US August Oil production at Post Pandemic High

A guest post by Ovi

All of the Crude plus Condensate (C + C) production data for the US state charts comes from the EIAʼs October Petroleum Supply monthly PSM which provides data up to August 2022.

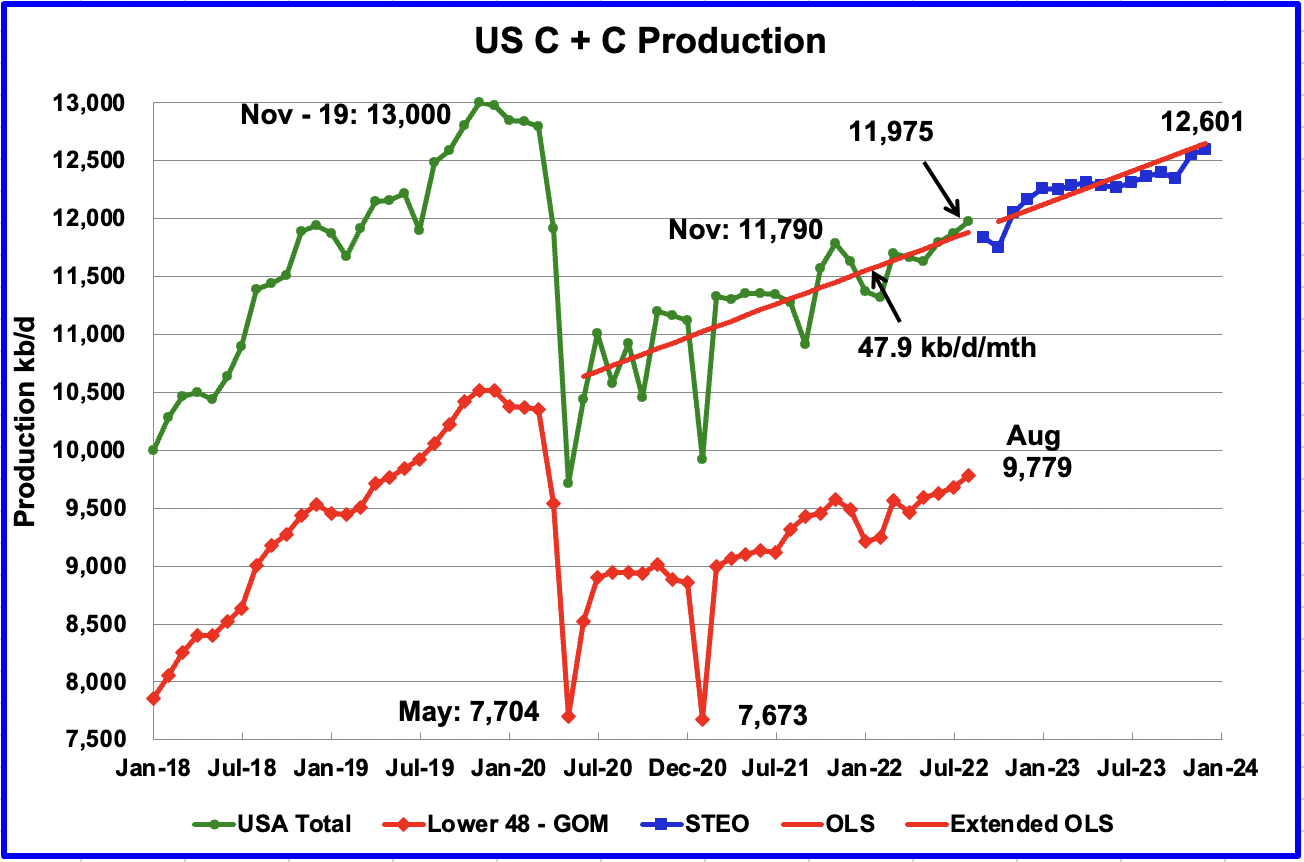
U.S. August production increased by 102 kb/d to 11,975 kb/d. It should also be noted that July’s oil production was revised up from 11,800 kb/d to 11,873 kb/d in the October report. So the total increase over the July report, including the revision, was 175 kb/d. For August, the state with the largest increase was Texas at 78 kb/d. August’s production was a new post pandemic high.

Read More

GOM Oil Production fuels US June Increase

A Guest post by Ovi

All of the Crude plus Condensate (C + C) production data for the US state charts comes from the EIAʼs Petroleum Supply monthly PSM. 

U.S. June production increased by 201 kb/d to 11,816 kb/d. Of the 201 kb/d increase, the largest increase came from the GOM, 183 kb/d. June’s production was a new recent high at 26 kb/d higher than November 2021 which was producing at a rate of 11,790 kb/d.

Read More

US March Oil Production Recovers

A guest post by Ovi

All of the oil (C + C) production data for the US state charts comes from the EIAʼ’s Petroleum Supply monthly PSM. 

U.S. March production increased by 349 kb/d to 11,655 kb/d. Relative to November’s 2021 production of 11,769 kb/d, March is still 114 kb/d lower. The main increases came from Texas 147 kb/d, ND 66 kb/d and the GOM 75 kb/d.

Read More