A guest post by Ovi
All of the Crude plus Condensate (C + C) production data for the US state charts comes from the EIAʼs October Petroleum Supply monthly PSM which provides data up to August 2022.
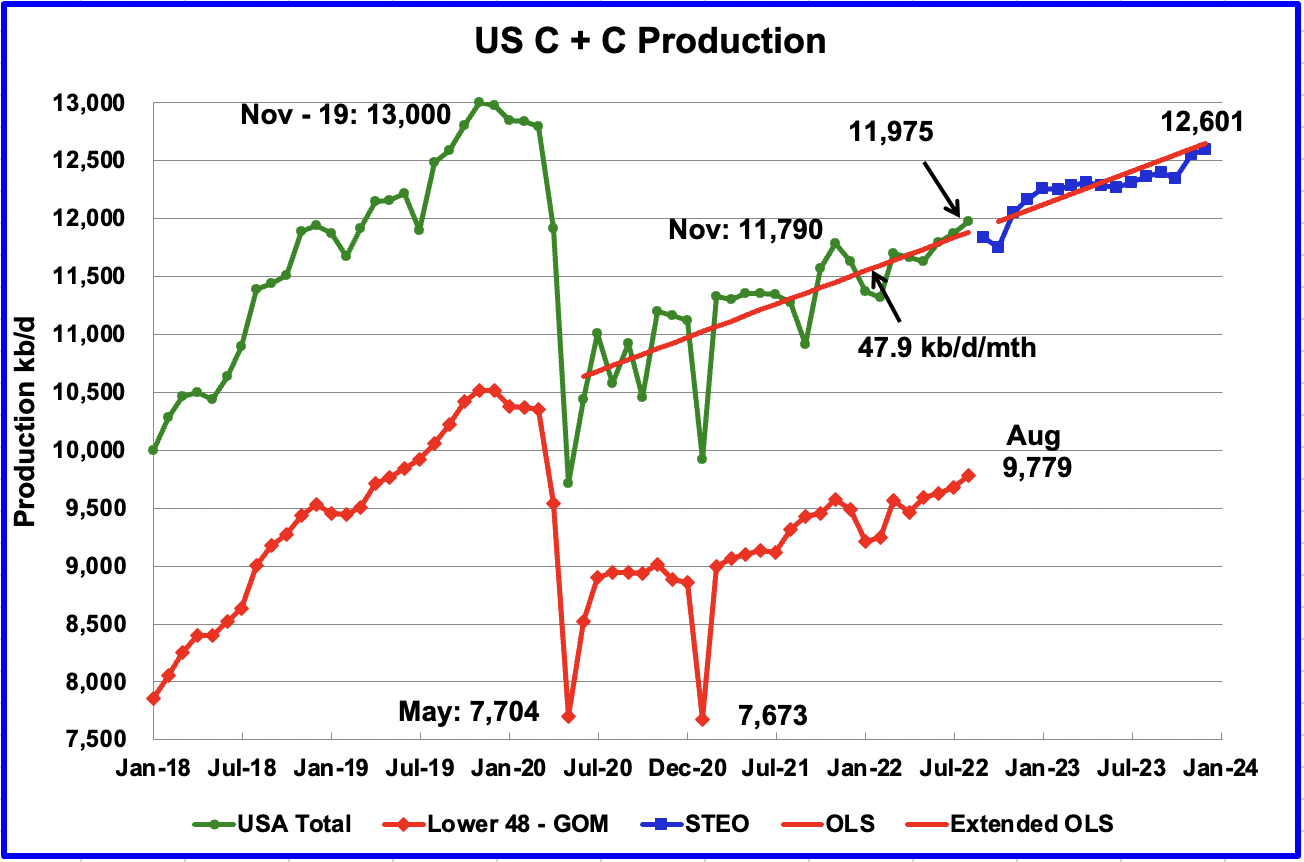
U.S. August production increased by 102 kb/d to 11,975 kb/d. It should also be noted that July’s oil production was revised up from 11,800 kb/d to 11,873 kb/d in the October report. So the total increase over the July report, including the revision, was 175 kb/d. For August, the state with the largest increase was Texas at 78 kb/d. August’s production was a new post pandemic high.
In general, the August report had a number of higher output revisions for many states. No explanation was provided. Could be just normal monthly revisions.
While overall US oil production increased, a clearer indication of the health of US production can be gleaned by looking more closely at the Onshore L48 states. In the Onshore L48, August production increased by 100 kb/d to 9,779 kb/d. This means that all of the increase in US production came from the Onshore L48.
The blue graph, taken from the October 2022 STEO, is the production forecast for the U.S. from September 2022 to December 2023. Output for December 2023 is expected to be 12,601 kb/d.
The red OLS line from June 2020 to August 2022 indicates a monthly production increase of 47.9 kb/d/mth over that period. The first portion of red line stops at August because that is the range covered by the OLS analysis. The second portion is the same OLS line extended to see how well it fits the STEO forecast. The OLS extension closely follows the STEO forecast and indicates a continued steady increase in production at close to the same rate out to December 2023.
Oil Production Ranked by State
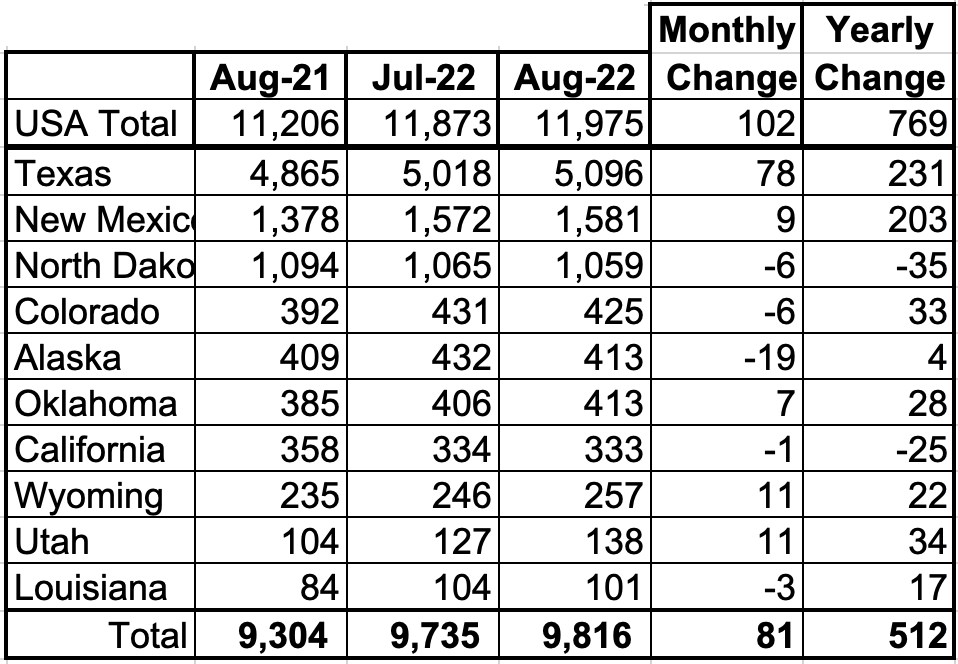
Listed above are the 10 states with the largest US production. These 10 accounted for 82.0% of all U.S. oil production out of a total production of 11,975 kb/d in August 2022.
On a YoY basis, US production increased by 769 kb/d with the majority having come from Texas and New Mexico. Note that only North Dakota and California are producing less crude this year than a year ago.
State Oil Production Charts
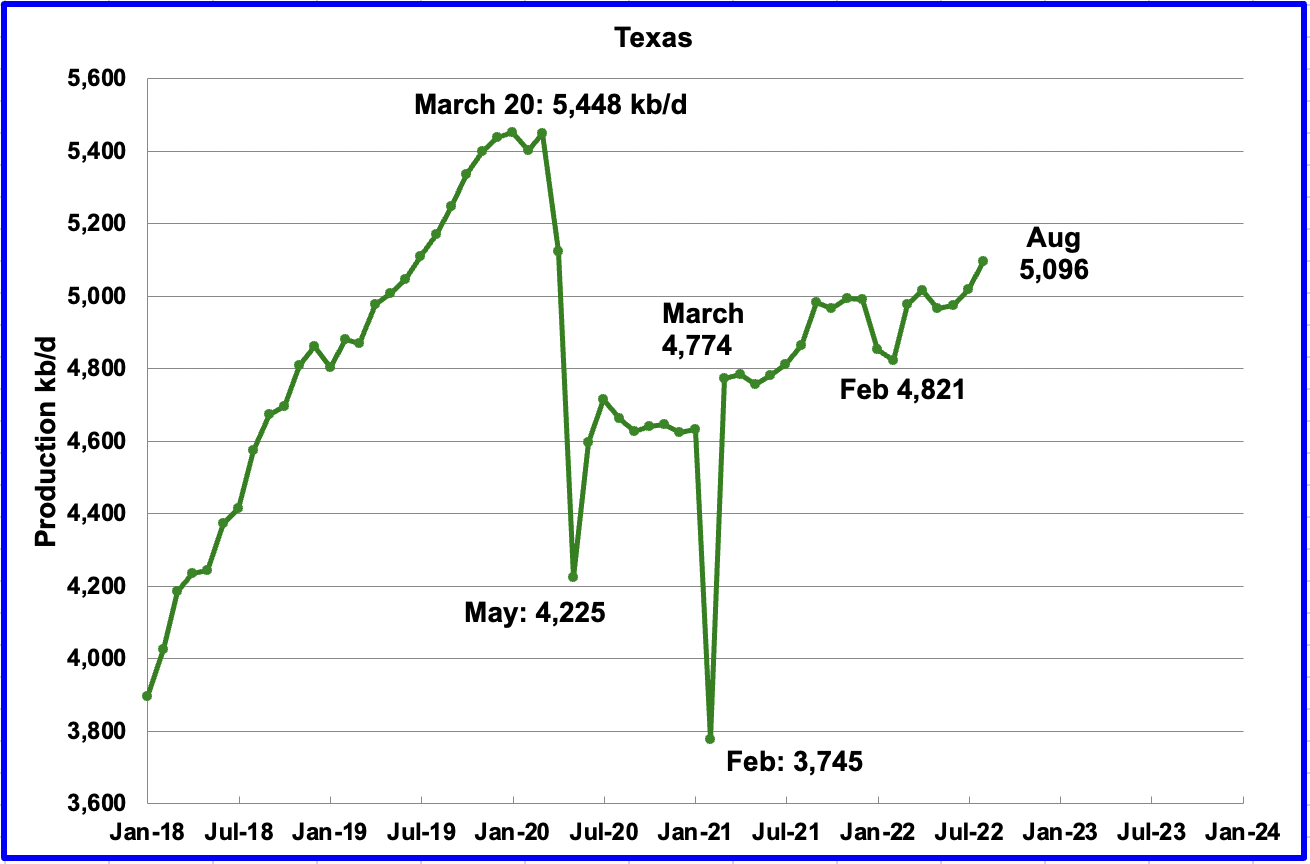
Texas production increased by 78 kb/d in August to 5,096 kb/d, a post pandemic high, from 5,018 kb/d in July. From March 2021 to August 2022, Texas production increased by 322 kb/d or at an average rate of 18.9 kb/d/mth.
In September 2021 there were 205 Hz oil rigs operating in Texas. By the last week of August 2022, 308 Hz oil rigs were operational, an increase of 103 rigs.
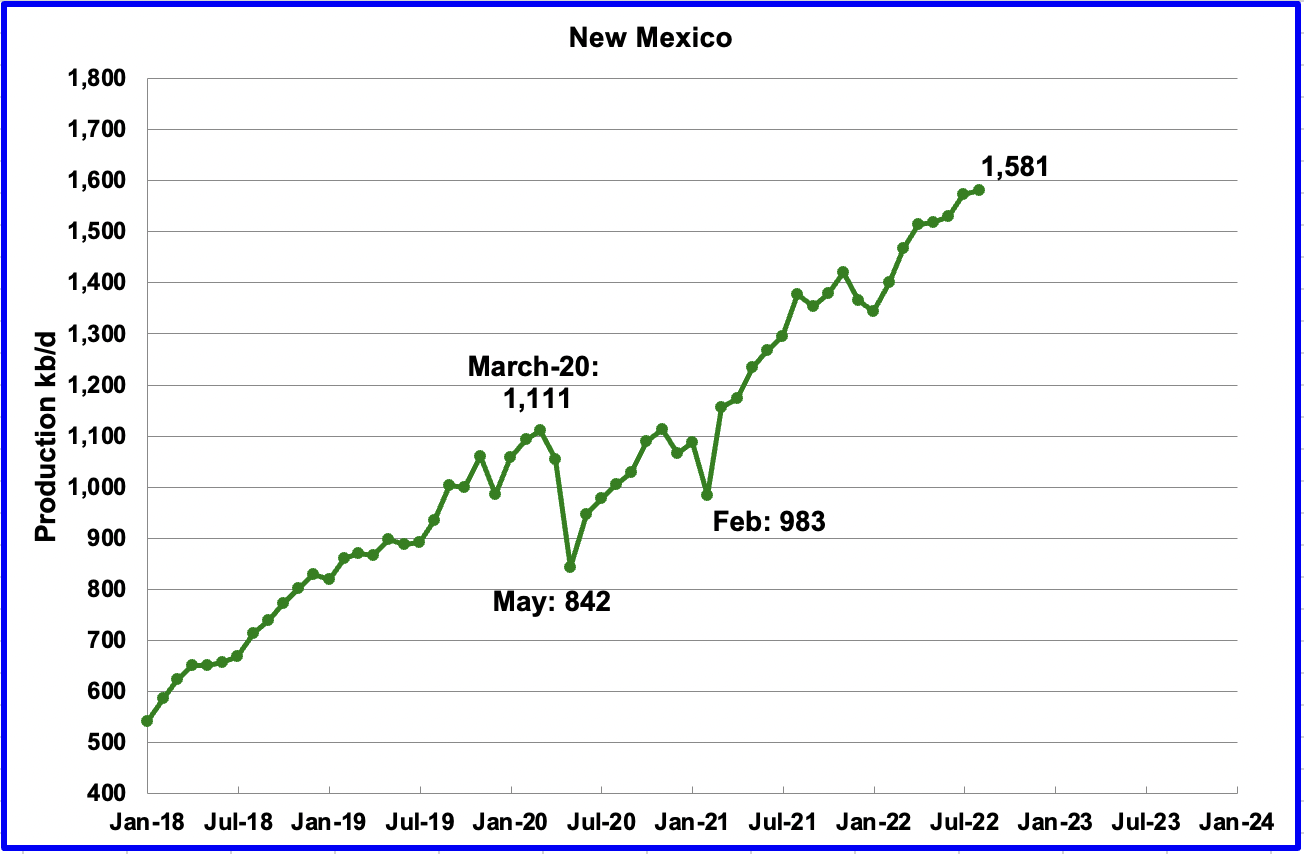
August’s New Mexico production increased by 9 kb/d to 1,581 kb/d to a new record high. From January 2022 to the end of May, close to 92 rigs were in operation in the New Mexico Permian. However by August operational rigs increased by four to total 96 which is consistent with New Mexico’s rising output. The recent production increase is due to more wells being drilled and more wells being completed than drilled.
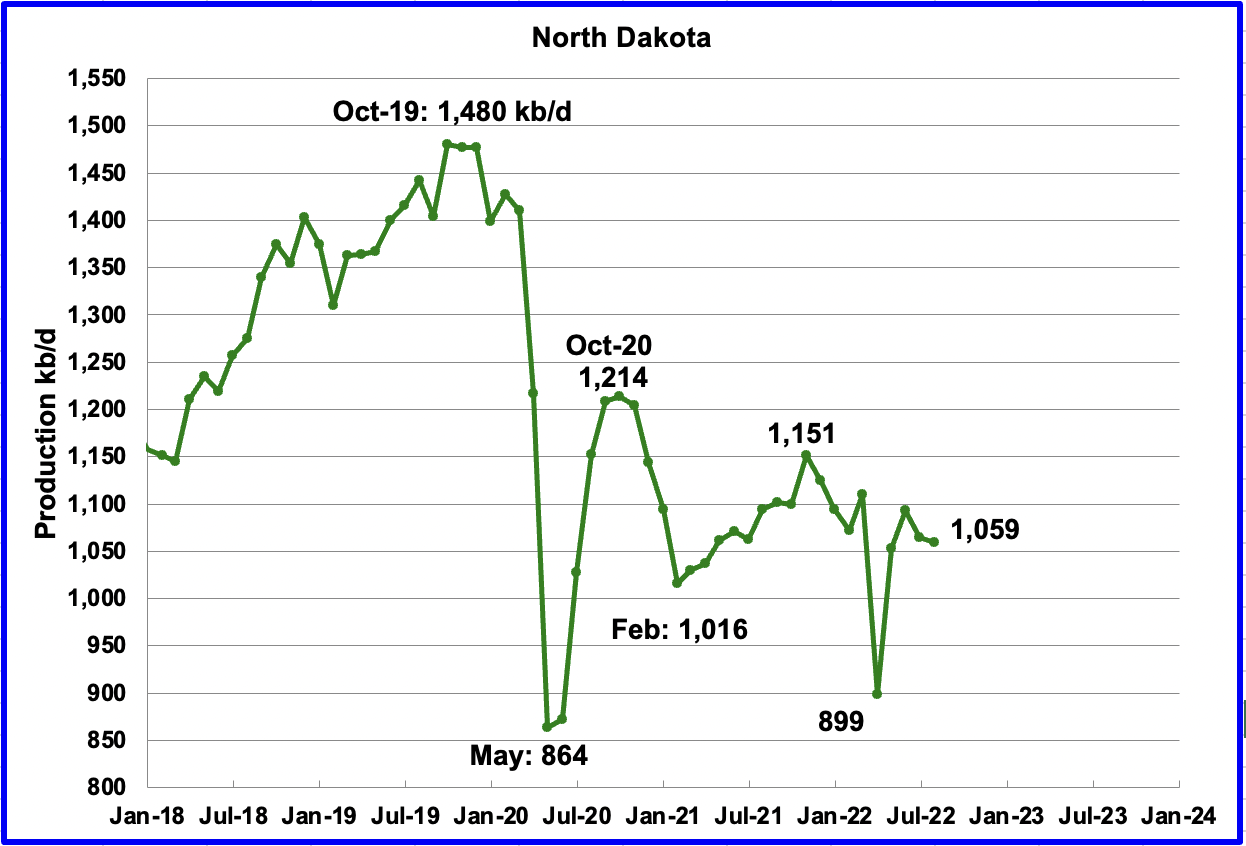
North Dakota’s August output dropped to 1,059 kb/d, a decrease of 6 kb/d from July. Note that this latest report revised July’s output up by 31 kb/d to 1,065 kb/d.
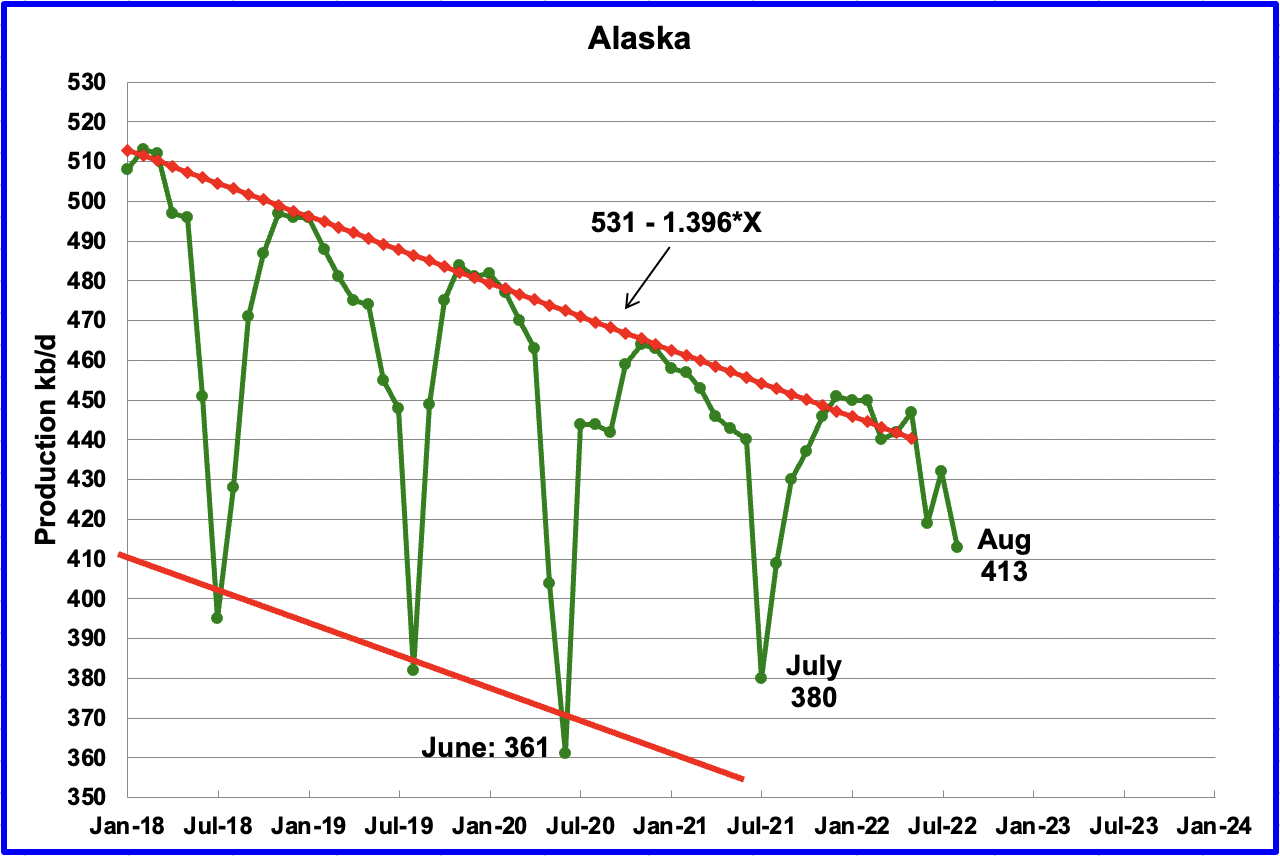
Alaskaʼs August output decreased by 19 kb/d to 413 kb/d. An unexpected drop since typically August output increases.
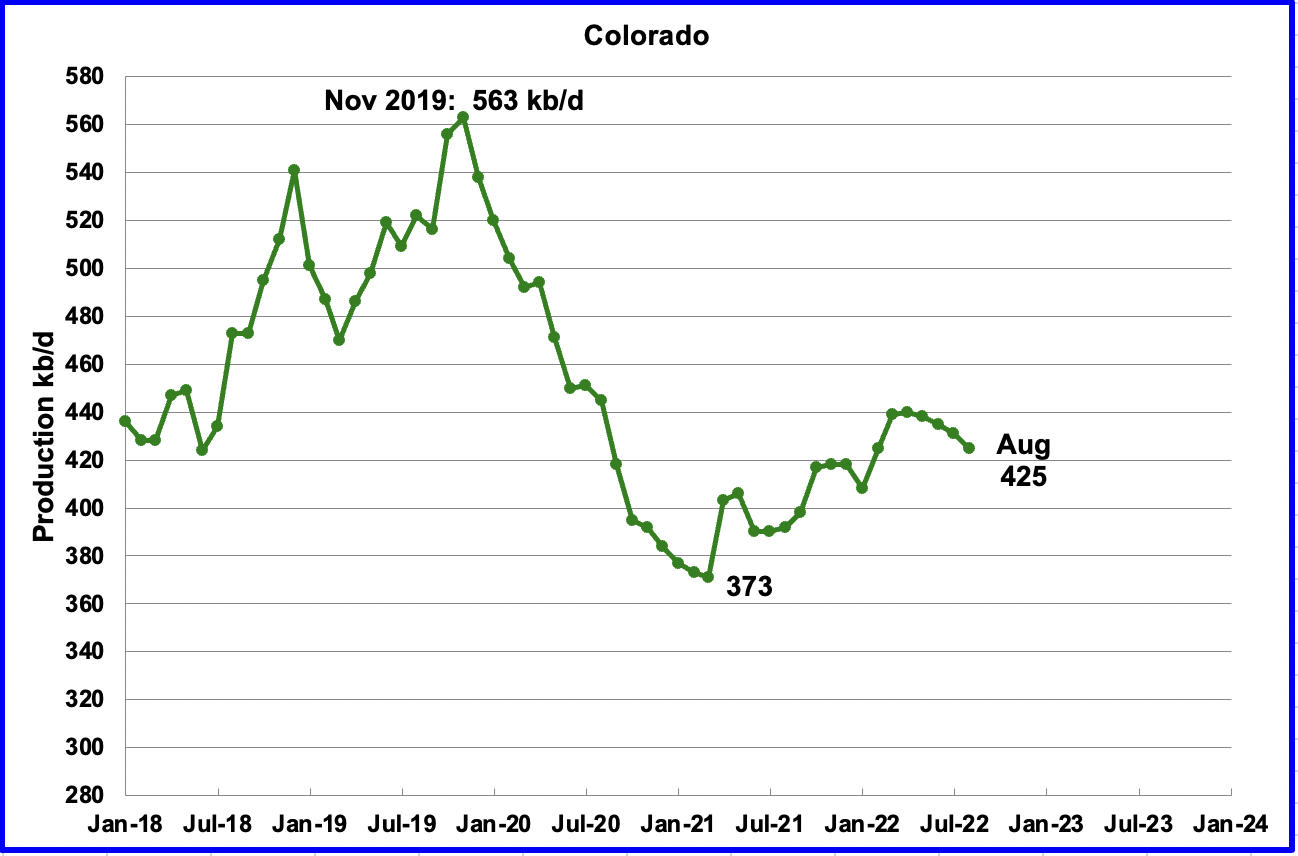
Coloradoʼs August production decreased by 6 kb/d to 425 kb/d. After production being flat in March and April, production has entered a slow decline phase. A recent Colorado report forecasts little oil growth is likely in Colorado for 2022.
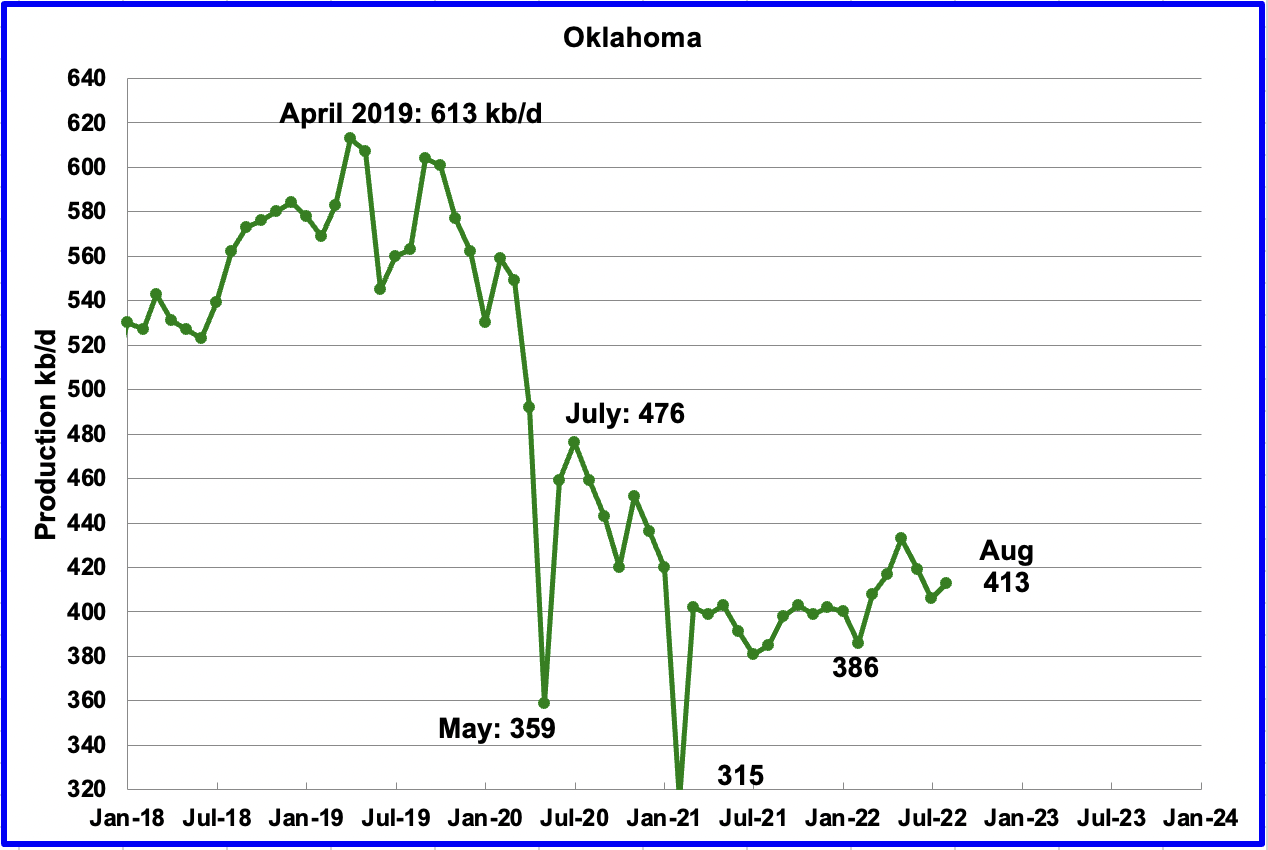
Oklahoma’s output in August increased by 7 kb/d to 413 kb/d. From January to April, close to fifty rigs were operating in Oklahoma. In July and August the rig count increased to between 57 and 59 which may lead to higher production.
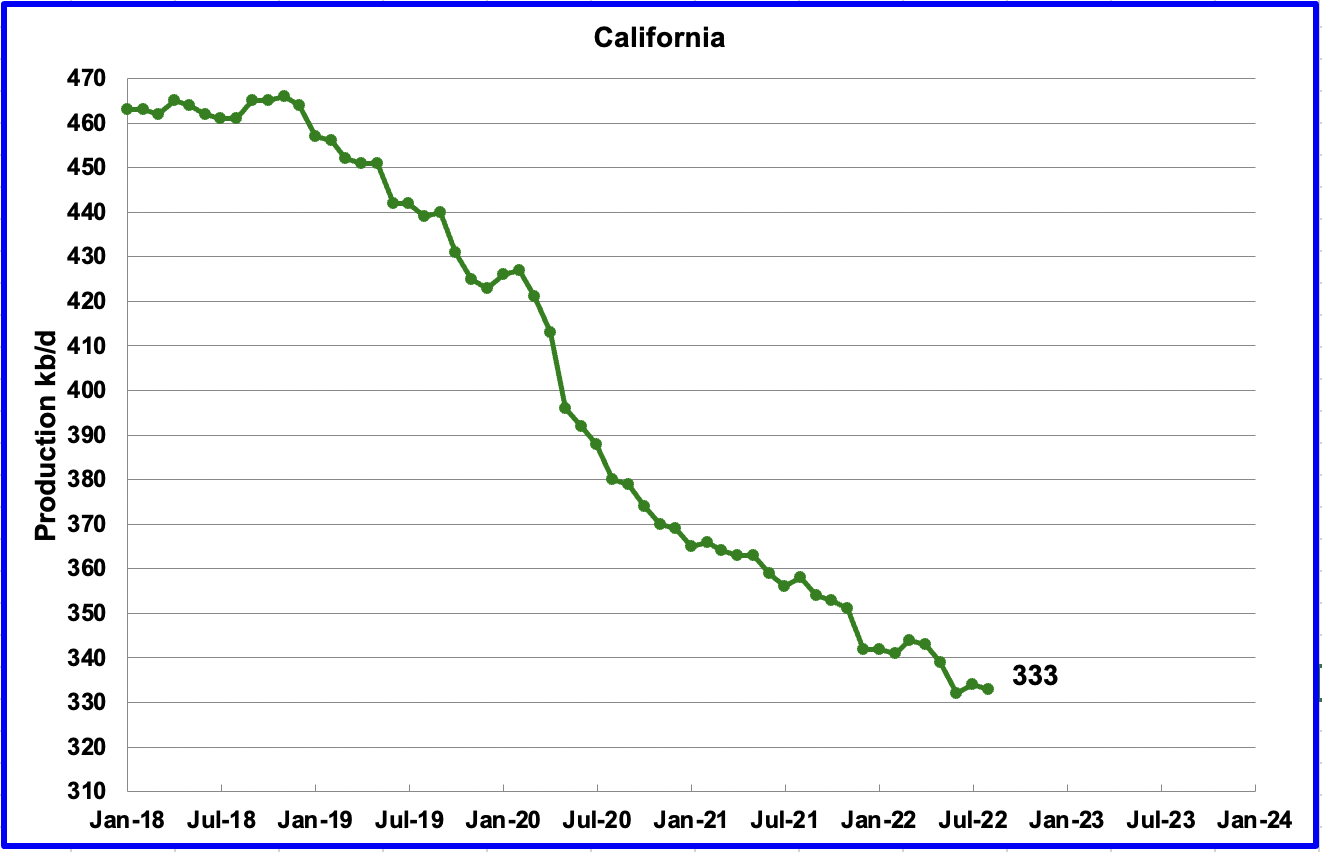
Californiaʼs slow output decline continued in August. Output decreased by 1 kb/d to 333 kb/d.
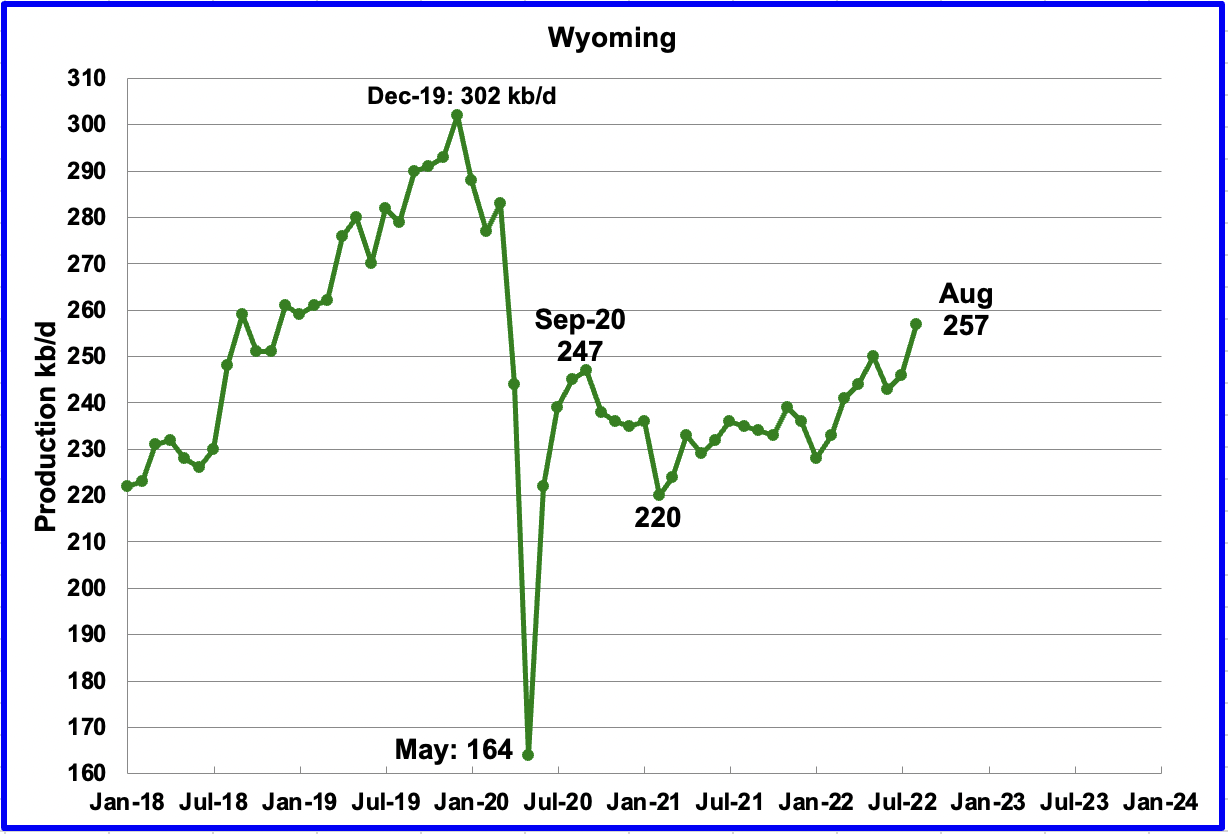
Wyoming’s oil production has been on a slow unsteady uptrend from the low of 220 kb/d in February 2021 due to increased drilling. August’s output reached a new post pandemic high of 257 kb/d.
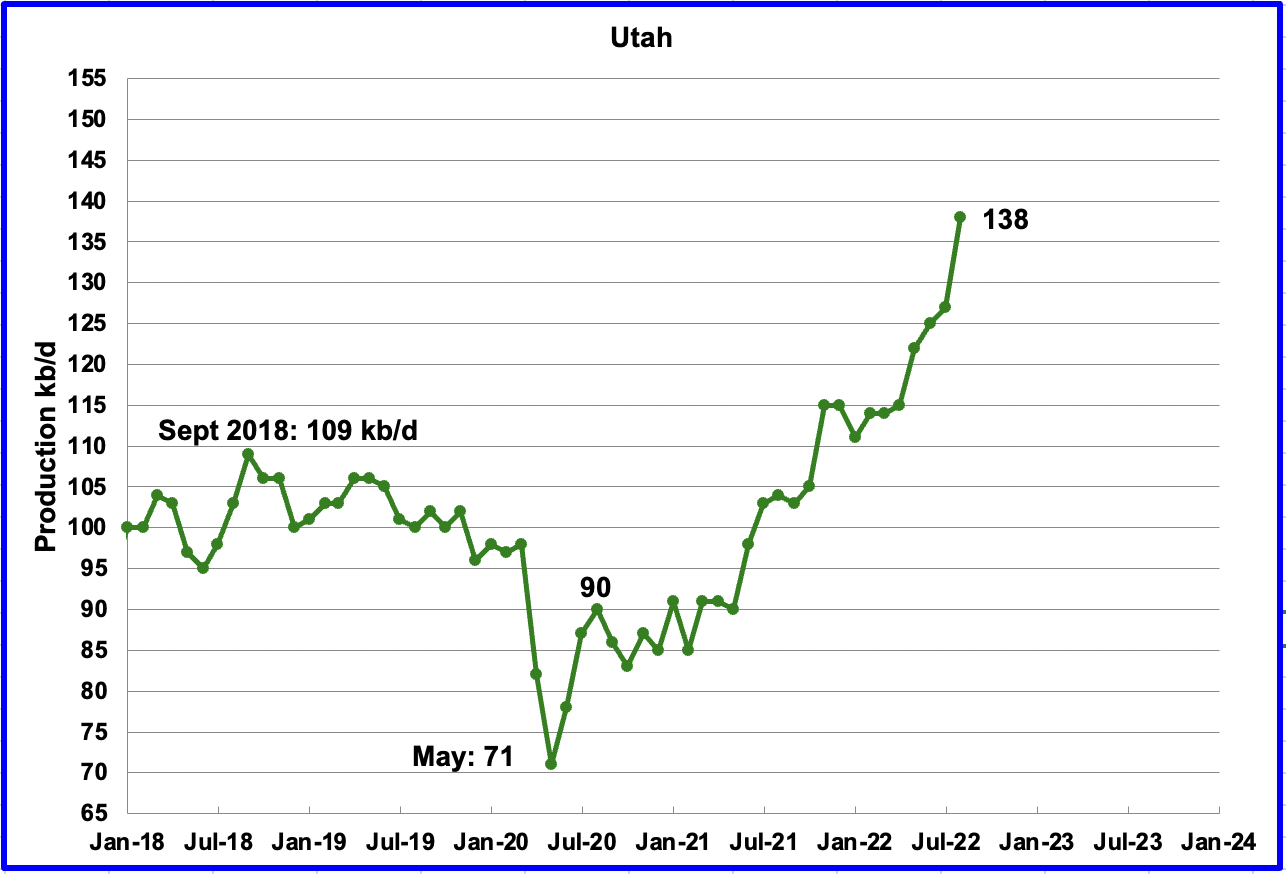
Utah’s production has been on a steady increase since January 2022. Production hit a new high in August of 138 kb/d after just adding 11 kb/d to June’s output. Utah had between 7 and 8 rigs operating in August.
The Biden Administration paves way for railway that will quadruple oil production in Utah’s Uinta Basin.
According to this source, a new railway, “The Uinta Basin Railway is expected to quadruple oil production in Utah’s Uinta Basin by linking its oil fields to national rail networks. Most of the crude will travel through the Colorado Rockies for 200 miles to Gulf Coast refineries.”
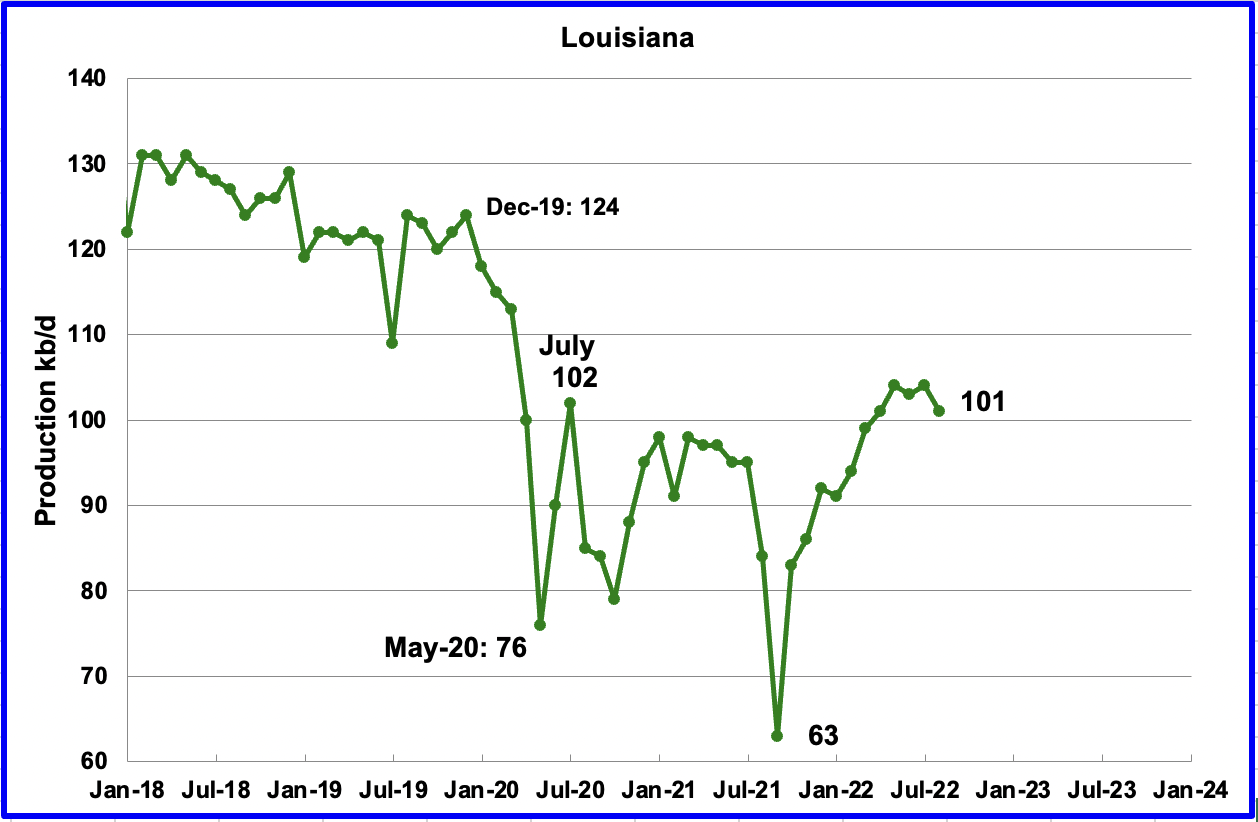
Louisiana’s output dropped in August to 101 kb/d.
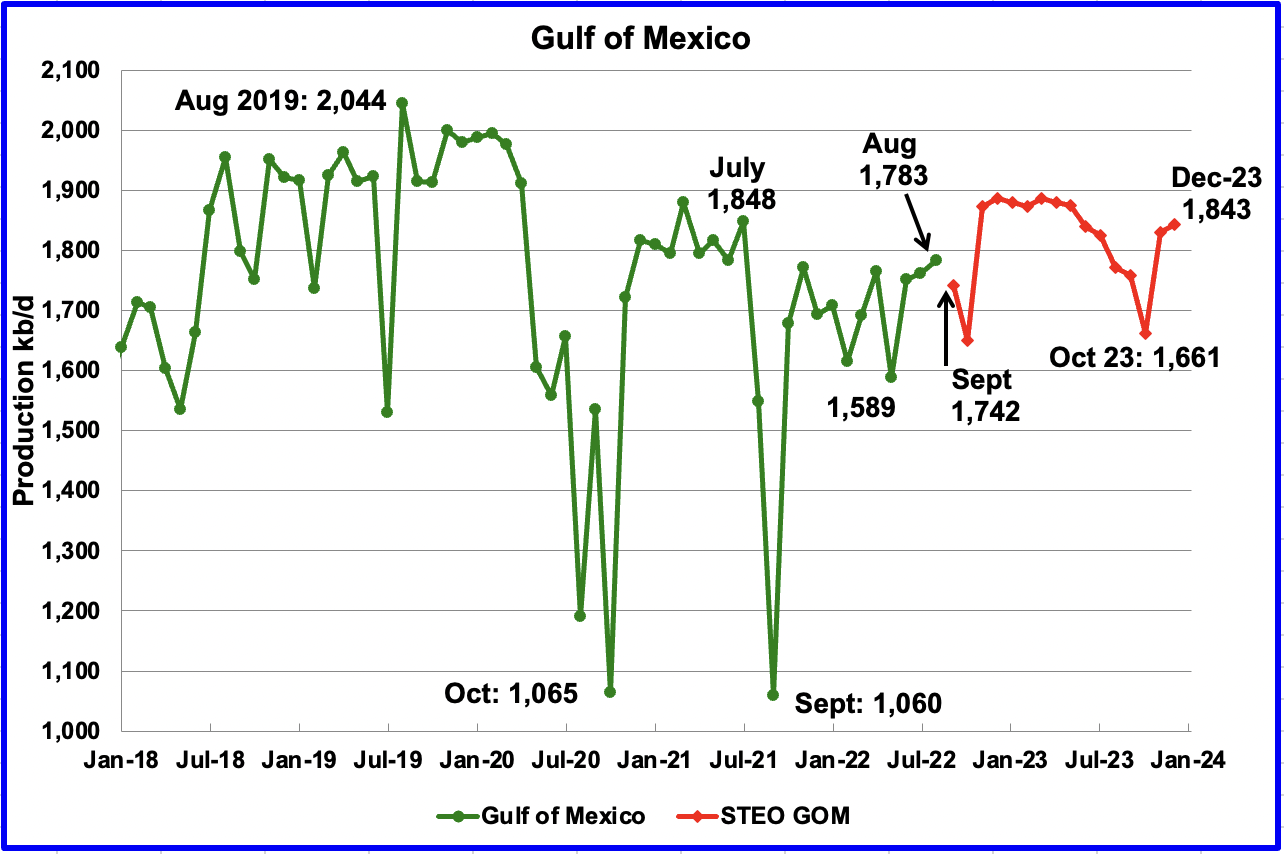
GOM production increased by 21 kb/d in August to 1,783 kb/d. If the GOM was a state, its production would normally rank second behind Texas.
The October 2022 STEO projection for the GOM output has been added to this chart and projects output will be 1,843 kb/d in December 2023, 60 kb/d higher than August 2022.
For September 2022, the STEO is projecting a decrease of 41 kb/d to 1,742 kb/d, possibly associated with Hurricane Ian which hit the GOM in late September. November is projected to have a sharp production increase of 224 kb/d to 1,874 kb/d.
A Different Perspective on US Oil Production
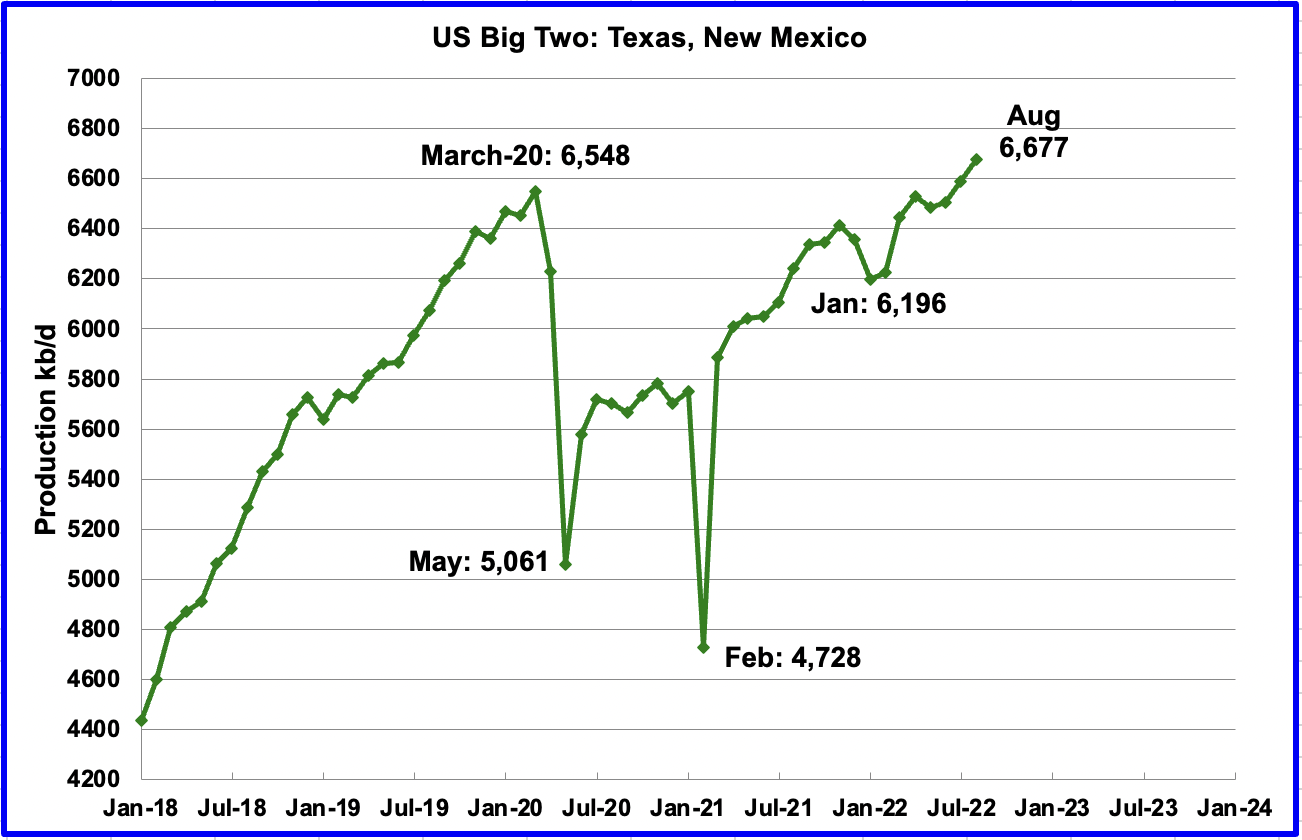
The Big Two states, combined oil output for Texas and New Mexico.
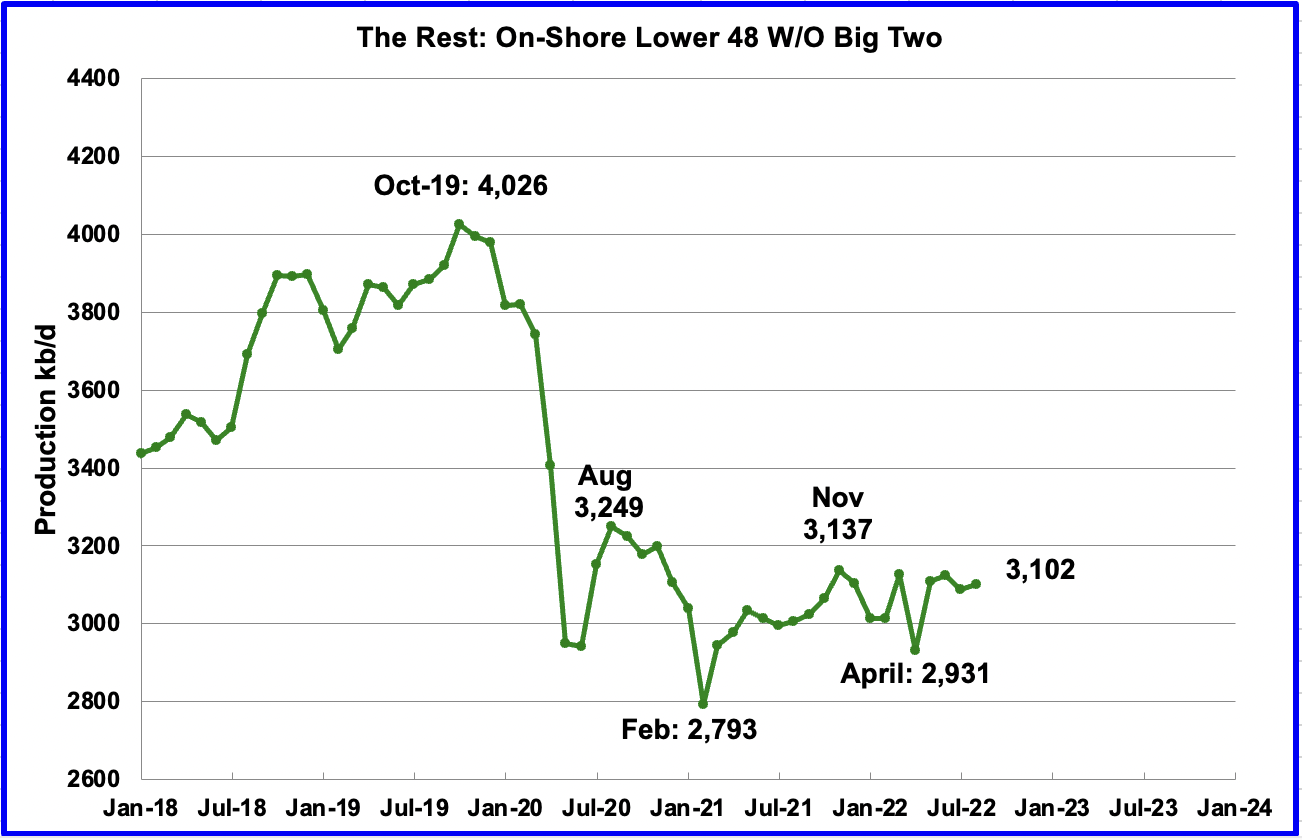
Oil production by The Rest
August’s production in the Big Two states increased by a combined 87 kb/d to a new high of 6,677 kb/d with Texas increasing by 77 kb/d and New Mexico adding 9 kb/d.
Over the past year, production in The Rest appears to be holding steady at close to 3,100 kb/d. In August The Rest increased output by 13 kb/d to 3,102 kb/d.
The main thing to notice in the Rest Chart is that current production is 900 kb/d below the high of October 2019. The question we need answered Is “Is this a permeant loss that will never be recovered?
Rigs and Fracs
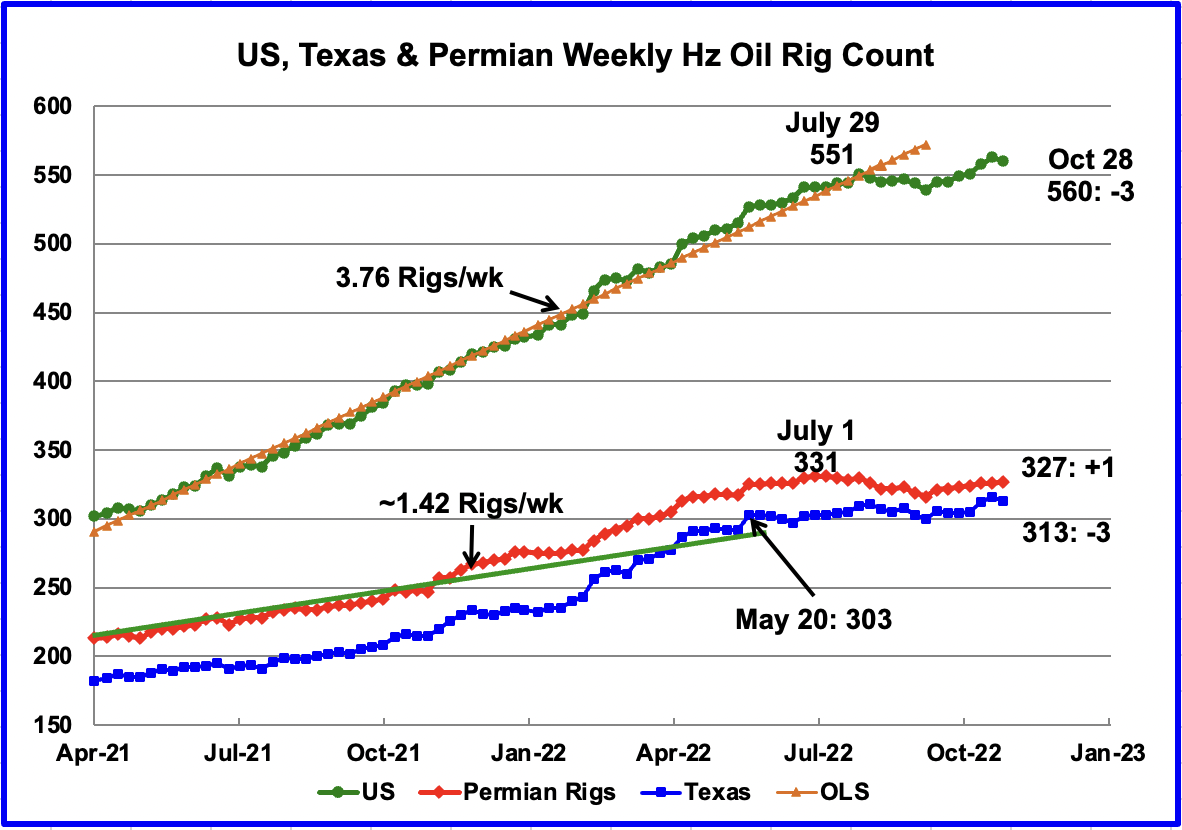
Since the beginning of April 2021 through to the week ending July 29, 2022, the US has been adding horizontal oil rigs at a rate of close to 3.82 rigs/wk, orange OLS line, and peaked at 551 rigs in the week ending July 29. However since then the number of operational rigs has been more or less steady at the 550 level. In the week ending October 28, the number of rigs decreased by 3 to 560.
In the Permian and Texas, the general trend for the number of operational rigs since July has been flat. Is this related to the recent drop in the price of WTI?
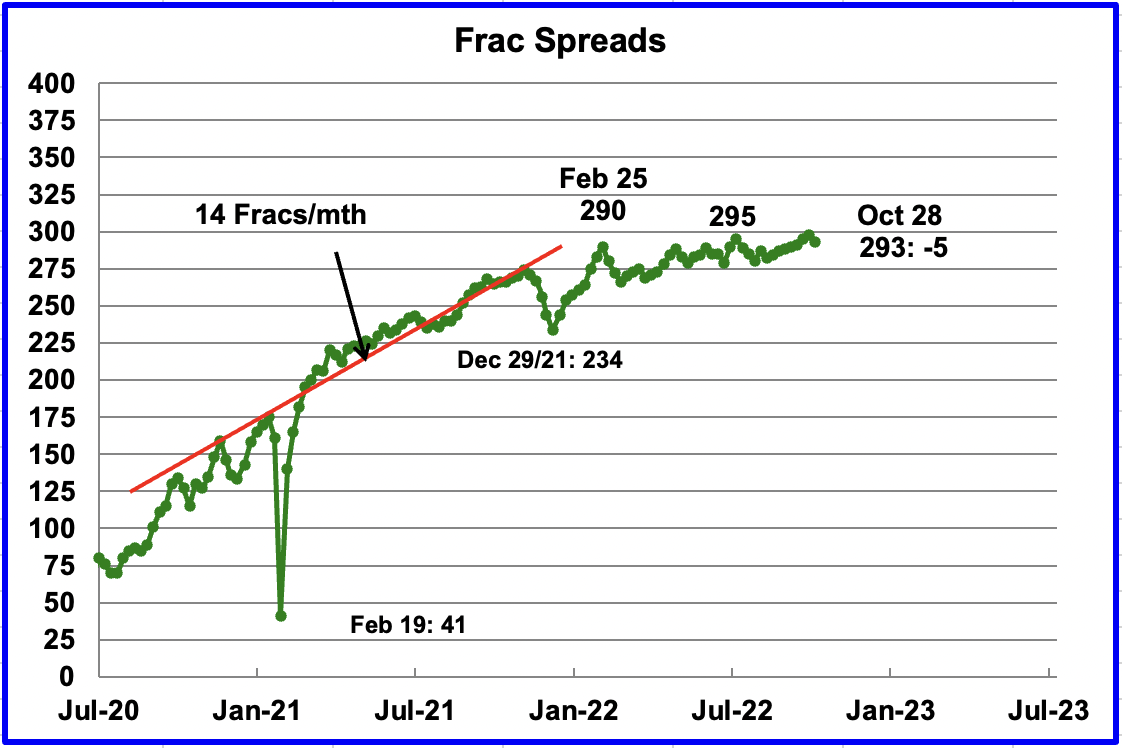
For frac spreads, the general trend since late February can best be described as essentially flat around the 290 level but with a hint of a slow increase toward 300 frac spreads.
The essentially flat rig count since June and the flat frac spread count since February hints at a possible equilibrium between rigs around 550 to 560 level and a frac spread count around the 300 level. This equilibrium could be driven by the new balance between drilling/completion expenses and return of capital and dividends to investors.
Note that these 293 frac spreads include both gas and oil spreads.
Drilling Productivity Report
The Drilling Productivity Report (DPR) uses recent data on the total number of drilling rigs in operation along with estimates of drilling productivity and estimated changes in production from existing oil wells to provide estimated changes in oil production for the principal tight oil regions. The October DPR forecasts production to November 2022 and the following charts are updated to November 2022.
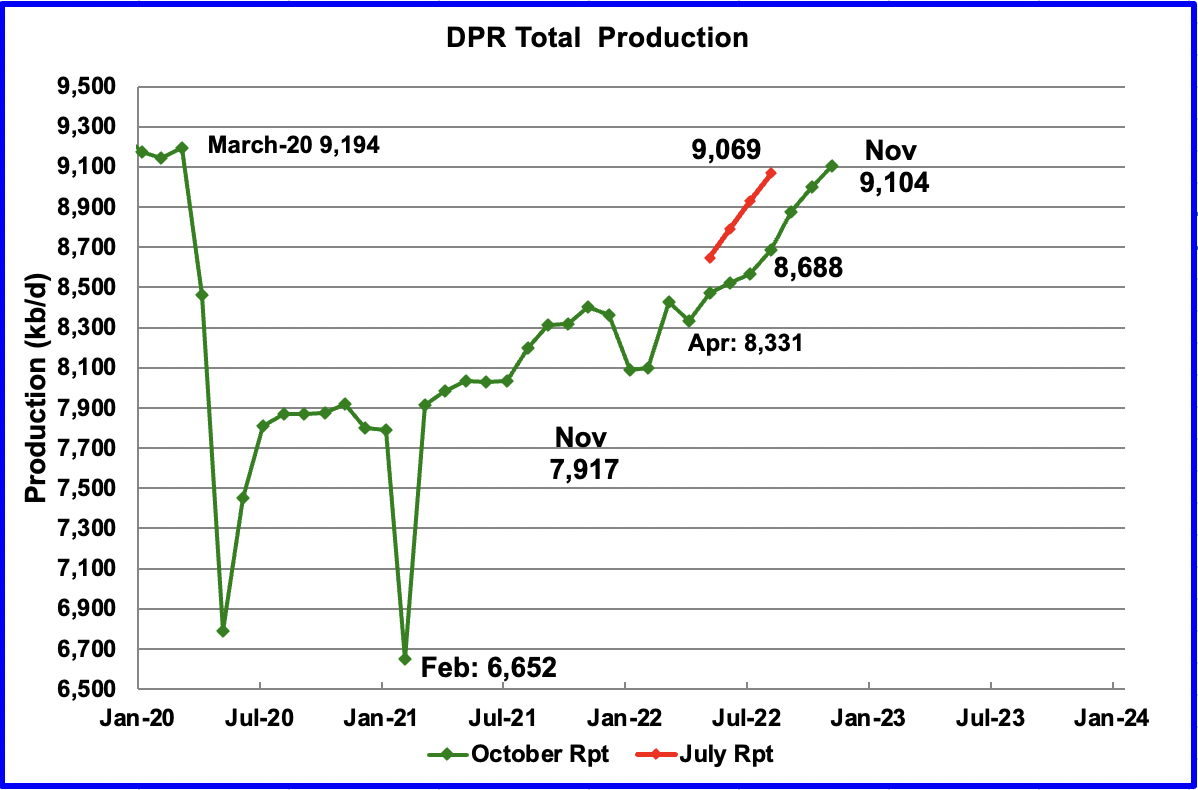
Above is the total oil production projected to November 2022 for the 7 DPR basins that the EIA tracks. Note that DPR production includes both LTO oil and oil from conventional wells.
The October DPR report has downwardly revised the April to October production forecast. The original production forecast for August 2022 was 9,069 kb/d, red markers. The revised estimate for August is 8,688 kb/d, a downward revision of 381 kb/d.
The DPR is projecting that oil output for November 2022 will increase by 103 kb/d to 9,104 kb/d. From April’s output of 8,331 kb/d to November’s 2022, output in the DPR basins is forecast to increase by 773 kb/d or by an average of 110.4 kb/d/mth.
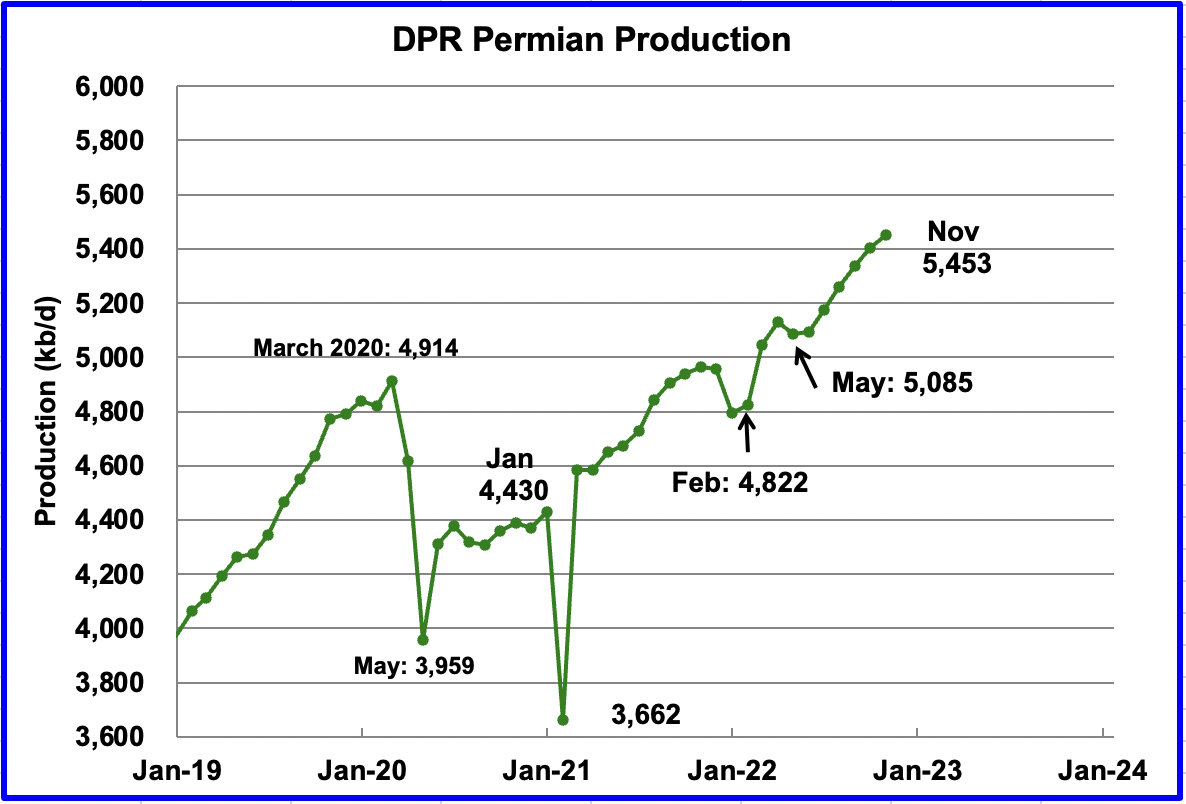
Permian output continues to increase in November. Production is expected to increase by 50 kb/d to a new high of 5,453 kb/d. From May to November, production is forecast to increase by 368 kb/d or at an average rate of 61.3 kb/d/mth. If the Permian were part of OPEC, at 5,453 kb/d it would be the second largest producer after Saudi Arabia.
During September, 416 wells were drilled and 430 were completed in the Permian. (Note that September is the latest data for DUC info). The completed wells added 378 kb/d to September’s output for an average of 879 b/d/well. The overall decline was 300 kb/d which resulted in a net increase for Permian output of 78 kb/d. Of the 430 completed wells, 341 were required to offset the decline. The completion of 14 extra DUCs over the drilled wells contributed 12.3 kb/d of the overall 78 kb/d increase.
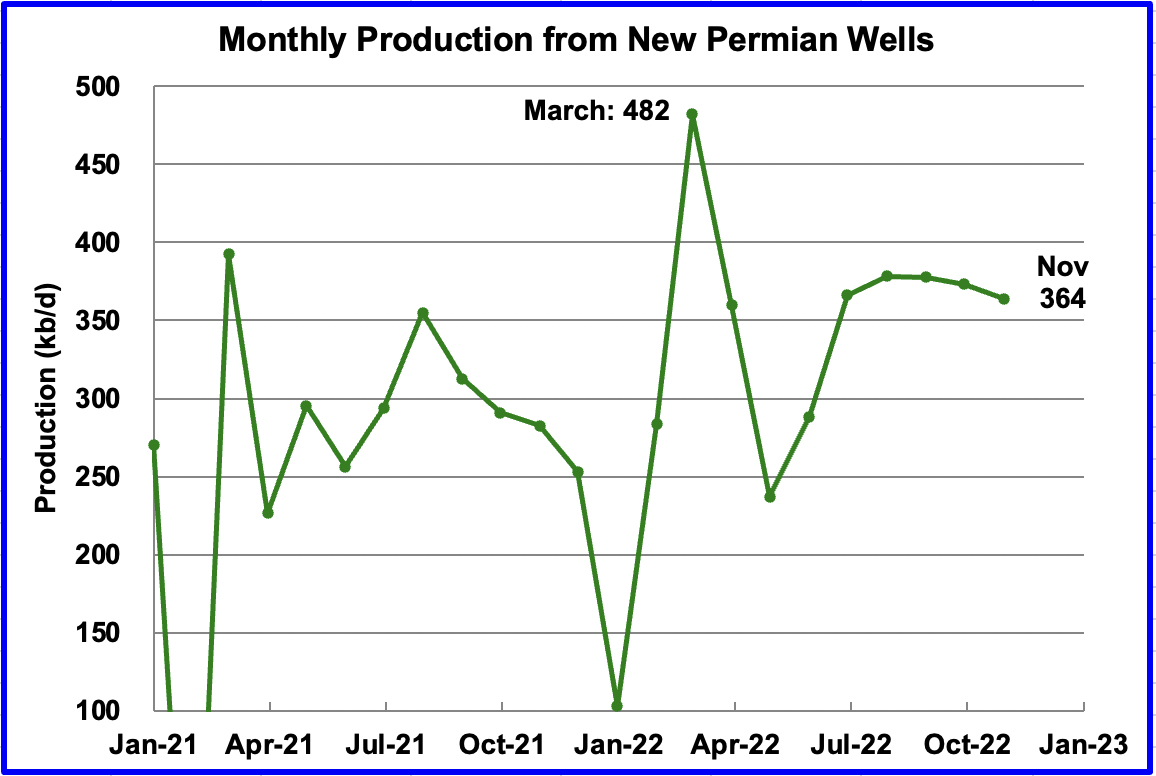
This chart shows the average total monthly production from first month Permian wells tracked on a monthly basis. Since July 2022, the volatility shown in prior months has stopped. While I cannot be certain for the reason for the reduced volatility, it may be related to the first upgraded LTO report released in September. Assuming the latest information is correct, total monthly production from the newest Permian wells may have peaked at 378 kb/d in August. Part of the decline shown is related to fewer wells being completed.
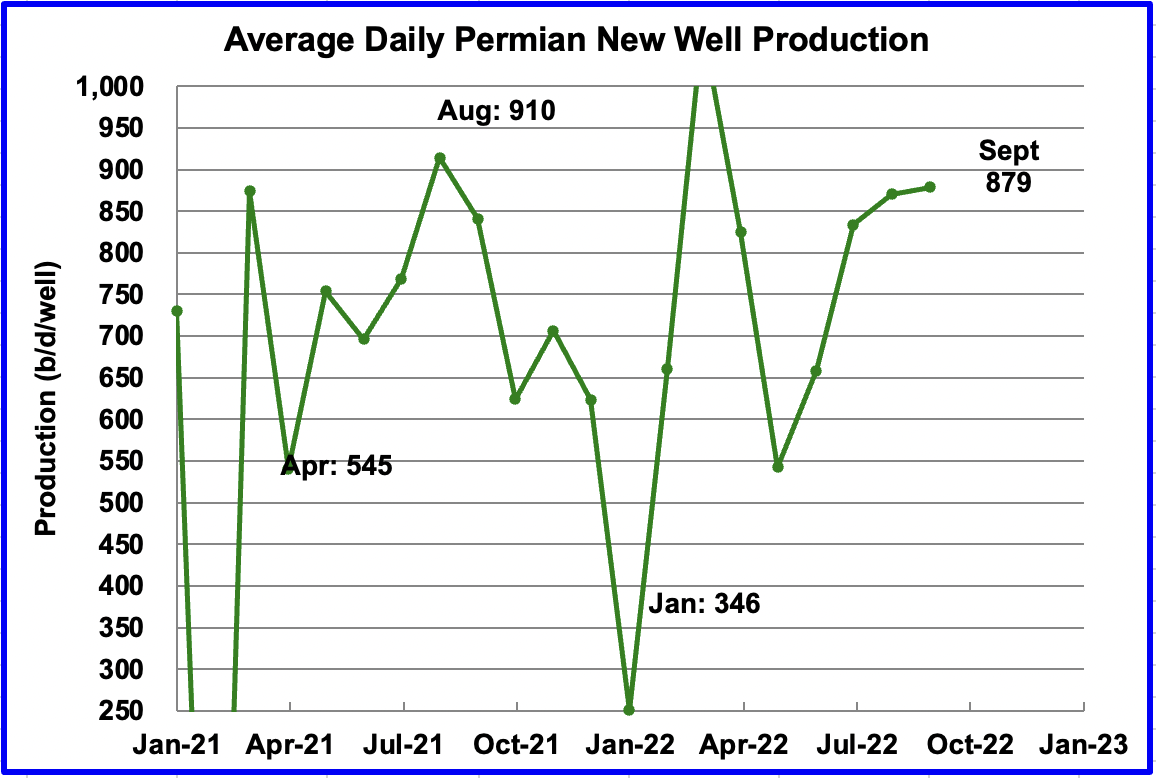
Average daily production for first month Permian wells is also volatile but the most recent data indicates average production is close to 879 b/d.
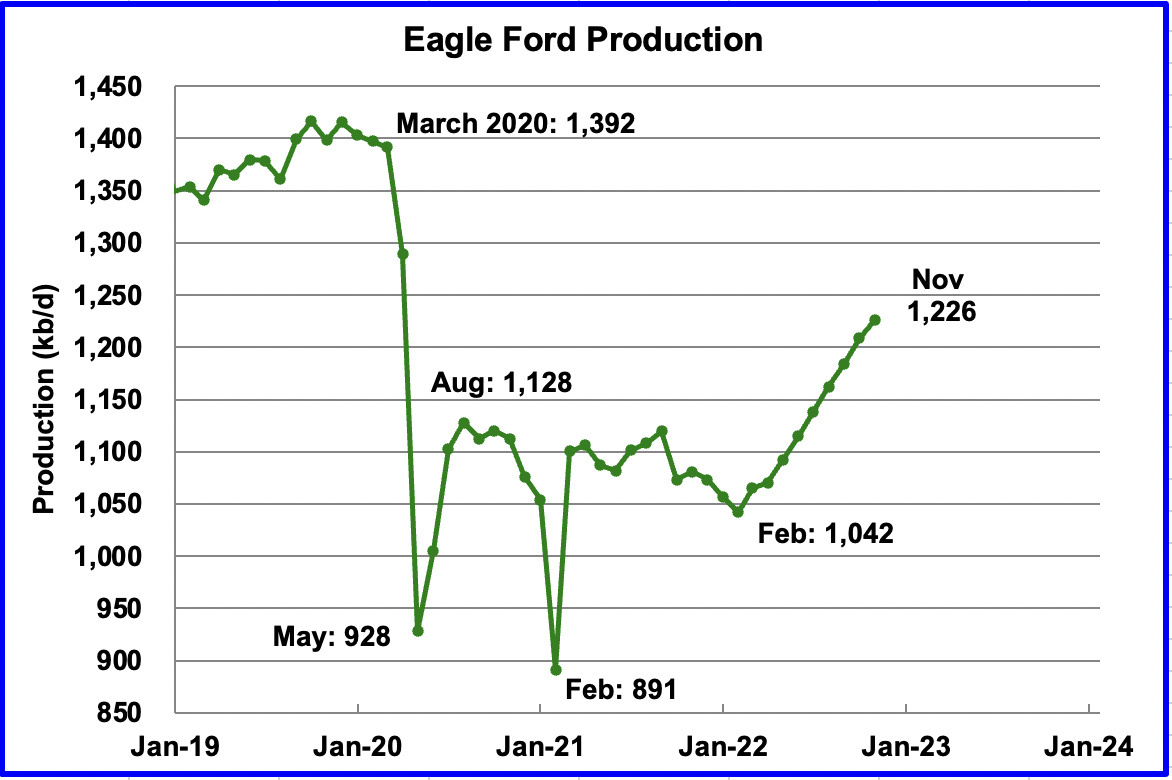
Output in the Eagle Ford basin has been showing an increasing trend since March 2022. For November, output is expected to increase by 18 kb/d to 1,226 kb/d. At the beginning of the year, 43 rigs were operating in the EF. As of October, 67 were are operational and account for the increasing production.
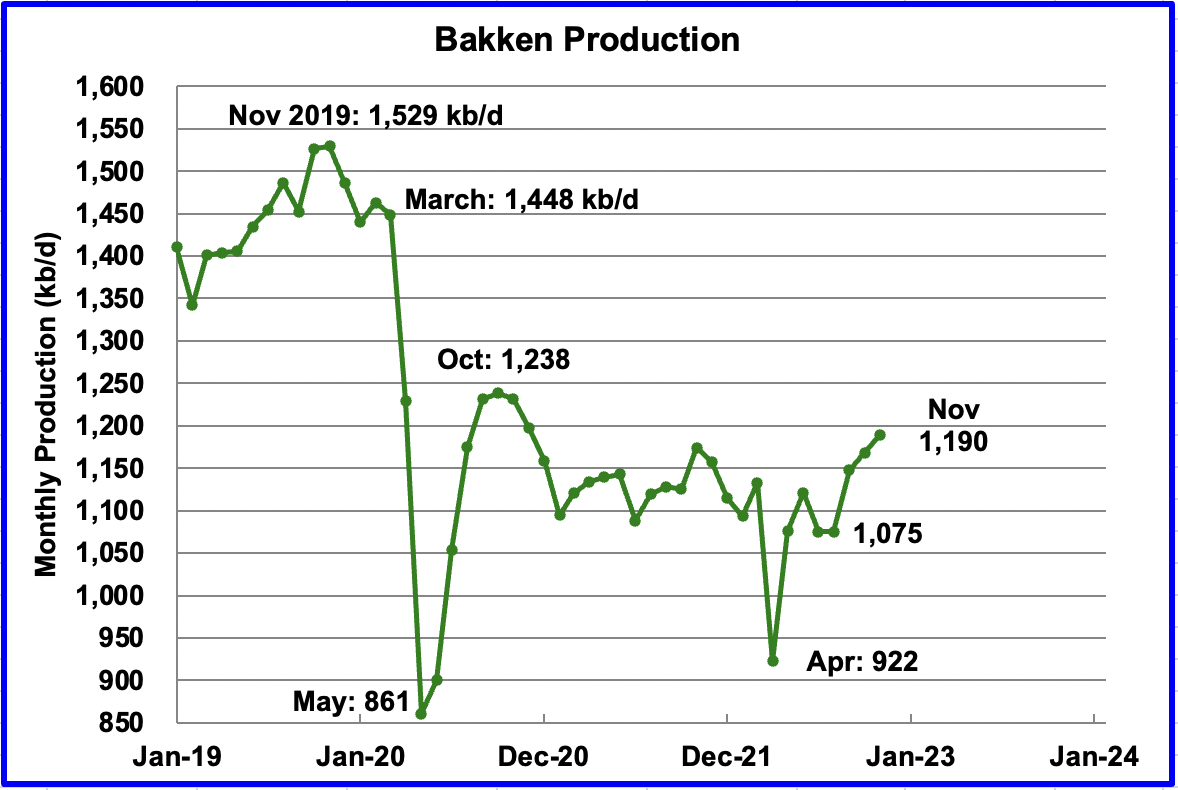
The DPR forecasts Bakken output in November to be 1,190 kb/d an increase of 22 kb/d over October.
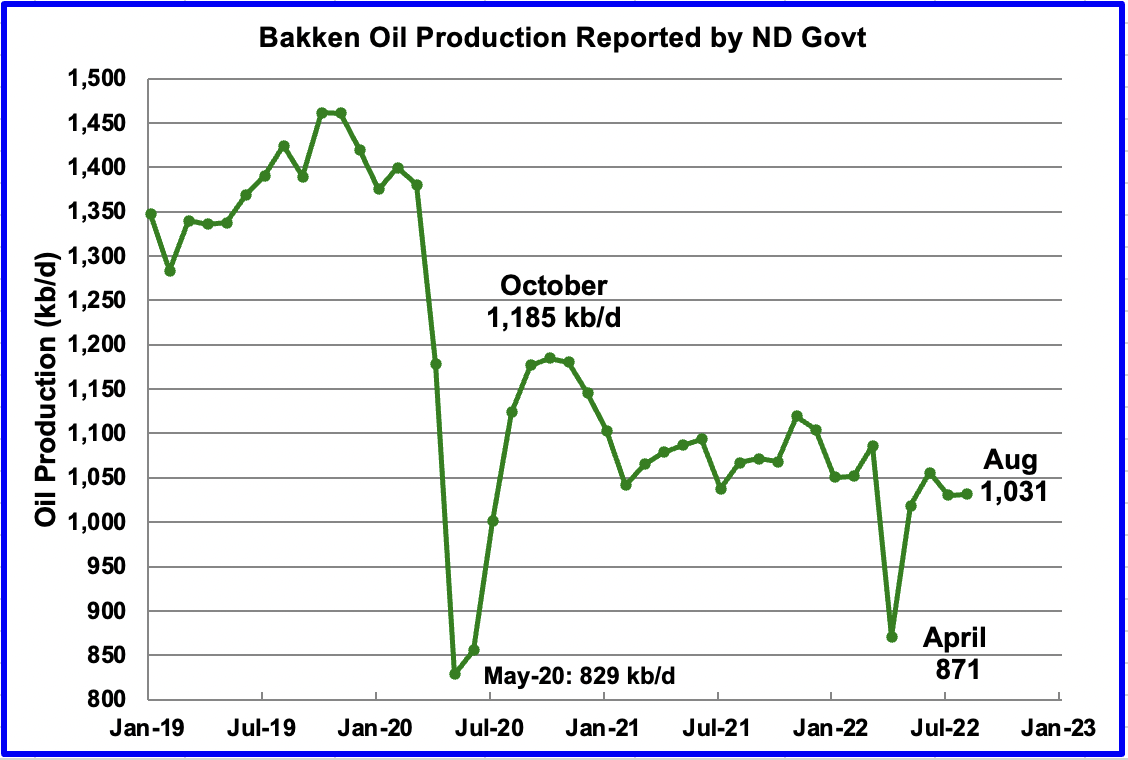
This chart shows the Bakken’s output as reported by the North Dakota government. August production was unchanged at 1,031 kb/d and showing no sign of increasing production. The DPR Bakken chart above shows August production to be 1,075 kb/d, 44 kb/d higher due to the Permian basin in Montana. The trend in the two charts up to August is essentially the same. However, the DPR is forecasting increasing production in the coming months.
The projection for increased production may be due to this source indicating a steady stream of completed wells would increase production in September.
“There is a steady stream of newly completed wells, with a projection that September’s numbers will continue to increase.”
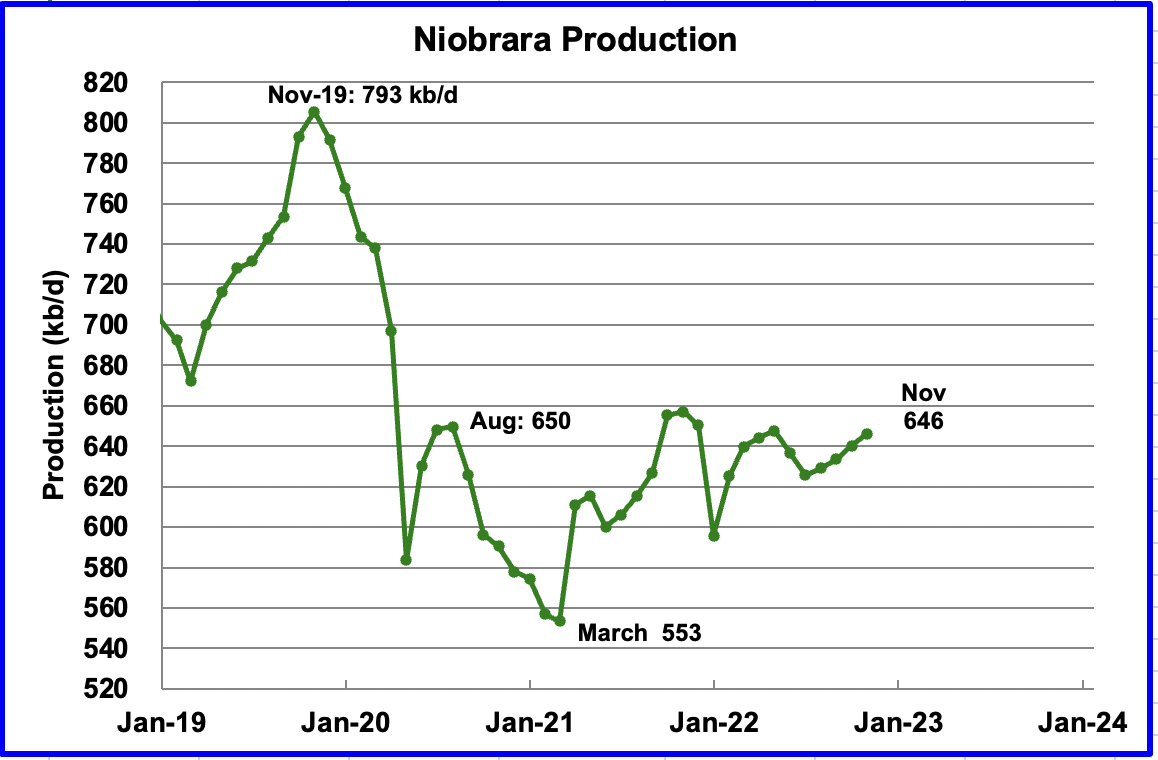
Output in the Niobrara continues to increase slowly. November output increased by 6 kb/d to 646 kb/d.
DUCs and Drilled Wells
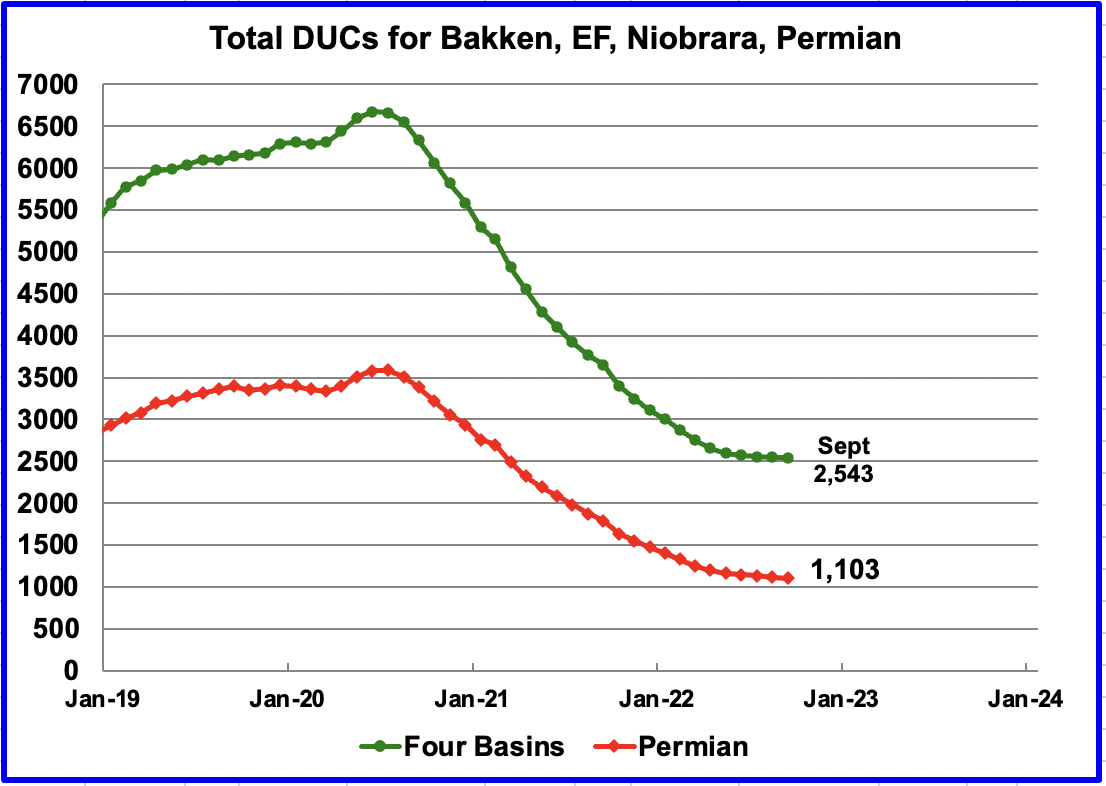
The number of DUCs available for completion in the Permian and the four major DPR oil basins has continued to fall every month since July 2020. Prior to July 2020 more wells were drilled than were completed. The last two data points show how the use of DUCs continues to slow and is further illustrated in the next chart.
According to this source, limitations on the ability to ship natural gas out of the Permian could affect crude oil production.
“From July 2020 to September 2022, the number of DUCs in the Permian region fell from to 1,103 from 3,590.
Meantime, because most natural gas from the Permian region is produced along with, and as a result of, crude oil production, limitations on the ability to ship natural gas out of the Permian region, known as takeaway capacity, could limit future crude oil production growth in the region, EIA said.“
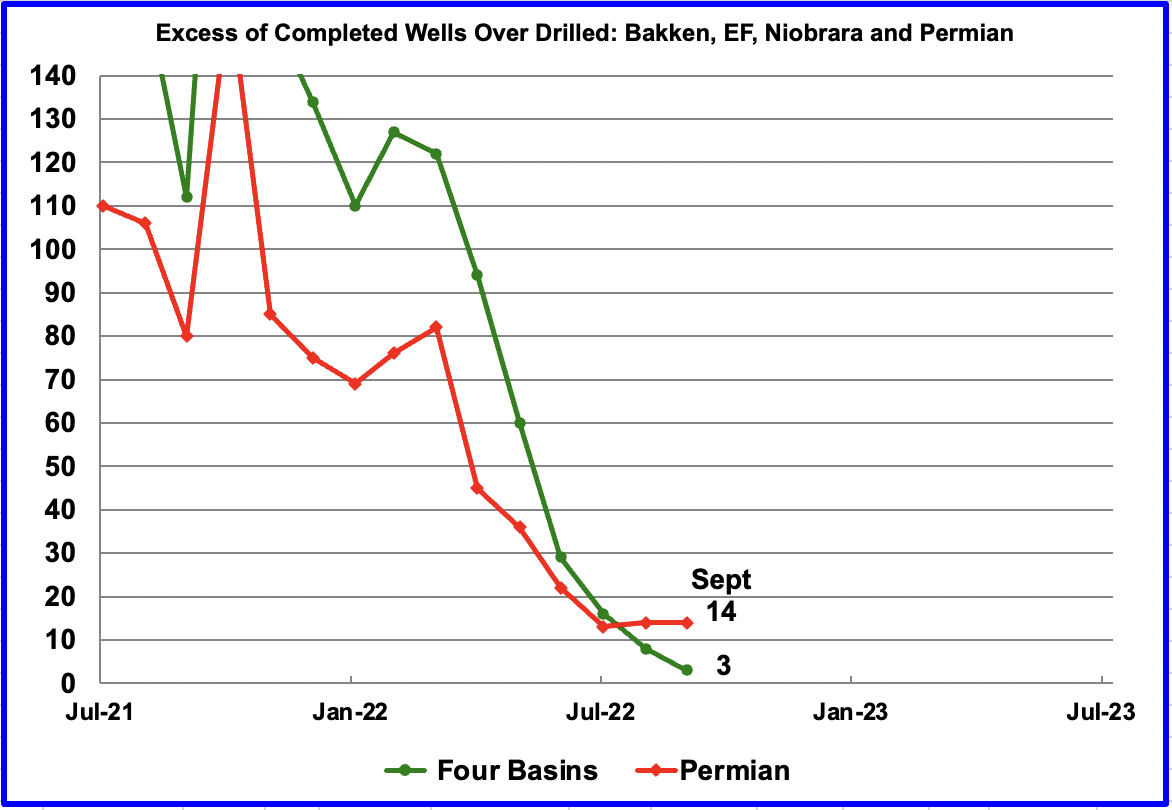
While this chart is titled “Excess of Completed Wells over Drilled”, it could also have been called “Monthly change in DUC completion rate” because the excess of completed wells in a given month is equal to the change in the DUC completion rate.
In these four primarily oil basins, the change in the monthly completion rate of DUCs started slowing after peaking in March 2021. In September 2022, there were 3 fewer DUCs (2,546 to 2,543 as shown in the previous chart) than in August. This means that the number of wells drilled and completed were essentially in balance in September in these four basins.
However in the Permian, the change in the monthly completion rate for DUCs has been unchanged for the last two months at 14. In September, the number of remaining DUCs fell by 14 (1,117 to 1,103 as shown in the previous chart). Note that since Permian excess well completions were greater than in all four basins combined, a few basins drilled more wells than were completed. For instance in the Niobrara, 126 wells were drilled and 111 were completed.
This chart shows that the completions of DUCs and the drilling of wells has stabilized in the Bakken, Eagle Ford and Niobrara basins while the inventory of DUCs continues to drop in the Permian.
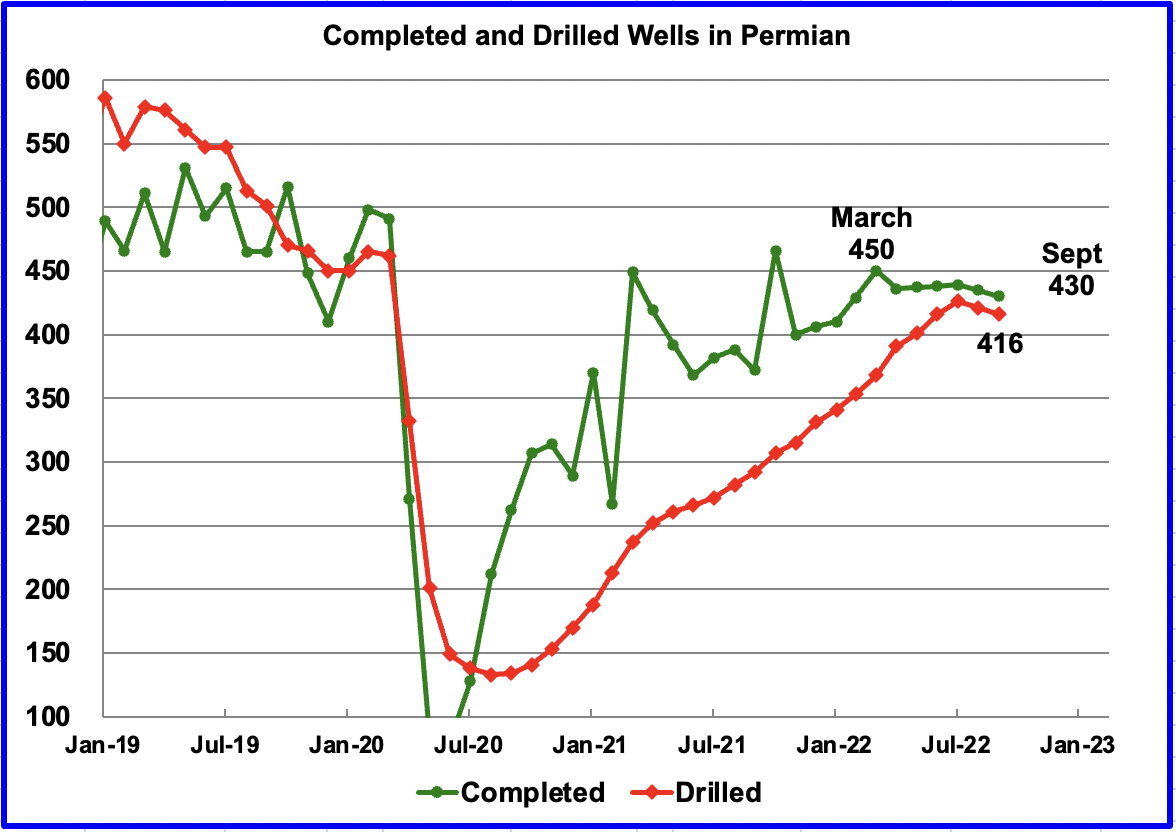
In the Permian, the monthly completion rate has been showing signs of slowing since the recent March peak of 450. This is consistent with the frac spread chart shown above where there has been little to no growth in frac spreads since February.
In September 416 wells were completed, 5 fewer than in August and 10 fewer than in July. During September, 430 new wells were drilled, a decrease of 5 over August and 20 fewer than in March. This is the second time that there was a MoM drop in drilled and completed wells. The gap between drilled and completed wells in the Permian has reached a new current low of 14, which is the same as reported in the previous chart.
October Light Tight Oil Update
The EIA’s LTO database provides information on LTO production from seven tight oil basins and a few smaller ones. The October 2022 report updates tight oil production to September 2022.
This is the second LTO report published after it was updated because of operational issues. While the first report revised production down, a bit much it appears, this second report has revised production back up. It also appears to be more reflective of what is happening in the field because the latest monthly production increases/decreases appear to be in line with previous months.
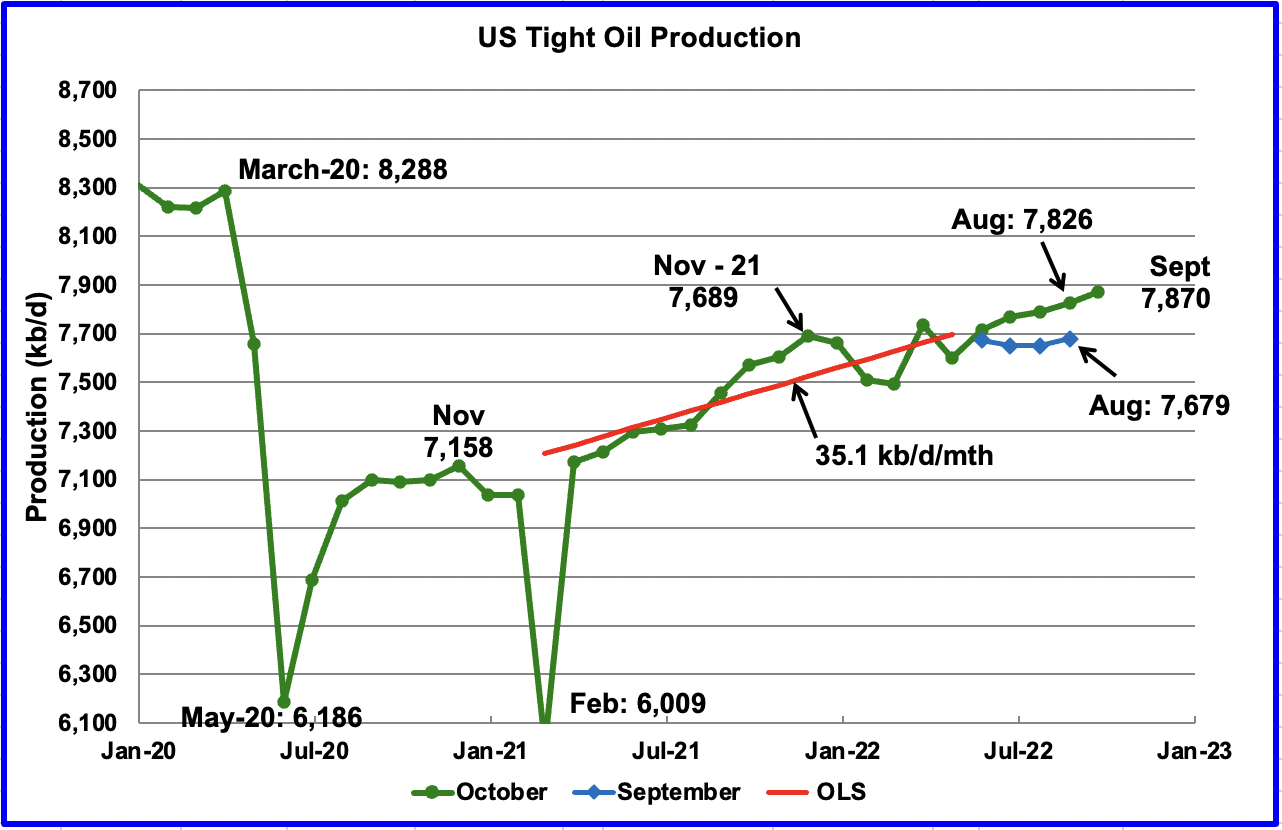
September’s LTO output increased by 44 kb/d to 7,870 kb/d.
The EIA’s September LTO report made significant downward revisions to the production forecast published in the May report. The October report indicates the September downward revisions were overdone and have been revised upward. For instance the August production rate reported in the September report has been revised up by 147 kb/d, from 7,679 kb/d to 7,826 in the October report.
The red OLS line from March 2021 to September 2023 indicates a monthly production increase of close to 35.1 kb/d/mth. The red line stops at April because it masked the green line. The analysis covered the whole period March 2021 to September 2023.
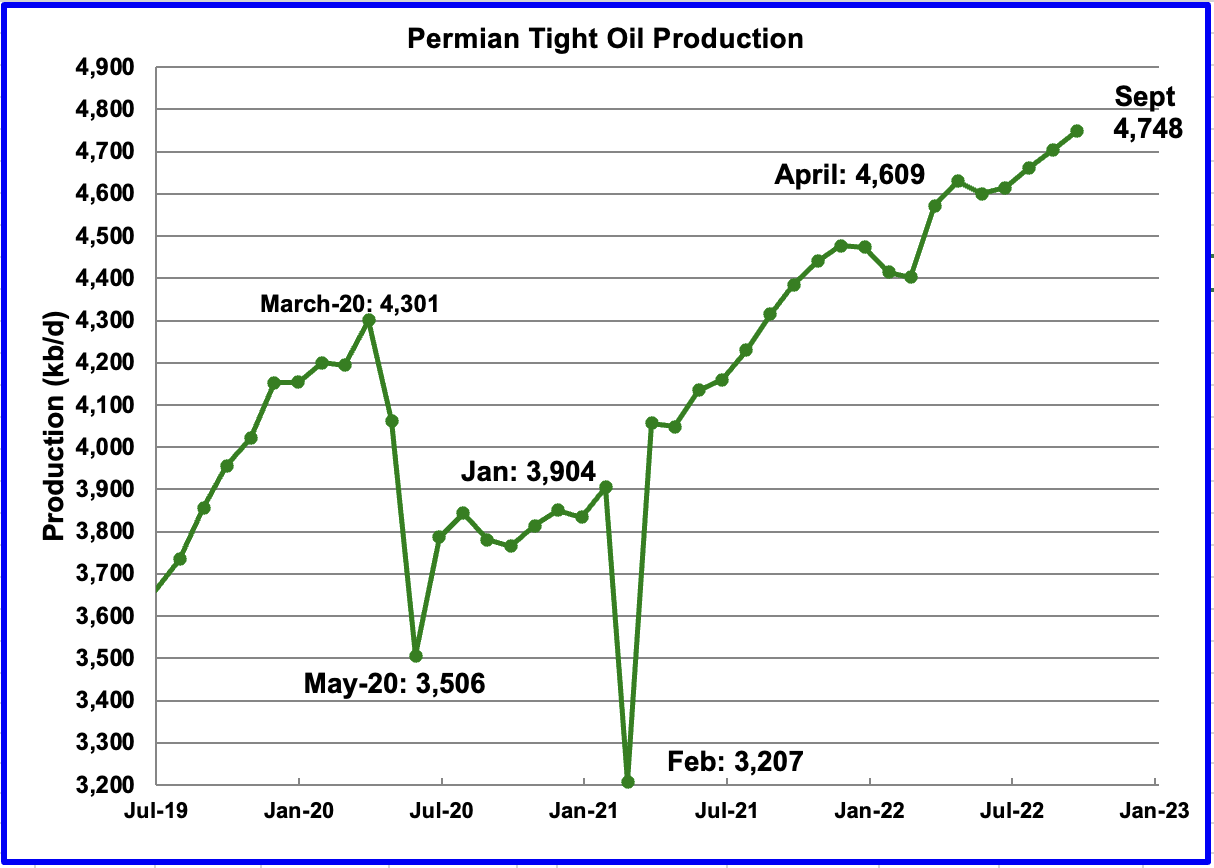
September’s output increased by 44 kb/d to 4,748 kb/d and is 447 kb/d higher than the high of 4,301 kb/d recorded in March 2020. Interestingly the Permian increase is the same as the total for the LTO basin.
According to this source the Permian may have seen its best days. For Top U.S. Oil Producers, Permian Shale Output Is Losing Steam
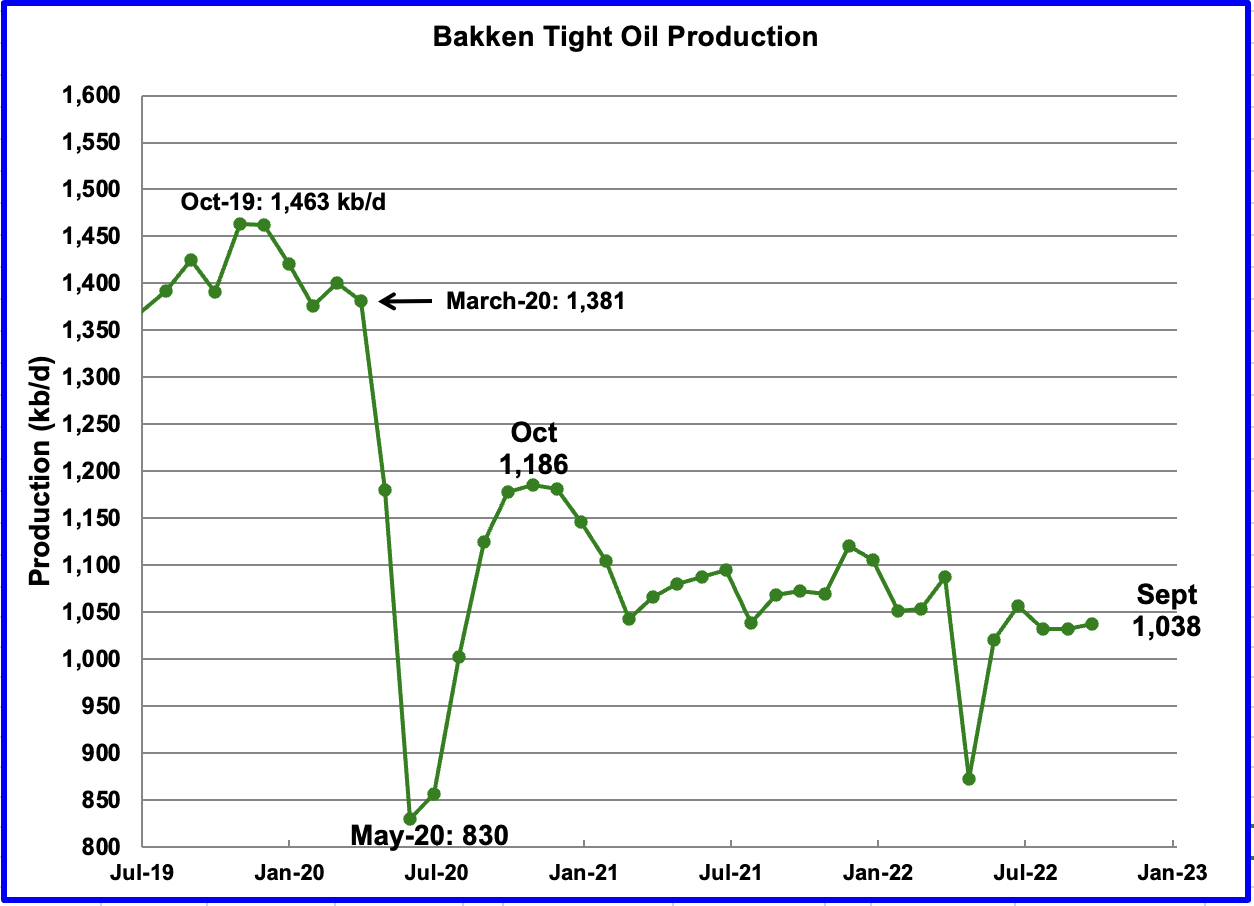
The Bakken’s September LTO output increased by 6 kb/d to 1,038 kb/d.
According to this source there was a steady stream of completed wells that would increase September production.
“There was a “steady stream” of oil and gas drilling permit applications in August, he said. The drilling rig count continues to stall out in the mid-forties and is expected to do so for the rest of the year.
There is a steady stream of newly completed wells, with a projection that September’s numbers will continue to increase.”
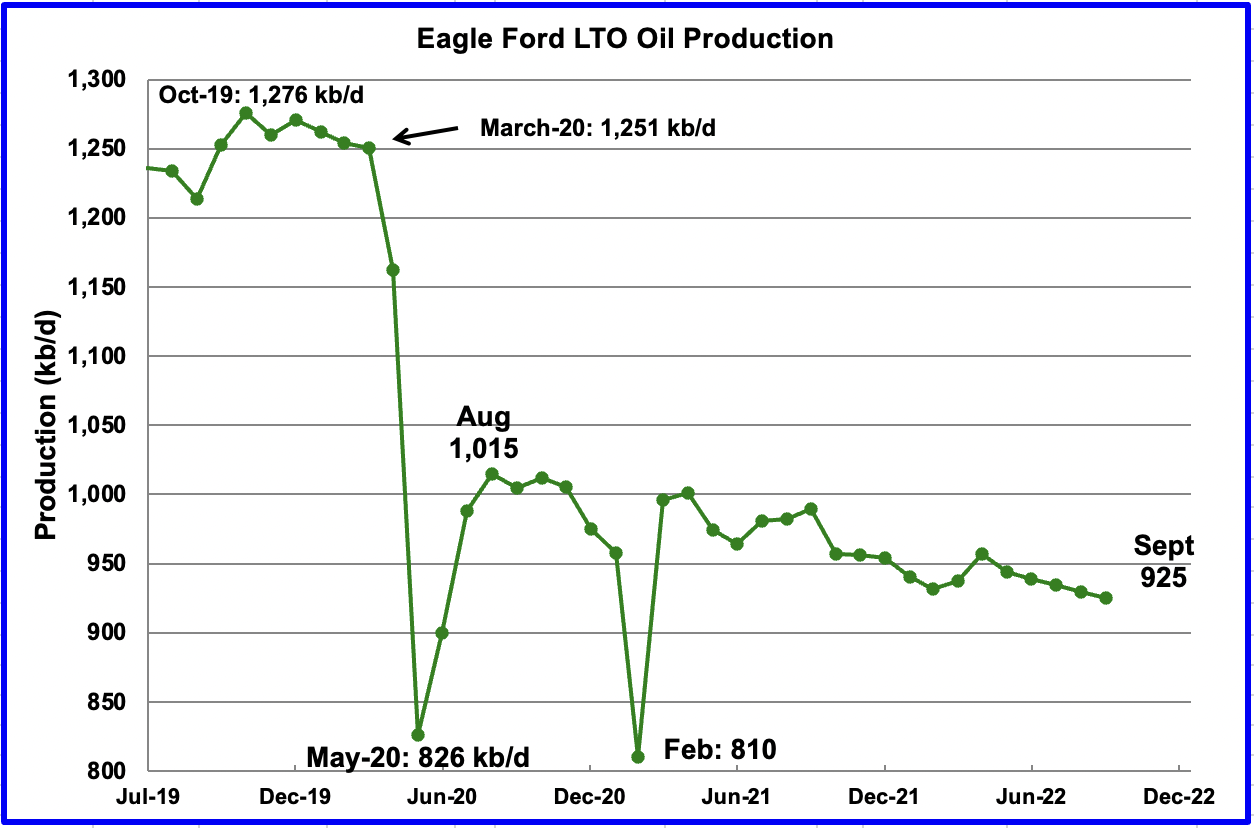
Production in the Eagle Ford basin decreased by 5 kb/d to 925 kb/d in September. Eagle Ford appears to have entered a slow decline phase.
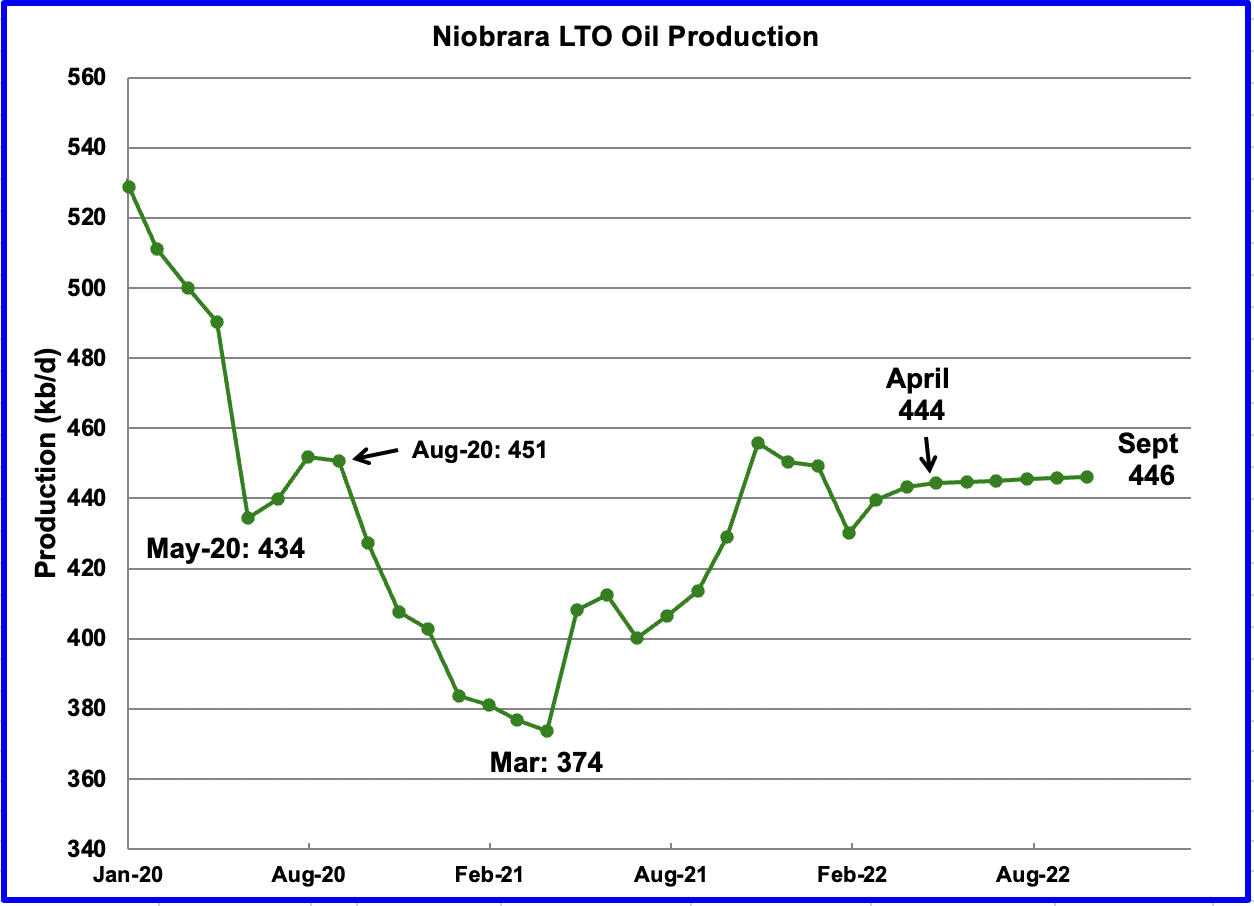
After increasing production from March 2021 to October 2021, output in the Niobrara began to drop in November 2021. Production since April has shown little growth. September’s output was unchanged at 446 kb/d and is up 2 kb/d from April.
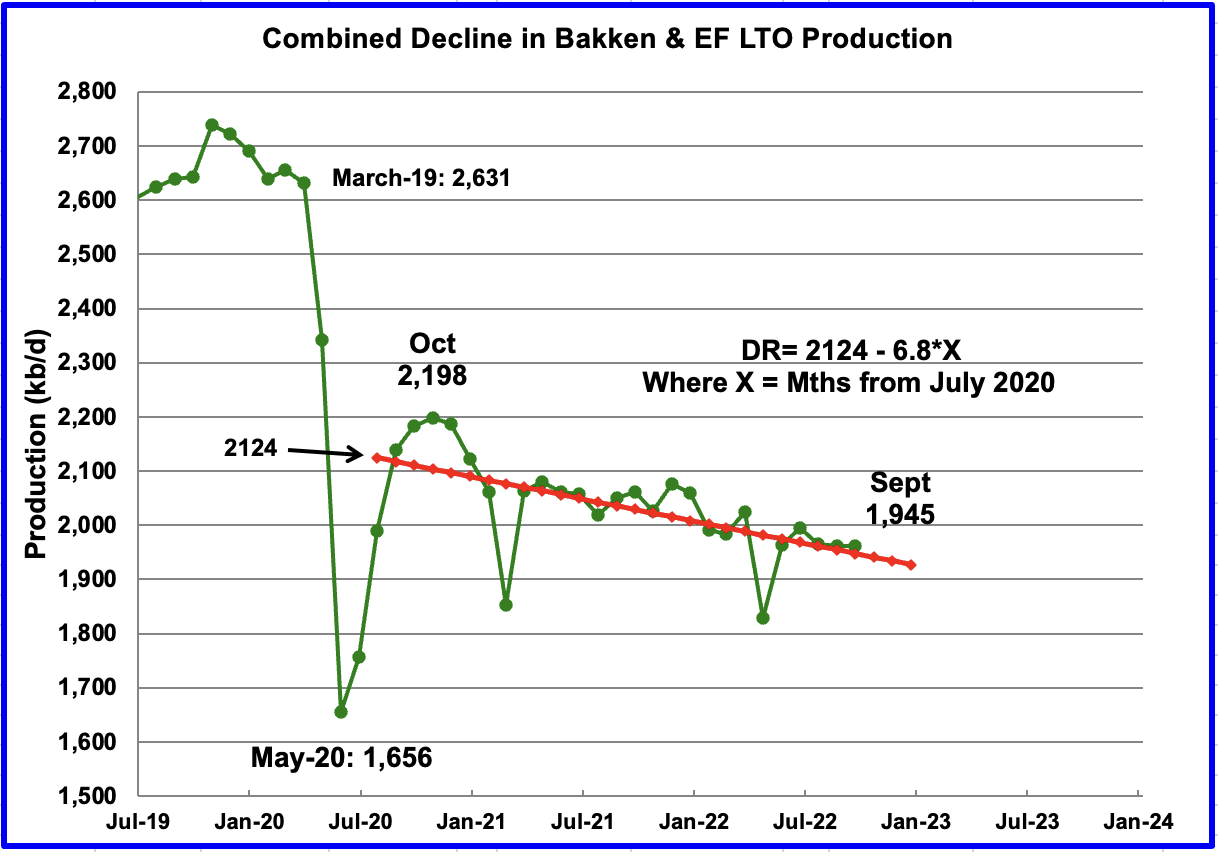
As noted above, monthly production in the Bakken and Eagle Ford basins since October 2020 has been in a slow decline. The decline being addressed here is not the rapid decline associated with LTO wells. Rather it is the decline associated with the lower productivity of new wells along with reduced investment in rigs and frac spreads.
The above chart is the combined output from the Bakken and Eagle Ford basins since they are so similar. Using data from July 2020 to September 2022, the OLS line gives a combined decline rate of 6.8 kb/d/mth.
On shore L48 Conventional Production
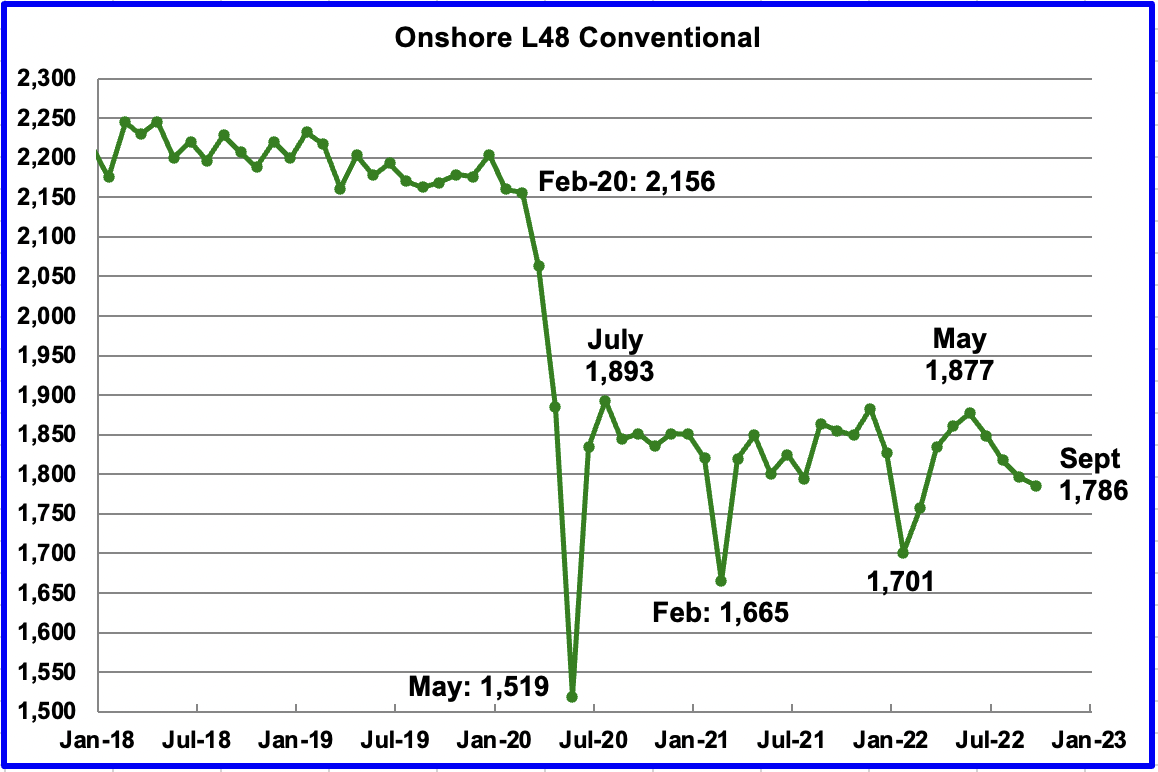
Conventional oil output in the Onshore L48 dropped by 10 kb/d in September to 1,786 kb/d and continued its decline from 1,877 kb/d which started in May. This estimate is based on a combination of the expected September LTO output and the October 2022 STEO report that has a September 2022 forecast for the US Onshore L48 output.
Production was essentially flat from June 2020 to June 2022. However since May 2022, a decline may have set in.
A note of caution is in order. This chart is derived by subtracting two large numbers which are subject to revision, particularly the last two months, August and September. Since there was an increase of close to 150 kb/d in LTO over the last four months, that has resulted in a similar drop in conventional crude.
Non-OPEC Production
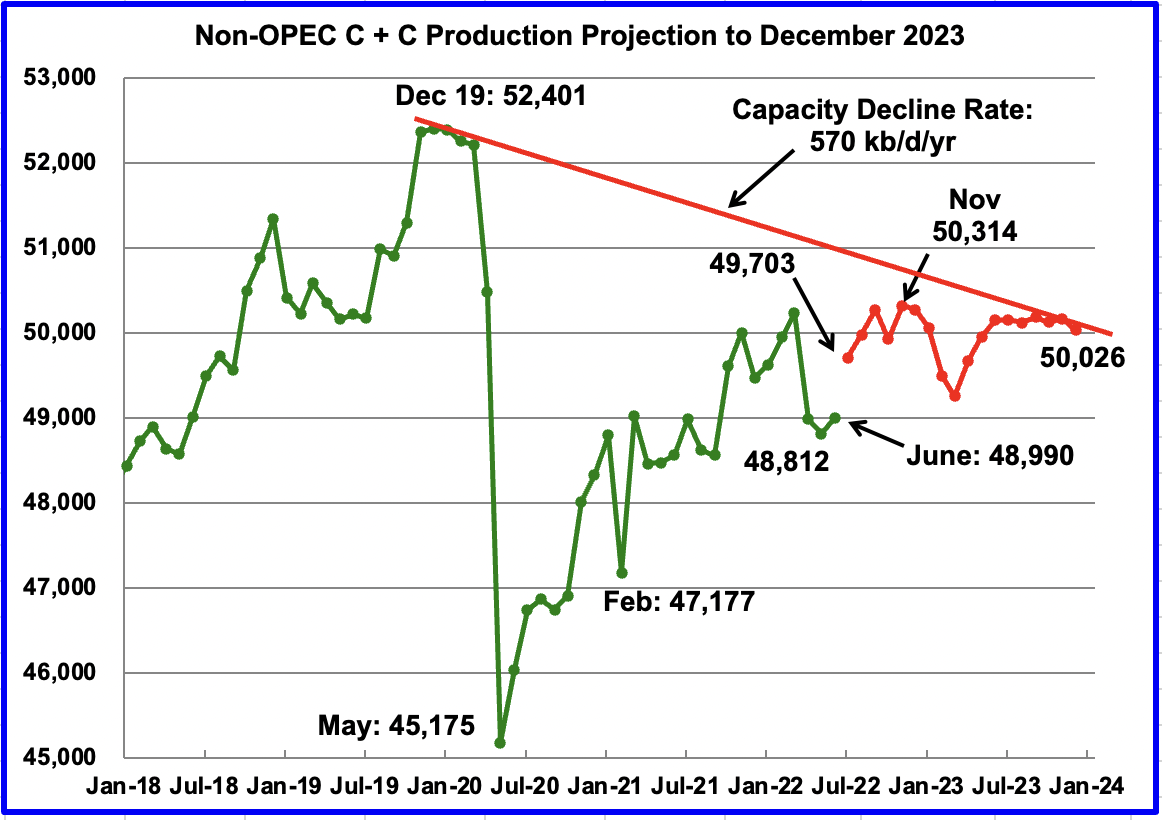
Non-OPEC oil production in June increased by 178 kb/d to 48,990 kb/d according to the EIA (Green graph).
Using data from the October 2022 STEO, a projection for Non-OPEC oil output was made for the time period July 2022 to December 2023. (Red graph). Output is expected to be 50,026 kb/d in December 2023. The July increase is expected to be 713 kb/d.
The projection shows that a post pandemic peak will be reached in the September to November time frame. Note that this high of close to 50,300 kb/d is the high for all of 2022 and 2023.
The red capacity decline line represents an average decline rate of 570 kb/d/yr for Non-OPEC countries over the four years since December 2019 and is combination of the natural decline rate plus possible reduction in exploration expenses and production/capacity investments.
Based on updated country data, the July increase of 713 kb/d will be provided by Brazil 155 kb/d, Canada 119 kb/d, Guyana 110 kb/d, Kazakhstan 214 kb/d and Norway 311 kb/d for a total of 909 kb/d. Offsetting this increase will be Russia with a drop of close to 217 kb/d, for an expected net increase of close to 700 kb/d. The EIA World report will be out with July crude production in about a week.
World Production W/O US
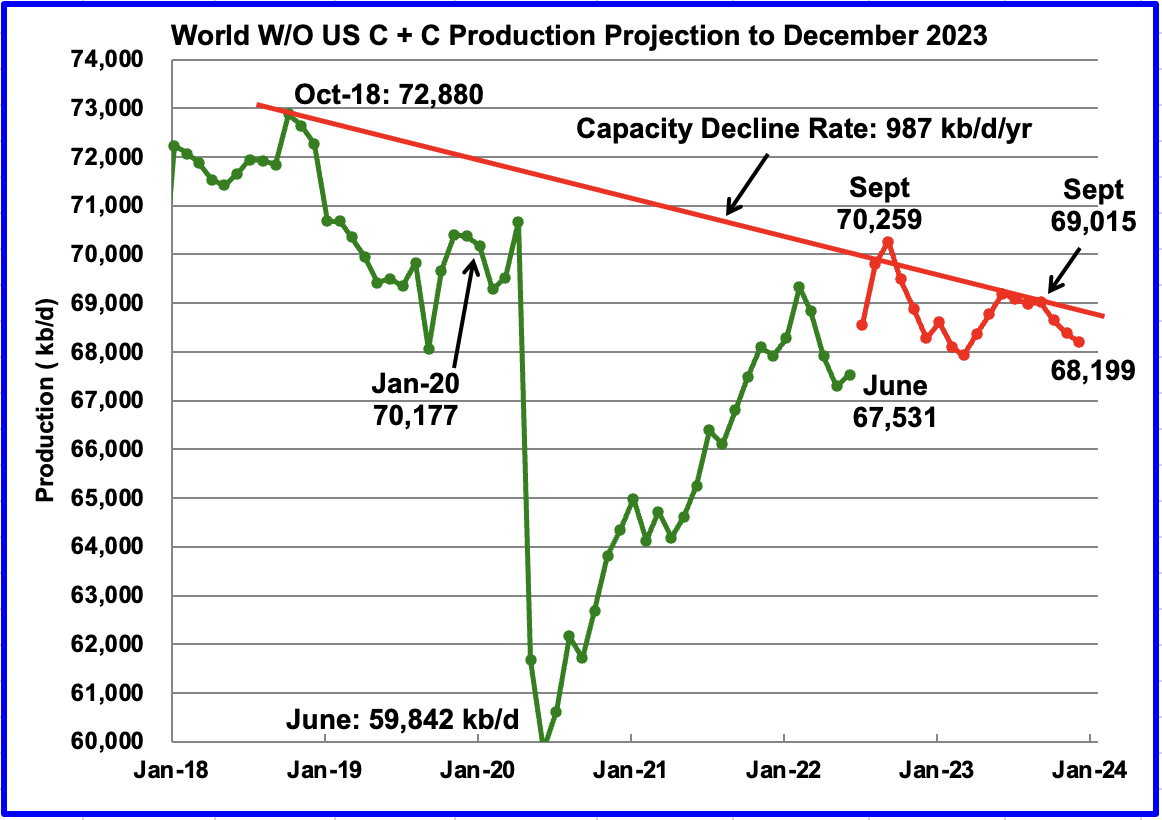
June World oil production W/O US increased by 234 kb/d to 67,531 kb/d according to the EIA (Green graph).
Using data from the October 2022 STEO, a projection for World oil output W/O US was made for the time period July 2022 to December 2023. (Red graph). Output is expected to be 68,199 kb/d in December 2023.
This chart also shows World production W/O the US with a post pandemic high occurring around September 2022.
The red capacity decline line represents an average two point decline rate of 987 kb/d/yr for World W/O US over the period October 2018 to September 2023. This is the highest decline rate seen over this period, provided the forecast is correct.
US Product Supplied
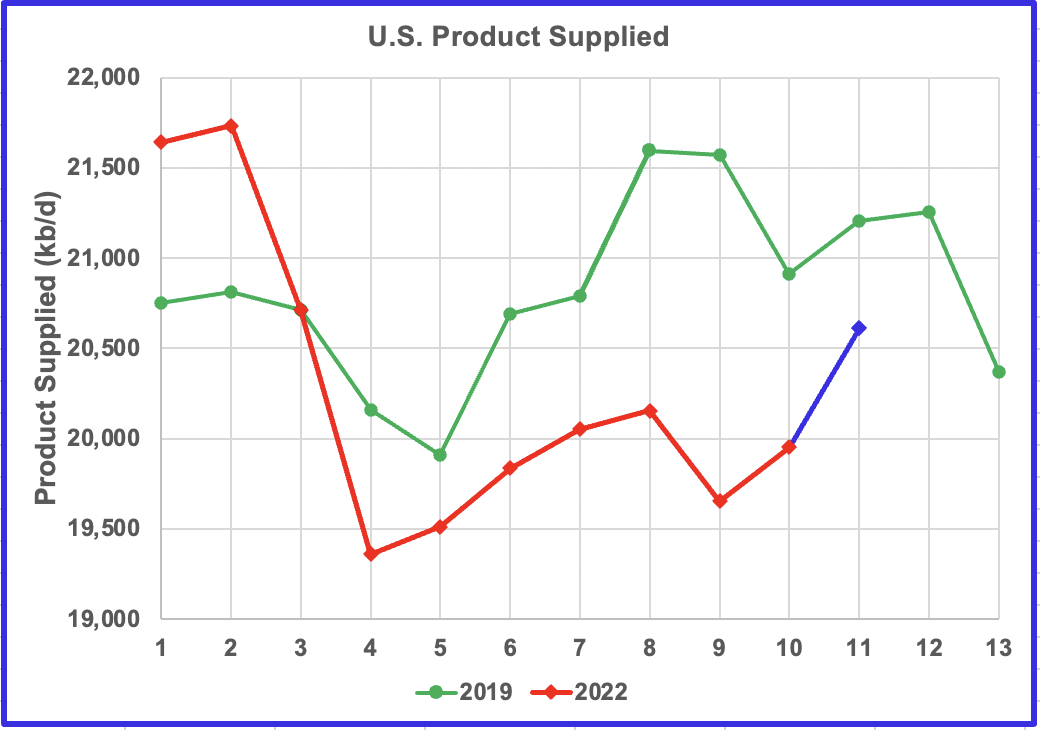
This chart shows product supplied in 2019 compared to 2022. The year has been divided into 13 four week segments. The last blue mark only represents the last three weeks. It does indicate that consumers are getting used to the currently higher oil product prices. Period nine shows an almost 2,000 kb/d decline in product supplied. The current period 11 is only down by 600 kb/d. Sounds like the US economy is on the mend.
284 responses to “US August Oil production at Post Pandemic High”
Thank you Ovi.
As always, outstanding work.
Dennis
Thanks
Thanks Ovi, great charts.
The “On shore L48 Conventional Production” chart is very informative. Many thought the demand destruction in 2020 “saved oil in the ground” pushing the peak forward. That chart clearly shows that the demand destruction did not save oil, the opposite was the case. The shutdown of many marginal wells meant they would never be restarted again. So instead of “pushing the peak forward” it simply confirmed that the peak was in the past.
Ron
Thanks
I think “the Rest” chart under Alternative view of US production shows definite damage to the tune of 900 kb/d.
Yeah, and that’s just here in the USA. The same thing is happening in many other places in the world.
I have mentioned this before when I thought it was obvious in many other places. No one seemed to be paying attention, however.
Ovi,
A lot of that change in “the rest” comes from North Dakota and Colorado and perhaps some from some other tight oil basins. In fact if we look at US tight oil minus Permian basin tight oil and take the centered twelve month average(CTMA), we find that from the peak in October 2019 at 4452 kb/d to the most recent CTMA of 3127 kb/d (March 2022 CTMA), the difference is 924 kb/d.
Perhaps these other tight oil basins will never increase their output to the previous peak, it will depend in part on how high the completion rate rises in these other basins in the future.
Also if we look at the decline rate of “the rest” of US tight oil (excludes Permian Basin) from July 2020 to August 2022 the OLS regression suggests a monthly decline rate of about 4.75 kb/d per month.
Dennis, it doesn’t really matter where it came from, it happened. And it happened to 58 other nations, about 75% of the world’s oil producers. It appears that most of the wells shut down were marginal wells that will, very likely, never be restarted.
Click on the chart to enlarge it.
Ron,
For tight oil basins it is less about shutting down marginal wells and more about the rate that new wells are completed. If the completion rate decreases too much then output will decrease. It took over 15 years for the World to return to the centered 12 month peak of 63033 kb/d in October 1979 in Jan 1996. It is total World output that is the story. We ar likely to see continued increases in World output until 2030 unless the transition to electric transport reduces oil demand to less than available supply at prevailing oil prices so that we see falling oil prices, in that case we will have a peak demand scenario that keeps World output below the 2018 peak. If autonoumous vehicles start to be approved before 2026 and robotaxis take off shortly thereafter, we could see oil demand decimated by 2028 which would lead to falling prices and falling supply of oil. In this case you will be correct and I hope that you are, but I am not that optimistic, I expect we will have to wait until 2035 for oil prices to start falling due to lack of demand.
Link below to Tony Seba presentation (18 minutes)
https://www.youtube.com/watch?v=Vqs0_3M-18c
That’s all well and good Dennis, but how do you explain what about the other 58 producers?
Ron,
For some of those producers perhaps marginal wells have been shut down permanently and the oil may remain in the ground, also there may be some wells that have been temporarily shut in and will eventually be brought back online or redeveloped in the future.
If oil prices go up to $150/bo, different decisions might be made, if oil prices decrease due to lack of demand the scenario could be very different. The future will depend a lot on the balance of supply and demand which is difficult to predict.
Here are the gainers since January 2020. I think they have about reached their peak.
Click on chart to enlarge it.
I should have excluded both Permian and Eagle Ford to compare with US minus Texas and New Mexico, sorry for the mistake.
When we do that we get a 600 kb/d of the drop from CTMA peak to the March CTMA for US tight minus the sum of Permian and Eagle Ford, so about two thirds of the 900 kb/d drop in L48 onshore output comes from tight oil outside Texas and New Mexico, the rest may well be a drop in US L48 onshore conventional C plus C output of roughly 300 kb/d.
OPEC oil output falls by 20,000 bpd in October -Reuters survey
In October, the 10 OPEC members bound by the deal have a target to produce 26.689 million barrels per day (bpd), down about 64,000 bpd from September’s target.
According to the survey, they trimmed output by 20,000 bpd to 25.33 million bpd. Still, this was 1.36 million bpd less than called for by the agreement.
September output was revised down after a change to the estimate for Angola.
Did they really trim or are they at capacity?
https://www.reuters.com/business/energy/opec-oil-output-falls-by-20000-bpd-october-reuters-survey-2022-11-02/
Ovi,
We will know the answer when Brent oil prices are over $100/bo in 2022$ and the big OPEC oil producers (Saudi Arabia, UAE, Iraq, and Kuwait) can no longer increase output. Clearly the other OPEC producers (with the possible exception of Iran) are already at capacity, the others may already be very close to capacity unless they choose to expand existing capacity, but that will likely take 3 to 5 years.
Dennis
I assume you are implying that once Brent gets over $100, that OPEC will increase production to try to stop the increased possibility of entering a recession.
“The employment index decreased to 49.1%, from 53.0%. Note: Above 50 indicates expansion, below 50 in contraction.”
Ovi,
I think if oil prices are over $100/bo, OPEC will likely not have any production quotas, but if they do it will be obvious to all they are trying to hide their lack of capacity. So everyone will be expecting an OPEC increase, but it may not happen.
Oh, I’m sure the world isn’t heading into some mild turbulence.
Sure thing, Dennis, oil will go up $5/barrel and everyone will open the taps they’ve kept closed.
Stephen,
If oil prices remain well above $100/b, say $110 to $130 for a 12 month period (say a yearly average of about $120), OPEC will no longer be claiming the need to restrain output, whether they can actually produce higher output remains to be seen, my guess is it will not be significant in the short term, maybe in 5 years if they develop their resources more aggressively they could increase output a bit.
We will see.
Prolonged $120 oil might do something. $100 oil obviously won’t as we have seen earlier this year. Thanks for the clarification.
Stephen,
Earlier in the year oil was above $100/bo briefly, things might have been different if oil price had remained above $100/bo, we will know more if this does in fact occur in the future, it will probably take a year with oil prices above $100/bo to see the effect I expect.
Dennis, oil has averaged much higher this year than 2019, yet the rig count is much lower. Something fundamental has changed that your model is not picking up on.
https://oilprice.com/Energy/Energy-General/US-Rig-Count-Still-305-Below-Pre-Pandemic-Levels.html
Higher costs?
Labor supply, materials, and cost of capital
@STEPHEN HREN:
I am thinking it could be too things:
– Supply chain issues for rig components;
– No good spots to drill; shortage of spots
Stephen,
Tight oil producers are being much more cautious than in the past.
Stephen,
At the end of 2019 the oil rig count in the US was 677 and the most recent oil rig count was 613, about 10% below the end of 2019 level. I agree oil prices are higher, but tight oil producers have become less willing to invest since the pandemic, investors want high dividends and/or stock buybacks.
And likely they are running out of places to drill also.
Ovi,
I get a slightly different result for the OLS on US C plus C output from June 2020 to August 2022, with a monthly increase of about 48 kb/d (annual increase of 575.21 kb/d).
Dennis
Checked my data. Looks OK to me. If I plug in your constants into my analysis, the SS increases.
Not sure where the diff is. Will keep looking,
Ovi,
When I drop the Feb 2021 data point I get a slope similar to your analysis. It may be a coincidence?
For this second chart the slope at a monthly rate is 44.4 kb/d per month.
Dennis
When we were having a private off line discussion on how to deal with the Feb 20 low, I looked at the difference between leaving that data point out and using the average. In updating the latest three months I forgot that February contained the average of January and March.
I have updated the post with the correct slope of 47.9 kb/d/mth.
I am beginning to better understand why so many writers say away from numbers.
Thanks Ovi,
I figured it was something simple and likely my error rather than yours.
Sorry to be a pain, note that your idea about dropping the data point may be a good one in this case, I tried a very simple method of minimizing the absolute value of the residual rather than the square and go a slope of 40/kb/d per month. This is a simplistic way of doing so-called “robust regression”, that are resistant to outliers. There are better methods available in R, but I have not yet gotten up to speed in that language where there are much better regression tools than simple OLS.
In short your 44 kb/d per month estimate may indeed be the better estimate.
If I figure out the robust regression, I will let you know by email.
Dennis
There is not much difference between between 44 and 40 or 48. What was concerning to me in the earlier STEO reports was the sudden increase in slope starting in September 2022 from around 50 kb/d/mth in the previous months to 75 kb/d/mth after.
I think the revised LTO report has affected both the DPR and the STEO for the better.
As for better regression, I recall reading many years ago of using a moving average and then regressing. Not sure if the is discussed anymore.
Permian tight oil output using data from tight oil production estimates by play at link below
https://www.eia.gov/petroleum/data.php#crude
The OLS regression is on data from August 2020 to September 2022 for Permian basin tight oil output. Monthly rate of increase is about 45 kb/d per month.
Permian Basin tight oil output is the sum of the Spraberry, Wolfcamp, and Bonespring formations within the Midland subbasin in Texas and the Delaware subbasin of Texas and New Mexico. The Spraberry formation is in the Midland basin and the Bonespring formation is in the Delaware basin, the Wolfcamp formation is in both the Midland and Delaware basins.
Many have claimed this rate of increase cannot continue, but keep in mind that the annual rate of increase in percentage terms is about 13% over the Aug 2020 to Sept 2022 period. Over the July 2017 to June 2019 period the average annual rate of increase in Permian tight oil output was about 37.5%.
I think when Scott Sheffield and others try to tamp down expectations of future Permian tight oil growth, they are saying don’t expect 37% annual rates of increase in the future. My guess is that a 500 to 550 kb/d annual rate of increase can be maintained for 5 years or so for Permian basin tight oil with a gradual decrease in rate over time. This assumes that oil prices remain relatively high (over $90/bo for average annual oil prices from 2023 to 2028).
Dennis,
There is no way the increase you suggest will be happening. Did you notice the aggressive drawdown of DUC inventory in the last 18 months? Without the DUC completions, we would have seen little to no production growth in the Permian (including New Mexico) Prices need to be at least above $125 per barrel to expand drilling and completions taking into account current inflated costs. Furthermore, once we do start seeing production declines, they will be like falling off of a cliff. You will see a greater than a 100,000 BOPD each month.
Another real problem with the Permian is gas take away. The Producers are getting hammered with low Natural gas prices and Pipeline Midstream Companies are loathed to commit a tremendous amount of capital to build to this region when they know, the region will begin terminal decline very shortly.
LTO Survivor,
The recent drop in prices at Waha Hub is likely temporary due to maintenance and more pipeline capacity is scheduled to come online. Yes I have noticed the DUC inventory has decreased and also have noticed that it is decreasing more slowly of late, if completion rate comes down just a small amount and rig count rises just a bit the DUC count will start to rise in the Permian basin. Also costs may come down as commodity prices were sky high and are coming down, it will take 6 to 12 months to this to feed in to steel pipe and other input prices. I would think excess natural gas could be used to run frac equipment instead of diesel and if natural gas prices are low this would reduce cost.
I think $100/bo and $5/MCF are enough to see Permian output continue to expand at about 8.5% per year.
We will see.
Below is a more conservative Permian scenario with the monthly completion rate gradually increasing from 400 completed wells per month in Dec 2022 to 450 wells/month in Feb 2027 (an increase of one well each month over that 4 year period. I expect this scenario will be too conservative unless oil prices remain under $90/bo. The annual growth rate is about 5.7% for this scenario.
Forgot units on chart, vertical axis is in kbo/d, the annual rate of increase for this scenario is about 300 kb/d.
When do you expect the 100 kb/d monthly decrease in Permian output to begin? Notice what is happening in the Eagle Ford and Bakken, output is declining but at more like 5 kb/d month.
Terminal declines in the Permian very shortly??? In the greatest petroleum system on Earth? That’s silly vodka talk. Pipes will still be built, expanded and maintained for decades in the Permian.
Terminal declines in the Permian very shortly??? In the greatest petroleum system on Earth?
What a relief to know that we have a brilliant oil field geologist on this blog. Smart enough to know that the Permian makes Ghawar look puny.
No different than another person opining that terminal decline is imminent in the Permian. I just happen to disagree… opinions vary. We are all just staring into crystal balls anyway.
I never compared Permian to Ghawar… that’s your comment. However, given a choice of any spot on the planet to own acreage, Permian would be mine. It is still surprising us with world class new plays and rebirth of old plays… truly an amazing complex.
Ghawer is obviously an amazing beast too, but not really a clean comparison vs. Permian… A “single” field vs. a multi-basin and platform complex with thousands of fields. Not really fair to Ghawar.
But thanks for the warm wishes, Ron.
I was referring to “total barrels produced, or will be produced.” Ghawar began production in 1940 and has cumulative production of over 70 billion barrels. Approximately 60–65% of all Saudi oil produced between 1948 and 2000 came from Ghawar.
Anyway, what the hell do I know? I am not an oil man. But LTO Survivor is an oil man. He is an actual Texas oil driller. I was just taking his word for the situation. What are your credentials? Why do you think you know more about the Permian than he does?
Ron,
Scott Sheffield is CEO of the company with the highest oil output in the Permian basin (Pioneer Natural Resources). He says:
“With an inventory of more than 20 years of high-return wells, our improved 2023 development program is highly repeatable and will deliver affordable energy to the world…”
Sorry Dennis, but this man is obviously lying, perhaps to pump up his stock price. It is impossible to have 20 years of high return wells in the Permian. As you know Permian shale wells drop about 80% of their production in the first 2 years. But he is saying they will produce high returnes for 20 years? Bullshit!
Okay, quite obviously, he is talking about reserves, not actual producing wells. That’ tricks they play in order to pump up their stock. However he cannot know how much oil those reserves will produce.
LTO Survivor,
I found this article today, see link below, arlicle published November 3, 2022.
https://www.naturalgasintel.com/pioneer-aiming-to-limit-exposure-to-weak-waha-natural-gas-prices/
Excerpt:
Pioneer CEO Scott Sheffield has increasingly focused Pioneer’s operations on the Permian’s Midland sub-basin, citing what he said is superior inventory to that of the Delaware sub-basin.
Pioneer is targeting full-year 2022 capital expenditures (capex) of $3.6-3.8 billion, to be fully funded by cash flow.
Pioneer plans to operate an average of 22-24 horizontal drilling rigs and about six hydraulic fracturing fleets in the Midland for the year, and to place 475-505 wells on production.
The company is forecasting 2022 production of 623,000-648,000 boe/d, including oil output of 350,000-365,000 b/d.
“To further enhance our top-tier free cash flow generation and return of capital, we have increased the return thresholds for wells to be included in our future development programs, which is expected to improve our program well productivity in 2023 and subsequent years, surpassing 2021 productivity levels,” said Sheffield. “Additionally, our current 15,000-foot lateral program, which we plan to expand in 2023, is delivering improved returns through lower capital costs per lateral foot.
“With an inventory of more than 20 years of high-return wells, our improved 2023 development program is highly repeatable and will deliver affordable energy to the world, with some of the lowest emissions as a result of the company’s high environmental standards.”
Dennis do you have any idea of the technical geoscience and engineering work required to get 1 location ready for a drill bit much less the technical work required to count “drillable ready for the drill bit” locations for the next 20 years!
Do people really believe this nonsense? Are you all in Dennis, portfolio wise with PXD?
Scott Sheffield: “With an inventory of more than 20 years of high return well, our . . .program is highly repeatable . . as a result of the company’s high environmental standards.”
I get a really good laugh when I read someone citing Scott Sheffield. Scott isn’t talking to me or you Dennis. Scott is talking to PXD’s bond holders and Wall Street.
And the word on the street in Midland, Texas is that the internal discussions at PXD is “how do we shift PXD from a “pure play Permian” company to a different and preferably new basin?
And this discussion is not limited to PXD.
John
US economy is definitely not on the mends. GDP was 2.9% for the quarter. Of which 2.8% was exports. Mainly high priced natural gas to Europe.
Not really what you want to see. You want to see Imports going up because that means US consumers are buying lots of stuff.
US economy is decelerating. And will continue to. The recession is just getting started.
Diesel shortage that can’t be fixed in a speedy manner will equal mass layoffs.
HHH,
Note that a lot of the high price of natural gas in Europe goes to the middlemen transporting the LNG, see
https://www.forbes.com/sites/thebakersinstitute/2022/10/26/whos-to-blame-for-exorbitant-natural-gas-prices-in-europe-hint-maybe-not-who-you-think/?sh=6f42cb447fa9
Excerpt:
Currently, given high prices, Europe is one of the major markets for this gas but it is not the US LNG exporters or US gas producers who pocket the steep price difference between HH and European spot prices. It is the “middle men” companies who buy natural gas or LNG in the US and sell LNG in Europe that receive the windfall.
HHH,
The claims of a diesel shortage are overblown see
https://www.eia.gov/dnav/pet/hist/LeafHandler.ashx?n=PET&s=WDIUPUS2&f=4
Dennis,
The reason for the higher Diesel & Natgas prices is due to Free Market Capitalism. The U.S. has been exporting on average, 1.2 mbd of Diesel and 10 Bcf/d of Natgas. If we kept some of this to fill our inventories to the normal 5-year average levels, we wouldn’t be seeing our diesel inventories at 106 million barrels when they should be closer to 140 million barrels.
Now, with the next round of EU Sanctions on Russia, to stop receiving Russian diesel imports, the U.S. will likely be EXPORTING MORE DIESEL to Europe.
So, we can thank EUROPE for even higher Diesel prices in the future… GO EUROPE… keep the hammer on Russia… LOL.
GOD HATH A SENSE OF HUMOR…
steve
Thanks Steve – So that’s why stocks are drawing down so much, producing 5, exporting ~1.2, and still consuming ~4.3, so net effect is every day distillate stocks are dropping 500k, only ~100,000k in the piggy bank so can’t keep this up for too much longer…
All the while high diesel prices here and abroad are causing major damage to global economy…
So, maybe the diesel shortage is real? Or maybe very soon it is going to be more real?
KENGEO,
The Diesel Shortage is tied to the problems stemming from Europe and will likely worsen if we export more diesel.
However, I see a continued structural diesel shortage in the world as global oil production declines.
steve
Dennis –
I think I agree with you about the diesel situation, but some of the trends are concerning, and if the Permian pulls back significantly like many of us think it will then things could change very quickly…
That’s curious why heating oil is double the price it was a year ago?
Also, distillate stocks a year ago were 127,000,000, as of 10/28/22 they are 107,000,000 (30 days supply vs 25 days). Dist. production stands at 5 MBpD, versus ~4.6 a year ago. This should result in a slow build as long as demand is not too high…refining margins are all time highs (diesel in Europe is $8-10 per gallon, about double US price), so refiners are producing at max capacity…but what is strange is that in past month overall distillate stock has dropped 5%, must be exports drawing supplies down…
New England and Central Atlantic are running at 52% from a year ago…
Demand doesn’t appear to be waning much (currently above levels from a year ago) – peak demand should hit in next 1-2 months… I guess most people fuel their trucks and heat their homes regardless of price, if they don’t drive then they have no income…if they don’t heat their homes they are dead…
Kengeo,
Fewer people are heating with fuel oil, many are switching to natural gas, propane, or installing heat pumps. Few people drive diesel passenger vehicles in the US. Stocks of diesel have decreased a bit, if supplies become short less will be exported.
There is not much sign of Permian output decreasing at present.
Kengeo,
Distillate exports are coming down of late.
Also worth noting that 25 days of diesel supply is a little bit misleading, because it includes product that is required to just keep the system running: such as, process inventory in refineries, volume required to fill pipelines, product trapped in tank bottoms, product in rail and truck transport etc.
PADD 1 distribution stress is already starting to show up, they are likely the bellweather for when the system disintegrates due to a lack of sufficient operating inventory.
Old Chemist , intelligent post . X number of days is not important , what is important is MOL ( Minimum Operating Level ) . A business does not shutdown because it has zero turnover , it shutdowns because sales are not enough to meet the expenses at the MOL ( also called breakeven ) . Kudos .
HHH . $ 1 trillion flew out of the emerging markets to USA . The Eurodollar problem is a bitch . India’s reserve one year ago were $ 640 billion now $ 525 billion . $ 115 billion gone in a year . Affordability of oil is now an issue for several countries .
Petrodollar is really just a myth. It doesn’t and has never really existed. It’s Eurodollars that are used to settle oil transactions. And no the FED and US government don’t control the currency that global settlements are done in.
HHH
After decades of running a trade deficit, a little export led growth can’t hurt America.
Ovi – Thanks for doing this update.
Your fingers must be sore from all the CTRL+C / CTRL+V just for the charts!
Thanks
WP
WeekendPeak
Thanks.
Yes it takes time but it also fills the time with a very interesting subject that most of the world is ignoring. My biggest problem is typing.
Ovi you do an outstanding job for this website. I for one am very thankful for everything you do.
LTO Survivor
Thanks. I am also thankful for Dennis and his contribution who does so much to keep the discussion going.
Thanks also for your hands on information.
In the discussion of oil production the focus on global production glosses over the unequal distribution energy among countries, and that effect on the economic prospects of most major countries of the world.
Up above it was stated ” It is total World output that is the story.”
As I see it- The big story is just how much crude oil and derived products are available for net export.
Consider that 8 of the top 10 biggest economy’s of the world are big net oil importers
[in order of GDP this includes China, Germany, Japan, UK, India, France, Italy, and S.Korea]
The other two on the list are Canada (clearly a long term net exporter), and USA. For the last 30 years the US has been a big net importer of oil (with the possible exception of the last couple years?).
Beyond the top ten biggest economies, there are over 100 other countries that are heavily dependent of oil imports.
Take S. Korea for example- A big industrialized economy in a country that has no domestic fossils. Oil contributes 43% of total energy consumption. The only current sizeable non-fossil energy is nuclear at 11% of total supply, and the output level has not grown in the past 35 years. Hydro, bio, wind and solar combined for less than 4% of total.
Their solar prospects are fair- annual insolation level on par with Toronto or Budapest.
Their onshore wind reserve is poor, the offshore wind prospects are not prime.
Transport use of crude is roughly 50% of total, with the other 50% being utilized for a wide range of industrial applications. Very little of that industrial use can be replaced by electricty. I don’t know if much can be offset by nat gas liquids or coal.
Consider that Naphtha as a petrochemical feedstock is 47% of total crude oil product consumption.
Clearly, if less oil is available for export then this country is going to experience big economic and social problems. And they are just one country of many. China, Japan, Germany have very similar problems.
https://ourworldindata.org/energy/country/south-korea
https://www.enerdata.net/estore/energy-market/south-korea/
Hickory,
Korea is expanding there sales of EVs
http://www.koreaherald.com/view.php?ud=20211115000649
and
https://www.seoulz.com/the-electric-vehicle-industry-in-korea-3-million-evs-by-2025/
I have no doubt that Korea will make a dramatic shift this decade toward electric vehicles, and will do a hard ramp up on solar.
That will help the situation from being quite as problematic/severe.
A big point of giving this example is that over a hundred countries are going to be competing for a dwindling supply of export oil. This competition for the products has always been a big issue, but will become an existential level competition as the next decade or three unfolds.
Some countries simply will not have the cash or credit to purchase what their economy needs for base operations and industries.
Efforts to replace demand with electric sources will help somewhat- much more in some countries than others.
Most countries are getting a very late start at those efforts.
But electricity can not replace some of the uses of oil, such as petrochemical feedstock.
D Coyne: “I think when Scott Sheffield and others try to tamp down expectations of future Permian tight oil growth, they are saying don’t expect 37% annual rates of increase in the future. My guess is that a 500 to 550 kb/d annual rate of increase can be maintained for 5 years or so for Permian basin tight oil with a gradual decrease in rate over time.”
Mr. Sheffield was the first person in the Permian Basin to warn that the GOR was rising inexplicably (2017). I’m sure his engineers and geologists informed him of the complex geologic physics involved.
In low permeability reservoirs (shale), solution gas separates from rock when the reservoir pressure drops lower than the bubble point of the gas. At that point, the gas emerges from solution, and also out of the rock. What causes the reservoir pressure to drop? Well, the removal of hydrocarbons, for one thing. Drilling an infill well too close is another. Sound familiar?
This point is marked by more than just gas coming out of solution. It is also the point where the oil cut falls. Necessarily, the GOR increases. By definition (of a light tight well), the bulk of the oil is of short-chain hydrocarbon molecules, but it is the longer chain (C6+) that cause all the problems. When the pressure falls, they get lodged in artificially fractured pores–billions of them.
By this point, the average Wolfcamp (both A & B benches) oil cut has dropped substantially, driven by aging wells hitting their bubble point. The GOR has to rise. It’s not talked about much.
This awful feature that Mr. Sheffield warned about was preceded by the same thing in the Bakken, the Niobrara, and the Eagle Ford. It happens in every shale basin. This interesting oil-gas-pressure interaction with the fracture spiderweb determines more than anything else the longevity of a shale oil well. The only thing keeping oil production rising in the Permian is the drilling of a great number of wells. When multiple thick benches were found in the NM part of the Permian, most of the rigs left the other basins. If the rig count doubled in the Bakken, the average production would rise dramatically and the GOR would fall. For a while.
Alas, a rising GOR is much more of a harbinger than was initially thought. This gets measurably worse when you try to crowd the field: two wells per 1280 acres is too few but twenty is too many. The only thing so far that will slow down decline is the injection of field gas to maintain reservoir pressure. The more ethane percentage in the NG the better because it is a superior solvent for naphthalenes and asphaltenes and even longer-chain hydrocarbons–it keeps the pores open longer. But eventually the inevitable will occur.
ALL shale oil fields are in decline. Enjoy the IP, because that’s where the money is. In fact, if you can’t reclaim 100% of your investment money from the IP, don’t participate. That’s my suggestion.
Different look at tight oil GOR for Permian, Bakken, Eagle Ford, and Niobrara Basins.
GOR data from EIA
Gerry,
You are correct on all points. More than one year payout of a well is just trading dollars. Pioneer is a bell weather major independent. When they signal they are looking for other zones, this tells the market a whole bunch about their drilling inventory.
The UK oil and gas reserves for 2021 were issued by the NSTA (ex OGA) in September. All areas, including one time frontier West of Shetland, are past mature and there are very few new discoveries or reserve revisions (actually P2 oil numbers have declined in the last four years showing negative revisions to existing discoveries). There is continuous trumpeting of the potential for multi billion barrel new developments but almost no sign of them, and as more and more main platforms are decommissioned the chances for developing small deposits, that would only have sufficient ERoI as tie-backs, fall away.
Oil has an R/P around nine and has been fairly stable. This equates to over 10% decline.
Natural Gas is in slightly worse shape, and the desire for increased draw in this and future winters is likely to increase decline. R/P is about seven, equivalent to about 14% decline without new additions.
(actually P2 oil numbers have declined in the last four years showing negative revisions to existing discoveries).
The official name for that phenomenon is “reserve shrinkage.” 🤣
Ron,
Note that the cumulative 2P reserve line is the one to pay attention to, this is the engineering best estimate, it has dipped a bit, especially when oil or natural gas prices fell, but the big dips are in the 3P reserves which include the possible P3 category which are more speculative.
Almost certainly because a number of largish start-ups from 2017/2018 have significantly underperformed: WIDP, Laggan (condensate), Scheihallion redevelopment, Clare Ridge and, especially, Mariner.
and
I like listening to Charles Hall, even when he’s repeating things I’ve heard before. I’d bet he’s great company over a beer: https://www.youtube.com/watch?v=6DABEN4slmo
Thank you! The Q&A portion is just a hoot!
Everyone is ignoring crude oil supply. Peak oil demand is all that anyone talks about. However, I believe the UAE’s Energy Minister Suhail Al-Mazrouei is obviously talking about the geology of peak oil supply here, not the economic concept of peak oil demand.
UAE Believes The Oil Industry Is In “Decline Mode”
Crude oil is in “decline mode” in the long term, OPEC heavyweight the United Arab Emirates (UAE) says.
“To assume oil is going to be there forever is wishful thinking,” the UAE’s Energy Minister Suhail Al-Mazrouei said at the ADIPEC energy conference, as carried by Bloomberg.
“No matter how much we defend it, it’s in decline mode,” said the official from the UAE, one of the most influential members of OPEC and a major crude oil exporter.
Ron,
The demand forecast by OPEC is what they are hoping for, in this case they are perhaps worse than the EIA. The IEA is closer to the truth in my opinion. If autonomous vehicles ever reach level 4 autonomy, then oil demand very quickly crashes. Lots of companies are working on this (Tesla, Google, Apple, and most major auto companies (Ford, GM, Audi, VW, Mercedes, Nissan, BMW, Honda, Toyota, Kia/Hyundai) it only take one company to break through and take over the market. I expect this may happen between 2025 and 2030 (regulatory approval in California), once it occurs it will spread rapidly in the US and then throughout the OECD.
I suspect that the impact of autonomous vehicles deployment on oil demand will take much longer to materialize than you Dennis. Maybe ten years later.
Perhaps I am just unimaginative on it, or perhaps just realistic.
I am certainly am not well educated on it, so take my comment with salt.
Hickory,
See following video, 19 minutes.
https://www.youtube.com/watch?v=Vqs0_3M-18c
Fleets discussed starting at minute 4, autonomous vehicles around 7 minutes,
Transportation as a service around 11:40, it will be ten times cheaper per mile than a new car, and 4 times cheaper than just the operating cost of a car that has already been paid for (say you were given an old car by your neighbor). The expectation is that oil demand falls to 70 Mb/d by 2030 and oil prices fall to $25/bo.
Also the point is made that hardware costs are decreasing exponentially while software improvements are progressing exponentially, making AI improvements increase at a double exponential rate, Machine learning is the key behind AV development, it might take much longer than Tony Seba believes, but his past projections from 2014 were pretty good (see first 7 minutes of video where he talks about EV costs and availability of 200 mile range EV for under 10k.) Also see link below.
https://www.greencarreports.com/news/1133768_volvo-parent-geely-reveals-9-000-geometry-ev-for-china-bullish-on-battery-swapping
Also I have long held the view that it would be 2035 before this happens, I am just suggesting that once AVs are approved, Lyft and Uber, and perhaps Tesla will go all in on robotaxis and will make the passenger vehicles owned by the middle class obsolete, wealthy people will still own their own vehicles, and trades people that need to carry their tools and supplies to jobsites. For many they will simply call Uber, Lyft, etc.
Seba [@ around 15:52] says they project that by 2030 Auotnomous EV with Transportation as a Service will account for 95% of global passenger miles.
I don’t buy it. Add 10 years and cut it to 50%. Maybe.
And I consider that very optimistic.
But then again I was born in the last century, and do see the world as having tough limitations to growth.
The transition from horse to car was very quick among those who had some cash/credit, but that was an incredibly compelling revolution in transport, cost, labor, and land use.
While the possibility of improvement in affordability and safety is considerable with electric autonomous transport, the degree of improvement over self-driven EV is not anywhere close in magnitude to the revolution of car over horse before WW1.
Most people who can afford to have their own vehicle will continue to do so.
Maybe people who live within dense cities, or in other countries, see this picture differently.
Hickory,
The key factor for Seba is that AVs will reduce the cost of transport by a factor of 10 relative to ownership of an ICEV, he also points out that an EV will last 500k to one million miles, the average car user drives about 10k per year, a personal vehicle that lasts for 100 years is not practical for most individuals, but for a fleet use where vehicles often travel 50 to 100k per year these vehicles make more sense.
I agree the forecast by Seba is optimistic. I also thought he was optimistic in 2014 when he suggested a 200 mile range EV for 10k by 2025, the Geometry EX3 was only sold in 2021 and was replaced by Geometry E in 2022 and the base price is 13K, for version with 200 miles of range, so we are not at 10k yet, but perhaps the 2014 estimate for a 200 mile range EV at around 10k might be met by 2025.
Generally these changes happen about 10 years sooner than I think. I know when I saw my first iphone, I thought, I have no use for that. Probably within 5 years I owned a smartphone.
Difficult to know how it will play out, but I think it will be slower than Seba thinks, but faster than your current belief. I hope I am wrong and that Seba is correct.
If AV is adopted in cities, but not in rural areas, it will just make cities more attractive. American cities suffer from poor land use and disastrous transportation, which is why they are smaller than European cities. It’s insane that people spend $10,000 a year just to get around town in America. AVs could be a partial solution to this, though the obvious solution is better land used and transportation systems.
My guess is that AV will happen, and have the effect Tony Seba predicts, but it is hard to say when. Seba is right that computing power is increasing exponentially, but AI is notorious for failing to deliver for decades, and then suddenly surprising everyone.
Alimbiquated,
I am not familar enough with AI to know what is possible, but I would imagine that more computing power helps. It might be 2 years or it might be 10 years before we have AVs, when they arrive things will change very quickly.
Dennis
You are right that more computing power helps. But look at neural networks, which got their start with perceptrons in the late 50s. They failed at everything, and neural networks were widely considered to be a joke until 2011, when good design and massive computing power put them into the spotlight. It took 50 years. Another key improvement was the availability of large collections of labeled data, data files identified by humans as being pictures of specific objects.
Or take expert systems, slated to change everything in the 80s. It never happened.
On the other hand, some applications like protein folding and image generation (like MidJourney or Dalle) just appeared unexpectedly, seemingly out of nowhere.
Computing power is a big plus, but massive amounts of data are also needed. The reason why games, language translation and image processing have been so successful is that there is so much data available online for training. Chinese English translation is amazingly good, but good luck getting a machine to translate Turkish into Vietnamese. Protein structures are also readily available, so protein folding is nearly solved. The best game engines train against each other, not against humans, because they need tens of millions of games to train on, more than humans have recorded in all history.
Self driving has a massive data problem. The data set is not growing as quickly as computing power is. Tesla’s solution is to use their fleet to record training data, which is very clever. Simulations are also heavily used. But my impression is that it currently isn’t going very well. Maybe we will see a revolution tomorrow, nobody knows. But maybe we won’t.
One day while driving at, let’s say 70mph on I 95. I looked in my rear view mirror as a Kenworth swerved into the full lane behind me forcing a woman driving a Town Car completely off the road. The Kenworth than moved out of the lane and the Town Car got back on the road just to have the Kenworth again forcing her halfway off the road. The truck then finally moved two lanes over ending the nightmare. There is no way in hell that computers could ever have saved the two people lives in that car. When it ended we were maybe 500 feet from a bridge.
Autonomous travel needs more kilometers than now – just because there are void drives, as a taxi owner has some empty drives to return from a suburb to the bar district for example.
And the electric grid is in no shape to support a huge increase in electric consumption – on the contrary, all the green agenda gives a lot of strain to the system.
Things will go much slower – gadgets like the smartphone could be provided much faster because they are so small.
Eulenspiegel,
No not really, in many cases the robotaxi could park and wait for next ride, it might be a kilometer down the road. Also robo taxis will allow pool service for lower cost so in many cases there will be several passengers, where today most trips are a single passenger in the car. There could be a decrease in miles travelled due to higher average occupancy in vehicles.
Outside of industrial use, AV’s will most likely just cannibalize an unknown percentage of Uber and Taxi’s which will be energy demand neutral in my opinion. AV’s are almost a novelty for individual use, much like the Lime and Bird scooter frenzy a few years back. Now I don’t see those scooters laying around everywhere… they’re almost gone.
Meanwhile, most of humanity outside of high dense population areas will still own their own car or motorcycle, whether EV or ICE. There are too many examples of why humans require independent transportation….. and I get a bit too long winded at times, so I am stopping here… But it’s likely that garages will be filled with private cars for the foreseeable future or until molecular transport is mainstream.
I’m with Dennis on this one, I think most people on this site badly underestimate how disruptive EVs and potentially AVs will be. Most EVs will easily last 500K miles and are 4-5 times as efficient as ICE. It will be easy to program them to charge when electricity is abundant and even feed back to the grid in times of low supply.
Already plug in cars are 18% of global car sales. It will not be an issue for this number to increase 10%/yr. There will be no more gas cars sold after 2030 except for hobbyists.
https://cleantechnica.com/2022/10/31/100-electric-vehicles-13-of-new-vehicle-sales-globally/amp/
And if you have a fleet of cars for delivery or your business, the economic incentive to switch to EVs will be truly overwhelming by 2025.
Agree.
A couple years ago when I said that 90% of light vehicle sales in US would have a plug I got the sense I was seen as outlandish on this.
I reaffirm that prediction.
I haven’t digested the possibilities of autonomous vehicles. I’ll probably just have to believe it when I see it.
Hickory,
Can you clarify?
90% plugins in US by what year? My guess would be 2032, if there were no AVs. If AVs get approved by 2025 in California, I expect 90% of passenger miles traveled on land will be with electricity by 2030.
Dennis- oops I forgot to indicate that I was talking about year 2030-
90% of global light vehicle new sales will have a plug
Thanks Hickory. I thought that was what you meant, but I often assume incorrectly, so thought it would be better to ask.
I have been on the same page, but think things may be moving more quickly.
Stephen
There is something wrong with your 18%. EV sales in China are 18%. EV sales in Europe are dropping according to the article below. US EV sales are at 7%.
Typically I don’t follow this trend but I went looking and this is what I found. Maybe you have better data,
“The share of electric car sales in Europe dropped to 11% for the first half of 2022, down from 13% in the second half of last year. Growing electric vehicle sales in the United States and China suggest that a lack of regulatory incentives, not a supply chain crunch, is the main cause of Europe’s sluggish electrification efforts, says T&E.”
https://www.transportenvironment.org/discover/europes-electric-car-sales-stagnating-as-china-gains-foothold/
Ovi, your China EV sales data must be out of date.
https://cleantechnica.com/2022/10/24/china-electric-car-sales-35-share-of-auto-sales-in-september/amp/
Fully electric 26% with a plug 35%. China is on track to stop selling gas cars around 2025-26.
China is also perfecting the car you have advocated for and that I also hope will become more popular, an EV with a range of 100-150 miles that still has a gas engine for range extension. These do no count as EVs but the vast majority of miles driven in these cars will be electric. They are still called plug-in hybrids and don’t show up in the EV numbers but are wildly popular in China.
The numbers in any given region is it nearly as significant as the total global EV sales and their percentage of all car sales.
Keep in mind that EVs will last several times as long as a conventional ICE car and so each EV sale will displace many ICE car sales down the line, just as a well built piece of furniture will last many generations and potentially displace many pieces of crap from IKEA. This is because there are only about 1% the number of moving parts in an EV compare to an ICE car and also because of the lack of constant vibrations that an ICE car produces that slowly wears on things and shakes things loose.
Stephen
The outliers here are China and Norway. China understands it’s Achilles heel is its need to import 10 Mb/d of crude so it is pushing EV sales. Norway has massive subsidies.
Not sure what is happening in South America and Africa, but I think the EV market there would just be starting.
I have no doubt that the PHEV market share will continue to grow and will be accelerated by the increased price of gasoline. I just think that today’s projections are a bit optimistic.
EV sales are down in Europe because nobody can deliver. There are serious supply chain problems, and waiting lists are months long.
After China maxes out at 100% in the 2025-26 timeframe the floodgates will open, the prices will come down significantly worldwide, and EVs will be everywhere.
I ordered a new Chevy Silverado ICE pickup truck in June. It’s estimated arrival is now April. The dealership tells me this is because of a chip shortage. The sales manager also made an interesting comment. He said he’s heard that GM is “hoarding chips” needed for its upcoming EV line, and this is slowing the manufacture of ICE vehicles.
Is this just urban legend? I haven’t been able to verify this.
I also read above in a post that the most popular vehicles in China are plug in hybrid. Those have always made the most sense to me for the driving my wife and I do. We have family that lives several hours away and I also have to make driving trips of over 250 miles for work at times.
We still have very few Tesla’s in my area, but we do have many hybrid vehicles and some are plug in.
SS, I haven’t heard that rumor and can’t comment on it. But hopefully the entry of sophisticated plug in hybrids from China which I suspect will be here by 2025 will drive growth in availability in this segment. These vehicles should be substantially less expensive than full EVs because of the smaller battery size but still run 90-95% on electricity. But I don’t see any movement at the present moment for this type of vehicle to be offered here in the US unfortunately.
Lets keep in mind that the landscape looks very different through the eyes of the vast majority of vehicles customers of the world, than those in a country like the US or Canada.
In these two N.American countries all are used to abundant domestic oil and have the sense of stability in supply.
In most countries of the world that is not the case. Many will shift eagerly to electricity if their grid has a history of reliability in supply and reasonable price.
In the last 10 years China has had 3.5 M EV vehicles sales
In the last 10 years US has had 0.63 M EV vehicles sales
China has reasons to be more motivated on this, with domestic supplies of oil much lower than demand (far into the depletion curve) , and all of the oil import cargo ships being tracked by the US 7th fleet.
Nonetheless, the US will be running hard to play catch up as the years unfold. We’ll have to see if the international supply chains hold up.
Hickory —
> In these two N.American countries all are used to abundant domestic oil and have the sense of stability in supply.
The US has been a net importer of oil since 1946.
There is a massive worldwide chip shortage that is squeezing the car industry hard. Basically chip manufacturers overestimated the effects of Covid and shut down. Now they are struggling to keep up with demand. GM is definitely not alone. I don’t know how they are allocating chips between models though.
One big problem is that car manufacturers aren’t interested in getting the latest and greatest chips, and chip manufacturers aren’t interested in selling old chips. For example, chip manufacturers are focused on energy savings for mobile devices and server farms. But cars have enough energy, and chips are a small part of the equation, so it isn’t worth it to car companies to redesign systems for the newest generation of low power chips. So car companies are low priority customers for chip manufacturers.
Dennis, when the UAE Minister says, “To assume oil is going to be there forever is wishful thinking,” it is blatantly obvious that he is not talking about demand not being there. He is talking about oil not being there to meet demand. How can you possibly spin that to mean he is talking about demand not being there?
Ron,
I read the article you linked, I was commenting on the OPEC World Oil outlook cited in the piece.
Excerpt:
Earlier this week, OPEC presented its annual World Oil Outlook at ADIPEC, in which it forecast that demand for oil would continue to grow all the way through 2045. Oil is expected to retain the largest share in the energy mix, accounting for almost a 29% share in 2045, the cartel said. In OPEC’s view, all major fuel types, with the exception of coal, will see demand growth through 2045. Moreover, OPEC also said that the global oil sector would need a cumulative investment of $12.1 trillion in the upstream, midstream, and downstream through to 2045, equating to over $500 billion each year.
OPEC’s rosier outlook on oil demand is in contrast with projections from other forecasters and analysts who see the early 2030s as the possible time of peak oil demand.
The International Energy Agency (IEA), an advocate of the energy transition and net-zero emissions by 2050, said in its own world energy outlook last week that fossil fuel consumption is expected to peak or plateau within this decade, accelerated by the policy and trade flow shifts following the Russian invasion of Ukraine. For the first time ever, a World Energy Outlook scenario from the IEA based on current government policies and settings has the global demand for every fossil fuel showing a peak or plateau, the agency said in its World Energy Outlook 2022.
Did you read the whole piece that you linked?
Autonomous vehicles is a total pipedream.
OPEC is basically 5 nations instead of 13 as usually stated. Those five are Saudi Arabia, Iran, Iraq, Kuwait, and the UAE. And that is with the consideration that sanctions will soon be lifted on Iran, allowing them to increase production by, hopefully, one million barrels per day.
The other eight are in terminal decline, just like most of the rest of the world.
the 2022 data below is through October.
Ron,
Much of the fall in the OPEC small 8 output is due to the crash in Venezuela’s output, which is likely to plateau around 600 kb/d, or at least decline more slowly than the 2012 to 2020 period. If we look at only the OPEC small 7 listed in the title of the chart below (your group of 8 minus venezuela), output declines at an annual rate of 226 kb/d on average from 2012 to 2021. I used EIA annual data through 2021.
https://www.eia.gov/international/data/world/petroleum-and-other-liquids/annual-petroleum-and-other-liquids-production?pd=5&p=00000000000000000000000000000000002&u=0&f=A&v=mapbubble&a=-&i=none&vo=value&&t=G&g=none&l=176-2000000040004000g0g000000400000400000000000000002&s=94694400000&e=1640995200000
Yes, of course I read the whole thing. The author of the piece first quotes the UAE Minister, then he talks about the OPEC presentation. Two entirely different things.
I thought what the UAE Minister had to say was a lot more interesting.
Chart below has OPEC other 7 and Venezuela from 2013 to 2020.
Over 60% of the decline of the OPEC other 8 was due to Venezuela.
Leaving Venezuela out of the mix doesn’t seem to help much.
Dennis, I believe your charts are designed to hide more than they reveal.
Ron,
Using EIA data (which we only have through 2021 (there is not 2022 OPEC annual output). The annual decline is 226 kb/d from 2008 to 2021. This is if we use an objective method to determine the slope of the average decline such as ordinary least squares (OLS) regression. This can be done by simply adding a trend line in excel and then displaying the linear equation on the chart. (right click on your data series then choose trendline from the pop up menu.
Dennis, we have the OPEC MOMR data through September, and I used this data for October; OPEC oil output falls by 20,000 bpd in October -Reuters survey. If you have the data, you should use it as I do. I stated that my 2022 data was only through October. And I expect OPEC November and December crude production will be even lower.
That being said, I still prefer my charts to yours. I think they are far more informative. I think you will find that I have a consensus of opinion on that point.
Ron,
Perhaps. Can you explaine where your straight line comes from? Are you just eyeballing it? Kind of subjective don’t you think?
Really Dennis, are you serious or just trying to be funny? I get my straight lines from the exact same place you get yours. Obviously, it’s just a trend line. But perhaps your straight lines are not trend lines, perhaps you have some complicated mathematical algorithm from which you derive your straight lines.🤣
Ron,
Looking at the lines on your charts it looks like you use the drawing tool as the lines are often not centered on the data points, also no equation is displayed. There is an objective algorithm for determining the best fit to a set of data called ordinary least squares (OLS) regression and there are more advanced statistical methods called robust regression that give a better fit when there are outliers or other problems with the data.
Excel uses OLS to fit a trendline to the data.
Well hell, I just use my eyeballs to fit the trendline to the data. If I am off a fraction, what the hell? I will continue to just draw trendlines to fit the data as best as I can. Sorry about that.
Dennis/Ron
Eyeballing Ron’s data, I get a difference of 2700 kb/d between the 2010 and 2022 data points. 2700/12 = 225 kb/d/yr. Same as what Dennis got using OLS. I would call this a DRAW.
Ovi,
Rons charts are more informative though, I think different perspectives are useful, my main pointvwas that most of the decline of the other 8 is Venezuela. Well over 50%. Let’s say Venezuela continues to decline at 300 Kb/d. They would then be at zero after 2.25 years and could decline no further.
Ovi, it is not my data at all. It came from the OPEC MOMR as well as the Reuters link you posted a few days ago. I don’t have any data that is mine. I always get it from another source. 😇
Ron
I am a bit sloppy sometimes when I write quickly. I think most of the participants here know that you are using OPEC data.
Dennis, I am replying below to have more room for my chart.
Dennis
I just found it it interesting that both charts gave the same slope. As for Venezuela, I think they are stuck on a plateau as long as they are under sanctions and should be left out of decline analysis.
Ovi,
I agree. Venezuela may be on plateau and the decline we witnessed as Venezuela fell into failed state status is not likely to be repeated so excluding Venezuela from the analysis makes sense to me.
so excluding Venezuela from the analysis makes sense to me.
Dennis, you don’t seem to understand the problem. In 2015 Venezuela was producing almost 2.4 million barrels per day. Today they are producing about 680 Kbp/d. Of course, they will never drop 1.7 million barrels per day again, but that is not the point. The point is Dennis, if OPEC ever expects to get back to its former peak, then that 1.7 million bp/d will have to be made up by someone else. That, plus the decline of the other 7 also-rans and their future decline. And let’s not even mention the 1.25 million barrels per day Iran is down.
Dennis, OPEC will never climb these mountains. That is the point. That is the problem.
Ron,
I agree that OPEC may not return to its previous peak, my point was that the decline of the other 8 is not a good guide, the decline in the other 7 is more useful, OPEC may either plateau or increase slightly, but might not return to the previous peak.
Ron,
In chart below I compare OPEC Other 8 with OPEC other 7 using monthly data from MOMR from Jan 2012 to Sept 2022, The other 7 excludes Venezuela from the Other 8 group of smaller OPEC producers outside the middle east. Venezuela accounts for about 57% of the total decline from the other 8 group.
For the period from Jan 2012 to September 2022 for OPEC crude only output.
The average annual decline rate for Other 8 is 408 kb/d.
The average annual decline rate for Other 7 is 176 kb/d.
The linear trend is determined using OLS regression on all monthly data from MOMR.
https://www.amazon.com/Worldview-Based-Evidence-Ron-Patterson-ebook/dp/B0BG6QXHX6/ref=sr_1_1?keywords=a worldview based on evidence&qid=1667589956&qu=eyJxc2MiOiIwLjAwIiwicXNhIjoiMC4wMCIsInFzcCI6IjAuMDAifQ==&sr=8-1
Ron,
FWIW, my Dad thought your book was really good. Said he needs to think about your arguments on infinity, but pretty much agrees with everything else.
Great Job!
And for UK readers:
https://www.amazon.co.uk/Worldview-Based-Evidence-Ron-Patterson-ebook/dp/B0BG6QXHX6/
Thanks, John, I appreciate the support. Sales are picking up.🤣
Your book is listed under “Fantasy”?????
rgds
WP
Not much happening in the Frac spread count this week. Last year the frac count peaked in mid November and then headed for the low of 234 in December.
So is this week’s count the beginning of another drop into December?
Mr. Coyne: I noted your charts above re’ GOR in all four major shale basins, and not surprisingly found them to be flat as a flitter since circa 2010. All except the Bakken. There is a good reason for those graphs: the frenzy of new production has outrun the physics of individual wells.
The physics hasn’t changed. When vast amounts of hydrocarbon are removed from a low permeability environment, the reservoir pressure has to fall. When it falls below the bubble point of the prevalent gas, said gas will emerge from solution, from the rock, and at that point, because longer-chain hydrocarbons begin to get trapped in fracture pores no longer subject to higher pressures, the oil cut decreases. The combination of reduced oil cut and increased gas escape raises the GOR coming out of the wellhead. This is immutable. The only thing so far to combat this is the re-injection of field gas to maintain a reservoir pressure head and also to scavenge the more complex hydrocarbon molecules. Ironically, the very best gas by far is prevalent in the only basin (Bakken) that seems to follow the law of physics. There’s a reason for that too.
When the Permian “find” was major gossip, then fact proven and verified, the Bakken was getting a bit more mature and looked paltry by comparison. Companies like Occidental, Chevron, Exxon, EOG mostly fled to the Permian. The Texas infrastructure–already nicely formed from decades of production–was built out dramatically, while the Bakken didn’t even have a decent egress pipeline without the Keystone (they shipped mostly by rail). Eagle Ford benefited from that mass migration and was also a younger field. The frenzy was on.
So take a measure. There are a great number of old wells in the Permian and the Eagle Ford, and I can assure you that they’re following the above delineated law of physics. But their yield is now down to say 30-50 barrels per day of crude and some (steadily increasing) amount of methane gas. If you look at those individual old wells, I can guarantee you that the GOR has increased substantially–just about in lockstep with the decrepit old Bakken field. But with scads of fresh new Permian wells coming on daily, with giant IP’s of say 4,000 barrels of oil and a certain amount of methane (not much ethane in the Permian), the low production numbers of the large flock of old wells in various stages of depletion get overwhelmed and outrun by these massive new numbers from the initial production of new ones. It’s population statistics to a numbers guy like you.
I’m not trying to argue this to look smart (I’m average, maybe), but in all fairness you are sharp as a tack with these damn graphs and they always seem to make an indisputable point when sometimes–as in this case–they are terribly misleading. I’m not at all sure what my motive is in trying to correct that, except that I enjoy this forum and the intellect (including yours) that visits these pages. It strikes me that a few people around the world are struggling to grasp something complex, about which we’re being mislead by the Saudis, the UAE, Putin, and yes, our own people here in the U.S. Rather than generate a conspiracy theory, I think it is because people don’t understand the geologic physics of the various oil and gas basins around the world. There is no way to compare the physics in the shale basins with what the Saudis face in Ghawar. In a couple of years, when these new shale wells have blown off their massive IP’s, unless something is found to counteract physics that have been around since the age of Boyle, van der Waal, LaPlace and Courvoisier, these by-then old wells will run up against these same tired dynamics. I’m just saying that this is happening–and not talked about–and that the numbers spewed out by fresh wells are outrunning the much lower numbers of an aging field. The fact that this is being debated on this august forum is a problem within itself.
Niobrara? I don’t know. My experience up there has been good, but the old Watenburg field (in the southwest corner of the D-J Basin) is also part of the Niobrara formation (which also runs into Wyoming) and the initial GOR is very high up there. I have already made the statement that when the IP GOR is high the well is better. Plus, there was an astounding amount of activity up there right after the new administration came in. I had much more new production from the Niobrara than from the Bakken or even from Texas–they were trying to drill out some areas subject to banning for political reasons. I imagine the same phenomenon that I outlined for the Permian applies to the Niobrara as well. BTW, the subterranean pipeline structure in the Weld County Colorado Niobrara is the best in the world, a model for the Permian to use (very few trucks, more mule deer, you have to search the landscape for oil and gas gear).
I hope you and other readers–if any kept at it–understand what I’ve tried clumsily to say. As a longterm investor, it took me a very long time to grasp what I’ve just condensed. I can tell you unequivocally: Your graphs are right, for the entire field, but they very wrong when you try to understand complex hydrocarbon fluid-gas-pressure-artificial disruption of the rock in individual wells. EVERY SINGLE SHALE WELL FOLLOWS THESE PRINCIPLES (unless in very unusual situations there is contiguous source rock with oil and gas under very high pressure that feeds the exploited reservoir rock. I have one of those–a weird trap that communicates with another one.) Like you gentlemen, I subscribed to the lifelong learning process, so if there is someone on this forum who holds more scientific data on this subject, and especially if you disagree, please sound off. I have very little ego in this matter. Mike Shellman could say this better in half the words, but he’s gone fly-fishing.
I will say it again: the shale fields, like all other fields, are in decline. And the first sign in the shale field is an increase in GOR. That doesn’t mean the Permian won’t last for a long time (with flat basin-wide GOR curves). But it’s like a pandemic: eventually tens of thousands of individual well curves will become the broad field curve–just as they did in the Bakken. And that is the precise point where we should assume the fetal position with a hazmat suit–because the s*** is about to hit the proverbial fan. Over and out on this subject.
Gerry, you have a very good handle on issues pertaining to pressure depletion and rising GOR in core areas of the Permian and I compliment you.
Mr. Coyne wants you to believe you are wrong, he is right, and the basin-wide EIA charts he used to refute your concerns are basically crap. Don’t fall for it. Over-drilled core areas in the Permian’s primary counties are a precursor of things to come. Mr. Coyne chooses to focus on the entire Permian because it better fits his idealism of the future. The fact is that in spite of much, much higher product prices, steadily rising rig counts (until recently) and longer laterals that supposedly should increase EUR’s, liquids well productivity is declining and many of these core areas are gassing out. As they do the gas stream is becoming drier and NGLS are also declining in core areas.
If skinny goat pasture away from these core areas was so good, and going to result in so much EURR in the future, why aren’t these Permian guys out there banging away at that stuff at these higher prices? Because it sucks out there, thats why. Pioneer’s jefe just last week said exactly that and that his company is retreating back to the safety of its sweet spots for better returns.
Everybody else is always wrong; it’s a one man forum of eternal hope and perpetual optimism. The more charts, and the more complicated those charts are, the more credibility can be given to eternal hope. I admire you, and Mr. Patterson, Mr. Kaplan, LTO Survivor, Steve, Shallow, Kengeo and a couple of others for your persistence. And thanks, Gerry, for reading all the hubbub last week about my last well…I will never place a brown trout, or a bone fish over the importance of getting to the truth about our nation’s remaining hydrocarbon future. A permit, however, is a different story.
Mr. Coyne I caught the snarky comment about me not taking criticism well. I don’t run the TRRC and your criticism of my writing had nothing to do with the point I was trying to make. I’ve survived 60 years in a very complicated business, including worldwide blowout control, with a high school education, by listening to people smarter than I am and by taking criticism and productive advice from hundreds of my peers. You are not one of my peers.
with a high school education,
Hey, I have one of those also. Yeah, I have letters after my name. My card reads, “Ron Patterson, HSG” (High School Graduate). And I am no academic slouch either. I graduated with a B average no less. 😂
Mike’s recent posts
https://www.oilystuffblog.com/forumstuff
Mike your post was great, just pointing out that there is very little evidence that Permian output is decreasing. RRC data for the September 2021 to August 2022 period is not very good. I think you know this, not clear why you would use that data, your choice though.
I look at the entire basin, because it is the easiest way to analyze things in my opinion.
Note that if I only analyzed the core areas, I would have average well profiles with higher EUR and could be accused of cherry picking.
Also when I do the economic analysis these higher average EUR wells that have been cherry picked from the core areas of the basin would have higher breakevens.
The way I do the analysis has the opposite effect of what you claim, it is more pessimistic than optimistic.
Mike,
GOR has indeed ben rising in Midland county. In chart below I only use December data for each year to get a rough idea of how GOR has changed in Midland county in Permian. Looks somewhat like the Bakken chart.
For all of the Permian Basin in Dec 2021 the GOR was roughly 4 for horizontal wells only (data from Novilabs).
Gerry,
Just showing the data, GOR is up in the Bakken, though it is far below the level in all other tight oil basins. I understand very well that pressure depletion causes rising GOR. Basin wide newer wells keep the basin average flat, Bakken might be rising because completion rate has decreased, this will happen in other basins as well.
For the average Permian basin well completed in 2020 and using my well profile estimates for oil and natural gas based on data through first 2 years of output, I get the following for an individual average well GOR (this is basin wide average well profile). The end of the chart is where I assume the average well is shut in at 20 bopd output.
Agree . Oil in place has no real bearing on the ultimate EURd especially in a tight reservoir.
My point in the above exchange was to point out that the OPEC decliners will keep the total OPEC production from ever reaching its former 12-month average peak of 31,837,000 barrels per day. They are currently over 2.1 million bp/d below that point, and I believe they are currently at their post-covid high. It is all downhill from this point as cuts kick in from this point. Quota cuts always kick in when every OPEC nation is producing flat out. Their history proves this point.
It is my opinion that there is no doubt whatsoever that peak oil is in the rearview mirror. Opec has peaked, Russia, one of the world’s three largest producers has also peaked and, after sanctions kick in in December, will likely never again get within one million barrels per day of their pre-covid peak. That leaves the USA as the only hope left. Lotsa of luck with that one.
I used the Reuters estimate for October OPEC production below.
Ron,
Opec and Russia may have peaked, but OPEC may plateau at the current level, US and others (Canada, Norway, Brazil, Guyana, Aregentina, and Suriname) may more than make up the difference.
We will see. Over time we may see the Big 5 expand their capacity, but it will take 5 yers or so.
Really? This is where you are placing your hopes? Their combined production is under 9.5 million bp/d and down over 650 Kbp/d since peaking in December 2019. World production is down over 5 million bp/d from Nov. 2018 peak and down almost 4 million bp/d below the 12-month average peak. And you expect these guys to make up that gap?
Dennis, what planet are you living on? 😧
Ron,
Those nations plus US and OPEC big 5, yes.
Wait 2 or 3 years and you will see.
OPEC has peaked. Whatever the big five may gain, which won’t be much, the other eight will lose, and then some. The US has a few more barrels to go before peak but not a lot.
But, but, but…. the rest of the world is obviously in decline. You completely forgot about that. I have renamed your six nations as the Big 6. Anyway, the rest of the world is down 7 million barrels per day in 8.5 years. That’s the song I have been singing all along Dennis; the rest of the world is in decline. Now OPEC has peaked, and Russia is in the toilet. It’s a damn mess, Dennis.
Click on chart to enlarge.
Ron,
Venezuela should be excluded from your chart above. The decline is far less than the increase will be.
Ron,
A chart of the nations that will be increasing output in my opinion.
THis group had and average annual increase from Jan 2013 to April 2020 of about 1454 kb/d using OLS Regression. From May 2020 to June 2022 the average annual increase has been about 3417 kb/d.
HOUSTON… “We Have A Problem.”
It looks like the supposed oil production growth in the United States in 2022, DID NOT materialize. As of Oct 28th, U.S. oil production is up a mere 0.1 M/bd since Dec 31, 2021.
Furthermore, current production is down 0.3 M/bd from the peak on Aug 5, 2022.
The overall peak was likely in Mar 2020 at 13.1 M/bd.
GOD HATH A SENSE OF HUMOR…
steve
Gerry
Thanks for taking time to explain the significance of GOR. I have a bit of physics background so that helps.
I hope that you don’t think this a a crazy question but it is one that I keep wondering about.
I am trying to visualize a tight oil field as opposed to a conventional field. For a conventional fields I visualize a 200 ft to 300 ft thick pay zone, about a couple of miles square or bigger that is well connected with soil that has medium to high permeability.
When I visualize an LTO field I also see a 200 ft to 300 ft pay zone. The difference is separate blobs of sandstone with a volume of 1,000 barrels to 10,000 barrels that are not connected. The fracking then cracks the surrounding soil to let the oil in these separate blobs get to a well. When the oil comes out of these small volumes, the pressure drop very rapidly as opposed to oil coming out of much larger well connected fields.
Maybe I am totally off base with my visualization but my sense is that you may be able to enlighten me.
Most of the people commenting here are pretty adamant that US oil production has peaked, and that the world has as well.
It makes perfect sense to plan on that being the case.
And no one knows what the decline rate will turn out to be as time unfolds.
It makes perfect sense to plan on decline in supply happening far before any sustained decline in demand.
And probable scenario that works out to a world of hurt.
Knowing that scenario, you would think that people would be gungho to strong take measures to lower consumption of oil products. Most people in the US act as if they are immune, or that it is all an issue that different politicians can cure. Entitled delusion.
Ovi, I’ll explain as best I can with a couple of short stories. In 1951, the first deep oil well (10,000 feet) in Oklahoma was drilled on my grandfather’s land. He was very poor: no indoor plumbing, drank from a cistern. Each day he would walk me around his screened-in porch, showing me the different geologic zones in drill core samples. I was six years old. So one night he comes and scoops me up, drives like a maniac through a pasture and skids to a stop just shy of a big gully. On the other side was a derrick and men were running everywhere. A couple of hours later I woke to the splat of oil shooting over the derrick, landing on the windshield of his Bel Air. He had the windshield wipers going, the windshield was thick with oil, and he was jumping up and down, proclaiming us to be rich. A few days later, he was offered a lot of money for his property. He looked out the window and saw the blowout still shooting a geyser . . . . . and tore up the check. He died without indoor plumbing, as the pool was shallow and over-pressurized in that area; the well petered out in two months. So as you can see, I am no one to answer much of a question pertaining to oil (or emotions), because God help me, I am still as fascinated as I once was. His last words to me were: “Don’t ever sell the Tombstone Rock.” That was pink granite, which had been turned on its side by a giant upheaval, creating large oil traps. You needed 3D to get into them, and they were complex to drill. They were also about four miles west.
Oil moves, sometimes a long distance. About 400 million years ago, a giant ocean resulted in sedimentation of little marine creatures, which became fossilized as “conodants.” Sometime in the fifties, a lady named Anita Harris traveled all over the eastern United States. It took her a while but she finally figured out why some were white (the oil had migrated away) and others were black (oil had migrated to this area). It was a good find.
But oil soaks in selectively. If you pour oil on sandstone or limestone, it will soak in. That’s a high-permeability sedimentary rock. If you pour oil on shale, it will sink in reluctantly. It’s a low-permeability sedimentary rock. Oil sands hold a lot of oil as you know. Oil sands are sandstone that has been eroded into its most granular form.
Oil will migrate to an oil trap, which is either an anticline (uplifted area), or stratigraphic (trapped by layers of rock), or both. I am currently directing my attention to fault blocks either upthrown (uplifted) or downthrown (depressed) by a giant tectonic upheaval in the setting of an old seabed. I love the conventional oil search–a porous sedimentary stone or sands to which oil has flowed from source rock, and can be retrieved by a vertical hole in the ground. Most people thought all the conventional oil had been exploited, and that’s the reason we wound up with unconventional drilling into low-permeability rock like shale, resorting to expensive and time and labor intensive hydraulic fracturing. The good news is that oil-rich shale will likely give you a commercial well. The bad news is that you only retrieve a small fraction of the oil (20-25%).
Finding an economic conventional oil pool is a mixture of hard work and study and luck. if you’re lucky and have great 3D seismography and AVO (Amplitude Versus Offset signals), you just might drill into an oil trap (such as a fault block) containing an ocean of crude. Or you might be confused by so-called “fizz gas,” which is gas in solution that gives you a false-positive reading. The difference is a gusher versus a dry hole. This is the very last stand in domestic conventional oil production, and it is high risk.
I don’t know if this helps or if I’ve just made a fool of myself. Because of my grandfather’s awful experience, I chose to do something else in life, but my love for geology never wavered. That’s one of the reasons I value Mike Shellman’s comments: there is no substitute for on the job training, and he can say things in plain language that make more sense than a PhD geologist. He has drilled an awful lot of shallow wells into reservoirs that receive oil from source rock and is forever replenished (which is fairly rare and occupies a unique place in the ground). Those things produce at low levels for a very long time. In short, there is nothing like discovering an oil trap that has been fed (and continues to be fed) by source rock with its favored egress straight for your pump jack.
I’ll bet Putin doesn’t have this much fun!
Gerry
Thanks. I did not realize that oil migrated. I thought it was formed in place.
The oil sands, I understand, were conventional oil initially that was close to the surface and the light components slowly evaporated leaving behind the heavy components.
This was a stupendously interesting read. Thanks
Liz Truss had her telephone hacked. One minute after the Nord Stream explosions she sent a text message to Antony Blinken saying “it’s done”.
Article in French: https://www.liberation.fr/checknews/its-done-liz-truss-a-t-elle-confirme-lexplosion-de-north-stream-par-un-sms-envoye-a-washington-20221102_PVI6JLF23BGQTASJD2FWL2PEOE/
Haha. It was hacked by Russians. According to Putin fantasies Liz Truss was tracking covert military operations in real time and reporting the results to Washington.
Did you know that the word “gullible” does not appear in any dictionary?
Schinzy,
Is this being reported at a reputable news source such as LeMonde?
There are a lot of lies on the web.
Posting bullshit news about elections or news does not enhance ones reputation.
Quite the opposite…
Except perhaps among the Willfully Ignorant Red Hat crowd.
I am sorry. I quoted someone and posted the link they sent without actually
reading the article. The article does not say Liz Truss used her iphone to
text Blinken. The article says that it is alleged that Liz Truss used her
iphone rather than her official encrypted phone to text Blinken.
What do I know? I am a U.S. citizen residing in France.
Psychologists tell us that we tend to retain data which supports our
worldview while we forget data which undermines our worldview.
France was one of the few countries that resisted U.S. pressure to invade
Iraq. While U.S. main stream media (MSM) was talking non stop about weapons
of mass destruction, French media gave air time to the head of the U.N.
weapons inspection team who said flatly that U.S. intelligence was bad.
Since then the U.S. political machine has consistently used all possible
means to prosecute whistle blowers, censor dissent, and control the MSM
narrative, including spreading outright lies. This has been extensively
documented by Glenn Greenwald among others, see for example
https://greenwald.substack.com/p/the-consortium-imposing-the-growing.
Over the past 10 years, U.S. politicians from both sides of the aisle have
condemned the Nord Stream pipelines with the strongest rhetoric possible.
IT IS EXTREMELY EASY TO VERIFY THAT A PHONE HAS BEEN HACKED. Just as it was
extremely easy to verify that someone had obtained Hunter Biden’s computer.
The reason for this is that if the phone has been hacked, the hacker has
access to all communications, not just incriminating communications.
Therefore the hacker can give information about harmless easily verifiable
messages sent by the hacked phone. If Liz Truss used an iphone to text
Blinken, it is highly probable that the text message was intercepted.
La Libération is the traditional communist leaning newspaper in France. It
is a reputable newspaper. In this case it is just repeating allegations
flying over Twitter.
Sorry, I made a bad mistake with this post. I tried to post an explanation without success. I am trying to post something shorter to see if that works
I am sorry. I quoted someone and posted the link they sent without actually
reading the article. The article does not say Liz Truss used her iphone to
text Blinken. The article says that it is alleged that Liz Truss used her
iphone rather than her official encrypted phone to text Blinken. No proof was supplied to support the allegation that she sent a text message to Blinken.
What do I know? I am a U.S. citizen residing in France.
Psychologists tell us that we tend to retain data which supports our
worldview while we forget data which undermines our worldview.
France was one of the few countries that resisted U.S. pressure to invade
Iraq. While U.S. main stream media (MSM) was talking non stop about weapons
of mass destruction, French media gave air time to the head of the U.N.
weapons inspection team who said flatly that U.S. intelligence was bad.
Since then the U.S. political machine has consistently used all possible
means to prosecute whistle blowers, censor dissent, and control the MSM
narrative, including spreading outright lies. This has been extensively
documented by Glenn Greenwald among others, see for example
https://greenwald.substack.com/p/the-consortium-imposing-the-growing.
Over the past 10 years, U.S. politicians from both sides of the aisle have
condemned the Nord Stream pipelines with the strongest rhetoric possible.
IT IS EXTREMELY EASY TO VERIFY THAT A PHONE HAS BEEN HACKED. Just as it was
extremely easy to verify that someone had obtained Hunter Biden’s computer.
The reason for this is that if the phone has been hacked, the hacker has
access to all communications, not just incriminating communications.
Therefore the hacker can give information about harmless easily verifiable
messages sent by the hacked phone. If Liz Truss used an iphone to text
Blinken, it is highly probable that the text message was intercepted.
La Libération is the traditional communist leaning newspaper in France. It
is a reputable newspaper. In this case it is just repeating allegations
flying over Twitter.
I looked at a couple of the larger fields in the Permian and there certainly seems to be a correlation with rising GOR and post peak production. The GOR and production is for oil only, some Permian fields have high gas production from gas-condensate wells, which would swamp any overall figure. The RRC site is an absolute pain and in typical fashion only downloads the field number rather than the name so I can’t remember exactly which is which. I’ll try with some NM fields as well, the NM site is a bit less aggravating.
More Permian problems.
https://www.wsj.com/articles/frackers-say-oil-production-slowing-in-the-shale-patch-11667743226
Lightsout,
From conclusion of article:
“We have roughly 10 years of high-quality drilling inventory in the Permian, and less if we grow faster,” Mr. Loughrey said. “That’s going to mean these larger companies don’t grow.”
My best guess scenario assumes the completion rate grows fairly slowly from about 425 wells per month recently to about 550 wells per month by Feb 2027, output in the Permian basin grows at about 480 kb/d on average each year from Sept 2022 to June 2027 in this scenario. Lets take 425 wells per month for 120 months, that is about 51000 high quality wells in total. My best guess Permian scenario reaches that number of completions (starting in October 2022) by Feb 2031, total wells completed for my scenario from Oct 2021 to Jan 2040 is 82400 wells, so perhaps 31300 of these wells will be lower quality wells or fewer wells will be completed than my best guess scenario.
Dennis
To grow completions, there will be a need to grow rigs and Frac spreads.
I wonder if you or other participants could check the recent Q3 reports of companies like Noble Drilling to see what they are saying in their forward guidance with regard to ordering more rigs or any other relevant info.
Ovi,
My scenario has a very gradual increase in completions from 400 per month in Dec 2022 to 550 completions per month in Jan 2027.
For past 12 months the horizontal oil rig count has been increasing at an average rate of 164 per year (13.7 per month on average) using OLS regression on the data. The frack spread count has been increasing more slowly at an annual rate of 36 per year (or 3 per month) over the past 12 months. Of course with frack spreads we don’t know the split between oil focused and gas focused spreads so this statistic tells us less than the horizontal oil rig count.
If we look at completion rate for Permian, Bakken, Eagle Ford, and Niobrara for past 12 months the OLS gives an annual rate of increase of about 53 completions per year or 4.4 per month.)
Future rates of course are unknown.
Ovi,
Many of the big producers are targeting 20% growth (Exxon, Pioneer, Chevron, etc) in the US tight oil sector.
Dennis
I was looking for a different source of info for Rig demand. The rig chart that is in the post shows no growth in the Permian. The overall rig count has slowed over the last three months. That to me indicates a slowing in demand for rigs.
I was wondering if someone that was familiar with the drillers could confirm there was a slowdown in rig demand or demand was increasing and that they were having a difficult time meeting demand.
I was able to see some of WSJ article listed above
Frackers Say Oil Production Slowing in the Shale Patch.
In the contiguous U.S., oil production through August has increased only 3% since December, up 288,000 barrels a day to 9.77 million, according to the Energy Information Administration. It had earlier expected total U.S. oil output—including Alaska and the Gulf of Mexico—to hit 12.64 million by December, growing more than 1 million barrels a day compared with the same month last year. It has since lowered its projection almost 500,000 barrels a day.
Even Chevron and Exxon XOM 1.09%, the largest U.S. oil companies that enjoy scale and logistical advantages, came in on the low side of their shale production targets.
Exxon recently said its oil-and-gas production in the Permian was projected to rise about 20% over last year’s levels, down from its initial target of 25% growth. It attributed the recalibration to weather, facility delays and schedule adjustments. Chevron said its Permian output will come in toward the lower end of its targeted range for the year, around 700,000 barrels a day, as production levels out at a slower pace.
Growth forecasts may fall further because many drillers have relied on wells they had previously drilled but left offline for future production, so-called drilled but uncompleted wells, or DUCs. The EIA said companies have tapped most of their best DUCs, after they used the wells to save money on drilling as the pandemic led to a historic oil-price collapse. That trend, combined with a gas-pipeline bottleneck in the Permian, is expected to further constrain U.S. oil production growth, the EIA said.
Another key problem for shale companies is how much oil wells are producing in the Delaware basin, the western half of the Permian that frackers have drilled heavily. As the region matures, well performance is predictably deteriorating there, said Tom Loughrey, president of oil analytics firm FLOW Partners LLC.
“We have roughly 10 years of high-quality drilling inventory in the Permian, and less if we grow faster,” Mr. Loughrey said. “That’s going to mean these larger companies don’t grow.”
Note the bold area. This confirms the growing GOR discussion above and it appears the gas is overwhelming the gas pipeline takeaway capacity.
Ovi,
There was pipeline maintenance and failures that caused the prices to drop for natural gas in Permian.
See
https://www.ogj.com/general-interest/economics-markets/article/14284824/waha-natural-gas-prices-fall-to-225mmbtu
also
https://www.eia.gov/naturalgas/weekly/
The price at the Waha Hub, which is located near Permian Basin production activities, rose $2.72 this report week, from -$0.65/MMBtu last Wednesday to $2.07/MMBtu yesterday. Having returned from negative pricing last report week, the Waha Hub continued to trade at a significant discount to Henry Hub this report week, as ongoing pipeline maintenance continues to affect westbound flows from the Permian Basin. On Thursday, October 27, Waha traded at a discount of $4.57/MMBtu to Henry Hub, while yesterday the discount was $2.44/MMBtu.
No doubt about it, the tail is wagging the dog in the Permian. A freshly fracked horizontal oil well in the Permian Basin yields on average about 2,000 cf/d of methane gas per barrel of oil, so a good well with an IP of 2,000 bopd produces about 4,000,000 cf/d of natural gas. As that well ages, it is not unusual for the gas production to rise to 5,000 cf/d for each barrel of oil, and sometimes much higher. Those are real numbers, not speculation. That happens in the other shale basins too.
The conundrum is that the current frenzy of drilling new wells is putting an awful lot of NG in the pipelines, and, more worrisome, into the environment. For example, the Permian just blew past 20 bcf/d (yes, 20 billion cubic feet per day!), and to put that in perspective, the level was “only” 17 bcf/d about six months ago. Because of this mind-blowing gaseous eruption from the bowels of the earth, flaring exceeds the standards of the TRRC (Statewide Rule 32) by a country mile.
There is currently a whole circulatory system of new pipelines coming in, including the Matterhorn Express, which will travel 500 miles to Katy, Texas. This was originally thought to be huge but will “only” carry 2.5 bcf/d (about six months incremental growth). The problem presents itself as a two-edged sword: at some point the Permian will turn into a gas field–and that could be okay or a complete disaster, depending on what happens globally with LNG.
And very soon another problem emerges: operators move out of the core into the fringe . . . and that is much, much gassier. Mr. Loughrey, an analyst of FLOW (Friezs Loughrey Oil Well Partners), is the man quoted in the article above. To remind you: “We have roughly 10 years of high-quality drilling inventory in the Permian . . .” Well, he may be right. And you may be right too, Mr. Coyne, in your prediction of 82,000 new wells over a ten-year span. But if you are, the world is going to be floating on pure methane gas.
Gerry Maddoux,
The natural gas can be used to produce electricity and charge batteries to power vehicles and reduce the need for oil, also useful for AC and heating homes and water as well as producing fertilizer to grow food, etc. With expanding LNG export capability in the US the natural gas can be used to replace Russian gas in Europe.
Can be?, cmon Dennis. Let’s look at what’s actually happening.
“Equipment that’s designed to cut methane emission is failing…
“…in this case, the flame had gone out, so methane was pouring from the pipe. The flare’s mechanisms are supposed to alert the operator if it stopped working. That didn’t happen in this case, according to a report by the Texas Commission on Environmental Quality.”
https://www.independent.co.uk/news/ap-wilson-epa-san-antonio-texas-b2218465.html
I agree. In fact, I love natural gas. But are you trying to blow smoke up my behind?
The point here, unless I’ve been mistaken, has been the longevity and viability of the Permian as America’s last premier oil field. A well in the Permian will cost $12-15M. You spend that kind of money for oil.
You can drill a very lucrative dry gas well in the Haynesville Shale for $7M. There is plenty of water in Louisiana, so frack water is cheap, and disposal is easy. Those wells in the core parishes like DeSoto are extraordinarily pressurized and come in hot–say, 20 MMcf/d–so the IP pays it off fast.
If the Permian turns into a gas field (and the fringe, remember, is very gassy), you can take that model with 82,000 wells on it and divide it by two or even three, because individual wells won’t pencil out. I’m not down on the Permian and I’ve persisted with the GOR simply because your graphs made it appear that there was no issue, when a major issue is lurking just below the surface (well, about 10,000 feet below, to be exact).
I love Texas. I am not in the business of talking down an industry, but in order to take advantage of a verge, you have to face the fact that it’s there. I see a massive opportunity to convert NGL’s into a transportation fuel. I also see a terrific possibility for steaming dry methane to produce blue Hydrogen, which could drive green Hydrogen. Elon Musk is now a Texan, which is a huge plus for the incorporation of all forms of energy into a massive depot for the distribution of electricity and fuel to all of America and also to our allies.
But to pretend that a very large oil field isn’t in the early stages of going exceptionally gassy is to ignore the obvious. I have no bone to pick, but I must say that I find your incessant segues somewhat irksome. So I’ll wish y’all a cordial goodbye and find myself another learning spot. Thanks for the help.
Gerry,
The 82000 well scenario is over an 17.25 year period (Sept 2023 to Jan 2040). Of course the scenario may be wrong(very likely to be wrong in fact), especially if oil or natural gas prices fall in the future so that tight oil production is no longer profitable.
By my estimate the average Permian basin well in 2020, will produce 478 kb of oil, 2030 MMCF of natural gas and 168 kb of NGL. Cumulative net revenue would be about 14 million after 18 months at $95/bo at wellhead, NGL at 35% of crude price and Natural gas at $5/MCF.
If we assume the well is shut in at 20 bopd, cumulative net revenue at the end of life at 168 months after first flow would be 35.2 million in 2022 $.
Many companies claim they have a large inventory of high quality wells (Pioneer claiming 20 years worth).
USGS had predicted about an 11 Gb mean TRR for North Dakota Bakken, my guess is the ERR will be about 8.5 Gb or 77% of mean TRR estimate. For Permian basin the USGS mean TRR estimate is 75 Gb, 77% of that would be 58 Gb, my scenario expects about 51 Gb or 68% of the USGS mean estimate.
Reservegrowthrulz might argue that my scenario is far too conservative. Note that I expect oil prices to be above $95/bo from 2023 to 2035, if this is not correct and oi prices are lower than my expectation then URR may be lower than my best guess of 51 Gb for the Permian basin.
Oh and I have been expecting GOR to become a problem since 2012 and was predicting then tht new well productivity would soon decrease. Ten years later I am still waiting for GOR to become a problem, eventually it will, probably around 2030 is my guess.
Gerry
Pls don’t leave. We enjoy your insightful knowledge. When you provide a different view it is helpful for those of us that don’t have a deep understanding of what is happening in the field.
This board is filled with intelligent people that have different opinions that are delivered kindly. That is an important feature of this board.
Read the posts and comments and decide if they make sense or don’t, but don’t let them upset you.
I don’t blame you, Gerry; Dennis Coyne’s comment about rising GOR and exponentially rising gas volumes in the Permian Basin now being “OK” for our nation ( or rather a remote part of West Texas) is a direct contradiction to all of his predictions about liquids EURR in the Permian and 120,000 more wells. Your points about GOR are valid, he’s crawfishing.
Remember, you are dealing with people who can only see numbers and know absolutely nothing about real life in the oilfields of our country. Most of these people have never even seen a real oil well, don’t put their money where their opinions are and have never gotten a blister on their hands, EVER. They are self-declared experts only because of the…internet. A pseudo ‘economist’ from Maine believes GOR is not a problem in gas depletion (oil expansion) tight mudstone, try googling white papers on the subject at the JPT. They’d laugh at him.
Gerry,
I am sorry you find my replies irksome, I think your comments are great, I guess in the future I will limit my responses to thank you kind sir, you are correct.
They are self-declared experts only because of the…internet. A pseudo ‘economist’ from Maine believes GOR is not a problem in gas depletion (oil expansion) tight mudstone, try googling white papers on the subject at the JPT. They’d laugh at him.
Dennis, I don’t know how you put up with it. You dedicate so much time to this site, and yet some of these writers–instead of saying, “Sir, I respectfully disagree with your assessment and here’s why”–must issue personal insults.
I don’t know if your predictions are on the mark or not. I just observe. But these ad hominems are clearly off base and evidence of small minds.
Mike B,
I tend to come across as a know it all in these comments and those who know more than me find that very annoying. I realize my knowledge is limited and try to share that fact, but sometimes any disagreement with someone else’s point of view is taken as an affront.
I have the utmost respect for Mike Shellman and in some cases try to respectively disagree. Somehow any comment not affirming what Mike says is not taken well no matter how respectfully I try to present it.
I am happy that Mr Shellman, Mr Maddoux, Mr Kaplan and Reservegrowthrulz choose to share their insight.
Dennis, I greatly appreciate this site and all the hard work you, Ovi, Ron and the others put into it. One polite suggestion: you seem to feel like you always have to have the last word. Maybe don’t comment so much with the exact some scenario, it tends to overwhelm the board and make it look like a vanity project. Essentially it looks like your voice is more important than everyone else’s because you comment so much. Try to be more of a moderator and don’t try to dominate the board so much with your viewpoints. We all know what you think. You don’t have to say it fifty times on every thread. Just my two cents.
I rarely comment because I have no experience in modeling or in the oil business. I think that energy resources and the ecological impacts of energy production are vital issues for our global society, and this is one of the few (only?) sites that has such wide-ranging, expert discussion of these questions. So, these threads are fascinating reading, so much better than most commentary and forums on media and blogs. I wanted to express my appreciation for all of the work you all put into this site, Dennis, Ron, Ovi, George and all the expert commenters. It’s great to hear such informed and informative debate over our future. I feel Dennis provides a cautionary note regarding extrapolations to the future, in part because his modeling and most others failed to account for the tremendous growth of shale and oil sand production. So, there is the risk of underestimation of future resources on a global level. On the other hand, there have been “Black Swan” events which have greatly impacted production more recently, so models would have overestimated production/demand over the past few years. Who saw COVID or the Russian invasion of Ukraine on the near horizon in 2018? I believe we will be seeing more unexpected political and environmental disruption going forward that will impact production negatively, but perhaps there are surprises on the upside that no one sees coming.
Stephen Hren,
Thank you for the advice, I will comment less.
Thanks Brian,
I am not an expert, but many experts do contribute and I appreciate all the informed opinion and debate, both non-expert and expert alike.
I was looking back on an old projection from December 2018, just after the most recent Permian USGS assessment for the Delaware basin had been released.
At the time I had data through October 2018 and I have filled in the data through Sept 2022 in the chart below, obviously I did not anticipate either the pandemic or Russian invasion of Ukraine in December 2018. The old model was an underestimate of actual Permian output up to March 2020, but was definitely an overestimate from April 2020 through Sept 2022, missing high by 1007 kb/d in September 2022.
Predicting the future is difficult and I get it wrong about 100% of the time.
Gerry,
We come from very different places and perspectives.
Despite that I appreciate the time you take to share your observations.
We all tend to learn from hearing each other out.
Thanks for that.
Gerry Maddoux,
I have run the numbers, the average 2020 Permian basin well breaks even at about $66/bo, $23/b NGL, and $5/MCF natural gas (wellhead prices) with a nominal annual discount rate of 15% and average well cost of $14 million and OPEX of $13/boe. EUR over 168 months (I assume the well is shut in at 20 bopd) for the average 2020 Permian basin well is 478 kbo, 168.5 kb NGL, and 2031 MMCF natural gas. I agree that if these wells did not produce oil they would not be profitable, but note that with adequate natural gas pipeline capacity the natural gas produced by older wells could leas to considerable cash flow if demand for natural gas remains strong through 2030 or so. Low oil and natural gas prices will be the end of tight oil production, the talk of $40/bo and $3/MCF being viable for tight oil growth is nonsense in my view. Note that if I reduce my natural gas price assumption to $3/MCF, the breakeven oil price rises to $72/bo at well head(NGL assumed to sell for 35% of crude price in all cases).
Brent is flirting with the 100$ again – and from the chart the down trend from summer is broken.
After the midterms Biden has to stop the draining of the SPR – let’s see if commercial storage in the USA is falling then faster.
Don’t over complicate it. US demand is the only thing holding prices up. And US is heading into recession. Jobs aren’t near as robust as we are lead to believe.
US has almost 500,000 fewer full time jobs as we did in March 2022. Big tech is laying off in mass. Which will have knock on effect as lots of other jobs that depend on the demand those highly paid people bring. Recession is just getting going or started. We got a few rough qtrs ahead of us.
Banks are also laying off in mass as new loans particularly in housing market just aren’t happening often with 30 fixed mortgages above 7%.
Only thing that will cure the dollar shortage is lower interest rates that spur borrowing and lending. And we will get there eventually.
But until then there will be a lot of financial pain. And lower oil prices.
HHH
There is currently a 50 basis point spread between the US 2yr and 10 yr.
What does the gap tell you as it increases and decreases?
The fact that it is inverted at all tells me while the bond market acknowledges the FED is raising rates. It doesn’t agree with why the FED is raising rates and is betting the FED will be cutting rates aggressively a lot sooner than everyone thinks.
As this recession takes hold the yield curve will steepen. As short term yields fall faster than long term.
Stock market is trying to time this an front run FED rate cutting cycle.
We are likely heading into situation where stocks are bought not because things are good but because things are bad. Very bad. And that means interest rate cuts and QE.
I follow lots of different varieties of financial advisors on youtube, etc.
The good ones all see that things are going to get bad, and they see this as an opportunity to get rich as they can buy assets for pennies on the dollar.
Almost all of them assume a rebound will follow and they’ll be laughing to the bank.
Pretty much none of them see that this is heading into a potential energy crunch
in which case there might not be a rebound as in the past.
HHH,
Do you still expect the oil price to decline or even collapse ($25 by March) because liquidity dries up but then at the same time assets keep increasing because FED changes its policies? So oil companies will make little income but their stocks will do great? Or is it that you think the market has the timing of events wrong (market crash followed by FED intervention and then higher asset values similar as GFC).
Might take a little longer than March. Recession is a process that happens over weeks and months. It builds over time. As one by one businesses and people make decisions to cut back.
Not all stocks will preform. Most people are expecting some sort of a rotation into energy stocks. Because prices are high and supply is limited.
I’m not in that camp. I think demand will fall faster than supply. And OPEC will likely be cutting production again just hoping to keep prices up in 2023.
Globally we have a dollar shortage. And I expect that to really weigh down on demand in 2023.
I also don’t think China will be opening back up anytime soon. And when they do decide to try. Covid numbers will be unbearably high and they will shut right back down.
China will no longer be the world’s engine of growth that pretty much all countries rely on.
About China opening up: When Xi decides the COVID numbers don’t matter anymore, they don’t matter. The rest will be hidden from the public – but in the rest of the world the omicron waves have already passed, so no doom to expect here when they open. They can even reach 100% vaxxed before they do, just pressure the people with their COVID-app (get the shot or be switched red).
The crisis is slowly building up in real estate: New projects already collapse – nobody who can’t pay mostly cash can pay the high prices. For older objects prices are already falling. Condos that sold in weeks here I can see since half a year on the portals.
What still is up and keeps the building industry going is that inflation fear keeps owners improving and repairing their houses with spare money. I’ve spoken with craftsmen – still full order books and high raw material prices through elevated demand. Inflation doing inflation stuff.
Anyway, many things can change politically very fast the next time. A successful coup against Putin(a successful assassination is enough) allowing real peace conditions from a successor shifting all the blame on Putin, a turn around in chinese COVID politics, a chinese attack on Taiwan destroying major chip factories as “collateral damage” – there is the possiblity for fast changes, good or bad, in the next year.
And central bank chaos, too – too long too high interrest rates. The $ shortage is symptom here as you state.
HHH
OK. Steepening of the yield curve is bad. I assume the opposite move is encouraging.
All depends on why it is steepening. Steepening due to recession is bad. Steepening due to accelerating economic growth and inflation is good.
We had 2 qtrs of stagflation. Which is price inflation while economy is decelerating. Now we have both decelerating economy and inflation. And this will continue for next 3-4 qtrs
We are no where near bottom of prices. What we are seeing are bear market rallies. Which happen because markets have sold of by a lot.
All rallies should be sold be it stock markets or oil futures. Until we see growth and inflation bottom out. We are just at the very beginning of a recession. That will play out over 2023.
https://www.oilfieldtechnology.com/digital-oilfield/25102022/enverus-unearths-full-north-america-inventory-in-basin-by-basin-deep-dive/
Key takeaways from our North American Inventory Analysis: EIR estimates there are 125 000 remaining undeveloped locations, amounting to 60 billion bbl, that break even below US$40 WTI across North America. The Midland and Delaware basins combined make up 85% of the sub-US$40 WTI North American oil cost curve.
Dennis
How does your model compare with this statement in the article?
“Key takeaways from our North American Inventory Analysis: EIR estimates there are 125 000 remaining undeveloped locations, amounting to 60 billion bbl, that break even below US$40 WTI across North America.”
Ovi,
For my average 2020 Permian basin well with OPEX at $12/boe and well cost at $14 million and nominal annual discount rate at 15%, the discounted net cash flow over 168 months (when average well reaches 20 bopd output) is just aver 14 million and the well “breaks even” at an average wellhead price of $63/bo, NGL at 35% of crude price per barrel and natural gas assumed to sell for $5/MCF. There is no reasonable scenario where the average well breaks even at $40/bo. If we assume a wellhead price of $40/bo with NGL at 35% of 40 per barrel and natural gas remaining at $5/MCF the discounted net cash flow over the life of the well (168 months) is $7.8 million with the nominal annual discount rate set at 15%, if the well cost $14 million this would be a loss of $6.2 million in 2022$ over the life of the well. The net revenue (not discounted) over the life of the well would be $10.77 million in 2022 $. As far as well locations and the 85% of 125k locations (or about 106k well loxations in Permian basin), I model about 82400 well locations that may be economically viable if oil prices remain over $99/bo through 2035. My guess is that oil prices will start to fall by 2030, so the 82400 wells would be too high, if that optimistic projection for a transition to electric transport is correct. Lots of moving parts to this however, costs could come back close to 2019 levels (in 2022 $) if supply disruptions ease, there could be costs reductions due to improved tachniques such as 15k laterals supposedly having lower costs per foot and maybe electric frac fleets which might have lower energy costs and other process improvements such as water recycling that might reduce water use and water disposal costs. My scenarios assume none of these changes occurs. Also there could be reduced output per well (EUR) as sweet spots become fully drilled and as basin pressure depletes. I assume average lateral length of 10,000 feet and lateral spacing of 1320 feet (4 wells per section width), about 283 acres per well. ERR is about 51 Gb which is about 67% of USGS mean TRR for my best guess Permian basin scenario. Several scenarios in chart below, ranging from 450 wells per month to 600 wells per month maximum completion rate. Scenarios have 400 well per month completion rate in December 2022 and all scenarios have increasing rates of completion up to Feb 2027 then remain flat for 3 to 5 years and then completion rate declines, all scenarios have the same number of total wells completed (about 82400 after September 2022).
The short answer is that my model has exactly zero wells that breakeven at $40/bo ( though there might be a few exceptional wells where this is the case as there is a wide spread around the average, so perhaps 2% of the 125,000 claimed or about 2500 wells as a WAG (the 2% is a pure guess as I no longer have access to the well data from shaleprofile that once upon a time was freely available.)
Dennis
Thanks. I was concerned and skeptical of that $40 breakeven price.
What about the 125 000 remaining undeveloped locations? I recall you also had big well numbers.
Ovi,
For the Permian my scenarios above use 82400 new wells. For the 4 major basins I have 124 thousand wells (Permian, Bakken, Eagle Ford and Niobrara) after Sept 2022 assuming oil prices remain at $100/bo in 2022 $ until 2040. If we assume oil prices fall to lower levels earlier than this due to a transition to electric transport reducing oil demand then fewer wells will be completed, my current guess is around 95 thousand wells completed for all 4 major US tight oil basins after September 2022, with about 63 thousand of these wells being completed in the Permian basin. This scenario assumes oil prices start to fall in June 2030 and reach $50/bo or less by June 2033. The last tight oil well is completed in this scenario in 2033 and tight oil output falls very rapidly after 2030. See chart below for Permian basin.
Dennis
Thanks. So your well count is bang on with the report at the higher and you have also provided a lower estimate. Good analysis.
Thanks Ovi,
Below is a second revision to the 600 completion per month maximum in the Permian basin scenario. This scenario assumes that tight oil producers see falling future demand for oil by June 2028 and decide to start reducing the completion rate. By March 2030 in this scenario oil prices fall from $100 to $90/bo with expected future prices to fall by $6/bo in real 2022$ each year and with that price deck the wells completed barely break even. The well completion rate decreases very steeply at that point going from 535 comletions in March 2030 to zero completions in May 2031. Total wells completed for this “low” scenario is 52.3 thousand after September 2022 (that is roughly 10.25 years of drilling inventory at current rate of drilling) and URR for Permian basin falls to 38 Gb (50.7% of USGS mean TRR estimate for Permian basin).
This “low” Permian scenario is consistent with my expectation that oil prices will start to fall by 2028 due to lack of demand for oil as global personal transport moves to electric power.
Output in Permian basin increases at about 9%/year from Sept 2022 to June 2027 in this scenario and output decreases at about 23% per year from June 2031 to June 2036.
Click on chart for larger view.
Mr. Oilnews,
The numbers referring to future natgas potential in your linked Enervus report validates what we ‘natgas bulls’ have been saying for some time.
Specifically, over 300 Trillion cubic feet (almost a decade of US consumption) is economically viable at zero HH pricing when this associated gas is co-produced at $60 WTI oil pricing. (I am a bit skeptical of this statement).
Below $3/mmbtu HH has over 800 additional Tcf from the dry gas plays.
Raising the price point to, say, $6/mmbtu gives a century’s supply as viable acreage increases dramatically.
Going forward, there will continue to be pressure exerted on oil for transportation usage with natgas (CNG and LNG) taking up much of this role.
Coffeeguyzz
From same piece linked above
Privately funded E&Ps are running 45% of drilling rigs and 50% of completion crews in today’s US growth basins, the Midland, Delaware and Haynesville. In EIR’s opinion, this cohort risks inventory exhaustion concerns over the next three to eight years; in contrast, large-cap independents, US supermajors and natural gas-focused E&Ps are in far better shape and can hold activity levels for nearly 15 years without facing severe inventory deterioration.
Coffee- “Going forward, there will continue to be pressure exerted on oil for transportation usage with natgas (CNG and LNG) taking up much of this role.”
Interesting take on it.
We will have to watch for a change in the vehicle industry stance, since that is not the course they are embarking on currently.
In countries who are not sitting on abundant domestic reserve of excess nat gas, most of them will do much better with electric vehicles. That accounts for most of the worlds countries.
Europe’s Energy Crunch Will Trigger Years of Shortages and Blackouts
https://www.bnnbloomberg.ca/europe-s-energy-crunch-will-trigger-years-of-shortages-and-blackouts-1.1843004
Thats a really good update on the LNG supply/market situation.
Lots of ramifications.
Brazil is a major second tier producer in the same bracket as Iran, Iraq, Canada etc. It is one of the few producers not clearly past peak. However, it is maybe not doing as well as expected five or more years ago when reserves of up to 50Gb were being mentioned. Instead, current C&C reserves are less than 20Gb and have been on a gradually falling trend since the 2014/2015 price crash as discoveries and revisions are not quite fully replacing production. In the chart the 2P numbers before 2019 are simple averages of 1P and 3P but since then ANP has issued full details. Growth is in the Santos basin in pre-salt developments, but it is facing rapid decline in the highly mature Campos basin.
By basin:
five or more years ago when reserves of up to 50Gb were being mentioned. Instead, current C&C reserves are less than 20Gb and have been on a gradually falling trend since the 2014/2015 price crash as discoveries and revisions are not quite fully replacing production.
I think that perhaps “reserve shrinkage” is overtaking “reserve growth”, not just in Brazil but in a lot of other places in the world.
This is a projection made in early 2020. There have been some changes to actual start-up for new FPSOs and the overall availability for offshore platforms has been lower than assumed but actual production, shown by the red line as a quarterly average, is tracking reasonably closely; close enough not to warrant creating a new projection yet. It is likely that as depletion has been a bit lower than average for the last two years, there will be less decline seen now and the production may move above prediction for a time. Longer term there are sure to be changes in ramp-up schedules for new FPSOs (more likely delays rather than accelerations). There may be new FPSOs that I hadn’t included as a result of new discoveries or appraisals although I don’t think I’ve seen any yet (it can be difficult to keep track in Brazil as each FPSO has about four names: a constructor’s hull number, a Petrobras platform number, a vessel name, and oil field names).
As always George, thanks for posting such important information. Perhaps Brazil’s energy cliff will impact its status as global agricultural powerhouse. Best to be prepared I suppose.
Is US Shale Peaking?
https://oilprice.com/Energy/Energy-General/Is-US-Shale-Production-Peaking.html
Goat pasture or future drilling sites?
“Yeah, I’d say the delayed targets have underperformed where we would have anticipated. ..”
https://novilabs.com/resources/state-of-shale-oil-gas-q3-2022/
Chart below from page 6 of report linked above, click on chart for larger view.
Since January 2020, just before the covid demand collapse, 22 nations have surpassed their January 2020 production level, 55 nations are still below their January 2020 production level, and 12 very small producers are at the same level they were in January 2022.
The 22 gainers represent 47.5 percent of world oil production, and their combined production is almost level with the world peak in November 2018.
The data is through July 2022.
Since January 2020, just before the covid demand collapse, 22 nations have surpassed their January 2020 production level, 55 nations are still below their January 2020 production level, and 12 very small producers are at the same level they were in January 2022.
The 55 losers represent 52.5 percent of world oil production, and their combined production is 4.5 million barrels per day below where it was when the world peaked in November 2018 and 5.5 million barrels per day below their latest peak in December 2019.
The data is through July 2022.
So, in the big picture (since Jan 2013), the losers are down 3.5% but the winners are up 15.8%?
Yes, that’s correct, if you go back to 2013. But peak oil was in 2018. We are only concerned with what has happened, and what is happening, after peak oil.
Typo? Is it 55 gainers or losers…or the 55 gainers that are now losing since 2018?
Sorry, it was a typo. The 55 are all losers, not gainers. And they represent, as of July 2022, 52.5% of world oil production. That percentage will obviously change every month since losers will likely keep losing. The gainers, on the other hand, will not gain much more. Their production will increase until September or October then they, or most of them, will start declining also.
Thanks for the heads up. I have corrected it.
https://www.eia.gov/todayinenergy/detail.php?id=53319
Our latest Natural Gas Pipeline Project Tracker includes five new projects—four newly announced projects and one project under construction—since the last update in April 2022. Of the four new projects, three will expand capacity for existing pipelines, and one will be a new pipeline. If completed as planned, these five projects together would increase takeaway capacity out of the Permian Basin by a combined 4.18 billion cubic feet per day (Bcf/d) over the next two years.
1.7 BCF/d increase in capacity by Dec 2023 and another 2.5 BCF/d by 2024Q3.
RBN Energy just said the other day that the Permian is now producing over 22 Bcfd.
Thatsalotta gas.
Interesting piece from Novi labs
https://novilabs.com/blog/whats-behind-the-rise-in-us-gas-production/
Took a quick look at GOR for wells in the Permian basin Midland county (core of Midland Basin) for 2016 and 2018 wells, took 12 month cumulative intervals to save time to get 1 year, 2 yer etc total output for oil and gas then found GOR, for 2020 wells we only have data for all wells through 12 months, so just a single point with GOR at 1.86 MCF/bo, higher than either 2016 (1.61 MCF/bo) or 2018 (1.5 MCF/bo). As Mr Maddoux and Mike have pointed out, at the individual well level the output gets very gassy as the well ages. In the Delaware basin it is likely worse.
For all of the Texas Permian basin I found the yearly average GOR for Permian basin wells in Texas that started producing in 2016, 2017, and 2018 by using cumulative production at 12, 24, 36, 48 and 60 months and then finding 12 month total production for year 1, 2, 3, 4, and 5 for oil and natural gas and then calculated the yearly average GOR for each of the 2016, 2017 and 2018 wells, for 2016 wells we have 60 months of data, for 2017 wells only 48 months and for the 2018 wells only 36 months.
The chart below shows increasing GOR over time and the shift in the curve from 2016 to 2018, some of this shift might be due to a higher number of Delaware basin new well completions (in percentage terms in 2018 compared to 2016). The Delaware basin tends to have higher GOR than the Midland basin.
Dennis is the voice of reason in a sea of emotion. The most irritating part
of Dennis is his damned reasonableness. He states his assumptions,
steadfastly cites the most reputable sources, and plugs in the numbers.
As a trained mathematician, I have noticed that people’s (including my own)
intuition is in general bad. Who would have thought there was a nowhere
differentiable continuous function until Weierstrass wrote one down? Much of
mathematics is being trained to write proofs precisely for this reason. If
it’s true you should be able to write down a proof from known principles.
In the same way, if you really understand peak oil you should be able to
write down a mathematical model that either fits the data, or gives a
confidence interval in which the data lies. Otherwise you have no business
objecting to the reasonable voice of Dennis Coyne.
The only advice I have for you Dennis is to keep up the good work. I
appreciate it immensely and have the utmost respect for what you do.
Thanks.
“Peak” oil is a meaningless term that has nothing whatsoever to do with mathematics, or data, all of which is bias and skewed by whomever is providing the data. Whenever it occurs it will not be a precise date in time. Nobody picking the date of peak oil is going to win a Nobel Prize.
Is Novi’s data better than Enverus’s data? Rystads? They are all trying to be the last data-sell company standing and will say anything to sell good news, not bad news. Why is waiting for corrected TRRC data from 250,000 wells in Texas (!) so hard for some impatient people. Most of you couldn’t figure out how to timely report that information in a lifetime, with a staff of 2,000. On the other hand, EIA 914 estimates are something some can spend all day yacking about and making charts over. Sorry, the. EIA stands for Energy Inaccuracy Agency. It is politically motivated.
The data these companies provide is subject to limitless interpretations, also based on bias opinions, or a personal agenda, or something as simple as the need to seek relevance in an industry you have never been in and know nothing about. Since when does anybody put any credibility into a statement from a tight oil company in an IP, like PXD saying it has 20 years of Grade A locations left in Saudi America?
I think when it suits your personal “agenda.”
This comment I am responding to is actually quite poor and I am disappointed in a fellow tennis player of such worldwide stature making it. It suggests that only bias data and charts and math matters and that anybody with any real life information, or experiences, with their own money at stake, should otherwise keep their mouths shut. As though a stupid chart predicting the future solves all the answers.
Dennis works hard on his computer, indeed. Most of us work “hard.” Some of us actually trying to get this oily shit out the ground, and in your little FIATS, or to fuel generators that provide the E to your EV’s… work very hard, 24/7, non-stop. When we’re at risk, financially, when we are away from home at the expense of family life, when our lives and safety are at stake, fucking “mathematics” seems likes something left for bored folks who don’t like blisters. We sota think you folks analysing our work, from the safety of your own keyboards, with nothing in your lives actually vested, financially or otherwise, ought to listen up. You might actually learn something.
Respect must be shown before it can be given. If you all think I am an asshole, you know nothing about the real oil business and who, exactly, does all the work to provide you energy.
“Respect must be shown before it can be given. ”
Pot, meet kettle.
Mike,
I think you are great, I have a great deal of respect for you and for your industry and I appreciate all you have taught me, sorry that you don’t like what I have to say. My “agenda” is to let the world know about peak oil by making the best guesses about the future with the data I have available. The EIA uses the RRC data up to 24 months ago and then estimates output based on a survey (the 914) for the largest 25 to 30 producers in Texas (which account for about 90% of total Texas output) they estimate the rest based on the past percentage of non-914 companies to 914 companies. It does of course miss sometimes, but typically by less than 1% and it has nothing to do with politics.
If oil men think it best to leave as much in the ground as possible is best and save the oil for the future, that’s fine with me. My expectation is that the World will move on from oil and natural gas in the next 10 to 15 years and much of the expensive oil (tight oil and oil sands) will indeed remain in the ground.
If I ran a tight oil company, I would produce the oil while oil prices are high (as they are today), large producers in the Permian basin that are ramping slowly may look back in 2030 at all the money they left on the table by choosing a slow rate of oil completions as oil prices start to fall and their assets become stranded.
That is just how I see things going, but as I often say, the chance of me being precisely correct are zero. The future is unknowable. My scenarios are based on a set of assumptions and those will not hold true.
Mike do you define respect as always agreeing with someone?
I always respect what you have to say, I just do not always agree.
There is a distinction.
I choose the free Novilabs data because it is free, it is the only data besides the EIA data that I have, the older RRC data that is accurate is matched by the EIA data.
Mike,
It is hard to find two Americans with backgrounds as different as you and I,
and yet I feel a profound kinship with you.
I was born in 1955. I started commuting by bicycle in 1966 and have never
stopped. My wife bought the family’s first car in 1991. I am a French
resident and do not have a French driver’s license. I’ve driven less than
100 miles in the last 10 years. I grew up in a family of left wing
intellectuals, my grandmother was called before the House Un-American
Activities Committee and was asked if she had been a member of the Communist
Party. Her answer was: “Yes, but they threw me out”. My grandfather was the
first Californian hippy. While I was out being a tennis bum, and then
learning and teaching abstract nonsense in universities, you were actually
getting stuff done that made my life possible.
What do we have in common besides our taste in music, aesthetics, and a love
of tennis? We are both grieving a USA we grew up in. You spent your life in
an industry into which you were born and in which people and integrity
mattered. You took pride in being part of that industry. Today the industry
has turned into a numbers, graphs, charts, and money industry. People and
integrity have taken a back seat. I teach some of the tools used in this
transformation. I have spent the last 30 years living and working in France.
I am grieving the same things. I grew up in a rich California culture which
I was proud of, and proud to represent. I have watched astonished as main
stream media has turned into a propaganda machine. Not just your industry,
but many other areas of U.S. culture seem to have lost track of the values I
grew up with, frequently using tools I teach as justification: statistics,
numerical methods, and optimization. Today people and integrity have become
less important than money and political advantage.
You are correct to remind us that the important part of peak oil is not the
numbers, but the human element. Forty years ago I thought institutions in
the U.S. and Europe well designed. Today I think these institutions have not
incorporated what we have learned in the last 50 years. I think they need to
be redesigned. I will use my new favorite word: holobiont. We need to take
care of our holobionts, see
https://theproudholobionts.blogspot.com/2022/06/survival-of-fittest-or-non-survival-of.html.
You are in fact a role model for me. I have one more year at the university
before I role up my sleeves and get to work actually doing stuff that
matters. Getting ready for a post peak world that will radically change our
work force. My new activity will be agroecology. See
https://theproudholobionts.blogspot.com/2022/07/why-agroecology-is-future-of-food.html
Shinzy, we’re good mate. I know who you are, I admire you immensely…you did something I could never do. You used your “gift” to get an education. I never had the gift and I had to work. I don’t resent that. I am proud of you, truly.
I gave up years ago trying to explain why tennis is so life-like, how it makes good men and women out of fair to mediocre kids, why 90% of collegiate tennis players graduate and excel in academics, and why 37% of basketball players don’t. Lets just say you are a hoss, probably in life too, and you had the guts to get out of this fucking country, something I never had. Goodonya. I said to my coach the other day about Max Cressy…I bet I know the dude who helped develop him and send him to California.
It’s hard this oil shit. I was born into it and after seven decades I still don’t don’t know much about it. It’s humbling experience. If people think they have it all sorted out and and can predict what the future holds, all I am trying to say, after all this time…you don’t. Humble up man… there is ALWAYS somebody out there smarter than you are.
In the oilfield, like life, we start at the bottom and work our way up. There are no participation trophies; you know you have done OK when you come home with all your limbs and you can go back the next day. Which I have to do at 04:30 in the morning. Bonne nuit, mon ami.
Amen Mike,
I am proud as hell of you.
Mike Shellman,
Chart for Midland county and RRC district 8, I do not have the programming chops of Enno Peters so pulling together well profile data for say midland county to determine average GOR for 2018 wells is not possible for me, so the charts below use RRC data for midland county and for district 8 as a whole.
Lets assume that Dennis is close enough in his peak oil calculations.
https://peakoilbarrel.com/future-decline-rate-of-world-oil-output/
Currently 40 million old cars are scrapped each year and the global fleet is growing by about 30 million each year.
When peak oil happens global oil production will start declining between 1% and 2.5% this will vary from year to year. In a good year the world will have to get by with around 0.7 million barrels less of oil. On a bad year oil production would fall by 2 million barrels per day.
Let’s say the number of flights and shipping journeys and chemical production remains the same. How many ICE vehicle equivalent would have to be removed from the roads of the world for that to happen?
Would the electrification of all 70 million new cars per year be enough to give us time to figure out other solutions for the airline industry, shipping etc.
According to BP and other sources cars, globally use around a fifth of all oil produced.
https://www.bp.com/en/global/corporate/news-and-insights/reimagining-energy/spencer-dale-on-electric-vehicles-and-future-energy-demand.html
There are an estimated 1.4 billion cars in the world, so 1 million barrels per day fuels approximately 70 million cars.
In a good year of oil decline, if every single car produced was fully electric, we would cope with that decline rate.
In a year of steep decline 2.5% the world would somehow have to get rid of the equivalent of 140 million cars. I know there are people who could drive less, but many cannot get to work any other way. There is another problem, in 2028 there will be another 480 million people demanding their share of what we use.
How will governments ensure oil goes to where it is needed to most and how will people be compensated when told they cannot use their cars?
In ten year after Peak Oil, the world would have to get rid of over 1 billion ICE cars many will only be a few years old. How will that happen?
Charles,
A couple things to consider is that EVs will be considerably cheaper to own within a few years as costs come down.
Also if autonomous vehicles are perfected enough to be approved the cost of an Uber/Lyft ride in a self driving car will be 10 times cheaper per mile than using your own car (if purchased new and used for 100k miles) and 4 times cheaper than an ICE car given to you for free by your rich uncle as fuel and maintence cost alone will be 4 times more expensive per mile than driving the car yourself. Note that my projections are likely to be incorrect.
See following Tony Seba Video (18 minutes) for more info
https://www.youtube.com/watch?v=Vqs0_3M-18c
Also remember that the global fleet will stop growing at some point as it has already in many OECD nations. If autonomous vehicles are eventually approved for use on roads, the typical passenger vehicle that currently averages about 10 thousand miles per year Worldwide will be replaced by fleet vehicles in robotaxi services where each vehicle travels about 100 thousand miles per year, about 10 times fewer passenger vehicles might be needed. Many people may choose cheaper pool services where the robo taxi is shared so this might reduce vehicle miles travelled if the average vehicle increases to two passengers per trip rather than the current average which is likely very close to 1 passenger per vehicle, that would reduce the number of vehicles needed by a factor of 20. Less parking space will be needed in cities, freeing up a lot of space. Also keep in mind many major companies are working on autonomous technology, only one needs to be approved as there will likely be only two competing systems as it is like an operating system for PCs or smart phones. This may be a reality in 3 to 5 years.
Mr Coyne
Your first sentence is the guess of all guesses. You can’t possibly know what the cost of EVs will be in a few years. The break throughs that may or may not happen, the resources that may or may not be available. The electrical infrastructure from chargers to power plants and a robust distribution that may or may not be adequate. I believe that in your heart you want it to be true. At this point in time the cost of batteries are only getting higher, today the spot price of lithium carbonate crossed $40/lb. A few short years AGO the price was $3/lb.
Ervin,
There are EVs in China priced as low as 14 thousand with 200 miles of range. Of course I don’t know the future. My statement is what my expectation is. Prices have come down in the past and are likely to continue that trend in my opinion as most car manufacturers are working on this and economies of scale are likely to become a factor as battery production ramps up. This is historically how technology has developed, it is likely to continue.
Dennis
This is why most people are still buying ICE vehicles. For a family buying a new car today, today is all that counts
https://www.hyundai.co.uk/new-cars/kona-electric
https://www.hyundai.co.uk/new-cars/kona
The difference is equal to 3 years of a families food bill.
Charles,
In the US the total cost of ownership over the life of the car will be lower with the electric vehicle. Have you heard of the adage, pennywise and pound foolish? Also future costs will fall for BEVs while fuel costs for ICEVs will continue to rise.
Charles,
For total cost of ownership comparison in Europe see
https://nickelinstitute.org/media/8d9058c08d2bcf2/avicenne-study-tco-eu-and-uk-automotive.pdf
Those who look at the short term, will be buying the less expensive car initially but paying more over the long run.
The longer one owns the car the higher the savings for an EV, I usually keep my cars at least 10 years if I buy a new car.
Hey Charles, I happen to own a Kona electric (2021 new leftover) & it is a hell of a great car. But it did cost 38 K tax and other charges but it came with a $9500 tax credit which sealed the deal for us. It generally gets about 4.4 miles per KWH and with a range of over 300 miles when fully charged. We also purchased a RAV4 plug in hybrid that gets 50 miles on the battery charge. It is also a great vehicle and we rarely purchase gasoline for the RAV4 since we have the electric abilities. The problem though with all transportation going completely electric in the future is a lack of critical resources needed to make the electric & battery components. Critical ones like Cu, Ag, Ni , Mn, Zn, Co, Li & many more including the rare earths will be limited or very costly. And with oil prices heading higher permanently, this will make it very troublesome for the entire electric transition. But I have to say that electric vehicles are superior to ICE vehicles from our viewpoint thus far.
See article on metals needed for EV’s – https://www.iea.org/data-and-statistics/charts/minerals-used-in-electric-cars-compared-to-conventional-cars
Dennis
I have just redone the calculations based on sales of vehicles staying the same from here on.
Secondly, I have also played with the concept that every single car sold will be fully electric by 2030, only 7 years away. The most optimistic studies predict 30 million electric vehicles being sold in 2030.
Car scrappage will increase until it matches the cars produced 12/14 earlier. Let us assume natural scrappage will reach 70 million per year in 2028. Nearly all those cars will be diesel and petrol which is good.
To avoid global shipping of food and goods being impacted, to avoid the aviation industry being decimated and other industries, the reduction in consumption can only come from cars.
However according to you, the average decline rates after 2028 for oil will be around 2.5%. That would mean a decline in oil production of around 2 million barrels per day each year. Equivalent to what is used by 140 million ICE cars.
5 years after peak oil, in this very optimistic scenario, the global ICE car fleet would have declined from approximately 1.6 billion to 1.3 billion.
Global oil decline rates would only have enough oil for 900 million. As you can see we would have to scrap over 120 million ICE cars every year after peak oil. A frightening prospect.
Charles,
Much will change between now and 2028 and note that often the most optimistic studies are wrong. Many miles will be covered with robotaxis in the future, perhaps as many as 20 times fewer personal vehicles will be necessary, most will be owned by robotaxi fleets, except for the very wealthy, cost per mile travelled will decrease by a factor of 10 relative to current ICEV. Did you watch the Tony Seba video? His predictions in 2014 for 2021 were pretty good.
Dennis
Are you having a bad week?
If oil decline removes the fuel for 140 million cars, then the world will have to find that saving.
I have assumed the most optimistic possible, ALL cars sold by 2030 will be electric, yet scrapping 70 million old diesel and petrol cars a year will be only half that is needed.
There will not be the fuel to drive all the vehicles no matter what the cost.
Charles,
Older cars are driven less, it is the old cars that are scrapped. The rate of sales of EVs might increase to more than 70 million per year or people may drive less. I know I drive much less these days as I do a lot of shopping on line and many people work from home now and no longer commute to work.
If robotaxis become a reality the average robotaxi will travel 100 thousand miles per year, the global average is currently about 10 thousand miles per year per registered passenger vehicle, so rather than needing 1.3 billion passenger vehicles the World will need only 130 million vehicles (10 times fewer). In addition many may choose pool type Uber/Lyft service where the vehicle is shared with a stranger, this may increase the average riders per trip to 1.5 from about 1 currently, this would reduce the total number of light passenger vehicles needed to about 86.7 million vehicles. Under this scenario at 70 million vehicles sold per year the entire global fleet is replaced in a few years. Note that in this scenario the number of cars produced per year would decrease by a factor of 10 and the Global car manufacturing industry may produce a lot fewer cars.
In any case all of the robotaxis are BEVs in this scenario because they are far cheaper to operate and demand for oil drops precipitously. Note also that the scenario from the post in August assumed demand for oil would decrease. If needed output can continue on plateau until 2037, see chart below, but if autonomous vehicles reach regulatory approval before 2035, then output will be much less than this scenario due to lack of demand for oil.
Charles, in your simplistic model of vehicles numbers and oil supply you are not taking into account that those with petrol vehicles will choose or be forced by market conditions (high price for gas) to scale back their mileage driven if oil supply is short.
They won’t scrap their vehicle, rather they will drive less. They will avoid all unnecessary travel- in some countries like the US there is a tremendous amount of unnecessary oil consumption.
Regardless of that point, yes- there is certainly a degree of probability that most countries in world will reach a point where there is not enough affordable petrol available on the market. That has always been the case for some poor countries.
I expect to see a huge rush for electric vehicles globally. Already the waiting times for a newly ordered EV for many manufacturers is 1-2 years, despite a very rapid expansion of the industry sector. The US has been very slow to react because of the current/temporary adequate supply of domestic oil.
If the vehicle battery progress over the past decade grinds to halt (unlikely), then a majority of people will get used to having an electric vehicle with lower range than they had been used to in the petroleum era. The average US vehicle is driven 29 miles/day. A vehicle with 120 miles range will seem a miracle compared to any other alternative. For occasional longer trips people could rent a vehicle with longer range.
And if you and I are wrong, there will be plenty of oil indefinitely.
Charles,
The average car driven 10k per year with fuel economy of 30 MPG uses about 7.93 b per year, 2 Mb/d is about 730 million barrels, if we divide by 7.93 we get 92 million vehicles rather than your 140 million, there might be a few years where supply is tight and ICEVs will be driven fewer miles and EVs will be driven more miles on average. In any case the ICEV fleet will be older and older cars tend to be driven fewer miles.
Dennis- in your calculation don’t forget to consider that each barrel of oil yields 20 gallons on gasoline when refined. So in your example it would be 16.5 rather than 7.93 b per year/ vehicle driven 10,000 miles.
Hickory,
Good point, but I would include diesel fuel as well because globally a significant number of light vehicles use diesel (though I do not know what percentage, most of the diesel is used by heavy trucks and some by water shipping). It is likely that no more than 50% of crude is used by light passenger vehicles. I missed that completely, thanks for correcting me.
“If robotaxis become a reality the average robotaxi will travel 100 thousand miles per year, the global average is currently about 10 thousand miles per year per registered passenger vehicle, so rather than needing 1.3 billion passenger vehicles the World will need only 130 million vehicles (10 times fewer” ~ DC
Regular taxis can already do that. Just need a taxi driver.
Survivalist,
With robotaxi BEVs costs per mile will decrease by a factor of 10 vs ICEV with driver or that is Seba’s claim, I have not run the numbers, it might be less than that.
Dennis
Tony is a fantasist.
Reality.
https://europe.autonews.com/automakers/truly-autonomous-cars-may-be-impossible-without-human-touch
Even those in the business are saying they will always have remote driver backup and that is still a decade away at least
https://edition.cnn.com/2022/10/26/business/ford-argo-ai-vw-shut-down/index.html
Self driving cars will be so profitable Ford and VW cannot bring themselves to take all that money. HA HA HA
Charles,
See following video.
https://www.youtube.com/watch?v=__EoOvVkEMo
These robotaxis already exist in Phoenix. Arizona.
When I first saw an Iphone I thought I would never have a need for such a thing, it will never catch on thought I.
I guess that’s where you are on the autonomous vehicle (AV) thing. The companies that will crack this problem are high tech companies like Google, Tesla, or Amazon, or possibly NVidia or Microsoft. It is a software / machine learning problem that is likely to be solved.
Only one company needs to accomplish this, Tesla, Waymo, Apple, and GM are still working on this. Impossible to predict when it will be accomplished, my WAG is 2027.
Phoenix Arizona!?
What a lovely place to implement sustainable transportation. I wonder if the taxis can do a Baltimore winter.
Survivalist,
Probably wouldn’t work on snowy roads, they are rolling this out in San Francisco.
See
https://www.youtube.com/watch?v=cKriYPN6gNg
“How will governments ensure oil goes to where it is needed to most and how will people be compensated when told they cannot use their cars?”
There will be no compensation for not having enough oil to drive around. You can cross that off any wish list.
Russia’s Oil Output Set To Fall By 1.5 Million Bpd In December Bold mine
Russia’s oil production is set to drop by as much as 1.5 million barrels per day.
Russia’s October production was 1.1 million bpd below its quota of 11 million bpd assigned under the OPEC+ agreement.
The expected sharp drop in Russia’s oil production will lead to a spike in international oil prices.
Russia’s oil production could drop to as low as 9 million barrels per day (bpd) in December when the EU embargo on imports of Russian crude oil enters into force, Russian news agency TASS reported on Wednesday, citing analysts at the Energy Development Center. “We expect that production in December will fall by 1.5-1.7 mln barrels per day compared to the June-October average, or 14%,” according to a report from the Energy Development Center cited by TASS.
The expected sharp drop in Russia’s oil production will lead to a spike in international oil prices, also considering that the OPEC+ group is reducing the target production as of November, the experts said.
What’s about the midterms now? Biden only stated the SPR releases until this data – after this another 1 mbd will be missing.
So it’s a deficit of 2.5 mbpd. Sounds we need a severe recession to compentate this and prevent prices from rising again.
Or there will be more Sri Lankas who won’t get any more oil. So or so – one side needs to give.
“Or there will be more Sri Lankas who won’t get any more oil”
Of course that is the case.
Depletion will threaten to the ability of all oil importing countries to have enough oil.
That is a certainty- its a matter of time.
Some countries will be able to afford oil for longer than others.
The pressures will absolutely shift geopolitical relationships.
US CPI came in at 7.7% today on expectations of 8%. Treasury yields rallied meaning yields fell because economy is cooling. Lower yields means stock market up for now.
But lower CPI and lower yields means in real economy there is tighter monetary conditions and less lending. Less demand.
Oil prices are holding recent losses for now.
‘We’re in an era of higher oil prices for at least the next six years:’ Eric Nuttall
Eric Nuttall, partner and senior portfolio manager at Ninepoint Partners LP, talks with Financial Post’s Larysa Harapyn about why he thinks oil prices are going “a heck of a lot higher” even if there is a global recession.
Some of the comments here read like fairy tales which are not told to kids but rather well off people which imply that their life will never change and (EV) cornucopia is just around the corner. All while outside the fundamentals of our civilization are crumbling.
The energy intensity of EVs is likely higher than that of internal combustion vehicles, weight for weight, if you account for dissolving the battery in acid every eight years to be fully sustainable. Currently the lithium isn’t recovered. Cars will shrink in size and be less comfortable.
Hi Required,
I think the thinking here is on a spectrum which allows for healthy debate. Some more opinionated and passionate in their arguments than others.
I think the common ground we all agree on is none of us know how it will play out.
Latest episode of The Great Simplification features an interview with Art Berman.
https://youtu.be/leE-_EKLv-k
I love listening to Art speak and never miss a chance to do so.
It was a good interview—
Some interesting Putin insight.
Dennis
What is the your cost per KWh to charge your car
Charles,
It is approximately 15 cents per kWhr when I charge at home, at superchargers when making a longer trip (more than 150 miles or so) it is more expensive, roughly 30 cents per kWhr( this varies by location), most charging is done at home at the lower rate. About 240 Whr per mile over the life of the car so far, approximately 4 miles per kWhr. So if I drive 15,000 miles per year this would be 3750 kWhr, let’s say 20% of these are at a supercharger and 80% at home, that would be $225 spent at superchargers and $450 for charging at home for a total energy cost of $675/year. A comparable quality ICEV Mercedes C class AMG 3Liter 6 cylinder gets average fuel economy of about 23 MPG, at 15k miles that is 652 US gallons of petrol per year, if we assume current US prices of $4.54/gallon (the Mercedes requires premium fuel), that is $2960 per year. So a difference of about $2300 per year in energy cost.
Dennis
I have a Mazda CX-5 with a compression ratio of 13 to 1. It uses regular gasoline. Most Japanese cars use gasoline direct injection so that regular can be used.
I used to have a 2008 Mercedes’ that required premium. I used to fill it with 1/2 super premium, 94 octane, and regular, which gave me 90.5 octane and the price of mid-grade.
In Canada, most stations only have two tanks, regular and premium. The fuel is blended in the gasoline pump.
Dennis
Your reply just shows the great difference in costs and cars between the U.S. and Europe.
https://www.bymiles.co.uk/insure/magazine/mot-data-research-and-analysis/
Firstly our average mileage is only around 6 to 7 thousand miles per year, it was only 7 thousand in 2011 and has been falling.
Secondly few have 3 litre cars, average mpg is 40 and some cars do 70 miles per gallon.
Thirdly we will never trust Russia again as Putin is just one of many in power, the next leader could be worse.
So we are stuck with electricity prices of 40 to 50 pence per kWh. Charging outside is between 55 and 75 pence for a fast charger.
As you can see if someone drives 6 to 7 thousand miles the cost difference between the two is only £200 to £400 per year.
If you look at finance cost on the £9,,000 difference between electric and petrol car.
The two are about the same.
Charles,
It may be that in Europe a BEV with a smaller battery makes more sense.
Currently petrol is about 6.27 pounds per US gallon in UK, so at 6500 miles per year the Kona (30 MPG) would use 216.7 gallons costing about 1358 pounds. The electic Kona uses 27 kWh per 100 miles so for 6500 miles that is 1755 kWh and at 45 pence that is 790 pounds so a difference of 568 pound per year, so without accounting for various subsidies that might be available for EVs, it would take a long time for the BEV to pay back the 9000 pound premium.
I guess subsidies have been eliminated in the UK.
Also in normal times electricity price is more like 20 p/kWhr in the UK, which would be about 351 pounds for electicity (actually there is a special EV rate that allows overnight rates at about this rate), so savings is about 1000 pounds per year so about 9 years and you have paid pack the extra money, if the car is kept for 15 years (97500 miles at 6500 per year) then one would be 6000 pounds ahead of owning an ICEV (not accounting for finance cost). This would be roughly equivalent to investing the 9000 pounds and getting a 3.5%/year average return on the investment over 15 years, so not that great, basically a wash as you suggested.
Anyone buying a new Mercedes ice car doesn’t care if they are going to save 2300$ a year on fuel by going electric
Raul,
Very true and my motivation for buying a Model 3 had nothing to do with saving money.
In the US the average person can save roughly 2/3rds of the annual cost of ‘refueling’ by going electric and charging at home with an equivalent vehicle.
We have an EV that my wife drives, and are saving 75% per mile cost given the gas/electric pricing in our area.
And in countries who import their gasoline or diesel, the advantage will likely dramatically increase for EV savings as the decade unfolds (peak oil). This assumes that the country electric grid and supply is in good shape. For some countries that is not the case.
Hickory
Europe imports 2/3 of its gas, so not much difference in terms of security. Every European country is now ordering, building LNG regasification plants. Global LNG prices have shot up, so there are no cheap alternatives here.
Charles,
Over time more energy will be supplied by solar and wind and European nations will be tied together with an HVDC grid, this will dramatically reduce the need for natural gas and prices will fall. This won’t happen overnight, but as relative costs for wind and solar fall in relation to natural gas and coal, the installation of wind and solar will accelerate. A widely interconnected HVDC grid will help to reduce continent wide variability and the energy can be moved from areas of high wind or sun to other areas that need energy. Existing Hydro and nuclear can back up wind, solar and battery storage with occasional use of natural gas or synthetic fuel.
Currently, and tomorrow, in Sweden and Norway the electricity cost is almost too cheap to meter, 0,02 SEK/kWh, do the math… (due mainly to wind and hydro)
Edit: to Americans thats 0,2 cents/kWh
But at times, when we`ve exported heavily to mainland Europe the price has been 2-3 SEK/kWh and even higher in the southern parts at times.
https://www.nordpoolgroup.com/en/Market-data1/#/nordic/table
So the answer is either nuclear at a steady but high price (see Hinkley point strike price etc. (and delivery much, much later)) or renewables with storage, in cars, accumulators, chemically in NH3, H2 etc.
And you can always use less by insulation…
My best bet car-wise is an early E-Golf or Prius refitted with more batteries.
Charles, don’t be surprised when you look back in ten years and see that many countries in Northern Europe have engaged in a huge offshore wind build-out. That is their only option for new domestic energy production, other than some coal and maybe nuclear (takes a very long time and is very expensive). And they will still be importing Nat Gas- if it is available.
Hickory
Germany has one of the highest installed wind capacity rate per capita. They have been building wind and solar at a high rate for 15 years.
https://ourworldindata.org/grapher/wind-electricity-per-capita
Wind and solar often produce a grid collapsing 10% or less, Germany was importing vast amounts of gas and it burns very high amounts of coal because wind and solar are so bad.
https://energy-charts.info/charts/power/chart.htm?l=en&c=DE&week=36&stacking=stacked_absolute_area
Australia has very high amounts of installed wind and its coal consumption is off the chart.
Electricity storage is 10 times more expensive than coal powered direct production, how would you like your electricity to be 10 times what you pay for it?
Storing electricity for an entire country is impossible that is why not a single country does it. Not even ones with no oil, gas and coal.
A new thread reporting on July Non-OPEC production has been posted.
https://peakoilbarrel.com/july-non-opec-oil-production-hits-post-pandemic-high/
A new Open Thread Non-Petroleum has been posted.
https://peakoilbarrel.com/open-thread-non-petroleum-nov-11-2022/