September World Oil Production Rebounds

By Ovi

Below are a number of Crude plus Condensate (C + C) production charts, usually shortened to “oil”, for oil producing countries. The charts are created from data provided by the EIA’s International Energy Statistics and are updated to September 2023. This is the latest and most detailed/complete World Oil production information available. Information from other sources such as OPEC, the STEO and country specific sites such as Russia, Brazil, Norway and China is used to provide a short term outlook for future output and direction for a few of these countries and the World.

World Oil Production and Projection

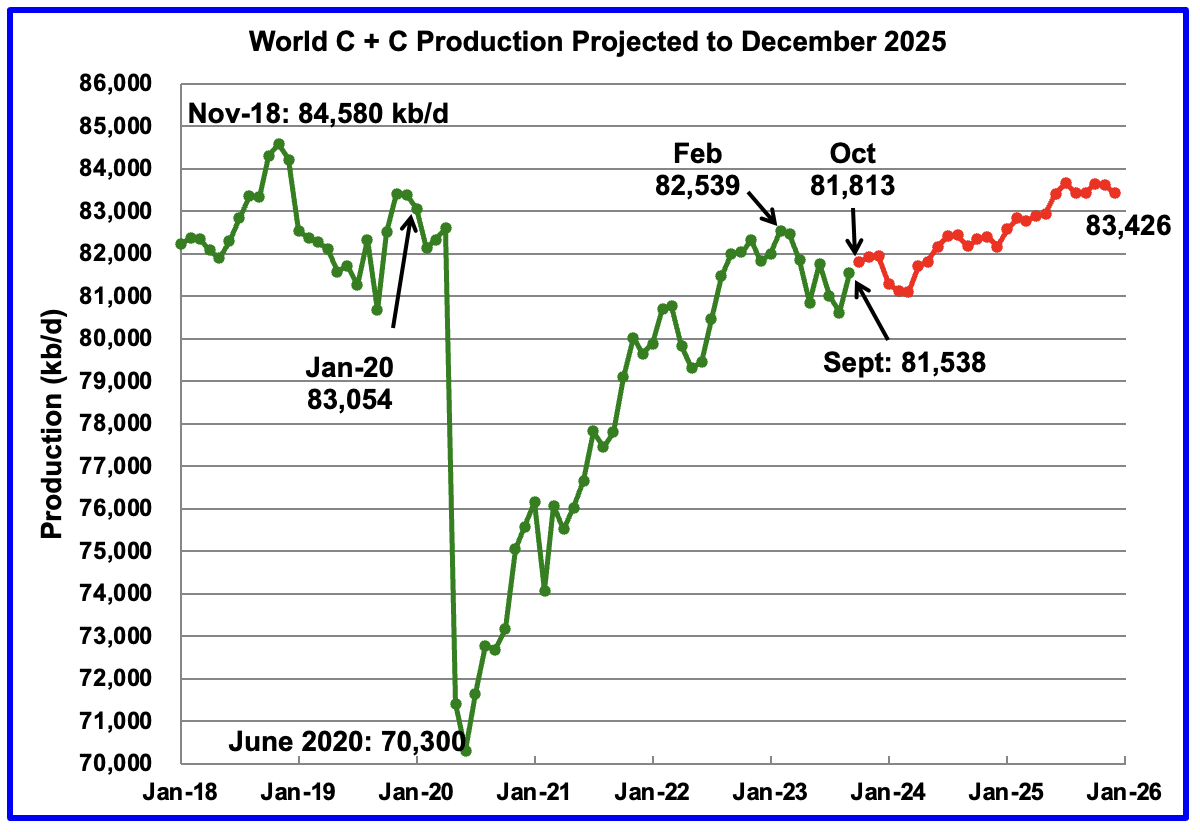
World oil production increased by 927 kb/d in September, green graph. The largest increase came from Saudi Arabia 500 kb/d while the US added 224 kb/d and Brazil 210 kb/d.

Read More

Russia Oil Drop Collapses April Non-OPEC Production

A guest post by Ovi

Below are a number of Crude oil plus Condensate (C + C ) production charts for Non-OPEC countries created from data provided by the EIA’s International Energy Statistics and updated to April 2022. This is the latest and most detailed world oil production information available. Information from other sources such as OPEC, the STEO and country specific sites such as Russia, Brazil, Norway and China is used to provide a short term outlook for future output and direction for a few countries and the world.

April Non-OPEC production decreased by 1,294 kb/d to 48,925 kb/d. Of the 1,294 kb/d decrease, the biggest decreases came from Russia, 965 kb/d, Kazakhstan, 175 kb/d, Canada, 95 kb/d and Norway, 78 kb/d. There were no significant offsetting increases. The April 2022 output of 48,925 kb/d is 3,295 kb/d lower than the March pre-covid rate of 52,220 kb/d.

Read More

May Non-OPEC Oil Production Up slightly

A guest post by Ovi

Below are a number of oil (C + C ) production charts for Non-OPEC countries created from data provided by the EIAʼs International Energy Statistics and updated to May 2021. Information from other sources such as OPEC, the STEO and country specific sites such as Russia, Norway and China is used to provide a short term outlook for future output and direction for a few countries and the world.

Read More

Non-OPEC September Oil Production Flat

A post by Ovi at peakoilbarrel

Below are a number of oil (C + C ) production charts for Non-OPEC countries created from data provided by the EIAʼs International Energy Statistics and updated to September 2020. Information from other sources such as OPEC, the STEO and country specific sites such as Russia and Norway is used to provide a short term outlook for future output and direction for a few countries.

Read More

August Non-OPEC Production Rises

A post by Ovi at peakoilbarrel.

Below are a number of oil (C + C ) production charts for Non-OPEC countries created from data provided by the EIAʼs International Energy Statistics and updated to August 2020. Information from other sources such as OPEC, the STEO and country specific sites such as Russia and Norway is used to provide a short term outlook for future output and direction for a few countries. Typically I collect updated country info after the 20th of the month for September and October. Since this is an early post, those have not changed from last month.

Read More