A guest post by Ovi
Below are a number of oil (C + C ) production charts for Non-OPEC countries created from data provided by the EIAʼs International Energy Statistics and updated to May 2021. Information from other sources such as OPEC, the STEO and country specific sites such as Russia, Norway and China is used to provide a short term outlook for future output and direction for a few countries and the world.
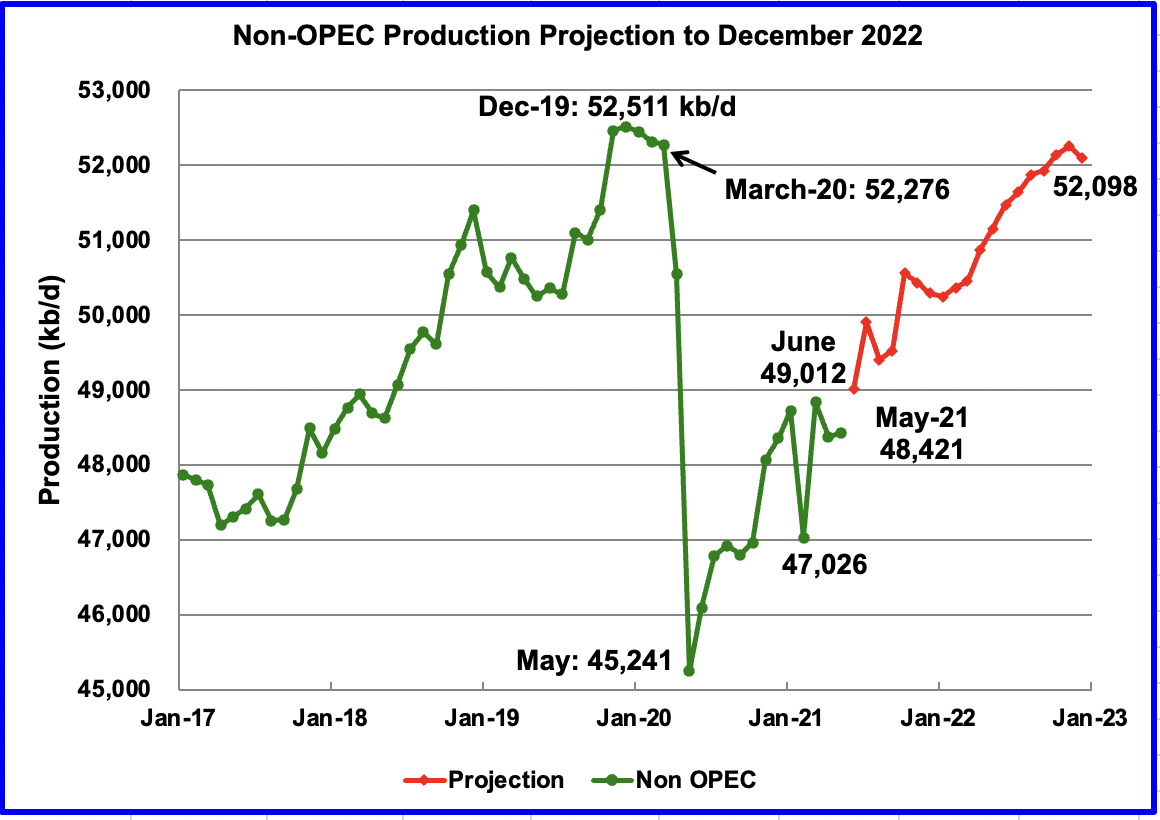
May Non-OPEC production increased by 44 kb/d to 48,421 kb/d. The biggest contributors to the increase were Canada, 71 kb/d and the US, 82 kb/d. Offsetting the increases were declines from Norway, 54 kb/d and Italy, 43 kb/d.
Using data from the September 2021 STEO, a projection for Non-OPEC oil output was made for the time period June 2021 to December 2022 (red graph).
Output is expected to reach 52,098 kb/d in December 2022, which is lower than the previous high of December 2019, by slightly more than 400 kb/d. In the September STEO report, the forecast December 2022 output was revised down by 86 kb/d from 52,184 kb/d in the August report to 52,098 kb/d.
June production for the Non-OPEC countries is projected to increase by 591 kb/d to 49,012 kb/d. About half of that increase is expected to come from Canada as maintenance on a few oil sands coker units/plants is completed. The 49, 012 kb/d output in this report was revised down by 347 kb/d from 49,359 kb/d in the August STEO.
Ranking Production from Non-OPEC Countries
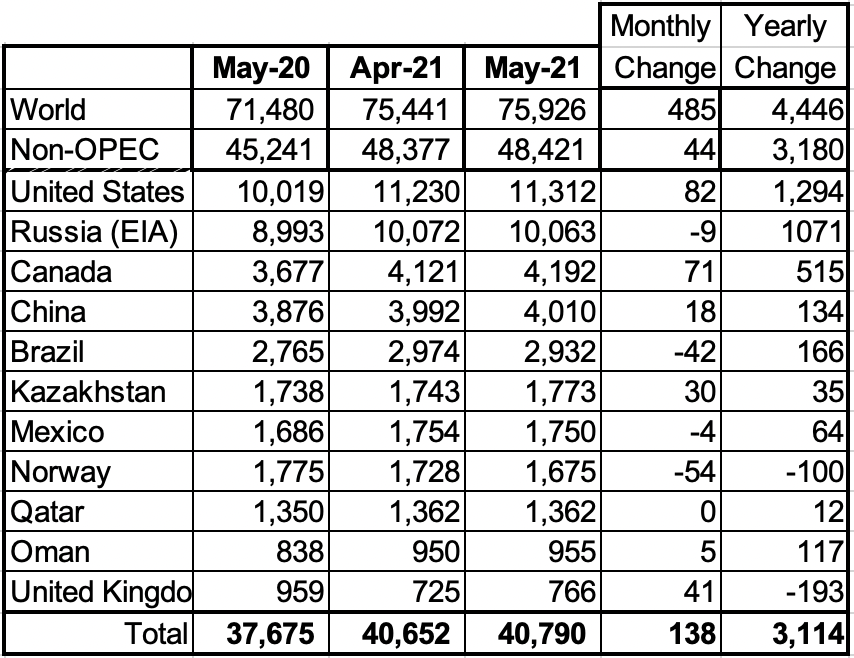
Above are listed the worldʼs 11th largest Non-OPEC producers. The original criteria for inclusion in the table was that all of the countries produced more than 1,000 kb/d. The last two have currently fallen below 1,000 kb/d.
In May, these 11 countries produced 84.2% of the Non-OPEC output. On a YoY basis, Non-OPEC production increased by 3,180 kb/d while on a MoM basis production increased by 44 kb/d to 48,421 kb/d. World YoY output was up by 4,446 kb/d.
Production by Country
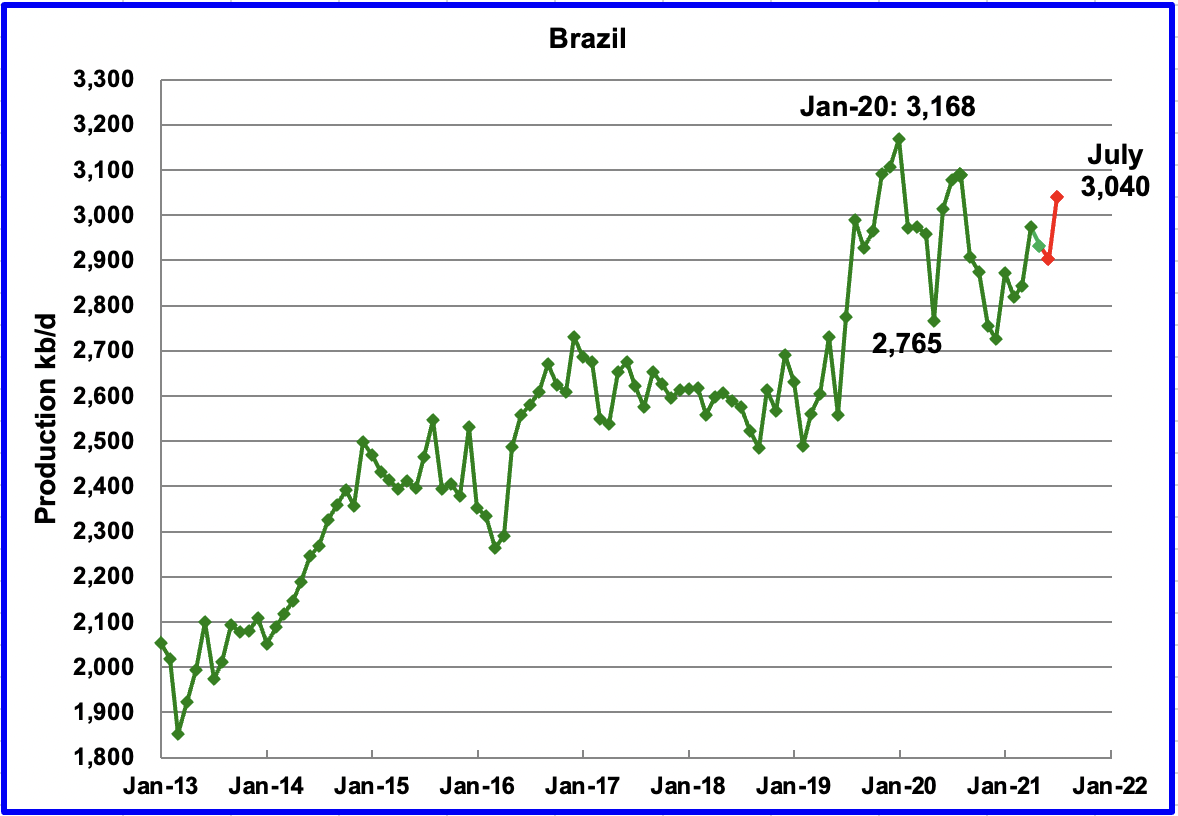
The EIA reported Brazilʼs May production decreased by 42 kb/d to 2,932 kb/d. According to this source, June’s output decreased by a further 29 kb/d from May to 2,903 kb/d and July rebounded to 3,040 kb/d, according to this source. (Red Markers).
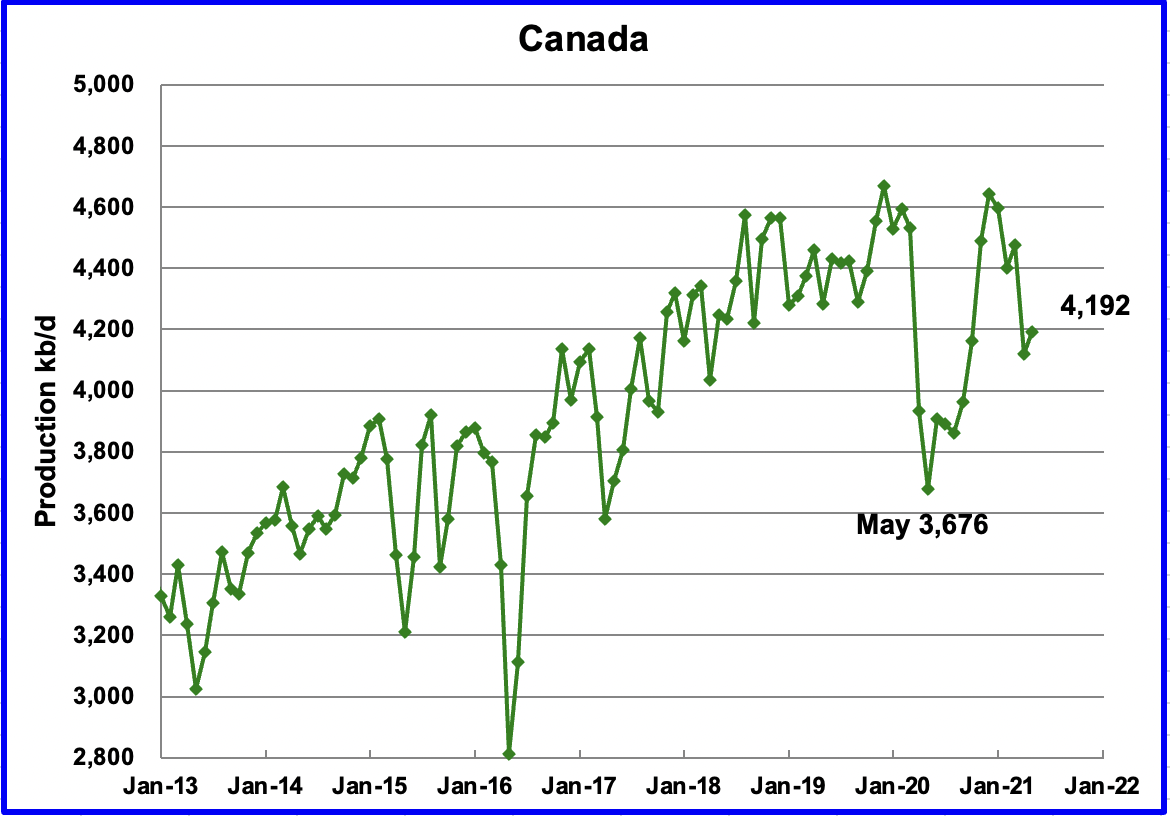
According to the EIA, May’s output increased by 71 kb/d to 4,192 kb/d. The increase was due to some oil sands plant maintenance being completed. As more is completed, production should return to the 4,600 kb/d range.
Oil exports by rail to the US in June were 131.6 kb/d, little changed from April and May and down by close to 45 kb/d from March. The June rail loadings are down from a peak of 411,991 bpd shipped on the railways in Feb. 2020 before the COVID-19 pandemic knocked out oil demand and led to a collapse in oil prices.
According to this source, Enbridge’s 390,000-bpd pipeline expansion is in ‘final innings,’ lifting hopes for capacity-constrained oil patch. Long anticipated and frequently delayed Line 3 is expected to begin filling with crude in late September.
Canada is the U.S.’s largest source of oil imports, shipping just over 4 million barrels per day of oil on average in May.
An interesting comment: “The same US administration that retroactively cancelled Canada’s Keystone XL Pipeline is now pleading with OPEC & Russia to produce & ship more crude oil,” the premier tweeted last week. “This comes just as Vladimir Putin’s Russia has become the 2nd largest exporter of oil to the US.”
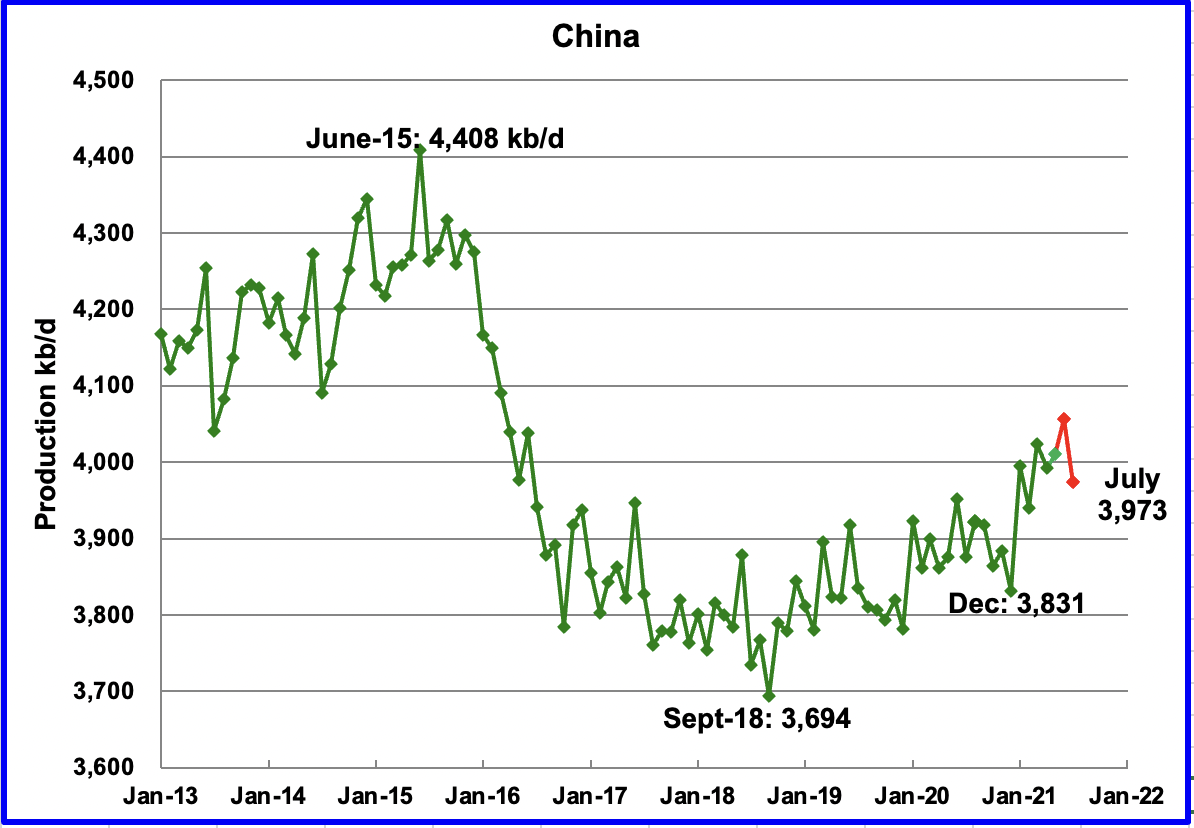
The EIA reported Chinaʼs May’s output increased by 18 kb/d from April to 4,010 kb/d. According to this source, China’s output decreased by 83 kb/d in July to 3,973 kb/d.
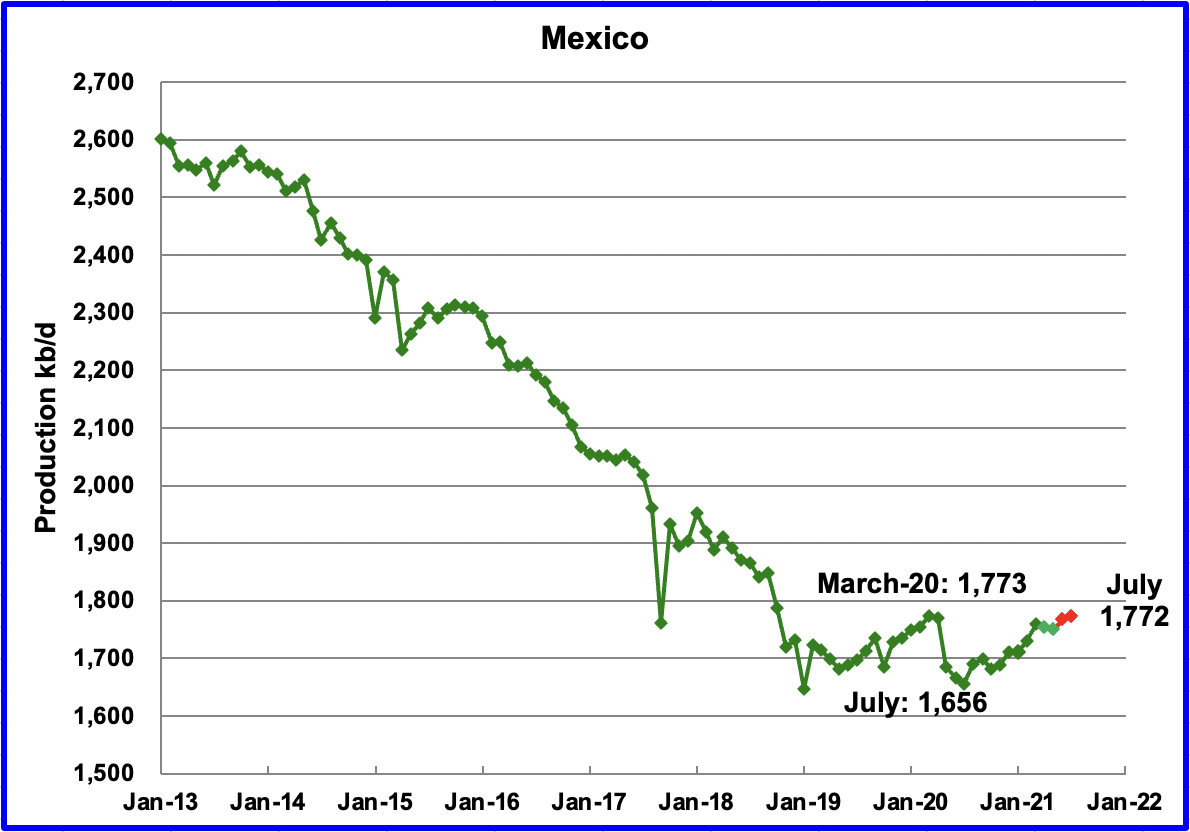
Mexicoʼs production, as reported by the EIA in May was 1,750 kb/d, down 4 kb/d from April. Data from Pemex shows that July production was up slightly to 1,772 kb/d. (Red markers).
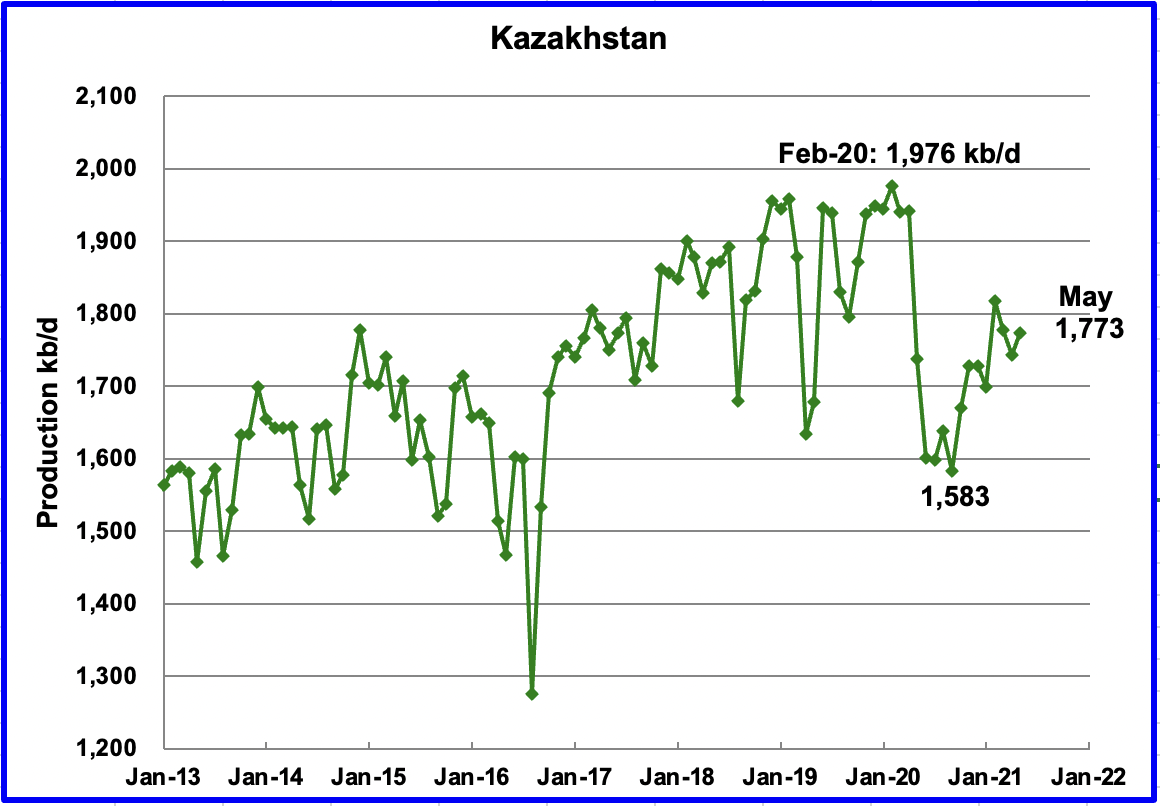
Kazakhstan’s output increased by 30 kb/d in May to 1,773 kb/d. Will it get back to its pre-covid level which is 200 kb/d higher?
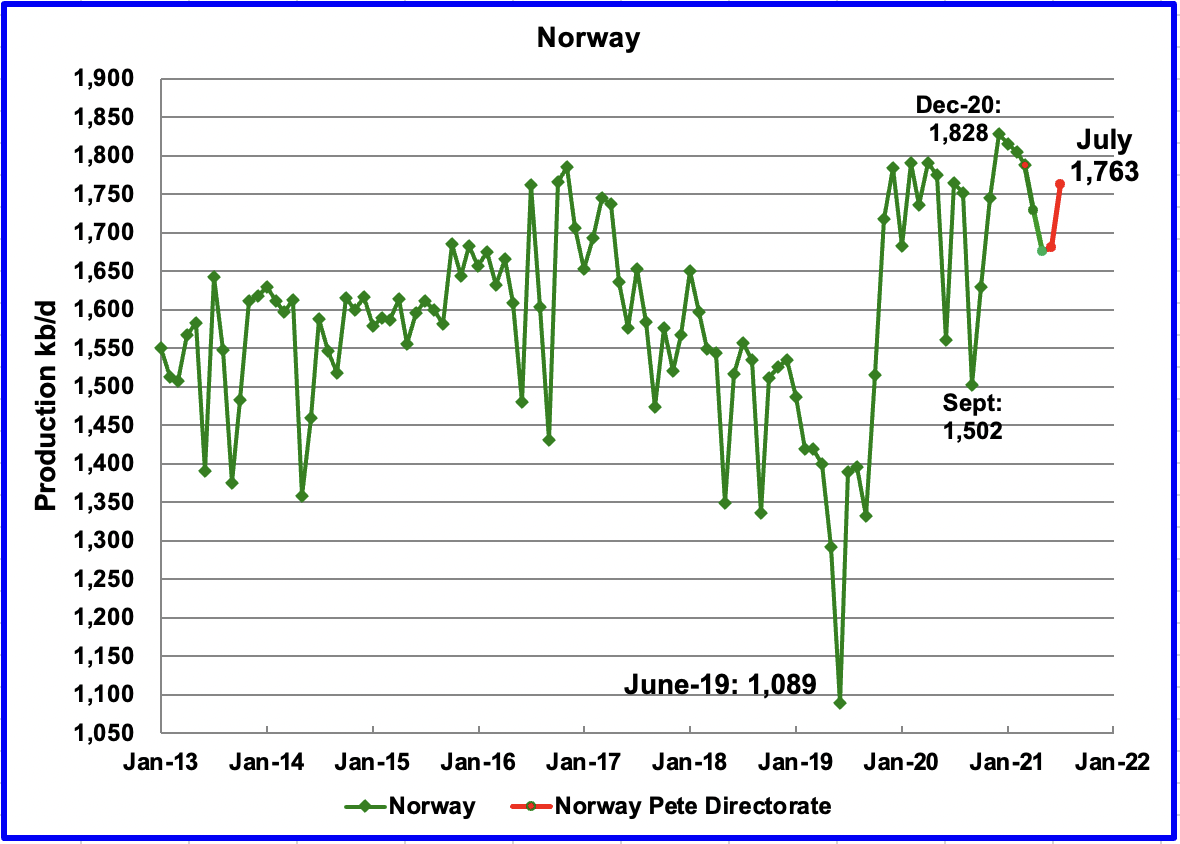
The EIA reported that Norwayʼs May production was 1,675 kb/d, a decrease of 53 kb/d from April. The Norway Petroleum Directorate (NPD) reported that production in July had recovered to 1,763 kb/d, up by 83 kb/d, red markers.
The NPD announced earlier this year that production would increase in the second half 2021. July was the first month showing a significant production reversal. Will production exceed the previous high of 1,828 kb/d in December 2020?
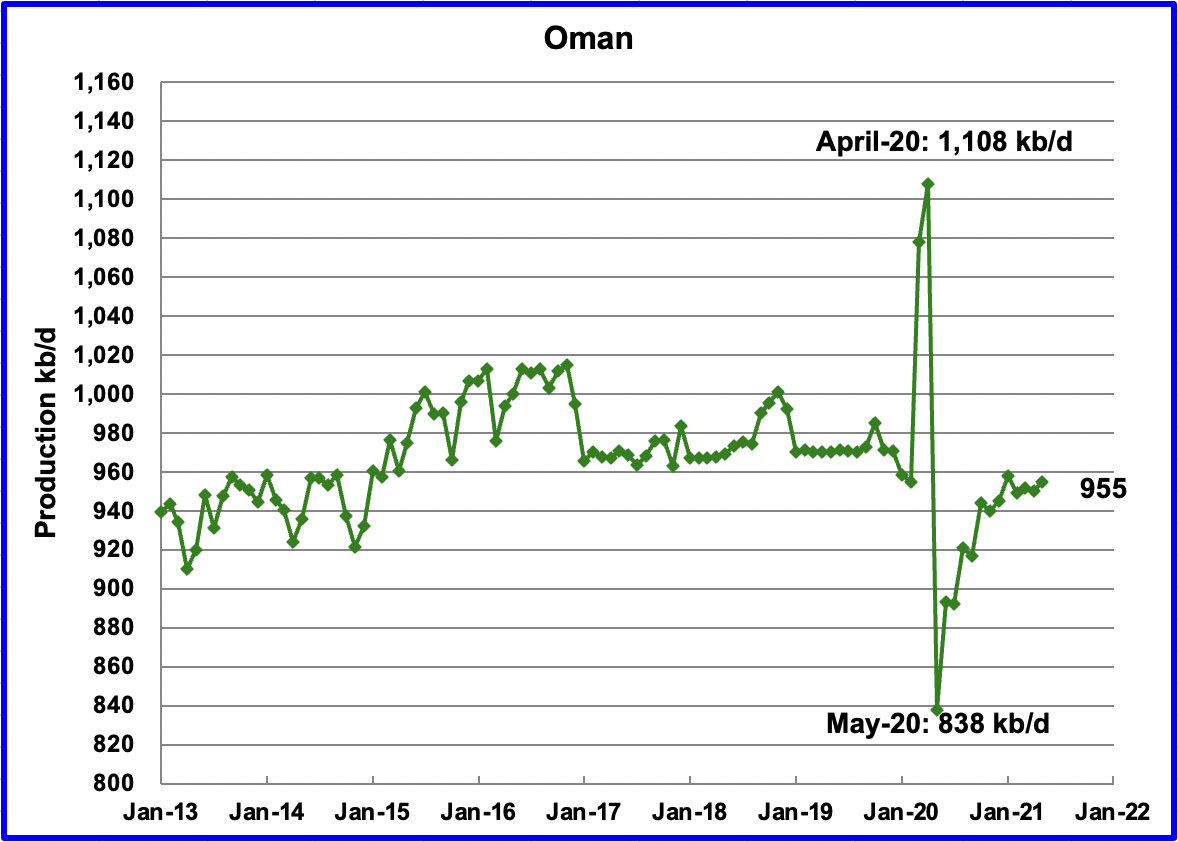
Omanʼs May production increased by 5 kb/d to 955 kb/d.
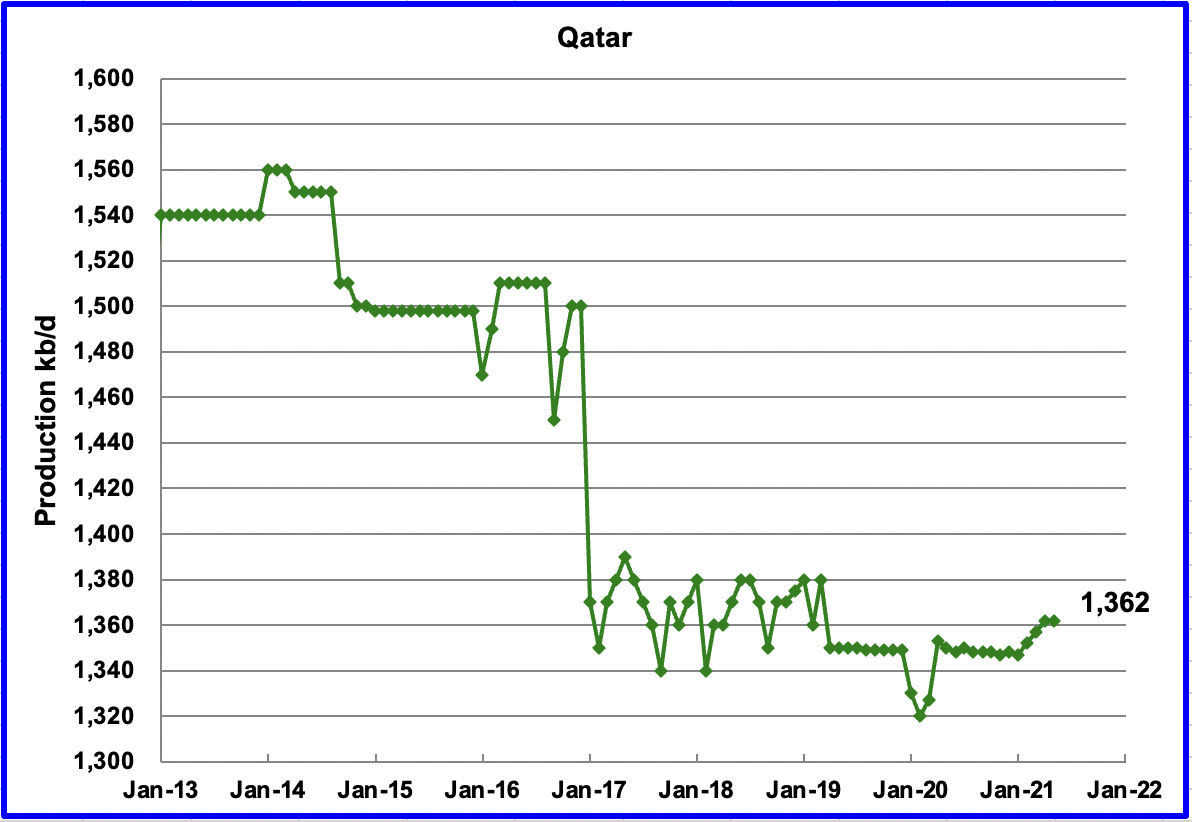
May’s output was unchanged at 1,362 kb/d.
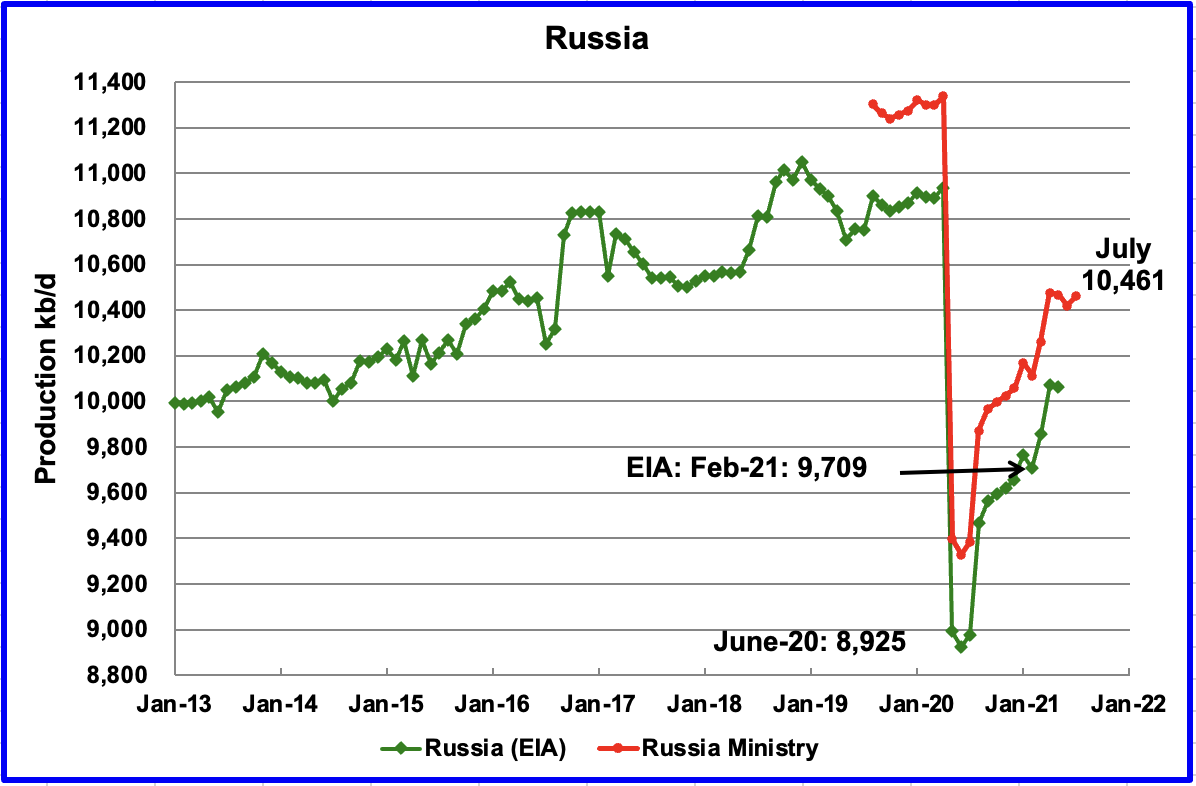
The EIA reported that Russian output decreased by 9 kb/d in May to 10,063 kb/d. According to the Russian Ministry of Energy, Russian production in July was 10,461 kb/d.
According to Reuters, Russian oil and gas condensate output decreased to 10.43 million barrels per day (bpd) in August from 10.46 million bpd in July.
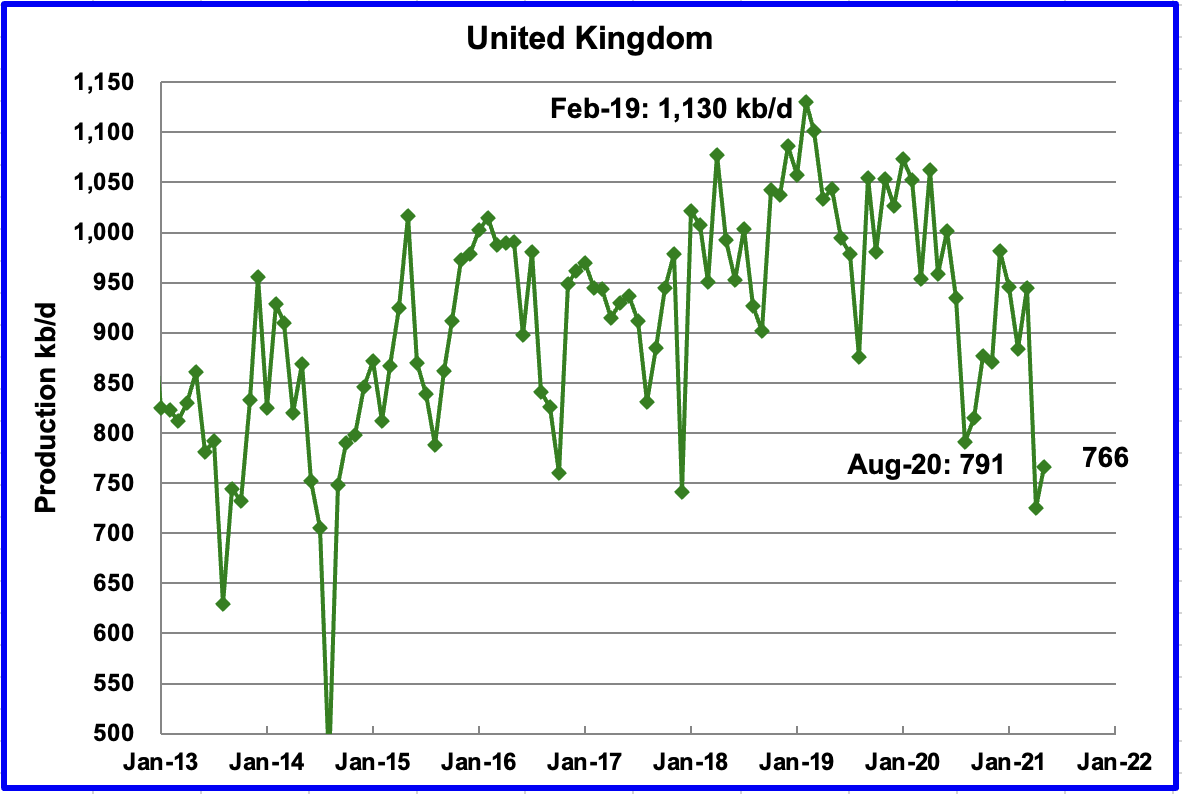
UKʼs production increased by 41 kb/d in May to 766 kb/d.
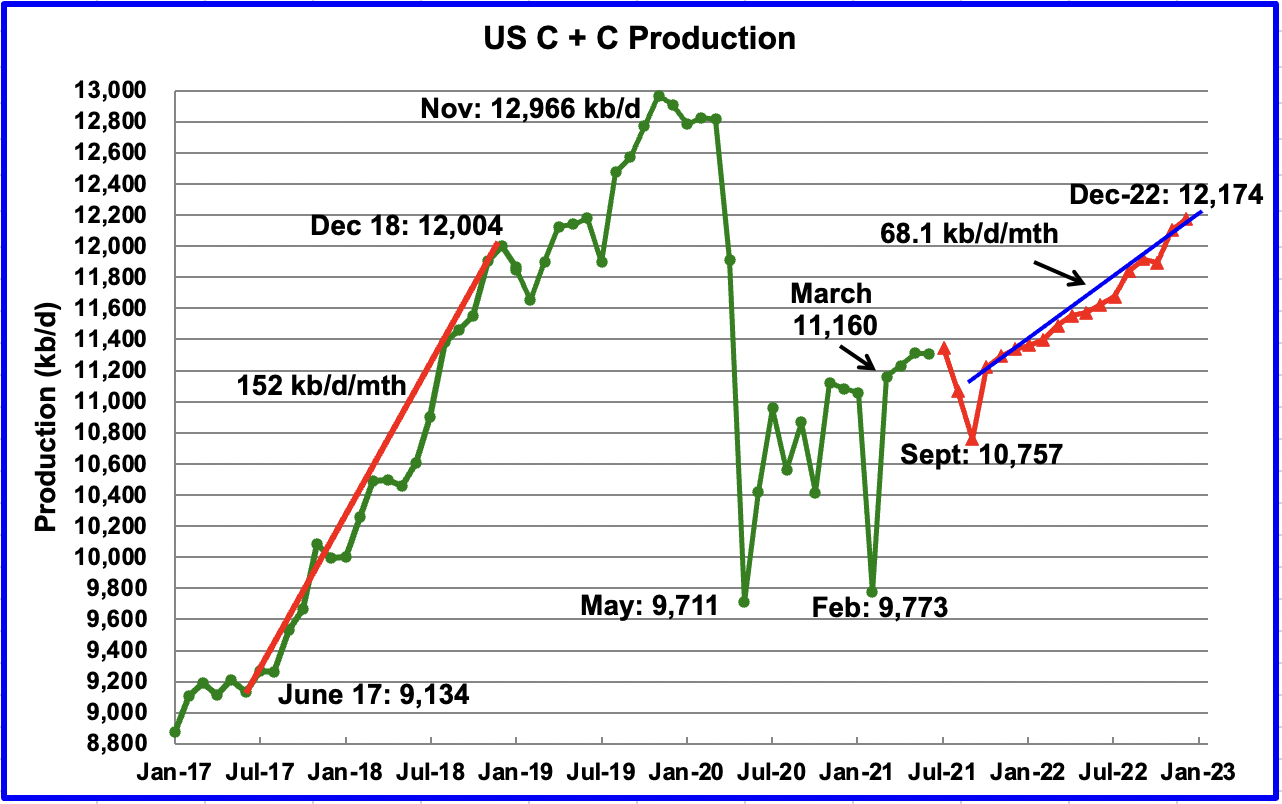
U.S. June production was essentially flat at 11,307 kb/d. The main change in this chart is the September STEO projection, red graph. August and September outputs are forecast to drop. September is projected to hit a low of 10,757 kb/d due to hurricane Ida.
The December 2022 output has also been revised down by 57 kb/d from 12,231 kb/d to 12,174 kb/d. The expected monthly increase in US production from October 2021 to December 2022 is now 68.1 kb/d/mth, down from 72.8 kb/d/mth. It is still not clear where this increase will come from. This monthly rate, if correct, is less than half of the rate in 2017 to 2018 and will be a relief to the OPEC + countries
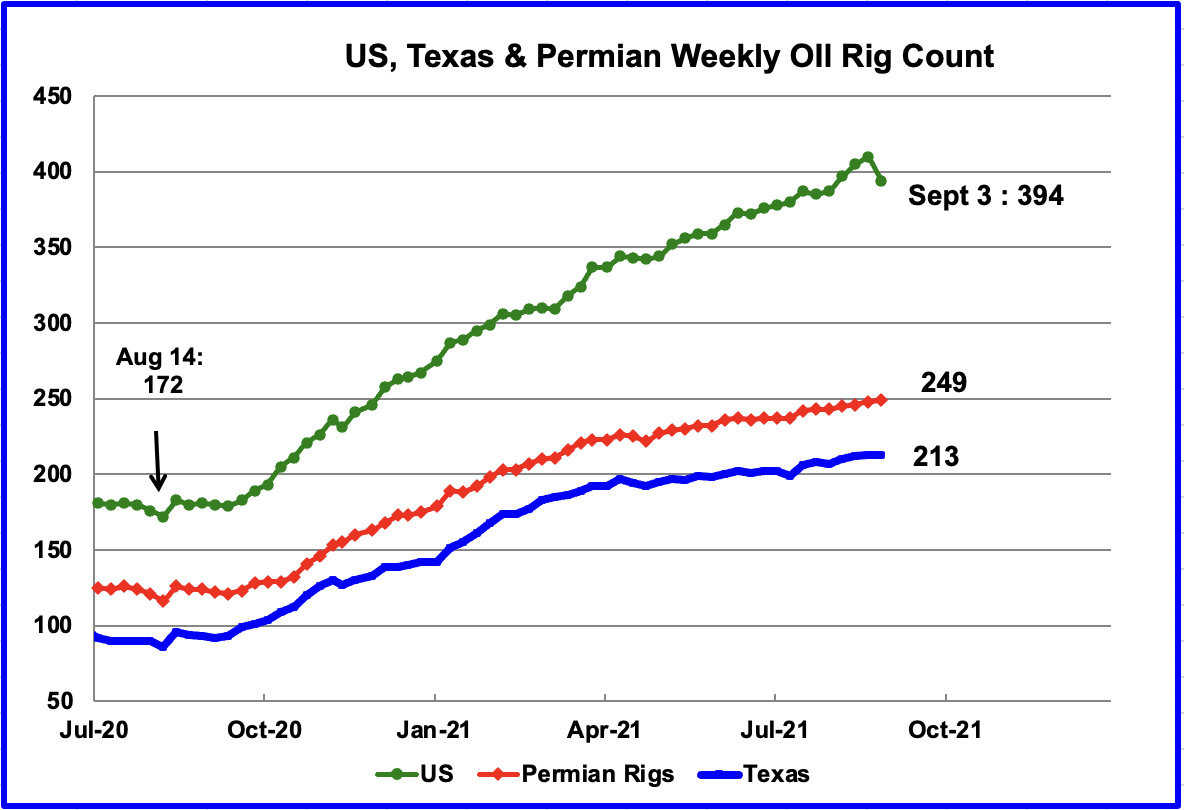
In the week of September 3, the US oil rig count dropped by 16. This was due to 17 rigs being rendered inoperable due to hurricane Ida hitting Louisiana. Interestingly Louisiana had increased their rig count by 3 a few weeks earlier.
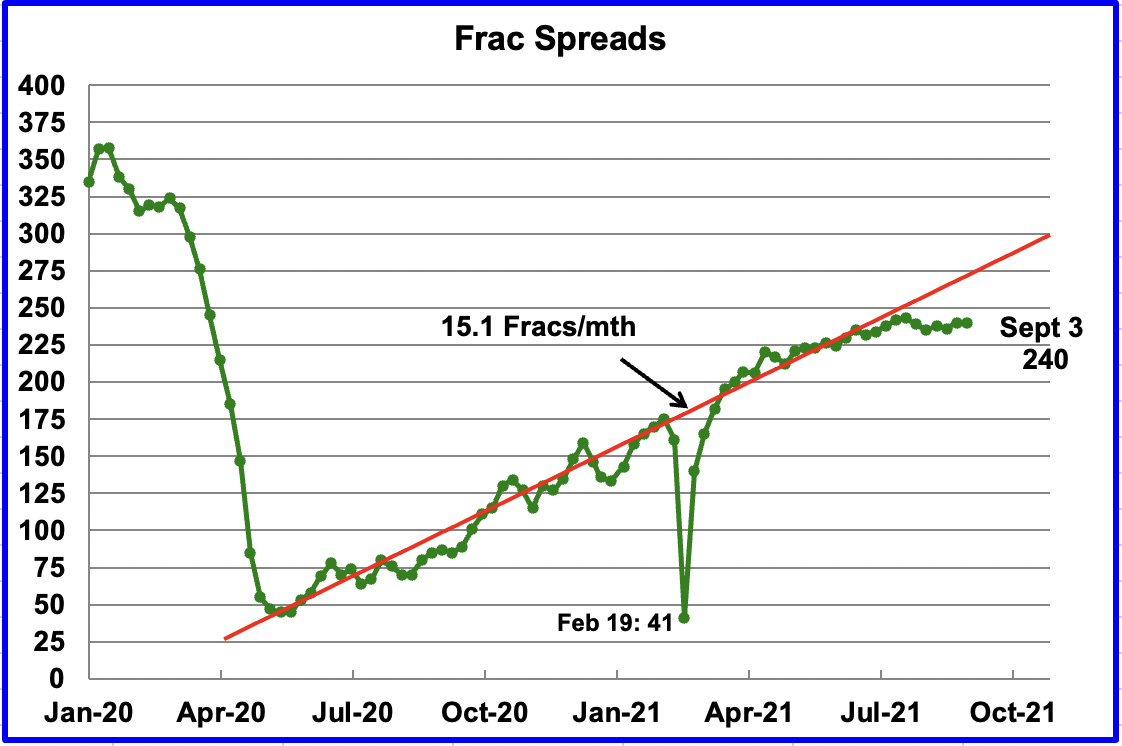
Frac spreads have largely been unchanged at close to 240 since the week of July 9.
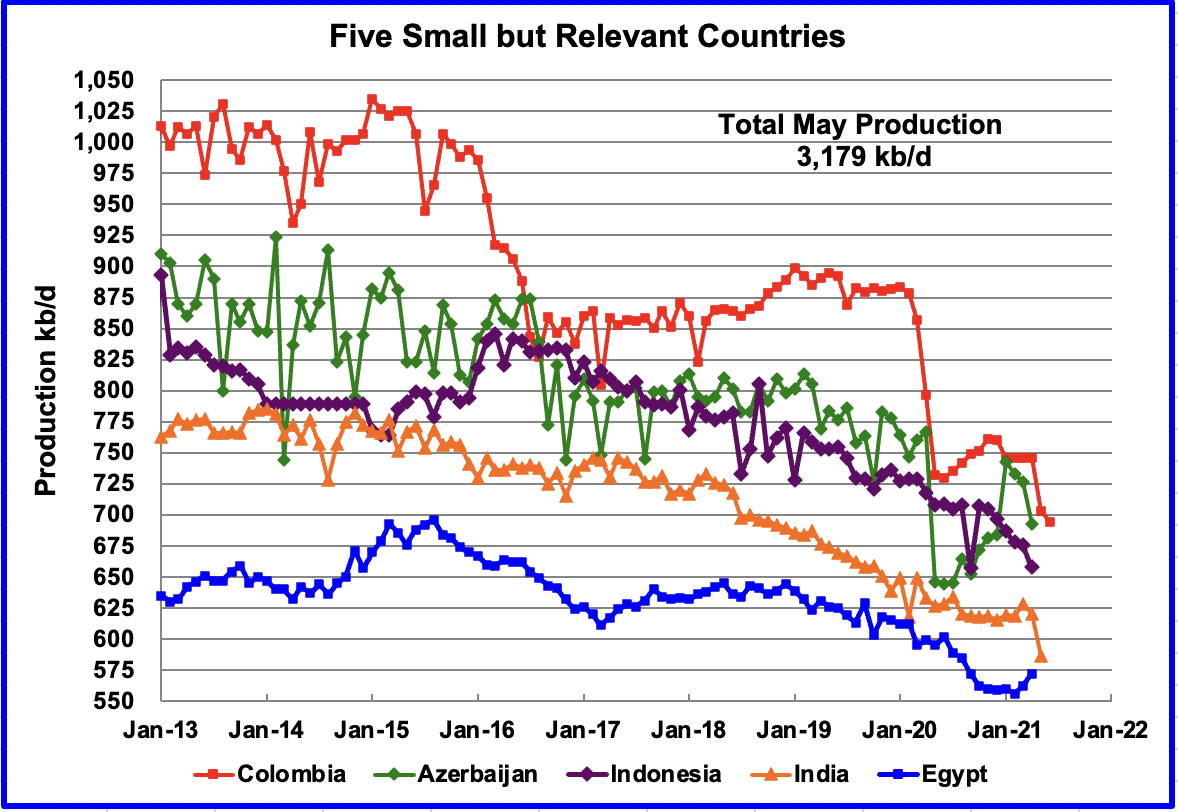
These five countries complete the list of Non-OPEC countries with annual production between 500 kb/d and 1,000 kb/d. Their combined May production was 3,179 kb/d, down by 109 kb/d from April. The drop was largely due to small drops in all five countries, with Columbia being the largest at 42 kb/d.
World Oil Production Projection
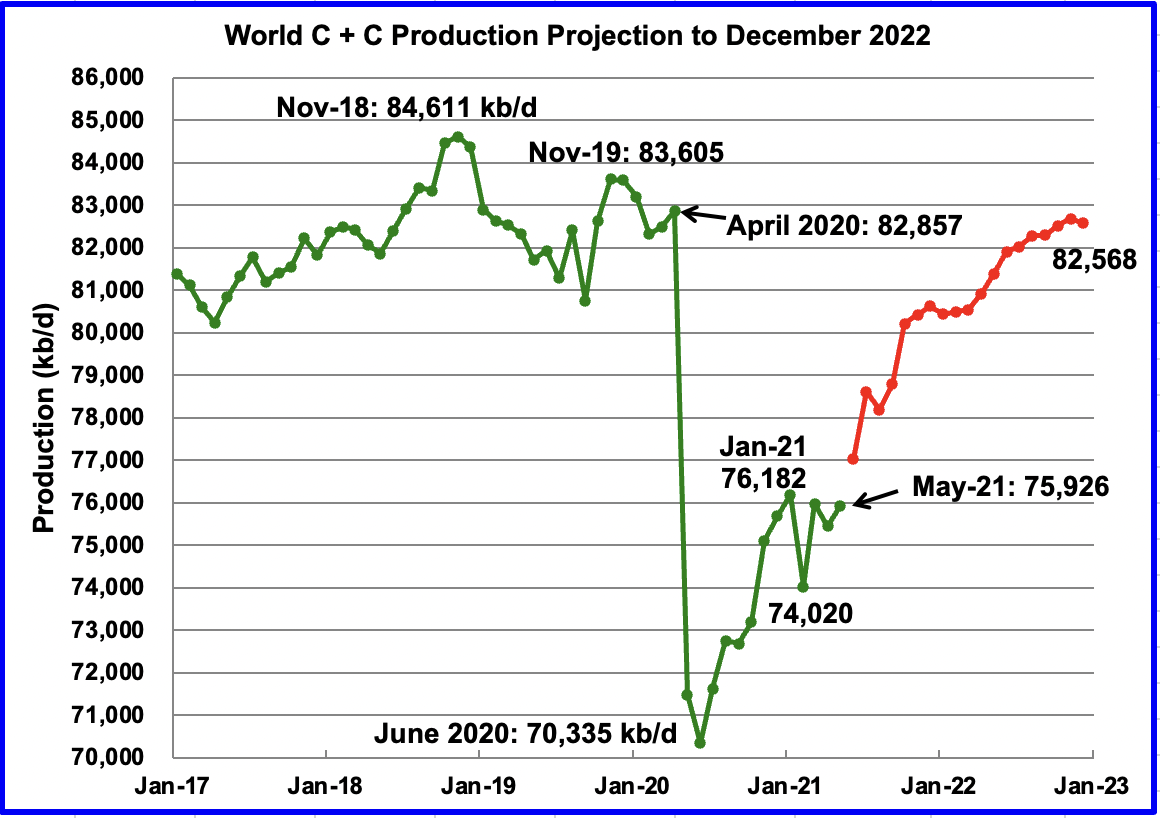
World oil production in May increased by 485 kb/d to 75,926 kb/d according to the EIA. Of the 485 kb/d increase, the biggest contributor was Saudi Arabia, 385 kb/d. There were a number of countries that had smaller increases of less than 100 kb/d, offset by countries with similar decreases.
This chart also projects world production out to December 2022. It uses the September STEO report along with the International Energy Statistics to make the projection, red markers. It projects that world crude production in December 2022 will be close to 82,568 kb/d, 380 kb/d lower than forecast in the previous report.
The current December 2022 forecast is 2,043 kb/d lower than the November 2018 peak of 84,611 kb/d. As best that I can remember, this may be the biggest gap that I have reported.
236 responses to “May Non-OPEC Oil Production Up slightly”
Ovi,
Great Update. Especially, the last chart. Indeed, it does look like Nov 2018 may have been the ultimate C & C production peak. We will see.
And, if we want to look at what I call THE DESTROYER OF CAPEX, let’s look no further than ExxonMobil’s U.S. Upstream Sector. We still enjoy a good laugh that ExxonMobil management stated they could make profits at $30 per barrel in the Permian. Well, if we look at the financials, ExxonMobil is Destroying Capital at a much higher rate than other shale companies.
Thus, ExxonMobil is robbing PETER (International Upstream Sector) to pay PAUL (U.S. Upstream Sector). Again, how much longer will ExxonMobil shareholders continue to watch Good Money be thrown after Bad in the U.S. Upstream Shale Black Hole?
steve
Great Report Ovi. I am still stunned at the production growth in the US. Our small Permian company continues to run two drilling rigs while keeping production flat-ish at 25k boepd. We are cash flow neutral at this rate while suffering some hedging loses at $50 oil. Must be the DUCs that are providing most of the production increases. I suspect we would be cash flow positive if we were not hedged. It is also interesting to see how Exxon continues to lose money as well but stays committed to the shale. Perhaps they are planning on higher prices coming down the pike.
I am still stunned at the production growth in the US.
I have no idea what you are talking about.
Ron,
Agreed. Maybe this OPEC vs NON-OPEC & U.S. Shale Decline Rates puts it into perspective the BIG PROBLEM ahead for the global oil industry.
You will notice that NON-OPEC Decline rates have been increasing at a healthy rate. But, when we factor in U.S. Shale Oil Annual Decline Rate at 48%, well then, we have arrived at the SENECA CLIFF.
How in the living Hell do you Offset Global Oil Production declines with a 48% Annual Decline Rate?
Maybe we can ask the Russians if they can help us with that ULTRA-DEEP ABIOTIC OIL. 🙂
steve
Ron,
LTO survivor has wells in the Permian basin. I think he was referring to growth in output there.
In the past 12 months Permian basin output (from tight oil estimates by play) has increased by 830 kb/d. Since Nov 2020 the increase in Permian basin output is 539 kb/d.
Ron,
The numbers were revised for the most recent report with data through July 2021. Output on the Permian increased by only 360 kb/d from Nov 2020 to July 2021. I made a mistake on the previous comment, used wrong column from spreadsheet. For past 12 months the increase was 354 kb/d, only about 29.5 kb/d increase each month on average, for the past 4 months the average rate of increase in Permian has been 42 kb/d each month, at an annual rate (if the rate of the past 4 months continues for a 12 month period) this would be about a 12% annual rate of increase.
Thanks Ron. I meant to say that I am stunned at production growth in the Permian.
Thanks LTO
Steve
I wonder how much of that International Capex is being spent in Guyana this year. The reward comes in a few years. They are doing a lot of drilling and have had some good hits and a few dry ones. I guess they have to borrow to make up the difference. According to this article revenue from Guyana is set to increase next year as production ramps up.
“IRVING, TEXAS – ExxonMobil reported a discovery at Whiptail in the Stabroek Block offshore Guyana. The Whiptail-1 well encountered 246 feet (75 meters) of net pay in high quality, oil-bearing sandstone reservoirs. Drilling is also ongoing at the Whiptail-2 well, which has encountered 167 feet (51 meters) of net pay in high quality, oil-bearing sandstone reservoirs. Drilling continues at both wells to test deeper targets, and results will be evaluated for future development.
The Whiptail discovery is located approximately 4 miles southeast of the Uaru-1 discovery that was announced in January 2020 and approximately 3 miles west of the Yellowtail field. Whiptail-1 is being drilled in 5,889 feet (1,795 meters) of water by the Stena DrillMAX. Whiptail-2, which is located 3 miles northeast of Whiptail-1, is currently being drilled in 6,217 feet (1,895 meters) of water by the Noble Don Taylor.
“This discovery increases our confidence in the resource size and quality in the southeast area of the Stabroek Block and could form the basis for a future development as we continue to evaluate the best sequence of development opportunities within the block,” said Mike Cousins, senior vice president of exploration and new ventures at ExxonMobil.
ExxonMobil envisions at least six projects online by 2027 and sees potential for up to 10 projects to develop its current recoverable resource base.
The Liza Destiny floating production storage and offloading (FPSO) vessel is currently producing about 120,000 barrels of oil per day.
The startup of Liza Phase 2 remains on target for early 2022, and the Liza Unity FPSO expects to sail from Singapore to Guyana in late August 2021. The Unity has a production capacity of approximately 220,000 barrels of oil per day.
https://www.worldoil.com/news/2021/7/28/exxonmobil-tallies-another-significant-oil-discovery-offshore-guyana
Ovi,
Agreed about the Forward-Spending CAPEX on Guyana. However, that would make the situation for ExxonMobil’s U.S. Upstream Sector even worse… no? Gosh, if ExxonMobil is investing a lot of its International CAPEX in Guyana for future revenues-earnings, then I’d imagine it’s making the U.S. Upstream Sector look much better than it really is…. CAPEX to EARNINGS RATIO, that is.
As I have stated, it seems that many of the bigger players in the Permian have now switched to 40-45 Stage Fracks with over 20 million pounds of sand, being pumped down 15K Well-heads. Heard from a Tech at Schlumberger that the internals of these 15K wellheads were getting sandblasted to hell due to the high pressures and the massive amount of sand being pumped through them.
SHALE IRONY: Technology Meet Sand Blasting on Steroids.
steve
Thanks for all the great work Ovi.
Schinzy
Much appreciated.
Ovi , what would we do without you ? Probably tweedle our thumbs . 🙂 . Tks to all you guys who make these fantastic posts along with graphs etc . No exceptions in spite of differences on issues . Keep hitting the homers .
Biden’s Call for More OPEC Oil Is Still Bugging Shale CEOs
(Bloomberg) — Cimarex Energy Co. Chief Executive Officer Tom Jorden on Wednesday became the latest to bristle at President Joe Biden’s call for more oil production from OPEC, rather than from homegrown shale companies like his.
So little oil production growth is expected in the U.S. that the world’s top providers of drilling and fracking services are reorienting their businesses around overseas customers and pivoting away from North America. Despite a strong recovery in crude prices in 2021, the shale industry is largely resisting a repeat of previous boom cycles when it added new supply and contributed to a global glut.
“So little oil production growth is expected in the U.S”. This statement is very different than the EIA’s forecast starting in October.
Why does CEO Jordan need Biden to ask for more oil. Just go ahead and produce or is he really saying that he needs some incentives to produce more?
https://www.bnnbloomberg.ca/biden-s-call-for-more-opec-oil-is-still-bugging-shale-ceos-1.1649492
Ovi,
No worries, because according to Biden, the United States will increase Solar PV power to nearly 50% of Electricity power by 2050. Thus, we won’t have to worry about messy oil and all that fossil fuel stuff anymore.
We are just going to power everything with Electricity and Free Energy. 🙂
https://www.washingtonpost.com/climate-environment/2021/09/08/biden-solar-climate-change/
steve
You will be fine Steve, next month Exxon going to run 50% off blacksmith work. You can still get Dusty some new shoes for safe travels on the trail.
For the rest of us, Lyriq will define the future, coming early 2022
What is lyriq? Electric Cadillac?
shallow sand,
Correct, a caddy EV SUV crossover. Not available yet, expected in late 2022.
https://www.cadillac.com/electric/lyriq
Hunt,
What a pleasure to receive a response from you. Was wondering where you have been.
I am not worried about ExxonMobil. I don’t have any SKIN in the company. But, that may be a different story for shareholders dreaming of Dollar signs and Sugar Plums dancing in their heads.
Regardless… let’s enjoy viewing the SHALE BLACK HOLE through our telescopes while it’s still is around.
Also, I got my dibs on Musk’s newest Flying Electric Car powered by Clean Green Energy.
steve
Shale must be the high cost marginal producer. As demand increases, I don’t expect the majors to increase much capex in the Permian until the Middle East is back to pre-covid production and $100 plus WTI. We are already over $4 a gallon here. I don’t think anything under $6 will slow down the consumer here. There is a street 3 minutes walking distance from me that has 13 homes on it and there are 6 Tesla’s parked on the driveways.
There are three Tesla’s registered in my county of about 20K.
How many people still haven’t gotten a COVID shot?
I am not sure I can tell what is rational and irrational behavior these days.
From Our World in Data
Ca 56.7% fully vaccined
Tx 48.5% fully vaccined
Orange county 60.48% fully vaccined or 1,913,000 people
Shallow sand,
In 2020 about 1.7% of new cars and light trucks were EVs in the US, total new cars and light trucks registered were about 14.5 million with 254 thousand new EVs registered in 2020. About 79% of all new EVs registered in the US in 2020 were Teslas (200691).
Hunt,
While shale is the high-cost marginal producer, the Fed is the marginal buyer of last resort of Treasuries & Bonds. I am surprised that most Americans think this sort of activity is sustainable over the long run.
Furthermore, I am putting together an Energy Powerpoint Presentation for a Financial Group. In that presentation will include how Oil production growth, not the Fed, pulled the U.S. out of the 2008 Financial crisis. The same was true for the 1930s Great Depression and winning WW2. All due to oil production growth.
This sort of Oil Magic will not happen again. We just ran out of Shale Magic Fairy Dust.
While it’s neat and nifty to have so many Tesla’s in walking distance from your home, let me know what that looks like in say 5-10 years.
steve
I will agree with you about oil production being a major factor in pulling the economy out of 2008. Millions of jobs putting money which was being sent out of the country, got put into American workers pockets. I think you have it ass backwards in the 1940 era. Oil production growth was a result of WWll. Oil was in short supply and rashened because of the war. Women went to work because of a shortage of male labor. Government demand grew GDP, which needed oil to power it.
As long as technology advances keep inflation at bay. The Fed can play loose and free with rates and it’s employment mandate. The Fed doesn’t dig holes, they bring together the capital to do the job. It’s a lot easier to keep the airplane in the air. Than put it back in the air after it crashes. I’m sure there will be a day of reckoning.
You know fossil fuel is finite. Substituting is the only energy option. Your going to get a hole in your shoes dragging your feet. The Permian is the gift to make a transition. Let’s wait until the fat lady sings.
Steve, We are in agreement on the idea that there will be no new big pond of oil to come to the rescue, and depletion will be the trend from about now and going forward- indefinitely.
I ask you- in this scenario, isn’t it better to have an alternate mechanism to continue getting around?
In 10 years everyone who has a plug-in vehicle will still have affordable mobility.
Will we be able to say the same for those with petrol fueled vehicles?
I’m talking globally- not everyone has a Ghawar or a Permian within their borders. Importers are going to be in a huge battle for the remaining available exports.
Coal to liquids.
Coal to liquids.
Ha ha ha ha.
Plenty of well paid jobs in building and running those plants.
But those coal reserves you thought you had will only last half as long.
David,
with all due respect for someone who supposedly has a pretty good head on their shoulders, for you to blurt out “Coal to Liquids” and then hahaha…
My gosh, have you seen the Full Cycle EROI on Coal to Liquids? Have you seen the massive coal waste that comes from just transitioning to 2-5% of liquid fuels?
This is typical of the regurgitating a seemingly easy solution by “PLUG AND PLAY” coal to liquids… LOL.
If supposedly intelligent people are making these sorts of comments… no wonder we are going to head over the ENERGY CLIFF… DEATH, DUMB, BLIND… and STUPID.
Nothing personal, just the facts…
steve
Dearest Steve,
I am coming up on having served 50 years in the oil industry, on and off. My first job was a juggie on a seismic crew in 1974 out in the desert, living in tents and for lunch we would bash a can of food open on the corner of a Landcruiser trayback. You didn’t know what was in the can because the label had worn off on the way out to the desert.
When oil supply starts declining the price is going to run and run. Energy poverty is real poverty. Most of the functions provided to western civilisation now by coal can be provided by nuclear. And coal can go off to coal-to-liquids until coal runs out and we have to start using biomass to make synthetic liquid fuels. Right at the moment we are creating biomass in the US to burn in a power station in the UK, so biomass as a feedstock for synthetic fuels might do a lot. In the long term our standard of living will be determined by the cost of producing hydrogen from electrolysis using power from nuclear reactors. Carbon will be the means by which that hydrogen can be usefully handled, by enabling the production of a fuel that is liquid at standard temperature and pressure. The sooner we start using hydrogen from nuclear-sourced energy, the better as we can conserve all our carbon sources so they can be converted to liquid fuels, and plastics and fertiliser and all the other things that oil currently does. That includes nuclear power plants to provide heat and hydrogen to the Canadian tar sands for a starter.
David , your latest post is not worthy of your experience .
1. No more nuclear . NIMBY prevails except in China .
2. If we start creating biomass for fuels then where do we go creating (growing) our food > We are loosing top soil and agriculture land year over year .
3. Energy poverty is real poverty . You are correct . That is where we are headed . Be prepared .
4. Hydrogen economy has been debunked so many times that I will not even mention it .
Heck , shale will end up loosing at least a trillion and trillions was printed to get it going . Now you expect to start up the printing presses again to trigger another project which is even worse placed .
Too much hopium and pie in the sky thinking . Not expected from someone with your background . Disappointed .
Reluctantly I must do a copy paste of Steve’s comment
” If supposedly intelligent people are making these sorts of comments… no wonder we are going to head over the ENERGY CLIFF… DEATH, DUMB, BLIND… and STUPID.”
Steve, since you don’t seem to be keeping up with the light vehicle transport sector very closely, consider this-
I have a midsize all-wheel drive vehicle in my driveway (wifes car) that goes 100 miles distance on just about $1.08 of electric charge. And we charge it right in the driveway at the national average electrical cost of 11cents/kWh, which is the same for our particular state. She drives quite a lot for her work, and never goes to gas station anymore.
Its a great thing for this country to have this new option for transport, with such low operating cost/mile.
You might want to call it Jetsons, but no- this vehicle stays on the road. Its acceleration torque will pin you hard to the seat if you want to.
Its the real deal, and in another 5 years it will obvious to even those who have tried to ignore the sector.
How far does your vehicle go on $1.08?
She drives quite a lot for her work, and never goes to gas station anymore.
And how long does it take to plug it in at night? I mean, compared to driving to a gas station and pumping…
1-2 minutes.
It would interesting to actually clock it. I would have guessed that it was much shorter, but it certainly depends on your setup.
Hi Nick,
Range anxiety has been much hyped. I’ve owned an EV for over 3 years without being really concerned about not having enough juice. It takes me 20 seconds to either plug or unplug my EV. I recharge at 5 miles per hour using 120 V household current at 12 A. If I was concerned about not having enough juice at any point in those 3 years, I would have installed a 220 V 16 to 32 A home charging station and recharge at a maximum of 25 miles per hour. Yes, it costs money but if I am driving that much, the difference between $3/gal in a 40 mpg ICE and 120 mpge in an EV would pay for a charging station in less than 2 years.
In the above example and burning 10 gallons of gasoline, it would cost me $30 to go 400 miles. In an EV, $30 worth of electricity at $0.10 per kwh (300 kwh at 4 miles per kwh) would propel my EV 1200 miles. To do 1200 miles in an ICE, I would have to spend another $60. If I drive 12,000 miles per year, that’s a $600 saving that I could put toward a charging station. Installed, they are generally less than $800. So in less than 2 years, I’ve recouped my investment and can put the difference to paying down a loan or saving for a trip.
Hickory,
I do keep one eye on the EV sector. However, while it does provide an alternative for some, it won’t for many. This is the problem with scaling up EVs.
The world has slapped itself on the back for adding 5,300 TWh of Wind & Solar over the past twenty years. However, Oil-Natgas-Coal energy consumption has increased 42,500 TWh over the same period. Thus, the world added 8 Times more Fossil Fuel Energy consumption compared to Wind & Solar.
Now, let’s see if we can add that much more Wind & Solar with falling Fossil Fuel production.
steve
20 years isn’t an objective time frame. How about the last 2 or 5 years. That would be more current to today’s cost of solar installation.
Not objective.
https://www.salon.com/2021/09/09/gavin-dont-surf-the-california-recall-election-on-the-ground-in-orange-county/
I lived in Huntington Beach in 1967.
It was a bit different.
Of course, Dana Point had 400 people then.
And of course Huntington had The Golden Bear
https://en.wikipedia.org/wiki/Golden_Bear_(nightclub)
Steve,
Not clear that fossil fuel output will fall before 2030 and perhaps not until 2035 unless demand for fossil fuel falls, which it may as renewable power continues to grow at 15% or more per year.
Also for thermal power, only 40% of fossil fuel primary energy gets converted to electricity so 100 EJ of fossil fuel is the equivalent of 40 EJ of renewable power from wind or solar.
Renewable power output has doubled in each of the past 5 years. Note also that fossil fuel has a lot of thermal losses, only about 40% of primary energy is converted to useful work.
If we compare 5 year average annual growth rates of exergy for fossil fuel (1.7%/year) and renewable power (17%/year), it becomes pretty clear that renewables will take a big dent out of fossil fuel demand going forward. As fossil fuel depletes and becomes more expensive as a result it will only accelerate the transition to wind, solar, and battery powered land transport.
In 2019 the exergy of all fossil fuel consumption in exajoules was about 198.5 EJ (in 2020 it decreased, 2019 was the peak year), if renewables continue to grow at 17% per year the electrical output by renewables will be 54 EJ in 2030, an increase of 43 EJ over that 10 year period. If fossil fuel exergy use grows at the annual rate of the past 5 years (1.7%/year) we would see an increase of only 36 EJ, so fossil fuel exergy demand would fall by 7 EJ (about 3.5% of the 2019 level).
If we further assume the growth rate for renewable power drops to 10%/year from 2030 to 2040, then pewr from renewables increases by 87 EJ while fossil fuel exergy demand grows by only 43 EJ, so another 44 EJ bite out of fossil fuel demand, for a 20 year total reduction of fossil fuel exergy demand by 44 plus 7 or 51 EJ. That is 26% of 2019 fossil fuel exergy use.
If the 10% growth rate of renewables continues to 2049 and fossil fuel exergy demand were to have continued the 1.7%/year trend (2014-2019 rate), then all demand for fossil fuel as an exergy source would be eliminated by 2049. No doubt some demand would remain as raw material input (fertilizer and steel) and some energy uses such as farming, air transport and water transport.
Not clear that fossil fuel output will fall before 2030 and perhaps not until 2035 unless demand for fossil fuel falls,
Well, there are basically three types of fossil fuels, coal, gas, and oil. And they are, for the most part, all three used for different functions. So I really don’t see how you can lump them all together.
Incidentally, the USA and the European Union have reduced their coal consumption while China has increased theirs. China now consumes more coal than the rest of the world combined. See chart at this link:World coal consumption, 1978-2020
One has to wonder how much longer the Chinese can continue mining as much coal as the entire rest of world, from a reserve base half that of the US. They would appear to me to be strong candidates for some sort of catastrophic energy crisis within the next decade.
Tony H , bullseye . China miracle was cheap labor , cheap land , cheap coal = cheap electricity and unlimited pollution . All 4 elements are exhausted and so is the Chinese economy . The unravelling has begun with the Ever Grande episode . Grab some popcorn .
Ron,
Steve lumped them together.
See
https://peakoilbarrel.com/may-non-opec-oil-production-up-slightly/#comment-725073
Generally from the perspective of climate change they all contribute to carbon emissions and all provide energy. As we move to electricity for transport oil will become less important and as wind and solar ramp up, coal and natural gas will become less important.
My response was to Steve’s comment which clearly lumped fossil fuels together.
Ron,
I’d imagine you realize that a large percentage of Coal & Natural Gas production comes as a result of Oil Production… correct?
While we did enjoy significant coal production-consumption in the late 1800s and early 1900s, we can thank petroleum for extracting and transporting a lot of this coal presently. Sure, some countries like Germany use electricity to extract coal, but most are powered by diesel equipment and transportation.
Unfortunately, we still don’t have long enough EXTENSION CORDS for Trains, Boats, Barges, or Ships. But, who knows, maybe a bright enough engineer in here could figure that one out.
So, when we head over the OIL ENERGY CLIFF, then by gosh, we will also experience a COAL & NATURAL GAS ENERGY CLIFF soon thereafter.
But, maybe if we can get those Space Aliens and Russian ULTRA-DEEP ABIOTIC OIL to help us out with energy, then we can continue being an excellent example of a species to the Universe by continuing our religious rituals of going to Starbucks, Walmart & Walt Disney.
steve
‘Unfortunately, we still don’t have long enough EXTENSION CORDS for Trains, Boats, Barges, or Ships. But, who knows, maybe a bright enough engineer in here could figure that one out.’
Why not capsule pipelines for transportation of physical goods? Basically, polymer lined steel capsules, maybe 1-2m in diameter, containing physical goods, with the capsules ballasted to be neutrally buoyant in water. These could be transported through water pipes, using electric power to pump the water, carrying the capsules along with the flow.
Probably quite a slow means of transportation, but energy costs would be lower even than rail and energy can come from direct electric. The drag between the water and the wall of the pipe, scales with the square of velocity. Assuming that wind turbines provide the pumping power, flow speed would vary according to the square root of power, so fluctuating power would result in only modest changes in delivery times.
Pipelines are the cheapest way of transporting bulk liquids. Using capsules, solid goods can be transported as well, without a drop of diesel. They would probably be best suited for shipping goods between nodes, serving a surrounding area. Short range electric or compressed air powered vehicles, with range of a few tens of km, could then be used to ship capsules from the node to the surrounding area and vise versa.
The pipes themselves would probably be polymer lined concrete. Pipe runs should be as straight as possible to minimise friction losses and reduce capsule wear by collision with walls. Flow will probably be laminar.
Capsules should be designed to allow them to fit onto rail and HGV trailers, such that they function as standardised container units.
You could even run these pipelines under water, provided that capsules are strong enough to withstand compressive forces from the water head. It should therefore be possible to ship goods between continents, by trailing the pipes along sufficiently shallow areas of seabed. Pipelines could in this way reduce the need for container ships.
Ron —
You are right that coal oil and gas aren’t strictly comparable.
Coal consumption peaked in 2013 and is definitely on a downhill slope. It can’t compete with the flexibility and efficiency of gas, and nothing can compete with renewables on price, since they are zero marginal cost.
Oil is primarily for storing energy in a moving vehicle, and will survive until battery powered vehicles replace the current fleet, which will take time. It is losing out to gas in the petrochemical business.
Gas looks like the winner among fossil fuels in the longer term. It’s primary weakness is that it can’t be transported overseas without liquification, which is expensive.
Steve- totally agree.
Scaling up the electric transport sector is going to be a huge job (huge amount of jobs).
And it will be very challenging to get a chunk of it done before oil depletion hits hard.
I am not optimistic the country or world will get the transition done in any kind of smooth fashion.
Hell, only about half the country has even got a pandemic vaccination, and that has been free.
People walk around as if the brain is starved for oxygen.
I think we will see excellent pricing for the oil industry this decade, as well as continued and growing boom times for the ‘all things electric industry’.
I know you are into the investment side of this discussion- have you watched the electric transport sector? compare Exxon or any of the other oil industry stock performance over this past 5 years to NEE, PWR, ENPH, AMRC,TAN, for example. Not a sector to ignore or dismiss.
Tony H , ” But, who knows, maybe a bright enough engineer in here could figure that one out.’’
Tony , you have already figured it out . Suggest you contact Mr Musk or Mr Branson . They are the only persons who I think are capable of implementing such bright ideas .
Steve-
To compete with EVs, oil needs to get under $20 a barrel. That isn’t anything special about EVs, it simply because oil is expensive compared to electricity.
If we assume you are right that there won’t be enough EVs to go around, then there will be clear winners and losers. Anyone who can’t get EVs won’t be able to compete because their costs will be too high.
That’s what you think now because EVs are very heavily subsidised by the government (society).
What pays for the upkeep and maintenance of roads? The petrol tax does. Don’t the EVs use the same roads and services? They do, but they don’t pay anything now because a tax on every litre/gallon of petrol is enough. But then again, EVs not only pay for the infrastructure they use, but they also get an upfront subsidy on the purchase price. The petrol/diesel vehicles also pay myriad taxes (included in the price of gasoline/diesel) that the govt. uses for other things.
That all is good, but free-ride that the EVs have currently is only going to last until the petrol/diesel vehicles are happy paying more to maintain the infrastructure.
Don’t worry, that is all going to end. EVs have to pay for the road infrastructure they use and pay for everything else that the petrol/diesel vehicles are paying currently. Probably some kind of pay per mile driven will be implemented for EVs – and looking at the taxes the petrol/diesel cars are paying (multiple times the actual price) – the tax on EVs is going to be multiple times that of the cost of electricity. I won’t be surprised if there are additional taxes/duties/charges etc that the EVs have to pay in addition because of the additional load they will put on the electricity grid.
So, you EV guys are being subsidised. You don’t even understand the ways you are being subsidised currently whereas the petrol/diesel cars are being burdened by high taxes/surcharges and are indirectly subsidising you. As the number of EVs on roads increase, be prepared to pay more.
“As the number of EVs on roads increase, be prepared to pay more.”
For the country, it sure beats being reliant on just a depleting energy source. As oil depletes it will get much more expensive.
>What pays for the upkeep and maintenance of roads? The petrol tax does.
Only in America I think. And actually, it doesn’t, that’s mostly a myth. DOTs around the country have been taking money out of other pots for decades. For example, states commonly use federal stimulus money to widen roads. Also states routinely borrow money to build roads and take money from sales tax revenues.
Be that as it may, you can tell electricity is much cheaper than oil because oil is rarely used to generate electricity. It’s too expensive. Islands like Hawaii use diesel because coal is too expensive to ship and handle, but other than that it has been driven out of the market.
EVs are very heavily subsidised
Some EVs have modest subsidies.
Petrol/diesel is far more heavily subsidized. Let’s start first with the substantial pollution for which society pays the healthcare costs (asthma, NOX, etc), and let’s not forget security costs (including trillions for oil wars and enormous standing military, private security costs of the “war on terror”). Then of course there’s climate change, which entails truly massive costs.
What pays for the upkeep and maintenance of roads? The petrol tax does.
As Alimbiquated pointed out, US petrol taxes haven’t covered road costs for quite some time. They pay for a portion of highway costs, but local governments have to pay for the majority of road costs out of their general funds.
And light vehicles don’t cause the majority of road maintenance costs: trucks do. Road wear is a function of weight and pressure, and light vehicles just don’t create the much. So, it’s trucking that is subsidized.
Petrol taxes should be far higher, or EVs should be “subsidized” at a far higher level.
—————————-
Other subsidies are worth mentioning in this context: US SUVs are subsidized by a $25k import tax; both road transport and aviation are massively subsidized by not paying property taxes, while rail pays property taxes.
The fossil fuel industry receives $5.3 trillion a year in government subsidies, despite its disastrous toll on the environment, human health, and other global inequality issues, a new report by the International Monetary Fund (IMF) published Monday has found.
http://www.commondreams.org/news/2015/05/18/governments-giving-fossil-fuel-companies-10-million-minute-imf
August 29 2013
Researchers from MIT’s Laboratory for Aviation and the Environment have come out with some sobering new data on air pollution’s impact on Americans’ health.
The group tracked ground-level emissions from sources such as industrial smokestacks, vehicle tailpipes, marine and rail operations, and commercial and residential heating throughout the United States, and found that such air pollution causes about 200,000 early deaths each year. Emissions from road transportation are the most significant contributor, causing 53,000 premature deaths, followed closely by power generation, with 52,000.
In a state-by-state analysis, the researchers found that California suffers the worst health impacts from air pollution, with about 21,000 early deaths annually, mostly attributed to road transportation and to commercial and residential emissions from heating and cooking.
The researchers also mapped local emissions in 5,695 U.S. cities, finding the highest emissions-related mortality rate in Baltimore, where 130 out of every 100,000 residents likely die in a given year due to long-term exposure to air pollution.
“In the past five to 10 years, the evidence linking air-pollution exposure to risk of early death has really solidified and gained scientific and political traction,” says Steven Barrett, an assistant professor of aeronautics and astronautics at MIT. “There’s a realization that air pollution is a major problem in any city, and there’s a desire to do something about it.”
Barrett and his colleagues have published their results in the journal Atmospheric Environment.
Interesting regarding US air pollution deaths. Globally, about one in five deaths are estimated to be caused or contributed to by air pollution.
To generate the equivalent figure of 200,000 early deaths per year through nuclear accidents, would take something like 20 poorly contained nuclear meltdowns with no evacuations, every single year. The US had one nuclear accident over 40 years ago, with close to zero radiological consequences. In the decades since then, the American people have suffered at least 10million casualties, the equivalent of a thousand nuclear meltdowns, due to fossil fuel air pollution, all because they were frightened of building new nuclear reactors. Human beings are genuinely stupid. This winter, tens of thousands of people are likely to freeze in Europe, because our leaders failed to make the investment in Nuclear Power that would have kept them warm. The same thing will happen year after year until the morons are removed from power.
Nuclear could work.
But, it’s slower to build, and much more expensive, than wind and solar (even including storage).
I think nuclear is the Betamax of energy (or the CD, for a more contemporary reference): even though it has a theoretical appeal it has been passed by history.
@Nick
There is no storage so far. Not at all – only a few pumped hydro storages designed long ago and a few battery packs only used to flatten net oscillation. Only a few Gwh, not multi TWh necessary only for the 24 hour storage.
Building huge battery packs the next 20 years would also counter bringing trucks, busses and cars to electric ones since battery production can only ramp up slowly. All big battery plans with other technology are still in lab state, or small prototype state.
Nuclear can be ramped up much faster if there would be a will. The most of it is good old steel + concrete technology. Plus the newer high tech part.
Don’t forget if you want to go the pure solar and wind way you have to build huge interconnections, too – to be able to push californian sun to New York or rainy windy east cost weather to California. This is multi megatons of copper or even more high tech (superconductor).
All this goes with a huge increase of mining of necessary raw materials. So an approach would be to build both to be faster. Building the hull of atomic plants – the containment, the generators, the cooling, the control centers ist just a redirection of construction industry – no new industry necessary. Build some less malls and skyscrapers to free the concrete and steel capacity.
100 miles on about 10kWh doesn’t sound right ? Most EV’s get 3 to 4 miles a kwh.
Huntington beach,
Correct the Tesla M3 gets about 4 miles per kWh, so at 11 cents per kWh, it would be $2.75 per 100 miles. Hickory may have been doing a comparison of a car with fuel economy of 40 MPG and the equivalent cost per gallon of gasoline. The Tesla M3 (or MY) would be like paying $1.10/ gallon for electicity compared to a Camry Hybrid (which gets about 40 MPG). I have both a Camry Hybrid and a Tesla M3, so these are real world numbers over 8 years for the Camry, and almost 3 years for the M3.
So for 100 miles the Camry Hybrid uses 2.5 gallons at $4/gallon at a cost of $10/100 miles. The Model 3 uses 25 kWh for 100 miles at 11 cents per kWh or $2.75/100 miles.
Thanks for the reality check HB-
my calculation was just wrong.
We are getting $2.88/100 miles.
For a petrol car to match that with USA average gas pricing on this very day [$3.18/g],
the car would have to get 110 miles/gallon
Thanks for the upadate. ”Kazakhstan’s output increased by 30 kb/d in May to 1,773 kb/d. Will it get back to its pre-covid level which is 200 kb/d higher?” Apparently, no. https://www.upstreamonline.com/production/kazmunaygaz-suffers-oil-production-slump/2-1-1047192
We continue to get mixed messages out of Russia. This is dated three days ago.
Russia to produce 506 mln tonnes of oil 2021, taking into account OPEC + deal 06/09/2021Bold mine
The volume of oil production in Russia at the end of 2021, subject to OPEC + restrictions, may reach 506 mln tons, which is 1% less than in 2020, Russian Energy Minister Nikolai Shulginov told reporters on Thursday on the sidelines of the sixth Eastern Economic Forum (EEF).
At the same time, the volume of processing exceeds the last year’s figure by 2%, Shulginov said. “Oil production is 1% lower than last year. I believe that this trend will continue. By the end of the year, it will be about 506 mln in tonnes. It will all of course depend on supply and demand, and the implementation of the OPEC agreement. The refining will be about 2% higher,” Shulginov said.
In other words, Russia will export less and less oil but consume more and more internally.
China sells oil reserves to lower prices in unprecedented move
China made an unprecedented intervention in the global oil market, releasing crude from its strategic reserve for the first time with the explicit aim of lowering prices.
Another OPEC estimate for August Production
In late August, Reuters reported: “The Organization of the Petroleum Exporting Countries has pumped 26.93 million barrels per day (bpd), the survey found, up 210,000 bpd from July’s estimate. Output has risen every month since June 2020, apart from in February.”
In early September Bloomberg reported: “Output from OPEC’s 13 members averaged 27.11 million barrels a day in August, according to the survey. Saudi Arabia increased by 200,000 barrels a day to 9.63 million, while Iraq ramped up by 110,000 a day to 4.08 million. Both countries were roughly in line with their new, higher targets.”
Today S & P Global Platts reported:
OPEC’s 13 members pumped 26.97 million b/d in the month, a rise of 140,000 b/d from July, while nine non-OPEC partners led by Russia added 13.29 million b/d, a drop of 90,000 b/d, according to the latest S&P Global Platts survey. (Very close to initial Reuters estimate)
The combined output of 40.26 million b/d marks the sixth straight month the alliance has stepped up production. But it could have been more in August.
The current OPEC supply accord calls for monthly 400,000 b/d increases in the group’s collective quotas, as it aims to capture the global economic recovery from the pandemic.
Iraq, Russia, Saudi Arabia, and the UAE were the largest gainers in the month, but Kazakhstan underwent major field maintenance that saw its output decline, and Nigeria suffered a significant oil spill near a key export terminal that shut in production.
Several other members continued to pump below their allocations due to a lack of spare production capacity.
Libya, which is exempt from a quota under the deal, also had a field outage.
Russia, the main non-OPEC participant, surged its production by 130,000 b/d to 9.77 million b/d, the survey found, as domestic deliveries rose. That is above its quota of 9.60 million b/d.
Kazakhstan undertook maintenance at its Tengiz field, and as a result, its output fell to 1.30 million b/d in August, according to the survey. The maintenance is scheduled to end in mid-September.
Million b/d of CRUDE
OPEC-10 AUGUST CHANGE JULY QUOTA
Iraq 4.10 0.11 3.99 4.061
UAE 2.78 0.06 2.72 2.765
Saudi Arabia 9.57 0.09 9.48 9.600
TOTAL 10 22.81 0.20 22.61 23.286
TOTAL OPEC 26.97 0.14 26.83
Russia 9.77 0.13 9.64 9.600
Kazakhstan 1.30 -0.18 1.48 1.491
https://www.spglobal.com/platts/en/market-insights/latest-news/oil/090921-opec-crude-output-up-slightly-in-august-hampered-by-outages-s-p-global-platts-survey
Russia, the main non-OPEC participant, surged its production by 130,000 b/d to 9.77 million b/d, the survey found, as domestic deliveries rose. That is above its quota of 9.60 million b/d.
Russia’s August oil, gas condensate output fell to 10.43 mln bpd Bold Mine
MOSCOW, Sept 2 (Reuters) – Russian oil and gas condensate output decreased to 10.43 million barrels per day (bpd) in August from 10.46 million bpd in July, according to Reuters calculations based on an Interfax report citing energy ministry data on Thursday.
Total oil and gas condensate production was 44.09 million tonnes, Interfax reported, versus 44.24 million tonnes in July. The ministry does not provide a breakdown for the production of oil and condensate, a type of light oil.
The Ministry hasn’t updated its web page for August yet. It is usually out by this time. I have seen it as early as the 2nd day of the month.
https://minenergo.gov.ru/en/activity/statistic
More speculation on Russia from oilprice:
https://oilprice.com/Energy/Energy-General/How-Much-Oil-Is-Russia-Really-Pumping.html
Time will tell!
Great article Stephen, thanks. There are some interesting stats coming out concerning Russia in the latest OPEC MOMR. Dennis will have an OPEC report coming out soon and I will comment on it then. But it is a real eye-opener.
Ron,
expected news from Russia:
Average daily production of oil and gas condensate in Russia from September 1 to September 15, 2021 amounted to 1.458 million tons. The indicator increased by 2.3% versus the August level.
Russia cuts production under the OPEC + agreement. But from January it can increase it as part of a gradual easing of restrictions. So, in January, the agreements allowed the Russian Federation to increase oil production by 125 thousand barrels per day (b / d), in February-April – by another 130 thousand b / d per month, in May-July – by another 38 thousand b / d. / s per month. In August and September, Russia increased production by 100 thousand b / d per month in accordance with the agreements in OPEC +.
In total, since the beginning of January, Russia has increased oil production by 6.3%, when the average daily oil production was 1.371 million tons. In September, according to the terms of the deal, Russia should produce no more than 9.704 million barrels per day of oil (gas condensate is not taken into account), TASS reports.
If we translate the Russian statistics on oil production from tons to barrels according to the coefficient adopted for Russian Urals oil – 7.33, then the average daily crude oil production in Russia in mid-September amounted to 10.687 million barrels against 10.05 million barrels in December 2020. At the same time, gas condensate is not taken into account in the OPEC + deal, and Russian statistics do not disclose separately the production of oil and condensate.
Russia produces on average 800-850 thousand bpd of gas condensate per month.
California Seeks to Avert Blackouts by Burning More Gas
California is asking the federal government to declare an “electric reliability emergency” so the Golden State can lean more heavily on fossil fuels to avoid blackouts.
The state’s main grid operator wants the U.S. Department of Energy to suspend air-pollution rules for some natural gas-burning power plants in case their output is needed “to meet demand in the face of extremely challenging conditions including extreme heat waves, multiple fires, high winds, and various grid issues,” according to a filing. The last time California received a waiver of such length and breadth was 21 years ago during the Western Energy Crisis.
While the cost of green energy keeps falling, has anybody looked at adding in the cost of keeping a backup system?
Ovi,
California needs major grid upgrades, this is true of much of the US which has done a very poor job of maintaining infrastructure.
As wind and solar power expand, less backup will be needed, I imagine utility companies and electricity suppliers have looked at this question. Much of the backup is already in place, those comanies that keep these facilities operational will receive a premium price when the electricity is needed, probably about 5% of average load will be needed for backup in a worst case scenario once a renewable system is fully built out. Only a portion of this will need to be from fossil fuel, some will be battery, some pumped hydro, smome can be provided by synthetic fuel produced using excess power on windy days and excess power produced in summer from solar power.
Dennis
Look at what happened in Texas this winter. If people are prepared to lose power for five days, I guess less backup will be acceptable.
Ovi,
The problem in Texas was a lack of natural gas due to natural gas infrastructure not being prepared for severe winter weather, it also hurt Texas that their grid is independent of the rest of the US. For most of the US the grid is interconnected, so outages in one area allow supply of electricity to continue from other areas.
As I said the backup exists already in the US and gradually wind and solar will replace older fossil fuel power plants until we get to a steady state where the appropriate amount of backup exists.
Better grid interconnection also helps to avoid the need for backup.
“has anybody looked at adding in the cost of keeping a backup system?”
Ummm..yes. It is a whole industry.
Technologies and cost sometimes brought to the table on the non-oil thread.
In the news today is the imminent listing of Energy Vault on the NYSE valuation at about $1B
https://www.energyvault.com/
just one example of the action in this sector.
For cost analysis of various energy options Lazards is highly regarded-
here is the 14th v 2020-
https://www.lazard.com/media/451419/lazards-levelized-cost-of-energy-version-140.pdf
and the storage cost report of the same date-
https://www.lazard.com/media/451566/lazards-levelized-cost-of-storage-version-60-vf2.pdf
While the cost of green energy keeps falling, has anybody looked at adding in the cost of keeping a backup system?
Ovi,
In a free market, prices are set by the marginal costs at any given time. So zero marginal costs for wind and solar (and hydro) are very bad news for anyone trying to sell fuel.
There is some hope that you can sell fuel to compete with batteries, but the prices there keep falling as well. In America in particular there is little emphasis on reliability, as recent events in Texas (and many others elsewhere) have shown. So even if batteries are not up to the job, or too expensive coal and gas plants are likely to run out of money and go broke, if wind and solar keep growing.
Those power plants don’t exist to provide electricity. They exist to increase shareholder value. Once they stop doing that, they will vanish. What comes later is anyone’s guess.
The key question is not how much electricity wind and solar can produce, or how much batteries cost. The question is how damaging they are to the balance sheets of traditional energy providers.
In a free market, prices are set by the marginal costs at any given time. So zero marginal costs for wind and solar (and hydro) are very bad news for anyone trying to sell fuel.
That energy is never free. It cost a lot of money to build solar farms and wind farms, a lot of money. And the maintenance on both is never-ending. And they belong to someone or the electric grid company. And they want a profit.
Those power plants don’t exist to provide electricity.
Oh really? I thought that was why much of Louisana is still in the dark. Just what is it they do if they don’t generate electricity? Why do people send them money every month if not for the electricity they generate?
They exist to increase shareholder value. Once they stop doing that, they will vanish. What comes later is anyone’s guess.
Oh good Lord! They own the grid. The grid will never vanish. If you got all your electricity from wind, solar, and batteries, the same guys would own them. And you would send your monthly payment to the same address and the same organization. And the same shareholders would either make or lose money, which is exactly what they are doing today.
Ron,
The electricity industry has changed over the years, most utility companies simply provide transmission and distribution services and electricity producers sell their product to utilites or directly to consumers as the electricity supplier.
Dennis, it makes no difference. The grid is necessary and someone must pay to maintain it. The electrical companies still maintain the local grid. They are the ones who provide all the transformers and substations. They are the ones who repair the grid when it is damaged by a storm. There is no such thing as free energy as Alimbiquated seems to believe.
That energy is never free.
Ron,
You are absolutely right of course. But the marginal cost is zero. Put another way, curtailing solar or wind output doesn’t save a penny. Those maintenance costs are still there.
So there is never any incentive to cut production if prices are non-negative, even if the company is losing money hand over fist, even if it is bankrupt. This situation is very different than the situation of a gas-fired plant, which has to buy gas to keep operating. If the company can’t service its debts, or electricity prices fall below fuel prices, the fuel-based plant stops producing electricity.
In financial accounting terms, solar output is always cash flow positive, (assuming electricity prices are positive) even if the balance sheet shows a loss. Market prices are determined by cash flow, not by the balance sheet.
So renewables are like the chip industry, not the energy business. Why are chips so cheap? “Moore’s Law” isn’t the only reason. Another reason is that it is dirt cheap to make chips once you have built a foundry. The foundry might cost billions though, so as so as you have one, you start a brutal fight for market share to get your money back. When a new generation of chips comes out, the price holds for a few months before a crash comes.
Oilmen are used to wild swings in prices and waiting out the bust until the next boom comes. But renewables change the game, whether they are “really” cheaper or not. Every solar PV plant that gets built will produce flat out for decades no matter whether it makes money or not, price be damned.
The grid will never vanish.
The grid (in America at least) is only there as a way of selling electricity at a profit. It exists because people make money burning coal. I am not very optimistic about its future as renewables suck more and more profit out of electricity production. Reliability is already terrible compared to Europe.
You might think it would be stupid for a rich country not to have a grid. But:
It is stupid for a rich country not to have universal health care that pays for cures rather than procedures. And yet here we are.
It is stupid for a rich country not to provide higher education at prices anyone with the talent and motivation can afford. Need I explain? And yet here we are.
It is stupid for a rich country not to have a dense network of passenger trains and in major cities. And yet here we are.
American cities expect people to work for minimum wage at McDonald’s, but don’t even provide sidewalks for the poor to walk to work, because nobody can charge people to use the sidewalk. Who will provide a grid when the money is sucked out of electricity generation?
What makes you so sure the grid will survive? Are you worried poor people might not have electricity? Touching.
Renewable energy is a diversion into a dead end. Humanity could continue to harness modest amounts of energy from biomass, hydro and wind. But there is no possibility of replacing the energy flows that we presently receive from fossil fuels with renewable electricity from the sun and the wind. The problem is not so much intermittency, but low power density. The result is that wind and solar power require 1-2 orders of magnitude more embodied energy and raw materials than an equivalent fossil or nuclear system.
A 1GWe average solar farm would cover about 200 square kilometres of land in Northern Europe. A wind farm of equivalent power at maximum possible packing density, would cover 500km2. To generate serious amounts of power from renewable energy sources, the systems need to be country sized. A nuclear steam supply system capable of generating 1000MWe of power, enough for a city of 1-2 million people, would fit inside a modest 4-storey building. The resource requirements for a nuclear power system are tiny compared to those of any alternative solar or wind based energy source. The fact that these sources are in any way financially competitive, indicates how distorted the energy market has become.
Below is a link to the 2015 Quadrennial energy review, produced by the US department of energy.
https://www.energy.gov/quadrennial-technology-review-2015
Go to Section 10, Table 10.4 for a summary of materials inputs into several different types of powerplant in ton/TWh. Here are some tallys per TWh:
Nuclear (PWR) = 760t concrete / cement; 3t copper; 0t glass; 160t steel; 0t aluminium.
Wind = 8000t concrete / cement; 23t copper; 92t glass; 1800t steel; 35t aluminium.
Solar PV = 4050t concrete / cement; 850t copper; 2700t glass; 7900t steel; 680t aluminium.
Compared to a pressurised water reactor nuclear power plant, a solar PV plant producing the same electric power output will require some 5.3x more concrete; some 280x more copper, some 49.4x more steel; and thousands of times more glass and aluminium. Wind turbines (presumably onshore) require about an order of magnitude more materials for the same amount of electrical energy generated. There is no indication that these quantities include any materials investments needed for energy storage. This would require further materials investments in pumped hydro, CAES or some other means. This increases the materials cost of wind and solar still further. Embodied materials are a reflection of embodied energy.
Wind and solar power only appear competitive at present, because of hidden subsidies and the fact that their huge embodied energy costs are being met by fossil fuels. The steel needed to fabricate wind turbines and PV frames is produced using coal. Solar panels are made in China using cheap coal derived electricity and forced labour. The huge amounts of concrete are produced using natural gas. The polymer blades are a product of oil derived naphtha. And the huge quantities of embodied materials must be mined and shipped using diesel powered equipment.
Nuclear is pretty much a dead relic of the 50s. Boiling water simply isn’t a cot effective way to generate electricity.
The nuclear industry needs to go back to the drawing board and figure out how to generate electricity without generating hard radiation and heat.
OMG. This is entirely unrealistic.
Wind and solar don’t need that much space. Fossils and nuclear need more than the amounts shown. The “energy density” argument is obsolete: wind and solar are cheaper.
A 1GWe average solar farm would cover about 200 square kilometres of land in Northern Europe.
That’s about 10x too large. A GWe is one billion watts. If we figure 10% capacity factor (which is conservative), then we’re talking 10 billion watts peak capacity. Peak solar insolation is 1 kilowatt per square metre, so we need 10 million square metres. If we assume a 50% factor for spacing between panels, then we need 20M square metres. That’s 20 square kilometres. Plus rooftop solar “consumes” no space at all.
The calculations for wind are also terrible, because they assume that all of the land inside the wind farm between the turbines is “consumed” by the farm. That’s silly, and it’s off by about 100 to one. Also off-shore wind “consumes” almost no space at all.
I haven’t fully reviewed the materials argument, but one problem jumps out from me at the source: for FF and nuclear it doesn’t include fuel or upstream requirements, only the generator. So, the material requirements for coal generation don’t include the materials used for the coal mine!
Wind and solar will continue to be cheaper than fossil fuel electricity, even if they use their own outputs as inputs to build more capacity. Why is that? Because they’re cheaper! If they’re cheaper than fossil fuel and nuclear plants when they’re using FF inputs, why wouldn’t they be cheaper when they’re using their own power output as inputs to building more, cause their power oututs are…cheaper.
OMG.
A big wind tower uses round about 200 square meters of space here – by law the foundation has to be covered by at least 1 meter of soil. That’s enough to plant corn or grow a forest on top on it.
For example: https://www.mz.de/lokal/merseburg/wie-das-land-mit-repowering-der-windanlagen-die-landschaft-aufraumen-will-3170065?reduced=true
You see, the loss for the farm is almost zero.
The main needed space are the access roads for maintaince. I think that’s the same as shales stripper wells – you need to be able to reach the location with a truck. When you build them in farm you can use the access road for heavy farm equipment, too.
Something is going on in Russia, I am not sure what. The data is just in from the Russian Ministry of Energy: Stastics Russian C+C was down 35,000 barrels per day in August.
But we are getting some strange signals out of Russia.
This Rystad page, Russia’s oil supply set to break Covid-19 chains, rise to a new record in July 2022 and peak in 2023,
has Russian production reaching new heights next year and peaking at 12.2 million barrels per day in 2023. The article mentions “greenfields” 6 times and “brownfields” 0 times. Over 60% of Russian oil production comes from brownfields.
This article, from last November, may explain why:
Russia prioritises new projects at expense of brownfields.
From 2021, the development of mature oil and gas projects, or so-called brownfields, will cost Russian producers more due to taxation changes, while greenfields will continue to enjoy tax incentives. Currently, oil consumption is reducing due to unfavorable market conditions, but the changes may backfire when demand recovers.
The article goes on to explain how Putin is giving all tax breaks to Arctic production and abandoning the brownfields.
To guarantee returns of new investments, the Kremlin also worsened the operating conditions for dozens of large brownfields that switched to a trial netback taxation mechanism in January 2019. Due to state support, these projects have been considered significantly less expensive to operate compared to new developments in the Arctic.
So that’s what’s happening in the Russian oil patch. The next few months will tell us how it’s working out.
The Russian authorities have totally underestimated the effect of reducing the prolific rate of infill drilling needed to sustain production in the old brown fields. Rystad simply add new production taking no account of decline rates for legacy wells. I have worked for Russian’s and there will be a delay before any action is taken to reverse the situation. The stages in the process will be.
1 wait to see if it improves
2 look for something or someone to blame
3 try to fix it without telling the government
4 tell the government and put your tin hat on.
Lightsout , second thanks for today .
Have big oil fields actually been discovered in the Russian Arctic, or do they just think there’s lots of oil there?
Some oil has been discovered in the Russian Arctic, but most of it is a long way from development.
Russia Begins Development on Arctic Oil Project That Will Produce 25 Million Tons of Oil Per Year
That works out to be half a million barrels per day by 2024.
Russia’s national oil company has begun construction on a massive project in the Arctic that officials say will produce 25 million tons of oil each year by 2024. The new operation is possible only because the Arctic is now traversable in places and at times it previously wasn’t, due to sea ice levels plummeting as the planet warms. Hahahahha everything is fine!
The Barents Observer reported this week that construction ships have been spotted off the coast of the Taymyr Peninsula in Siberia and have dropped off around 20,000 tons of construction materials to begin building what will be the Arctic’s biggest oil terminal. The project, called Vostok Oil, is owned by Rosneft, which is controlled by the Russian government but has a number of private investors (including BP, which, if you’ll recall, has big plans to be net zero by 2050). The CEO of Rosneft told Vladimir Putin that the company had also started drilling in a new license area this month as part of the project.
The proposed project is dauntingly huge. Rosneft said that it anticipates exporting 25 million tons of oil a year by 2024, 50 million tons by 2027, and 115 million tons by 2030.
In barrels per day that’s .5 million by 2024, 1 million by 2027, and 2.3 million by 2030. Ambitious but I don’t think that will overtake their brownfields decline. Also, I think that 2.3 million barrels per day by 2030 is overly ambitious.
Ron . there is a saying ” China will grow old before it becomes rich ” . Same applies to the Vostok project and the Chinese “One Belt One Road” project . Not enough surplus nett energy to spread around such gigantic endeavors .
About the vostok oil project, RUB 10 trillion will be needed. Where are they going to find these funds? ”Massive infrastructure requires massive investment. There are estimates that project implementation will require at least RUB 10 trillion. But despite such colossal costs, experts believe that the project will still be lucrative and oil prices will actually remain quite reasonable, at USD 35–40 per barrel. ” https://arctic-russia.ru/en/project/world-class-cluster/
By the way, they are looking for contractors. https://www.reuters.com/business/energy/rosneft-begins-hunt-contractors-massive-vostok-oil-project-2021-06-07/
It has to be noted Ron they are investing heavily in gas.
https://youtu.be/ekzzAMbyfjU
It is propaganda video. Gazprom has no (more) spare capacities to supply Europe. https://www.upstreamonline.com/production/no-answer-russia-fails-to-boost-gas-deliveries-to-europe/2-1-1047019
JFF , agree . I am surprised at the change in the narrative . We never thought that a gas crunch could come faster than oil . What were we missing ? OR Is it the unravelling of the false data and lies that have been fed to the public over the several years ?
No false data and lies have been fed to the public. It’s just a problem of blindness and lack of informations among people in general. But, yes, I admit the awakening is hard.
There’s an energy crunch unfolding in Europe, especially with the UK in a very precarious position with respect to power and heat generation. Coal plants due to be mothballed next year were fired up recently for emergency production, and interconnectors are being seen as unreliable due to other issues. Europe has far below average NG stocks going into autumn, and the wholesale power market prices have spiked as they would were we in a cold snap. I’m sat in my garden and it’s 23ºC outside right now in September. What happens if it actually gets cold?
https://www.thetimes.co.uk/article/0decb912-116d-11ec-86b8-9dcf48a101ba?shareToken=11a09cd43e1fa5181008abd4ea0dca51#
This is when you see popular uprisings against gov’t policy. And if they see this is down to botched renewable policy, well, I don’t think appealing to peoples’ better nature will help if they’re freezing in the dark and their jobs are unable to function.
The situation is bad .
https://www.theguardian.com/business/2021/sep/08/two-uk-energy-suppliers-succumb-to-record-surge-in-prices
I have created three Oil price scenarios for Brent oil in 2020 US$/barrel, see chart attached.
The low scenario has a maximum oil price of $70/bo (2021-2035), the Medium scenario a maximum oil price of $95/bo (2029-2033) and the high oil price scenario has a maximum oil price of $120/b (2029-2033).
What do people think is the most reasonable of these scenarios?
Nobody will think these are correct, but answers might be, below the low scenario or between the medium and high scenarios. Or present your preferred scenario (best guess, or a range of guesses).
The medium scenario is just the average of the low and high scenarios. The decrease in oil price after 2035 is based on an assumption that demand falls either due to a transition to electric transport or possibly due to a depression due to declining oil availability, which I expect will start around 2030 in the absence of a transition to electric transport (or a very slow transition).
I took another look at USGS assessments of tight oil resources in the Permian Basin.
https://www.usgs.gov/centers/cersc/science/permian-basin-oil-and-gas-assessments?qt-science_center_objects=0#qt-science_center_objects
In all three assessments Midland Wolfcamp(2016), Spraberry (2017) and Delaware Wolfcamp and Bonespring (2018) there were about 50 million net acres of propective area to be developed. A “net acre” is the prospective acres times the probability of a successful well, if we have 100 acres with an average success rate of 80% we would call that 80 net acres.
The different “benches” of the Wolfcamp, Bonespring, and Spraberry formations in each of the sub-basins studied have different average EURs per well. If we assume the average well will have a 9000 foot lateral with 1320 foot well spacing (273 acres per well) the EURs range from 175 kb to 691 kb.
Listed from lowest to highest (in kb):
175, 222, 227, 244, 259, 259, 329, 344, 381, 413, 456, 456, 456, 456, 521, 524, 691
The mean TRR estimate by the USGS for all of these benches adds up to 70 Gb of undiscovered resources and when we add cumulative production plus proved reserves at the end of 2015 (5 Gb in total) we get a TRR of 75 Gb.
I have adjusted this estimate by dropping the lowest productivity benches (from 175 kb to 344 kb), one bench form Spraberry, 3 from Midland, and 4 from the Delaware basin. This leaves the benches with average EUR from 381 kb to 691 kb (9 benches in all). The USGS mean undiscovered TRR estimate for these 9 benches is 52 Gb, but this leads to a high average EUR of 468 kb for the 30 million net acres comprising the 6 benches (from 50 million total net acres in the USGS estimate for all 17 benches analyzed). To date the average Permian basin well in 2019 has an EUR of about 407 kb (this assumes the well is shut in at 20 bo/d output). At 273 acres per well we would have about 111000 wells that could potentially be completed, assuming 407 kb per well would lead to about 45.2 Gb of undiscovered TRR, when we add the cumulative production plus proved reserves at the end of 2015 (before the first assessment was completed) we get a TRR of 50 Gb.
Note that this is quite a conservative estimate as the F95 USGS TRR estimate is, 44 Gb where F95 means there is a 95% probability that the TRR will be 44 Gb or more. So my estimate might be the equivalent of an F85 TRR estimate, if the USGS analysis is accurate.
Using this new TRR estimate and the three oil price scenarios presented earlier, I made the following maximum completion rate assumptions for a low, medium, and high oil price scenario at 450 wells per month, 525, wells per month and 600 wells per month respectively.
OPEX about $15/bo in 2021 (average OPEX of $16.50/bo over life of well) and rising as the field depletes, well cost $10.5 million, plug and abandon cost 500k per well, NG $2.50/MCF, NGL sold at 35% of the price of crude oil, royalty and taxes 28.5%, wellhead price $5/b less than Brent, all prices in 2020 US$, discount rate 17.5%, interest rate 7.5%, dividends are 25% of net revenue.
Wells completed range from 89000 for low price scenario to 124000 for high oil price scenario.
Note that 15500 wells had been completed in the Permian basin by the end of 2017, the 110000 wells completed to extract the 45 Gb of undiscovered TRR are competed after Dec 2017 in these scenarios, so without the economic analysis where all potential wells are completed we would have about 125500 total wells competed to extract 50 Gb of oil.
Dennis
This post of yours may well be amongst the most informative and relevant of all your years of engagement on this site.
Good for you for going deeper past the mere ‘headline’ encapsulations that seem to form the evaluative basis of so many.
Additional insight …
Those USGS presentations were published in November 2016, May 2017, and November 2018, respectively.
As such, the analyzed wells are somewhat archaic by current practices.
If you choose to learn of more modern protocols, the 118 page June, 2021 presentation from Liberty Resources describes many of the factors involved in economically fracturing/developing today’s unconventional wells … particular relevance can be found on pp. #s 43 – 47.
Looking forward, the new hardware enabling so called simul fracs are claimed to save $400,000 per completion.
Ongoing advances in diverter technology and water processing (enabling re-use of both frac fluid and produced water) are enabling both operational and economic benefits. (Common for Appalachian Basin operators to use 100% recycled water for frac’ing.)
If you follow lateral length on Enno’s site for Permian wells, expect ongoing increase in length up to the 15,000 foot threshold.
Again, AB technology is arising in Texas, which provides additional motivation for lease consolidation.
The added economic benefits for longer laterals cannot be overstated. Along with advances in Artificial Lift, 12 to 15 foot Permian laterals will be routine in the near future.
Innovation, like depletion, never sleeps.
Coffeequyzz,
Coffeguyzz if you have a link post it for Liberty Resources presentation, it is not obvios on the website.
Bakken has been at 10000 foot laterals for years, I expect this will be the limit for tight oil wells. There may be fundamental differences between shale gas wells and tight oil wells in this regard.
In any case, there might not be significant savings in going to longer laterals and note that I have used prospective acres in my estimates (this has always been the case), if we went from 9000 foot laterals (current Permian average) to 18000 foot laterals we might double EUR, but we also would have half as many wells, the net change in TRR is zero.
Your argument may be that costs are reduced, perhaps, but there are other forces such as costs of either recycling or water and its disposal which may become more expensive over time, there are also labor shortages which might raise labor costs, higher steel prices, perhaps higher pump prices due to shortages. All of these point to rising well costs. My model assumes average well cost in constant dollars remains fixed, one could think of this as technological advances lowering costs while other factors mentioned (water, labor, steel, and other equipment costs) will raise costs and the two might balance at zero change in cost. I do not know which way it will go, but the model can easily be changed to reflect either rising or falling well costs.
Oil pros seem to think costs will rise, I am inclined to agree, but at minimum I doubt they will fall.
The EUR estimate is based on the average 2019 well, since 2016 Permian well productivity per 1000 feet of lateral has been decreasing, so increased productivity seems unlikely. This is especially true as sweet spots become fully drilled up and also as pressure depletes in the basin.
Coffeeguyzz,
Interesting that for an emerging shale gas play the optimum spacing is 2000 to 2700 feet. Found June 2021 presentation you referred to, thanks.
For anyone interested (well spacing mentioned on slide 41)
https://investors.libertyfrac.com/~/media/Files/L/Liberty-OilField-IR-V2/reports-and-presentations/investor-day-presentation-june-2021-vf.pdf
Dennis,
Yes, that is the presentation.
Liberty Oilfield Services – while closely affiliated with Liberty Resources – is a separate entity.
You are correct in stating that ultimate hydrocarbon recovery will be less with longer laterals, but the economic tradeoffs – fewer wells – will more than make up for the drop in production.
Page # 41 in Liberty’s presentaion shows that an 8% drop in total recovery can occur while drilling one half the wells.
This, precisely, is part of an ongoing juggling act of optimizing operations … finding the ‘Happy Valley’, to use Liberty’s marketing terminology.
Regarding a dearth of +10,000 foot laterals, you are already mistaken.
I refer you to the data rich April 2021 newsletter from Rystad (‘Decade of efficiency gains …’) which states current horizontal lateral length of over 11,000 feet is now ~20% of all unconventionals. While this includes the numerous gas wells, the 2 Devon oil wells – targeting the Delaware in New Mexico – merit attention. These 2 wells – having 3 mile laterals – have each produced ~200,000 barrels of oil their first 2 months online.
Whiting’s recent acreage acquisition in the Sanish field specifically involves drilling some 3 mile laterals.
(Numerous 15,000 footers were drilled under Lake Sakakawea years ago).
The top ~ half dozen oil producers in the Ohio Utica al have 19,000/20,000 foot laterals.
The hardware/technology introduced by Deep Well Services – specifically their Hydraulic Completion Units – are playing a large role in these efforts.
They just set up shop in Texas and have already spawned competing companies offering similar capabilities.
Coffeeguyzz,
Just because there are a handful of wells longer than 10,000 feet, does not mean that the economics has been proven. I look at basin wide averages, for the Bakken it is about 10,000 feet and for the Permian about 9000 feet. Sometimes a 15000 foot well is drilled, but that does not mean the economics work out to be better than a 10000 foot well.
There may be operational difficulties with oil wells longer than 10000 feet, I am not in the field so I do not know the details.
Dennis,
You need to be aware of the leasing/Drilling Spacing Unit protocols to undetstand what is unfolding and its significance as longer-than-10,000 footers become more common.
In the early days of Bakken development, North Dakota changed the minimum lease size ftom 640 square acres (one square mile) to 1,280 square acres.
This greatly assisted the operators as it virtually halved the number of wells that they would need to drill to protect their leases via Held By Production contracts.
(Mississippi did the same thing by establishing 1,920 sq. acre units – 3 sq. miles – to encourage Tuscalossa Marine Shale development).
The north eastern states generally have no such geometric, pre-determined lease/DSU parameters and, in fact, rely upon private parties to bring about regulation-compliant drilling/production acreage.
This has led to – using Toby Rice’s description – ‘funky’ leases of wildly varying shapes and sizes.
This further greatly incentivized the drilling of longer and longer laterals by which leased land could be efficiently developed.
These developmental innovations which arose in the Appslachian Basin are now appearing in other regions.
As far as cost reductions … in general it is claimed to be an across-the-board savings of 30 to 40 per cent from an ~8,000 footer to a ~14,000 foot long lateral to drill and complete on a per foot comparison basis.
Natgas is far more amenable than oil in recovery from these long laterals, but the ongoing improvements in Artificial Lift continue to support these efforts.
Again, there are very productive oil wells in the Ohio Utica with 19 and 20 thousand foot laterals.
Coffeeguyzz,
It seems most of the wells in Ohio are gas wells, only about 57 kb/d of tight oil output (no doubt primarily condensate) with 5.6 BCF/d of natural gas output. So the Utica “oil” wells you mention would be better termed “wet gas” wells.
Operators will choose the configuration with the highest return on investment, perhaps lateral length will increase, but only if profitable to do so.
Pretty sure those 30% to 40% cost reductions apply to natural gas, and are for CAPEX only, it may well be that for tight oil wells the economics are very different and that any savings (if they exist) for longer lateral tight oil wells (laterals longer than 10000 feet) migth be offset by higher OPEX due to operational problems or higher pumping or maintenence costs for the longer lateral tight oil wells.
Just because there are a handful of such wells with high initial output does not mean the ROI is higher.
Thanks for the information on the gas industry Coffeeguyzz.
Its a huge story that gets much less attention than is deserved here in the US,
probably because the reserves are so much more abundant than oil.
Hickory,
Here is a quote that should grab some attention …
“A major retailer told me if that engine (15 liter natgas engine from Cummins Westport, just introduced in China) was available here today, they would pull all of their trucks out of California tomorrow – the diesel trucks – and replace them with natural gas”.
(From Commercial Carrier Journal, June 15, 2021 article on Renewabke Natural Gas).
While I was originally dismissive of the entire RNG world, it increasingly looks like I was mistaken.
One example …
A large landfill gas recovery project near Scranton (Assai) will recover – and produce – the energy equivalent of almost 2,000 barrels of oil every day.
The technological advances in the recovery, processing, storing and transporting of methane from large farms, small beer breweries and large landfills is nothing short of astonishing.
How much of this that may be economical sans subsidies is up for (much rancorous) debate.
However, the people who focus primarily upon oil availability/scarcity are apt to be missing out on the much larger picture.
Dennis
My original draft actually included the mention of the high viscosity nature of the Crawford/Outlaw/Purple Hayes wells, but I deleted it so as not to have too ‘wordy’ a post.
Ohio clearly distinguishes between oil and natgas, while simultaneously not breaking down the components making up NG and NGLs.
If it is characterized as oil in the Buckeye state, it is oil, whatever the viscosity may be.
Furthermore, to transport viscuous fluids 4 miles sideways and a mile and a half up to the surface through tubing no bigger than a man’s fist is no small achievement.
Regarding the lengthening of Texas’ unconventional laterals … no need to quibble … simply observe the changes via Enno’s site.
The number of 12/14 thousand footers will increase sharply, (already started) and those resilient operators will continue to surmount the operational challenges as they arise.
Coffeguyzz,
I don’t have direct access to lateral length info, but occasionally it is mentioned by Enno Peters. As I have mentioned before, possibly longer laterals might offset rising well costs a bit, but there are only so many prospective acres (about 30 million as of the end of 2017 that might be viable), longer laterals mean more acres per well and fewer prospective wells. I f we increase the average lateral to 15,000 feet rather than the 9000 foot estimate I used, then we have 455 acres per well rather than 273 acres per well and 66000 prospective wells rather than 111000 prospective wells after 2017.
Output would be changed very little, especially under a high oil price scenario, for a low price scenario if the longer lateral wells are indeed lower cost as you claim, then potentially more total tight oil output would be viable.
Coffee , ” If you follow lateral length on Enno’s site for Permian wells, expect ongoing increase in length up to the 15,000 foot threshold. ”
Even if it was 150, 000 ft it would not make a dime of a difference . It will loose money and will only hasten the rate of depletion and bankruptcy . Shale is as Nader said ” unsafe at any speed ” the parody is ” Shale is a money looser on any metric . “
Hole in head,
Even my low oil price scenario has Permian basin debt paid back by 2027, also the net present value of future cash flow in 2020 US$ using a nominal 15% annual discount rate (a real rate of 12.5% assuming a 2.5% annual inflation rate) is 208 billion. Current cumulative debt for Permian basin based wells completed from Jan 2010 to June 2021 is about 118 billion 2020 US$. When we subtract current debt from the net present value of future cash flow for the low price scenario presented earlier we are left with about 90 billion 2020 US$.
I know you believe oil prices will be lower than my low oil price scenario ( I believe you have WTI at $25/bo in 2025), but I think LTO survivor believes oil prices below $70/bo in 2020 $ are not very likely over the medium to long term. I agree with LTO survivor. I think my medium oil price scenario is a nice middle ground with a 50/50 chance that oil prices will be higher or lower than this and perhaps a 65% probability that the maximum 3 year average Brent oil price in 2020 US$ between Dec 2025 an Dec 2030 will be between 85 and 105 dollars per barrel (2020 $).
HIH,
It does not make a dime of difference, it may – ultimately – make a difference measured in the tens of billions of dollars … for a start.
If you were to read through (2/3 minute read), the above-referenced April Rystad article, you would find that Drill & Completion costs are now averaging $700/lateral foot. (I have seen some under $500 per).
The ramifications of these developments are huge.
When Dennis does his projections, he never – to my knowledge – incorporates the Rogersville, the Tuscaloosa Marine Shale, the Paradox.
Nor does he extrapolate the gains from the Powder River Basin or the Uinta, amongst others. (Future gas potentialities are so numerous, so huge, that it is near meaningless to calculate probabilities. Starting with a century’s worth of abundant, cheap natgas, one can try to fine tune from there).
The expanding productive footprint – aka Tier 2 and 3 becoming more viable – is another consequence of plummeting development costs.
Revisit your statement next September … 12 months out.
IF oil stays in the $70/$80 barrel range and IF natgas is $3.50/$4 per mmbtu, you will witness an extraordinary turn around in most of these upstream operating companies financial status.
Gar. Own. Teed.
Coffee , I have already replied to the IF from Dennis . Let me make it humorous ” If grandma had a d*** she would be grandpa ” . 🙂 . OR ” If grandpa had boobs and a slit he would be grandma ” 🙂 ROFL Then you say “Starting with a century’s worth of abundant, cheap natgas, one can try to fine tune from there). Heck there are problems with natural gas in Europe ( see JFF above ) . Lay out a pipe from Marcellus to Hamburg or maybe get those LNG ships revved up . You sir are in living la la land .
P.S : As Keynes said ” ULTIMATELY we all will be dead ” . You can take that to the bank .
Coffeeguyzz,
Those other plays are incorporated under “other US tight oil”. We do not have recent USGS assessments of tight oil plays beyond the Permian, Eagle Ford, and Bakken/Three Forks. I do not focus on natural gas. Of the tight oil reserves that were proved reserves at the end of 2019, about 96% of the 23 Gb were in 4 plays, the Bakken/Three Forks, Permian, Eagle Ford, and Niobrara.
A recent 75 Gb scenario for US tight oil includes about 10 Gb from “other” US tight oil plays, 2.6 Gb from Niobrara, 8 Gb from North Dakota Bakken/Three Forks, 9 Gb from Eagle Ford, and 44 Gb from Permian basin. Peak in 2028 at 9.6 Mb/d, see chart below (this uses my Permian medium oil price scenario).
As of 2018-
“Waste Management’s 110 compressed natural gas stations deliver 60 million diesel equivalent gallons of natural gas each year. The company’s fleet of 6,700 natural gas trucks represents 30 percent of the company’s overall collection fleet. The company continues its commitment to converting its fleet from diesel to natural gas with 80 percent of new truck purchases powered by natural gas.”
https://mediaroom.wm.com/waste-management-unveils-30-million-renewable-natural-gas-rng-facility-in-louisville-kentucky/
Dennis
What most fascinates me in your forecast is the slope of the production increase. It seems that the maximum slope is close to 500 kb/d between 2022 to 2026. If correct, this must make OPEC Plus feel good. If the yearly increase in world demand gets back to the 1,000 kb/d range, then OPEC will be back in charge of the market and they will be able to increase production to meet demand, once they get through their CV associated cuts in late 2022.
Ovi , just for humor . In India they have started a news channel called GNT ( Good News Tonight ) to inject the public with the ” feel good ” { your words , not mine } 🙂 . Maybe Dennis can apply . 🙂 .
P.S : This channel is owned by a govt toadie who is making an effort to defend all the bad news regarding the Modi govt that is in the media .
Ovi,
The scenario is very conservative and reflects the current behavior of tight oil producers, as oil prices reach higher levels (such as $95/bo) they might increase the completion rate, but based on information from oil pros, the lack of drilling inventory would prevent this, in fact the oil pros that contribute here consistently tell me that completion rates will be less than I predict, they will probably be right, but for now, the economics based on the oil price scenarios I have given suggest these scenarios are conservative.
By that I mean that there is money left over that is used to pay back debt as quickly as possible in my scenarios that could be used to complete more wells and have plenty of cash for dividends, interest and principal payments. Note that in my scenarios for medium and high price the maximum price is not reached until 2029. Debt is paid back by 2026 or 2027 (depends on price and completion rate) at that point the completion rate could increase or excess cash could be used for share buybacks or returned to shareholders as dividends. Difficult to know what oil companies will do in the face of potentially dropping demand as EVs take a larger and larger share of the light transport and possibly some of the heavy land transport market, they may choose to wind down operations so they do not hold stranded assets.
If you look at the tight oil scenario (where drops in non-Permian tight oil offsets Permian increases after 2025) OPEC plus will be fully in control of the oil market by 2026. If they are disciplined in the meantime they can keep oil prices high (over $80/bo) from 2022 to 2026, after that they will decide the price of oil that the market can bear.
A final thought is that the IEA expects World demand growth for oil from 2022 to 2026 will be about 500 kb/d per year, they also expect US petroleum liquids output will only grow by 1600 kb/d from 2021 to 2026, where I have tight oil growing by about 2400 kb/d from 2021 to 2026. I expect increases in NGL output will offset declines in onshore conventional and GOM may be reltively flat from 2021 to 2026, so my US oil forecast is a bit higher than the IEA forecast by about 160 kb/d per year.
Ovi,
I have updated all of my tight oil scenarios (Permian, ND Bakken/TF, Eagle Ford, Niobrara, and other US tight oil) using the low oil price scenario presented earlier (maximum Brent Price of $70.5/bo in 2020 US$ and maximum WTI of $67.50/bo in 2020 US$). ERR is about 60 Gb for all US tight oil, peak about 8300 kb/d in 2027 (about 1200 kb/d higher than the July 2021 US tight oil output level). Completion rate of tight oil wells in new wells completed per month on right axis.
Breakout of ERR, Permian 34.6 Gb, ND Bakken/TF 7.6 Gb,
Eagle Ford 6.3 Gb, Niobrara 2.5 Gb, other US LTO 9.4 Gb.
Chart below, click on chart for larger view.
This is an incredible work of fiction.
https://oilprice.com/Energy/Energy-General/Why-US-Shale-Companies-Are-So-Undervalued.amp.html?utm_source=tw&utm_medium=tw_repost&__twitter_impression=true
Lightsout , tks . ” Stupid is what stupid does ” — Forrest Gump .
And then ” Fiction is what fiction does ” which is spread fake news and false hopes . Good catch .
Lightsout,
The cash flow numbers are real, look at free cash flow vs CAPEX spending for the companies he listed. If oil prices remain at 70/bo or higher through 2022 these companies will be in better financial shape.
Dennis , ” If oil prices remain at 70/bo or higher through 2022 these companies will be in better financial shape. ”
Akin to saying ” If wishes were horses beggars would ride ” . 🙂
What are these companies doing with their free cash flow?
Schinzy,
Paying higher dividends, paying down debt, and buying back shares. Investors are looking for capital discipline and lower Debt/equity and the companies are obliging in an attempt to boost their stock prices.
Here’s Why U.S. Crude Oil Supplies Took Such a Big Hit From Ida
The damage to offshore platforms, pipelines and even heli-pads was so severe that two out of every three barrels of crude normally pumped from the U.S. sector of the Gulf of Mexico are unavailable. The ripple effects are still playing out as refiners and brokers scour the globe for replacements and the Gulf’s biggest oil producer, Royal Dutch Shell Plc, tells some customers it can’t honor supply commitments.
Frugal , thanks . Being in Europe I was wondering what was happening .
Hole in head,
If pessimistic projections of future oil output are correct, then it is likely oil prices will be higher in the future. OPEC+ may have enough capacity to keep the market well supplied through 2026, if oil demand growth is as slow as the IEA predicts (99.4 Mb/d in 2022), if the higher oil demand projections of the EIA’s short term energy outlook are correct (101 Mb/d in 2022), then the oil market may be short of oil especially if the US does not remove sanctions on Iran.
So in my view a low oil price scenario ($70 bo/d or less) depends on either slow demand growth as the IEA foresees or a resolution between Iran and the US on the JCPOA and a removal of sanctions on Iranian oil exports. The IEA expects 101 Mb/d for World oil demand in 2023 with demand rising to 104 Mb/d in 2026.
Reprt from IEA at link below
https://www.iea.org/reports/oil-2021
Dennis “the IEA foresees or a resolution between Iran and the US on the JCPOA and a removal of sanctions on Iranian oil exports. ”
Just wondering when did the IEA takeover foreign policy decision making of the US from the Biden administration . ???.
Anyway if a resolution was desired then it could be done , but that would be in favour of Iran .Who in the heck wants to annoy AIPAC the biggest political donor to both the Dems and the Repubs .??
Hole in head,
Don’t quote part of a sentence, that is taking something out of context. Try reading the comment again, not saying anything about IEA influencing US foreign policy, simply a comment that if the US wants more oil, on the World market they can get an extra 1.3 Mb/d by removing sanctions on Iran.
Biden was not elected to continue poor foreign policy initiated by Trump.
Dennis , apologise if my wording makes it seems the comment of IEA is attributed to you . No , it is not your comment and IEA is free to speculate all it wants . I am on the same page as you on the lifting of sanctions and get this out of the way . The sanctions are ineffective and only assist in releasing ” The dogs of war ” which the world can do without .
What do you guys think about this article?
China sells oil reserves to lower prices in unprecedented move
https://www.aljazeera.com/economy/2021/9/9/china-sells-oil-reserves-to-lower-prices-in-unprecedented-move
Desperate.
Lightsout , why ? Please expand .
China’s non-government debt to GDP is at 300%. Higher oil prices are a threat to that massive debt bubble. Those expecting higher oil prices only look at less supply equaling higher prices. It’s hard to quantify how much of the debt that currently exist everywhere is unpayable and unserviceable.
Therefore it is ignored by most people as if there is always going to be a monetary or government solution. Fact is there will be multiple G-7 countries over next decade that don’t have any solutions. UK, Germany, Italy, Take your pick. And if one goes down the toilet the others get taken down with them.
It’s never going to be as simple as oil and gas supply will fall and prices will rise enough to make oil production profitable enough to increase production.
Any lack of energy flow means debts start getting defaulted on. Watch the dollar denominated debt in the world for clues that this is actually taking place.
Lack of oil, lack of natural gas equals a stronger dollar.
Yes indeed. Due to two years of floods, the Chicoms will be importing an extra 40 million tonnes of corn this year. To keep meat on the table in China. The Chicoms are also short 40 million tonnes of thermal coal stocks which they need to get sorted before the winter season starting next month. They are also selling aluminium, copper and zinc from the strategic metals reserve. Looks like a liquidity crisis in Chicomland. Due to their banning of Australian coal, the coking coal price ex US east coast has reach $390 per tonne. And the thermal coal price has tripled in the last year:
Chicoms? Has that term been used since the 1960’s?
By labeling another people it allows a person to see them as without the full recognition, respect and compassion afforded to humans within your own tribe.
Yes its a form of racism. Chinese are people too.
Oil Producers Enjoy the Calm Before the 2022 Storm
You’d be forgiven for thinking that it’s smooth sailing ahead for the OPEC+ oil producer group.
The 23 members concluded their meeting last week in less than an hour, agreeing to raise output again in October. There were no signs of the tensions that had marred earlier gatherings, just a quick rubber-stamping of the next step in a deal thrashed out in July, which sees the group adding 400,000 barrels a day to supply each month.
According to the graph above, we’ll know exactly how much OPEC+ can produce in one year’s time.
Any thoughts on why, despite more EV on the road than ever and despite many still working from home that gasoline demand is at pre-pandemic levels. As I recall, July 4 week demand set an all-time record.
Shallow sand,
Probably pent up demand for vacation travel is the most likely explanation. Perhaps many are also fearful of air travel and are using cars for trips that normally would have been taken by plane, bus or train.
Note that I have not looked at the data closely, pure speculation on my part.
Simply, plugin vehicles do not make up much of the US fleet yet.
Even here in the prosperous west coast greater metro areas where it is not at all uncommon to see a dozen electric vehicles when out and about for a short trip, the vast majority of vehicles on the road are petrol fueled.
And apparently the nations drivers are not at all troubled or inhibited by the current price of fuel.
Plus- the USA population has grown in the past 2 years by roughly 3,851,000 people.
[and still with labor shortages in many sectors]
https://worldpopulationreview.com/countries/united-states-population
Russia Is the Canary in the OPEC+ Oil Mine
(Bloomberg Opinion) — Russia is struggling to boost its oil production, even as its allowance under the latest OPEC+ agreement is rising. At least that’s what the current data show. If it’s true, we ought to be worried. The country is the largest of the allies that joined with the Organization of Petroleum Exporting Countries last year to agree to a record cut in oil production as Covid-19 slashed fuel demand. Now, as consumption recovers and the producer group is steadily restoring its curtailed supply, Russia is lagging behind. Its production has flat-lined since April, while the amount it is allowed to pump under the deal has increased by 200,000 barrels a day. And that target is set to continue increasing at a rate of 105,000 barrels a day each month for the next year.
Maybe Russia has found a new sense of responsibility to pump closer to its OPEC+ target level, having been the group’s biggest over-producer in volume terms for much of 2020. But I doubt it. That would require the country to admit, at least privately, to past transgressions. Alongside Saudi Arabia, Russia was given a baseline production figure — the level from which its output cuts are measured — of 11 million barrels a day, which will rise to 11.5 million barrels in April 2022. But, unlike the Persian Gulf kingdom, the Russian oil industry has never produced anywhere near that amount and almost certainly can’t do so now.
There is a lot more to this article. It says that Russia’s inability to increase production may be due to a lack of gas production in the summer. That would cause a drop in condensate. And that there may be an increase in condensate production as gas production picks up to supply winter demand.
Ron
You have to understand the way that Russian’s interpritatete data.
Russia’s population actually shrank by a half a million people in 2020. Demographically it’s hard to see where they have any demand growth coming down the pipe.
If Russia is experiencing any kind of internal shortage where they feel the need to export less. That says a lot about conditions in Russian oil and gas fields.
Ron
I am trying to understand this comment “It says that Russia’s inability to increase production may be due to a lack of gas production in the summer.”
My understanding is that condensate and NGPL’s are the same gases that can be liquefied at the normal temperature of 68F, ethane, propane, butane and pentanes. The only difference is that condensate comes from oil wells and that NGPL’s come from natural gas wells.
The issue is, for consistency, should Russia be adding in the NGPL’s to their oil production numbers. It seems to me that the Russian Energy ministry is reporting All Liquids.
I also wonder if this explains the difference between what the Russian Energy ministry reports every month and what the EIA reports for oil production. The EIA number is typically 400 kb/d lower than the Russian number. I think the EIA reduces the Russian numbers by 400 kb/d to subtract out the NGPL’s that Russia includes.
My understanding is that condensate and NGPL’s are the same gases that can be liquefied at the normal temperature of 68F, ethane, propane, butane and pentanes.
No, that is incorrect. Ethane, propane, and butane are NGPLs and are all gasses at room temperature. They must be kept pressurized and are what I call “bottled gas. Though I have never known ethane to be bottled as such. (In Saudi, ethane was piped in and burnt in the power plant boiler just like methane. At least one or two days a month they would burn ethane.) Pentane is condensate and condenses out of natural gas and out of oil as wells. Condensate comes from both oil wells as well as gas wells. (In Saudi, every oil field had one or more GOSP, Gas Oil Separation Plant.)
In the summer Russia produces a lot less natural gas so therefore they produce a lot less condensate that comes up with the gas. The winter season, in Russia, consumes a lot of natural gas. They produce more gas in the winter, as Russian winters are horribly cold, therefore they produce more condensate in the winter.
But condensate is simply pentane and is still condensate no matter which kind of well it comes from. Pentane is C5H12. Every carbon polymer C5 or heavier is liquid, or grease, at room temperature. Every polymer lighter than C5 is a gas at room temperature.
It seems to me that the Russian Energy Ministry is reporting All Liquids.
No, the Ministry web page: Statistics clearly states: “Production (includes gas condensate)”
I also wonder if this explains the difference between what the Russian Energy ministry reports every month and what the EIA reports for oil production. The EIA number is typically 400 kb/d lower than the Russian number. I think the EIA reduces the Russian numbers by 400 kb/d to subtract out the NGPL’s that Russia includes.
I have no idea why the EIA has different numbers than Russia but I suspect they are using a heavier number than 7.33 barrels per ton as Russia does. But I assure you, Russia is reporting C+C and the data found at the site in my previous post is always C+C and never NGLs.
If you noticed, the EIA has the same problem with Canada, always reporting less than what the Canadian Energy Board reports.
One more thing. Condensate is always measured in barrels. (Or in Russian in tonns>) NGLs are measured in kilograms when compressed as a liquid. Or sometimes stated as BOEs, Barrels of Oil Equilivant. Propane has a boiling point of -44 F. That is, below that temperature it is a liquid. That is how it is bottled. It is cooled to a liquid, then bottled. It remains a liquid when it sits at room temperature though the pressure increases dramatically.
Ron,
The difference is how Canada and Russia report pentanes plus output from Natural Gas processing facilities compared to the US. Canada and Russia do this right and include the pentanes plus as part of total C+C output.
Note that chemically the pentanes plus is condensate and no different from lease condensate except that is comes from a natural gas processing facility rather than simply condensing from the produced gas at the lease.
The US inexpilcably excludes this from C+C production and only includes lease condensate, excluding any of the pentanes plus from C plus C output.
”The US inexplicably excludes this from C+C production and only includes lease condensate, excluding any of the pentane plus from C plus C output.” Perhaps it is because that at atmospheric pression, pentane is liquid and butane and the lesser fraction (propane, ethane, methane) are gazeous. They make perhaps a difference between the liquid fractions (pentane and after) and the gazeous fractions (butane and before).
Okay, I found this at EIA Definitions, Sources and Explanatory Notes
Small amounts of hydrocarbons that exist in gaseous phase in natural underground reservoirs but are liquid at atmospheric pressure after being recovered from oil well (casinghead) gas in lease separators and are subsequently commingled with the crude stream without being separately measured. Lease condensate recovered as a liquid from natural gas wells in lease or field separation facilities and later mixed into the crude stream is also included.
Liquids produced at natural gas processing plants are excluded.
I take that last sentence to mean that NGLs are excluded. However, the above paragraph seems to mean that condensate from oil wells or gas wells, both, are included in C+C. Note: There are separation facilities in the field that separate the gas from condensate before it is piped on to the natural gas processing plant.
Ron
Maybe this phrase: “Liquids produced at natural gas processing plants are excluded” is saying that any condensate (pentanes and up) that are recovered at a NG plant are excluded.
In cooling the NG to extract the ethane, butane and propane some pentanes and higher will also condense out and the EIA has decided that these will not be included in their C + C numbers.
That could be why I had the impression that the EIA only counted condensate from oil wells in the C + C numbers.
Ovi,
Everything you said except the last sentence is correct. Any condensate collected in the field (whether from an oil well or a gas well) is included in the C plus C numbers from the EIA, but the pentanes plus from natural gas precessing plants are excluded for no apparent reason.
Dennis
I think that is what I said: “EIA has decided that these will NOT be included in their C + C numbers.
Ovi read last sentence of comment I referred to , you said oil wells correct statement would read oil and gas wells and also use the term lease condensate which refers to clnensate gathered in the field rather than at the natural gas processing facility.
Ron,
Some of the NGL produced at natural gas processing plants is pentane plus, and is considered a part of NGL. These pentanes from the natural gas processing plants are excluded from the C plus C totals.
See
https://www.eia.gov/dnav/pet/pet_pnp_gp_dc_nus_mbblpd_m.htm
In June 2021 US NGL output was 5474 kb/d and 631 kb/d of this total was pentanes plus, roughly 11.5% of the barrels of NGL produced. Chemically the pentanes plus produced at the natural gas processing plant is identical to the lease condensate that is mixed with the crude in the oil field.
Canada and Russia add these liquids (the pentanes plus produced at natural gas processing plants) to their crude plus condensate total production. They do it correctly, the United States does not do this right and it makes the EIA international crude plus condensate estimates a bit lower than they should be.
Dennis, I agree completely. Finally, something we can agree on. 😉
Cool thx.
To put that amount of NGLs ~ 5 1/2 million barrels per day – into some context, that is comparable to, or exceeds, US daily crude production from 2004 thru 2010.
While much attention placed upon the 2 1/2 – 3 million bbld of US oil that is exported, the propane/ethane/butane exports are only slightly lagging at 2.2 million bbld.
New plants opening up in China, India, and Europe will continue to be supplied with US NGLs.
Dennis, I don’t doubt that some condensate, along with other finished liquids like gasoline, diesel, and kerosene are removed from natural gas at the gas plant. But I would think the amount would be negligible. From the same link as above:
Natural Gas Plant Liquids (NGPLs)
Those hydrocarbons in natural gas that are separated as liquids at natural gas processing plants, fractionating and cycling plants, and, in some instances, field facilities. Lease condensate is excluded. Products obtained include ethane; liquefied petroleum gases (propane, butanes, propane-butane mixtures, ethane-propane mixtures); isopentane; and other small quantities of finished products, such as motor gasoline, special naphthas, jet fuel, kerosene, and distillate fuel oil.
Dennis, after thinking about it, you are probably right. But in that case, I think Russia and Canada are correct and the EIA is wrong by not including ALL condensate. After all, condensate is condensate. If you had one type in a barrel and the other type in another barrel, you could not tell them apart.
Why should one type of condensate be counted and the exact same type, (chemically), be not counted as part of C+C?
Ron,
Agreed. No logical reason, I think they do it that way because that’s how they always did it, when natural gas output was small (or most of it was simply flared) it didn’t matter much, today it is a significant number, more than the three smallest OPEC producers average output of crude.
Natural gas in Europe is trading at 121 dollars per boe right now (61 euros per MWh).
https://www.theice.com/products/27996665/Dutch-TTF-Gas-Futures/data?marketId=5285052
Well electricity is at 160 euro/MW now, we can thank the “going green” for that and it has just begun. A lot of people will have to learn the hard way this coming winter what virtue signaling, dismantling base load and building wind will do to the wallet.
European governments, media and elites, are entirely clueless as to how their economies really work. They think they are financial systems and that growth and prosperity can be created by manipulating interest rates and money supply. In this view, the economy is a metaphysical construct, that can continue to grow without any increase in consumption of real resources. If one believes that, then fossil fuel depletion will not appear to be a big problem and there is no reason why the economy cannot transition to low EROI renewable energy sources, as in this model, the economy can keep growing without any need to increase the supply of real inputs. Yet the financial view of the economy falls to pieces as soon as one understands what it actually is at a microlevel: the production and exchange of goods and services between human beings. Money is simply an agreed medium of exchange; an enabling agent. The economy is a thermodynamic machine. Literally everything of value that the human economy produces is the product of energy acting on matter in one way or another. Over the past forty years or so, western economies have been facing declining growth and prosperity started shrinking in most Western countries shortly after the turn of the century. This declining prosperity was routed in the declining EROI and surplus energy of fossil fuels. Politicians, who rely on GDP interpretations of the economy, have not understood what has taken place. Very soon, shrinking EROI will be compounded by actual shortages. This will come as a surprise only to those that haven’t been paying attention. The writing has been on the wall for a long time. Ask yourself, what sort of an economy has to price credit beneath inflation?
Part of the problem is that so few politicians come from STEM backgrounds. A physicist has more hope of understanding the economy than an economist, because the former will understand that the economy is a thermodynamic machine and an energy system. The later will treat it as a financial system and will then be puzzled by the declining prosperity that his financial models fail to explain.
If there is a practical solution to our surplus energy problem, it lies with high EROI alternative energy sources, based upon nuclear fission and fusion. Trying to transition to low EROI ambient energy is a complete waste of time and will make our problems worse. We need a renaissance in understanding of our economy as an energy system, coupled with a rapid transition of our energy base from chemical to nuclear. Don’t expect this to happen under neoliberal governments presently in power across the west. Things need to get worse before they can get better.
Tony,
Very well written. I agree, nuclear fusion and fission are the only possible solutions if human beings have to maintain and grow their civilisation. However, fusion has still not been perfected in a lab environment and there is some ways to go still to productionalise it in the mass market.
Hopefully too, some day we have a better, more energy dense storage medium than the lithium ion in vogue currently.
We are in for a world of hurt and pain during the energy transition over the next 30-50 years. Oil will play a big role as will other hydrocarbons, but they will not last beyond that time. The world must transition to nuclear fusion or we will transition back to medieval levels of energy consumption and hence civilisation.
Ancientarcher and Tony,
When the cost of electricity produced by fission and fusion (which so far remains unproven) is lower than that from wind and solar they will become dominant, though we can place those in your backyards, not mine.
Wind and solar are not low EROI, especially if E is exergy. From an Exergy perspective fossil fuel used for producing electricity must be discounted by 50% at minimum.
For a different perspective see
https://www.resilience.org/stories/2017-03-15/eroei-matters-role-net-energy-survival-civilization/
The article indicates that wind and solar have adequate EROEIs at 20 and 10, respectively. I’d note that the source given in the article cites data that is about 15 years old. Solar in particular has dropped in cost by about 90% since then – I think we can expect a sharp rise in EROEI as well.
The EROI of Solar PV is 2-3 in southern Europe, according to the most comprehensive EROI analysis carried out by Hall (the inventor of the EROU concept) for Spanish PV developments. For wind power in Northern Europe, the figure is closer to 20 when all inputs are considered. But neither estimate accounts for additional net energy invested in storage (and losses) or backup power plants. We need an EROI of >11, just to run modern civilisation and maintain infrastructure without any expectations of growth. This suggests that Solar PV is entirely inadequate as anything more than a niche solution for power supply in industrial couhtries. Wind power has marginal value and arguably, a combination of onshore and offshore wind could provide sufficient electrical energy at an acceptable EROI for Northern European countries, provided that sufficient fuel was available for backup power plants and their embodied energy and capital costs were low. But there are practical problems with running a economy entirely on electricity. The EROI of wind is insufficient for supporting large scale production of synthetic fuels, though it could generate grid electricity to power efficient electric transport, like trains and tram systems. But this is unlikely to be a universally applicable solution. Northern Europe is one of the windiest locations on Earth. And even here, it would be difficult to find sufficient space for wind turbines capable of generating sufficient power to meet grid electric, industrial, heating and transport energy requirements combined.
The material requirements of PV and wind based electrical systems should also give pause for thought to anyone suggesting a large scale transition to these energy sources is practical. Western countries are presently attempting to implement an energy transition to systems that require 1-2 orders of magnitude greater embodied energy and manufactured materials than legacy fossil fuel based systems. This is a direct consequence of the low inherent power density of ambient wind and solar energy sources. We are attempting to implement a solution requiring greatly increased invested energy, using a fossil energy resource base that is shrinking. This is a situation that cannot end well. A renewable dominated energy system will require that much greater proportions of harvested energy are reinvested simply to maintain the energy system. The resulting lower net energy return will make it difficult to maintain existing systems of mining, manufacturing and distribution and impossible to maintain first world living standards.
The present apparent affordability of wind and PV systems, is a temporary nadir that has been created by the concurrence of several factors: (1) Manufacturing in China, using cheap coal based heat and electricity, along with forced labour in many cases; (2) Zero interest rate loans to the PV industry in China and export subsidies; (3) Low commodity prices, especially steel, as a consequence of low cost coal based energy (again, principally in China); (4) Favourable political environments in the western countries, which allow RE a great many direct and hidden subsidies, such as priority access to grids; (5) Very low interest rates by historical standards. RE investments are typically able to access capital at lower interest rates than other energy investments and QE has tended to reduce effective bond yields for many companies; (6) So far, the cost of RE does not incorporate the cost of supporting backup plants or adequate storage, which would substantially inflate costs. In short, many people have been lulled into a false sense of security as to how sustainable these energy options really are. There are clearly huge political and emotional attachments to these technologies and every possible mechanism has been used to bend the system in their favour. But no amount of politics and financial manipulation can change the inherently poor energy yield of a system designed to harvest low power density ambient energy. Over the next few decades, politicians, economists and the public, are going to receive some very unpalatable physics lessons in how the economy really works. I am going to make a prediction that will no doubt be unpopular with many people here, but I am certain will stand the test of time:
‘In the absence of fossil fuels, power can be produced in the large amounts needed by industrial civilisation, only by using nuclear reactors.’
‘When the cost of electricity produced by fission and fusion (which so far remains unproven) is lower than that from wind and solar they will become dominant, though we can place those in your backyards, not mine.’
France has historically had some of the lowest electricity rates in Europe, thanks entirely to series production of identical PWRs. This in a country that has none of the domestic fossil fuel resources that its neighbours have historically enjoyed. Those low electricity rates are now starting to unravel as France begins an entirely idiotic attempt to transition to wind and solar power. Germany and Denmark have the dubious honour of hosting some of the highest electricity rates in the world, thanks entirely to their political decisions to transition to low EROI ambient energy. The cross border power flows between these countries and their neighbours, now risks destabilising the entire European grid.
Whilst the EROI of light water reactors is superior to any other existing energy source, it is clear that inefficient regulatory systems and political bias can undermine even the most productive energy source. We also have the problem in the western world, that we allowed the industry and its supply chains to die in the 1990s, amidst a short sighted dash for natural gas. Now that we are attempting to build new reactors, we must resurrect entire industries and retrain workforces. Unsurprisingly, this is proving to be expensive on a per unit basis. Cumbersome regulatory regimes are also stretching build times and inflating costs. But these are all institutional problems associated with poorly designed regulation and attempting to restart a dead industry. They are not inherent factors that will neccesarily be applicable in the future. Series production of units can be carried out at capital costs beneath $1000/kW under sensible regulatory arrangements. The Chinese and Koreans are building reactor plants at a fraction of the cost that we are able to in the West. They are doing this through series production of standard designs. There is no practical reason why we in the West cannot do the same.
As for Dennis’ comment regarding not wanting them in his back yard, he should consider that he has roughly a 1 in 10 chance of dying from a disease caused or aggrevated by fossil fuel air pollution as things stand. The chances of dying from radioactive pollution from a nuclear accident are at least six orders of magnitude lower. And that is assuming you live within 10 miles of a nuclear power reactor.
TonyH,
The folks from Fukishima might have a different perspecive.
I would shut down all coal fired electric power first, then natural gas, in the west there is close to zero ourput from oil fired power plants. Hydro, geothermal, wind and solar could go in my back yard, but I will let you take the fusion and fission powered facilities.
The EROI doesn’t matter at all – all that matters are the complete costs and manpower included. And it has to be positive.
Brown coal here has a EROI of less than 10 – but is the most cheap of reliable energy sources (Solar wind still has no storage).
Why a so low EROI? Round about 10% of the power output of the attached power plant is used to power the (all electric) mining equipment. Excavating the open pit mine, and refilling it takes it’s toll. And in the last 20 years, the EROI was reduced more by sophisticated gas cleaning installations to reduce pollution. During the DDR times, you could even see the pollution in 100 miles distance.
But it are a few people operating these multi megawatt huge machines, so the manpower stretch on the society is very low.
The complete opposite is rooftop solar – lot’s of craftsmen needed to install and maintain it. With their tool and truck pool. It’s the main part, the module factory is only the small part of the effort.
Energy invested directly equates to manpower invested. In reality that invested energy is in the form of processed raw materials, like concrete, steel parts, panels, etc. These have to be mined, manufactured and assembled by real people, operating machines and using their hands. So low EROI inevitably means more manpower per unit energy.
If EROI expectations fail to align with cost, then it is a sure sign that other distortions are skewing the situation. In the case of solar PV, there are direct subsidies in manufacture, export, power system finance and hidden subsidies, such as privileged grid access, access to lower interest rate capital, freedom from backup power costs, etc. We are left with the situation where arguably the least effective and sustainable energy source, appears to cheap at the market level. The problem is that this situation depends upon circumstances that are unsustainable in the long-term.
“So low EROI inevitably means more manpower per unit energy.”
Not completely as I told. We are in the machine age, not the bronce age anymore.
You have high energy and low energy industries – big steel / concrete construction and mining as in my brown coal example is a lot of energy and low manpower. In all steps of the chain. Big machines with huge energy hunger all over the place, low number of operators. From iron ore mining to the furnace to coal mining to big machines construction.
Rooftop solar (in opposite to industrial scale desert solar) is the opposite – lot’s of people using medium or low energy tools or even their biological power (carrying panels to the location). So it’s medium energy and huge manpower.
You are right with the subsidies. They add to billions here, and still no backup concept beside powering up the old gas and coal plants. And they want to abandom them, with still no real backup concept in planning besides the hopes you have wind when there is no sun.
Natural gas in Europe up another 7% today:
https://www.barchart.com/futures/quotes/TG*1
A comment posted on OFW .
geno mir says:
September 13, 2021 at 10:25 am
I spoke with a guy from the bulgarian gas company (associate director level). Here’s ehat he said: russia is delivering all th3 contracted volumes and almost nothing more through the pipes but 4ussia is selling enormous volumes through the LNG terminal in Yamal. The LNG is flioated to EU and sold on the spot market (btw mainly by usa companies). Russia is just bitchslapping EU with the spot market using the own EU regulation framework.
Imo it’s about time for the russians to show my fellow europeans how business between equals should be conducted. They just simply had enough with Brussels and arw putting stop to the energy handouts.
Btw NSII is fully completed.
Putin ” the old fox ” plays chess while the EU plays checkers . 🙂
HOLE,
Interesting comment. While that this may be part of the reason for the higher European Natgas prices, according to the data that I have read, Russia has its own natural gas storage issue that it is remedying by cutting supplies to Europe while filling its underground reserves for the winter. Both Europe and Russia both had drawdowns of natural gas storage due to the cold winter.
Two news sources suggest that Russia will continue to fill its underground storage until November 1st. If this is true, Europe is going to be in a WORLD OF HURT as it has transitioned to the INSANE NON-RENEWABLE RENEWABLE NOT GREEN ENERGY Wind & Solar.
The United States will have its own problems with Natgas in the next several years, or sooner.
Welcome to PEAK EVERYTHING….
steve
No, you see, wind and solar will help us. Ignore that the wind has been barely outputting anything this summer on a scale not seen since 1961 (I can’t remember a summer with so few windy days or even rain), and also ignore that the UK has had cloud cover affecting the whole nation and especially their PV this past month.
Sure, we can overbuild to compensate, but what good is that if there is no wind and no sun? Zero times zero = ?
And this is why the transition will not go to plan. Record energy bill increases coupled with rolling blackouts and shortages of products on the shelves, along with a massive tax hike or benefit cut, depending on your circumstance, and one has an angry populace.
The Extinction Rebellion protestors arrested for blocking the M25 today got nothing but pure vitriol poured on them nationally. Listening to LBC radio, you’d think the people telling commuters the world is literally on fire were also eating live babies before them for all the ire they caught. Never a good sign when those preaching a message of warning are shutdown like that, even if the stunts they do are stupid.
https://markets.businessinsider.com/news/commodities/europe-gas-electricity-price-surge-commodities-markets-shortages-goldman-sachs-2021-9?op=1
what good is that if there is no wind and no sun?
You know, if there’s no sun, plants die. Crops fail. Are there massive crop failures in the UK?
There is no storage.
The very moment the sun clouds, either you are lucky and you get strong wind or a nat gas powered peaker plant fires up, or you switch a rolling blackout to shed off load.
It’s that easy.
And that’s why we have a record coal usage here in Germany the first half year – not much wind and solar. And gas caverns very empty because of the winter.
Nick G:
Actually, yes: https://www.reuters.com/article/grains-germany-britain-idUSL8N2FU3MC
We had a lot of impacted harvests last year due to the weather. But you do know what I was getting at. I didn’t literally mean we had no daylight whatsoever, but overcast skies? Murders PV efficiency. That’s why we took coal power plants out of storage that are due to be knocked down in 2022.
Steve , in an earlier post someone posted that Mexico will no more export crude oil and keep all for it’s own use . I had termed it as ” resource nationalism ” . The same will come to other critical commodity exporters . example rice (India , Thailand ) , wheat (Russia) , rare earths (China ) etc . Not surprising at all . An Afghan quote ” Me , my family , my clan , my tribe , my country ” . This chronology will prevail over all agreements , understandings ever made between nations in the future .
P.S : Now we know how the Afghans outlasted the Brits , the Soviets and the USA >
HOLE,
I doubt Mexican President AMLO will halt PEMEX oil exports when over 80% of its $113 billion in debt is held by foreigners. And now with AMLO ear-marking $32 billion this year to help boost Pemex’s oil production, it will most certainly need to get some return revenues from its oil exports that are now making decent money with the higher oil price.
But, let’s see what happens with Mexico’s oil production in the next 5-10 years. I don’t have much faith that Mexican oil production will remain in the 1.7-1.8 mbd for the next 5-10 years. Pemex oil production will likely begin to collapse as the Debt bubble bursts… thus Mexico will no longer be able to access CHEAP CREDIT.
steve
Steve , I don’t think Mexico is making any money from high oil prices . As far as I recall (at least since 5 years ) they have always hedged their production and have made positive returns even when prices crashed . They pride themselves on this achievement . I think ( could be wrong ) this time they are on the wrong side of the hedge maybe marginally . Pemex , Petrobras are nothing but junk rated entities as far as financial parameters go . The rating agencies will not downgrade them because that would put Mexican and Brazilian debt into deep junk category and a fast crash+ default . We know how deep the investment banks of New York are exposed to this debt . It is now blink blink and all is honky dory until TSHTF .
Mexico is a net importer of oil & oil products, weighted by price. They simply can not cut off their crude exports.
Similarly, Western Canada is an exporter, but Eastern Canada is a heavy importer, so even if Canada wanted to cut off exports, they could not for economic reasons.
Cutting off oil exports in most cases would be considered an act of war: it’s what started World War II (when the US cut off commodity exports to Japan). It’s very unlikely on the part of major exporters.
On the other hand, acts of god are certainly possible: the Persian Gulf is a fragile place. Oil importers should be working to eliminate their dependence as quickly as possible. It would improve their economic (and physical) health as well as reducing import risk.
Why Bank Of America Thinks Oil Prices Are Heading To $100
If winter temperatures in the northern hemisphere turn out to be below seasonal norms, oil demand would spike and could lead to oil shooting up to the $100 mark, Bank of America Global Research said in a recent note carried by Reuters.
“We believe that the robust global oil demand recovery will outpace supply growth over the next 18 months, further draining inventories and setting the stage for higher oil prices,” analysts at BofA wrote in June, in which they significantly raised their price forecasts for next year’s average Brent Crude prices.
The IEA summary issued this morning seems to agree.
Global oil demand is estimated to have declined for three straight months due to a resurgence of Covid-19 cases in Asia. As a result, 3Q21 has been revised down by 200 kb/d since last month’s Report. Already signs are emerging of Covid cases abating with demand now expected to rebound by a sharp 1.6 mb/d in October, and continuing to grow until end-year. Global oil demand is now expected to rise by 5.2 mb/d this year and by 3.2 mb/d in 2022.
World oil supply fell 540 kb/d m-o-m in August to 96.1 mb/d and is expected to hold steady in September as unplanned outages offset increases from OPEC+. Hurricane Ida shut in 1.7 mb/d of oil production along the US Gulf Coast at end-August, with potential supply losses from the storm approaching 30 mb. An uptrend in supply should resume in October as OPEC+ continues to unwind cuts, outages are resolved and as other producers increase.
So between the end of October and December 2022, the world has to put about 4.5 Mb/d back online.
wont happen
LTO’s , as we approach the end of the oil age we are going to see a multitude of such projections ” all is well , nothing to worry ” or ” pie in the sky ” . Very few know the facts . Grab some pop corn . As the McDonalds slogan says in Belgium ” I am lovin’ it ” 🙂
Prices will rise and that will reduce demand and OPEC can put another 2 Mbpd on market, Russia, Canada, Brazil, Norway and US can also add output especially at over 80 per barrel
Dennis , I don’t understand . Increased price = lower demand is OK , but then add another 2mbpd to the market which is trending to lower demand means more lower prices , not higher prices . Which way is it ?
Hole in head,
Demand is expected to increase, that’s why 4.5 Mb/d will be needed. Only about 2 to 3 Mb/d of capacity is available so market will be short by 1.5 to 2.5 Mb/d at current oil price level. Ergo oil prices will increase and quantity of oil demanded will fall and oil companies will increase investment in response to higher oil prices. Some of the investment will see a short time lag as in tight oil and onshore brownfield development, other projects such as deepwater offshore new field development and arctic oil will have a longer lag time between FID (final investment decision) and increases in output.
Another outstanding post from Matt down under, on Asia oil production and consumption.
Its a story of depletion, and huge imbalance.
http://crudeoilpeak.info/asia-pacific-peak-oil-2020-production-continued-decline-at-2-7-pa
Tks Hicks for the link . FUBAR .
The atomic age way of fixing a blow out, a thermonuclear explosion!
In 1966
The Soviet Union detonated a 30-kiloton nuclear explosive at a depth of 1532 m to extinguish a fire that raged out of control for three years in a natural gas field Urta-Bulak in Uzbekistan (Central Asia). The experiment saved vast reserves of natural gas.
https://www.youtube.com/watch?v=2KJ6p4JVN4g
Companies are running out of viable DUC’s .
https://www.reuters.com/business/energy/oil-well-backlog-shrinks-us-shale-may-upset-investors-drill-more-2021-09-14/
HH,
Thanks for the post. This continues to confirm what we were seeing as a Shale Producer over the past 12 months. Shrinking inventory, reduction of DUCs, paying down debt, paying out dividends and finally the PE Scumbags are fleeing in droves, The Seneca cliff is closer than us than we originally predicted and Energy Poverty is coming.
With global oil now in the early depletion/decline mode this decade, and coal consumption in early global decline since 2014, we all can agree that all things energy are changing.
Apparently thats about where understandings diverge.
A few comments in response to multiple comments earlier in this thread-
1. The US can do just fine with less energy/capita. For comparison, the countries of Germany,Japan, UK, France, and many others use about 1/2 or less the energy per person than the US. We will move in that direction, either with purpose and planning, or in a more painful and chaotic way.
2. The issue of the Perpetual Energy sources wind and solar having poor Energy Return on Energy Invested, or requiring more metals and materials than can be ‘earned’ by the collectors/turbines is based on old fallacy rather than a staightup engineering/economic analysis.
Read on it here if you’d like to keep up to date on energy issues
https://www.bnl.gov/pv/files/pdf/PE_Magazine_Fthenakis_2_10_12.pdf
On Photovoltaics-
‘Their energy payback times (EPBT)—the time it takes to produce
all the energy used in their life cycles—currently are between six
months to two years, depending on the location/solar irradiation
and the technology. And with expected life times of 30 years, their
ERRs are in the range of 60:1 to 15:1’
‘The life cycle of photovoltaics starts from the extraction of raw mate-
rials (cradle) and ends with the disposal (grave) or recycling and
recovery (cradle) of the PV components (Figure 2). The mining of raw
materials such as quartz sand for silicon PVs, and copper, zinc, and
aluminum ores for mounting structures and thin-film semiconduc-
tors, is followed by separation and purification stages…. ‘
The EROI (or EPBT) of real systems, depends upon where the panel is and where the analysts set the system boundaries. An EPBT based upon the manufacturing of a panel or module, without any inclusion of steel frames or concrete foundations will underestimate the embodied energy of the entire system. Likewise, the embodied energy of the inverters, transformers and grid connection. For the panel alone, an EPBT of two years may be realistic in SW USA, with its high annual solar flux.
For Spain, which is a long way further north than New Mexico, Hall and Prieto calculate an EROI of 2.4, equivalent to an EPBT of 10 years. This estimate includes a lot of energy costs that most analysts would usually leave out, like the road infrastructure needed to access the plant and the grid connections and transmission from a remote site.
https://www.springer.com/gp/book/9781441994363
Other researchers put EROI estimates even lower in Northern Europe. In some cases, net energy return appears to be <1.0
https://energyskeptic.com/2021/negative-energy-return-of-solar-pv-in-northern-europe/
These poor net energy returns stem from the enormous inherent materials budgets of utility scale PV power systems. This renders PV unsustainable in most places. Roof top mounted systems, without the need for heavy frames and for which power is used on site without need for grid connection, may show better EROI. But solar power is not a good technology for grid scale electricity production in northern climates.
The prospects for wind power are better. But even this technology fails to get into double digit EROI when the energy losses in and embodied energy of energy storage are accounted for. Basically, if you have a fossil fuel dominated electricity supply, the best you can hope to achieve with wind is to reduce the fuel bill at existing power plants. It is unlikely that this will provide net economic benefit, given that capital, operating and maintenance costs at the FF power plant still need to be paid for. But if you have genuine fuel shortages, it may help a little.
Avoid getting into an discussion on renewables and stuff . UK has learnt it’s lesson and Europe is learning it’s . There are no free lunches and the period required for transition is no more there .We even wasted the cushion provided by the money looser shale oil . I can post multiple links but will desist because all commentators know everything that I know . There is an age of actions and an age of consequences . We are there now ” up the creek without a paddle ” . Prepare to face the consequences .
Hole in Head
“There are no free lunches” is nonsense. For example trade is a free lunch. You have two people, each has something that is worth more to his neighbor than it is to himself, so they swap. Both sides win. It’s a free lunch.
As Adam Smith pointed out centuries ago, free lunches are a natural consequence of specialization. I plant potatoes, you plant cabbage. We both develop expertise. I have more potatoes than I want, you have more cabbage than you want. So we swap. Both sides win, it’s a free lunch. That’s basic economics.
Also sunshine is a free lunch. Without it the atmosphere would freeze to pools of liquid nitrogen. But it doesn’t. and nobody pays for it. The amount of energy involved is far beyond anything humans can produce.
The Sun emits the equivalent of 4 × 1026 J of energy each second, by comparison, some 2 billion times more energy than the Tsar Bomba gave off (the most powerful hydrogen bomb ever).
Calling it “ambient” energy is a red herring. There is no need to produce nuclear energy here on earth when catching and accumulating it for useful purposes here on earth is established science and proven to be more affordable than any other energy resource. The battery issue will get worked out shortly now that we are actually devoting resources towards it.
It is irrelevant how many watts the sun is producing. What matters is the energy profit ratio of the systems that harness it. This what is overwhelmingly important in the ability of an energy source to produce the abundant and cheap power that is necessary to support a materially abundant society. This basic point doesn’t seem to be well understood by a lot of people who concern themselves with future energy supply. Supply also needs to match demand. Intermittent power production is therefore another expression of entropy that must be overcome with more investment, before an intermittent energy can provide an output that is useful.
It is precisely the declining energy profit ratio of fossil fuels that is at the heart of the economic problems that led up to the Great Recession of 2008 and hinders a recovery to this day. Replacing fossil fuels with solar power only makes sense for the human economy, if the latter can produce usable exergy at better profit ratio than fossil fuels. So far, this has most definitely not been the case. And supporting solar power with hidden and open subsidies, like cheap coal based electricity in China, masks the problem but does not solve it. The problem is rooted in physics: Solar energy has low power density than competing fossil and fission energy sources and therefore more equipment and embodied energy are needed to produce power in this way. There is no way around that fact. It may be mitigated by new technology, but technology cannot change the nature of the resource.
Below is a link to the 2015 Quadrennial energy review, produced by the US department of energy. A reliable enough source?
https://www.energy.gov/quadrennial-technology-review-2015
Go to Section 10, Table 10.4 for a summary of materials inputs into several different types of powerplant in ton/TWh. Here are some tallys per TWh:
Nuclear (PWR) = 760t concrete / cement; 3t copper; 0t glass; 160t steel; 0t aluminium.
Wind = 8000t concrete / cement; 23t copper; 92t glass; 1800t steel; 35t aluminium.
Solar PV = 4050t concrete / cement; 850t copper; 2700t glass; 7900t steel; 680t aluminium.
And these resource estimates do not include any resources embodied in backup and storage. They do suggest that wind power has a better sustainability potential than solar power. This is largely because the Earth atmosphere functions as a heat engine, distributing heat from hot regions to colder one’s. Using the wind allows us to sidestep a large part of the investment needed in capturing exergy from sunlight.
The best option going forward with RE is to focus predominantly on wind power and examine options for minimising rather than eliminating FF consumption.
Large amounts of final energy consumption are in the form of heat. One option for powering a society using a majority of wind energy, would be to oversize capacity relative to baseload. Excess power could be stored cheaply as end use heat. The remaining more limited lulls in wind power generation (when it fails to meet non-heat baseload) could be filled by open cycle gas turbines burning LNG and biogas. These have low capital and operating cost, but relatively high fuel cost. However, modern GTs have efficiency in excess of 40%.
Storing energy as heat is also a very affordable option. Hot water and hot rock are almost free materials and can be stored cheaply in insulated tanks. This would appear to be a minimum cost approach and it also happens to be the one with minimum embodied energy, which is unlikely to be a coincidence. But it does suggest to me that storage is best considered as an end use, rather than a supply side option. There is little value in pursuing battery technologies for grid electric storage, although some battery capacity is essential for frequency control.
A nuclear based system has lower embodied energy, so it will provide the lowest whole system cost when delivered at scale. This has already been demonstrated in France, where nuclear power provides the bulk of electricity. The fact is that the economics of new nuclear power reactors have been skewed in the western world, by a combination of cumbersome regulatory requirements, political bias against the energy source, lack of supply chains and trained labour in resurrecting nuclear build capability, and lack of scale economies. But these are problems that we have made for ourselves, they are not inherent problems with the technology. They can therefore be overcome. The problems with renewable energy are basic physics problems. Not likely to be overcome.
TonyH,
Note that the very poor EROI cited for solar in Spain is based on including everything in the EROI calculations, roads, fences, etc, including all of these is never done for fossil fule EROI calculations where we would need to include pipelines, roads, petrol stations, refineries, etc in our EROI caclculations, if we also add the thermal losses in converting energy to work for fossil fuels the EROI gets quite low for fossil fuel and probably for Nuclear power as well. Energy density is nor really all that important for electric power production, there are lots of places where there is plenty of space for wind turbines and solar arrays, as to intermittancy, a well connected widely dispersed set of wind and solar resources will require perhaps 5% of average load to be backed up as long as the wind and solar are overbuilt by about a factor of 3 and it will likely still be cheaper and safer than Nuclear power.
Dennis, EROI could increase by a factor of 2 or 3 over what Hall calculated and it wouldn’t change the conclusion. Solar PV is a Ponzi scheme as far as bulk electricity is concerned. Expecting PV and wind power to replace the energy currently sourced from fossil fuels is unrealistic. They just aren’t in the same ballpark in terms of the resource investment needed to make them work. The only way that could happen, is if FF EROI declined to the point where renewable EROI, bad as it is, is superior. But society will face a maintenance crisis before that happens and will collapse.
Building three times as much solar capacity will increase the required energy and materials budget by the same proportion. It only helps if you can find an efficient way of using the over-produced power for something else that can use intermittent energy without a penalty. But Solar PV EROI is unworkable, before we even account for energy lost in storage and power balancing strategies. It just isn’t a viable solution as things stand.
And even with enormous institutional leverage in their favour, wind and solar power are making capacity additions that will fail to replace more than a modest fraction of fossil fuel energy consumption by the middle of this century. Remember, electricity is only part of our energy supply problem. Conditions for RE will never be better than they are now. Huge amounts of QE money inflating company stocks; close to zero interest rates and unprecedented discount rates for RE, lower than any other major investment; use of Chinese coal-based electricity for production of panels; feed-in tariffs, export subsidies, you name it. With everything going in its favour, one wonders why solar power isn’t completely free? But ultimately, all of this subsidy cannot overcome their rubbish net energy returns. By the way, the EROI calculations for FF electricity and nuclear power reactors, do account for the thermodynamic efficiency of power plants. Electricity is the output of interest in powerplant EROI studies. What many EROI studies fail to do, is account for the energy cost of converting intermittent electricity into reliable baseload power.
I am frankly amazed by the extent to which people on this site are prepared to ignore scientific reality and look a gift horse in the mouth, whenever it happens to be suit a pre-established prejudice. What you are doing is exactly what you accuse global warming sceptics and anti-vaxers of doing – ignoring science that contradicts a personal prejudice. Apparently, it is less reprehensible when you do it.
When I visited this site a week ago, I thought Ron was over-pessimistic and unwilling to consider new solutions. I think now that he has had years of you people and has lost patience with foolish cornocopians, who are not grounded in reality and ignore the science that doesn’t tell them what they want to hear.
You bring up good points Tony, I appreciate your well reasoned skepticism.
Tony- it is pretty simple thing to understand
Wind energy makes sense [excellent EROI] where it is very windy.
Solar energy makes sense [excellent EROI] where it is plenty sunny.
Northern Europe is not a place where I would want to rely on or invest in solar. It would be like drilling for oil in Salem Oregon- good luck.
If you are interested in exploring the geographic distribution of the massive global solar and wind resource than here is your tool-
solar https://globalsolaratlas.info/map
wind https://globalwindatlas.info/
solar best at sites roughly over 1600 kWh/m2 for [Global tilted irradiation at optimum angle]
wind best at sites roughly over 6.5 m/s at 100m [Mean Wind speed]
Those places are the where about 100% of the investment in these sources should been going, IMO.
Thanks for the links. But I would argue that investment in low grade ambient energy sources is a complete waste of resources practically everywhere it is being attempted. It demonstrates widespread ignorance of the importance of surplus energy as the foundation of wealth. The only place it makes sense is for relatively small off-grid applications, where a connection would be too expensive.
These sources cannot free us from fossil fuels. Fossil fuels are needed in every step of their manufacture and assembly. And their EROI is too poor to maintain society without the subsidy of fossil fuels. They have shown marginal value in reducing fossil fuel consumption in existing powerplants. But there is no hope of providing the storage necessary for these energy sources to stand alone without fatally compromising their net energy return.
Europe is about to learn the hard way that controllable, high EROI energy is not something that an industrial society can go without if its people want to lead comfortable industrial lifestyles. It is time to face the fact that nuclear energy sources are not simply one amongst many options. They are the only option capable of powering our societies into the future, given the depletion of fossil fuels and the complete inadequacy of ambient energy sources.
These talking points hold no water Tony.
In the real world the utilities of dozens of countries across the world have found that they can get very solid return on investment for energy produced by solar and wind- including accounting and expense of all energy and material input costs.
Take Iowa for example- about 57% of the states electricity is now from wind, and it can electrocute a person just as easily as if was from a coal burning turbine. The average retail price of electricity in Iowa is $0.09/kwh which is about 15% less than the average national price.
These sources of energy (solar and wind) are excellent parts of the nations energy tool kit.
Sure better than having an energy barrel that starts getting smaller each year.
Once again, oil is too important to be used simply for light transport (which is the majority of its use currently).
Much of oil energy goes to driving cars solo. With a 200 lb payload in a 4,000 lb vehicle, we are at best 5% efficient. Unfortunately ICE cars are only about 20% efficient, leaving us at a mobility efficiency level of roughly 1%. I can guarantee we will improve this number rather than let civilization fail. EVs are 4-5 times as efficient so expect them to be sold out for the next decade or two. If you don’t have one yet, get in line ASAP unless you like being poor. Functional AV taxis are still 3-7 years out in any quantity so don’t count on that. If you don’t think a reasonably sized PV system can power a home and a small EV for all your energy needs in North America, I recommend you get out more, because many folks are already there.
An example of the reality on the ground Tony-
One of the top ten biggest wind projects commissioned this year in the US
“NextEra Energy owns the 400-MW Jordan Creek Wind Farm in Warren, Indiana, featuring 146 GE wind turbines. The project provides approximately $75 million in payments to landowners and generates approximately $590 million in tax revenue for Benton and Warren counties.”
note- Next Era Energy is the nations largest utility.
TONYH
You may think it’s a waste of money, but it is happening.
https://www.npr.org/2021/05/11/995849954/renewable-energy-capacity-jumped-45-worldwide-in-2020-iea-sees-new-normal
‘Despite those changes, solar energy development “will continue to break records,” the IEA says, predicting that annual capacity additions will hit 162 gigawatts by the end of next year – almost 50% higher than the solar capacity gains in the pre-pandemic era of 2019.’
That is not very much for the entire world is it? Especially when you consider that the capacity factor of solar is 10-20%. Also, more than half of that capacity addition is in China. The Chinese are facing production constraints in coal. Installing wind and solar capacity and using coal plants as backup units is a way of stretching coal supplies, albeit at high cost. The Chinese are expanding nuclear power capacity at what looks like an exponential rate. But they are starting from a low base. So I guess their strategy is to stretch coal energy as far as they can, until nuclear reactor capacity addition is able to exceed the decline rate of coal. Renewable energy may have a transitory roal in helping them to achieve this.
The future of China as an industrial country, really does depend upon whether they can expand nuclear power quickly enough and cushion the decline in native coal production for long enough, to avoid crippling energy shortages that would lead to systematic collapse. I thing it is doubtful that they will succeed. But one should be wary of underestimating the Chinese. They seem to be able to get things done very quickly when they make it a priority.
162 GW is more than the combined average electricity production of UK, France and Germany.
I’m not sure what you mean by “an exponential rate”. Increasing by 0.0001% is an exponential rate. Is that what you mean?
Just kidding. You seem to think “exponential” is a synonym for “very fast”. It isn’t It means “an ever increasing rate”. There isn’t any evidence that China is doing that.
Capacity is not the same as production. Capacity is what the solar power system would produce if it were in full sun (1000W/m2). If you could put it in space, high above the Earth, it would generate at that capacity full time. On the Earth surface, real time-averaged power output is 10-20% of that value, because of night, cloud cover and the axial tilt of the Earth. So that 162GW will generate 16GW on average in Northern Europe and maybe double that in Southern Europe and US. That is a large amount of power for any European nation, but a drop in the bucket for the world as a whole.
For comparison, a nuclear power reactor capacity factor is typically upwards of 90%. And importantly, you get to choose and know ahead of time, when it gets turned off for refuelling and planned maintenance. That is valuable.
I suggest you just read the wiki article on nuclear power in China. That gives a figure showing the rapid increase in capacity addition and what the Chinese are ultimately aiming at for installed capacity towards the middle of this century. The plan is for about 1000GWe of nuclear generating capacity, dominated by fast neutron reactors. Renewable energy is nothing more than a ploy to extend existing coal reserves while they ramp nuclear capacity up. They appear to be doing this very effectively. But mother nature may call time on them, if there are significant declines in fossil fuel availability before nuclear power can be scaled up.
lets try to keep terminology on the factual side-
Capacity [nameplate] of a power plant is the theoretical instantaneous maximum output, kind of like vehicle horsepower. If a power plate is shut down (solar at night/nuclear when the uranium rods are being replaced) it is like a vehicle sitting in the driveway without the engine running. Capacity doesn’t matter when a plant is idle or operating at less than maximum. To take that into account we rely on the Capacity Factor-
Capacity Factor [CF] is a whole different deal. It is the long term average output of a power plant, generally on an annual or longer term basis- ‘what was the actual output’ as a percent of possible maximum.
For example- the exact same wind turbine may have a CF in a very wind location of 42%, whereas the same turbine placed in a calmer area or on a shorter tower may have a CF less than 18%
It is interesting to look at the trend of new wind energy CF’s for turbines installed over time. CF has increased from around 22% to 40% over the last 20 years as the towers and equipment have gotten bigger/better.
Informative links showing this stuff-
https://www.statista.com/statistics/183680/us-average-capacity-factors-by-selected-energy-source-since-1998/
https://emp.lbl.gov/sites/default/files/2020_wind_energy_technology_data_update.pdf
https://emp.lbl.gov/wind-power-performance
Capacity factor for wind turbines are a function of siting. For offshore wind in the North Sea, far from coasts, capacity factor can exceed 40%. But that is exceptional and not a globally applicable figure. Taking the same turbine, irrespective of size and quality and placing it in the continental US, will not give you a remotely comparable capacity factor. The same turbine placed in mainland Europe, will never achieve a capacity factor greater than 25%, regardless of reliability or tower height. Some problems are grounded in physics. And physics determines your solution scope.
If you check the links I supplied you will see that the USA onshore capacity factor for 2020 is 35,4%
This includes all grid connected turbines, whether old and small or bigger and newer.
https://www.statista.com/statistics/183680/us-average-capacity-factors-by-selected-energy-source-since-1998/
Another Russian Update
Russian oil output climbs in line with OPEC quota deal
MOSCOW (Bloomberg) –Russia’s crude oil and condensate output jumped in the first weeks of September as some of the nation’s key producers ramped up in line with the OPEC deal and Gazprom PJSC recovered from a fire at a facility in West Siberia.
The nation pumped an average of 1,456.9 thousand tons of oil per day between September 1 and 13, according to data from the Energy Ministry’s CDU-TEK unit seen by Bloomberg. That equals 10.679 million barrels per day, based on a 7.33 barrel-per-ton conversion ratio, which is 2.4% above August’s level. (My comment: The Energy Ministry info for August was 10.43 Mb/d. If this report is correct, that’s an increase of 250 kb/d.)
If that rate of production is maintained for the whole of September, it would be the biggest monthly increase in Russian production in just over a year. The country’s output on September 13 rose to 10.72 million barrels, indicating the full-month average may be higher than in the first weeks.
The gain was mainly driven by a 13.9% hike in production at Rosneft PJSC’s Bashneft unit and an 11.9% increase in the output of smaller oil producers, which include Gazprom.
https://www.worldoil.com/news/2021/9/14/russian-oil-output-climbs-in-line-with-opec-quota-deal
which countries are most dependent on oil consumption to go about their business?
Here is a list of some of the bigger economies ranked by oil consumption/capita-
Oil Consumption/ capita 2020 [in TWhr/million]-
USA 27.3
S. Korea 26.7
Japan 14.3
Germany 13.9
EU Combined 12.4
France 11.4
UK 9.3
China 5.5
India 1.8
This is only part of the story, since some countries have not tried to cut back yet (USA), while others without domestic supply have given some degree of effort in that regard, such as the EU countries.
Also, some heavy consuming countries import all of their oil such as S.Korea or Germany, while others do have some portion of domestic production such as US,China,UK
And then we have variable degrees of domestic oil production decline rates to consider.
Its going to be a big crunch for the people who are used to consuming lot of oil, especially if they don’t implement methods to get their business done with less.
Only a few choices in that regard.
-Use oil more efficiently, such as better mileage vehicles.
-Use oil less, such as dropping all discretionary/optional uses, and driving slower.
-Switch to vehicles with plugs.
Reducing fuel consumption would be pretty easy in the US. Average fuel economy for vehicles on the road is only about 23 miles per gallon. Average occupancy is only 1.2 persons per vehicle!
I know I’ve talked about how there is a dollar shortage outside the US on numerous occasions. Well the situation in China around the Evergrande bonds is exactly what I’ve been talking about. They can’t paper it over either. Because they are dollar denominated bonds. They can’t print dollars to make everything ok here. And it’s about $300 billion. So if the CCP and central bank don’t have the dollars to do a bailout. Which we will know fairly soon if they do or don’t. Or if they are unwilling it’s a major problem.
Now maybe worst case scenario doesn’t play out here. But keep a eye on this situation. If there is one thing out there that could send oil price back to $30 or less it would be a blow up and domino effects of a dollar debt meltdown.
If you were a betting man (I know you trade at least), would you say the CCP is voluntarily letting the buck stop with Evergrande to avoid setting a precedent like the TARP in 2008 did? Or would you say they literally cannot afford this bailout and so are hoping this doesn’t blow up and cause contagion?
Can the CCP do massive stimulus? When clearly judging by their recent moves selling reserve commodities including oil to try to hold prices down. Inflation is a problem.
Might be a dammed if you do dammed if you don’t situation.
It’s not clear yet if there is a way to contain this. But like I said it something to keep eye on. But if your long oil or pretty much long anything right now. This is where the risk is.
It’s not clear that the CCP and central bank have US dollars to spare to do a bailout. These bonds are US dollar denominated. Which CCP can’t create out of nothing. If they bail this out they might not have the US dollars they need to do other stuff like import food.
Or better yet they might not have the US dollars they will need to import oil if they do this bailout.
But if they don’t bailout it out a long list of problems and consequences show up.
HHH , looking at the recent actions of the CCP viz ; Didi , Breakup AntPay , roast Jackie Ma , straighten out celebrities , teach Xi Ping’s thoughts in school seems they are moving in the direction of straightening the line . Chinese leadership has more STEM graduates than the US (political animals) . I have a strange feeling that they have realized that future high growth rates are not possible and are preparing the public for “degrowth ” . In such a case making an example of Evergrande would be in line . They can always use the iron fist to crush unrest and then apply balm by giving the assets to the small investors by spreading the properties over a wide populace . $ 300 billion is I think 20% of China’s exchange reserve and bailing out will sure put a dent . Question : Who owns the debt ? US investment banks viz Blackrock , Fidelity , JPM etc or Chinese entities and the general public at large . If it is the US banks ,should China worry ? let them eat the losses . Yes , it could create a problem for the future funding but then the these investment banks have lent money to Argentina even after 5 defaults . ” Greed is good ” — Gordon Gecko (Micheal Douglas)
I don’t believe a bailout is forthcoming. And they’d have to sell US treasuries to to tap that exchange reserves. Which could be problematic for them.
Not that they couldn’t sell them but they run a currency peg. If I’m right and this is just the beginning of a dollar debt meltdown. Those $2.3 trillion in Dollar reserves might not last long and you could get a potential currency crisis. By not having them.
It’s wait and see though. Potential is there for major crisis but that don’t mean it’s a sure thing.
I don’t think that you should not worry about financial issues. Chinese people have their own. The central government increased the interest rates to cope with inflation. As the result, the real estate sector is on the verge of collapse. For example, evergrande, the leader of the sector is de facto in cessation of payment : they are not paying the suppliers, the estate projects are stopped and they don’t pay anymore their own employee. They have accumulated 260 billion dollars of debts. If their collapse propagates outside China, all the discussions about the debt of USA will be secondary… https://thediplomat.com/2021/09/is-chinas-evergrande-group-too-big-to-fail/
China in 2021 looking a bit like Japan in 1989…
UPDATE 1-U.S. crude, fuel stockpiles fall in wake of Hurricane Ida – EIA
Sept 15 (Reuters) – U.S. crude oil and fuel stockpiles dropped sharply last week, as refiners in the U.S. Gulf region and oil facilities offshore were still recovering from Hurricane Ida’s hit late August, the Energy Information Administration said on Wednesday.
The 2019 BOEM GoM reserve estimate report has been issued, but is not yet available as Excel data: Estimated Oil and Gas Reserves Gulf of Mexico OCS Region December 31, 2019 https://www.boem.gov/sites/default/files/documents/renewable-energy/state-activities/2019-EOGR.pdf
Energy issues are now a world wide problem . Peak oil , peak coal ,peak gas or PEAK EVERYTHING ( Steve )
https://economictimes.indiatimes.com/industry/indl-goods/svs/metals-mining/coal-india-warned-government-of-coal-shortage-in-february-documents-show/articleshow/86226638.cms?utm_source=newsletter&utm_medium=email&utm_campaign=NewsDigest&utm_content=recommended&utm_term=1%20%20%20%20%20%20%20&ncode=6c9faa4cdb8f2ea6553bb5078c887009458ea6419d0161dc7eb120b1d965a292c442fa46f2127811fdfec909db5c1e467244f1c6446a7a03994f5f54274cb6106e2c5fa4d81a511c7c24a386720dc728
A good info-graphic showing the various product derived from each barrel of oil-
https://www.visualcapitalist.com/whats-made-barrel-of-oil/
Does anyone here know if certain end products are generally in relative shortage or abundance compared to the others? For example, is diesel in short supply but asphalt in excess? I understand this will vary quite a lot depending on the specific oil grade and type, but thats about the extent of my understanding on it.
New posts are up.
https://peakoilbarrel.com/opec-update-september-2021/
https://peakoilbarrel.com/open-thread-non-petroleum-september-16-2021/