The EIA’s Short Term Energy Outlook (STEO) was published in early June. The chart below estimates World C+C by using the STEO forecast combined with past data from the EIA on World Output.
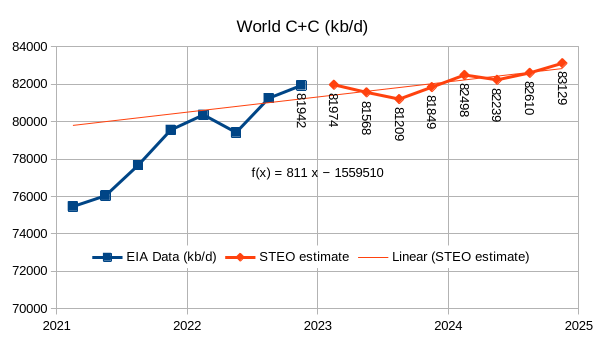
Output rises to 81849 kb/d in the final quarter of 2023 and to 83129 kb/d in 2024Q4. Annual average World C+C output was 80752 kb/d in 2022 and rises to 81650 kb/d in 2023 and to 82619 kb/d in 2024.
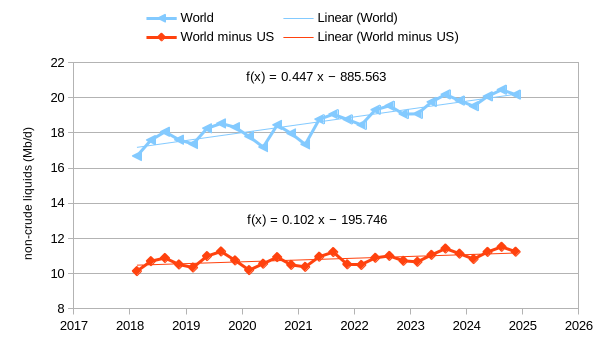
The chart above considers World non-crude liquids output (note that “crude” in this case is C+C) and compares with non-crude liquids output for the World minus US (excludes non-crude liquids produced in the US). About 77% of the increase in World non-crude liquids output over the 2018 to 2024 period will come from the US, if the STEO forecast for 2023 and 2024 is accurate (it usually is not.)
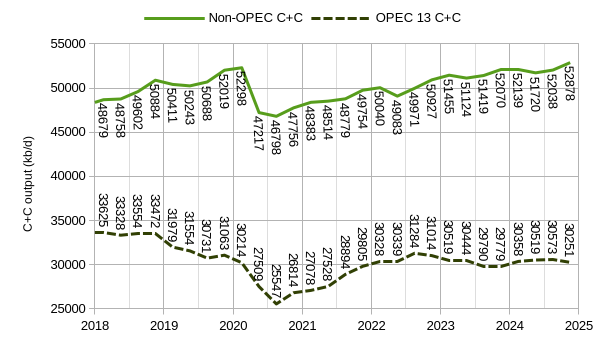
Chart above shows OPEC 13 and Non-OPEC output with STEO estimate after 2022Q4 (last 8 points on each series).
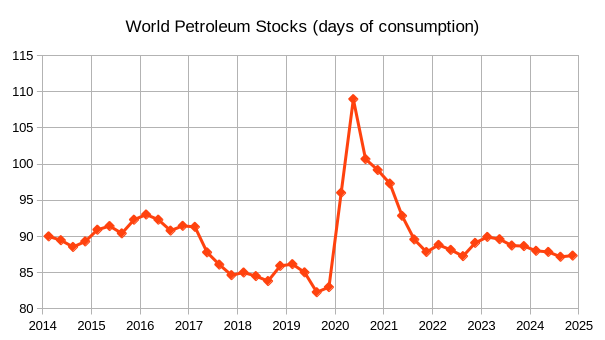
The chart above uses the EIA World liquids supply and demand balance from 2014Q1 to 2024Q4 from the STEO and assumes that in 2014Q1 the World Petroleum Stocks were 90 days of 2014Q1 consumption. Generally nations aim for about 90 days of petroleum stocks and I have assumed this aim was met in the first quarter of 2014, this choice was arbitrary. Oil prices will usually rise as stock levels fall below 90 days of consumption, though poor visibility of World stock levels make this a rough estimate (in reality it tends to be in the range of 88 to 92 days of consumption. Chart below shows average quarterly Brent Spot prices over the 2014 to 2023 period.
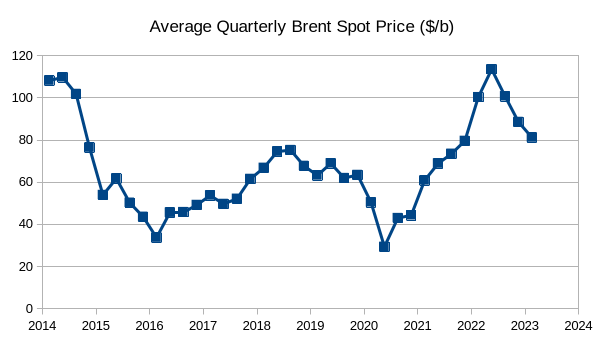
I expect that oil prices may rise as stock levels fall below 90 days of consumption by 2023Q3, if the EIA STEO supply and demand estimates are accurate.
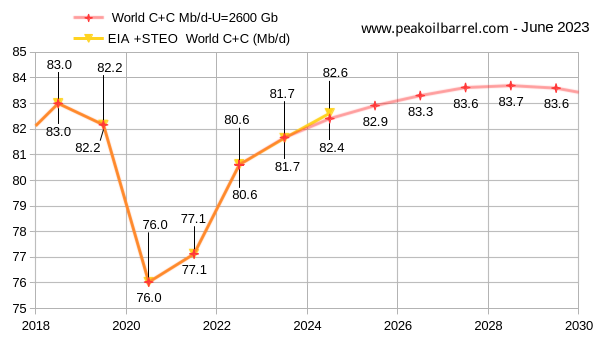
The chart above uses Paul Pukite’s Oil Shock Model to estimate future output with the assumption that a transition to electric transport reduces oil demand to less than supply by 2032 (+/- 2 years). The data above the line is EIA data up to 2022 and 2023 and 2024 are the STEO estimates, the data below the line is the model output. The 2018 peak is exceeded in 2025 for my best guess model (100% probability this will be wrong) and the peak is in 2028 at 83.7 Mb/d.
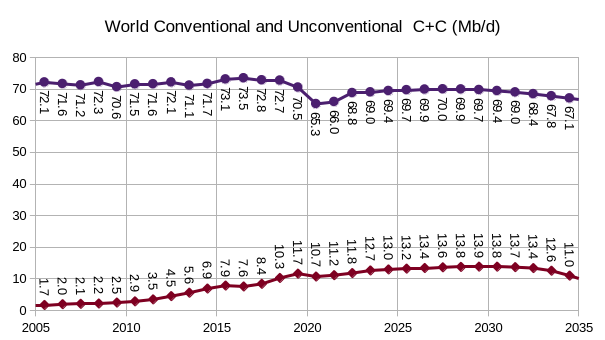
The figure above shows conventional and unconventional C+C output for the Oil Shock model in Figure 6. Unconventional C+C is defined as US Tight Oil (LTO) and extra heavy oil (API Gravity of 10 degrees or less) produced from Canadian Oil Sands or Venezuela’s Orinoco belt, conventional C+C is all C+C that cannot be classified as unconventional as defined above. From 2018 to 2028 unconventional output increases by 3.5 Mb/d while conventional output decreases by 2.8 Mb/d, there is a net increase in World C+C output of 0.7 Mb/d in 2028 above the previous 2018 peak. The unconventional C+C URR for this scenario is 170 Gb.
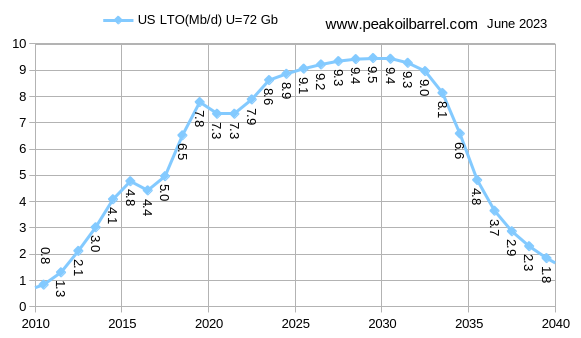
The tight oil model used in my most recent shock model has a lower URR than the model presented last month (72 Gb vs 81 Gb), there a shorter plateau (2028-2030) and a thinner tail with completion rate assumed to fall after 2029 due to a combination of fewer profitable locations to drill new wells and lower oil prices as more land transport moves to electricity. More details on this scenario below.
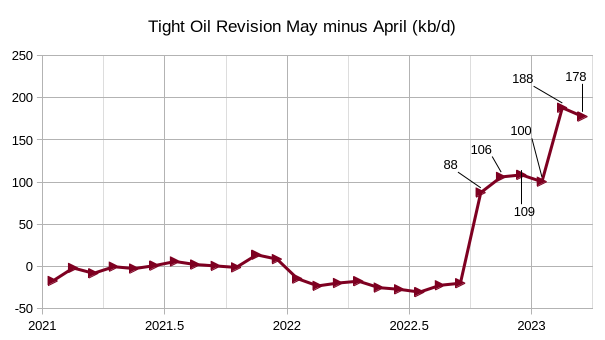
There was a large revision in last month’s EIA official tight oil estimate especially for the months of October 2022 to March 2023 (the revisions for those months are indicated in figure 9) with the revisions for February and March at 188 and 178 kb/d higher than the May report, there were also revisions lower by roughly 25 kb/d for Feb 2022 to Sept 2022.
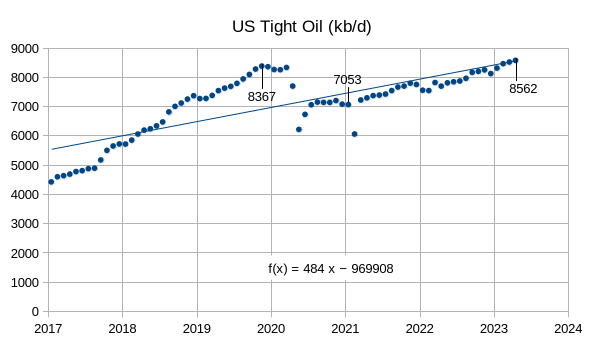
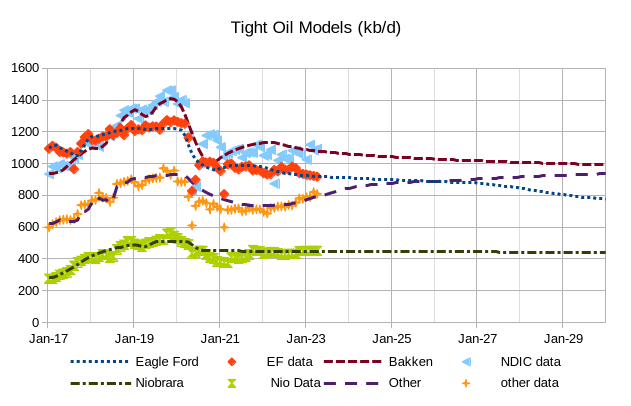
The chart above gives an overview of US tight oil output from Jan 2017 to April 2023 with the long term OLS trend at an annual rate of increase of 484 kb/d using all data from Jan 2017 to April 2023 (no data is dropped from the regression). For the past 24 months US tight oil has increased at an annual rate of 580 kb/d or a monthly rate of about 48 kb/d each month based on a linear regression using ordinary least squares (OLS). An endpoint estimate using a line through April 2021 and April 2022 gives an annual rate of increase of 640 kb/d over that period (slightly higher than the OLS estimate) with a monthly rate of increase of about 53 kb/d.
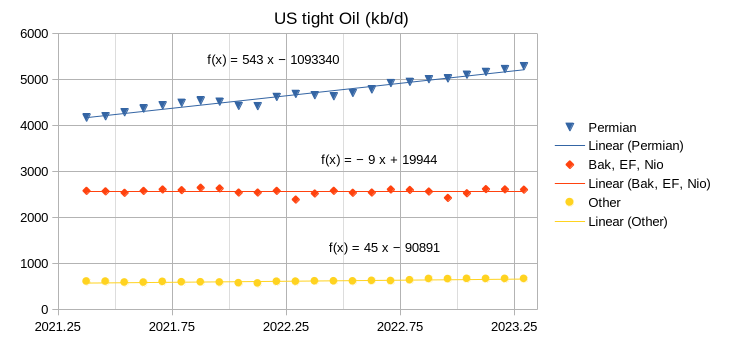
Most of the increase in US tight oil output over the past 24 months has come from the Permian basin with a small contribution from”other” tight oil plays such as the Anadarko, Powder River, and some contribution from shale gas plays which yield some lease condensate. Tight oil output from the Bakken, Eagle Ford, and Niobrara plays as a group was trending down at an annual rate of 9 kb/d over the past 29 months. Output from all non-Permian tight oil plays was slightly increasing at an annual rate 36 kb/d or a monthly rate of 3 kb/d over the past 24 months. Last month’s estimate for the past 24 months (April 2021 to March 2023) for non-Permian tight oil output was a decrease of 45 kb/d. The revisions in the data and a shift in the period covered by one month resulted in a net increase of 81 kb/d for non-Permian output compared to last month’s estimate. The change in the Permian annual rate of increase in output was relatively minor by comparison at an increase of 8 kb/d from 535 kb/d last month to 543 kb/d for the most recent estimate.
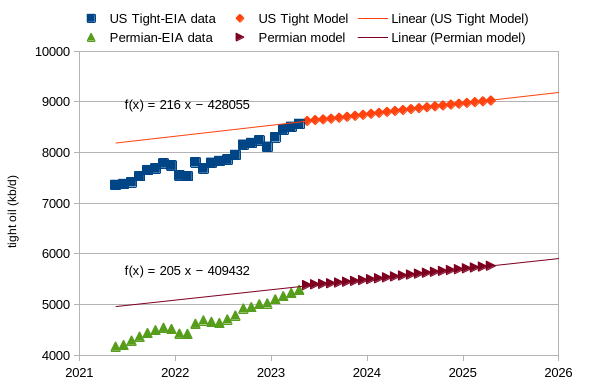
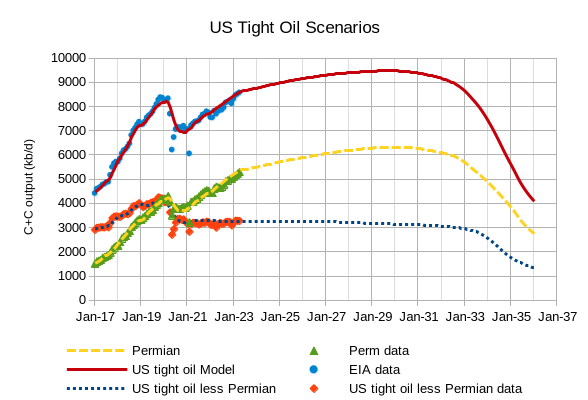
The chart above shows projected output for a scenario where the completion rate for US tight oil wells remains constant at 15 wells less than the April 2023 level from Sept 2023 until April 2025. US tight oil increases at an annual rate of 216 kb/d from May 2023 to April 2025 and Permian output increases at an annual rate of 205 kb/d over the same period. These rates are about 67% of the rates of increase reported last month (about 315 kb/d) as the scenarios have been revised.
Note that the scenarios above assume no increase in the new well completion rate after Sept 2023 which is 15 wells below the April 2023 rate of completion, it remains constant from September 2023 to February 2029. There was a slight revision to the “Other” tight oil model where other plays are those that are not Permian, Bakken, Eagle Ford or Niobrara plays. Bakken URR is 9.5 Gb, Eagle Ford URR is 8.5 Gb, Niobrara URR is 3.5 Gb, and Other tight oil URR is 8.5 Gb, with a total URR for non-Permian tight oil plays at 31 Gb.
The chart above simply is the sum of the scenarios presented in Figure 13 (US tight oil less Permian) plus the Permian scenario shown in Figure 14. I extend the chart out to 2036 to show the expected output decline, which falls by half in 3.33 years from 9000 kb/d in June 2032 to 4480 kb/d in Sept 2035. The URR of the tight oil scenario is about 72 Gb (9 Gb smaller than the scenario presented last month). The average annual rate of increase from May 2023 to April 2029 is about 1.6% per year for this scenario. The Permain scenario has a URR of 40 Gb with a peak of 6.32 Mb/d in Jan 2030, the US tight oil scenario peaks in November 2029 at 9.47 Mb/d.
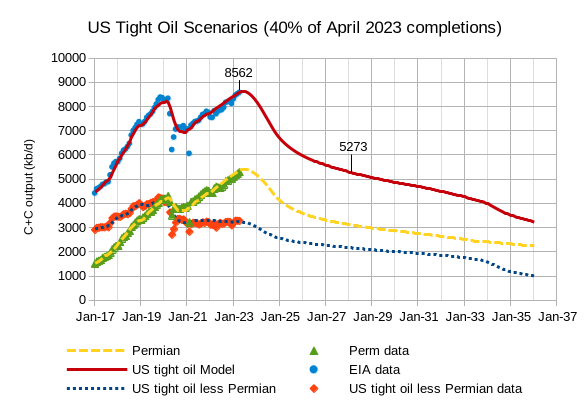
The scenario above assumes that crude oil exports from the US to nations not in North America are banned starting in March 2024 (this is highly unlikely in my view). As a result the tight oil well completion rate in April 2023 falls by half in each non-Permian basin over a 12 month period from May 2023 to April 2023 and Permian completions are reduced to one third of the April 2023 level by April 2024. Overall the completion rate is reduced from 955 wells per month completed in April 2023 to 380 wells per month in April 2024 (40% of the April 2023 completion rate). US and Canada have refinery capacity to handle about 4600 kb/d of tight oil, in order to avoid US crude exports outside of North America we would need to aim for 4600 kb/d of tight oil output. The scenario in figure 15 would reduce US tight oil output to about 4600 kb/d by July 2031, in Feb 2028 crude exports outside North America are reduced to about 700 kb/d (from 4000 kb/d in March 2023). The URR of the scenario in figure 14 above is 58.5 Gb and note that the completion rate could be increased after July 2031 to keep tight oil output flat if desired.
About 5290 kb/d of tight oil was refined in the US in 2019 (or was produced and not exported outside North America), it is unclear why there is such a large difference between 2019 and 2022 (nearly 700 kb/d). Perhaps LTO is being produced in the Canadian Bakken and has reduced Canadian demand for LTO (this would explain about 200 kb/d fewer exports to Canada in 2022 compared to 2019) also some refinery capacity for tight oil may have been shut down in the US during the pandemic. It seems likely that the estimate based on 2022 data is a more accurate gauge of current US refinery capacity for tight oil.
297 responses to “STEO and Tight Oil Update, June 2023”
Note the last figure in the post was labelled incorrectly, it should be figure 15.
Slightly different scenario from last scenario in the post (figure 15) where the tight oil completions fall to one third of the April 2023 monthly completion rate by Sept 2024 and then remains at that level until Jan 2032, followed by decreasing completion rates with the last well competed in May 2043. Tight oil output falls to 4600 kb/d by August 2029 and the URR is 57 Gb for all US tight oil for this scenario.
What the hell??? Dennis, have you finally come to your senses and acknowledge reality?
If so, Conjurations!
Ron,
I assume Dennis sees this scenario as highly unlikely. I don’t like to contemplate the disaster that would lead to Permian completions dropping by 2/3 in one year and remaining that low for decades.
Ron and Niko,
Niko is correct, the low tight oil scenario assumes a ban on US crude oil exports outside of North America (exception for Canada and Mexico, though lately only about 300 kb/d is exported to Canada and no crude oil gets exported to Mexico in recent years). The scenario is a what if case of what would happen to tight oil if we decided to no longer allow crude exports which was US law from Dec 1975 to Dec 2015.
you take this: https://www.worldoil.com/news/2023/6/26/fossil-fuel-leaders-say-transition-to-green-future-will-require-more-natural-gas/
add in this: https://oilprice.com/Energy/Natural-Gas/US-Sets-New-Record-In-LNG-Export-Capacity.html
multiply by this: https://electrek.co/2023/06/23/siemens-gamesa-big-wind-turbine-problems/
and it adds up to Texasteatwo being oh so right once again.
I wont go into just how wrong our ole friend steve was on nat gas pricing as we all know he is never right about anything energy related. Now I will also say I have missed my oil price estimate, as I though we would be north of $80 by now, but I still like the demand profile worldwide. Just a matter of time IMHO.
Don’t have time to chat as I am building up my carbon footprint like all the rich liberal’s do😉why should they have all the fun.
It’s good to be the king👑
Dennis
Nice work, those graphs showing steady declines seem fairly believable.
For the past 12 months US production still appears to be flat:
06/24/2022 12.1 mb/d
06/17/2023 12.2 mb/d
This is ~1 mb/d below the March 2020 peak of 13.1 mb/d. 8% lower than previous peak in 2020.
An interesting look at OPEC, in 2016 they peaked at 32.2 mb/d accounting for 35% of global production.
Now, they are only producing 29.1 mb/d, which is ~10% lower than previous peak. They are only 30% of global production.
More significantly, between 2012 and 2021, OPEC net exports shrank from 25 mb/d in 2012 to 19 mb/d in 2021.
Kengeo,
The weekly data should be ignored.
For US output we have chart below using data from link below
https://www.eia.gov/dnav/pet/hist/LeafHandler.ashx?n=PET&s=MCRFPUS2&f=M
The annual rate of increase for US C plus C output over the past 24 months (April 2021 to March 2023) using an OLS trendline is 752 kb/d.
The tight oil scenarios showing steady decline assu,e crude oil exports are no longer allowed from the US in order to conserve oil resources. It is not very likely that such a policy will be adopted by the US. The scenario with a gradual increase in tight oil output (where it is assumed the completion rate falls by about 1.6% from the April 2023 level by Sept 2023 and remains at that level until Feb 2029) from 8.5 Mb/d in April 2023 to 9.46 Mb/d in 2029 is my best guess scenario for US tight oil output.
Kengeo,
On OPEC exports consider the fact that the US imported 4000 kb/d of crude oil from OPEC in 2012, but only 979 kb/d of crude from OPEC in 2022, a decrease of over 3000 kb/d. That accounts for about half of the decrease in OPEC crude oil exports. OPEC output has also decreased by 1700 kb/d since 2012 and finally consumption of crude oil in OPEC nations has likely increased since 2012.
Pulled it up here from the last post .
Mr B– The Honest Sorcerer latest post . The Specter of Peak Oil . 8 minutes read .
https://thehonestsorcerer.medium.com/the-spectre-of-peak-oil-part-1-4c677eea93ce
Thanks for the link HH. The author is not a petroleum geologist but argues plain old common sense. What he argues is what many of us have been arguing for over a decade here on this blog. I find it astonishing that many feel that because peak oil was predicted back in 2005 and did not happen when predicted, the whole concept of peak oil was repealed and declared a myth.
There is an increasing amount of evidence that we are close to (or most likely have already passed) peak oil supply. But why is this so hard to tell? How can people argue that there is no such thing at all, while others keep warning us about an imminent decline in oil production?
Nothing but common sense. But for some people, it is common sense that has been repealed.
Oh, the title of the article is: The Spectre of Peak Oil — Part 1. Please post the “Part 2” link when it comes around.
Ron,
An excerpt from the piece that HIH linked:
Disclaimer: although I’m no petroleum geologist by profession, the topic always fascinated me. In order to fill in this knowledge gap at least somewhat, I’ve read countless articles, studies published in scientific journals and listened to experts elaborating on the topic for hours on end. If you happen to be a trained geologist you are more than welcome to correct me on any mistakes I made (which I tried to avoid as best I can by vetting every piece of information against scientific literature and expert views on the topic).
Thank you Dennis. I belted out my reply in sync with yours. The only question I’ve got remaining is when did Ron’s reading comprehension problem surface, way back when with his other claims of HERE IT COMES!!! PRAISE BEJESUS! were going on, or is it a more recent affliction related to advancing years or something.
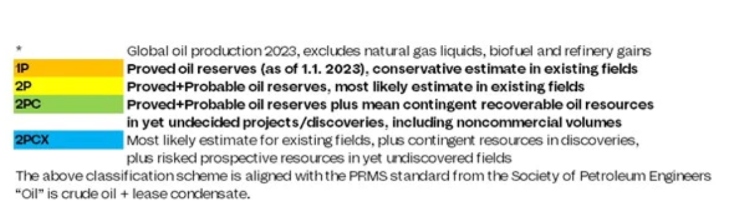
Reserves vs Resources
Oil Resource is an assumption based just how accurate geologic estimations on heavily drilled regions are, and just how accurate are the guesses for regions that haven’t been as heavily drilled.
Obviously, there is a very large margin of error on the overall estimate.
Oil Reserves are based on both an assumption of a level technological achievement and a set of assumptions of the global economic conditions. The economic capability of the nation and the world to both control costs of extraction and fund the purchase of the end products is a huge assumption wildcard.
A faltering of demand could become a sustained major factor in restricting Oil Reserves, as less capital is available for sustaining high end product prices. Alternatively, the collective purchasing power of humanity may provide enough capital to push Oil Reserve to yet higher levels.
The Reserve level basically comes down to how much oil derived products that the worlds population can afford to purchase.
I am not looking for the collective desire to purchase oil derived products to decline anytime soon.
Yet desire to consume is not always aligned with the ability to do so.
I found this to be one of the better graphics explaining the entire gamut of oil and gas categories for the layman. I can barely get industry engineers to explain their probability estimate on a simple decline curve, this type of top level graphic is far easier to talk around.
https://www.eia.gov/todayinenergy/detail.php?id=17151
Yes, its a good one.
I’ll just re-emphasize that the assumptions that go into guessing the reserve size have great uncertainties underlying them, and those economic uncertainties are often simply glossed over.
Thanks, Dennis. I have corrected my comment to reflect the correct statement. I regret my error.
Ron,
I often misread things in haste, no apology necessary. You can delete my comment.
Mine as well if you’d like.
Ron says: “Thanks for the link HH. The author is a petroleum geologist and argues plain old common sense.”
WHAT? Ron, can you even READ in your advancing years? Here is the disclaimer at the end of the article, the part you obviously either missed or just decided since the article is yet another peak oil HERE IT COMES AND THIS TIME…WE MEAN IT!! AGAIN! was worth assigning more credit to then it itself is willing to claim.
“Disclaimer: although I’m no petroleum geologist by profession, the topic always fascinated me.”
So no, not a petroleum geologist (although Art B has proven that isn’t worth crap when it comes to oil prognosticating) just another amateur hour hobbyist…like computer engineers who claimed peak oil was 2015 FUR SURE and have never seen a peak claim they didn’t fall for hook, line and sinker.
Hey, get off your goddamn high horse RGR. I misread that, okay. And just hope you are lucky enough to live as long as I have.
The article points out, and any damn fool can figure out, that oil discoveries peaked decades ago. Current annual discoveries are less than one-fourth of average consumption. Yet there are some idiots out there who believe this fact can be totally ignored. They assume that because peak predictions were wrong in the past that they will forever be wrong in the future.
Dennis predicts C+C will peak in 2028. Do you think he is an idiot for predicting peak oil? Dennis’ predictions of peak oil are less than one million barrels per day different from mine. Do you think we are both idiots for our predictions? Well, mine is not exactly a prediction but a historical observation. Mine happened five years ago, Dennis’ is five years in the future. But in the grand scheme of things, we are damn close to agreeing. Our estimates are not that far apart.
But you rant, rant, and rant some more. Is that all you know how to do? I know you are too goddamn stupid to realize it, but you make yourself look like a blooming maniac.
There is an increasing amount of evidence that we are close to (or most likely have already passed) peak oil supply. That sentence is nothing but ordinary common sense. Only one person on this blog would deny it. Guess who that person is.
Damn fools don’t understand why discovery timing isn’t the core of the issue, but rather the size of the resource base they represent. I think Dennis does a better job with his limited information and microscopic budget than most folks out there. But because he can’t build the system around the correct independent variable, he will be forever hobbled because of it.
And no, making predictions doesn’t make anyone an idiot. NOT LEARNING FROM WHY THEY WERE WRONG DOES. Now that using discoveries has turned out to not predict for squat, AT WHAT POINT DO YOU LEARN?
As far as “not that far apart”, I’d give you that if, when you claimed peak oil was 2015 FOR SURE, you had dropped in a caveat matching your understanding of the issue when yiou made the claim in 2014….something like ….”if not 2014 then 2015 for sure….GIVE OR TAKE A DECADE OR THREE”.
As far as evidence we are close or have already passed, sure. Making the claim after the fact at least appears safe. Of course, that hasn’t worked out either, proclaiming a peak in the past just to be safe….only again to arrive with egg on face when that peak was dispatched with more oil.
So, how about someone answer a previous question I asked….why don’t some of these peaksters get together, get the data they need, put in the work, and get the job done with a model using the necessary data? Why is it that this topic has been absolute amateur hour for so long, with so many academics involved along the way that surely had access to some funds to figure out how to get it done right?
.why don’t some of these peaksters get together, get the data they need, put in the work, and get the job done with a model using the necessary data? Why is it that this topic has been absolute amateur hour for so long,
Dennis, this idiot is talking about you. Care to reply?
Reservegrowthrulz,
Maybe you should do it, I could collaborate if you are interested, but you would need to find the grant money. I am not in academia.
To Dennis:
I have done collaborations before, but they can be extremely difficult in terms of arranging them with my employer.
Reservegrowthrulz,
Ok understood.
RGR said:
This characteristic is described in our book. There’s a property of fat-tail statistics — such as in the probability distribution of reservoir sizes — where the largest discovery can actually swamp all previous discoveries.
I hooked up the Dante AI system to Mathematical Geoenergy and asked it to summarize
It also answered that an infinite volume would not occur because “we live in a finite universe with finite resources”.
Much of this is deep thinking about the subject matter and using applied math ad probability borrowed from other scientific and engineering disciplines. Has this subject ever been taught in geoology or geophysics courses?
To Paul:
“Has this subject ever been taught in geoology or geophysics courses?”
Taught? The fundamental reference kick starting their use by geoologists was published a quarter century before you got your PhD. Aren’t electrical engineers required to take some kind of history course along the way to predicting peak oil in 2008?
I haven’t been able to find your textbook in a library nearby, I don’t suppose you would be willing to send me a PDF of the Appendix on reserve growth? I would be interested to see if you used the old USGS methods for it, or the new ones.
I thought not.
With Google Scholar,etc ad with ChatGPT should not be that hard to find publications that first (or only) describe the approach. If you can’t find it yourself, I will do that here. … And if you say that this info is only available from other means, such as proprietary or classified sources, well, that’s the issue, right?
And if Chat GDP can’t find any relevant information, it will gladly fabricate some for you.
Reservegrowthrulz,
U Colorado has an online copy
https://discovery.ebsco.com/c/3czfwv/results?limiters=FT1%3AY&q=pukite
No need for humans anymore. Today ChatGPT included this thing called Code Interpreter. I asked it to upload and analyze our book Mathematical GeoEnergy and prompted it to create an Oil Shock Model.
Go to this Twitter link to see how well it worked.
https://twitter.com/WHUT/status/1677776303989092354
This is the ChatGPT prompt history. Dennis, you should take a look!
To Ron:
No Ron, I wasn’t talking about Dennis. I was talking about Art and Tad and his Saudi money and any remnants of ASPO in academia and some of the academically affiliated that work in the UK. Dennis is doing what he can with what he’s got. Academics have budgets. Research organizations have budgets, like those recent analysts that have been referenced around here calling for whatever peak of this century we are now up to.
The peak for the 3500 Gb URR estimate for World C plus C in paper linked below peaks around 2030 at a similar level to 2018 peak.
https://www.sciencedirect.com/science/article/pii/S2666049022000524?via%3Dihub
Reservegrowthrulz,
What is the correct independent variable that you speak of? Price? You are aware I assume that resource cost curves are not fixed in time, they shift as technology changes as well as with changes in other input costs, there are a multitude of variables that are important, all of the values for those variables are unknown beyond the present with an infinite set of combinations of values for those many variables.
Yogi Berra was correct, predicting is hard, especially the future.
Reservegrowthrulz,
There are many papers that use the proprietary data, but are required to keep it hidden calling countries A, B, etc.
I thought the following was pretty well done, but it’s older from 2014.
https://royalsocietypublishing.org/doi/10.1098/rsta.2013.0179
There was an entire issue of the Philosophical Transactions of the Royal Society in Jan 2014, about 10 articles in total devoted to Peak Oil.
To Dennis:
Price indeed. And I am aware of the complications it involves, just as I am the monstrous advantages in modeling oil production. Do you recall our conversation as to the appropriate starting point for how much oil is the the ground and how it relates to the reason why peakers keep screwing it up? Start with the idea that the USGS published decades ago about the ultimate recoverability of oil and gas, get THAT data (one of those expensive data sets) and suddenly there is complete freedom to build in every change of technology you can come up with right up to and including mining.
To Dennis:
I am famiiar with the reference you mention. Interestingly, Figure #16 appears to be the only one that relates price to anything. And the article spends quite a bit of time explaining, but giving no indication they have the data necessary to make cost curves, let alone build a system that utilizes them. They seem to have been focused on a lengthy, but reasonable, explanation of most ot the moving parts.
Reservegrowthrulz,
Can you remind me of the USGS reference you are referring to, there have been a quite a few publications by the USGS in the past few decades. Are you referring to the reference linked below?
https://pubs.usgs.gov/fs//fs-062-03/FS-062-03.pdf
To Dennis:
The point I had in mind comes from here: https://pubs.usgs.gov/dds/dds-069/dds-069-d/REPORTS/69_D_CH_13.pdf
The quote comes from the section titled: Technically Recoverable Resources Versus Potential Additions to Reserves
The comment that launched me into a different way of doing things that solves the “peakers always underestimate everything” issue was:
“However, given the sophistication of current petroleum related technology, essentially all of the moveable oil or gas in almost any accumulation that can be envisioned has become recoverable from a purely technical standpoint.”
From such small beginnings. The author could be found at AAPG national conferences annually until he retired. He was a fantastic scientist with an outstanding history with the USGS and smart as a whip.
Thanks Reservegrowthrulz.
I will post part 2 as it comes online . In the meanwhile a comment by Stephen Bull (Olduvai .ca) . Thought provoking .
“Well laid out! Despite this, it is fascinating to me how many people either ignore/deny these self-evident aspects of our predicament, or delve into magical thinking to bargain with or rationalise them away.
It also seems to me that resource depletion, especially of one of our most significantly important resources such as fossil fuels, is, as Erik Michaels argues (see: https://problemspredicamentsandtechnology.blogspot.com/), a symptom predicament of our overarching predicament of ecological overshoot.
And it is a lack of fully understanding this and appreciating what this overshoot entails and means, that has humanity in the crosshairs of the inevitable ‘collapse’ that accompanies it. No amount of denial, anger, and/or bargaining can change this. But homo sapiens being who they are will try.
I think that the ‘best’ we might accomplish is to create some mitigations that ‘soften’ the consequences for some.
Instead, however, we have a sociopathic elite (and a lot of snake oil salesmen) who are doubling/tripling down on the very processes that have put us in this bind: pursuit of the infinite growth chalice (i.e., economic and population growth) and encouraging widespread adoption of complex technologies (i.e., non-renewable, renewable energy-harvesting technologies).
And rather than safely decommissioning some of our most lethal and dangerous complexities (such as nuclear power plants and their radioactive wastes, chemical production and storage facilities, biosafety labs and their dangerous pathogens), whose control of we will lose as net surplus energy dwindles and eventually reaches zero, we are seeing a push to expand these. Rather than stop the degradation of our biosphere (particularly through our mineral extraction and production processes), and whose integrity is perhaps THE most important aspect of all species’ survival, we are witnessing a HUGE push to expand these in an attempt to ‘replace’ fossil fuels.
The vast majority of us just can’t seem to face up the inconvenient idea that we in it waist deep and sinking rather quickly. And instead of considering the notion that we stop digging out the bottom out of the hole we have fallen into, we flail and thrash against the inevitability of it all chasing processes that are making the predicament even worse and guaranteeing a future that is the opposite of the growth and expansion we have experienced the past number of centuries/millennia—that’s if any of us survive at all given the destruction we have wrought upon our world because of our overshoot.
It’s a mad, mad, mad world! “
Ron , Part 2 is posted . Ramifications of peak oil . 9 minutes read .
https://thehonestsorcerer.medium.com/the-spectre-of-peak-oil-part-2-30360fe1b24d
Thanks HiH. Damn, good read. Spot on, except for this paragraph by one William E. Reese:
Globalization and unfettered trade — i.e., dependence on distant “elsewheres” for food and many other resources — will no longer be possible in the emerging resource and climate-constrained world. This is not entirely a bad thing. Globalization is a driver of overshoot — so-called free trade, particularly in the past half-century, greatly accelerated resource (over)exploitation and pollution, and facilitated population growth. It follows that adaptive eco-economies be more eco-centric local economies. Agriculture and essential light manufacturing — e.g., food processing, textiles, clothing, furniture, tools — will all be relocalized providing ample meaningful employment. There will be a resurgence of personal skills and pride in workmanship. As an immediate additional benefit, when citizens become acutely aware of their dependence on local ecosystems they become more actively concerned about the health and integrity of those systems. A sense of conscious participation in one’s eco-niche is not possible if the relevant ecosystems are half a planet away.
I have never read such a line of unadulterated bullshit in all my life.
Ron,
I agree with you there, that paragrah is nonsense. Globalisation is a one-way road. Once globalisation breaks down, shit will hit the fan.
And don’t forget to go on to:
https://www.youtube.com/watch?v=CDBJdQnjE2o
This is an interview of Art Berman by Nate Hagens. Very very informative.
Only 2% of United States production is °API 20 or lower with density of 933.1 kg/m3 or higher, yet US is configured to refine mainly heavy oil. Thus, most incremental production from US likely to be exported to emerging markets…please correct me if I’m wrong. —Razor oil .
Hole in head,
Yes increased tight oil output will be exported.
Ron,
I was not very clear in the post about that last figure, now correctly labelled as figure 15. It is an attempt to model what might happen if the US banned crude oil exports from any nation except Canada and Mexico. If the US put such a ban in crude oil exports in place, then there would be little incentive to produce more tight oil than an amount of tight oil that is greater than about 4600 kb/d unless there were increases in refinery capacity to handle LTO.
The scenarios shown in the last figure in the post and the first comment on the thread, assume a law was passed to ban crude exports from the US to outside of North America. The tight oil completion rate is assumed to decrease to accomplish the reduction in tight oil output that would be necessary from about 8.5 Mb/d in April 2023 to 4.6 Mb/d at some future date. That is the context for the lower tight oil output scenarios. The higher tight oil output scenario with a URR of 72 Gb that peaks in 2030 at about 9.5 Mb/d is more realistic in that I do not expect the US will change its policy on crude exports.
Chart below has US tight oil output from 2011 to 2023. Notice that tight oil approached about 4.9 Mb/d in 2015 and the crude export ban was lifted in December 2015 to allow greater tight oil crude exports.
Another tight oil scenario where only non-Permian tight oil plays see a decrease in completion rate over May 2023 to April 2024 period, the same as the non-Permian scenario from Figure 15 in post. The Permian scenario is the same as Figure 14 from the post with 450 new tight oil wells per month completed from June 2023 to Feb 2029. URR is 66 Gb, tight oil output is 8.4 Mb/d in 2028. This scenario is about as low as seems realistic to me, but I would put the odds at 2:1 that output will be higher than this scenario or a 33.3% probability output might be lower than this scenario and a 66.7% probability that output will be higher than the scenario shown below.
I fit a Hubbert Model to the Scenario above (URR=66 GB), the Hubbert Model that matches best has a URR of 81 Gb, note the rapid decline after 2032 is due to an assumption of low oil prices due to low oil demand, the Hubbert Model would make no such assumption. If oil prices remained high the fatter tail of the Hubbert model could be maintained.
Note that this tight oil scenario with URR of 66 Gb is extremely conservative. My best guess tight oil model with Hubbert curve in chart below, the Hubbert curve predicts a 2027 peak, my model assumes high oil prices in 2028 pulls some of later production of Hubbert model forward so that peak is 2 years later, possible this is too optimistic, it is based in part on tight oil CEOs prediction of 2029 to 2030 Permian peak, perhaps it will be a 2027 peak followed by a plateau for a few years.
Thanks for the analysis Dennis.
Schinzy,
Thanks.
Another scenario considers the possibility that the reduced completions in non-Permian tight oil plays that occur in the earlier scenario with URR=66 Gb (the reduction in completions is 469/month in April 2023 to 231/month in April 2024) allows an increase in Permian completions as the capital is deployed in the Permian basin. In the scenario the Permian completion rate is gradually increased by 5 each month until the completion rate reaches 699 in November 2026, then it is held steady at that rate until December 2028 and then the completion rate falls gradually to zero in June 2032. Total wells completed in Permian basin from Jan 2010 to June 2032 is 102,225 (42,362 wells completed though April 2023) and URR is 42 Gb for Permian basin, for US tight oil the URR=68 Gb. The peak annual average US tight oil output is 2029 at 10.9 Mb/d.
This scenario is basically a flat completion rate scenario, but capital is shifted from non-Permian plays to the Permian basin. For total US tight oil completion rate we have 959 wells completed in April 2023 and after May 2023 the completion rate remains 930 completions per month or fewer. In fact the completion rate for all US plays gradually falls from 959 completions in April 2023 to 781 completions per month in April 2024 and then gradually rises by 5 per month until reaching 930 completions per month in October 2026 which is the maximum after May 2023.
The scenario below is about as high as I think is a reasonable guess, but is of low likelihood in my view, perhaps a 15% chance US tight oil output would be higher than this and an 85% probability that output will be lower than this scenario. My best guess remains the tight oil scenario presented in Figure 14 in the post.
Bundesbank (Banker to the banks in Europe ) needs a bailout . Who is next ?
https://www.businesstimes.com.sg/international/bundesbank-may-need-bailout-ecb-bond-buying-auditor-says
Dennis, Ovi . An interesting tweet on Permian and Delaware basins .
https://twitter.com/Energy_Tidbits/status/1672692052314980352
Thanks for this tweet.
Lots of good stuff in that thread.
Interesting bar charts article.
Tweet that if oil closes Friday below $68.09 it will be the first time ever (1983) that oil has closed lower 11 out of the last 13 months.
Tweet TSA flight passenger levels are at or above 2019.
Never have understood oil prices. Never will.
HIH
In my upcoming US report, I have added a special section on the Permian. Still working on it. I think there are a number of indicators that the Permian is close to its peak, assuming that drilling and completions continue at their current rate.
Everybody’s showcase PXD is not immune .
Normalizing productivity for lateral length and for $PXD, it is clear that volumes are degrading on both daily production and total recovery.
This is a common theme in public E&P’s and with private E&P’s in even worse shape, US supply limitations are now firmly in the limelight!— Shubham Garg
Hole in head,
Average lateral lengths have been increasing and as they do productivity per foot falls, so this is expected. For a business what matters is productivity per dollar spent as lateral lengths increase the cost per foot of lateral decreases due to economies of scale. As long as the decrease in costs per foot is higher than the decrease in productivity per foot, net revenue per foot will increase. Pioneer clains the IRR for wells with 15k laterals is 20% higher than its average well, the name of the game is minimizing the cost per barrel.
Ovi,
Consider the Permian Scenarios in the chart below with completion rate at 350 wells per month, 450 wells per month, 500 well/mo, and 550 wells/mo. The April 2023 completion rate was about 500 wells per month according to recent DUC report from the DPR. The DPR does indeed suggest the Permian is flattening, but consider an earlier DPR, say from January 2023 with the current DPR and note any differences from the last 3 to 4 months of the Jan DPR with the most recent DPR (June). I think you will find the final 3 months of the DPR are not very accurate. Also consider Enno Peters most recent Permian report at link below
https://novilabs.com/blog/permian-update-through-april-2023/
especially the supply projection which assumes the rig count drops from 333 in April 2023 to 233 in Sept 2023 and then remains at that level until Dec 2029. If Enno has the same competion estimate for April as the EIA ~500/month, this suggests about 1.5 completions per rig and the completion rate would fall to 350 wells completed per month by Sept 2023 and remain at 350 wells/mo until December 2029.
This matches the 350 well/mo scenario in the chart below and my scenario is pretty similar to what is presented by Enno Peters (this makes sense as I use his data for my models). I would suggest the DPR model may not be as good as what Enno Peters is doing. If the completion rate remains at 500 per month Permian output will increase, indeed even at 400 wells per month (a drop in the completion rate of 20%) Permian output would continue to increase (though more slowly).
I took a quick look at Jan 2023 DPR and June 2023 DPR for Permian, the chart below has the Jan 2023 estimate minus the Jun 2023 estimate from Jan 2017 to Feb 2023 (final estimate for Jan 2023 DPR), for May 2022 to Feb 2023 the average Jan DPR estimate was 65 kb/d lower than the June 2023 DPR estimate for those same 10 months.
US oil production’s high-decline nature becoming obvious in rapid fashion with volumes now ⬇️ to Sep 2022 levels!
Well productivity degradation, lack of inventory depth, DUC exhaustion, and political manipulation have together punctured dreams of continued US supply growth. 🛢💰.—- Shubham Garg
Hole in head,
I will repeat what I have said many times before, the weekly output estimimates are not very good, best to ignore them in my opinion.
Dennis , this is not a weekly chart . This is a year on year comparison . Seppo Sir has posted a similar one down below .
Hole in head,
We only have monthly data through March 2023, the data on the chart goes through June 2023 and the number of squiggles also makes it quite clear this is weekly data, which is crap.
Dennis –
I disagree, the weekly data follows the monthly extremely closely…plot them together and you will see…
Kengeo,
I disagree. For March 2023 the 4 week average for weekly data was 12225 kb/d, the monthly estimate was 12696 kb/d a difference of 471 kb/d, lots of examples of errors this big for weekly data, the monthly data is better and gets revised, the weekly data never gets revised to reflect reality, nobody cares because analysts looking at historical data ignore the weekly data.
This trend will further accelerate as the lag effect of rig drops, movement to lower Tier acreage, and poor reservoir management plays out in 2H23.
Adding salt to the wound, Permian frac operations are at 52-week lows as both public and private shale E&P’s get stress-tested!
HIH
Could you post the link for this chart
Here goes Ovi .
https://twitter.com/WhiteTundraSG/status/1673477593205710849
The drop off at the tail end of the Permian frac chart is due to incomplete data for May, the frac focus data constantly gets updated and the most recent 8 to 12 weeks of data is not complete.
HZ rig count .
Permian Horizontal Oil Rig Count, Data from Baker Hughes, data at link below
https://rigcount.bakerhughes.com/na-rig-count
The Permian is responsible for all US tight oil growth since about 2019, it is the one to watch.
HIH
I think the chart you posted includes NG and Oil rigs. Attached is the chart I posted in the previous post for Hz oil rigs.
Note the sum of oil and NG rigs is 613 for the latest week, very similar to yours.
It also looks like the chart of SPR reserves from 1982. The sell down has been adding effectively 450,000 BOPD to world oil production. When it stops, and it will one day within the next 775 days, the oil market will get somewhat tighter.
The Monthly Energy Review (MER) was published today, it has L48 US C plus C output falling by 421 kb/d to
11840 kb/d in April, the STEO has forecast a drop of 60 kb/d to 12200 kb/d, my guess is that L48 output will be flat at about 12260 kb/d and US C C will be 12700 kb/d for April 2023 when th PSM is published on June 30, 2023. The tight oil estimate for April has an increase of about 60 kb/d and this is offset by a decrease in GOM output of 60 kb/d. The MER seems to use the weekly supply estimates to estimate the most recent two months, which explains why the estimates are usually not very good in comparison to the STEO, which is usually pretty good for the one month forward estimate.
The average annual percentage increase in US L48 C plus C output is about 7.2% per year (820/11409) over the past 24 months (May 2021 to April 2023 and using STEO estimate for April 2023).
I have another compare chart here. Who are you going to believe? If history is any reference, the STEO will be the closest. But we will know Friday when the Petroleum Supply Monthly is published.
The below chart is total US C+C production.
Dennis – Please don’t use Covid rebound data to estimate future supply, a fools errand. Recommend excluding April 2020 thru October 2021, it’s no representative of the trends that matter: 5 year, 10, and 20…
Even better, add in placeholders for what might have been expected if Covid hadn’t happened…
See weekly US production for ~20 years…we are clearly in a downtrend:
Kengeo,
What is the physical basis for fitting a 4th Order polynomial to the data?
Also extend the 4th order polynomial into the future say to December 2024 and tell us what you expect US output will be on that basis. Utilize monthly data which is more accurate the weekly data is very bad, so you have a garbage in situation.
Kengeo,
Here is October 2021 to March 2023 for US C plus C output.
Data from EIA link below
https://www.eia.gov/dnav/pet/pet_crd_crpdn_adc_mbblpd_m.htm
Note that I simply show what the trend has been, for the STEO I use the ratio of C plus C to total liquids in international data for 2022 and assume the ratio remains the same in 2023 and 2024 to estimate World C plus C past trends are not part of the analysis. For tight oil I make an assumption about future completion rates based on current rig count and recent trends and expected future oil prices, this also has little to do with past production trends, future trends are unknown we can only guess. There are likely plenty of viable tier 2 drilling locations that may be profitable with higher oil and natural gas prices in the future.
Covid did happen, so I use reality as the basis for my analysis. Oil that was not produced during low output periods during Covid can be produced in the future. This can easily be looked at by tracking cumulative production.
Chart below has US C plus C from Nov 2021 to June 2023 with STEO estimates used for April 2023 to June 2023.
Kengeo,
Here is a 4th order polynomial fit to monthly data from Jan 2004 to March 2023 (blue data), the red data on the chart is not included in the fit, the model is extended backward and forward 20 years. This shows why a random polynomial is not a good method for modelling. Notice how far off the model is for 1997 and if I extend the scale to show it, the model has about 40,000 kb/d for 1990, not all that realistic as it is in error by a factor of 5 (40000/8000=5.)
Kengeo,
Look closely at figures 11 and 12 from the post. For tight oil for the past 24 months (I prefer to use multiples of 12 months in case there is seasonality in the data) US tight oil increased at an annual rate of 580 kb/d from May 2021 to April 2023 and Permian tight oil increased at 543 kb/d over the same period. For my best guess model for tight oil the annual rate of increase over the May 2023 to April 2025 period is 216 kb/d for US tight oil and 205 kb/d for Permian tight oil much lower than the previous 24 months.
The new Bible is out. 2022 numbers.
US consumption 19.2 mbpd up 1.9%
KSA has now surpassed Japan in oil consumption with a fraction of the pop
China consumption down 4% in late Covid smack. 14.3 mbpd
Amid the horrors of sanctions and the clogging of the urals or siberian pipelines
and the refusal of people to accept Russian imports:
Russia oil production 2022 — 11.2 million bpd 1.9% on the year
Just ignore all western news services. They know nothing
US oil production 17.7 mbpd which is all liquids and corrupts all comparisons, including its own from 20 yrs back. Few other countries include all liquids. 6.5% despite the Green this and that sweeping the universe
India consumption 5.185 mbpd 8.1%
Spreadsheet: https://www.energyinst.org/statistical-review/resources-and-data-downloads
Thanks
very good – thanks watcher.
” 6.5% despite the Green this and that sweeping the universe”
Okay – I hope readers can now see that the “fight against climate change” is mostly just propaganda to appease those worried about it. It’s a dominant CULTURAL message, but not an actual force in power. And that dynamic is unlikely to change. You will have to put up with blue-haired cultural dominance as you roll your coal down the boulevard. Just feel content that on every issue that actually matters you are in control and have won.
Deeper dive. Nat gas.
Global consumption -3%. This was led by essentially shocking declines in Europe. Double digit consumption declines all over. Germany, France, down over 10%.
Gas production Netherlands down over 10%. Russia down over 10%. Azerbaijan down 8%.
It was useful to see this reported Russia gas production drop because it reduces suspicion about their reported increase of 1+% in oil production. These look like clean numbers.
Gas production increases less than 1% Qatar. 3% Australia and US. No one was burning it so increases were not produced. The story out of Europe (Finland gas consumption down 47%!!) appears to be a combination of mild winter and diversion of commercial gas to residential. Sacrificed the economy to prevent people freezing.
The KSA increase in oil consumption noted above was 8%. Japan small drop. Overtaken.
Nearly all the Persian Gulf oil producers ramped up domestic oil consumption. Several by 10+%.
Argentina gas production +7.7%. Vaca Muerta asserting itself.
Israel is not listed producing gas. Maybe not yet.
And coal production increased in China whopping 10.5%, India 12.2% and Indonesia 10%
Lower 48 production comparison
Paradox , contradiction or cover up ?. Read the comment . Art Berman
https://www.artberman.com/2023/06/09/opec-cuts-vs-an-incredibly-tight-market-both-cannot-be-true/
Hole in head,
The market does not have very good visibility for World Oil Stocks, the IEA data cannot be looked at except 2 months back for free, so we have OPEC MOMR data and EIA STEO data for World supply and demand estimates. I showed in figure 4 in the post that based on the EIA estimates the World oil market should reach stock levels that are similar to 2022 in terms of days of consumption by 2024, this is not as tight as markets were in 2018 and 2019 based on STEO estimates, and oil prices only went to $83/bo in 2022 US$ in 2018 (average annual price) with about 85 days of consumption for oil stocks. In 2014 when Brent oil prices were about $122/bo in 2022 US$ World Stocks were about 88 days of consumption, but that is likely because I simply assumed stocks were at about 90 days in the fourth quarter of 2013. The data for supply, demand and stocks is just not very good which makes analysis difficult. I think it is less of a coverup and simply that nobody knows what is going on, or not me in any case.
Looked back at long term stocks based on EIA STEO World supply and demand estimates and using data before 2015 does not give good results. I redid my stock chart using 90 days of supply at the end of 2014 as a starting point. I have included real oil prices (average real imported crude price for US) on right axis, the high prices in 2022 were due to concern over oil supply after Russia’s invasion into Ukraine rather than actual supply tightness, the market was far tighter in 2018 and 2019 (if EIA supply and demand estimates are correct from 2015 to 2022) with oil prices only as high as $77/bo in 2022$. If the EIA STEO estimates for 2023 and 2024 are correct, the oil market may not be very tight and crude oil prices would remain in the seventy to eighty dollar range in 2022$.
Looks like 2018 is still the peak…
Hi Kengeo,
I think its too early to call a peak. A recession in the 3rd or 4th quarter of this year will also complicate things further.
I also recall Ron and/or Dennis saying the world will peak when U.S peaks. This seems to be a good call with the current available data.
It wasn’t me who said that. It must have been Dennis. However, I don’t remember him posting that either.
That said, two of the world’s three largest producers have peaked. That is, Saudi Arabia and Russia. I think it is possible that the US has not yet peaked but would put money that the world peaked in November 2018. But if you want to get down to brass tacks, we are most definitely on the peak plateau right now. If the world does surpass the 2018 peak, it will be only by a tiny amount.
Iron Mike,
The way my model is laid out the peak for the US roughly coincides with the World Peak. I agree with Ron that Russia is probably beyond its 12 month average peak. Not clear to me that this is the case for Saudi Arabia, in July 2022 the Saudi’s had their highest centered 12 month average ay 10644 kb/d of C plus C output (EIA data). If we see high oil prices in the future, this peak may be surpassed. I definitely think the US will surpass the previous 12 month average peak of 12565 kb/d in Oct 2019 for CTMA. Probably in about 7 months or so.
Of course I am often wrong about the future, we will have to wait for it to arrive.
Thanks Ron and Dennis for the clarification.
I think it’s great this blog isn’t an echo chamber. Your respective opinions has also divided the other contributers on here and it will be interesting to see whose camp will be closer as time unfolds.
Ron you mentioned Saudi Arabia and Russia has peaked. I am assuming you are referring to the geological peak, essentially not due to economics and geopolitics. What makes you say that both those countries are in geological peak ?
Iron Mike,
I agree with Ron that our positions are not that different, he thinks we are on a plateau that won’t quite reach the previous peak in 2018, I think we are on a plateau that may surpass the previous peak by a small amount, presently my guess is by 700 kb/d, this amounts to less than 1% of World output if my guess of 83700 kb/d is correct, it’s a rounding error, not that important in the grand scheme and not really worth arguing over. Could be that Ron is right that the peak is behind us. I do think that Ron’s guess that 2028 output will be about 75000 kb/d for an annual average for World C plus C output may be off by at least 5000 kb/d, and more likely by 8000 kb/d, but note this is what Kengeo remembers Ron saying at some point, I do not know if he is correct, Ron will tell us if I am incorrect (or if Kengeo is incorrect).
Iron Mike,
Correction. Ron believes we will remain below 2022 average output after 2023 or that by 2029 output will definitely be less than 2022 average output which was 80.75 Mb/d. Or he might mean less than December 2022 output which was 81.73 Mb/d and that annual average output for every year after 2022 will be less than 82 Mb/d, so he might think we will be on a plateau at just under 82 Mb/d from 2023 to 2030. I am guessing, he is not too clear on the details.
Iron Mike – Mandela effect must be in play because I ALSO recall Ron saying “When US peaks the World Peaks” like multiple times and I thought it was a pretty reasonable probability. If he doesn’t believe that or never said it, I’m not dying on that hill, just wanted to let you know that you weren’t the only one 🙂 Please don’t get angry at me Ron.
I ALSO recall Ron saying “When US peaks the World Peaks” like multiple times and I thought it was a pretty reasonable probability.
Bullshit! I never said any such thing! In fact I have always maintained the exact opposite. I have always said that the US is just a bit player in the grand scheme of things. (From here on out, not in the past.) I have stressed that point over and over. Dennis can confirm that because it was always in response to his argument that the US had not yet peaked while others were arguing the US had peaked.
My point has always been that the US Peak has very little to do with world peak. I know that the US is currently the world’s largest oil producer but our days of dramatic growth are over. We may increase production a little but nothing to compare with our growth in the heydays of dramatic shale growth.
Yes, I have said, many times, that it looks like the IEA, the EIA, or whomever, are depending on the US to keep peak oil at bay. But I then stressed that US growth was over. The US will not save the world from peak oil. That is, and has always been, my point.
Note: The World peaked one full year before the US peaked. The US may, or may not, surpass their peak of 2019. The world will not surpass its peak of November 2018.
Twocats,
I remember someone saying that the World will peak when the US peaks, but not me or Ron as I recall, maybe Hole in Head, I don’t really remember. In any case the World may peak around the time the US peaks as much of the recent increase (past 10 years or so) in World output has been due to rising US tight Oil output. I expect that will peak roughly in 2030 and the World about 2 years before that. I have not really focused on when the US will peak, it might not coincide with the tight oil peak and might coincide with the World peak, not really sure because I don’t have a forecast for US C plus C output, only US tight oil.
Dennis , not me . Anyway it is of no importance , Scrap it . You and Kengeo are having a real good conversation . Very interesting outliers and observations from both . Your efforts are appreciated .
Sorry, just guessing, seems someone said it, maybe my imagination.
Dennis – It’s nonsense either way, the US peaked for conventional oil in70s, a secondary peak for non-conventional occurred in 2019 (13 mb), if you believe Rystad then LTO has further growth thru next 4-5 years, current growth doesn’t match that estimate however…
“The World” which in theory includes all producers has a wide range of country specific peaks that have occurred over a wide range generally centered about 2008. Oil growth of the 1960s will likely have a corresponding decline phase at 2025 plus or minus 3-5 years.
Call it 1970 to 2030, midpoint is 2000.
I believe it’s fairly clear once you look at world less US…
My guess is that decline rate will be 2-3 times steeper than average growth rate from 1980 to 2000 timeframe.
For a URR of 2500 Gb to be remotely possible, we need 1P growth of at least 5-10 % annually …we are seeing just the opposite though, which is exactly what would be expected under post peak conditions…
Here is something to consider regarding the next peak, more than likely lower than November 2018.
Below is a table that shows what I believe is OPEC’s spare capacity relative to May 2023 production, which was 28,000 kb/d. The attached table shows spare capacity of 1,687 kb/d. Let’s round it up to 2,000 kb/d. So adding that to May’s production gives OPEC sustainable capacity of 30,000 kb/d.
At the November 2018 peak, OPEC was producing 32,300 kb/d. Current world C + C production is 82,000 kb/d, 2,586 kb/d lower than November 2018. So if OPEC can come up with close to 2,000 kb/d and a few other countries can add another 600 kb/d, it may be possible to get to 84,600 kb/d in a few years. However this discussion has made no mention of the net decline rate of close to 500 kb/d/yr.
Bottom line, exceeding November 2018 will not be easy.
Ovi,
Possibly true that the single month peak won’t be surpassed. I believe it is the 12 month average which is of greater importance. That World C plus C peak was 83.0 Mbpd based on EIA data. The statistical review of World energy has the peak at 83.6 Mbpd. So we need either 1 or 1.6 Mbpd above 82 Mbpd to reach the peak. STEO has us close by 2024. My best guess is 2026 to reach byond EIA estimate and 2028 for BP estimate.
Ovi,
Keep in mind that if the US removes sanctions from Iran, there is another 1200 kb/d of capacity, it might not ever happen, but the US might be more motivated if oil was $100/bo or higher, which we might see in late 2023 or early 2024. Probably won’t happen until after 2024 election in the US. Also possible that capacity might be expanded in Saudi Arabia, UAE, and Iraq, though it will take a few years of investment, higher oil prices might lead to such an outcome.
Dennis
Do we really know what is happening in Iran. I think part of the world oversupply is related to unknown Iranian production and exports. I think they are producing and exporting more than the OPEC MOMR is reporting.
Also any idea on the huge difference between the EIA and OPEC. I know that OPEC is Crude only. But is there really that much extra condensate in Iranian production, order of 600 kb/d.
Ovi,
The chart below compares EIA data with the Statistical Review of World Energy (SRWE) for Iran’s C plus C (annual data). Also remember that Iran has very large natural gas fields and produced 259 billion cubic meters of natural gas in 2022 which likely yields quite a bit of condensate. Iraq produced about 9 BCM and Kuwait about 12 BCM so we would expect considerably less condensate from those nations in comparison to Iran. Not clear why there is such a large condensate proportion for Iran. The condensate amount does seem to track with natural gas output from 2018 to 2022. Using data for Natural gas from SRWE.
Ovi , are we to believe that for 50 years Iran was twiddling it’s thumbs waiting for the sanctions to be lifted ? They sell all they produce . When was the last time you heard that
there are off shore tankers being used for storage by the Iranians ? The Russian sanctions have set a new rule ” Oil flows cannot be stopped , only redirected ” . The oil will flow . When and if the sanctions are lifted it will only mean what is ” unofficial ” becomes ” official ” . Balance sheet adjustment as they call it in accounting .
Hole in head,
The Iranian output numbers don’t come from Iran, they are estimated by Secondary Sources, there are ways of tracking this stuff. For Iran you just watch the ships leaving export terminals, you can tell if the ship is empty or full by its level on the water.
Dennis
Maybe that is the answer, that a lot of the condensate comes from their gas fields. I am surprised that a gas field would have that mich condensate. I thought condensate started at C5 and up.
Ovi,
Note that I think this is only a partial answer, based on condensate from Saudi Arabia I would expect only about 400 kb/d from Iranian gas, it might be that the Iranian natural gas has more condensate than Saudi fields or perhaps they account for things differently there to avoid quotas or sanctions or something. Alternatively the data may just not be very good. It could be that the crude output is being under-reported.
“Recent better-than-expected production from US- sanctioned countries Russia, Iran, and Venezuela is a reminder that **geopolitical risk can cut both ways**”— Javier Bias
Iran appears close to testing a nuclear warhead. It’s hard to imagine additional sanctions won’t be imposed if this happens.
https://oilprice.com/Geopolitics/Asia/Foreign-Intel-Iran-Close-To-Testing-First-Nuke.html
Stephen , nothing will happen . 50 years of sanctions on Tehran have all been neutralized . Tehran exports all the oil it can pump , even as far as Venezuela .More sanctions are useless . The law of diminishing returns . There are two nightmare scenarios for the elite in Washington . A war in the Taiwan Straits and the closure of the Strait of Hormuz ( 65 % of the total world oil exports) . The Iranians hold the trump card and they know it . Relax .
@stephen – I don’t have any evidence for this specific claim against this specific article, but if foreign intelligence agencies are producing reports linking Iran to nuclear weapons you should be extremely extremely skeptical.
I don’t have time to go into the history of US Intelligence agencies using foreign intelligence and media agencies to seed misinformation back into the US to influence political decisions. But that history is well known and VAST. Even the article you linked to said, “But now a HIGHLY CONTROVERSIAL (my caps) report claims that Iran is close to testing its first ever nuclear weapon.” Boy have we heard this before. And it has never been true.
The much much much more likely reality is probably that the US is working on restarting the Iran-US nuclear deal, and there are plenty of people in various Intelligence agencies that think this would be a bad thing. To scuttle those talks you beat the “Iran Nuclear Weapons” drum as loud as you can. it’s pretty simple strategy and it worked well enough to make this thread so it can’t be all bad.
The Iranians hold the trump card and they know it .
I don’t really think so. The US Navy is larger than the next 10 navies combined, or something like that. If they even tried to close the Strait of Hormuz they would be blown out of the water, and they know it.
China is not nearly as dumb as Putin. They know a war over Taiwan would destroy their already very fragile economy.
The Russian invasion has been a wake-up call for everyone. Start some shit and you will likely choke on your own crap. The fact that we now have a global economy and every nation is dependent on global trade means they cannot start a war willy-nilly or it will be their own undoing.
I don’t have time to go into the history of US Intelligence agencies using foreign intelligence and media agencies to seed misinformation back into the US to influence political decisions.
Really now? Just how did you, or anyone else, find data that supports the idea that US intelligence agencies spread misinformation to foreign intelligence agencies in order to influence US political decisions? Did Trump wave that top-secret paper around to his golf buddies?
I am not a fan of conspiracy theories and I for damn sure don’t believe that one.
Ron , my last post on the subject of Iran and also of what Twocats posted .
The blue water US navy is a myth . Khomeini came to power in 1979 ( 44 years ago) and the sanctions were announced , So for 44 years Iran ships oil to Venezuela , India . Malaysia and wherever it wants but the US navy can only twiddle it’s thumbs ? Dry dock the navy . The US is still fighting WW2 with it’s aircraft carriers and frigates . This is the era of total surveillance and hypersonic missiles . The time of dog fights in the air with VanRichtoven are passe . Aircraft carriers are sitting ducks . The US DOD is using abacus while the world is onto ChatGpt . Rand Corp and DOD have done simulations of both the Strait of Hormuz and Taiwan Strait scenarios . Every time the Red Army ( Iran. China win). See link below on the navy . Sitting ducks .
Now to the what Twocats posted . Of course the US lies it’s way to war . Explain ,the Gulf of Tonkin incident which led to US involvement in Vietnam , WMD in Iraq , Taliban involvement in 9/11 ( 17 of the 20 were Saudi’s) . We have to go there ,so that they don’t come here — GWB II . Now the latest lie “If we don’t stop Putin in Ukraine , he will march to Brussels ” . It is the ” Empire of Lies “. The MMIC ( Military-Medical Industrial Complex ) calls the shots . Not questioning your integrity or honesty but on certain issues you have blinkers on , that is why my first line on the post .
https://brucewilds.blogspot.com/2023/03/the-navys-future-are-these-ships.html
Try the Failing New York Times, try Carl Bernstein, or the CIA itself. And it’s not a conspiracy – all this was actually uncovered and made public during the Church committee. It was supposedly dissolved, but if you believe that you’re naive.
https://www.nytimes.com/1977/12/26/archives/worldwide-propaganda-network-built-by-the-cia-a-worldwide-network.html
https://www.carlbernstein.com/the-cia-and-the-media-rolling-stone-10-20-1977
https://www.cia.gov/readingroom/document/cia-rdp99-00498r000100140110-7
https://www.nytimes.com/1976/02/12/archives/cia-to-stop-enlisting-agents-from-the-press-and-the-church-cia-to.html
And so if the CIA never did it, it’s weird that they would agree to stop doing it. Once after the Church. None other than George Bush made the statement:
https://www.cia.gov/readingroom/docs/CIA-RDP77-00432R000100390006-9.pdf
Also on Iran – I haven’t really been following this but apparently there has been A LOT of back and forth between IAEA/Rafael Grossi, Iran, and Israel over what the latest report about Iran’s nuclear enrichment, etc should or should not contain. Much like the CIA – the Mossad has fantastic working relations with many foreign intelligence services, and could easily push this line through Sweden et al. I’m just saying, the US doesn’t really believe Iran is building nuclear weapons – yet this line has been pushed very hard for decades.
updated 2023:
https://crsreports.congress.gov/product/pdf/IF/IF12106#:~:text=According to official U.S. assessments,Iran’s Shahab-3 ballistic missile.
the placard incident 2012:
https://jp.reuters.com/article/oukwd-uk-un-assembly-israel-idAFBRE88Q1GX20120927
again in 2018
https://www.timesofisrael.com/us-official-calls-netanyahus-iran-nuclear-warehouse-claim-somewhat-misleading/
if they’re willing to lie this much in public, how much covert stuff would Mossad be willing to do. one might ask.
Ovi,
We have increased output from US tight oil, Guyana, Canada, Brazil, Argentina, and Norway, along with increases from OPEC 13. If we focus on 12 month peak of 83,000 kb/d we are only 1000 kb/d away.
What??? Dennis, that statement makes no sense whatsoever.
OPEC November 2018
Iron Mike –
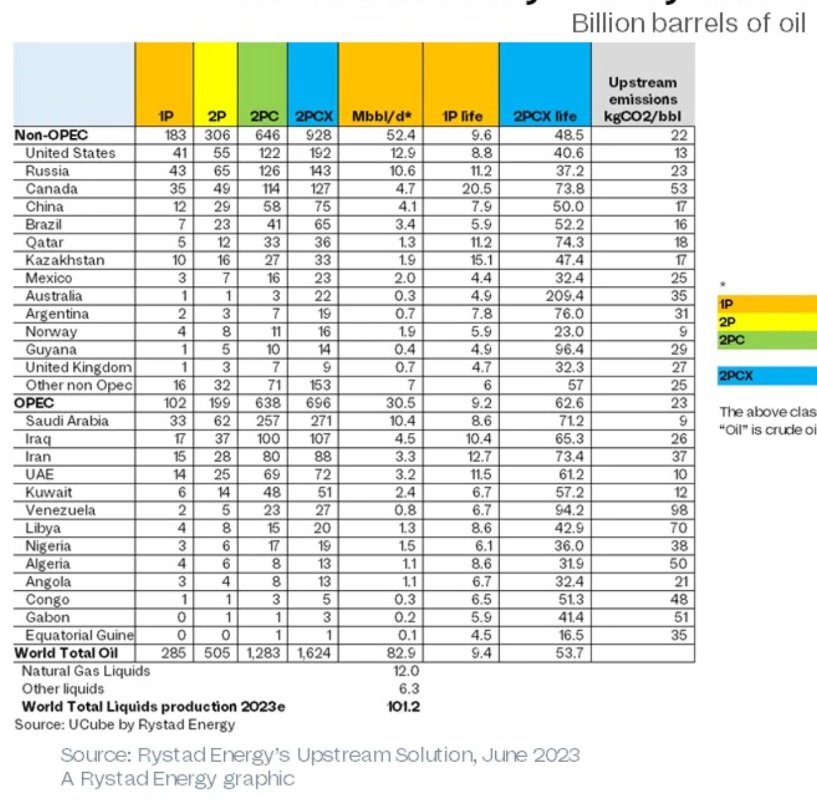
Disagree, we have 25+ years of scholarly work that called a precise peak at or about 1250-1300 Gb of total production (URR of ~2.5 Tb). Cumulative production is more than 1.4 Tb, so even if you can convince yourself that URR is 2.8 Tb (meaning there is 1.4 Tb remaining – which doesn’t agree well with 1P [0.29 Tb], 2P [0.5 Tb], or 2PC [1.28 Tb] estimates), the peak is passed.
As Laherrere put it in his 2022 paper:
“Overall, the key conclusion of Fig. 7 is just how soon are the expected peaks of global production for all four aggregations of oil. This in turn reflects the nature of a Hubbert curve, where a significantly greater URR leads to a higher production peak but one not much postponed.”
Figure 7 he refers to has LTO peaking in ~2019, crude peaking ~2018-2020, extra heavy peaking ~2030, and Natural Gas peaking ~2045…
The time for debate is nearly over…
Kengeo
The USGS estimate for conventional C plus C TRR was 3000 Gb 23 years ago at that time Campbell and Laherrere were claiming 1800 Gb. Recently Laherrere has estimated 2500 Gb for conventional only.
The peak does not necessarily occur at 50% of URR and the World peak does not necessarily coincidence with conventional peak. For all C plus C the World HL suggests 3500 Gb, that would suggest peak at 1750 Gb. That would be in 2032 or so.
Kengeo,
The U=2500 curve is conventional oil (excludes extra heavy (XH) oil and LTO). My model has this peak in 2016 with a secondary lower peak in 2025-2029 due to slow recovery from the pandemic. His Crude minus XH curve peaks around 2025 which suggests LTO peaks sometime after 2025 as it makes up for decline in conventional curve from 2020 to 2025. The final all crude curve adds XH oil which moves the crude peak to about 2032 or so, with XH oil peaking some time after that date, again because it makes up for the decline of the C plus C less XH curve. Note that actual production rarely follows a Hubbert curve as can be seen by looking at the production curves before 2020, so prediction based on Hubbert curves (or any other model) will be wrong every time, probability 100%.
Also you forgot 2PCX which is about 1624 Gb an increase of 52 Gb compared to Rystad’s 2022 estimate. This suggests a World Ultimately Recoverable Resource (URR) estimate of 3097 Gb, which when we round to a reasonable number of significant digits is 3100 Gb.
Kengeo,
We can agree to disagree there. I think there seems to be an underestimation in URR.
A URR of around 3000-3300Gb seems like the most likely case to me for conventional and unconventional resources. Now some will see this as an underestimation, others as an overestimation. Time will tell.
I think peak oil will most likely be around 2025. Economics permitting. If the global growth is anemic then the plateau will be longer, and we won’t have a secondary peak necessarily.
Iron Mike,
Sounds reasonable, peak could be 2025 followed by plateau, I would say 2025 to 2030 is a better guess for the peak but who knows, the URR estimate of 3250 plus or minus 150 Gb sounds very reasonable to me, I might put it a bit wider at 3000 to 3500 Gb for all C plus C resources, but we are quite close in our best guesses (3150 vs 3250 maybe call it 3200 plus or minus 200 Gb for our average guess).
We are already at peak plateau. starting in 2014
82 Mbpd +/- 3 (4%)
If anyone has a better idea of what the peak plateau levels are…lets see it.
Hickory,
Your guess sound reasonable, my expectation is your plateau (82 plus or minus 3 Mb/d) will be from about 2015 to 2033 (except 2020 and 2021). I use a 12 month average that is centered rather then the trailing 12 month average that Ron prefers. The red curve is shifted to the left by 6 months.
Through 2033? Naw, the curve will turn down this year.
I use a 12 month average that is centered rather then the trailing 12 month average that Ron prefers.
Yes, I very much prefer the 12 month trailing average because it is so much more informative. For instance, if you want to know the average production for any year, just mouse over “December” and it will give you that number. For OPEC 13 it was 28,837.000 for 2022. And when the monthly data crosses the 12-month average, you get a pretty good idea that things are headed lower or higher, whichever direction it crosses. For OPEC 13, it crossed, heading lower, in January. And when the 12-month average turns lower, then that pretty much confirms things are headed lower. That happened in April for OPEC 13.
@Iron Mike “economics permitting” – commendations on a very economical phrase. I have an 800 word post ready to go some day that could be titled “economics permitting”. for now I’m happy to let the economic situation unfold without much comment.
In the chart below I compare a Hubbert model with URR=2500 Gb with my best guess Oil Shock Model for Conventional Oil. Notice how the Hubbert Model does not fit historical output data from 1920 to 2022 (the Shock Model matches the historical output data exactly from 1920 to 2022). We do not know what future output will be, both the Hubbert Model and my best guess Oil Shock Model will be incorrect (probability 100%). It seems unlikely based on history from 1920 to 2022 that the Hubbert Model will match future output because it rarely has in the past. The cumulative output is nearly a match in 2030 and the average annual decline rate for the two models from 2031 to 2060 is fairly close (2.2% for Shock Model and 2.4% for Hubbert Model).
Unconventional Shock Model and Hubbert Model.
Combined Models for Conventional and Unconventional for Shock Model and Hubbert Models presented above.
Just as Hubbert Model has not matched World C pus C output in the past, we do not expect it will match output in the future.
Saudi Arabia’s annual crude-only production in thousand barrels per day. Data for 2023 is only five months, from January through May.
Ron,
It is true that for every nation their peak was last year or some previous year for annual output, at least so far, clearly KSA could produce more if they thought it was needed. Right now they believe there is plenty of oil to meet demand.
Dennis, the question is not if KSA could produce more or not. The question is; How much more oil could KSA produce? And for how long could they produce it? Production from Ghawar is a closely guarded secret. But there is every reason to believe that the world’s largest oil field is in sharp decline.
Ron,
I do not have the answer, I think they can produce at their recent 12 month peak for a while, and perhaps a bit more, I only believe it when I see it. I think we will know more when we see high oil prices for a sustained period similar to what we saw from 2011 to 2014, when average Brent prices were well over $100/bo in 2022 US$.
Just to remind everyone of my definition of sustainable capacity, it is the highest 12 month average output recently achieved by a nation. For Saudi Arabia’s C plus C output it was 10644 kb/d for the 12 months from Jan 2022 to December 2022 based on EIA data. The Statistical Review of World Energy has it at 10509 kb/d in 2022. The average of the two estimates (EIA and SRWE) would be 10577 kb/d for annual average output in 2022 for KSA C plus C.
Dennis – You are hilariously stubborn, kudos! So forget about the peak and simply state the problem as “when is the mid-point of cumulative production compared to total estimated reserves”…
Kengeo,
The R in URR IS recoverable resources
The U in URR stands for Ultimate.
Glossary For Peak Oil and Gas, Energy Terminology
Ultimately Recoverable Resources (URR)
URR is a concept with many names: Total Recoverable Reserves, Ultimately Recoverable Reserves (shortened to URR) or simply “Ultimate”
The URR is an estimate of the total amount of recoverable oil that exists in the ground before the production starts. In case of a single oil field, URR is defined as:
URR (single field) = cumulative production + recoverable reserves
When talking about a region or a country, the URR refers to the total amount of oil that will ever be produced from that region/country including yet-to-find fields:
URR (region, country) = cumulative production + recoverable reserves + yet-to-find
The author of the above definition uses the terms “resources” and “reserves” interchangeably. Meaning he thinks they mean the same thing.
I think it is obvious that Saudi Arabia has produced over half the oil it can ultimately produce. In fact they are very likely well past that point. Ghawar has always been over half their production, but no longer. That old field is in serious decline. Just like Russia’s old giant fields. Just like kuwait……
Ron,
Find a better resource, see for example Section 3a at link below
https://royalsocietypublishing.org/doi/10.1098/rsta.2012.0448
See also
https://onepetro.org/EM/article-abstract/3/02/79/198050/Quantifying-the-Uncertainty-in-Estimates-of?redirectedFrom=fulltext
Our objective is to quantify the uncertainty in estimates of world conventional ultimately recoverable resources (URR) and time to peak oil rate. We use two different methodologies. First, we employ a mathematical modeling technique based on regression of historical production data using Hubbert’s logistic model and a normal distribution model. However, we conduct the analyses probabilistically, considering errors in both the data and the model, which results in likelihood probability distributions for URR and time to peak rate. Second, we use a multiple-experts analysis to combine estimates from the multitude of papers presented in the literature, yielding an overall distribution for estimated world URR.
Both the mathematical modeling and the multiple-experts analysis indicate that there is considerable uncertainty in estimates of world conventional oil URR. Our best estimate is a P10–P90 range of 1.8–4.4 trillion bbl with a mean of 2.9 trillion bbl. Because of some conservative assumptions in our analysis, we believe the uncertainty is actually greater than indicated above, and the additional uncertainty is in the upside, resulting in larger P90 and mean values. In short, we do not have enough information at this time to say with reliability what the ultimate world conventional oil recovery will be. It could peak soon, somewhere in the distant future, or somewhere in between. It would be wise to consider all of these possible outcomes in planning and making decisions regarding capital investment and formulation of energy policy.
Kengeo,
I do not assume the peak occurs at 50%, it can occur before or after that point.
This headline is a little misleading. Malaysian crude oil peaked in 2017. They are talking barrels of oil equivalent, not just crude.
Malaysia Expects Its Oil Production To Peak Next Year Jun 27, 2023
Malaysia’s state-owned oil and gas company Petronas has forecast the country’s crude oil production will peak in 2024 at around 2 million barrels of oil equivalent daily.
The bulk of Petronas’ output is natural gas and it will remain this way, the company’s head of exploration and production, Adif Zulkifli, said at the Energy Asia conference, as quoted by Reuters.
Natural gas accounts for between 60% and 70% of Petronas’ hydrocarbon production.
Malaysia data .
CHART OF THE DAY: Freshly updated with new data released this morning (with a big🤥 warning).
China claims it imported ~1.4m b/d of **Malaysian** oil last month. That’s a fresh record high, and almost triple the real output of Malaysia. The reality? Iranian oil | —- Javier Baes .
Oil black market flourishes in the post-peak world…
OPEC is clearly post-peak, if there is such a thing as post-peak.
Sorry, the caption inside the chart should read OPEC 13, not OPEC 12. I can edit the text of the post but not the chart.
Will Russia save us from peak oil? No, they are having very serious problems.
Will the USA save us from peak oil? No, USA shale oil is close to peaking. At any rate, any increase from the Permina will be minimal at best.
Will OPEC save us from peak oil? Are you kidding me?
Russia’s Crude Oil Exports Dip By Nearly 1 Million Bpd Jun 27, 2023
Russian crude oil exports by sea plunged by as much as 980,000 barrels per day (bpd) in the week to June 25, although the dip was much more likely due to maintenance at a key export terminal rather than the promised cut in Russia’s crude oil production.
Weekly crude shipments from Russia’s export terminals fell by nearly 1 million bpd to 2.55 million bpd in the week ending June 25, tanker-tracking data monitored by Bloomberg showed on Tuesday.
Crude oil shipments fell by around 263,000 bpd on a four-week average basis in the four weeks to June 25, and last week’s plunge compared to previous weeks is likely only temporary, according to the data analyzed by Bloomberg’s Julian Lee.
Someone, please tell me why this is supposed to be funny. There is a picture of some guy belly laughing about this,
LOL! Bloomberg Predicts (Wait for it….) Peak Oil Demand by 2029
Almost from the first day when MDN editor Jim Willis began to write the MDN blog/news site, he heard of the concept of “peak oil.” For many years, peak oilers said that the world’s oil supply would soon run out–there’s just not enough oil left to extract out of the ground. Which is a joke. When the world saw the power of shale energy, it became evident even to the most hardened liars that they could no longer sell the concept of peak oil supply. Seemingly overnight, they changed and began to peddle peak oil demand. The lefties at Bloomberg are now predicting peak oil (for all uses) is coming in 2029. Which reminds us of the end-of-the-world predictions that surface from various cults every few years. This time it’s a prediction coming from the cult of anti-fossil fuelism.
Ron,
The cornucopians are concerned about peak demand for fossil fuel as it the fossil fuel companies provide their paychecks, it’s nervous laughter or perhaps laughing when they should be crying. I think Bloomberg may be a bit optimistic on 2029 for peak demand, probably more like 2035 and even that may be optimistic considering the small jump in fossil fuel demand (0.5% for all fossil fuel primary energy) in 2022 according to the Statistical Review of World Energy.
Dennis, there can be only one peak. When demand peaks, production also peaks. And when production peaks, demand peaks. The price will always be the arbitrator.
If demand drops off and fails to increase, then the price will drop so low that production will also peak. But if production cannot increase, then the price will get so high demand will drop to meet supply.
Whether the peak happens in 2018, 2029, or 2035, that will be the peak of both production and demand.
Ron,
I agree. Demand and Supply will be equal.
Yep, the tricky part is price…he comes in to try and make everyone happy…increasingly tough job these days!
Kengeo,
Price is just the number that matches what is produced with what people want, whether anybody is happy or not is not part of the equation. Producers always want a higher price and consumers always want a lower price and in a sense nobody is every happy with the price. It just is.
Bloomberg- “reminds us of the end-of-the-world predictions that surface from various cults”
Cult- a misplaced or excessive admiration for a particular person or thing. “a cult of personality surrounding the leaders”
HB- “@RGR, best not feed the cult with facts outside their short-term memory.”
https://peakoilbarrel.com/opec-update-june-2023/#comment-758972
Ron- “HB, even a damn fool knows the increase in US oil production last year was due to recovery from the covid-19 deep cuts.”
“SURVIVALIST – I’d say if someone called peak oil to be in 2015, and then it didn’t happen until say 2025…. that’s close enough for me man”
I’m guessing calling in peak in 2018 and it being 2029 works for him too. Mission creep.
Thank you Ron for making my case
HB, made it back to the library I see!
Grow up, you just made stupid shit up from ignorance. Back it up. You shouldn’t trash talk. I can prove your comment is ignorance and follow your comments 24/7 to demonstrate.
“I can prove your comment is ignorance and follow your comments 24/7 to demonstrate.”
Obsess much?
I’m starting to think ‘the beach’ is in moms basement.
Critical thinking isn’t one of your strong traits Matt
FWIW my peak oil prediction was 2023. I made it in 2014. Just a wild ass guess. My best hunch. When I saw George Kaplan’s graph around 2018 I changed my mind to 2025 …. but publicly I stuck with the 2023 prediction since I had been hanging my hat on it a while when chatting with friends. I’d say we’re all in the ball park. Close enough. The topic of such predictions doesn’t require culture war histrionics.
Here’s the link to George’s comment that I find so appealing.
https://peakoilbarrel.com/eias-latest-usa-world-oil-production-data/#comment-651548
Survivalist,
Without the pandemic, 2023 to 2025 would have been good guesses. In grand scheme I agree, it is of little significance, As things stand now, 2025 looks like a better guess than 2023. I still like 2028, but who knows, only the woman upstairs.
Cheers Dennis. Thanks for sticking your neck out and taking the heat in the comments.
“I’m guessing calling in peak in 2018 and it being 2029 works for him too.”
Yeah, I’d say that’s pretty good. 11 years ain’t bad in the context of geologic time.
Rystad Energy has just published its annual review of world oil reserves. Look at the collapse of Saudi Arabi 2P reserves, comparing this year to last.
https://futurocienciaficcionymatrix.blogspot.com/2023/06/reservas-mundiales-de-petroleo-segun.html
Quark, thanks for this data. It is amazing. I would say Rystad Energy is a far more reliable source for reserves than the OPEC propaganda. I am going to save this and use it as a source for future discussions.
I also loved the comments and discussion on your blog. Very interesting. I will add my two cents worth. I do not see seven years of tranquility before peak oil panic sets in. I see declining production starting this year and panic starting in three or four years.
Thanks again.
Thank you very much Ron. I have been reading peak oil barrel for years and learning from all of you.
Glad to be able to contribute.
Never trusted Saudi Aramco before, but now that they have gone public (in 2020) they have to tell the truth to shareholders. Is that part of it?
I remember someone using this to explain OPEC reserves . 🙂
Quark,
Thanks for the information and links much appreciated.
Ron, it seems to me at least, there is a possibility Saudi Arabia and Russia are not in geological peak. Their reasons for cutting production are more related to economics and geopolitics (sanctions) for the present moment.
As you said above, Ghawar is a state secret, and the same can be said more or less for Russias reserves. Hence its extremely difficult to make definite statements about geological peak.
In my opinion, the real test is to see production during periods when the global economy is humming. If supply doesn’t meet demand during such periods, that might be a signal of geological peak. In other words high oil prices, (without price gouging).
Again just speculation on my part.
Ron, it seems to me at least, there is a possibility Saudi Arabia and Russia are not in geological peak. Their reasons for cutting production are more related to economics and geopolitics (sanctions) for the present moment.
Oh my goodness, man. The fact that Russia’s giant fields in Western Siberia and the one in the Urals, together produce over 60% of Russian oil, have been known to be in steep decline for over a decade. It is only the new discoveries in the Arctic that have kept them from declining until this year. As for Saudi Arabia, the fact that Ghawar is in steep decline is a well-known fact. Just a few searches on Google will confirm that fact. For instance here is an article from three years ago. Long article, here is a sample from the middle:
The decline of oil has already begun
Most of Russia’s oil comes from aging fields in Western Siberia that are in decline, and Minister of Energy, Alexander Novak, has warned that Russia’s oil production could drop by 40% by 2035. Saudi Arabia – in spite of threatening to increase production – also appears to be in decline. According to Bloomberg, the giant Ghawar oil field in Saudi Arabia is “fading faster than anyone guessed.” Last year, Saudi Aramco oil company published financial figures, revealing that Ghawar’s historic production has declined by 24% in six years.
Aramco reports a natural decline rate of 8%, which means their production would fall by half in less than nine years, without investing billions annually into new wells and new technology on marginal sites. In 2005, Saudi Arabia increased its operating rig count by 144%, to increase oil production by 6.5%.
According to a 2019 Geological Survey of Finland report, the world average decline rate on post-peak production is 5 to 7%, meaning that oil production could plummet to half its current volume in the next 10 to 14 years.
Hey, it’s all over but the crying. Yes, the decline has already begun. It started in 2019. The peak of 2018-2019 will never be reached again.
Without a doubt! I’d say a year ago I wan’t 100% sure, but now seems like a watershed moment…really want to know the details for the massive OPEC 2P drop…
OPEC currently produces ~10 Gb annually, their 1P is 100 Gb, and 2P is only 200 Gb…
No wonder Saudi’s are buying PGA golf, tennis, and anything they can get their paws on!
I’m packing up all my snake oil and taking a trip to the middle east, they are buying everything!
Quark , thanks for the info . Your effort is appreciated . Disagreement , where ? 7 years . Why ? Since 2021/2022 the supply and price have been distorted by the release of about 1 mbpd of oil from the SPR ‘s worldwide . This has disguised the actual situation on the ground . Peak oil has gone in the background but has not vanished from the scenario . My guess is 2-3 years ( close to Iron Mike ) . Why ? We are ignoring two factors (1) It is ELM that will kick in earlier . (2) When peak oil goes mainstream we will see resource nationalism or what in common parlance is called hoarding . This will be akin to calling ” fire ” in a movie hall . I am not even talking of ” black swan ” events . These two are known issues to the observers / students of peak oil and are inescapable . Muchos Gracias , Senor .
Great find! Most of their charts are such poor quality it’s hard to read, looks like you not only found a clear/clean copy but it’s the new one too!
Kengeo,
A pretty good copy at this link
https://www.datocms-assets.com/75979/1687966805-20230627-recoverable-oil-pr-charts-1.jpg?fm=webp
screenshot below, Quark’s is much better. See end of post where I have uploaded a copy, still not as good as Quark’s.
Links to good copies of 2022 and 2023 reports from rystad, the 2023 report first
https://www.datocms-assets.com/75979/1687966805-20230627-recoverable-oil-pr-charts-1.jpg?fm=webp
and the 2022 report below
https://www.datocms-assets.com/75979/1661280656-20220630-world-recoverable-oil-pr.jpg?fm=webp
Thanks Dennis – I usually just work off the shoddy ones and squint
Legend for reserves below
Quick Analysis:
Reserves have shifted considerably since last year:
In 2022 OPEC had 45% of world 1P, now it’s down to 36%.
Similarly, OPEC had 54% of world 2P, now it’s down to 39%.
For 2PC, essentially unchanged with OPEC having 50% of world 2PC (based on 1P and 2P that share seems unbelievable…). Also doesn’t seem very believable since OPEC is only producing 30% of world supply…
The 2P downward revisions for top 5 OPEC producers amount to ~100
Total 1P shrank by 4.4% (from 298 Gb to 285 Gb).
Total 2P shrank by 7.9% (from 548 Gb to 505 Gb).
Total 2PC grew by 5.3% (from 1218 Gb to 1283 Gb).
Total 2PCX grew by 3.3% (from 1572 Gb to 1624 Gb).
Reminder for 1P vs 2P vs 2PC vs 2PCX:
1P – conservative estimate (proven reserves currently being harvested)
2P – most likely estimate (50% of being “right”)
2PC – includes non-commercial oil (as in no chance of bringing oil to market with existing technology)
2PCX – existing/contingent/risked/undiscovered (not a remotely real number – 0% chance of being statistically significant in bring oil to market)
Dennis – What’s your take on the 2P reduction, seems pretty significant?
Kengeo,
The OPEC 2P reserves have always been in doubt, this estimate may be better, I do not have the details so can only guess, at the World level the change in 2P reserves was only 43 Gb. I think the 2PCX number is the one to focus on which suggests recoverable crude plus condensate resources plus cumulative output for C plus C at the end of 2022 is 3091 Gb. Your understanding of noncommercial oil is not correct. Whether oil is commercial or not depends on the price of oil and natural gas and NGL, technology continually improves. It was not long ago (about 15 years) that many claimed that tight oil would never be produced in significant quantities.
New oil gets discovered (as was the case in Guyana a few years ago) and contingent resources are often developed later and become reserves. In addition the estimates of 2P reserves tends to grow over time. About 29 Gb of oil was produced last year, so with no revisions to 2P reserves and no discoveries or reserve growth we would expect 2P reserves to be 519 Gb this year if last year’s estimate was accurate. Instead the estimate is 508 Gb this year which indicates 2P reserve shrinkage (the opposite of reserve growth) of 11 Gb.
Dennis – I would expect that once a region has been fully developed then reserve will shrink since there’s nothing left to discover, would make sense simplistically. Interesting that producers of more than 40% of world production saw their 2P reserves shrink by 33%! That would be an alarming trend if it continues. Shrinkage (112 Gb) was 892% versus production (12.6 Gb)!!!
But 1P also shrank considerably for the group ~288% (36 Gb), also alarming.
For this group, 1P/2P remaining ranges from 10 years supply (122 Gb) to 17 years supply (217 Gb).
That’s if future shrinkage DOESN’T continue…
The EIA shows California reserves at about 1.7 billion barrels
https://www.eia.gov/dnav/pet/hist/LeafHandler.ashx?n=PET&s=RCRR01SCA_1&f=A
Off the coast of California there is estimated over 10 billion barrels of oil resources. That doesn’t count the Pacific coastline of Mexico, Oregon, Washington, Canada and Alaska. Oil fields don’t know political lines. In addition, the San Joaquin Valley is estimated to have up to 100 billion barrels of shale oil resources 1800 feet thick at about 10,000 feet. Some here would be proud that California isn’t developing and exporting it’s resources.
Years from now when push comes to shove and we are all driving EV’s powered by solar panels. There will still be plenty of oil at a price.
It was a beautiful 75 degrees at the beach today.
Kengeo,
In the US reserves have been growing for many years. This is in the most mature oil fields in the World.
Dennis that is a highly misleading statement. Reserves in some nations may be growing, but production in most mature fields is not growing, it is clearly declining. All of Russia’s old Western Siberian fields are in decline, Ghawar is in decline, Prudhoe Bay is in decline, Cantrell is in decline, Bergin is in decline, and I could go on and on.
Production in virtually all of the giant and super giant fields in the world are in very serious decline. Production is what really counts, not estimated reserves.
Ron,
I assume people reading this blog know the difference between reserves and production.
Chart below has World C plus C production from 1930 to 2022 with Shock model (URR=2600 GB) and Hubbert Model (U=3500 GB) to 2030. Shock model matches World output 1930 to 2022. Peak for Hubbert Model is 2035 at 89 Mb/d, I think that is probably too high and expect peak around 84 Mb/d in 2028.
Kengeo,
For a long time OPEC reserves have been suspect, I guess Rystad just decided to take a closer look, note that while OPEC 2P reserves decreased by 99 Gb in the Rystad evaluation in 2023, non-OPEC reserves increased by 50 Gb. Laherrere has long suggested OPEC reserves were overstated by 300 Gb, when looking at long term the 2PCX estimate is the best resource estimate to use in my opinion. For Rystad’s recent estimate this is about 3100 Gb for World C plus C URR (cumulative production through Dec 2022 is roughly 1473 Gb based on EIA data).
Kengeo,
Have you looked at US reserve data?
See post below,
https://peakoilbarrel.com/us-oil-reserve-growth-2/
especially this spreadsheet
https://drive.google.com/file/d/0B4nArV09d398d2lUQ2RsQlZHQ00/view?usp=sharing
In chart below I show US reserves where no reserve growth is assumed and plot actual reserves. If we assume US 2P to 1P reserves have a similar ratio as UK North Sea at 1.7. Then US reserve growth from 1980 to 2005 (before tight oil production was significant) was about 63% over 25 years or about 2% per year on average from 1980 to 2005.
Reserve growth is real.
What would be the reason behind such large changes to KSA and Kuwait numbers? Is it reinterpretation of existing data or new data becoming available (or other)? The harder Rystad looks the less it seems able to find. At this stage of maturity having more contingent resources than 2P reserves seems bonkers. Contingent implies very low EROI to me, so increasing oil price wouldn’t really help because as energy prices rise so does the cost of development. With current trends in rates of discovery the “X” component is going to take somewhere between 250 and over 10000 years to find.
George, the reason is simple. Rystad is simply telling the truth. We have known for years that those OPEC reserve numbers were total bullshit. Look at the chart I posted below concerning OPEC and Non-OPEC reserves. It is laughable. As for Kuwait, the fact that their quoted reserve numbers are total bullshit is known and published knowledge. The below article is from 2006:
Kuwait Oil Reserves: Things Just Got Worse
NO, MAKE IT A LOT WORSE. Word just came out that Kuwait, long regarded as home to some of the world’s largest reserves of petroleum, may possess only half the amount of oil reserves that it officially has been stating for many years.
According to a restricted report issued by the authoritative industry newsletter Petroleum Intelligence Weekly (PIW), internal Kuwaiti records reveal that the nation’s oil reserves are far below the officially stated amount of about 99 billion barrels. Kuwait’s reported 99 billion barrels, if they were really there in the ground, would make up about 10% of world’s reported oil reserves.
The PIW report is based upon data circulating within the top echelons of the Kuwait Oil Co. (KOC). KOC is the upstream arm of state-owned Kuwait Petroleum Corp. KOC has primary responsibility for conducting exploration, drilling and production from Kuwait’s oil fields. The PIW report claims that Kuwait’s remaining proven and nonproven oil reserves total about 48 billion barrels, or 51 billion fewer barrels than previously advertised.
This is a very long article. Click on the blue headline to read it.
After this was reported, the citizens of Kuwait demanded a total survey of reserves. Kuwait did conduct the survey but refused to publish the results. When asked why they did not publish the results, they simply replied; “Why should we?”
Some more on Kuwait .
“June-to-date monthly #Kuwait crude exports are lowest on record. Week ending June 25 was also lowest week on record. Comes in context of rampup of new Al-Zour refinery. 2 of 3 units now running, with the final set to start by end of year, further cutting crude exports. “
That is probably true. It will be interesting to see if any OPEC members follow Angola and report more honest reserve numbers in this year’s Statistical Bulletin. However it is already late with no publication date scheduled so maybe it’s another data source we’ve lost like BOEM reserve estimates and Russian production. Rystad does bottom up analysis, now based on individual wells, so something significant must have changed either in its method or the data. It is of note that OPEC has high contingent reserves but very little undiscovered, while non-OPEC has both, though I’m not sure exactly what that implies.
The Chart below is Saudi Arabia’s production for their highest yearly production ever, 2022. I think they might be able to sustain 10,700,000 barrels per day for a few months but not much longer than that.
Here’s a look at future world production using Rystads new 1P and 2P values…
I assume world decline rate ranging from 1-2% for high estimates (using ~800 Gb oil remaining, which brings the URR to ~2300), a decline rate of 3% for 2P (most likely) of 500 Gb (URR of 2000), and 1P (producing reserves) of 285 Gb (URR of ~1750).
Production is cut in half by following dates:
1P half by 2033
2P half by 2044
2P+ half by 2055
Looking forward to Dennis’ analysis, as always…
Comparison of Kengeo’s and My best guess, I think Ron’s best guess for 2028 may be 75 Mb/d, though he has not confirmed this.
World less US is declining approx. 1 mb/d, since ~2016 peak, my best guess above takes that decline into consideration but may actually underestimate the US decline, peak shale production is still ~3-4 years ago and there are no signs it will rebound. More likely we can expect steep shale declines of at least 10-20%, here’s simple math assuming shale declines at 15%:
US declines ~1.1 mb/d annually, rest of world declines 1 mb/d annually.
2023 – 78.9
2024 – 76.8
2025 – 74.7
2026 – 72.6
2025 – 70.5
2026 – 68.4
2027 – 66.3
2028 – 64.2
This generally matches a scenario of higher than 1P, but lower than 2P estimates.
Yes, I may have posted that, Dennis. But I am not wedded to those numbers. My only contention is that 2029 numbers will not only be lower than the peak in 2018 but lower than they were in 2022. That I am adamant about.
Ron – My best guess is between 68-78 mb/d by 2028 (your guess of 75 seems on the money), this aligns well with Rystad’s 2P reserves remaining just published of 500 Gb. But even if you are feeling super optimistic and want to use 2PC (1283 Gb) it will do you no good as far as a future peak is concerned (best case is down several mb/d over next several years – then steeper delcline):
But it would be nice since it gives a 30-40 year buffer of lower production…
2PCX is likely the right number to use. Assuming peak must occur at 50% of URR is unlikely to be correct.
Dennis,
Agreed, the assumption that peak occurs at 50% URR seem highly unlikely to me too.
Kengeo,
Have you revised your best guess again? Why do you believe a polynomial fit to data tells us anything at all?
Dennis – Future production decline based on three scenarios:
URR = ~1750, 2000, and 2300
decline rates of 6%, 3%, and 2%, respectively.
These obviously don’t take any type of shark-fin situations into account (either from geo-political, economic, or physical geology perspectives).
I don’t disagree with the fact that there may be non-recoverable resources (non-commercial for one reason or another)…but looks like they will not come to the rescue soon enough…
Kengeo,
Using the HL analysis that Laherrere prefers for conventional C plus C (or non-continuous C plus C as the USGS likes to call it) gives an estimate of 2500 Gb, that will likely be low because there will ne both discoveries and reserve growth over time. That is the reason this estimate has increased from 1800 Gb in 1998 to 2500 Gb in 2023, to think that reserve growth has ended or there will be no new discoveries seems incorrect to me. I use 2800 Gb for conventional C plus C, the new estimate by Rystad does not change my analysis. In fact their estimate for 2PCX plus cumulative output is close to 3100 Gb, slightly higher than my recent estimate of 3000 Gb assuming oil prices remain high. I believe lack of demand for oil will lead to falling oil prices after 2033 or so, this reduces the URR of my best guess scenario to about 2640 Gb.
Dennis – Here’s another look, even if you use 2PC, we are still post-peak…
Low and behold, using 2PC, a peak is reached ~2019.
2P+ hubbert peak is reached in 2012.
1P is a much older peak, way back in 2003.
So what if we remove the US from the equation? After all the double peak for US makes it complicated.
US produced 117 Gb between 1920 and 2023. So if we remove US from the equation,
Then World less US becomes
1300 Gb produced versus
1P reserves of 244
2P reserves of 460
2PC reserves of 1,161
2PCX reserves of 1,432
Excluding the US, best case scenario (2PCX) is that World less US peaks in 2-3 years.
But more likely, world less US has already peaked.
Cumulative world production less US in 2016 is ~1,100 Gb (which gives a URR -less US of ~2,200 Gb).
If we add US back into the equation
1P is ~150 + 2,200 = 2,350 Gb
2P is ~165 + 2,200 = 2,365 Gb
2PC is ~230 + 2,200 = 2,430 Gb
2PCX is ~300 + 2,200 = 2,500 Gb
So we can expect the URR to fall somewhere around 2,400 Gb.
Therefore, the world peak was ~2013 +/- 1-2 years.
Welcome to 10 years post-peak oil production…
Removing US from the world EIA data (annual). We do see that a peak was reached in 2016.
Dennis –
What value do you use for remaining US reserves?
My guess is that you are using ~300 Gb for remaining US? Or maybe you overestimated World less US?
Note for US:
1P is 41 Gb (peak would have been 2013)
2P is 55 Gb (peak would have been 2015)
2PC is 120 Gb (peak would be now, ~2023)
2PCX is 190 Gb (peak would be 2030)
2PCX 300 Gb (peak would be ~2040)
I only focus on World conventional US tight and Canadian oil sands. Don’t have info on every nation.
Dennis – Got it, for combined world crude conventional plus unconventional I get a decline rate for next several years at 3%, by 2030 it levels to ~2.5%…total world production will be below 70 mb/d by 2028…
I guess Mr. Carlson got it right back in 2011:
World Oil Production Via Hubbert Linearization of Production and Normalizations of Production
(W. B. Carlson
Pages 162-168 | Received 03 Jun 2011, Accepted 01 Jul 2011, Published online: 19 Nov 2011)
“The Hubbert linearization and normalizations for the rate of change of production have been used to depict the trends of oil production via the logistic and Gompertz models. Estimated cumulative production based upon the Hubbert linearization of the oil history indicates a total ultimately recoverable resource (URR) for all liquids of 2.6 terabarrels (Tb). The Gompertz URR is projected to be near 4 Tb for all liquids including non-traditional sources. The normalization of the change of rate of oil production to the rate of production shows a peak potential of 95 million barrels production per day based on the projected URR of 2.6 Tb. The United States Geological Survey estimate of 2.5 Tb URR most closely approximates the projected 2.6 Tb URR.”
Random polynomials fit to data tell us very little. Your North America prediction will be wrong. Laherrere underestimates tight oil for US by a factor of 2.
Dennis – See below with Laherrere’s 18% decline rate for LTO…it matches thru ~2030, not sure after that…
World Proven Crude Oil Reserves
Cumulative Production versus net additions
Things are looking pretty dire if we are willing to take OPEC’s word for it. 🤣
Took awhile to find this, a 9 year old peak oil video, and it had a moment of comedy gold, a belly laugher IMO.
Context on reserves. Start: https://www.youtube.com/watch?v=7qGM9ypR-UI&t=1413s
Comedic moment on KSA: https://www.youtube.com/watch?v=7qGM9ypR-UI&t=1520s. It’s the final seconds of this segment that lives rent free in my mind.
The Permian Basin Is Depleting Faster Than We Thought 06/ 30/ 2023
The most crucial development in global oil markets is depletion in the Permian basin. We first warned about this in 2018, predicting the Permian would peak in 2025. In retrospect, our analysis was too conservative. We now believe the basin could peak within the next twelve months. The implications will be as profound as when United States oil production peaked in 1970, starting a chain of events ultimately sending prices up five-fold over ten years. If we are correct, this could not come at a worse time for oil markets: inventories are tight, production in the rest of the world is declining, and investors are incredibly complacent.
Whenever we make long-term thematic predictions, we construct a road map of things we should expect to see. Since price is rarely a good proxy for fundamentals, we need hard data that confirms we are going down the right path, even during the inevitable periods when the oil price is moving against us. Based upon our original work back in 2018, we concluded the Permian would roll over once operators drilled most of their best Tier 1 locations. Before peaking, per-well productivity would fall as operators drilled lower-quality inventory. This is what has happened. For the first time, productivity per lateral foot registered a 6% year-onyear decline in the Permian. According to our models, this proves the industry has drilled its best wells; basin-wide production decline is likely not far behind. With the Eagle Ford and Bakken unable to grow over the last eighteen months, once the Permian rolls over, the shale revolution will shift from growth to decline, and Hubbert’s Peak will reemerge with a vengeance.
The past decade has indeed been remarkable for global oil markets. Operators first succeeded in developing natural gas shales before adapting the techniques to the oil shales starting with the Bakken in North Dakota. The Eagle Ford was developed next, and then finally, the largest of all, the Permian, with its stacked pay potential, started its development in 2012. The results were without precedent. After having declined by 50% over forty years, the US abruptly reversed course to become the largest oil producer in the world. Shale oil production went from zero to 10 m b/d, more significant than Saudi Arabia.
This is a really long article. I have only posted the first three paragraphs. But the banner says it all. The Permian is depleting much faster than we thought.
Ron
I have a full review of the Permian in the next US post that takes info from another source to add further evidence that the G & R report
Looking forward to it, Ovi. Thanks.
Excellent article. I will post the link for people who are in denegation of reality. Thank you.
Thanks Ron,
Excellent piece.
US April Production is down 102 kb/d
Full report late Monday.
Cannot post chart.
The EIA’s Petroleum Supply Monthly is just out with US C+C production data for April 2023. Below is a chart comparing the data with the Monthly Energy Review and the STEO. As expected, the STEO was much closer than the Energy Review.
US C+C production for April was 12,615,000 barrels per day, down from 12,717,000 bpd in March.
Gulf of Mexico ouput was down by 138 kb/d so US Onshore output was up by about 35 kb/d. Also March output revised up by 21 kb/d from last months PSM, the STEO had forecast 12640 kb/d. not bad only high by 25 kb/d (0.2% error).
Going, going gone .
Was not aware but Mike S also uses the same graph in his latest post ” Useless DUC’s ” .
https://www.oilystuffblog.com/forumstuff/forum-stuff/duc-s-are-now-just-noise?origin=notification
Fine tuning KSA . Interesting details .
Dennis – Above you mention Laherrere’s 2022 paper, cut and paste from it:
“We describe the different categories of oil and related liquid fuels, and show that public-domain by-country and global proved (1P) oil reserves data, such as from the EIA or BP Statistical Review, are very misleading and should not be used. Better data are oil consultancy proved-plus-probable (2P) reserves. These data are generally backdated, i.e. with later changes in a field’s estimated volume being attributed to the date of field discovery. Even some of these data, we suggest, need reduction by some 300 Gb for probable overstatement of Middle East OPEC reserves, and likewise by 100 Gb for overstatement of FSU reserves.”
So how can you possibly say that 2PCX is an appropriate value for estimating the remaining, I think this is your huge disconnect and why your estimates are overly optimistic. We’ll know soon enough but it’s worth pointing out that you are likely using the wrong URRs for your estimates…
I’m fine throwing out the 1P and only looking at 2P, and in doing so we can clearly see that the mid-point for 2P was long ago (URR of ~2000), meaning that globally speaking, peak was in ~2007/2008…
I’ll even be ok with sprinkling 500 Gb of low-grade tar sands and LTO to squeek out 2500 Gb URR…
But guess what? That still means the peak was in 2016!
URR of 3000 Gb? Doubt it, but if it were to be a reality then it simply means the peak is now!!!!
Dennis – Could you do me a favor and make a forecast using Laherrere’s assumptions that LTO will decline 18% annually while deepwater well decline 2.8% annually?
I’d be curious to see what that looks like, especially using your other assumptions…
(here’s my ballpark for LTO: 2025- 9 mb/d, 2027- 6 mb/d, 2029- 4 mb/d, 2031- 2.7 mb/d, 2033- 1.8 mb/d)
Thanks!
The important statement in Laherrere’s 2022 paper:
“Even some of these data, we suggest, need reduction by some 300 Gb for probable overstatement of Middle East OPEC reserves, and likewise by 100 Gb for overstatement of FSU reserves.”
The point many who tout “reserve growth” fails to understand is that national oil companies, that is, all oil companies not traded on a major stock exchange, have no reason to be conservative with their reserve estimates. Most such companies, in fact, overstate their reserves by a considerable amount. And as Laherrere points out, these overestimates must be corrected. When they do this, it’s called “Reserve Shrinkage”. 🤣
Agree, all estimates regardless of type have to start shrinking eventually…
Going to change my name:
“RESERVELOSSRULZ”
Kengeo,
When Laherrere talks about OPRC reserves needing to be reduced by 300, he is talking about reserves reported by the Statistical Review of World Energy which for conventional OPEC was about 952 Gb, taking off 300 Gb gets us to 652 Gb. That is pretty close to the Rystad 2PC estimate for OPEC. So we would want to look at 2PC estimates at minimum, but using 2PCX allows for discoveries and reserve growth. In addition, Laherrere’s analysis for conventional C plus C (total C plus C minus XH and LTO) gives 2500 Gb. Then add in XH plus LTO, plus likely discoveries and reserve growth and we get to 3250 Gb in my view as a best guess for World URR. Note also the USGS World Assessment from 2000 for conventional oil gives a URR of 3000 Gb for conventional oil. The basis for my 2800 Gb estimate for conventional oil is the 2500 Gb HL estimate and the USGS estimate and I round to the nearest 100 Gb to get 2800 Gb. The estimate is conservative as there are likely to be discoveries and reserve growth. In addition the tight oil URR estimate of 72 Gb and extra heavy oil URR estimate of only 96 Gb are very conservative estimates, my model also has a URR for conventional of only 2500 Gb. The difference is that I do not assume the peak must occur at a cumulative production of 50%. In fact my conventional model peaks in 2016 at cumulative output of 1273 Gb which is 51% of the conventional URR of 2474 Gb. For unconventional output the URR is 168 Gb and my model for unconventional peaks at cumualative output of 82 Gb in 2029 at 44% of URR. Note that the 2016 conventional peak has already occurred. Any assumuption that output must follow a Hubbert curve is disproven by historical output, the future will be no different.
Mistake above, 82/168 Gb for unconventional is 49% for cumulative output/URR in 2029, not the 44% I stated.
The Rystad estimates correlate with Laherrere’s estimates for reserves, though the 2PC estimate seems to match Laherrere’s 2P estimate from August 2018 for OPEC.
Here’s the 4th order poly plotted with ~18% LTO decline…it’s not very far off of Laherrere’s 18% annual LTO decline rate…maybe you are underestimating the decline rates for shale wells?
Kengeo,
Laherrere is wrong on LTO. His URR for US tight oil is too low by a factor of 2, at least.
Here is my LTO model from 2031 to 2040
9.28, 8.97, 8.14, 6.59, 4.82, 3.65, 2.87, 2.30, 1.85, 1.48
The average decline rate is 22% per year over the 2031 to 2040 period. Over the shorter 2033 to 2040 period the average annual rate of decline is 25% per year. The model assumes a small decrease in Permian completions to 450 from 500 and held steady until Feb 2029 and declining,other tight oil plays are assumed to have a steady completion rate until about 2030 and then decreasing completions. The model is quite conservative with a 72 Gb URR about 60% of the tight oil URR used by the EIA in its last Annual Energy Outlook (about 120 Gb).
You really do like those random polynomials.
Here is a really bad model for tight oil using a 4th order polynomial. It contradicts what oil company CEOs are saying (peak Permian output in 2029 or 2030) and does not account for Williston basin output going back to 1955.
Just to be clear, this model is pure nonsense.
These guys claim to use machine learning in their analysis.
https://blog.gorozen.com/blog/the-permian-basin
“The Permian Basin Is Depleting Faster Than We Thought”
06/ 30/ 2023 (excerpt from their Q1 2023 commentary)
Paul,
Yes they use Novi Labs for their data, which bought shaleprofile.com from Enno Peters.
According to Globaldata, Ghawar produced 3.04 million b/d in 2022.
https://www.offshore-technology.com/data-insights/top-ten-crude-oil-producing-fields-in-middle-east/
Quark, this is fantastic! Thanks for the link. I don’t know how you found this but this is a bombshell. Here is the link again. Everybody must look at this.
Top ten crude oil-producing fields in Middle East
The total crude oil and condensate production of Middle East in 2022 increased by 7.10% when compared to 2021. The largest oil producing countries in Middle East are Saudi Arabia, Iraq, and the UAE. Through to 2030, annual crude oil and condensate production is forecasted to increase by a CAGR of 0.64%. GlobalData uses proprietary data and analytics to provide a complete picture of the global oil & gas fields segment.
Total production from these ten fields was 12.12 mmbpd in 2022.
The ten largest Middle East Fields by order of production in 2022.
site says ‘percent depleted: total recoverable crude oil and condensate reserves’ . in my view that is 3P… all oil in ground… assumes unknown methods recovery and all economical. If 1P is conventional, 2P is horizonatal unconventional, and 3P is unknown methods…and each is 30%… then a quick review of Gehwar would not be 66.59 of 3P but XXX of 2P…or YYY reserves w/o new technology?
Phew , running on empty .
Isn’t Manifa the high vanadium oil that is corrosive on the pipelines and needs continued maintainers ? Good luck with that .
If Ghawar produced 5000 kb/d in 2004 and 3040 kb/d in 2022 and the peak was 2004 (as Matt Simmons claimed), then the average annual decline rate would be 2.73% per year for Ghawar. I understand thet there are several fields within Ghawar, but we do not have the data on these individual fields.
The Biden admin will not stop fabricating data and draining the SPR to push the price of oil lower (zero hedge)
Quote Tweet
Javier Blas
@JavierBlas
·
23h
OIL MARKET: As I had expected (again), @EIAgov has **massively** revised US demand for April upward based on monthly data (from the early estimate based on weekly).
Total US oil demand pegged at 20.446m b/d in April, up from initial estimate of 19.671m b/d (+775,000 b/d) #OOTT
and
https://www.rigzone.com/news/wire/biden_government_bins_proposed_phasedown_of_fossil_fuel_output-30-jun-2023-173226-article/
I pity the fools who take/took this guy seriously
Hey Ron, Dennis,
On the Rystad document, how come Venezuela has such low reserves? Too speculative?
Thanks for your posts, as always, it’s been a while since i last posted here…. several years in fact 🙂
Skeboo,
It may have to do with the politicaal situation in Venezuela, much of the resource in the Orinoco may remain in the ground.
Putting my neck on the line. This is my “prediction”, a possible second peak in the error margin ~ 2025. My mean decline rate for world C+C is -3.5%, I did this via a random number generator with a range of possible growth between 1.25% and a decline of -4.75%. Since it’s a random number generator everytime you run the program it will give you a different curve with a different URR. And you can obviously tweak the growth and decline rates to your liking.
Iron Mike,
Interesting. Not clear we would see an equal probability of 4.25% decline with 1.25 % increase. Have you looked at historical increase vs decline rates to set your probabilities for increase vs decline? One way to do this would be to create some Hubbert curves and see what the probability for rates of increase and decline would be over 1935 to 2235, maybe use 2500 Gb, 3000 Gb and 3500 Gb URR Hubbert models to establish your probability distribution and then draw randomly from that.
In any case nice work. I think it likely there will be another peak, probably 7 in 10 odds. Whether it is 2025 or 2028 or some other year? Much lower odds for any single year. I would say 50/50 odds it will be before or after June 30, 2028.
Dennis,
I’ll have a look at your suggestion to improve the prediction regarding probability distributions of growth and decline rates.
I personally feel the plateau might be longer than we think with a steeper decline on the other side of the plateau.
Iron Mike,
Could be, the longer the plateau, the steeper the decline will be when it ends. Hickory has proposed a plateau scenario that seems pretty reasonable. My shock Model has average output of 81.7 Mb/d from 2015 to 2033, with most points in between within 2 Mb/d of the average (exceptions are 2020 and 2021). The average output over the 2015-2033 period for Hubbert Model is 80.2 Mb/d with a peak in 2024 at 82 Mb/d.
Dennis,
So a plateau of about 18 years within a 2Mb/d range. Sounds plausible to me. What’s your average decline rate/year after the plateau ?
Iron Mike,
For my Shock Model from 2034 to 2060 the average annual decline rate is 2.62% per year on average. Chart below has natural log of output in Mb/d for my best guess Shock Model from 2034 to 2060.
If world C C stays up on this plateau til 2033
then this ten year period gives the world a big chance to avoid a rapid oil crash scenario, with electric vehicles for light transport becoming pervasive by then.
At 2033 the majority of the 90% from peak residual oil production (or 80% if you are more pessimistic) will be used for purposes that are harder to replace than light transport.
It would be interesting to see your chart Iron Mike in an up close version out to 2040…down about 20% down by then?
Does the remaining oil being sold on the market go to the highest bidder, or to economic and military partners?
Hickory,
Iron Mike’s scenario has annual output falling from 30 Gb/y to 25 Gb/y from 2025 to 2040, a total decrease of about 17%, an average annual decrease of about 1.2% per year.
Hickory,
Dennis is right with regards to decline of my scenario out to 2040. If the other side of the plateau is steeper, your question becomes very interesting. One would assume the world would be chaotic if oil demand is still there. Military would get primary preference I’d assume.
Iron Mike –
1800 Gb remaining?
That seem extremely high!
So for every barrel of oil on the books you think there are 5 hiding in the dark waiting to be found?
Dennis used 2800 Gb which is likely too high, not sure how you arrived at your numbers…
I think you are all missing the point, there is no future peak coming it already happened 4-5 years ago at least !
Kengeo,
Dennis and I have similar thinking in a URR of between 3000-3500Gb. I think there is potential for reserve underestimation and TRR being produced regardless of ERR.
I honestly think there is a lot more oil in the earths crust probably >5000Gb. But 90%plus of it won’t be produced due complexity and economics. However more reserves will come online as places such as the arctic and greenland melt.
However again i will reiterate, alot of my prediction is pure speculation.
What is your estimate of URR ?
It’s slightly complicated due to different types.
But we can assume low, med, and hi cases
-Low: 1P remaining plus produced of ~1,300 thru 2018, so call it 1,600 as a very low case. Medium case is 200 Gb higher. For the high case, easiest to take the midpoint of 1300 Gb and multiply be 2. This yields 2,600 Gb, but 1P and 2P are so much lower that I think it’s too high. I think a more realistic URR is between 2,000 – 2,200.
Most major fields have been in decline for 10-20 years, I’m also fine using Hubert’s original estimate of peak in 2008. My guess is that yields a midpoint of ~1,150 or there abouts.
The production curve has three clear phases, growth, plateau, and decline. Based on past 20 years we know the growth phase ended long ago, no doubt about that. I would argue the plateau phase is ended now, 3-5% decline phase is underway, starts slow then picks up over next 1-2 years.
Kengeo,
This is what your scenario looks like on my program. That’s apocalyptic stuff if it comes to fruition lol
Dennis has pretty much same thing, he just starts decline 5-10 years later…
That’s right, and we know that’s possible based on the decline rates of individual shale wells, 20% is steep drop. We will know soon enough…12-18 months…
Iron Mike,
My Models don’t have decline rates that high for World output, note that the 2200 Gb URR estimate is ridiculous. For a reasonable URR (2600 Gb or greater, even 2600 Gb is likely lower than we will see, I have optimistically assumed demand for oil will be limited after 2035) the decline rate will be about 2.7% per year from 2034 to 2069.
I realize you are showing why such a scenario is absurd, but Kengeo will think, yeah we will see oil output decrease by 5% per year and Iron Mike agrees. You might want to clearly state you think that scenario looks absurd (if indeed that is what you believe).
Ken geo,
No I do not say decline will be 3 to 5 %, my scenario has decline at an average annual decline rate of 2.7% from 2034 to 2069 due to lack of demand for oil. Tight oil can drop steeply if oil prices fall, but it is only 9 Mb/d or roughly 11% of World output at its peak and a much lower percentage as it drops by 20% per year over a short period from 2034 to 2043, at which point it has fallen to only about 1% of World C plus C output.
Dennis,
Since i cannot predict the future if my life depended on it all scenarios are game. But yea i think it’s highly unlikely Kengeos scenarios will come to pass, due to the fact that it is essentially ‘end of the world as we know it’.
And in the plot i have the heading as Kengeo PO scenario, so it is specifically his.
Iron Mike,
Yes the future is unknown. In my view some scenarios have lower probability than others. The Kengeo scenario would be an F99 scenario, ie about a 99% probability (or more) that output will be higher than the forecast over the 2025 to 2100 period. Your original scenario is closer to an F50 scenario after 2024 with an equal probability output would be higher or lower. My scenario is a bit lower because I assume oil prices will fall after 2035, this depends on a transition to electric land transport which may or may not occur, without that assumption my scenario would be fairly similar to what you have.
Dennis,
I got the average growth rate (barring 10% growth & decline rate yoy data points) at 2.718% before the plateau. Essentially BAU years.
Which is what you have as your decline rate on the end of the plateau. Doesn’t sound like a reasonable assumption given you have ~18 years on the plateau, the decline rate might be higher than the average growth rate imo. Also in your scenario you assume electrification which will also imply a higher decline rate.
Iron Mike,
I assume the electrification takes time and note that there is a significant portion of oil use that is not land transport (water, and air transport, and farming) that will continue to consume oil. My models do not have decline rates as an input. They depend on discovery, the rate that reserves are developed and extraction rates. Possibl that all my assumptions about the future are wrong, I just guess based on history, I assume extraction rates fall due to electrification, possible they could fall faster than I have assumed. Not clear how quickly electrification will happen, it will take a couple of decades to replace the existing land transport fleet, assuming robo taxis never gain traction in the future. Lots of variables and I have made relatively conservative assumptions.
Iron Mike,
For 1930 to 1972 the growth rate in oil production was about 6.78% per year on average.
From 1973 to 2015 the growth rate was about 1.1% per year on average and from 2016 to 2034 the growth rate was 0.07% per year for data up to 2022 plus my scenario from 2023 to 2034. The decline rate from 2035 to 2070 is 2.7%, far higher in absolute terms than the 43 years from 1973 to 2015 (2.45 times higher). Note that the decline rate is higher from 2070 to 2095 for my scenario, about 6.8% per year. Just as the growth rate was not a single rate on the way up, I do not expect fixed exponential decline on the downslope. There are an infinite number of paths output might follow, mine is simply one. Personally I hope after 2040 demand declines by 7% per year, I just am not that much of an optimist. There is little reason to expect that supply of oil will be a constraint certainly in the near term. I can create steeper decline rates by assuming extraction rates decrease more quickly. No idea how quickly extraction rates might decrease in the future, it will depend on demand for oil.
Kengeo,
Iron Mike and I see World C+C rising from 76 Mb/d to about 82 Mb/d in recent months, the decline in 2019 and 2020 has a clear explanation, so far there is very little evidence for the decline that you anticipate for World C plus C output. OPEC is cutting output because there is too much supply in relation to demand (or that is what the OPEC analysis in MOMR points to.) At some point oil prices may rise as supply becomes tight and output may rise in response, certainly their is OPEC capacity to raise supply to some degree as oil prices rise and there is increasing output from South America, Canada (if wildfires subside), and the US as rising prices may lead to increased rates of development in tight oil plays.
I will believe the decline you forecast when I see it over a 12 month period.
Dennis – Your chart above is URR of >4 Tb, you do realize that right???
You keep making absurd statements without any basis, “peak doesn’t occur at the midpoint”…of course it does!
“Weekly production data shouldn’t be used”, what is the basis?
Then you project the Covid rebound as if it’s actual world production growth…
At this point it seems like you are just waiving your arms around…
1P global reserves are 285 Gb, that’s at best 10 year supply, 2P is 500 meaning there are 215 Gb of probable reserves (recoverable >50% but <90%).
Ken geo,
What chart has URR more than 4000 Gb, all my charts are 2600 Gb or less. The Conventional Models have URRs of 2437 Gb for the Shock Model and 2467 Gb for the Hubbert Model. The Unconventional Models have URRs of 168 Gb for Shock Model and 154 Gb for the Hubbert Model. The World C plus C Models add the conventional and unconventional oil models with Shock Model URR=2605 Gb and Hubbert Model URR=2621 Gb.
Where do you get 4000 Gb?
I showed a chart with weekly data. Maybe look at EIA data for April 2023
https://www.eia.gov/dnav/pet/hist/LeafHandler.ashx?n=PET&s=WCRFPUS2&f=4
4 week average for April 28, 2023 is 12275 kb/d at link above
https://www.eia.gov/dnav/pet/pet_crd_crpdn_adc_mbblpd_m.htm
At link above for monthly data April output is 12615 kb/d. The difference is 340 kb/d, about 2.8% too low.
For March 2023 the monthly estimate is 12717 kb/d and the 4 week average for March 31 and also for March 24 was 12225, this was off by 492 kb/d or about 4%.
Chart below has World Cumulative output for the Shock and Hubbert Models Presented URR is 2600 Gb. Can you point me to the 4000 Gb scenarios you are blathering about?
Seems someone is making stuff up while waving his arms and it is not me.
Why do you assume the peak must occur at the midpoint, there are plenty of real World examples where this is not the case. Take World Conventional output which peaked in 2016 at 1273 Gb of cumulative output, if we take conventional URR as 2500 Gb as estimated by Laherrere this would be 51% of conventional URR. My HL estimate for conventional C plus C is a bit lower at 2473 Gb using HL so cumulative output at the peak is at 51.5% of URR.
For my Hubbert Model of unconventional oil the URR is 154 Gb, but my Shock model has slightly higher URR at 168 Gb, with cumulative output at the peak at 82 Gb or about 49% of URR.
A Hubbert model does indeed peak at 50%, the point you seem to miss is that real world output rarely follows a Hubbert curve, just look at past data to confirm.
You also don’t seem to understand the way reserve estimates work. 2P reserves are proved plus probable reserves, this number is a best guess estimate which means there is an equal probability (50/50 odds) that reserves are higher or lower than this estimate.
The best estimate of remaining resources is the 2PCX estimate. To think there will be no reserve growth or discoveries in the future strikes me as absurd.
In any case we will watch the data and will see who is correct in the future.
The covid rebound has seen World output grow at a very fast rate, about 2270 kb/d over the 2020 to 2022 period, I don’t project that rate of increase in the future, I project an increase of about 500 kb/d on average from 2022 to 2028, a rate that is about 4.5 times lower than during the covid rebound.
This comment will turn 10 years old next year…now think about that!
“POLITICAL ECONOMIST
06/23/2014 at 11:34 pm
Dennis suggested I do HL to the world oil, natural gas, and coal as a whole. For oil, it works. HL analysis for 1995-2013 indicates the world’s ultimately recoverable oil resources to be 388 billion tons. Cumulative production up to 2013 was 176 billion tons. The implied world oil production peak happens in 2018“
Kengeo,
388 billion tons is 2844 Gb for URR, note that Laherrere et al recently found the the URR by doing an HL on 2008 to 2019 data indicates a URR for World C plus C of 3500 Gb. Twelve Years ago using HL gave a result of about 2500 Gb. That is the problem with using a Hubbert Linearization, it does not give reliable results.
Then why do you use 2800 Gb???????
Kengeo,
2800 Gb is my resource estimate for conventional oil only, for unconventional it would be about 300 Gb for a total of 3100 Gb, and that’s a conservative estimate, it could easily be 3300 Gb using USGS conventional estimate of 3000 Gb plus 300 Gb of unconventional, even a 500 Gb unconventional estimate is reasonable in a high oil price scenario. There is likely plenty of oil at the average oil price level of 2011 to 2014 (around $120/b in 2022 US$). My expectation is that demand for oil will wane after 2035 as the World transitions to EVs and other forms of electric land transport (trains, public transport, EVs, etc). Oil prices fall and a lot of the oil resource remains in the ground because oil prices are too low for it to be produced profitably.
In short, my oil resource estimate(TRR) is about 3000 Gb at minimum, and probably 3100 Gb would be my best guess in a medium oil price scenario ($80/bo in 2022$ until 2050).
Why do my scenarios have a 2640 Gb URR when resources may be as large as 3100 Gb?
I expect oil prices will fall after 2036 due to lack of demand for oil.
Oil price scenario below for Brent oil.
Kengeo,
I use 2800 Gb because what I see is that HL gave an estimate of 1800 Gb in 1998, about 2000 Gb in 2005, about 2300 Gb in 2008 and about 2500 Gb in 2012, do you see the trend? URR estimates tend to rise over time. Then we combine this fact with a USGS estimate for conventional oil of 3000 Gb in 2000 and I took the average of 2500 Gb and 3000 Gb (2750 Gb) and rounded up to 2800 Gb to account for the tendency of HL to underestimate which gives a very conservative conventional URR estimate for the World of 2800 Gb. Then add unconventional resources of at least 500 Gb and we get about 3300 Gb for World C plus C. I have later revised the unconventional URR estimate lower by 330 Gb due to lack of demand in the future and the conventional URR is also revised lower by 370 Gb for the same reason, about 700 Gb of C plus C TRR is never exploited due to lack of demand for oil after 2035 in my scenario.
Dennis – Bottom line, regardless of where you pin the tail on the donkey (peak in production), we can all agree that the cumulative production midpoint was reached several years ago (which also corresponds with the peak!)…
It sounds like you need to add some more Gb to your models, URR!
“ D COYNE
06/22/2023 at 9:35 am
Kengeo,
Note the URR they use for conventional oil is 3000 Gb, about 200 Gb more than I use in my model.”
Kengeo,
Cumulative production midpoint for conventional and unconventional do not coincide. For a conventional model with a URR of 2500 Gb the midpoint was 2015, the peak in conventional output was one year later in 2016. For unconventional oil if we use a Hubbert model with a URR of 154 Gb, the peak occurs in 2029 for both the Hubbert Model and the Shock Model. When the two models (unconventional and conventional) are combined for both the Hubbert and Shock Models the peaks are 2028 for the Shock model and 2024 for the Hubbert Model at 1534 Gb for cumulative production for a Model with URR of 2627 Gb or at 58% of URR. For Shock Model the URR is 2605 Gb and peak occurs at 1655 Gb at 63.5% of URR. Peak does not necessarily occur at midpoint of URR for World C plus C due to different timing of conventional and unconventional oil cycles.
Assuming peak occurs at midpoint of URR is a very simplistic way of thinking, and wrong.
Dennis – Your estimates for ultimate remaining are only about 20-30% too high. I think you will realize this soon enough. If global production falls by 2 mb/d over next 12 months would that convince you? I would love for there to be 3, 4, or 5 Tb of oil …but unfortunately that doesn’t seem to be the case.
Kengeo,
It depends on why oil production falls. If we see oil production fall by 2 Mb/d in the next 12 months with average oil prices over $70/bo, then perhaps I would revise my estimate. Note that my URR estimate is 2640 Gb, a Hubbert analysis for World C plus C gives us an estimate of 3500 Gb (Laherrere et al 2022). Some might argue that my Oil Shock Model Scenario is 24% too low, rather than 25% too high. If my Scenario URR were reduced by 25% that would put World URR at 1980 Gb, about 43% lower than the HL estimate by Laherrere et al in 2022 (1980/3500=57%). That is not an estimate that is likely to be correct in my opinion. We would need to assume zero output from conventional oil, which would be at least 168 Gb too low, and in addition it is 520 Gb below the Laherrere et al, 2022 estimate for conventional oil of 2500 Gb.
In any case, time will reveal which estimates are better.
This is behind a paywall and is from June 2019…anyone have something more recent for Exxons decline rate estimates?
“Exxon’s Math Calls For Overall Global Oil Decline Rate of ~7%, A Very Bullish Argument For Post 2020 Oil Prices”
Dennis – Maybe you could model 3 decline rate scenarios, 3, 5, and 7….if using 3 Tb then start the decline 2025 plus or minus…
Kengeo,
A 7% decline rate assumes all investment in new oil production ceases, not a scenario worth wasting time on. Decline for World output will be 2 to 3%, but won’t start at that rate until after 2034.
Question, sorry if I missed this Dennis; if 7% decline represents zero investment, what do you feel the investment range will need to be to achieve 2 or 3% decline. Do you feel there are any probable economic scenarios that might decrease the availability of that necessary amount?
Survivalist,
I assume the World adapts to constraints, as population peaks and declines and the World starts to take climate change seriously we may see less fossil fuel resources developed and lower extraction rates, at some point demand for fossil fuel might drop steeply and supply will drop as well. I cannot anticipate when that occurs. The 2 to 3 % decline rate assumes the transition to non-fossil fuel happens relatively slowly over the 2023 to 2100 period. I assume prices will adjust so that the cheapest fossil fuel resources (for oil this would be onshore and middle east resources) can be extracted.
Libyan civil war may be kicking off again. Last time about a million bpd was lost for several months
“Libya tensions rise amid oil threats, drone strike
Following Oun’s comments, the GNU on June 29 claimed to have carried out a drone strike on a site used by Russian mercenaries, the Wagner Group.
…
Hammad said there were plans for a “judicial guard” to halt exports and seize $16 billion in revenue.”
https://www.energyvoice.com/oilandgas/africa/515812/libya-tensions-rise-amid-oil-threats-drone-strike/
Libya’s oil exports face threat of fresh blockade
Three-quarters of Libya’s crude could be shut in, as the country’s eastern leaders accuse their western counterparts of corruption, write Aydin Calik and Kuganiga Kuganeswaran
London, 30 June (Argus) — The stability of Libya’s crude production is again under threat as key political actors across the country’s east-west divide tussle for control of oil revenue.
The eastern-based Government of National Stability (GNS) — which is supported by the Libyan legislature — has threatened to stop the flow of oil and gas, including exports, unless it is allowed to appoint an official with oversight of state-owned oil firm NOC’s finances. Around three-quarters of Libya’s 1.2mn b/d of crude production is located in the east, alongside five of its nine oil export terminals. Exports have been running steadily at around 1mn b/d since July 2022, when the last oil blockade — orchestrated by the eastern-based head of the Libyan National Army Khalifa Haftar — was lifted.
Russian mercenary group Wagner has supported Haftar militarily since 2018, with a presence around key east Libyan oil infrastructure. The group has an estimated 1,000 members in the country. To what extent Wagner’s aborted mutiny in Russia on 24 June will affect the group’s foreign operations is uncertain.
https://www.argusmedia.com/pages/NewsBody.aspx?frame=yes&id=2464884&menu=yes<b
More indication that low EROI projects wun’t get done, or will take a long time, or with much reduced scope:
An oil and gas company has abandoned a proposed North Sea development, blaming “unprecedented challenges” across the sector.
Parkmead Group highlighted rising costs, skills shortages, the windfall tax, a hostile political climate and ageing infrastructure as among the reasons for ditching the Perth project. It said it would take a £33 million non-cash impairment charge as a result.
Aging infrastructure, volatile prices, supply chain issues and sector labour shortages are only going to get worse as societal rot increases and OECD economies break down. Add this project to Wisting, Bay du Nord, Campo, Sparta, SW Bonga, a couple of FPSOs in Brazil, offshore Suriname, a couple of African LNG plants with long delays or semi-permanent suspensions, all citing similar reasons.
US and Permian update around 4:00 pm today.
Thanks OVI looking forward to it.
Thanks for the heads up. I set a timer. Here it is hands down the best articles and comments section on the web.
color me shocked, shocked I say>>>
“[T]he hard truth is this: the energy transition isn’t. The numbers from the just-released Statistical Review of World Energy show, once again, that despite rapid growth in wind and solar, those two forms of energy are not even keeping pace with the growth in hydrocarbons. That’s true both globally and in the U.S.
[I]n absolute terms, hydrocarbon consumption grew by 110 exajoules, (EJ), while wind and solar grew by just 32 EJ. Thus, the growth in hydrocarbon use over that time frame was 3.4 times faster than what was seen in wind and solar.
And here’s the key point: hydrocarbons are prevailing despite staggering amounts of spending on wind and solar. According to a January report by Bloomberg New Energy Finance, some $6.7 trillion was spent on alt-energy globally between 2004 and 2022.”
https://robertbryce.substack.com/p/the-energy-transition-isnt
A new post updating US oil production has been posted.
https://peakoilbarrel.com/gom-drop-drops-us-april-oil-production/
A new Open Thread Non-Petroleum has been posted.
https://peakoilbarrel.com/open-thread-non-petroleum-july-3-2023/
I think some version of this story, along with some other major subplots, is why most of the people who come around here do so.