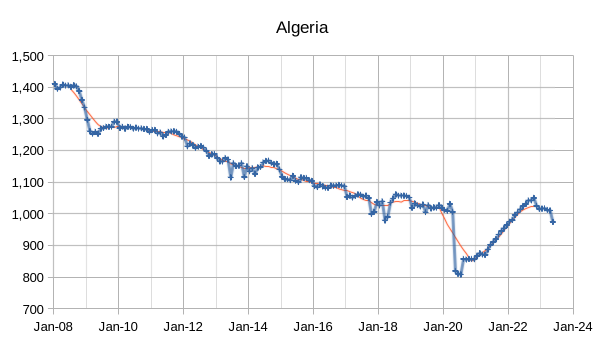
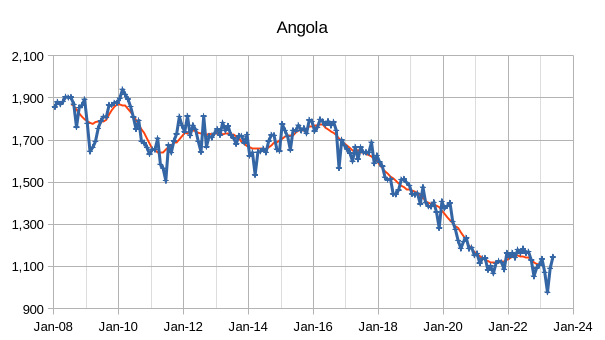
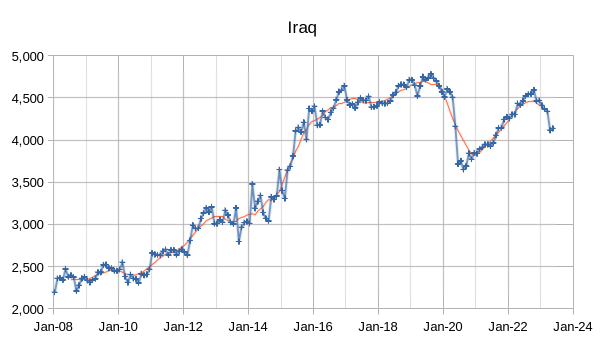
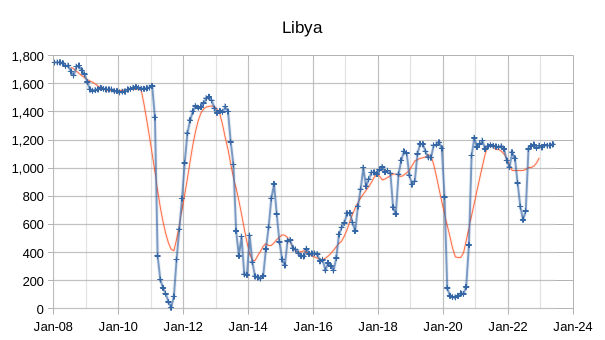
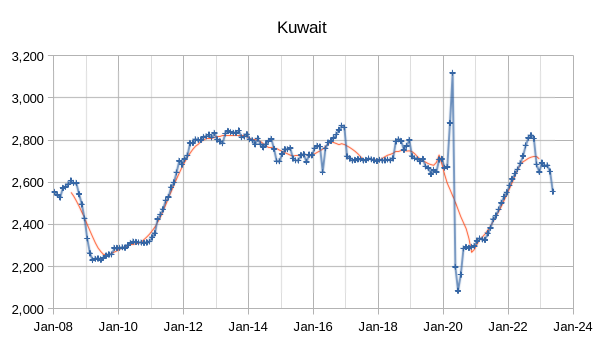
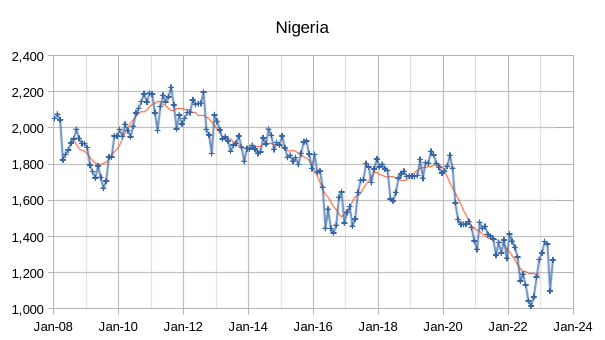
The OPEC Monthly Oil Market Report (MOMR) for June 2023 was published recently. The last month reported in most of the OPEC charts that follow is May 2023 and output reported for OPEC nations is crude oil output in thousands of barrels per day (kb/d). In many of the OPEC charts that follow the blue line with markers is monthly output and the thin red line is the centered twelve month average (CTMA) output.
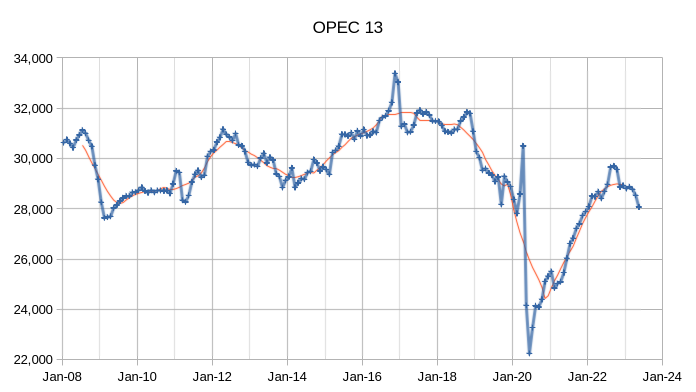
OPEC crude output was revised lower in April 2023 by 74 kb/d compared to last month’s report and March 2023 OPEC crude output was revised lower by 21 kb/d. When the World was at its CTMA peak for C+C output in 2018, OPEC crude output was about 31300 kb/d and by April 2023 OPEC crude output had fallen to roughly 3240 kb/d below that 2018 average level.
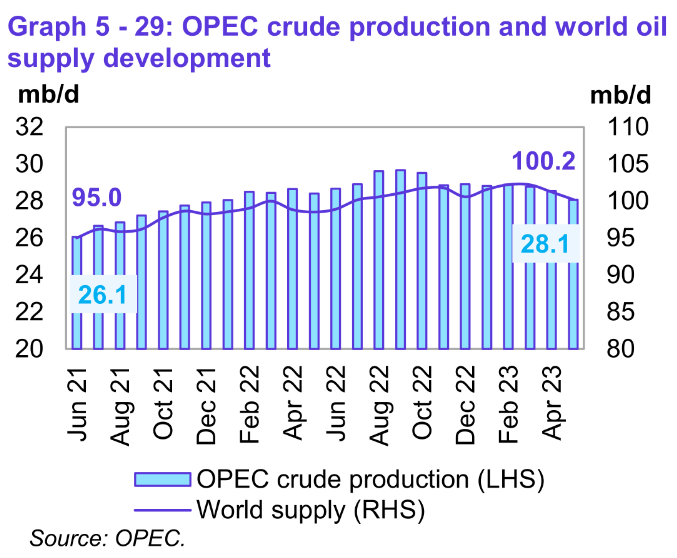
Preliminary data indicates that global liquids production in May decreased by 1.02 mb/d to average
100.2 mb/d compared with the previous month.
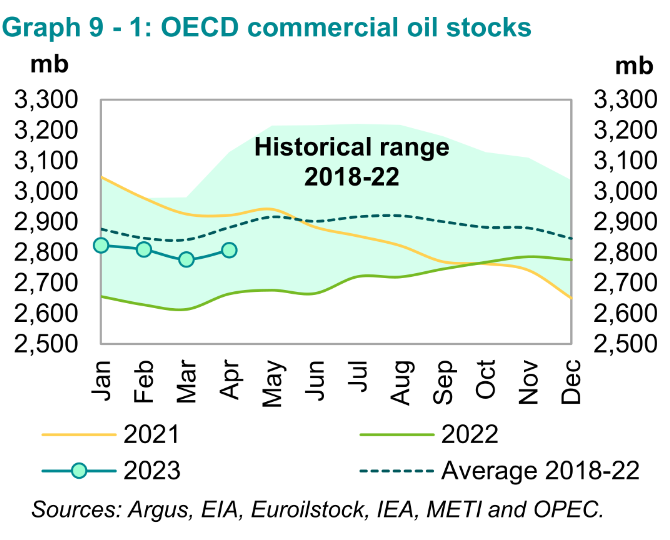
OECD stocks increased in April 2023 by 30.2 Mb and were 74 Mb below the 5 year average. Through April 2023 the World oil market looks fairly balanced with OECD stocks slowly rising. Looking at OPEC’s estimates for future supply and demand and considering recent OPEC quotas, it looks like the World Oil Market will be tight the second half of 2023, see figures 5 and 6 below.
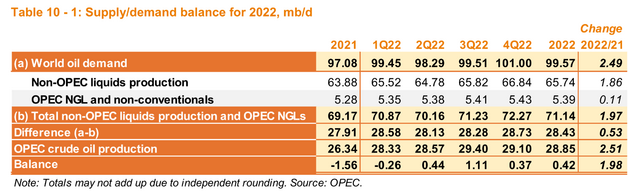
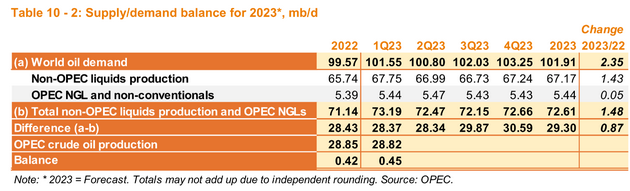
The call on OPEC for 2023 has risen by 40 kb from last month’s OPEC estimate due to a reduced estimate for non-OPEC liquids output plus OPEC NGL and non-conventional output and an increase in the estimate for oil demand in 2023. We have avoided a default on US Treasury Securities and assuming no major changes in the Ukrainian War or increased tensions between the US and China, we might avoid a severe recession. This rosy scenario also assumes that central bankers don’t overdo the fight against inflation, which could be incorrect. If OPEC continues with cuts as currently planned and if OPEC supply and demand estimates are roughly correct, oil prices should rise by the middle of 2023Q3 (only 8 weeks away).
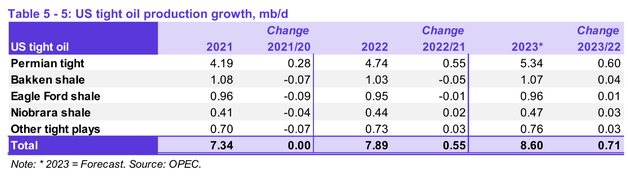
OPEC has increased its estimate for US tight oil in 2023 by 20 kb/d from last month. This breaks down to a 10 kb/d increase for the Permian basin compared to last month, a 20 kb/d increase in Bakken shale output from last month, and a 10 kb/d decrease in Eagle Ford output in 2023 compared to last month’s estimate. My estimate for the US tight oil increase in 2023 is 640 kb/d, about 70 kb/d less than OPEC’s estimate.
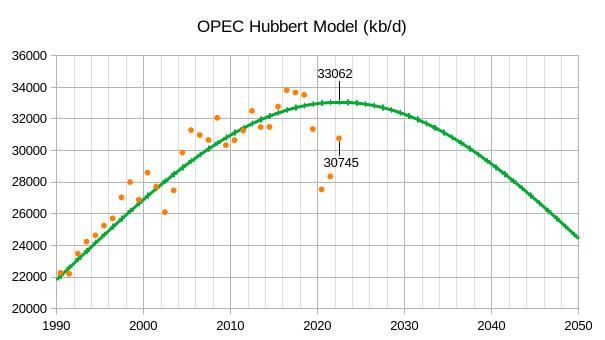
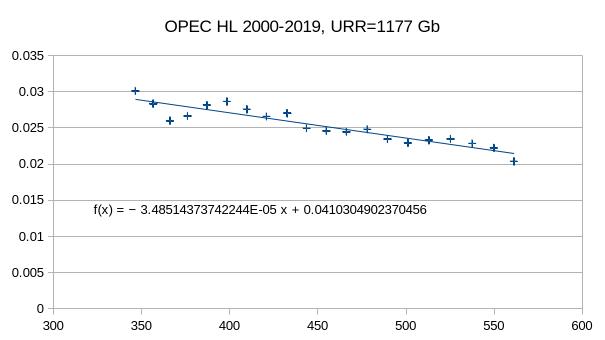
The Hubbert model above is based on a Hubbert linearization on OPEC data from 2000 to 2019, cumulative output through 2022 for the model match the data well through 2022 (model cumulative is 595 Gb at the end of 2022 vs 592 Gb for the data). The terminal decline rate for the model is about 4.1% per year, but the model does not reach this level of decline until 2146, the decline rate is zero in 2022 and gradually increases over time (1%/y in 2035, 2% in 2049, 3% in 2068, and 4% in 2129.) Hubbert linearization in chart below. For figure 9 below, the horizontal axis is cumulative output in Gb and the vertical axis is annual production divided by cumulative production. URR=-b/m for f(x)=mx+b on chart below.
230 responses to “OPEC Update, June 2023”
The OPEC Big 5, in May, was down 1,881,000 barrels per day from their post-pandemic high in September.
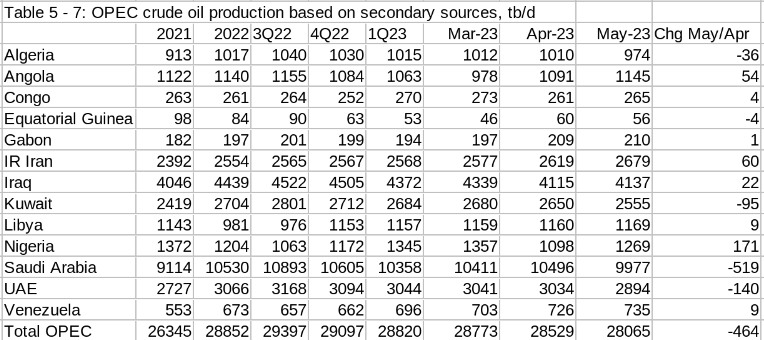
For OPEC 13 output is 1631 kb/d lower in May than the recent Sept 2022 peak of 29,696 kb/d.
The rest of OPEC, the Other 8, production was up 108,000 barrels per day in May. This was all Nigeria which was up 171,000 barrels per day. So, without Nigeria, the Other 8 was down 63,000 barrels per day in May.
Production stands where it would have been expected to be without the COVID-bump.
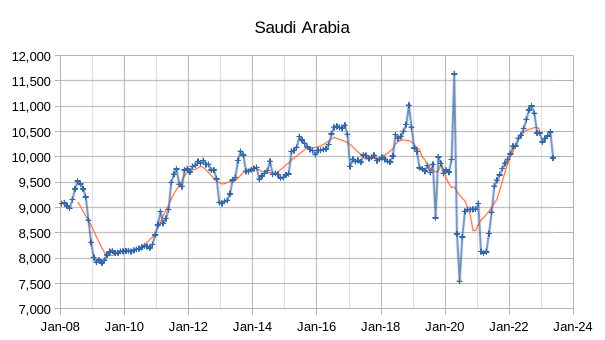
Saudi oil production forecast analysis.
According to my estimates, taking up old theoildrum publications updated with data from 2022, in 2031 the terminal decline of Arabia begins.
https://futurocienciaficcionymatrix.blogspot.com/2023/06/arabia-saudi-analisis-de-produccion-y.html
Thanks for the update Dennis.
Schinzy,
You’re welcome.
Thanks for the post and update Dennis. Barring a recession it seems there is going to be a supply demand imbalance by 3rd quarter of this year. Which might push up oil prices.
Iron Mike,
My pleasure. I agree, looks like oil prices may be higher in second half of 2023.
If we aren’t in recession already then a fuel price spike would likely push ys into one.
Legacy shale requires 10k bbl/d of fresh production every single day just to make up for its natural decline.
2022 was the last hurrah fueled by higher prices and complete drawdown of DUC’s. 2023 declines will be hard and fast 😈
60% of those are dead DUC’s (spud in 2019 or earlier) and shale generally requires a working stock of ~2-3 DUC’s per active rig (usually can’t frack wells when pad drilling and there’s a lag between drill and completions either way).
The dead DUC meme is likely wrong, notice that the DUC count seems to be approaching level in early 2023, it could be that the completin process has become more efficient and that there are plenty of frack spreads to service existing activity so less need for a big DUC inventory. DUC count for US tight oil and shale gas plays from DPR.
The ducks are lined in a row regarding the Permian by Mr Shellman .
https://www.oilystuffblog.com/single-post/what-s-declining-what-s-not-in-the-permian?postId=c081b387-6d62-429a-aa2a-d61842d9ae6c&utm_campaign=84625de6-86a8-4236-a535-f252736ecaaa&utm_source=so&utm_medium=mail&utm_content=f8646a23-57a4-4260-8a92-ae38ad32e760&cid=fa335351-37bb-44a6-9899-f8c34b4a0f81
that post should be pinned at the top somewhere on POB since its one of the better “the reported death of peak oil has been greatly exaggerated” explainers we’ve seen in a while. I’m assuming there is nothing in there that D. Coyne doesn’t already know – it’s interesting that Mike and Dennis still disagree on LTO production over the next two years.
Twocats,
Mike rarely agrees with me, but he knows infinitely more than me about the oil business. I expect oil and natural gas prices will probably rise in late 2023 and beyond (up to about 2030).
Mike maight think prices will remain where they are or decrease. I also think that as water and water disposal costs increase, that more water will be recycled and water and water disposal may become less of a constraint. Also note that recently shallow sand suggested that perhaps tight oil output might not see a big drop in the Permian for the next 7 years. LTO Survivor thought the 350 well scenario shown below might be realistic for the next 18 months, when I asked what he thought would happen beyond 18 months there was not any answer, perhaps no guess is feasible.
The 400 and 450 well scenarios are both about 40 Gb URR because the 450 well scenario sees the completion rate fall earlier than the 400 well scenario (2029 vs 2031), the 350 well scenario has a URR of 37 Gb, the 450 well scenario has 97k wells completed from Jan 2010 to March 2035 (no wells completed after that date). Cumulative Permian tight oil output from Jan 2000 to April 2023 is 10.7 Gb with about 42,300 wells completed.
Dennis , the number of wells is now immaterial . What matters is the location . You can sink 1000 wells in tier 2 & 3 location they will be uneconomical at today’s prices , then ??? . You are nixing quantity over quality or for better words ” Missing the woods for the trees ” .
Hole in head,
Note that longer wells have slightly lower productivity per foot, but costs per foot are also lower so producers go for the longer lateral lengths, because cost per barrel is what matters to an oil producer, they aim to minimize the cost per barrel produced. Productivity per foot of lateral is less important to an oil company than barrels produced per dollar spent. The CEOs are saying they don’t expect output will increase much in the Permian and peak will be around 2029 or 2030. That might coincide with about 375 new wells per month as in scenario below, in April 2023 tere were about 500 wells completed in the Permian basin (EIA estimate), the scenario assumes the completion rate falls by 20 wells per month until reaching 375 wells per month after about 7 months (Nov 2023) and then remaining at that level until 2031 and then fallin after that, URR for scenario is 38 Gb, and 93400 wells completed. There are likely to be this many tier one and tier two locations in the Permian basin in my opinion.
The annual decline rate for the scenario from 2035 to 2039 is about 27% per year, output is 1174 kb/d in December 2039, decline rate becomes even steeper after 2039, output is zero in December 2048.
Note also that many of the CEOs claim to have 10 years of premier drilling locations at current rates of completion, my scenario with 450 wells per month is about 12% below current rates of competion (510 wells per month) and the 400 well scenario is 22% below current rates of completion and the 350 well scenario is 31% below current rates of completion (375 well scenario about 26% below current rates of completion). Perhaps the CEOs are not being truthful, though in the past I think Mike S has suggested Sheffield is a straight shooter, perhaps I am remembering incorrectly.
Note that longer wells have slightly lower productivity per foot,…
Why would that be? Long or short, if production per foot is falling, then that means they are moving into less and less productive territory. Well, that is exactly what we would expect. We just didn’t know when it would happen. Okay, so it is happening right now. And it will, quite obviously, continue to happen. We can expect that production per foot will continue to do what it is doing right now, we can expect it to decline.
Or do you disagree?
excellent response – thanks dennis. It will be very interesting to see the oil production response once demand makes a call.
Ron,
The optimum is determined by cost per foot. I imagine you can see why cost per foot would decrease as lateral length increases. As wells get longer it is difficult to keep productivity per foot at the same level at the toe of a 15 k lateral.
As wells get longer it is difficult to keep productivity per foot at the same level at the toe of a 15 k lateral.
No, that is not the case. There is no reason that productivity per foot should decline unless the oil in the rock declines. Why would it?
Ron,
See the following
https://jpt.spe.org/the-trend-in-drilling-horizontal-wells-is-longer-faster-cheaper
Especially this snippet:
When the Norwegian data and consulting firm compared the results of companies doing 2- and 3-mile-long laterals in comparable rock with similar completions, they found the production per foot for longer laterals sometimes falls short.
“Our conclusion so far was that many of them were able to maintain productivity per foot, but we also recorded some cases with 10 to 20% degradation in productivity per foot for 3-mile laterals,” Abramov said.
Those estimates were based on the first 3 to 6 months of production. He said that “most likely, degradation in EUR [estimated ultimate recovery] will be less pronounced as 3-mile laterals exhibit even longer flowback period and shallower decline rates.”
Even if the lower rate has a lingering effect, the 15 to 20% reduction in drilling and completion costs offers an economic argument for going longer.
The entire article is worth reading, but this gives you a flavor of why I believe 15k horizontal tight oil wells might have lower output per well than a tight oil well with a 10k lateral, perhaps by as much as 15% lower productivity per foot, but with 17.5% lower costs per foot gives the company higher profits. Profits are how companies keep score.
Ron,
As to the why of lower productivity for longer length horizontal tight oil wells, the paper below suggests frictional losses along the horizontal well bore.
https://onepetro.org/JCPT/article-abstract/doi/10.2118/02-05-03/30357/Optimization-of-Well-Length-for-Horizontal?redirectedFrom=fulltext
It also may be difficult to get consistent fracking results towards the far end of the lateral (near the “toe” of the well). No doubt there are other considerations I am not aware of, but regardless of the reason, the data show the productivity of the very long laterals on a per foot basis is lower than for shorter laterals. For a long time (2008-2018 roughly) the “sweet spot” of cost vs productivity was considered to be 10,000 feet for the horizontal lateral of a tight oil well (this length was used for many years in the Bakken). Now companies are going longer, to 15k when possible, often the leases are not large enough to accomplish this, so presently in the Permian only a small percentage of wells are over 11k for the horizontal section (about 20% of wells in 2021, see link below).
https://www.eia.gov/todayinenergy/detail.php?id=50016
“Our conclusion so far was that many of them were able to maintain productivity per foot, but we also recorded some cases with 10 to 20% degradation in productivity per foot for 3-mile laterals,”
Dennis, this article explains nothing except for the fact that, in some cases, production per foot productivity dropped by 10 to 20%. There was no attempt in the article to explain why productivity per foot dropped. Otherwise, everything was the same.
Everything had to be the same because, in some cases, there was no decline per foot. From all that, we can come only to one conclusion. Available oil per foot of shale is declining in those new wells. That should be expected as they move further and further away from the sweetest spots.
The article said nothing about frictional losses. Why would some wells have frictional losses and others have none?
Ron,
The frictional losses are mentioned in a different piece, not all information can be gleaned from reading a single piece as you are no doubt aware.
The following piece reveals some of the challenges in modern horizontal fractured shale wells. An assumption that increasing the horizontal length of the well from 5000 to 15000 feet will yield 3 times more oil is likely not a valid assumption due to the complexities of such an endeavor, an art rather than a science (see end of piece linked below).
https://jpt.spe.org/optimizing-well-productivity-horizontal-logs-unlock-critical-geologic-knowledge
There are always inconsistencies in the rock from well to well. no two wells are ever the same, what is important is what happened on average and the average productivity decreased in areas where the expectation was that productivity should have remained constant.
I will leave you to your impression that it must be lower quality rock, I am open to other explanations such as longer laterals may not optimize productivity when normalized for lateral length.
I don’t think we know the answer, but a petroleum engineer might enlighten us on the general principles. Certainly there would be a pressure drop along the pipe, this is a very general physical principle. As the well becomes longer and longer eventually this affects productivity and there would be more of an affect for oil than for natural gas as the frictional losses may be greater.
Other problems are that landing zones may thin out as the lateral is extended to 15k and this reduce productivity and it may be more difficult to hit the intended target as the lateral is extended.
There may be a reason that most wells top out at about 8000 to 10000 feet, that may be the optimum size from an economics point of view.
See article below from May 2021
https://www.spglobal.com/commodityinsights/en/market-insights/latest-news/oil/052121-us-upstream-industry-relying-on-longer-lateral-drilling-to-boost-cash-flows
Dennis, that was a very interesting article. However, I couldn’t find anything in the article that referred to lateral length or what increasing the length from two to three miles would have on production.
The word “lateral” is mentioned five times in the article. But not one of those five referred to any effects increased lateral length would have on production. I could find no mention of that subject anywhere in the article.
Ron,
The article is about the challenges of optimizing wells and getting uniform reservoir stimulation along the lateral. As wells become longer and have more frack stages this becomes more challenging. Also there is a second article which talks quite a bit about increasing lateral lengths and the effects, see especially the Diminishing returns section of that piece. Excerpt:
But even as more oil and gas is procured per well with plus-sized laterals, output increases come at diminishing returns, Rene Santos, manager of North American supply for S&P Global Platts Analytics, said.
Using a hypothetical example, Santos explained that between a 7,000 foot and a 10,000 foot lateral, the production increase might be around 400 b/d of oil or 0.133 b/d per each additional foot drilled.
However, the increased production from taking a lateral to 13,0000 feet versus 10,000 feet may be only about 275 b/d or 0.092 b/d per each additional foot.
“The 13,000 foot lateral is more economical than a 10,000 foot lateral, but you get less incremental production for each additional foot drilled,” Santos said.
I am just going by what the experts say, perhaps they don’t understand this as well as you.
Ron,
The bottom line is that if we have two wells in similar quality rock, and one well has a 10k lateral and the second well has a 15k lateral, on average experts would expect the longer well will have lower output per foot of lateral, one explanation might be frictional losses over the extra 5000 feet of lateral, another might be that the fracking of the well over the extra 5000 feet of lateral is more difficult to do properly relative to the first 10000 feet. There are no doubt about 10 other better answers (at least) that an oil pro could give us.
Thanks Hole in head. Nice post by Mr Shellman.
For Nov 2022 Novi Labs has GOR for Midland county at 3.3 MCF/bo, in Nov 2019 it was 2.37 MCF/bo, GOR has increased quite a bit (39% increase over past 3 years).
At $2.50/MCF and $70/bo, I get $70 for oil stream and $8.25 for gas stream, plus one tenth of a barrel of NGL for each MCF of NG so 0.3 barrels od NGL at $20/b so that adds $6 for NGL, so $70 revenue for oil and $14.25 NG sream (including NGL extracted). Oil is 70 of 84.25 or 83% of the revenue stream. Not sure where the 50% of revenue coming from oil estimate comes from, when natural gas prices were sky high back in August 2022 ($8/MCF) and NGL was at $35/b the revenue stream might have been close to 50/50, oil was at $85/bo back in Aug 2022, so 85 to 18.5 is still 82% of revenue stream from oil. I must be missing something with different tax rates or royalties on natural gas vs oil. If we take things on a boe basis 3.3 MCF would be 0.55 boe, so the gas would be about 35% of output on an energy basis, but revenue/unit energy for natural gas is typically lower than for oil.
Europe expects to receive US LNG for a long time; it will be short or at best medium [term].”
–Jean LaHerrere
“Beware of graphs that plunge dramatically just past the present moment”. How many graphs like this did we see on The Oil Drum? Hundreds, or thousands?
Things are about to go off a cliff, any day!
No editorial comment on the content, just the fact that these graphs have been wrong – every single time.
No editorial comment on the content, just the fact that these graphs have been wrong – every single time.
No, they were not! All graphs posted that showed a dramatic plunge in early 2020 were spot on!
The other trick is to add other forms of liquid fuel, or of unconventional sources of oil to the charts. It’s evident that the inertia of the worldwide economy will keep going in the short term as it adapts to other fuel sources, and excepting for a plunge as due to the pandemic, the curves will follow a dead-reckoning slope from current levels.
Consider the crash of 2008. As part of the recovery effort, Obama admin offered incentives for green energy, which the oil companies siphoned off and used for funding fracked shale oil production. It was a smooth adaptation to unconventional oil that was barely noticed in the curves.
At the risk of getting hammered by Mike , I am posting this . The lying just does not end , Lies . lies and more lies . This is why Dennis and me are in disagreement . The data source is contaminated . GIGO rule .
https://www.oilystuffblog.com/forumstuff/forum-stuff/energy-inaccuracy-agency?origin=notification
“It is likely that EIA forecasts to 2050…[are] unrealistic by assuming an increase by 50% of the drilled wells, when most shale plays are almost completely drilled.”
–Jean LaHerrere
Source of article?
Svaya , the first two slides Shubham Garg at White Thunder , the latter two slides Art Berman , Dependable sources .
yes, I know, I thought there is an article, Jean LaHerrere is pretty old school, old school as in good
“Art Berman , Dependable sources.”
October 2011
Art Berman….”my professional opinion….when I look at the volumes of oil I don’t see enough to make a difference”…. referring to US shale oil development.
The U.S. last year posted the biggest increase in oil production in the world and largest increase in U.S. history. – June 12, 2013 (referring to 2012)
https://www.wsj.com/articles/SB10001424127887324049504578541601909939628
Dependable sources indeed.
@RGR, best not feed the cult with facts outside their short-term memory. Best case you’ll only get an error message in return and will need repair. Worse case, their error message will get stuck in a continuous loop.
HB, even a damn fool knows the increase in US oil production last year was due to recovery from the covid-19 deep cuts. To believe that this was just a normal increase in production could only be done by an imbecile. But then…??? 🤣
Yes Ron, there has been a lot of fools in the past. There have been those who for almost 50 years thought the USA peaked in 1971. Then there was also the glory days of The Oil Drum. Where thousands of fools gathered counting the end of civilization. Thinking humanity was past peak oil. Only to find out The Oil Drum was past it’s peak as record prices brought on an economic technological flood of oil. So much oil that the price of oil collapsed to half of it’s price in a few months in early 2015. This is when the great oil man Ron Patterson called peak oil himself.
What happened next ? That’s right, humanity just keep figuring out how to keep producing more of that black gold by the day. Until there was a world pandemic and within 3 months the world was floating in so much oil that for a few days. People had to pay to get someone to take the oil assets off of their hands. Well you know what happened next, Ron The Great with his oily crystal ball called peak oil again. Honestly, I don’t know how many times one gets to call wolf before everyone stops listening. Maybe you do. But I do know a broken clock is right twice a day. So all hope is not lost.
Personally my money is in the Dennis camp. He is a student of history, economics, forecasting, data, doesn’t get distracted by one time events, doesn’t speak of certainty but of probability of the future and most of all is open minded to technological advancements. He even drives an electric car. It really doesn’t matter any more if humanity has reached peak. The world has changed from the days of your father’s Oldsmobile. There are alternatives now to liquid fuel transportation and oil will see the days of buggy whips in your grandchildren life time.
I’d say if someone called peak oil to be in 2015, and then it didn’t happen until say 2025…. that’s close enough for me man. A decadal error bar is quite fine for personal planning and prepping for this kinda shit to happen in one’s lifetime. The difference between Ron and Dennis, and his “rosy glasses”, is a rounding error.
FWIW- I think G Kaplan makes great forecasts with those charts…. 50 by 2050 is how I remember them. Approx 50 million barrels a day by 2050. Help your loved ones get prepared for that.
I like hearing from knowledgeable people who stick their neck out to make predictions and take some heat from the crowd. They got some balls, so to speak.
Agree Survivalist.
To survivalist: You said:
“I’d say if someone called peak oil to be in 2015, and then it didn’t happen until say 2025…. that’s close enough for me man”
I agree wholeheartedly. Now go back, starting with say Colin Campbell’s claim of global peak oil in 1990 or so, and check every written claim of peak oil for someone mentioning a given level of temporal uncertainty into their result. There were a few, including the EIA. But of all the ones I am aware of, everyone EXCEPT the EIA has already outrun both their initial claim, as well as any big error bar they dropped around it.
Ron himself, who in 2014 gleefully declared the blessed event, but gee, if not 2014 than FUR SURE!!! in 2015. You will notice that Dennis substitutes scenarios, which are better than nothing, but allow all sorts of testing. However, until those who have built their models with the appropriate independent variable, it is testing without the critical piece of information necessary to say ANYTHING about future production. But with the CORRECT independent variable, even scenarios are wildly useful and uncertainty around the independent variable can be quantified appropriately, including with a temporal component, should the user so desire to develop sceanrio down the road, for example, modeling global oil production balancing off against claimed climate change mitigation scenarios. Geopolitical risk. Etc etc.
One thing that I have learned studying the Earth is that geologists and geophysicists are really not that good at applied math. Or at least that’s what it seems. Maybe they don’t actually want to do the work. Perhaps it’s not in their best interests? In any event, what you get instead is some bloggers interested in doing the work independently, applying the math that they have learned from other scientific and engineering disciplines.
So for people like RESERVEGROWTHRULZ, this is what you get. Best-that-we-can-do estimates based on half-assed data from bureacratic organizations such as the Texas Railroad Commission, fundamental religious tribes such as Saudi Aramco, pirate plunderers operating in west Africa, and crazed warlord despots such as Putin and company, Only a few places like Norway and the UK and NoDak doing a decent job.
Or we can work on other earth sciences disciplines that the Earth pro’s are equally inept at, such as predicting the next El Nino …. Well, as it turns out it’s entirely possible that every El Nino could have been predicted from data as early as 1932 based on freaking TIDES!
https://geoenergymath.com/2023/06/17/canonical-cross-validation/
So RGRZZ can keep on taking shots from their pseudonymous armchair perch.
https://aspofrance.org/2023/06/
US tight Oil scenario using scale similar to Laherrere, note this is tight C plus C rather than all liquids as in Laherrere’s scenario which includes C plus C, NGL, and biofuels. Also his right hand scale is in Mb per year which for my scenario would translate to 3285 Mb/year at peak (9 times 365).
And renewable energy gets accused of intermittency lol
Dennis should replot that with the x-axis starting in the year 0 AD. Example of a delta function
I like this chart
LTO Survivor,
Thanks. Same chart with different scale below, most people at this blog do not like this chart. It kind of matches what many tight oil CEOs are saying with a peak around 2030 and slow growth between 2022 and 2030 (average annual growth rate is about 2.3% per year). The annual decline rate from 2035 to 2040 is about 16.5% per year.
Dennis –
I think your graph is a bit misleading…
Kengeo,
I disagree, Permian resources are about 75 Gb based on Mean USGS estimate, my scenario has about 52 Gb for Permian, 17.5 Gb for Bakken/ and Eagle Ford, 3.5 Gb for Niobrara and 8 Gb for other plays (including condensate from shale gas plays). The USGS assessed plays have about 100 Gb for mean TRR and other plays likely add another 20 Gb to total. The 81 Gb estimate is reasonable in my opinion. Tight oil proved reserves plus cumulative production are 45.5 Gb at the end of 2021, this would be the minimum we would expect. There are likely about 17 Gb of tight probable reserves which increased the likely estimate to 62.5 Gb, then there are possible reserves and contingent resources which are likely to become part of 2P reserves over time. In 2021 6.6 Gb were added to proved tight oil reserves, more will be added to proved reserves in the future especially as oil and natural gas prices rise. If we take 81 minus 45.5 thats about 36.5 Gb, so another 6 years of reserves being added to tight oil reserves at 6 Gb per year gets us pretty close. If oil price start to fall in 2031 rather than 2035 as in the model I used, then the ERR might be reduced to 70 Gb.
Ok, so let me get this straight.
You’re of the opinion that tight oil is growing ~1.2 mb/d annually (~15% annual growth)?
Yet, in the past 12 months, there has been virtually no growth – which for 6 of those 12 months had been a very high price environment. Tight oil production possibly grew at ~3% over past 12 months, hard to tell…
Bottom line is the industry experts are not anticipating any measurable growth in tight oil – but somehow you are? What makes it even worse is that you expect that tight oil growth will offset conventional crude oil decline rates…
Your position gets curiouser and curiouser!
Note that scenario has far higher peak in 2016, for the URR they use 3000 Gb from USGS which is for conventional resources only. Actual output increased by less than 1% rather than 2% and decline might also be similar rates.
Like I said, I’m no expert, but the little I have familiarized myself with shale your graph looks way too optimistic. My impression is that we’re on the cusp of sustained declines from shale.
Anon,
Consider
https://www.eia.gov/petroleum/data.php#crude
and
https://www.eia.gov/energyexplained/oil-and-petroleum-products/data/US-tight-oil-production.xlsx
My model has US output increasing from 8562 kb/d in April 2023 to about 9500 kb/d in June 2030, so about 950 kb/d over 7 plus years, an average annual rate of increase of 136 kb/d per year or roughly 1.5% per year (136/9000). Just does not seem that unrealistic to me.
https://www.rigzone.com/news/wire/pioneer_cuts_long_term_permian_basin_oil_production_forecast-06-jan-2023-171642-article/
Pioneer is forecasting Permian output at 7 Mb/d in 2030 as of last January, my model has Permian output at 6.5 Mb/d in 2030, current (April 2023) Permian output is 5291 kb/d.
Dennis,
How much untapped tier 1 acreage do you think is left to support your projections?
Anon,
I don’t have access to how various acres are graded. The scenario has about 62k wells completed after April 2022, at about 300 acres per well this is about 18.6 million acres, but note this is in about 3 benches so the surface acres would be about 6 million acres. Total wells completed about 104 k with 42k wells completed so far. Note this assumes 9500 foot laterals spaced 1320 feet apart, as laterals get longer fewer wells can be drilled. The most prospective areas will be drilled first and over time average well productivity will decrease, this has not been factored in and will either lead to more wells being drilled if prices are high enough or less output especially in the tail. Difficult to predict exactly how it plays out, it will be more complex than I can model.
Anon,
While not specifically addressing your question regarding remaining Tier 1 shale drilling locations, today’s (dated June 21) RBN Energy post – dealing with the massive expansion of Corpus Christi’s export terminal capacities – might provide a clue as to the direction – and duration – of oil production from the Permian over the next several decades.
The actions of people investing multiple billions in infrastructure for large, long term hydrocarbon output, might warrant serious consideration from outsiders as their ‘skin in the game’, aka money, is no trifling matter.
Jes’ sayin”.
Ken Geo,
From 2021 to 2022 annual average tight oil did increase from 7.3 to 7.9 Mb/d and from June 2022 to April 2023 US monthly average tight oil increased from 7830 kb/d to 8562 kb/d, over 12 months this would be about 878 kb/d if the rate of the past 10 months continues for the next 2 months.
It is unclear how you come up with 1.2 Mb/d annually or 15%. Let’s do some simple math from 7.9 Mb/d in 2022 on my chart at a 15% growth rate to 2030 (where my model has tight oil output at 9.5 Mb/d.) The result in 2030 would be roughly 24 Mb/d almost 3 times larger than my estimate. We can also use your 1.2 Mb/d annual increase which would result in 17.5 Mb/d in 2030.
To the math challenged my scenario might seem curious. The correct numbers are about an average annual increase in tight oil output of 2.4% per year or an average annual increase of 0.2 Mb/d. So you were only off by a factor of 6.
Border Collies are some of the smartest dogs on earth. But their intelligence is not measured entirely by the work they do. They herd sheep. Sheep are stupid, they simply follow each other around and, for instance, are so stupid will follow the ass of another sheep in front of them, in the squeeze chute, straight to a firing pin point blank in the noggin. Bingo, lamb chops.
The “nobody would invest money unless they knew it was going to be profitable or long lasting” meme is truly a stupid one. Its sheepful. First of all, it’s not their “skin” in the game, it’s somebody else’s. Its OPM.
Herding sheep has led to 150 billion, and counting, of bankruptcies in tight oil E&P, countless other bankruptcies in mid and downstream.
All tight oil exports from the US of A, 95% of them, come straight from the Permian Basin…the last refuge of American oil independence, of remaining affordable liquid hydrocarbons. 1Q2023 we averaged 85% of all Permian HS tight oil production exported to foreign countries.
That is our kid’s oil, their hope for their future. Electricity is a long time coming answer and your life in the US will NOT be as good without oil. Mox nix, let our kids have the option to decide for THEMSELVES.
Don’t buy the other people are smarter than you bull shit. Enormously large corporations that invest in mid stream pipe and downstream export terminals have NOTHING invested in that. Hope is not a plan.
Draining America First, for exports, is not very American. Forget what other people do, or don’t do, think for yourselves. Trust your instincts about remaining hydrocarbons in America.
Mike, No, No, No
That shit coming out of Texas now is so bad we’re lucky to be able to sell it at a discount. We have to import the good stuff to keep our refineries running. It’s why they have to keep draining the SPR because Texas is letting us down.
Mike, indeed. From the book Economics of Good and Evil, by Tomas Sedlacek, the fundamental problem we have is that rather than attempting to maximize moderation, the economic theory we have maximizes utility, which is to say the insatiable human wants. The reason is simple, we do not know how to calculate the former, but we have a way of calculating the latter by simply adding all that contributes to the GDP. In short, our economies are based on Hedonistic ideas, rather than following the Stoic school of philosophy, or something resembling that. Incidentally Adam Smith belonged to the latter, as his theory of Moral Sentiments shows.
Dr. Korpela, you are very kind, sir. Thank you.
I appear only to be capable of embracing those theories up to a point. With regard to our country’s natural resources, their plundering, for the sake of utility, escapes my comprehension completely.
I am a big fan, by the way. I still have a comment or two you made to me years ago.
Beach, take it up with Mama Nature.
In the meantime, see if you can talk some of these kids out of this, will ‘ya? On one hand I’d want to flee that dump and never go back… but Texas? Tell them we’re averaging 120 F back here right now, running out of water, and everybody is now carrying a gun.
I’m for a 10 foot fence around the entire State, with razor wire on top, but Austin is Austin. Austin belongs in California. Wanna buy it? You can sell some of your cattle and get it pretty cheap.
https://www.zerohedge.com/personal-finance/millennials-lead-way-great-migration-california-texas
Mike, I don’t need to sell my cattle. I can do better than that. I’ll give you two for one. You can have Riverside and San Bernardino counties for Austin. The two of them will be like big cousins to Flatonia. Those Austin guys will love running around in the sun, sand and surf.
Ya, no water, 120F and guns doesn’t exactly help real estate values
Seppo, Nature of Human Wants- All the desires and aspirations and motives of humans are known as human wants in economics. And the wants that can be satisfied with goods and services of any kind are economic wants. Like for example food, shelter, clothing, etc are economic human wants.
Mike,
No disrespect intended, but do you ever think not developing the Permian Shale and keeping it in the ground would have ever been a viable option? You keep reverting back to this thesis that this oil should have been preserved in the ground for the next generation. However, it would have been impossible to realistically do…. unless we socialized all mineral rights and oil & gas development to be released for drilling with perfect timing. Private mineral and land ownership, contracts, leases, variations in lease language… all would have made making shutting the Permian Shale down for future generations impossible. The lawsuits alone would have filled a thousand courts.
Meanwhile, the current real benefits of developing the Permian Shale currently flow nicely into worker salaries, local property taxes, state severance taxes, mineral/royalty owner payments, etc… so, these benefits would have suffered under your scenario.
So, why do you persist pushing a point that had almost no realistic chance of actually happening and would actually have direct offsetting negative effects?
Thanks,
Huntingtonbeach,
The point is that we should produce less tight oil, this would be the case if the export ban on crude had not been lifted in 2015. We can utilize roughly 4.5 Mb/d of tight oil output in existing US refineries, that’s the amount the US should be producing rather than draining our resources and exporting them. This makes perfect sense to me.
Gungalonga,
Mike can correct me, as I likely have this wrong. The basic idea is that the US banned crude exports from Dec 22, 1975 (a law signed by Gerald Ford) to Dec 2015 (roughly 40 years). Since 2015 we have basically exportaing any tight oil output over roughly 4500 kb/d. To Mr Shellman and me this seems a dumb policy, the crude export ban should never have been lifted, the resources which cannot be utilized by US refineries should remain in the ground for later use.
One thing Mike jas mentioned in the past is that he’s ok with exports to Canada and Mexico, that seems perfectly reasonable, though his views may have changed on this point, I am unsure.
Dennis, Gungalonga makes excellent arguments above for trading shale. But I can think of a couple more. First it doesn’t solve the problem of resource depletion. It only gives the US a few extra years of economic longevity. The real answer is to stop burning oil for transportation and transform. The only long term solution to the limited supply side is to address the demand side. Part of that process means changing Americans and the world expectations about transportation. We can move to it or have it forced on us. If you think about, if you slow down the speed of transportation. You kind of make planet earth larger for the 8 billion of us.
It will be to future generations advantage to move expeditiously from ICE and it’s damage to the environment. One example- tomorrow new vehicles could be governed some were around 50 to 60mph and in a very short time save mbpd’s worldwide. In a lot of areas it will force older vehicles to slow down also. It would also make electrifying transportation quicker and easier. Until we move to an optimum efficiency speed we really aren’t serious about the problem. We have to learn how to live off renewables. There is no reason we need to travel at 75 to 80 mph with a car load of people. It’s a combination of selfishness and ignorance.
Second, from an ethical point of view. Who are we to burn up other poorer nations resources to save ours for ourselves. This is the kind of attitude wars are made of. America has been sucking the nipples of other nations oil reserves for over 50 years. An now you want to say not from my nipple you don’t. That’s not right and you know it. Just because America has been more advanced over the last 100 years. Doesn’t mean we have the right to others resources and deprive them of their future. For what ? To drive our vehicles at 80mph. I don’t draw lines around my immediate family. Mine is a family of 8 billion and that includes Mike and Dennis. Maybe HIH not so much. Have a great day !
Mike, thank you for your kind words, as I with tentative steps stumble to understand the predicament we humans have gotten into. We will be forced back into economies that are local, and this is likely to temper our “insatiable wants”.
Guga, I’ve heard from you before several times, you mean to be very disrespectful to me. Quit the shit.
I don’t even truly understand your argument. You seem to be implying that slowing the rate of Permian production down to coincide with US refinery absorption would eventually lead to nationalization of all minerals in the US and, in… TEXAS? Gimme a break. Thats dumb, and clearly spoken from the ORRI or RI camp. No such thing would occur.
But to be clear, you are good with private mineral ownership dictating when the very last of our nations minerals are produced. THAT comes before long term national security and the future well being of the nations children. You voted I am sure for all three of the TRRC Commissioners. all of whom believe more is better, two of them appear to benefit directly from that theory, certainly Craddock, and are no longer willing to uphold Texas law.
I absolutely cannot believe people have become so far removed from history, the purpose of the TRRC, and what is best for our entire nation. How my industry was regulated the past 100 years was beneficial to the State, to employment, to mineral ownership, to the American consumer and to my nation’s energy security. All that historically has occurred, cooperatively, for the greater good of all Texans and all Americans. It is not either/or, that is fear porn kinda stuff.
If you don’t like what I write, don’t read it. I don’t give a shit. Don’t feel threatened by my words of caution and conservation, my concern for the long term… relish in the fact that you are just like every other fucking American these days. The future is now.
And congratulations. You, like Beach, are life time members of the Drain America First Club. You both have different reasons for wanting America drained of all fossil fuels ASAP, that is the beauty of the club. Its all encompassing. And that is exactly why exports of vital America resources will go on until there is nothing left.
A Love Hate Marriage
Hi Mike, you do realize your beloved state of Texas is the leader of your fictitious make believe club. You should rename it Drain Texas First. Texas is the number one contributor to producing and shipping America’s oil resources to China. I would suggest you take your F250 and drive up to Austin. Then explain to Governor Abbot the mismanagement of Texas. He is wasting America’s resources and that you want your children to be able to have the joy of driving an F250 also.
California denies most fracking permits ahead of 2024 ban- https://apnews.com/article/climate-business-environment-and-nature-california-gavin-newsom-1671bce1013b33ba9013b8c06ac2c645
I can’t help but to believe you have a hard time getting a good night sleep with your beloved Texas. On the bright side, Texas loves to put out. I mean output.
Looks like it’s going to be in the low to mid 70’s here according to the next 10 day weather forecast. https://weather.com/weather/tenday/l/dce0083169b639a7b248fe29153cd5ac9530713836224028be9537946084462c
Did you know Flatonia has Tesla super chargers right next to the Valero ? You could buy an F150 lighting with your money and help save Texas resourses.
It’s great to see you have a sense of humor. Enjoy your road trip and have a great day.
Mike,
No disrespect intended… just a healthy debate. You are the one firing back with aggression.
Not sure where you are going with this and what you didn’t understand… my point was and is …. What you propose would be impossible to have implemented in our fee country. All private owners of the Permian/Shale mineral interests would have had to agree to keep their oil & gas in the ground and sacrifice life supporting royalty revenue. All this sacrifice simply to support keeping reserves in the ground for unknown conditions in the far future. It would never have happened… too many different mineral owner cash flow needs and too many significant private and public benefits would have been lost.
… this includes massive lost royalty revenue to individual mineral owners from small to large, The University of Texas System and many other large Institutions, countless charities of all sizes (the Catholic Diocese is a huge mineral owner for example), someone’s grandma and grandpa, my neighbors who get $500/month that helps pay their mortgage. All of these benefits would have been left in the ground and all that capital that came from production would never have made it into the Private Sector hands to do the good that it did, or to just have been spent on Gatorade and wine… a free choice. The Government would have been in control and we all know how that would have ended up… think SPR times 1,000.
I am not threatened by anything you write, just entertained and sometimes you have some compelling points, so keep on posting. I am just pointing out that, in my opinion, the notion that U.S. reserves should be left in the ground for future generations is a philosophical and conceptual discussion only and not useful in practical terms…. unless all the Mineral Rights were socialized and controlled by the Gov to control keeping the reserves in the ground.
Further, much of the past and current huge royalty driven financial gains for the private/public mineral owners are pumped into lasting benefits that would not have been created and supported had shale been magically shut-in and preserved for the future. I know countless universities, charitable foundations and institutions that were born and/or are continuously supported by monthly shale royalty from developing and producing private mineral rights in the US.
Thanks for inclusion into the DAFC, not sure I agree with your statement… seems a bit extreme. But, maybe I will order a couple sleeves of styro cups with that on it… increase polystyrene demand a bit!
If having the freedom to develop your property and resources when and how you see fit under the guidelines of reasonably established protocols, then I am a proud and Free American. If the nations needs more oil security for the future, then build a bigger SPR and fill it.
Gungalonga,
Mike is proposing that the crude export ban that was in place from Dec 1975 to Dec 2015 be reinstated. That is pretty much it. Mineral owners are free to develop their resources as they see fit, they just have to sell their crude in the US (or possibly North America, Mike’s position on this is a bit unclear to me). The TRRC has been regulating oil production in Texas since 1919, Mike Shellman is more familiar with Texas laws regarding oil and natural gas and states that the RRC is not following the law in the way it is allowing Texas oil and Natural Gas to be developed.
I think reimposing the crude export ban in the US (or change to allow exports only to Mexico and Canada) that was removed in 2015 is a good idea. It would be interesting to hear the views of oil pros on this idea.
Dennis, respectfully, Mike wrote…”But to be clear, you are good with private mineral ownership dictating when the very last of our nations minerals are produced. THAT comes before long term national security and the future well being of the nations children. “… and several other times he writes that producing the Permian Shale is “draining our children’s future”. Whether it’s exported or not, it is still draining.
I may be missing something, but sounds to me like Mike wants to keep the Permian Shale in the ground for the future when apparently the global crude supply is tight. Whether our shale production is exported or consumed internally doesn’t make a difference to me. If things get lean in the future… we will adapt and slow down exports to keep more oil supply domestic. Meanwhile it’s time to make hay.
As for the TRRC, if Mike knows Craddick or someone else at the TRRC did something illegal, he should report them. In my opinion, the TRRC isn’t in the business of acting outside the law, they are there to promote and govern safe, fair and balanced production. Not saying they are perfect…. but pulling ~5 million BOPD out of the Permian is a wonderful thing and supports countless businesses, county tax rolls, salaries, charities and personal consumption budgets…. so the TRRC system is working fine by me overall.
Anyway, a nutty discussion all around. Done with it.
At this time I’m not seeing a big drop in US shale this decade, unless prices collapse again.
North Dakota seems to be good example. It’s the most mature large shale basin. There aren’t many rigs running there. But there are enough to keep production over 1 million BOPD.
In Enno Peters’ recent Permian post, he notes that even with the drop in rigs in the Permian, there are still more than enough running to maintain current production rates.
Production might not grow a lot more, but it won’t collapse unless we go through something like GFC, COVID, and government stimulus doesn’t happen or doesn’t work next time.
However, once the good shale locations are used up, then what?
Shallow sand,
If prices for petroleum and nat gas remain where they are now, output will fall, at higher prices output may fall a bit more slowly. After 10 years output of tight oil is very likely to fall, sooner perhaps.
So peak oil has arrived.
Anon,
Not in my opinion. Peak in about 5 years at 84 to 85 Mb/d is my guess. If oil and natural gas prices remain at current level then yes peak remains 2018, but I think it unlikely that oil and natural gas prices remain low beyond 2023.
Isn’t Powell trying to prevent that? The 2008 recession smacked the price of oil down 5 fold.
If energy gets more expensive from here on out, it will do the work of Powell for him and throw cold water on economic activity.
@anon – no – powell is not trying to prevent a recession – falls into “not my job” category.
https://www.pbs.org/newshour/economy/federal-reserve-rate-hikes-likely-to-cause-a-recession-research-says
https://www.bloomberg.com/features/2022-federal-reserve-recession-inflation-response/#xj4y7vzkg
fed focuses on two things – inflation and jobs. job market is still sizzling. target for inflation is 2%. Last print was about 4%. so inflation reduction is the priority. Consensus Estimates are as follows: 2Q23 – 4.2%, 3Q23 – 3.5%, 4Q23 – 3.2%, 1Q24 – 2.8%. And a lot of the drop in the last monthly was due to energy prices.
https://www.nytimes.com/live/2023/06/13/business/cpi-inflation-fed
so if energy goes higher then the fed will have no choice but to do WHAT IT JUST SAID IT WOULD DO in any event – which is raise rates 2 more times. No where in that equation does “high oil prices = doing fed job for it” leading to rate cuts and stronger economy. Operation Break Shit is still on.
the nasdaq just went on a 50% run. that’s crazy. very little of that flow went to oil. if the fed reverses course and cuts a portion of that flow will go towards oil and push about $100 in short order. powell can’t risk it.
Anon,
When Oil prices were highr from 2011 to 2014 the World economy grew about 3% per year on average in constant US $. There may indeed be a recession, then central banks will ease rates and growth will continue. Higher oil prices up to $100/bo are not likely to be a problem and it will be good for oil producing regions.
Powell can do nothing . The recession is here . Leading indicator .
” Apple saw its sales tumble 27.5 percent to 53.3 million units from the year-ago quarter. The iPhone 14 family made up 78 percent of that number.
This was the worst quarter since 2014 for smartphone shipments with total sales of 250 million units. Compared to last year, sales declined by 19.5 percent and this could be attributed to the gloomy global economic environment. In contrast, 301 million smartphones were shipped in Q4 2022
Finally the Eurozone concedes it is in a recession . Can’t keep lying all the time .
https://www.dlacalle.com/en/global-economic-surprise-plummets-as-eurozone-enters-recession/
It’s not just Powell that has no power. All these rate cuts in China are having absolutely no effect.
Interest rates cuts are really just signals to the markets/banks to do their job and lend money.
Banks aren’t going to lend just because central banks want them to. Rates go to zero globally.
Money will be cheap but not plentiful. Oil will be cheap but not plentiful. It’s what a global recession/depression looks like.
Despite Hole in Head proclamation of terminal economic decline of India a few years back, that country has grown, and then grown.
“India’s GDP touched the US$ 3.75 trillion mark in 2023: Union Finance Minister, Ms. Nirmala Sitharaman informed on June 12, 2023, that the gross domestic product (GDP) of India has touched the US$ 3.75 trillion mark in 2023, up from around US$ 2 trillion in 2014.”…”lifting the economy’s uptick in 2022-23 to 7.2% from the 7% estimated earlier”
And just “13 hours ago — India’s largest airline IndiGo has announced a 500-aircraft deal with Airbus, a record in aviation history. The agreement has topped the …”
Looks like they have considerable confidence in domestic demand, and the ability to find fuel. Either confidence or simple wishful thinking.
There never will be a pre covid 2019 economy . Nett surplus energy is declining . Aviation still behind the clock .
https://www.energyintel.com/00000187-e82b-d9d3-a7b7-e8efe1270000
I’d like to see all (or 99%) air flight permanently disappear in short order.
I am aware that this would be devastating for certain sectors of the economy, but it is all optional consumption of energy and of the biosphere…civilization would continue on.
I certainly do not expect this sector closure to happen. People will use up whatever they can until its all gone.
The India air order of 500 new planes is an indication that despite global slowing growth or even recession, that certain sectors of heavy energy consumption are and will continue to be funded and expanded, in this world of 8 billion soon to be 9 billion.
Even as billions hover at the level of bare subsistence, there are other billions with purchasing power to consume ever more energy, and energy derived products and services.
In short, I wouldn’t be holding your breathe for the time when demand/consumption for energy declines. If not whale oil, then kerosene. If not wood then coal. If not jet fuel then bunker fuel. In fact…all of it.
The IMF in its April 2023 World outlook has World real GDP growing quite slowly over the 2023 to 2028 period, an average annual rate of only 2.56%. For comparison from 2010 to 2019 the average annual growth rate for World real GDP was about 3%. No depression forecast, but growth may not be very robust.
Again? So peak oil #6 of this century in 2018 has been dispatched by yet another? When is it going to end!!!! The horror!!
Again? Peak oil was predicted in the past, and it didn’t happen!
So this means it just ain’t ever going to happen!!!!
When will these damn fools stop predicting oil production will begin to decline. When any damn fool should know oil production will continue to increase forever! The horror!!! 😫
To Ron:
Oh please. I am making fun of the incessant claims since Colin Campbell’s 1990 global peak oil claim, I accept Hubbert’s math on the profiles of extraction of non-renewable resources published in 1956 without question.
I simply note, as McPeaksters tend to forget, that if peak oilers aren’t lamenting the last peak that didn’t happen, they then eagerly await the opportunity to claim the next.
And the irony that we’ve been post peak globally (#6 claimed or occurred) for 5 years now doesn’t slow down their illogical Peak = Doom routine for a nanosecond. “The horror!!!” indeed.
RGR stated: Oh please. I am making fun of the incessant claims since Colin Campbell’s 1990 global peak oil claim,…
Bullshit Your snarky comment was in reply to someone who simply stated: So peak oil has arrived. They were not predicting a future peak but simply acknowledging the peak that happened five years ago.
But it’s not your fault. You cannot help the fact that you are a helpless cynic without any knowledge of how to make an argument without snarky, cynical comments. No, it’s not your fault. It could be because a child, you were bullied on the playground. 🤣
It’s actually Peak Bookkeeping that we should be monitoring. At some point, new bookkeeping tricks will cease to have an impact and the reality of the constraints will hit everyone. There’s also the related concept of Peak Smokescreen, where the utility of mentioning climate change as a mitigation carrot stops working. Not clear how soon the smoke will clear, but as long as climate scientists and geophysicists can’t figure out the patterns of change people will follow along.
BTW, example of near-Peak Bookkeeping: The USA only extracts 12 million barrels of crude oil per day from its territory, while USA also consumes 20 million barrels/day. Always cooking the books when it comes to crude.
Paul,
Not quite right on the bookkeeping. We extract about 12 Mb/d (11.88 in 2022) and we input about 16 Mb/d of crude oil to refineries (15.93 in 2022), net imports of crude are about 4 Mb/d. Actual imports are about 8 Mb/d because we export about 4 Mb/d (3.6 Mb/d in 2022) of tight oil that we do not have refinery capacity to utilize. The refineries were designed to handle mostly heavier grades of oil rather than tight oil. A lot of the 20 Mb/d consumption is propane, ethane and butane (so called LPG) about 4 Mb/d.
Above my pay scale , but here is a tweet on inventory adjustment and oil book keeping . Please analyze and comment .
https://twitter.com/ALikhodedov/status/1672010207436718082
Dennis, That’s my point. Lots of detailed bookkeeping tricks go into the numbers which make it look like the USA is net exporter of crude oil on first glance, that is without diving deep as you show.
“At this time I’m not seeing a big drop in US shale this decade, unless prices collapse again. ”
Shallow,
I love your comments. Have learned much from your thinking.
Just when I am convinced Peak Oil is about to bite. An oil pro thinks US Shale has a plateau of another decade.
I have an a**hole and an opinion like everyone else. Mine is just a far less qualified butth*le……LOL!
With shale there appears to be no moderation or steadiness. Shale production climbs rapidly and then declines rapidly. (Famous “sharkfin” production profile of shale). I don’t buy that shale production will plateau and I don’t see anything making up for a decline in U.S. shale production, which is coming soon.
**I’m an enthusiast and not a pro like some of these guys here.**
Anon,
See chart below from
https://novilabs.com/blog/permian-update-through-april-2023/
In the post above Enno Peters says of the chart below for potential Permian Basin tight oil supply:
This number of active rigs (333) is however more than sufficient to maintain current output, assuming no changes in rig & well productivity. The following overview, from our Supply Projection dashboard (available to subscribers), reveals that if one assumes a drop 100 rigs from now until September 1st (top chart), Permian production will plateau at the existing level (bottom chart).
I do agree that tight oil output will decline rapidly after 2030 or so, demand for oil may be waning at that point as the land transport fleet moves to electric over the next couple of decades.
I dont understand how he thinks. How does he reconcile a very vertical decline thats empirically observed with his prediction of a nearly perfect flatlining of production? It seems like fantasy/fiction.
I agree the history hasn’t necessarily shown this, but investor / bank discipline seems to have been instilling this more moderated strategy for several years now. Like you said, the experts on the thread can probably speak better to this, but the industry could certainly organize itself to maintain flat production if that were the goal – it’s just math.
it’s really a question of investor sentiment and the slide deck pitch. if you’re pitching “forever and exponentially rising production” and can show that increase over 3 quarters then sit back and watch the hot venture capital money flow in. if your slide deck shows a nearly guaranteed 15% return over 7 years, then the Warren Buffet money will flow in.
Anon,
See
http://oilpeakclimate.blogspot.com/2014/06/oil-field-models-decline-rates-and.html
Unfortunately I have lost the charts for this post, but a simple Bakken Model Can be found here.
https://docs.google.com/spreadsheets/d/1o30YdXx5zNZOV-bpcKEHU8uAZIF8Wym7/edit?usp=sharing&ouid=105320434049434900507&rtpof=true&sd=true
Bakken well profile below for model above, note that the average well actually becomae more productive from 2014 to 2018 and remains more productive in 2022 relative to 2014.
See
https://public.tableau.com/shared/7G7D67544?:toolbar=n&:display_count=n&:origin=viz_share_link&:embed=y
Anon,
The average well profile is convolved with the wells added per month over time as shown in chart below for bakken model on spreadsheet, note that this model was from June 2014, I only had data through April 2014 at that time, wells added after April 2014 is a guess, the wells added are constant from April 2015 to December 2020 for this model at 95 new wells completed each month over that period.
The resulting model when the well profile (assumed not to change from April 2014 to December 2020) is convolved with the number of wells completed per month is shown below.
This is basically what Enno Peters has done in his supply projection for the Permian basin (the well profile is different and the number of wells completed per month, but the technique is the same.)
I wonder what folks make of this, according to Goehring & Rozencwajg – Hubbert’s peak is finally here
https://blog.gorozen.com/blog/hubberts-peak-is-finally-here
I’m not a pro regarding shale. I don’t think companies are making much money now either, at current oil and natural gas prices.
Companies didn’t make much 2017-19 either. But it seems that they keep plugging away unless prices collapse to where they are really losing a lot of money.
I’m just noting what I read in the most recent Enno Peters post about the Permian. There have been about 5,500 shale wells completed there every year for the past few years, except in 2020. I assume they have a few more years of locations at that rate, although it does appear issues are forming, and have been for awhile. GOR, WOR, and other issues which Mike, LTO point out.
But I see the Bakken is hanging in there without many rigs, and has for awhile.
I’m not saying there will be growth, but that there isn’t going to be a big fall off a cliff. Not until the locations have ran out. Then production will really fall. Easy to see that in the charts. Majority of oil comes from wells drilled in last 2-3 years.
I’m just assuming the drilling won’t stop, or even slow much, until we run out.
I do see it’s going to be close to 110 in Midland, TX this week.
I do wonder about whether the water be there to frac the remaining inventory.
Shallow sand,
Thanks for your comments, I know tight oil is not what you produce, but you are an oil producer and know much more than most of us (except Mike S. and LTO Survivor perhaps) about US oil production. I expect there may be more recycling of frack water and produced water as water becomes more scarce in West Texas.
Article below discusses some of this for Texas
https://abc13.com/hydraulic-fracking-wastewater-recycling-texas-earthquakes-oil-companies/12591057/
My exectation is a slow rise in tight oil output to about 9 Mb/d by 2028 or so, then a brief plateau until about 2032, followed by fairly steep decline as the Permian runs low on profitable locations (tier one and tier 2) to drill new wells. Potentially high oil prices might extend the plateau to 2035, but I expect we may see falling oil prices after 2030 so output may fall rapidly as completion rate slows due to lack of profits.
With regard to oil prices, it seems like they are dependent upon the world economy, at least somewhat.
I don’t have a good idea of how the transition from oil will occur. I think you are predicting a price collapse due to lack of demand resulting from transition.
That could very well happen, but the timing is key. Demand is still rising and the renewable build out will require a lot of oil.
My oil price prediction continues to be a range of $35-$150 WTI. Which means I have no idea, but feel both of those numbers will cause a major supply response.
shallow sand,
I also don’t know what will happen to the price of oil in the future, but my expectation (aka guess) is that oil prices will rise to $90/bo or higher over the 2024 to 2030 period, over this time there will be a gradual shift to EVs and plugin hybrids from ICEVs, eventually we will reach a point where demand for oil may be falling faster than the supply of oil at the market oil price in 2030 or so (perhaps $95/bo in 2023$) and oil prices will gradually fall so that supply and demand match. I don’t expect a sudden crash in oil prices, prices will gradually adjust lower so that more expensive oil is priced out of the market (mostly tight oil and perhaps some ulta deep water projects and Arctic oil projects). I expect tight oil output may fall pretty rapidy in such a scenario and new offshore projects may also cease and higher cost offshore platforms may be shut in. My oil price scenario used for my Permian basin scenarios below, oil prices fall after 2035 from $80/bo in 2022$ to $35/bo by 2040.
Dennis,
Do you have any thoughts on net energy? Declining EROI. The oil industry using more and more of its own oil to keep going looks like it can be a rapidly approaching problem with depletion.
Anon,
I don’t think it wise to evaluate net energy at an industry level, the Oil industry uses many energy inputs besides just oil, electricity, natural gas, NGL, etc. All that matters at the industry level is profits, nobody considers net energy, it is not evaluated. On a society wide level for all types of energy it is an important consideration.
I use papers such as the following as my guide.
https://www.mdpi.com/2071-1050/14/12/7098
I met with a surface landman last week working for XOM in the Delaware basin.
Water is selling for $0.85 a barrel.
How much water are they using to frac these Delaware Basin wells?
An alternative Hubbert Linearization using 2009-2018 data gives a URR that is closer to reported OPEC reserves excluding Orinoco Belt Oil, URR=1490 Gb, remaining resources 919 Gb at end of 2020, BP reported conventional OPEC reserves at the end of 2020 were 953 Gb, about 34 Gb more than indicated by my HL estimate. Chart below has revised OPEC HL.
Hubbert model for OPEC matching HL chart above, peak year is 2034 at 36.2 Mb/d, seems quite optimistic at current oil prices, but if oil prices increase to $90/bo or more perhaps the rate of resource development in OPEC nations will increase (especially big 5 producers). Previous peak was 2016 at 33.8 Mb/d, currently OPEC can probably produce about 32.5 Mb/d (with no OPEC cuts), with sanctions relief for Iran, perhaps 33.7 Mb/d within 6 months. So we would need to see a 250 kb/d on average each year over the next 10 years for the 36 Mb/d peak to be realized, even at $90/bo probably a stretch, who knows how high oil prices might go over the next 7 years, not me. A more likely scenario is a plateau around 31 to 34 Mb/d for the next 10-15 years for OPEC, if demand for oil holds up.
Denis, how much do horizontal drilling and water injection skew the peak to the right? And how much would we need a perfect world scenario to make such a clean curb come true? I would guess that sanctions and political struggle will take a toll on the peak, which will stay well below 35.000 kb/d. And then there will be a much steeper downturn:
West Texas Fan Club,
I agree OPEC output is likely to remain below 34 Mb/d, I believe I said that in my initial comment, I also agree it is unlikely the Hubbert curve will be followed for many reasons, chief among them may be a lack of demand for oil after 2035, though this might not affect OPEC as they likely have the lowest cost oil in the World. The low demand for oil will hit higher cost producers first.
My preferred model is the Shock Model. The Hubbert linearization favored by some points to a URR of 1490 Gb for OPEC, note that I have excluded the 260 Gb of Orinoco Oil Resources from the BP Reserves estimate. There has been 571 Gb of cumulative OPEC C plus C output up to Dec 31, 2020. So URR minus cumulative production=remaining resources=1490-571=919 Gb. If the peak gets pushed to the right as you suggest then it might occur at 900 Gb rather than 745 Gb as in Hubbert model. If we assume a plateau at 32 Mb/d=11.68 Gb per year, then from cumulative production at the end of 2022 (593 Gb) we would have 900-593=307 Gb/11.68=26 years plus 2022=2048 for end of plateau. Note that the Hubbert Curve reaches 900 Gb in 2045.
In any case I don’t think the HL method gives a reliable estimate. For the World I expect something like chart below. Not sure specifically how it will break out between OPEC and non-OPEC.
If I’m reading Laherrere‘s recent work right, He expects sharp decline (>7%) to start by 2025, losing almost 1 mb/d annually. Also, based on his chart, it appears the plateau phase will be 5/6 years (which means we are right in the middle of the plateau).
Covid likely made it trickier to see the plateau phase and also likely flattened the peak to some degree…
Kengeo,
Laherrere assumes the curves will be symmetric, just look at the Alaska curve to convince yourself this is a poor assumption. Also consider the centered 12 month average of UK C plus C output in chart below. Most oil output curves are not symmetric. My tight oil scenario has an average annual decline rate of about 12%/year from 2030 to 2040, so pretty steep.
Dennis
Those bumps up in Alaska are new fields. Using a few extra logistics accounts for the new fields and would give a slightly better result.
As for logistics, I think that was a reasonable assumption by Hubbert back in the 50s when wells were vertical and the reservoir pressure dropped as more wells were drilled and oil was removed.
I think that horizontal wells, along with pumping water into the well to maintain pressure along with other enhanced oil recovery methods cannot be modelled using the logistic function, IMO.
Ovi,
I tend to agree. Only presenting it as an alternative to the shock model which some don’t like, the geological analyses suggest a World URR on the order of 3500 to 4000 Gb for technically recoverable resources, if we had good cost curves we could evaluate how much of the oil might be produced under different oil price scenarios, but most of the cost curves I have seen severely underestimate actual production cost in the case of tight oil.
The Hubbert type analysis points to a URR in the right ballpark in some cases, but depending upon the choices one makes for data to include in and HL one can get very different results, in the case of OPEC between 950 and 1500 Gb so the method is not all that reliable. For non-OPEC including or excluding tight oil can change the result by a factor of nearly 2 for URR and likewise the choice of data to include can change the analysis to a large degree.
Overall the results are very subjective, though the choice of URR for a shock model is also subjective, I use the average of a 2500 Gb HL estimate and the USGS conventional oil estimate of 3000 Gb as a starting point and take a number in the middle (2750 which I round up to 2800 Gb). This is also subjective, but note that my overall URR for my best guess shock model is 2650 Gb with conventional oil at about 2470 Gb in line with the conventional HL oil URR estimate.
On Alaska there was one very large field that dominated output, what I am referring to is the slope of the curve when output was increasing vs the downslope which is far less steep. Using multiple logistics would seem to introduce more subjectivity into the analysis from my perspective. Also it seems the point of such an analysis is to simplify, there are a lot of fields in the World, fitting a logistic to each one would be pretty time consuming.
Found an interesting graph in Laherrere’s May 2023 paper:
Apparently, he sees a very sharp decline eminent.
I believe his URR works out to 2,600 Gb, which I believe also matches your shock model.
Dennis – For your shock model, the bulge from present to ~2035 doesn’t look real, I don’t think a world production curve would have any way to fit that arc you have shown.
My low estimate is slightly higher than Laherrere’s, if his graph turns out to be right, by 2028 that will put world production down 10 mb/d over ~10 year period.
Decline would be right about 1 mb/d…
Kengeo,
That chart for Laherrere is for conventional crude oil only, he also has unconventional at 135 Gb, though this is likely an underestimate, his estimate for tight oil URR is 35 Gb. Proved tight oil reserves at the end of 2021 for the US were 24 Gb and cumulative tight oil output from Jan 2000 to Dec 2021 was 21.6 Gb, so we would expect a minimum URR of 45.6 Gb, but note that 2P reserves tend to be about 1.7 times proved so 2P reserves are about 41 Gb plus cumulative production would be 65 Gb, the USGS estimates the mean TRR at about 100 Gb, my URR estimate bsed on well profiles and area left to be developed is about 80 Gb with a conservative oil price estimate, in short Laherrere’s URR estimate for US tight oil is far too low in my opinion.
Laherrere’s estimate is for conventional oil my estimate is for all C C. In chart below I have World C plus C and World C plus C minus US tight oil. This scenario assumes the rate that oil is developed continues at the pace of the past 104 years and that extraction rates for conventional oil increase from 5.1% in 2022 to 5.3% in 2028, note that in 2018 the World extraction rate for conventional producing reserves was about 5.4%, extraction rates decreased during the pandemic due to lack of demand, they can certainly increase as OPEC nations are currently cutting back on output. Producing conventional reserves from 2018 listed below for my model (multiply by extraction rate for conventional output):
490.34
491.28
493.66
495.32
495.49
495.01
493.90
492.19
489.92
487.11
483.78
480.03
475.92
Extra heavy output from 2018 (Mb/d):
3.76
3.86
3.39
3.82
3.94
4.04
4.12
4.16
4.21
4.30
4.35
4.39
4.41
CHART OF THE DAY: Deflation in the American oil patch.
The cost of benchmark oil country tubular goods (aka, drilling pipe) is down ~40% from the all-time high set in late 2022, easing pressure on US shale companies . —- Javier Bias
I don’t know if I’d call that chart deflation.
Let me know when it gets back to 2019 levels.
Shallow sand,
Deflation=falling price.
Dennis.
Hasn’t fallen below pre-pandemic. Still way above.
I actually pay for tubing. It has stabilized for us at $6.06 per foot for used, tested gas storage well pipe. It was $2.50-$2.80 pre-pandemic. 2 3/8”.
So it all has to do with your frame of reference. Yes, it has dropped since 2022.
I could go on and on about how much more everything costs compared to 2019 and prior. But I think you and everyone else here are aware of that.
Shallow sand,
Yes costs are much higher now than before the pandemic, hopefully prices will continue to fall for steel tubing, a pretty steep drop from the end of 2022, is this apparent in the used market, might be different and I do not buy steel tubes so would not know.
My apologies for offending you, not intended, I just say dumb stuff sometimes. I will try to be better or not comment at all.
Thats tubular steel, still double the recent times.
Other components of the cost equation not looking so ‘favorable’.
Labor costs for example.
Median real wages for adults over 16 full time in the US
2019Q4=362 1982-84 dollars, and 2023Q1=363
I believe the problem is finding workers in the oil field. Also lots of other costs have increased along with steel tubing.
Chart from
https://fred.stlouisfed.org/series/LES1252881600Q#
Remove 20-22 Data (Noise do to Pandemic)
OPEC 13 average production will fall below 28 Mb\d by Early 2024 if the trend holds. Although a deep recession may result in production lower than 28 Mb\d if demand crashes like it did in late 2008 to early 2009.
The decrease in OPEC output is just cuts due to over supply, that will end and OPEC output may rise, potentially to a new peak, but I think not that high, probably to 1 Mbpd less than previous peak.
I think that shows the issue very well, with another million coming off in July and the late 2022 blip up only possible because fields were rested in the Covid years the red line shoul actually be a bit steeper down.
We will see if the trend continues and if Saudi Arabia makes the voluntary cuts in July, they have said it will be for a month, I doubt it will be more than one month and perhaps it is an idle threat. We will know what OPEC’s true capacity is when oil prices rise to $90/bo and OPEC actually pumps at capacity. By 2024 it is likely that OPEC 13 crude output will be back to 30 Mb/d.
Another Voice: Peak oil
The carbon content of fossil fuels is driving the climate crisis, but that is not the only reason to rapidly shift to renewables.
For decades people have been concerned about the issue of peak oil, first mentioned by oil geologist Marion King Hubbard in 1956. He proposed that since oil was finite, any given reserve had a natural production cycle, which would eventually peak and then inexorably decline. He suggested the US domestic reserves would peak in the early 70’s. While ridiculed at the time, US production did peak in 1972. He also predicted that global production would peak in the early 2000’s.
This was posted April 30, but I missed it. You can read it or listen to it. It has a 5.5-minute audio track.
Several publications did the same prediction but later about the Word oil peak. I observe that the investissements for oil research increased at the end of the 1990s. Obviously, the geologists of the major oil companies made their managerial boards aware that their would be a problem of oil ressources at the end of the 2000s. The crash of these investments suggests that they think that the ”carottes sont cuites” for oil production.
Thanks Jean, I had to look your French quote up, “carottes sont cuites”.
Les carottes sont cuites means literally “the carrots are cooked.”
Figuratively, a synonym for this French expression in English would be, “the chips are down” or “your goose is cooked.”
Yeah, I agree. Thanks again.
6 months into 2023, US oil production has flatlined as new wells simply make up for legacy declines and struggle to add any growth!
Now drilling rigs are ⬇️ 10% YoY, frac spreads are ⬇️ 8% YoY, and normalized well productivity is ⬇️ 10% YoY. 6 months of declines ahead? 🤔🛢💰—-Shubham Garg
Things not looking good .
Hole in head,
The weekly production numbers are crap. Using data from
https://www.eia.gov/dnav/pet/hist/LeafHandler.ashx?n=PET&s=MCRFPUS2&f=M
From March 2021 to March 2023 we find the average annual rate of increase in US C C output is 719 kb/d and note that if we use only the past 12 months, the annual rate of increase is 1153 kb/d. Probably true that US output might be relatively flat in 2023. The US EIA in their most recent STEO has the trend in US output at an annual rate of increase of 283 kb/d from Dec 2022 to Dec 2023.
Dennis , the graph is made by J.P , Morgan , not by Shubham Garg . Whom you gonna believe ? EIA ( Energy Inaccuracy Agency ) or JPM ? Not me but Richard Pryor asked this question . 🙂
Hole in head,
They got their data from the EIA, they are using weekly data which is very inaccurate, the monthly data is far better, which is what my chart is based on. Believe what you wish.
Global Oil Industry Natural Decline Rate Red Queen Syndrome For DUMMIES…
One of the most overlooked aspects of the Global Oil Industry, is that it has hit the RED QUEEN SYNDROME. The Global Oil Industry Natural Decline Rate (without new investment or drilling) is likely between 10-11 mbd… EVERY YEAR. However, I have provided a bit more conservative figure of 9.4 mbd.
But, with most of the oil production growth in the past several decades coming from Non-OPEC, mostly Shale Oil & Offshore, this declines even faster.
Don’t count on a gradual decline in Global Oil Production, but more likely the SENECA CLIFF… the ENERGY CLIFF.
steve
Steve , you are being generous . The man who along with Collin Campbell (RIP) wrote the first paper on decline and depletion of oil , pegs the decline at 7 % not 6 % . “If I’m reading Laherrere‘s recent work right, He expects sharp decline (>7%) to start by 2025,” Kengeo . By the way we are talking about quantity , what about quality ? If , of what we have left is majority NGL , NGPL , bio fuel , + 50 API Tight oil and refinery gains where is the black goo ? Quo Vadis ? After me the deluge ??? .
Hole,
I actually believe the Non-USA Global Natural Decline Rate is likely north of 9% per year. Based on 81 mbd of Non-USA production, that is 7.3 mbd and if we add the USA 4.6 mbd, we get nearly 12 mbd lost EACH YEAR to the natural Decline Rate.
That is likely the more realistic figure.
steve
Hole in head,
Kengeo did not read Laherrere’s work correctly, he has World crude output decreasing by about 3.57% per year from 2030 to 2060. In 2030, crude output is about 3000 cubic meters and in 2060 it is about 1000 cubic meters for Laherrere’s recent model. See
https://aspofrance.org/2023/05/30/peaks-from-past-data-with-hl-energy-fossil-fuel-co2-population-gold/
page 14 (figure at top of page, figures are not labelled.)
You can check my work.
From a bottom up view (which I think is always to be preferred if data is available) I’d say accelerating decline from 2025 is highly likely. There just aren’t enough projects in the pipeline to maintain production. The dearth of discoveries and the choice made by almost all public E&Ps to prefer dividends and buy-backs over investment is all part of this. With low oil prices the NOCs aren’t getting the revenue they need even if they had the prospects. Iraq is probably the one country with large opportunities and look at the problems they had in getting TotalEnergies to commit to any long term projects.
This is the gold dust.
Thanks for the heads up George.
Drop us a line if you’re in a pinch.
Yup!!!
Dennis – How in the world do you get a future crude oil peak if we have already used 70% of all existing crude oil?????? Page 30 Laherrere: “the peak is past for crude”.
If we assume a decline rate of ~3.5%, the remaining 850 Gb of crude will not last long (drop at least 1 mb/d annually):
2027 will hit 70 mb/d; 2031 will be 60 mb/d; 2036 will be 50 mb/d; and 2042 will be 40 mb/d (more than 50% drop from current levels).
Page 71 – Interesting that Laherrere looks at population and sees it peaking by 2030 (which would make a lot of sense given the sharp drop in oil supplies).
Excerpts from Laherrere May 2023 (https://aspofrance.org/2023/05/30/peaks-from-past-data-with-hl-energy-fossil-fuel-co2-population-gold/):
Page 29:
-oil in weight
HL of world crude oil production in weight is good from 1994 to 2019 trending towards an
ultimate of 350 Gt
Page 30:
For an ultimate of 350 Gt for crude and 700 Gr for all liquids, the peak is past for crude and 2040 for all liquids.
Page 31:
HL of crude oil production – 225,000 M.m3 produced versus a max. of 325,000 M.m3.
Converted to Gb this works out ~2000 Gb produced and total URR of 2850 Gb.
Page 32:
world NG ultimate = 475 000 km3 (17 Pcf) giving a peak in 2040
Page 34:
Hl of world condensate production trends towards 17 km3, giving a peak in 2019.
Africa NGPL has peaked in 2010
Asia NGPL will peak in 2026
Page 36:
OPEC NGPL will peak in 2023
Page 37:
Non-OPEC NGPL will peak in 2037
Here’s another look, sharp decline appears on the horizon:
Kengeo wrote: Dennis – How in the world do you get a future crude oil peak if we have already used 70% of all existing crude oil??????
Kengeo, damn good question. That’s what I would call a real poser. 🤣 Anxiously awaiting Dennis’ reply.
This should all come as no surprise for most of us on here:
Blast from the past: (Hirsch, Bezdek, & Wendling, 2005):
This almost 20 year old figure, global peak projected ~10 years into the future with a date of 2016…
I added more recent data points. If we consider the peak with production above ~27.5 Gb (2010 – 2020), then 2015/2016 is actually about right…
Kengeo,
Note the URR they use for conventional oil is 3000 Gb, about 200 Gb more than I use in my model. They seem to focus on conventional oil in that model (they may have believed that conventional oil would not amount to much). The data in chart below is conventional crude and the original model increases output to 2016 at 2% per year then decreases at 2% per year after 2016, cumulative output reaches 1340 Gb in 2016 and 1500 Gb (half of conventional oil) in 2021 for the original model and in 2035 cumulative output is 1878 Gb. The “modified” model attempts to match actual conventional output with an exponential increase with a matching exponential decrease, after reaching about 1340 Gb (as in original model). The exponential increase is 0.5% per year from 2000 to 2018 followed by a 0.5% per year decrease after 2018. For the modified model cumulative output is 1337 Gb at the peak in 2018 and 1498 Gb (about half of conventional URR) in 2024 and 1783 Gb in 2035 (about 100 Gb less cumulative output than original model). Scale on chart is Gb per year of conventional crude output.
Ron,
We haven’t used 70% of existing crude oil, we have used about half of conventional crude, we also have unconventional crude that can be utilized, both tight oil and oil sands. Laherrere’s charts ignore unconventional crude. I use a conventional crude estimate of about 2800 Gb, but less is produced after 2030 due to lack of demand in my shock model. We will just have to wait to see if Kengeo is right about 62 Mb/d in 2030, note that his “most likely range” assumes zero output from extra heavy oil and tight oil. I think that is likely to be a poor estimate. Below is my estimate for unconventional oil (extra heavy oil plus tight oil). Do you guys believe there will be no more discoveries or reserve growth? That is down right silly.
Rystad’s best guess estimate for remaining resources at the end of 2021 was 1725 Gb, cumulative production of oil at the end of 2021 was about 1444 Gb, URR would be 3169 Gb and we have used about 45.6 % of this URR as of Dec 31, 2021 with 1725 Gb of remaining resources.
Note that my shock model assumes some of these resources remain in the ground with a URR of 2650 Gb.
I get ~69% of crude oil produced based on Laherrere’s analysis…
We all know that not all oil is created equal…your unconventional production curve doesn’t appear to have any net affect and may have some bad assumptions to boot…
Sic ’em, Ken.
Mr. Coyne, I am tired of you lecturing me about an industry I spent a half century in feeding my family and the families of my employees. To come to MY place, and lecture me, for an article I did not post on AOB, is all I can take, dude. You have lost all credibility with me, and it appears… all your readers as well.
You must kindly kiss my Texas ass. God bless Ken for wanting to set the record straight, everybody in the oil business that has EVER commented here for the past eight years has given up.
Yeah, I’m regretting agreeing with one of his views too.
I’m resigned to the fact these shale guys are just going to keep on drilling at $70 WTI, until the locations run out. I figure that’s pretty much the rest of the decade. Then, of course, there will be real trouble unless the conversion to electric fleet has bit big time into world demand.
So I posted that.
And this really stinks, because pre-pandemic we would have been happy as could be with $70 WTI. But inflation reared its ugly head in 2021-22, and now $70 just isn’t that great.
Then just down the page there is a good chart showing steel casing or tubing prices have dropped, but are still much higher than pre-pandemic. I might know this as we buy this stuff almost every month.
And Dennis makes some comment inferring I don’t know what deflation means.
Dennis, there is a shortage of rig hands most everywhere. Maybe you should do a project where you go work in the oilfield for a few months.
Better yet, buy a small working interest. Having something at risk could really help your perspective.
I have found learning by doing is best most of the time.
shallow sand,
Sorry, didn’t mean to offend, dumb comment by me. I will just refrain from replies in the future.
No. Comment anytime.
We won’t always agree. But that’s ok.
They have to keep drilling Shallow Sand. It is a hamster wheel. The acquisition of the week was Civitas overpaying for Tap Rock and other NGP companies. All of these companies know damn well they can’t grow through the drill bit. I just drilled 3 wells in Eddy County last year. The AFEs we $7 million per well in 2021. In 2022 each we’ll cost $10 million dollars and my rate of return or MOIC ( Multiple of invested capital may end up being at most 2:1 and that’s because all of last year we enjoyed much higher prices and our wells were drilled in the core or the core. There is no way these wells can make money, pay back debt and pay dividends at current prices. No way!!! So…………they keep drilling to keep production flat and pay the bank or merely stay one step ahead of the bank. Sheffield said it all of last year and he is right. There will be marginal growth. The only operators drilling right now have private equity hoping to maintain production until prices get high enough to unload their “shitco” assets as we fondly call them in our industry for a “big pop” at the exit!
Mike,
Not a lecture, a question really, can you clarify your claim that 50% of revenue is coming from oil in the Permian? Certainly not the case for Pioneer in either the 1st quarter of 2022 or 2023, I checked the 10Q.
i’ll take Mike and the guys who actually do this for a living all day long for the forecasts….
That is a top five lesson I have learned from this site.
You need to have your D*CK ballz deep in the hole to figure it out. And even then YOU CANT
I think Dennis is doing his work honestly and academically.
He isn’t trying to rip anyone off.
Who gives a shit if someone disagrees with your forecast if they are being honest.
If Dennis was trying to sell you Life Insurance policies based on his forecasts than have at him…
But he is not a grifter as far as I can tell.
And he is far more pessimistic than the average worldwide citizen.
Dennis has admitted OVER and OVER again that he thinks his predictions will be wrong.
Jesus Christ!
Andre,
I agree, any forecast by an oil pro will be better than my forecast, which will be wrong every single time. Chances of being correct are zero and of being wrong 100%.
Ken,
Oh I see now, that is not very good data. A better Hubbert analysis of conventional oil gives a URR of 2500 Gb, cumulative production through 2022 is about 1425 Gb, so about 57% of conventional crude has been produced based on an HL analysis (which tends to underestimate URR). Laherrere has also used HL to estimate all crude (conventional and unconventional) in 2022 and got 3500 Gb as the result. Cumulative production to the end of 2022 for all crude is 1473 Gb, so we have produced 42% of the crude oil resource. The estimate for 2000 Gb of conventional crude is too low by at least 500 Gb. On the HL below I define conventional crude as all crude except extra heavy oil from Canada and Venezuela and US tight oil, the HL is based on data from 2000 to 2019. Also shown is all data from 1965 to 2019 with a power law fit on the 1965 to 2019 data, note the curve and the potential that the HL will flatten further over time, this is part of the reason that early estimates using the HL technique have tended to underestimate URR. For example an HL on 1985 to 1997 would give an HL of 1800 Gb, just as Campbell and Laherrere estimated back in 1998. This is the reason the HL method is flawed and will tend to underestimate URR. The USGS estimate of roughly 3000 Gb for conventional oil back in 2000 remains the gold standard.
Note that Laherrere’s own analysis in a peer reviewed paper in 2022 gives the same 2500 Gb URR result that I get for conventional crude oil.
See figure 6 at link below for net effect of unconventional on HL, it adds about 1000 Gb (increases from 2500 to 3500 Gb for URR from conventional only to all crude HL).
https://www.sciencedirect.com/science/article/pii/S2666049022000524?via=ihub
My estimate of conventional crude oil is 2800 Gb and I believe that is conservative, as of Dec 31,2022 we have produced 1425 of 2800 Gb or 51% of conventional crude (about half as I said.)
Realized Laherrere is doing conventional crude only without condensate, that is a hard number to find except for OPEC, difficult to confirm his analysis without access to data.
Building models based on URR is a blind sighted approach to the situation. There are way too many assumptions. For example reserve is now based on price. However that is a sloppy assumption. But once accepted and borrowed against it’s very hard to walk back. So reserve growth can easily increase but has tremendous pressure towards the up side not to decline. Which means that the speculative URR are probably as accurate as Saudis stated reserves which we all know is a lie.
The other problem is what is $70.00 really worth? When we see pipe prices that have more than doubled and labor shortages what $70.00 buys today isn’t what it did 10years ago. So withs costs escalating as they are presently you might as well trash the stated reserves at $70.00pb. And with it the URR.
The other feed back that is biting hard is affordability which is cutting into demand. People will choose food over mobility and already are making hard choices on discretionary spending and have cut back on buying other household items.
Without calculating all the above variables and simply speculating on URR is making my guess as good as yours and becomes like a dog chasing his own tail.
However geology is not constrained by price. It really is unconcerned about what is happening on the surface. It knows what can and can’t be done. It will gas out when it’s going to gas out.
So a double edge sword is at play. Just when the oil industry needs $100 per barrel to operate the economy needs $35 per barrel to restart. The overall slowdown is biting into manufacturing which is being under utilized driving up per unit pricing. At the same time depletion is driving up material costs exacerbated by high energy prices. Meanwhile the Fed who think the world runs on money is raising interest rates which also put downward pressure on prices that aren’t the result of inflation (which is a monetary problem) but rather a collapsing system losing economy of scale.
So getting back to the reason i posted this is using a Hubbert model was useful when oil prices were stable as they had been prior to 2005 now it’s pretty meaningless considering that since then prices have spiked to $140.00 and dropped to -$35.00. But that’s to be expected as the system contracts. It’s only going to get worse and what is stated will become less and less reliable as people adjust from reality to fantasy. The necessity to lie and to believe the lie will become the imperative of the political systems globally. All truth will be blocked and become the enemy of the state.
JT,
URR is a starting point for the analysis, we cannot produce oil that does not exist. The economics are tricky, but if we had good resource cost curves and make assumptions about what oil, NGL, and natural gas prices might balance the market we could make pretty good guesses about output. I don’t have the resource cost curve information, but it is out there at a price, I have no idea how accurate the cost curves are, the ones I have seen pop up on the internet seem far too low (costs are likely much higher than published in these estimates.)
OIl pros like shallow sand and Mike probably know the true costs, occasionally they hint at these and I take what information is revealed and information I can find from Novilabs, EIA, IEA, OPEC, IMF, World Bank, and BIS to make the best guesses I can come up with. They will be wrong 100% of the time.
Dennis
Besides Novilabs the rest of the sources are politically vested entities in promulgating the present business as usual economic system. Which is propaganda to insulate the public from reality. One way we know is the changing definitions of things. Very convenient. At one time we defined oil as crude but then c+c crude plus condensate. Then BOE barrel of oil equivalent. Just keep changing the definition and moving the goal post so you can always win. They did the same thing with the COVID vaccines. At one time a vaccine gave a person immunity from infection because it taught the immune system to recognize and combat infection. Now our definition is a vaccine prevents symptoms of disease. So evidently if you are symptom free you’re not sick or perhaps only in the head. Because if that’s true why test for anything. Simply treat the symptoms. I feel fine very very fine.
So my perspective is the crazy train left the station years ago. So most of the information is worthless but what’s not worthless is the fact diesel stocks are persistently low. Oil prices are stuck in an unacceptable range for consumers and producers. Prices are primarily rising in import dependent countries. And export countries are on the verge of deflation.
Think about it what is the common denominator?
Energy has become too expensive as a ratio of economic activity. So forget about $110-200.00 oil it isn’t going to happen which means EIA and IEA projections are rubbish. URR projections are rubbish. And people’s pensions are rubbish.
The first victim will be the global economy that will go into crisis. We will recognize the problem when governments start printing their way to oblivion because private debt can’t grow fast enough to maintain the money supply. The populations will more and more be dependent on government handouts and be employed in virtual work from a computer on their couch. Real trades and tradespeople will be in short supply and infrastructure will be in disrepair. It will be a very dark day.
Oh and by the way it was yesterday incase you didn’t notice.
JT,
C plus C has been used for defining crude oil in the US for at least the past 20 years. That is all I use, unfortunately OPEC and IEA focus on total liquids which is less useful.
And 20 before that? It’s to hide the problem Dennis no one wants truth. Just a comforting lie. Like technology will save us. Actually technology destroys us. We’re not an advanced civilization.Advance civilizations learn from the past. The past reveals that every civilization or economy eventually collapsed because of resource constraints. All mines are eventually shut in. The new green deal is actually a brown mining operation. Renewable repairable rebuildables are not recyclable. So the future of the new Green Deal will be very short lived and not to energetic.
JT,
Seems as far back as 1974 we were using C plus C data in the US see
https://www.eia.gov/totalenergy/data/monthly/archive/00357412.pdf
Document at link below gas data going back to 1947 for annual data, it is consistent with data currently at EIA for C plus C. See page 23 of document and note that where crude is reported separately from condensate (9 years from 1968 to 1976) the two columns add up to currently reported C C, for all other years crude plus condensate are reported together as crude oil.
https://www.eia.gov/totalenergy/data/annual/archive/AER 1977.pdf
Slight difference with current data reported for 1973, but only a 0.22% difference and it is not unusual for data to be revised slightly over time as data becomes more complete.
I don’t think it’s what you think. Prior to 1974 I dont have access to older monthly data, but from 1977 I have data going back to 1947 as published then (45 years ago).
Most people would work very hard to buy the essential stuff that comes from an oil barrel,
even at $150/barrel.
And $150 would be enough funding for sustaining oil production for quite some time (yes-purposely vague on the timeframe since I wouldn’t pretend to know the balance of the top ten factors affecting this equation).
At that kind of high price people would also think very hard about just what is essential. Some countries and families here in the US already operate at that level…they’ve got no fat to shed so to speak. Others do have quite a lot of fat to shed. And no, you really don’t need to put any gas in a lawnmower, eat bananas that came in boat from 1000 miles away, or go in an airplane. Ever, to survive.
And people will come to the realization that light vehicle transport with petrol energy is a very expensive waste of that energy and important chemistry.
Hickory, the counterintuitive conclusion is that a society that has a lot of fat is more resilient than a lean society. However, the fat society needs to learn to become lean fast enough to prevent pitchforks appearing on the streets.
Yes. Any country that undergoes a decline in access to energy, or the products that energy enables [petrol, electricity, food, industrial and manufactured goods, etc]
is under threat of internal tumult.
The tension between energy ‘haves’ and ‘havenots’ will likely become an even bigger and bigger story on the decline phase, than it was on the growth phase.
“…but if we had good resource cost curves and make assumptions about what oil, NGL, and natural gas prices might balance the market we could make pretty good guesses about output. I don’t have the resource cost curve information, but it is out there at a price..”
You sure could. And it is the right way to do it of course. Have you seen any sign that peak oilers are ever going to get together, pool their resources, and get it done the right way?
Oh yes, and this method works quite well for better guessing, and also does outstanding scenario modeling.
Reservegrowthrulz,
Unfortunately the information is quite opaque, in many cases even when this information is accessed it cannot be revealed in publications.
The publicly available information is not very good on resource costs.
Consider the cost curve shown in post below
https://www.spglobal.com/commodityinsights/en/ci/research-analysis/global-crude-oil-curve-shows-projects-break-even-through-2040.html
The claimed full cycle costs for the Permian basin in 2021, they show average costs for the Pemian basin at $45/bo, this is too low by at least 35/bo. It makes one wonder how they come up with these estimates.
You are correct, restrictions on publishing the data are substantial. But that doesn’t generally go for the results derived from the data and applicable system to process it. The results demonstrated in your link are completely inadequate for global work other than in the general sense, and don’t give a clue if the authors were limited to that level of resolution, or did it at the correct/best level for themselves and customers and then just aggregated it up for presentations.
And even if done right, averages are fairly worthless to someone using that level of data when putting together an output based on a model’s natural progression from more proftable top tier acreage to less profitable, let alone between plays-accumulations-basins. Maybe the authors have kept the higher resolution to themselves to sell the superior analytic results to their customers?
Thank you to Dennis who has been trying to make sense of incomplete data. In contrast,, I’ve been more recently interested in openly available climate data. With the high north Atlantic surface temperatures right now, one could ask is there any way to predict this from models incorporating historical data? May have to face the fact that even though this is likely a much more difficult physics and fluid dynamics problem than oil resource accounting, having free public data to analyze reduces the uncertainty in what we’re dealing with.
https://user-images.githubusercontent.com/2855758/222759233-6c536e15-94d8-416d-b7a5-406b1c21cfde.png
JT, sounds about right, however, kind of think the adjustment will be from fantasy to reality. Can’t remember the who, but “you can ignore reality, but you can’t ignore the consequences of reality”.
Dennis – Agree about uncertainty of URR, but what is undeniable is that we are 5+ years post peak, no matter how you dice it up. A future increase looks less and less likely, even in your revised charts from a year ago. My approach is to use a multiple lines of evidence to support the analysis. While there MAY be more than 2000 Gb, if it’s low quality/too expensive to produce – does it matter? Tight oil has played an important role in prolonging the plateau but is ending now. Eyeballing your graph above, I get ~2250 Gb or so. JT brings up important financial pressures that will weigh heavily on future production growth.
Once again cherry-picking the data to fit your needs, Laherrere is extremely clear on his analysis – I have no clue how you are able to continuously misinterpret his work, it’s astonishing.
I rest my case
Kengeo,
Yes I did not catch that he was using crude only rather than C plus C. Generally he has always focused on C C less extra heavy oil in the past.
I think focusing on HL estimates is a mistake, Laherrere’s estimates for C plus C less extra heavy oil and tight oil have gone from 1800 Gb in 1998 to 2500 Gb in 2022. I also use several different lines of analysis to inform my conclusions. I have conventional oil at 2800 Gb for URR and on a relative plateau from 2005 to 2030. Unconventional oil makes a big difference on whether output increases or decreases, in my view Laherrere’s estimate for LTO is far too low and an HL will not give an accurate estimate. His analysis of extra heavy oil is more optimistic than my analysis.
My conventional scenario has World conventional output increasing by 273 kb/d over the next 6 years, my guess is there will be plenty of conventinal output from OPEC big 4, Brazil, Argentina, and Guyana to accomplish this while also offsetting decline elsewhere in the World.
It will be interesting to see how close your analysis comes to actual output in the future. Can you clarify what you best guess is for total World C plus C output in 2028, mine is 84.22 Mb/d, in a recent chart you have your “most likely” estimate at about 67 Mbpd in 2028, is that the best guess estimate for World C plus C?
Dennis – Yes, 67 seems like a very reasonable number. For the life of me I can’t see a production value above 80. Even your estimate above shows conventional 3-4 mb/d below the 2016-2018 peak…
For 2028, I’ve formed the following outlook:
Best case scenario would be a loss of 1 mb/d each year, so roughly 76 mb/d
Optimistic range is 70-75 mb/d
What I call the most likely range, average production is 65-70 mb/d
The easiest way to think about it, is that the US will lose around 1 mb/d annually and rest of the world will lose at least 1 mb/d annually.
If US production can somehow manage to stay flat, then world production is only down ~5 mb/d from current level (this would be highly unlikely).
If decline is worse than 2-3 mb/d annually, then world production in 2028 will be lucky to be above 65 mb/d.
We can actually calculate 2028 production bases on Laherrere’s HL of crude.
From ~2025 to 2050, Laherrere has crude production cut in half.
This works out to an annual loss of 2.73%
Assuming conventional crude production is currently ~70 mb/d, then 2028 production would be ~6 mb/d less (64 mb/d).
Adding the remaining unconventional production brings the total back up to between 70 mb/d and 75 mb/d depending on decline.
I think the deck is stacked against us and a lowe production value will be reached by 2028 (likely sooner).
Soon 3/4 of the worlds high quality crude will be gone.
What mechanism do you have to delay the conventional oil decline by 5+ years?
I think you are counting conventional oil that is simply not there…
Peak conventional crude was all the way back in 2007, or at best 10 years later.
You also over estimate the covid savings, it was only around 3-4 months of production that was saved…
Kengeo,
Thanks for the extensive explanation of your view. So to boil it down to a single number that you believe has 50/50 odds that output will either be above or below that level for annual average output in 2029 for World C plus C production (both conventional and unconventional), I think that would be somewhere in the 65 to 70 Mb/d range with perhaps the best guess being 67.5 Mb/d? This makes it easy to compare with my 84.2 Mb/d estimate for 2028 when we get to April 2029 and have the actual data. In 2016 when conventional oil was at is peak of 73.4 Mb/d, unconventional output was 7.6 Mb/d, in 2028 when I expect conventional out put will be 70.4 Mb/d, I expect unconventional output will be about 13.8 Mb/d, conventional output will be 3 Mb/d less than at its peak, but unconventional will be 6.2 Mb/d higher than the conventional peak year of 2016.
Also for further probabilities from my perspective I would have a 50% probability that output is higher than 84.2 in 2028 and a 50% probability it is lower, I would say roughly 33% probability it is less than 84.2 and more than 75 Mb/d and about a 15% probability output is between 65 and 75 Mb/d, the probability that output will be less than 65 Mb/d in 2028 I would estimate at about 2%. I just realized you have a 70 to 75 Mb/d interval (you call this optimistic) and a more likely 65 to 70 Mb/d interval, I would put the probability that 2028 output falls in your optimistic interval (70-75 Mb/d) about 10% and in the more likely interval (65 to 70 Mb/d) about 5%.
Here’s my breakdown (a WAG ~67, no sophisticated graphs needed):
Don’t think we’ll need to wait that long, trend will become clear by late next year (so I think we can call it early 2025 and we will know).
Either production is >80 or it’s not, once the plateau ends it will be easy to tell.
>80 is <1%
75-80 is <9%
70-75 is ~20%
65-70 is ~40%
60-65 is ~20%
<60 us ~10%
Here's another way to think about this, imagine a cylindrical tank that at one point long ago held all crude oil that ever existed, that tank would have the following dimensions:
Slightly over a kilometer tall, with a diameter of 20 km.
Right now the height of oil in the tank is 310 meters and falling at a rate of almost 20 meters per year.
If we could keep pumping it at the same rate, it has only 15 years of supply, fortunately the rate is going to drop somewhat rapidly, this way we can stretch out the life of remaining oil.
Action should have been taken 20-30 years ago since the experts knew, but time was squandered and we ended up here.
We should revisit our estimates in 6 months and see which way the wind is blowing…
Kengeo,
I agree that by 2025 our estimates are quite different, yours perhaps 74 Mb/d for best guess estimate of annual average World C plus C output in 2025, and my best guess is about 83 Mb/d for average World C plus C output in 2025 (2022 output was about 81 Mb/d). You seem to be expecting about a 2 Mb/d decrease in output each year (79, 77, 75 for 2023 to 2025), my guess is (82, 83, 83 for 2023 to 2025) so we will see a difference by April 2024 when we have annual average output for the World for 2023 from the EIA.
It will be interesting to see what happens. The most recent 12 month average is about 81 Mb/d, but the last 3 months have averaged about 82 Mb/d. Maybe you can update your guesses for 2023 to 2025 most likely average annual World C plus C output, I may have gotten them wrong.
As many have observed the peak year moves to the future as URR keeps increasing somewhat. In this graph the peak year is plotted as a function of the year the prediction is made. When the graph crosses the diagonal the peak year is in the past. But future is unpredictable, as we all know.
Interesting way to think about it except for the fact that the official pandemic start was January 10, 2020.
Kengeo,
Chart from Laherrere at al 2022 paper (link below)
https://www.sciencedirect.com/science/article/pii/S2666049022000524?via=ihub#s0050
Note that for World HL they choose 2007-2019 data, when I use that same range of Data for World C plus C less XH less LTO, I get a URR of 2500 Gb, the same value they use in Table 1 in the paper.
Sir, UAE graph for its mostly empty field showed three seperate linerizations…one conventional, one secondary, last for the 10% left when fell off a cliff.
Watkins is at it again
Very nice summary of the situation
https://consciousnessofsheep.co.uk/2023/06/21/bitter-fruit/
His references are worth mining plus I enjoy his writing style.
US shale’s muted reply to OPEC oil cuts to limit supply, executive says
HOUSTON, June 21 (Reuters) – Muted increases in U.S. oil production and cuts by the OPEC producing-nations group will limit crude supply in the months ahead, pushing up prices, an executive at U.S. shale producer EOG Resources (EOG.N) said on Wednesday.
U.S. energy firms have cut domestic oil and gas drilling activity to the lowest level since April 2022 with declines from Texas to Pennsylvania. Analysts expect further cuts this year with oil and gas prices off from last year’s strong levels.
U.S. oil production growth will rise only 1.3% to 12.77 million barrels per day next year, after a 6.1% gain this year, according to estimates from the U.S. Energy Information Administration. Output from the top shale region, the Permian Basin of Texas and New Mexico, has also been waning.
Italics mine.
Maybe the penny has dropped with these oil executives and they have decided it is best to support OPEC by slowly reducing rig and frac spread count.
Also note that WTI is down $3/b this morning with US inventory down 3.8 M barrels, weekly production down by 200 kb/d to 12,200 kb/d, product supplied at 20,925 vs 19,800 last year and gasoline at 9,375 kb/d vs 8,700 kb/d last year. Something is wrong with this picture. Is it too much world oil or just a poor economy?
https://www.reuters.com/markets/commodities/us-shales-muted-reply-opec-oil-cuts-limit-supply-executive-says-2023-06-21/?rpc=401&
Ovi –
Another solid line of evidence, I said it last year and I’ll say it again, it will be impressive if shale production can maintain current levels (looking at past year, shale growth has been unimpressive, specially considering the high oil prices). More likely it will decline quickly…
Saudi played the US as suckers, got us to overproduce our LTO supplies and now we’re helpless to their market manipulations…
I met a Saudi guy who explained all this to me back in 2013…didn’t believe him at the time but now I do!
Dennis – Take another look at page 31, you’ll see HL for NGPL, condensate, XH, and LTO.
Percent remaining based on his analysis:
NGPL – 75%
LTO – 46%
XH – 40%
condensate – 38%
The shale revolution had a 4-5 year ramp up, a ~4 year plateau and the ramp down will be ~5 years
Kengeo,
Laherrere’s estimates for tight oil are far too low as I have said. He estimates LTO URR at 35 Gb, 2P reserves plus cumulative production is roughly 65 Gb, with further reserve growth my best guess for LTO URR is 80 Gb. Also the extra heavy oil estimate is 62 Gb, quite low considering there are at least 200 Gb of reserves.
He says on page 32
The sum of the 5 ultimates is 330+80+16+10+7 =443 km3 when the HL of all oil is rather 600 km3, showing the uncertainty of the estimates. But the HL for crude oil is rather of fair quality and it is for NGPL and extra-heavy that ultimates should be increased.
I agree the estimates are quite uncertain and would also note the HL estimate for all crude plus condensate is about 560 cubic kilometers (or 560 billion cubic meters) or 3500 Gb. So far about 1470 Gb has been produced (so 58% remaining)
US shale’s muted reply to OPEC oil cuts to limit supply, executive says
HOUSTON, June 21 (Reuters) – Muted increases in U.S. oil production and cuts by the OPEC+ producing-nations group will limit crude supply in the months ahead, pushing up prices, an executive at U.S. shale producer EOG Resources (EOG.N) said on Wednesday.
U.S. energy firms have cut domestic oil and gas drilling activity to the lowest level since April 2022 with declines from Texas to Pennsylvania. Analysts expect further cuts this year with oil and gas prices off from last year’s strong levels.
“We’re a short term away from seeing the market tighten even further,” EOG’s chief operating officer, Lloyd Helms, said at a JP Morgan energy conference. “We are more constructive on where oil prices could go.”
U.S. natural gas prices also could be supported this year by fewer drilling rigs in shale-gas basins at a time when liquefied natural gas (LNG) demand is expected to peak, Helms said.
Mr. Patterson,
The entire transcript from Billy Helms’ talk at the JP Morgan conference is about a 10 minute read and provides much interesting, relevant info on the state of both EOG and the wider hydrocarbon world.
Particularly informative is his perspective on the Mowry, (Powder River Basin), the Ohio Utica, and their huge Dorado gas play (21 Tcf recoverable, according to them).
Well worth the time getting the views of the COO from the most successful unconventional upstream company, even in the chest thumping atmosphere prevalent at these investor oriented affairs.
Thanks, Coffeeguyzz. However, I could not find a link on the link I provided. Can you post it? I would love to read it
Mr. Patterson,
The Seeking Alpha site has the full transcript posted.
“getting the views of the COO from the most successful unconventional upstream company,”
I suppose you mean success at volume of produced hydrocarbons?
Certainly not in stock price which is ever so slightly lower than it was this week 9 years ago.
[I do realize they have thrown off some dividends along the way]
Hickory,
EOG can be considered an exceptionally successful upstream operator in many ways.
They claim to have almost $6 billion cash balance with under $4 billion in net debt.
They have an incredibly long runway of very low cost (to D&C) wells in the Bakken, Eagle Ford, Powder River Basin, and the Permian, along with early development of the so called Dorado dry gas play and now the very surprising (re)entry into the northeast, specifically the oil window in the Ohio Utica.
EOG is regarded as possibly the most technologically advanced operator in the market today.
In retrospect my comment about the poor stock performance was irrelevant.
The whole sector has pretty much done poorly due to being too successful at supplying the market with product, and stock performance is but one measure of a company.
Your point is well taken.
IEA: U.S. TO “DOMINATE” GLOBAL OIL PRODUCTION EXPANSION AMID SLOWING DEMAND GROWTH
The United States is poised to dominate global oil supply despite an expected slowing down of global demand, meaning that U.S. oil production has a sound and prosperous future, according to a recent International Energy Agency report.
The new report, which provides a medium-term outlook of the “evolving oil supply and demand dynamics through to 2028”, forecasts a slowdown in global oil demand as the result of multiple trends: post-COVID economic recovery, Russian invasion of Ukraine, and an accelerated energy transition towards renewables and other low-carbon sources.
However, the report also highlights how supply growth is concentrated in the Americas, including the United States, Brazil and Guyana, representing more than 80 percent of the growth through this period.
Growth in Global Oil Demand to Slow Down
While the IEA touts the idea of “peak oil” demand by 2028, due to clean energy accelerating faster than investments in fossil fuels, this wouldn’t be the first time an organization or outlook predicts peak oil demand. Throughout history – from when President Jimmy Carter announced to the world in 1978 that the world was running out of oil to pre-Shale Revolution theories that oil had peaked – several have forecast that the world has reached (or will soon reach) its peak oil production and demand, but none of these predictions have come true.
That’s about half of this article. Click on blue link above to read the rest of it. The chart below is part of the article.
I do not believe that US production will increase by 2.6 million barrels per day by 2028. But I do believe world oil production in the rest of the world will be lower in 2028 than it was in 2022.
Thanks Ron, also this link directly from the IEA site, dated 14 June 2023
https://www.iea.org/news/growth-in-global-oil-demand-is-set-to-slow-significantly-by-2028
Ron,
Keep in mind this is total liquids. From 2010 to 2022 US liquids growth averaged about 880 kb/d (this includes NGL and biofuel). For C plus C over the same period annual growth was about 535 kb/d, so other liquids growth was about 40% of total liquids growth (345 kb/d). Scale on chart is Mb/d. Chart includes the recent STEO estimate for the US from 2023 to 2024 with output increasing from 20.67 for 2022Q4 to 21.94 Mb/d for 2024Q4, and increase of 1270 kb/d over 2 years or an average rate of increase of 635 kb/d per year. Three more years at that rate of increase would be 3175 kb/d over 5 years, so the 2600 kb/d increase seems reasonable for total liquids.
Dennis –
Here’s a more detailed analysis for my decline (worse case) scenario:
Total:
2023 – ~78-80 mb/d+
2024 – 78 mb/d [-3.0 from 2022 level]
2025 – 74 mb/d [-7.0 from 2022 level] (UK runs out; -1 mb/d)
2026 – 72 mb/d [-9.0 from 2022 level] (Mexico runs out; -~2 mb/d)
2027 – 70 mb/d [-11.0 from 2022 level] (Nigeria and Angola run out; -3 mb/d)
2028 – 65 mb/d [-16.0 from 2022 level] (Norway runs out; -~2 mb/d / misc. OPEC run out; -1 mb/d)
OPEC:
2024 -2.0 mb/d decline from 2022 levels
2025 -5.0 mb/d decline from 2022 levels
2026 -6.0 mb/d decline from 2022 levels
2027 -7.0 mb/d decline from 2022 levels
2028 -9.0 mb/d decline from 2022 levels
Non-OPEC:
2024 -1.0 mb/d decline from 2022 levels
2025 -2.0 mb/d decline from 2022 levels
2026 -3.0 mb/d decline from 2022 levels
2027 -4.0 mb/d decline from 2022 levels
2028 -7.0 mb/d decline from 2022 levels
Pay attention to these 15 countries…
Some additional analysis:
Peak for this group of 15 was 2002, excluding the outliers brings peak to 2008.
>80% of the countries fit a peak of 2010 /- 10 years.
If the 2002 peak is considered, significant decline is currently underway.
Here’s the rest (excluding LTO):
Putting it all together:
Excluding LTO, the group of 15 will be 35 mb/d +/- 5 in 2030.
Others will be 28 mb/d +/-5 in 2030.
Best case is 73 + LTO in 2030. Adding LTO = 10 we get 83 mb/d in 2030, flat from ~2019.
Worst case is 53 + LTO in 2030. Adding LTO = 10 we get 63 mb/d in 2030, down ~20 from ~2019.
Middle case is 63 + LTO in 2030. Adding LTO = 10 we get 73 mb/d in 2030, down ~10 from ~2019.
Pessimists will focus on the low 60s, optimists will focus on the mid 70s and overly optimistic will see 80s…
I guess I put myself in the pessimist group, hopefully it wont be that bad though…
Kengeo,
What is your best guess estimate (for each year from 2023 to 2028) for average annual World C plus C output. You gave me your worst case estimate, but the most interesting estimate to me is the best guess which is define as the guess that you believe has a 50/50 chance of being either too low or too high.
It seems on the last chart you posted with your predictions, the “worst case” was the most likely case which would be your best guess. Just realized this now sorry, so you have already given your best guess estimates.
So from 2023 we have 79, 78, 74, 72, 70, and 65 Mb/d up to 2028 for your best guesses vs 82, 82, 83, 84, 84, and 84 for my best guesses from 2023 to 2028. By April 2024 it will be pretty clear who is on the right track, but will become clearer over time.
Kengeo,
The best guess projections compared in a chart for average annual World C plus C output.
The average world C+C production for 2022 was 80,753 K bpd. The peak was in November at 82,161 K bpd. I would not guess the average C+C for 2023, but I will say that December 2023 production will be well below December 2022 production of 81,773 K bpd.
Ron,
I focus on yearly average, can you define what you mean by well below, how about a numerical best guess? My guess for 2023 average is 81.68 Mb/d, I rounded to nearest Mb/d as Kengeo did in his estimates so 81.68 becomes 82. Could be that Dec 2022 is less than Dec 2021 and average annual output remains over 81.51 Mb/d (which would round to 82 Mb/d), I don’t think any single month’s output is very important.
Dennis, I am guessing that December 2023 C+C production will be below 80,000 kbpd. I won’t guess just how far below, however. December production alone is not that important. It will be that low because that will be the general direction of production. November and January production will both be pretty close to December production.
Production in December could be as high as 80,500 kbpd, but I think it will definitely be below December 2022, and the production level, heading into 2024 will look much more pessimistic than it does right now.
Ron,
STEO has World C plus C at roughly 81.9 Mb/d in Dec 2023, my best guess is similar. I expect supply will be tight the last half of 2023 and oil prices may be rising, after a relatively flat 2023 for World C plus C, higher oil and natural gas prices might lead to increased output in 2024 about a 700 kb/d increase an average annual output in 2024 above the average annual level in 2023 (my best guess for 2023 is 81.7 Mb/d).
Kengeo,
What are those curves you are using, parabolas fit to the data? A logistic is not perfect but is far more reasonable than a parabola. Note also that 2PC estimates will tend to underestimate eventual output, this is a mistake Laherrere has been making since 1998. The best guess estimates of petroleum engineers get consistently revised higher over time, this is why 2P reserves have tended to grow over time. Ignoring reserve growth will lead to underestimates of resources. Laherrere’s estimate for conventional C plus C was 1800 Gb in 1998, today it is 2500 Gb. In 2000 the USGS estimated World conventional C plus C resources at 3000 Gb, this remains the gold standard.
A video of Doomsberg , Anas Analhajji , Adam Rozencawjg ,and Yra Harris on energy markets ,
https://www.youtube.com/watch?v=nDYtMvf0aKI&t=2116s
Rig and Frac report for week ending June 23
The rig count continues to drop while the frac count reverses and increases.
The Hz rig count dropped by 2 to 496 and is down 76 from the high of 76 in November 2022. In late November 2022, Oklahoma had 69 operational rigs. In the week ending June 23 Oklahoma has 38 operational rigs, a drop of 31. So of the total drop of 76 rigs, 40% of the drop occurred in Oklahoma. The biggest rig drop since January has occurred in Texas, 37, 47%.
The frac count has rebound by 21 since the low of 256 in the week ending June 2. In the week ending June 23, the frac count increased by 9 to 277.
Thank you Ovi for keeping us updated. It looks like the average frac spread count in 2022 was pretty close to the current level, can you confirm that guess? Also for the Permian what was the average horizontal oil rig count from July 1, 2022 to Dec 31, 2022 compared to current level? Seems most of the drop in Texas horizontal oil rigs has been in the Eagle Ford/Austin Chalk.
Dennis
The average number of frac counts for 2022 was 280, very close to the current count of 277.
Attached is a chart that breaks down the rig count for the Permian and Eagle Ford. The recent drop is a mix from the Tx Permian and the Eagle Ford, with the bigger drop in the Tx Permian.
The average number of rigs in the Permian in the last half of 2022 was 326 close to the current count of 323. As you can see, it is the Texas Permian that is dropping. The New Mexico Permian has been fairly steady at 100 ± 4.
I found this interesting
https://blog.gorozen.com/blog/hubberts-peak-is-finally-here
Perhaps it’s been discussed….. I didn’t have time to scan the feed to note if it had been or not.
Mr B– The Honest Sorcerer latest post . The Specter of Peak Oil . 8 minutes read .
https://thehonestsorcerer.medium.com/the-spectre-of-peak-oil-part-1-4c677eea93ce
“India’s rising imports of Russian oil hit a record high of about 1.95 million barrels per day (bpd) in May denting purchases from Iraq and Saudi Arabia fell, tanker data from trade and industry sources showed. India, the world’s third biggest oil consumer and importer, buys more than 80% of its oil from overseas markets.”
New posts are up
https://peakoilbarrel.com/steo-and-tight-oil-update-june-2023/
and
https://peakoilbarrel.com/open-thread-non-petroleum-june-26-2023/