By Ovi
All of the Crude plus Condensate (C + C) production data for the US state charts comes from the EIAʼs Petroleum Supply monthly PSM which provides updated production information up to September 2025.
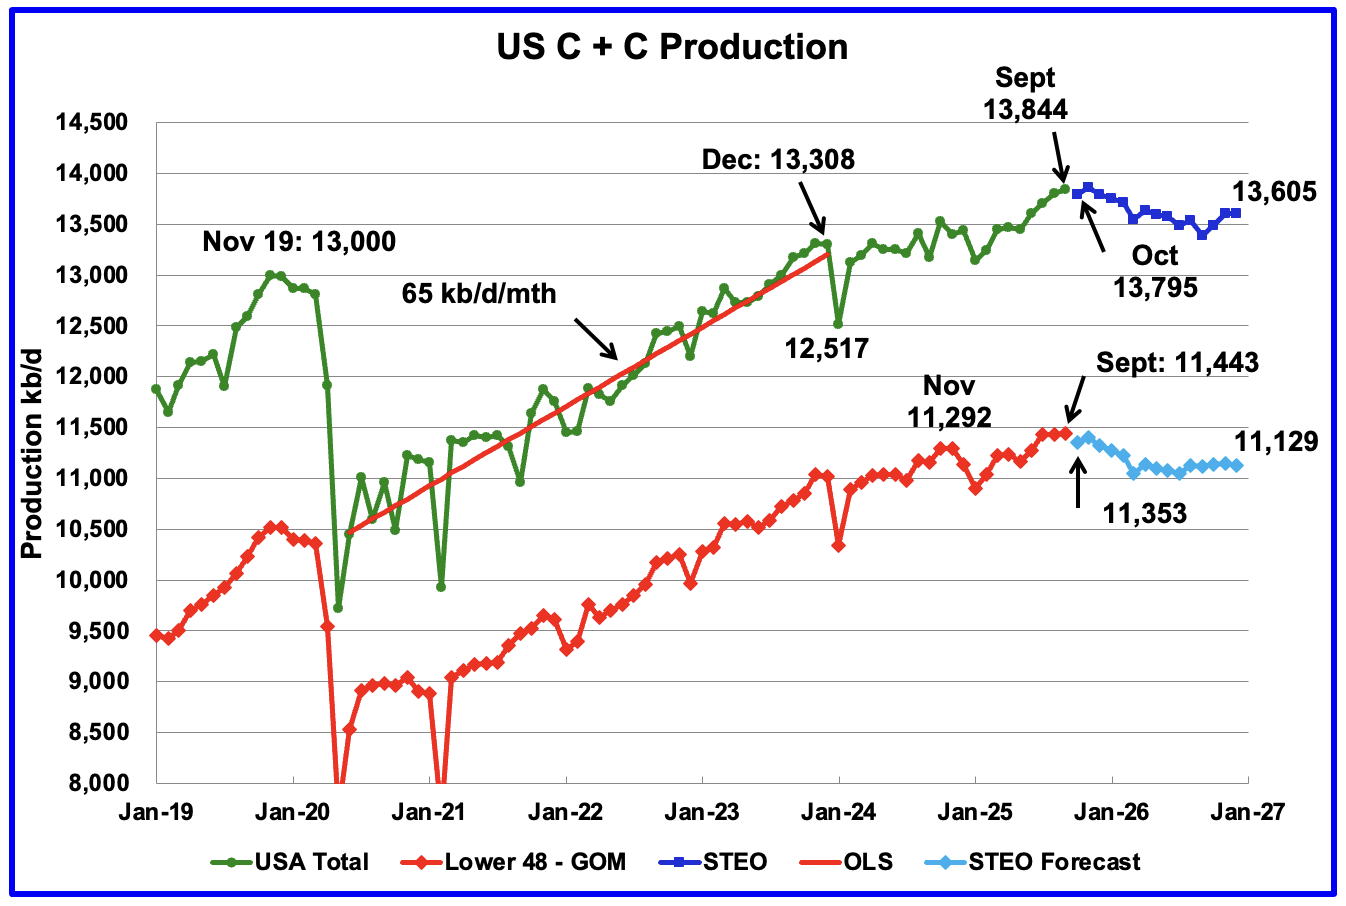
U.S. September oil production increased by 44 kb/d to 13,844 kb/d, another new record high. The largest increases came from Alaska and New Mexico. The November STEO forecast for October production is a drop to 13,795 kb/d. It should be noted that the November STEO under estimated September production by 59 kb/d.
The dark blue graph, taken from the November 2025 STEO, is the U.S. oil production forecast from October 2025 to December 2026. Output for December 2026 is expected to drop to 13,605 kb/d. From September 2025 to December 2026 U.S. oil production is expected to drop by 239 kb/d.
Note the almost flat production in the Onshore L48 for July, August and September, 11,437 kb/d, 11,432 kb/d and 11,443 kb/d respectively, red graph. The difference between the 44 kb/d increase in the overall US production vs the almost flat production in the Onshore L48 is the 31 kb/d increase from Alaska.
The light blue graph is the STEO’s forecast for the Onshore L48 output to December 2026. From September 2025 to December 2026 production is expected to decrease by 314 kb/d to 11,129 kb/d.
U.S. Oil Production Ranked by State
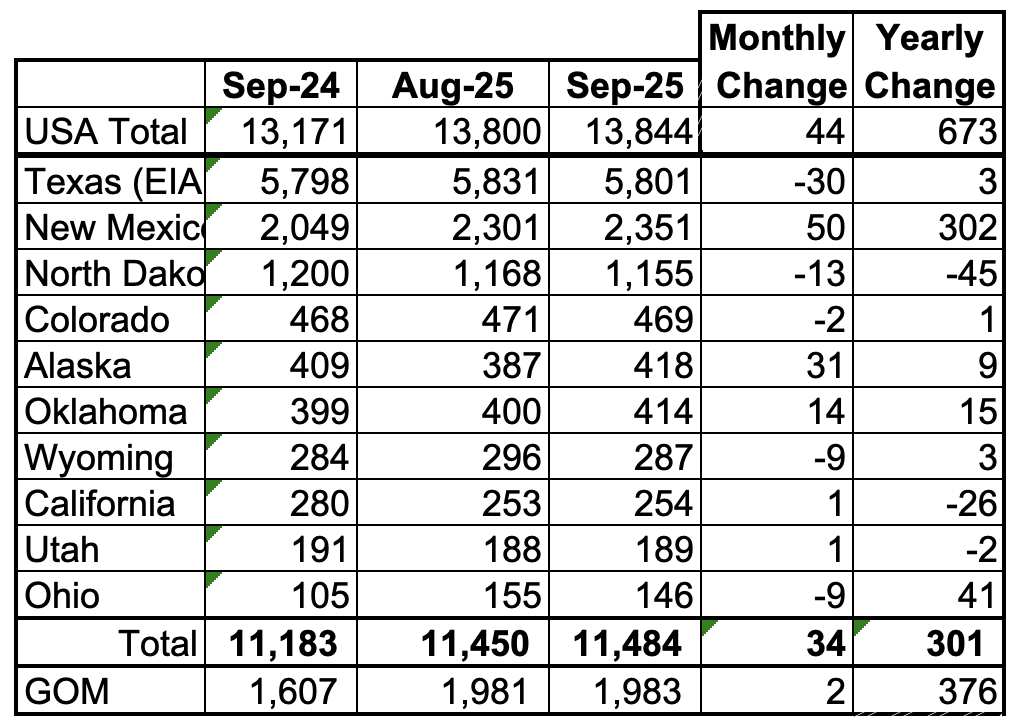
Listed above are the 10 US states with the largest oil production along with the Gulf of Mexico.
These 10 states accounted for 83% of all U.S. oil production out of a total production of 13,844 kb/d in September 2025. On a MoM basis, September oil production in these 10 states rose by 34 kb/d. On a YoY basis, US production increased by 673 kb/d with the biggest contributors being New Mexico and the GOM.
State Oil Production Charts
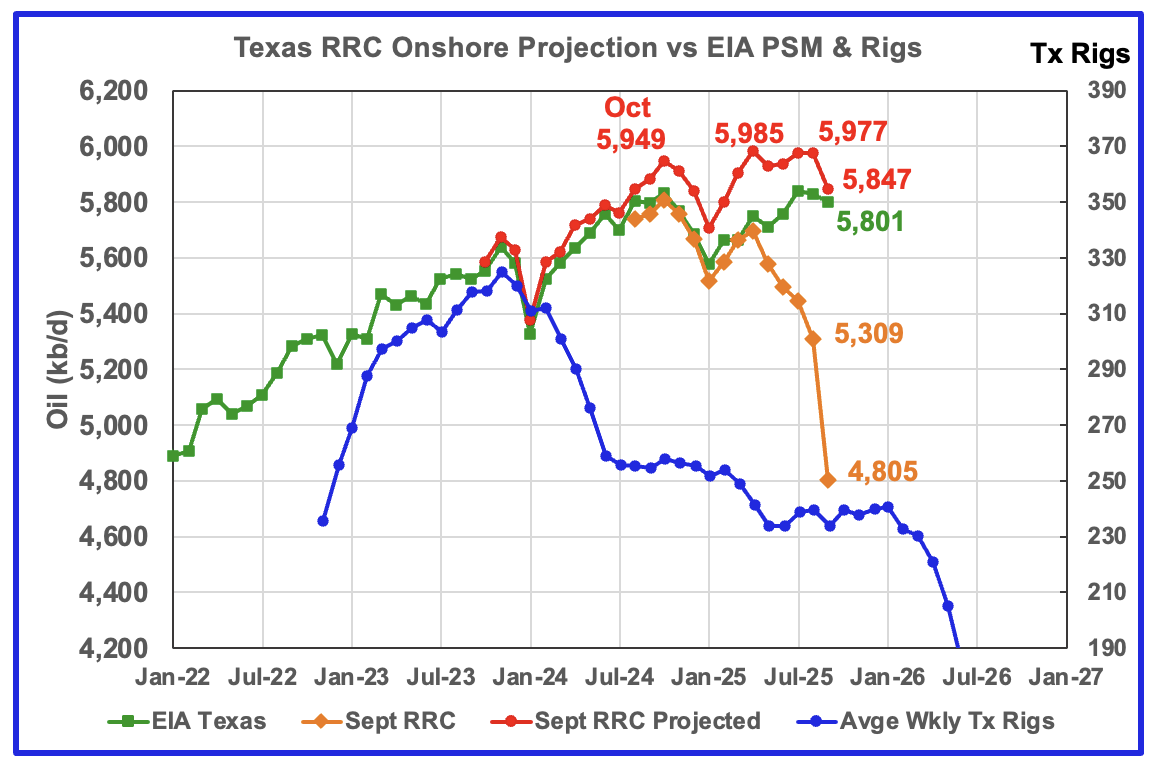
September’s production decreased by 30 kb/d to 5,801 kb/d according to the EIA.
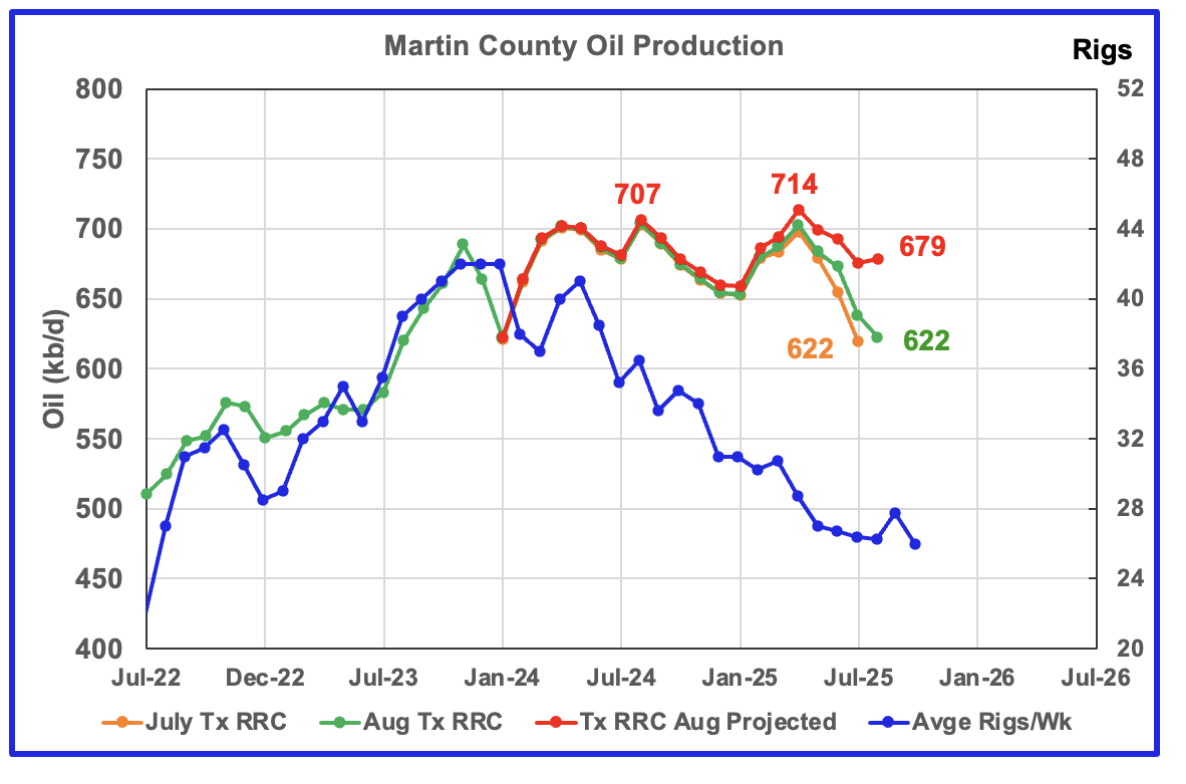
Texas production has rebounded since the weather related January 2025 drop. The EIA’s September production is essentially the same as September 2024, 5801 kb/d vs 5,798 kb/d. The point to note here is both the production projection and the EIA’s production are going in the same direction from January 2024 to August 2025 and both are indicating that Texas is entering a plateau phase.
The September projection deviates from the EIA’s because MoM corrections start in July 2023 which result in an overly optimistic projection. Texas’ RRC initial September production is lower than normal which accounts for the large September production drop. Texas’ RRC initial production for September dropped by 501 kb/d to 4,805. A more typical month end drop is 350 kb/d. It is not clear if the large drop is due to a Texas RRC processing delay or a real production drop.
The red graph is a production projection using the August and September Texas RRC data. The projection trend follows the EIA’s production up to August but not for September due to the September initially large 501 kb/d production drop. The four peaks in the projected graph starting in October 2024 indicates that Texas production is close to peaking.
The blue graph shows the average number of weekly rigs reported for each month shifted forward by 10 months. So the 276 rigs operating in July 2023 have been shifted forward to May 2024. From February 2024 to July 2024, the rig count dropped from 312 in time shifted February 2024 to 256 in July 2024. That drop of 56 rigs had no impact on production up to October 2024 but November was the first month when the impact of the rig drop on oil production started to show up along with fewer completions.
The rising production after January 2025 is difficult to explain considering the continuing drop in the rig count.
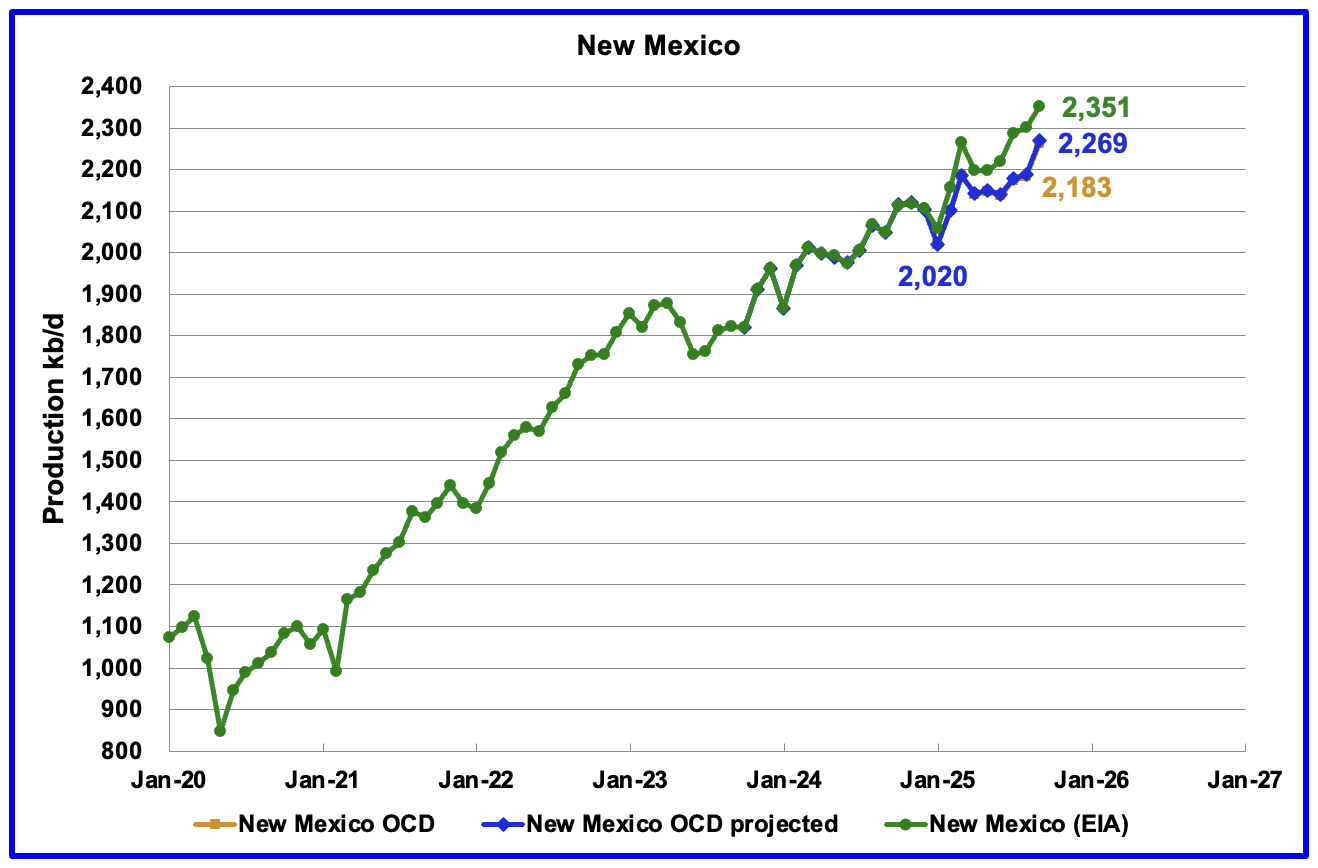
According to the EIA, New Mexico’s September production rose by 50 kb/d to 2,351 kb/d, a new high. YoY production rose by 302 kb/d, the biggest contributor to overall rising US production.
The blue graph is the projected output for September. The September production projection increased by 80 kb/d to 2,269 kb/d, of which 78 kb/d is from the OCD’s preliminary production.
Eddy county accounts for 60 kb/d of the projected increase of 80 kb/d and is discussed further in the Permian section below.
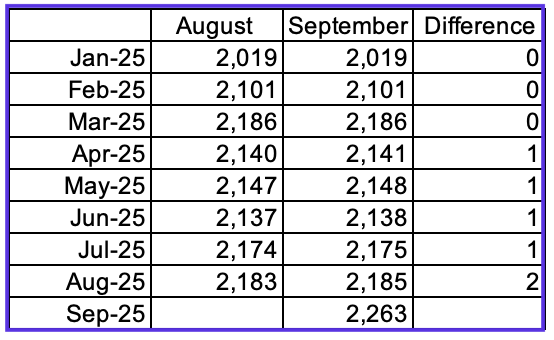
This table compares the NM OCD production reports for August and September. Note there are no production revisions for January to March and only a 1 kb/d revision for the months April to July. Since the September revisions to the August data are small to nothing, this implies that the production information from the NM OCD is more up to date than that provided by the EIA.
In 2024, from May to September, the EIA over estimated NM production by an average of 30 kb/d, with a high of 40 kb/d and a low of 21 kb/d. In August 2025, the EIA revised its 2024 production numbers to be consistent those reported by the NM OCD. For August 2025, the EIA’s reported production is 2,301 kb/d. The NM OCD is reporting 2,185 kb/d, lower by 116 kb/d.
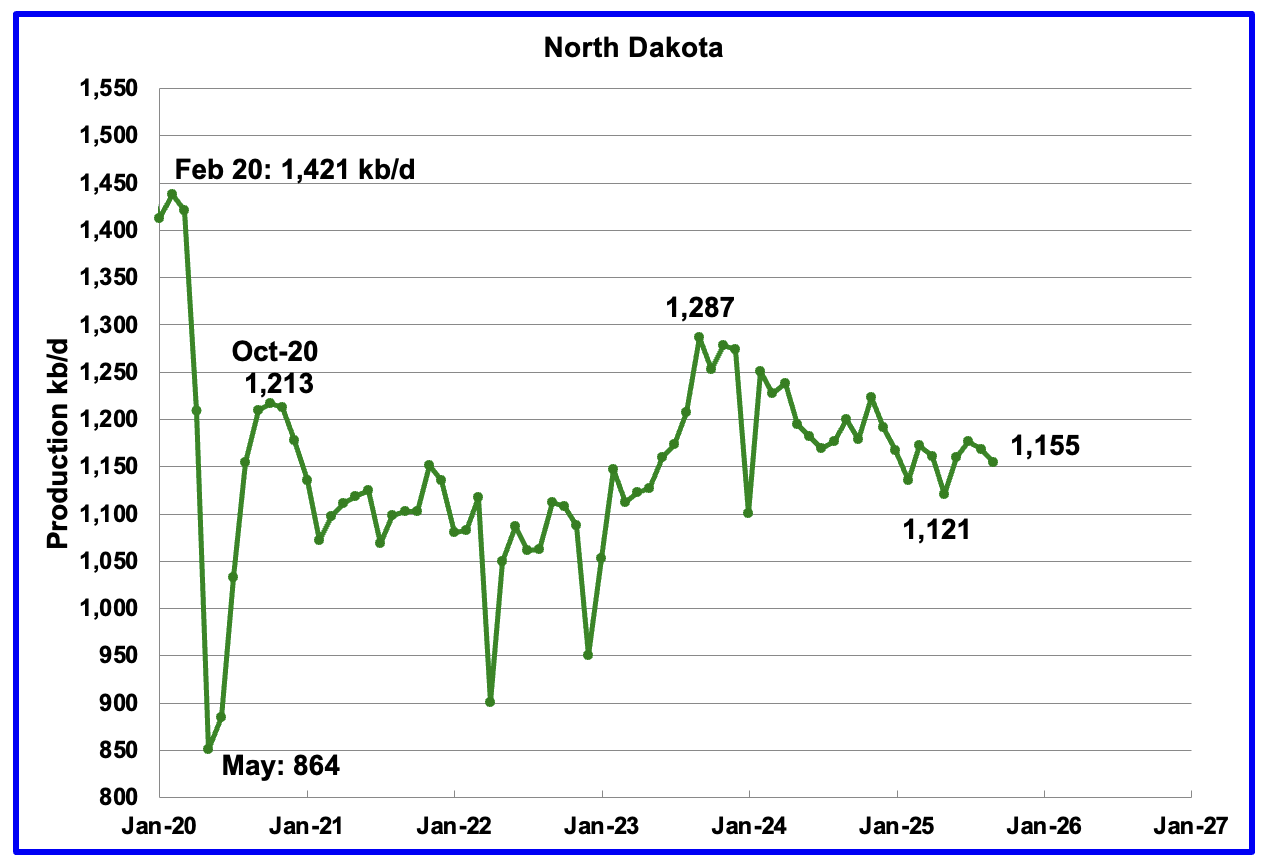
September’s output dropped by 13 kb/d to 1,155 kb/d. Production is down 132 kb/d from the post pandemic peak of 1,287 kb/d.
The North Dakota Department of Mineral resources reported September production was down 5 kb/d to 1,166 kb/d, which is close to the EIA’s estimate.
According to this Article, while oil production is down, NG is rising.
BISMARCK – North Dakota reached an all-time high in daily natural gas production in September, according to Nathan Anderson, director of the North Dakota Department of Mineral Resources.
Anderson said Friday, in the monthly oil and gas production report, the state produced 3.58 billion cubic feet (BCF) of natural gas a day.This was an increase of 1.27% from August to September.
Oil production was down slightly in September, with 1.165 barrels of oil a day produced or a 0.43% decrease from August to September. However, it was 1.38% above the revenue forecast.
Currently, 28 rigs are actively working in North Dakota.
North Dakota’s market oil price averaged $56.69 a barrel in September, which was 3.9% below the revenue forecast. Currently, West Texas Intermediate oil is selling for $59 a barrel.
Ten frac crews are working in the N.D. oil field, according to the report.
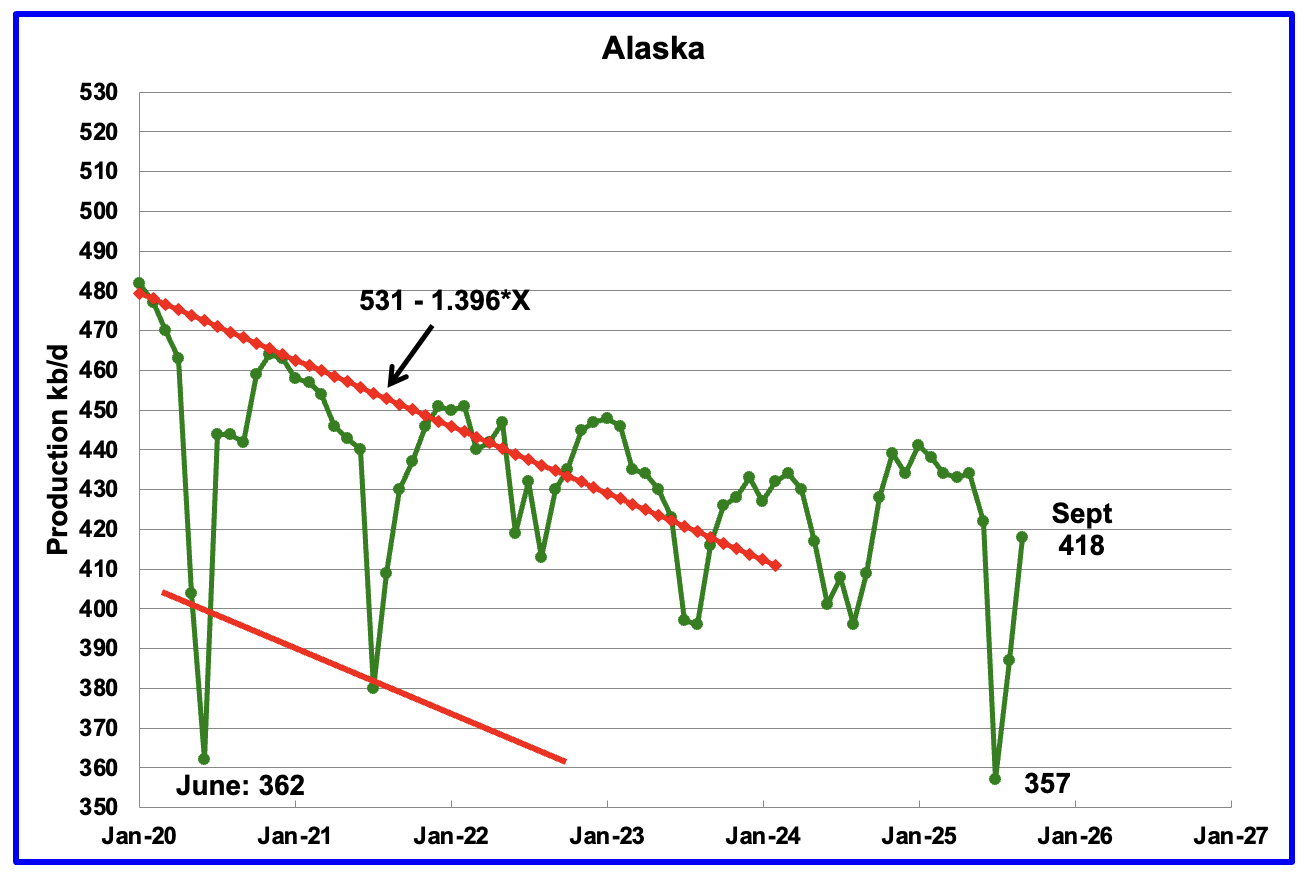
Alaskaʼs September output rose by 31 kb/d to 418 kb/d while YoY production increased by 9 kb/d. The EIA’s weekly September reports indicated that September production would rise and would average close to 416 kb/d. Production from the weekly reports for October and November continues to be in the 430 kb/d to 435 kb/d range, showing little growth beyond September.
Alaska has recently brought new fields online to consistently have flat YoY and monthly production gains which have broken away from the earlier dropping production red trend lines.
In early 2026 the Alaska Picca field is expected to come online. At its peak, Pikka could produce up to 80 kb/d from 45 wells. The production expected from these projects may be enough to flip Alaska oil production into a steady growth period. Also waiting in the wings is the Willow project which is projecting first oil in 2029 with a peak rate of 180 kb/d.
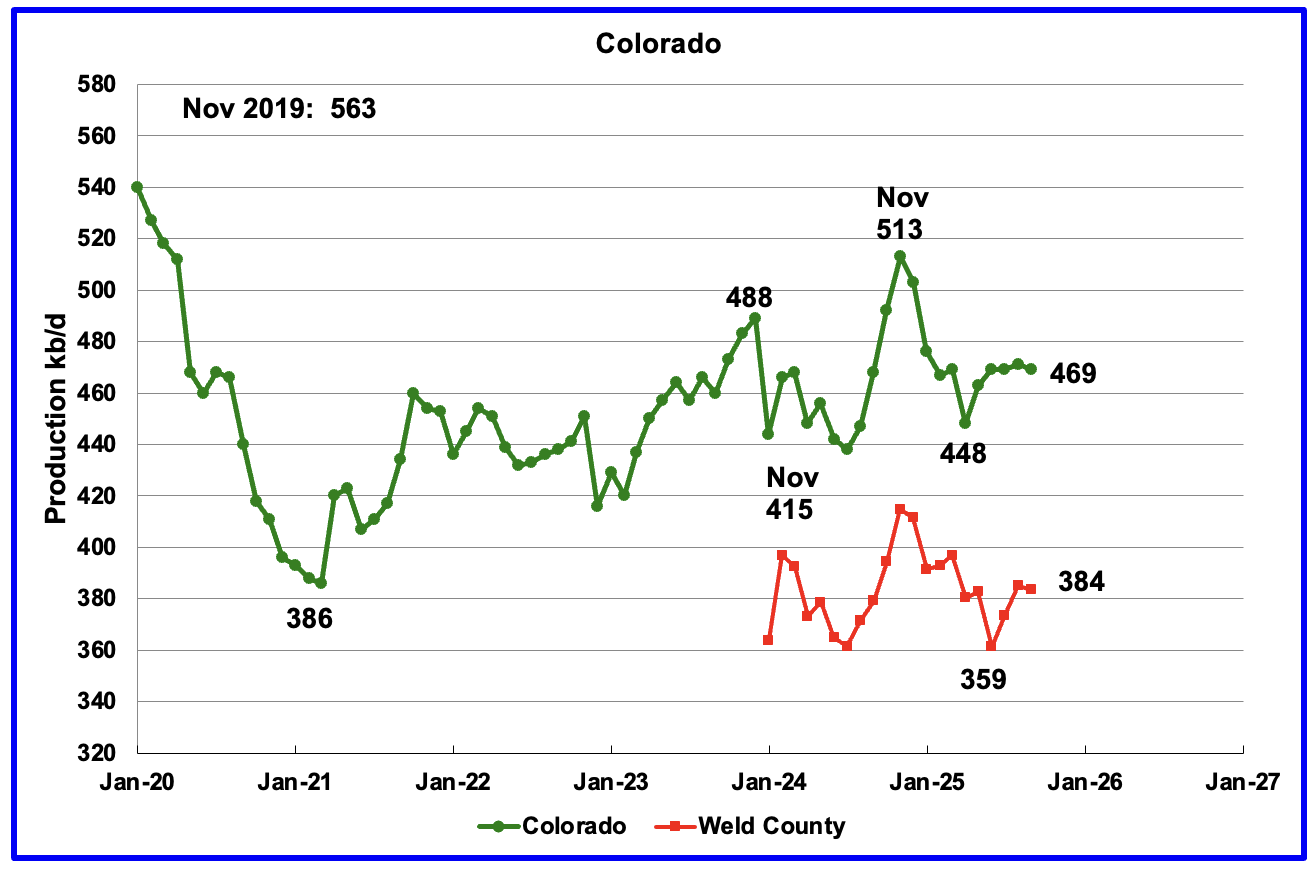
Coloradoʼs September oil production dropped by 2 kb/d to 469 kb/d.
The biggest oil producing county in Colorado is Weld County and its production has been added to the chart. The two graphs have been almost parallel since January 2024 but diverged over the last two months. Weld’s production dropped by 1 kb/d in September to 384 kb/d.
Colorado began 2025 with 6 rigs in January and February and peaked at 11 in October. At the end of November 9 rigs were operational..
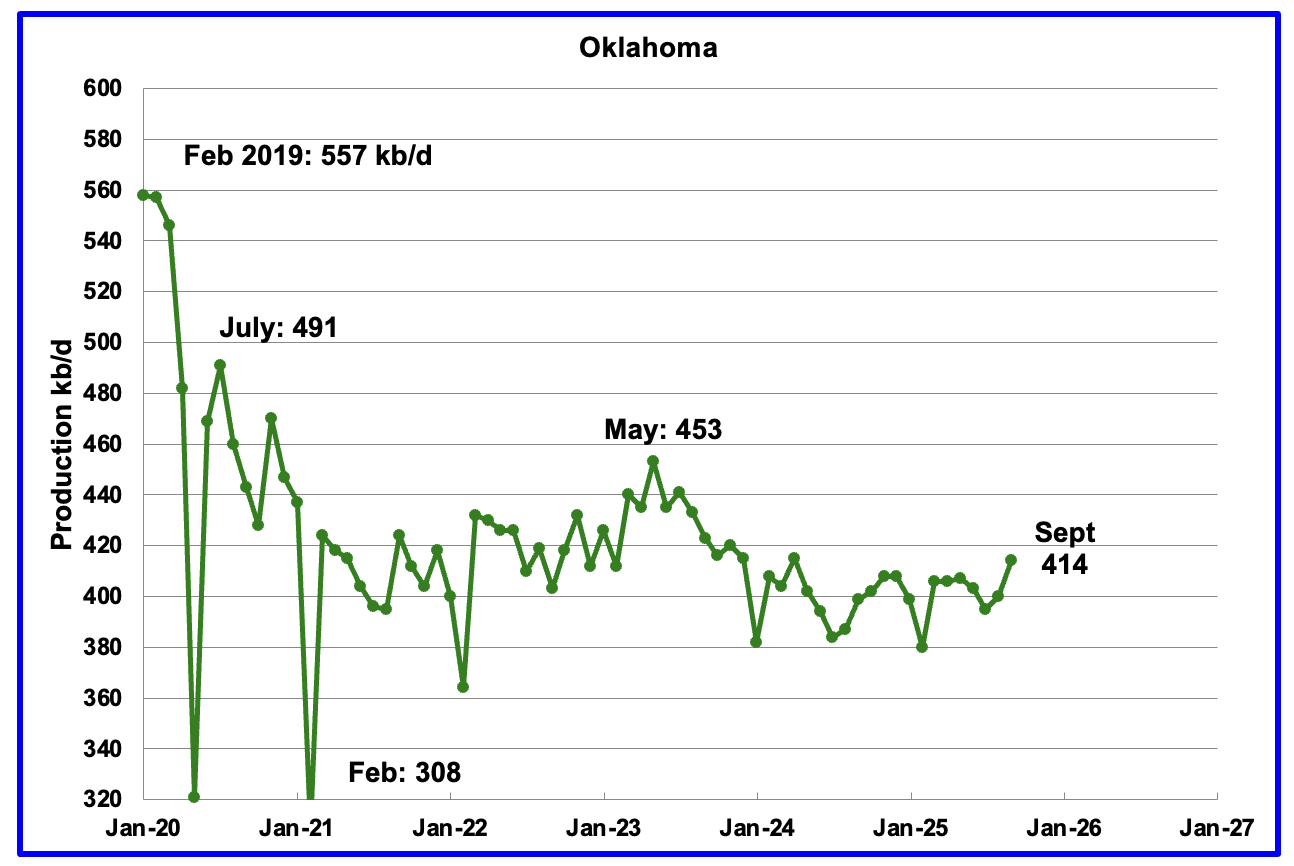
Oklahoma’s output in September rose by 14 kb/d to 414 kb/d. Production remains below the post pandemic July 2020 high of 491 kb/d and is down by 39 kb/d since May 2023. Output entered a slow declining phase in June 2023 and now appears to be range bound around 400 kb/d ± 20 kb/d.
Oklahoma had 51 operational rigs May which slowly dropped to 39 rigs in November. The impact of the dropping rig count after May should begin to show up in a few months, allowing for a 6 month time shift between rig count and oil production.
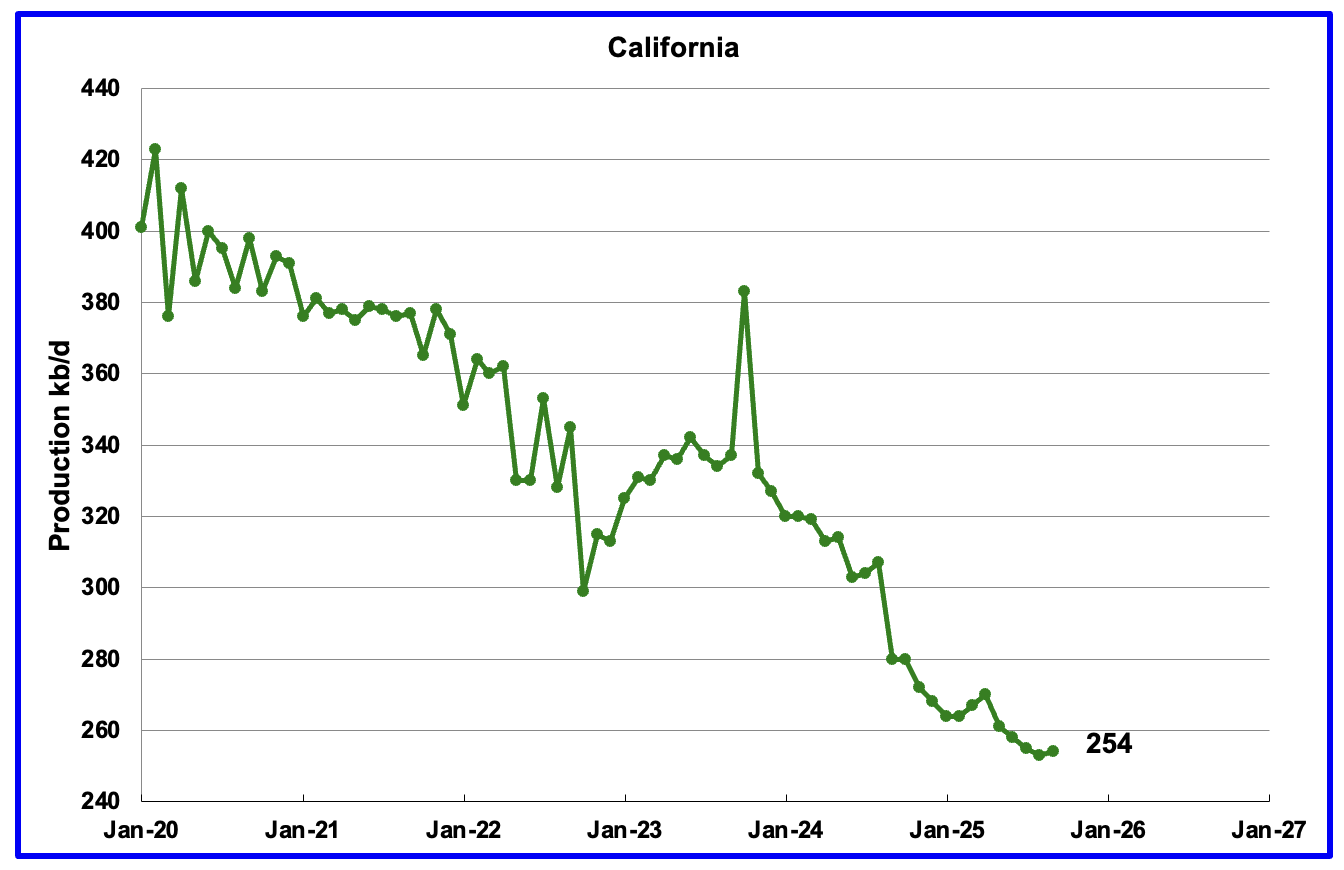
California’s overall declining production trend continues but September had a minimal rise. September’s production rose by 1 kb/d to 254 kb/d. YoY production dropped by 26 kb/d.
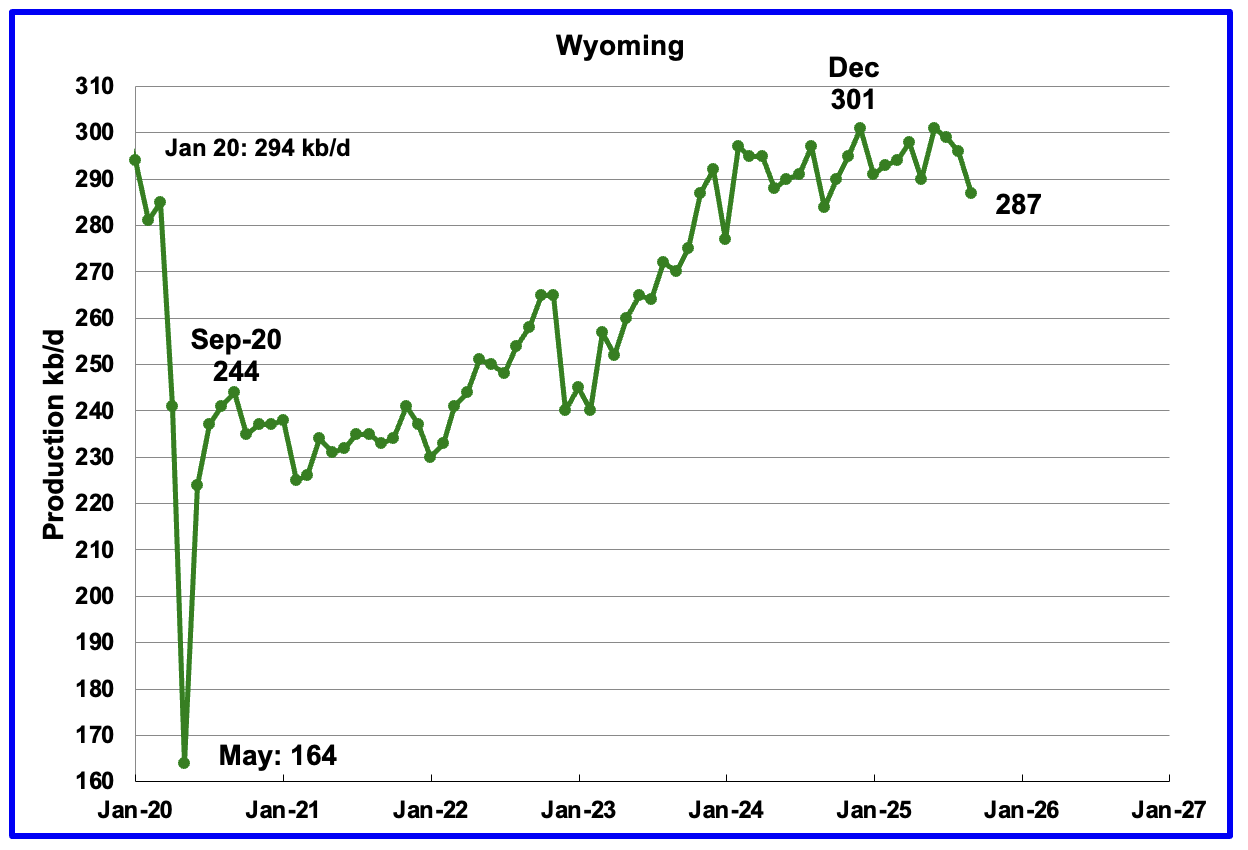
Wyoming’s oil production reached a post pandemic high in December 2024 and appears to have entered a plateau phase around 295 kb/d. September’s production dropped by 9 kb/d to 287 kb/d.
At the beginning of 2025 Wyoming had 14 operational rigs and rose to 16 in March and April. At the end of November 10 rigs were operational.
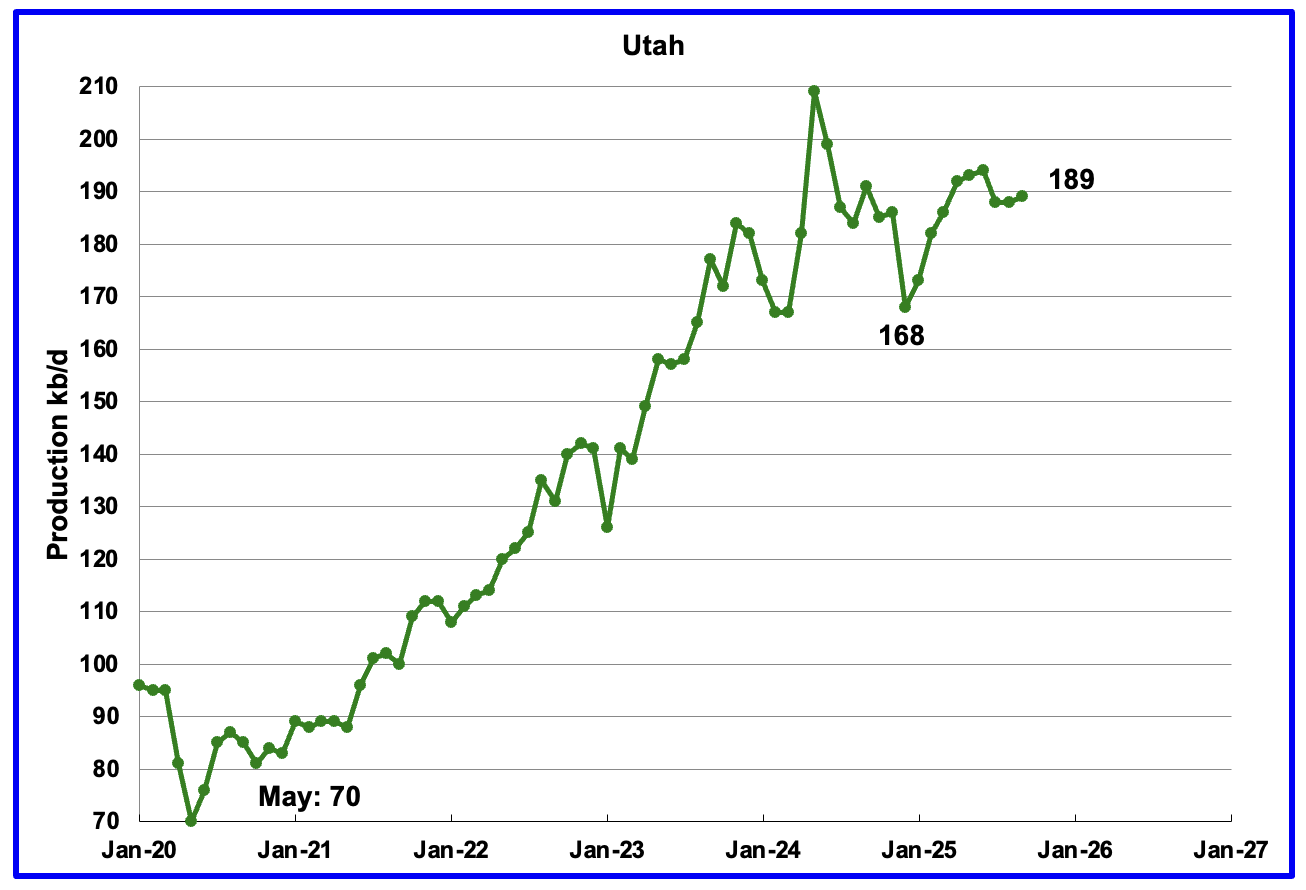
September’s production rose by 1 kb/d to 189 kb/d. Utah had 8 rigs operating from October 2024 through May 2025 but dropped to 6 in early June but returned to 9 in October and November.
The Uinta Basin Rail line that was approved in 2021 was given final approval by the Supreme Court.
The country’s highest court said Thursday the Surface Transportation Board’s 2021 Approval of the controversial Uinta Basin Railway — following several years of review and a 3,600-page environmental impact statement under the National Environmental Policy Act, or NEPA — adequately analyzed the impact of the railroad and the agency did not need to study potential impacts from increased drilling or refining of Uinta Basin crude.
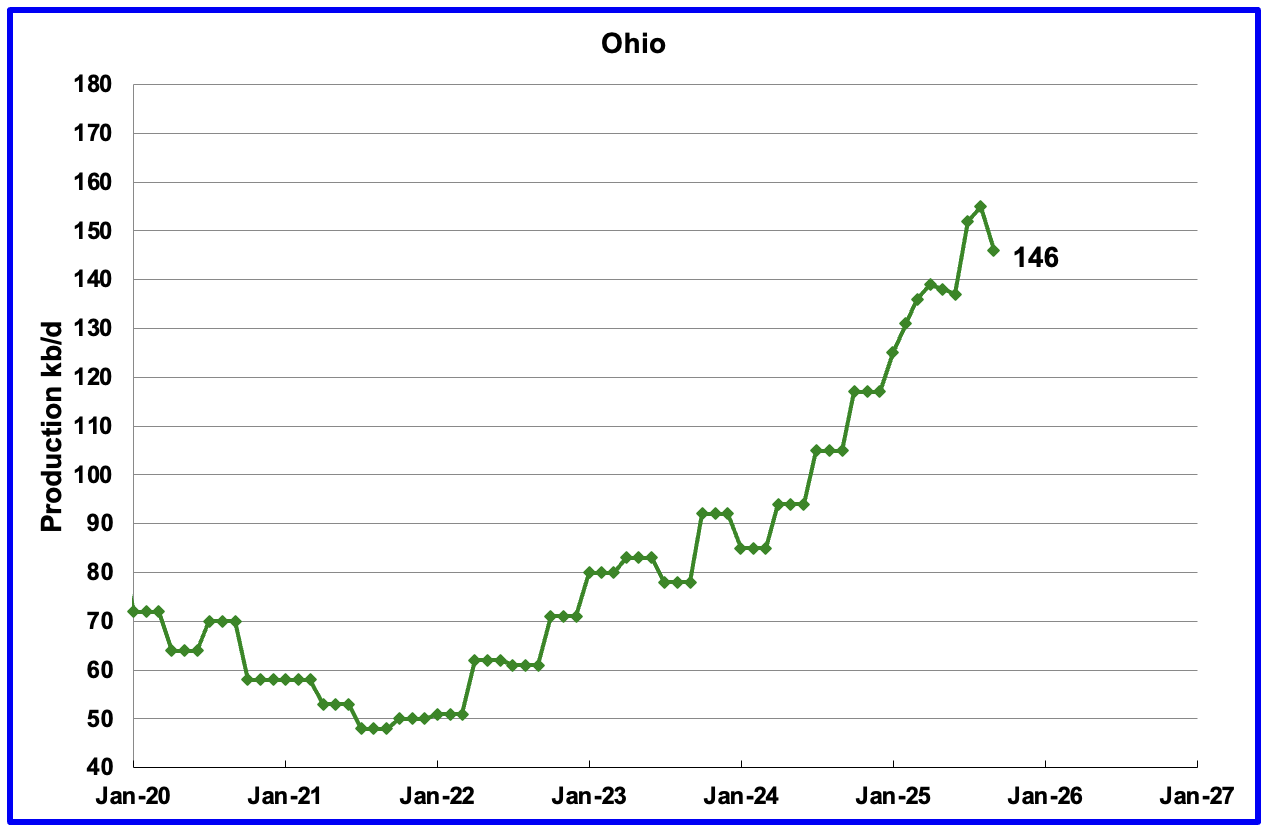
Ohio’s September oil production decreased by 9 kb/d to 146 kb/d. Ohio started the year with 6 NG rigs, In late November Ohio had 11 NG rigs and 1 oil rig operating.
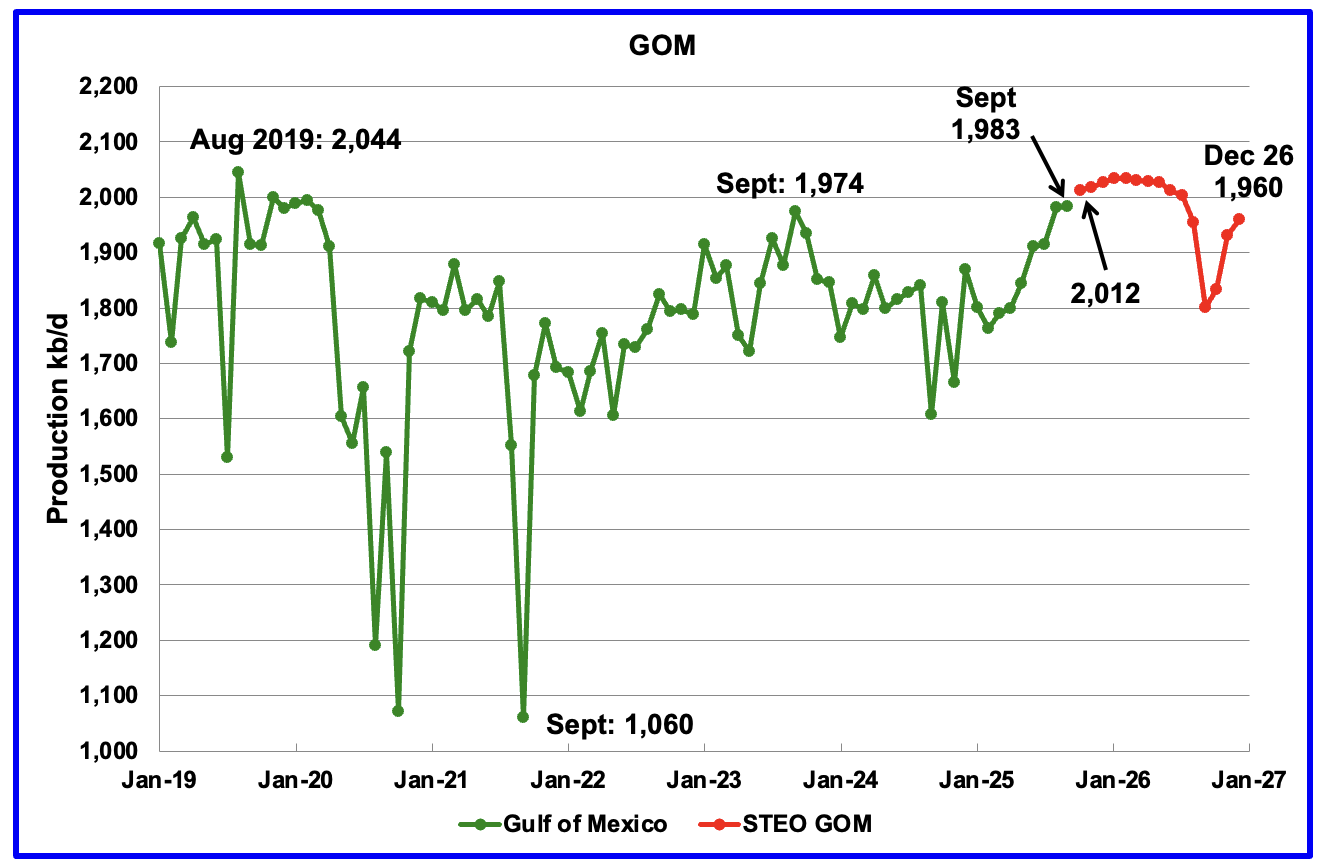
GOM production rose by 2 kb/d in September to 1,983 kb/d. October’s production is projected to increase by further 29 kb/d to 2,012 kb/d.
The November 2025 STEO GOM projection has been added to this chart. It projects production in December 2026 will be 23 kb/d lower than September 2025 at 1,960 kb/d.
A Different Perspective on US Oil Production
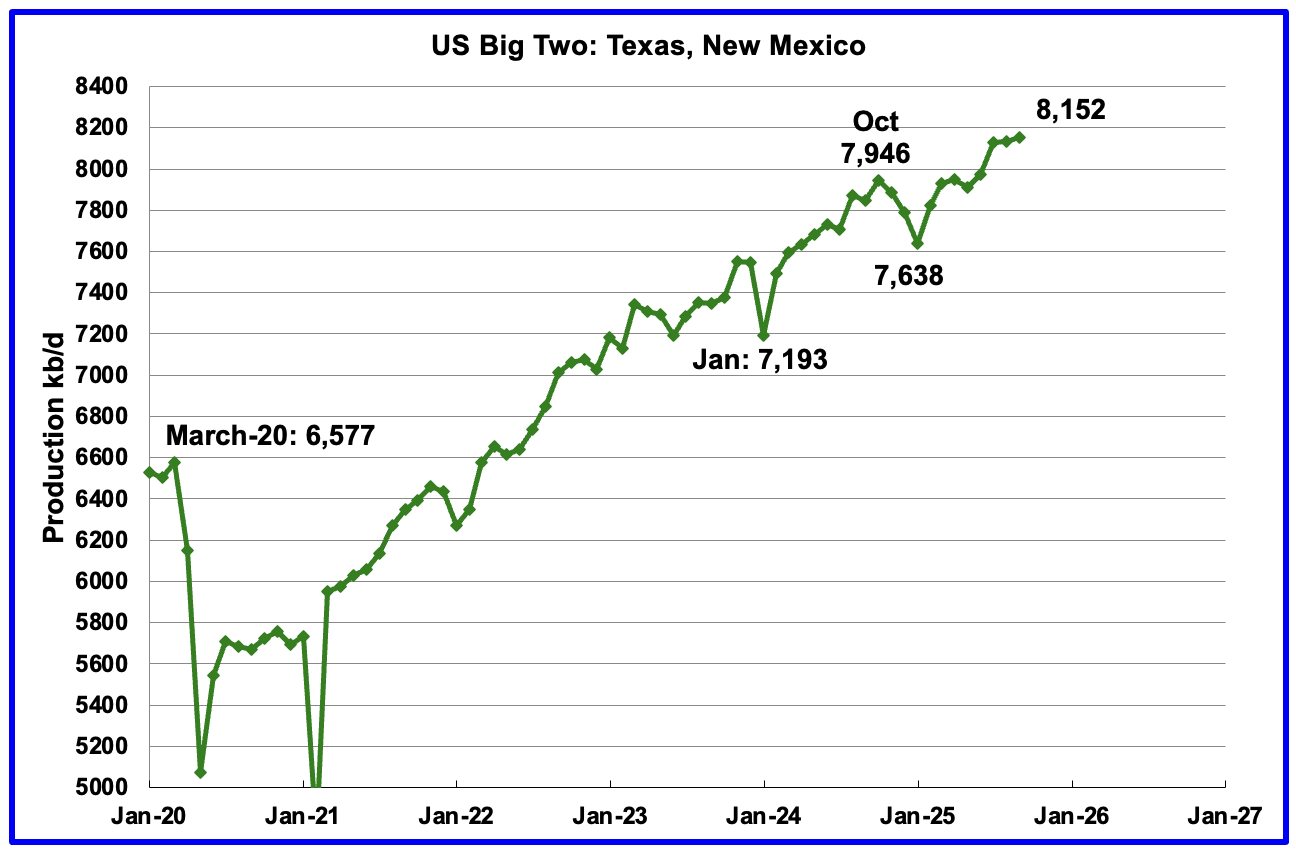
Combined oil output for the Big Two states Texas and New Mexico.
September’s production in the Big Two states increased by a combined 20 kb/d to 8,152 kb/d, a new high. Clearly these two states were the drivers of US oil production growth up to September 2025.
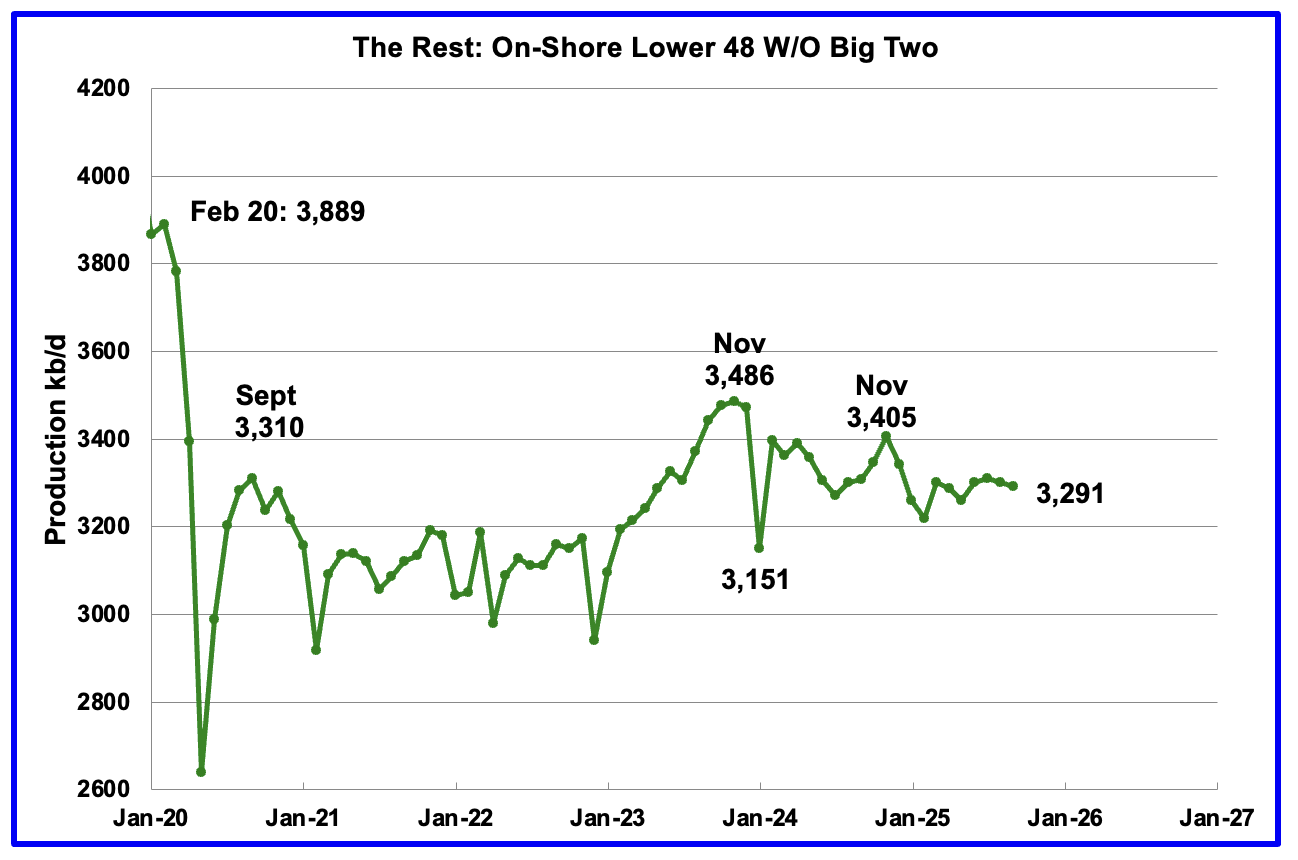
Oil Production by The Rest
September’s oil production by The Rest dropped by 9 kb/d to 3,291 kb/d and is 195 kb/d lower than November 2023.
The Big Beautiful Bill (OBBBA)
The other day I began wondering whether there was something in the OBBBA that was encouraging more oil drilling even as the price of WTI dropped from $70/b to $60/b. Since my knowledge of US Accounting/Tax rules for oil drilling is zero and was wondering how to get an answer, I finally realized I could ask that new all knowledgeable AI person to provide an answer. Here is how Mr Googl AI responded.
“Yes, the legislation referred to colloquially as the “
Big Beautiful Bill” (officially the One Big Beautiful Bill Act, or OBBBA, signed into law on July 4, 2025) includes significant tax provisions that function as extra write-offs for the oil and gas industry, including for new oil wells.
Key provisions benefiting new oil drilling include:
- 100% Bonus Depreciation: The Act permanently restores and expands the 100% bonus depreciation, a key provision that had begun to phase out under previous law. This allows oil and gas companies to immediately write off the full cost of capital expenditures, such as drilling equipment and pipelines, in the first year they are purchased, rather than depreciating them over several years.
- Intangible Drilling Costs (IDC): Restrictions in the prior law (the Inflation Reduction Act) on tax deductions for intangible drilling costs (which cover most non-equipment costs like labor, site preparation, and surveys) have been lifted.
- Reduced Royalty Rates: The bill also decreases the royalty rates that producers pay the government for drilling on federal land and in offshore areas.
These measures are projected to provide billions of dollars in new or extended subsidies to the fossil fuel industry over the next decade, making it cheaper to operate and invest in new oil and gas production.“
I will leave it to the oil experts to analyze the benefits of the OBBBA. The main sense I get is that a driller can right off most of the drilling costs which implies the price of oil is not a major factor because a driller is guaranteed to make a profit regardless of the price of WTI.
In the comments section below I will attach two articles related to the OBBA.
Permian Basin Report for Main Counties and a District
This special monthly Permian section was added to the US report because of a range of views on whether Permian production will continue to grow or will peak over the next year or two. The issue was brought into focus many months back by two Goehring and Rozencwajg Reports and Report2 which indicated that a few of the biggest Permian oil producing counties were close to peaking or past peak.
A more recent report was issued and can be reviewed Here. In this report they state:
“For years now, we have outlined with what we hoped was clarity, and what we now submit was prescience, the view that U.S. shale oil, that great source of modern supply, could not grow forever. It would mature, crest, and begin its long descent. That moment, by our models and measures, has arrived: shale has plateaued, and 2024 appears to be its high-water mark. And yet, investor sentiment has scarcely been more downbeat.”
This section will focus on the four largest oil producing counties in the Permian, Lea, Eddy, Midland and Martin. It will track the oil and natural gas production and the associated Gas Oil Ratio (GOR) on a monthly basis. The data is taken from the state’s government agencies for Texas and New Mexico. Typically the data for the latest two or three months is not complete and is revised upward as companies submit their updated information. Note the natural gas production shown in the charts that is used to calculate the GOR is the gas coming from both the gas and oil wells.
Of particular interest will be the charts which plot oil production vs GOR for a county to see if a particular characteristic develops that indicates the field is close to entering or in the bubble point phase. While the GOR metric is best suited for characterizing individual wells, counties with closely spaced horizontal wells may display a behaviour similar to individual wells due to pressure cross talking . For further information on the bubble point and GOR, there are a few good thoughts on the intricacies of the GOR in an earlier POB comment and here. Also check this EIA topic on GOR.
New Mexico Permian
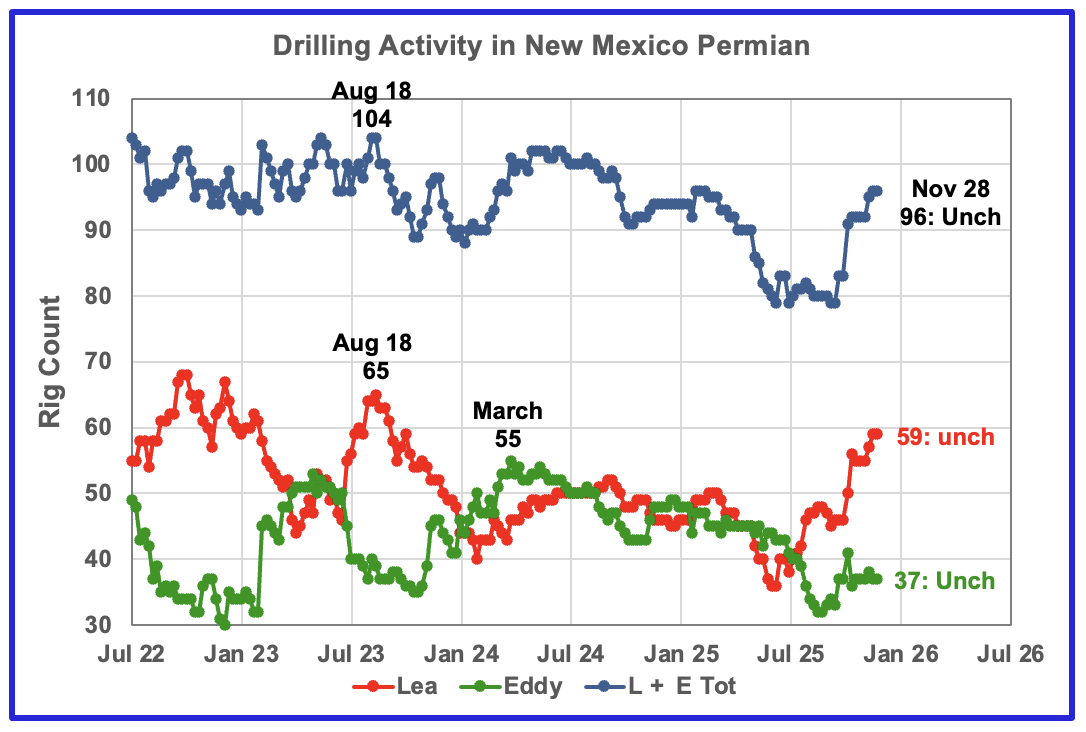
The current rig counts in Lea and Eddy counties are moving in different ways, Lea is adding while Eddy is holding steady. Over the past month Lea added 4 rigs to 59 while Eddy has held steady at 37.
Oil Production in New Mexico’s Primary Permian Counties
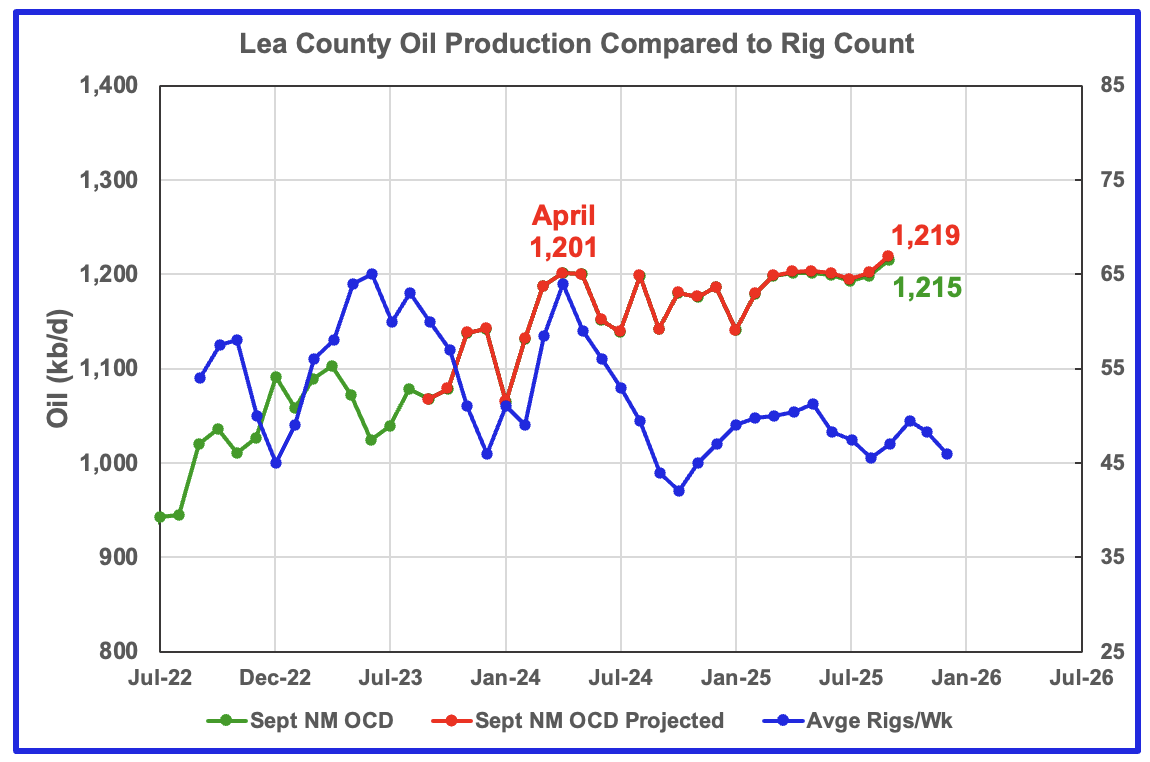
Lea County’s oil production started its plateau phase in April 2024 at 1,201 kb/d and the plateau continues to September 2025 but with a slight rise of 17 kb/d to 1,219 kb/d. In the last post it was noted that the August projection of 1,259 kb/d was over optimistic because July’s oil production was under reported. In this report August production has been revised down from 1,259 kb/d to 1,202 kb/d.
Preliminary September data from New Mexico’s Oil Conservation Division (OCD) indicates Lea County’s oil production rose 17 kb/d to 1,215 kb/d, green graph, and is a second indictor that production is rising in Lea County. The September production rise could be associated with the rising rig count that starts in time shifted September 2025.
A couple of months back I had the impression that Lea county was on the verge of entering a slowly declining phase. However after looking at this month’s data showing very flat production from April 2024 to August 2025 and a rise in September, one cannot infer/see a start to slowing production.
The blue graph shows the average number of weekly rigs operating during a given month as taken from the weekly rig data. The rig graph has been shifted forward by 8 months. So the 64 Rigs/wk operating in August 2023 have been time shifted forward to April 2024 to show the possible correlation and time delay between rig count, completion and oil production.
Note that rig counts are being used to project production as opposed to completions because state completion data is not available. However completion data from the Drilling Productivity report below indicates that extra DUCs are being completed in the Permian at this time.
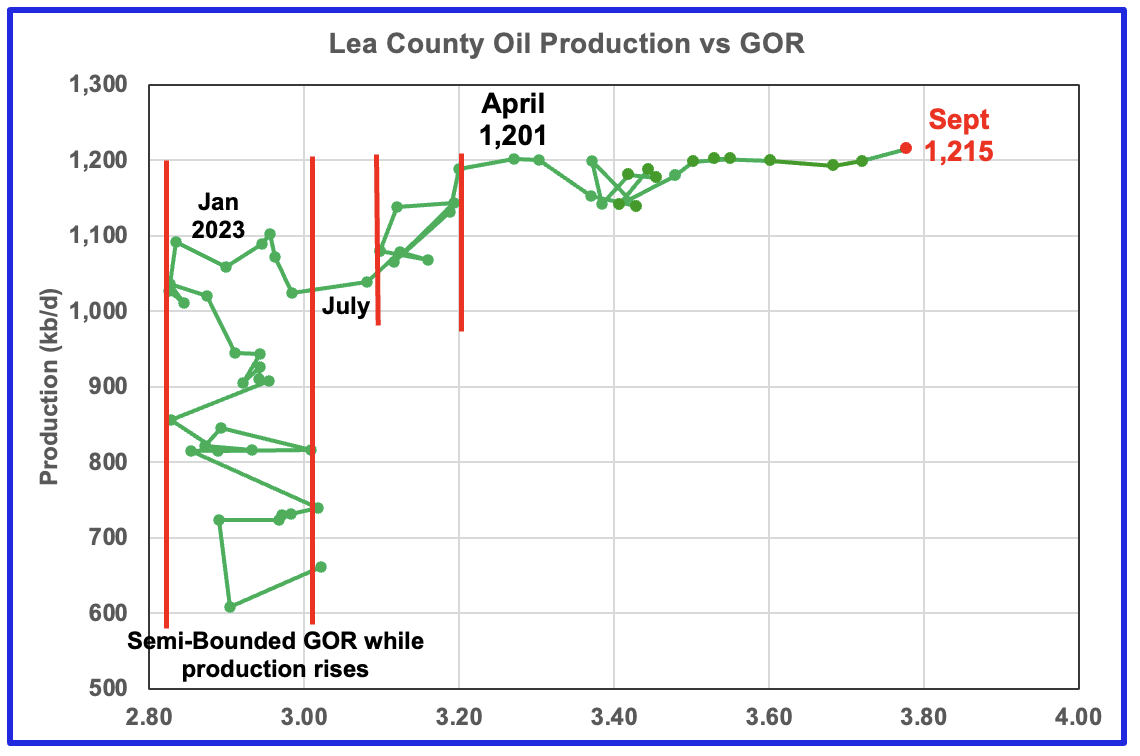
After much zigging and zagging, oil production in Lea county stabilized just below 1,100 kb/d in early 2023. Once production reached a new high in January 2023, production appeared to be on a plateau while the GOR started to increase rapidly to the right and first entered the bubble point phase in July 2023.
Since July 2023 Lea County’s production continued to increase as the GOR remained within a second semi-bounded region. This may indicate that additional production was coming from an oilier part of a layer since the GOR’s behaviour since August 2023 to March 2024 time frame appears once again to be in a second semi bounded GOR phase accompanied with rising production.
The GOR moved out of the second semi-bounded GOR region in April 2024 as production hit a new high of 1,201 kb/d. From July 2024 to May to February 2025 the GOR was range bound between 3.35 and 3.45 but from March 2025 to September 2025 the GOR has risen every month to hit new highs. September’s GOR was 3.78 while preliminary production increased to a new high of 1,215 kb/d
This zigging and zagging GOR pattern within a semi-bounded GOR while oil production increases to some stable level and then moves out to a higher GOR to the right has shown up in a number of counties. See a few additional cases below. The rising GOR to new highs in Lea county is an early indicator that production may be close to entering a declining phase even though the September projection does not confirm this.
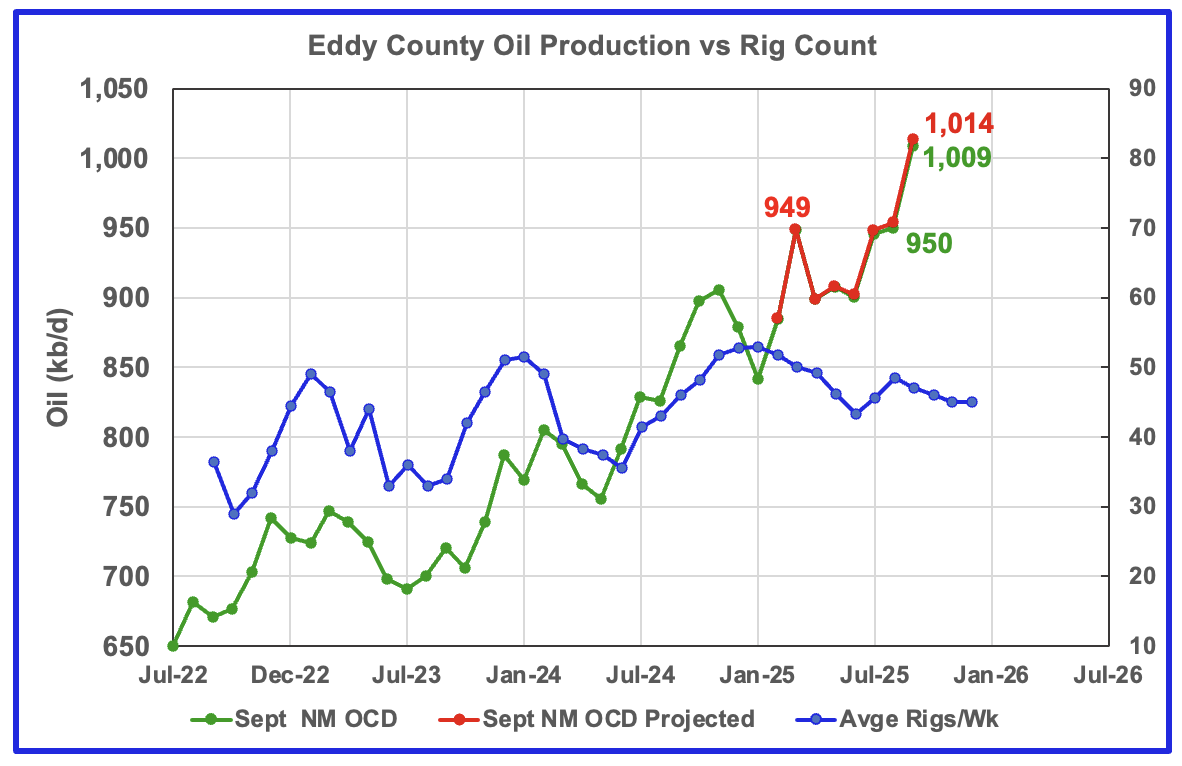
September’s projected oil production increased by 60 kb/d to 1,014 kb/d, a new high while preliminary production from the NM OCD increased by 59 kb/d to 1,009 kb/d. Eddy county’s month over month production updates are very few and small and primarily occur in the last three or four months which indicates their preliminary production is very close to final. This month’s updates/revisions again were minimal. The rising production could be linked to the increasing rig count starting in time shifted July 2025 and could possibly be the beginning of a short increasing phase. Will the falling rig count affect production after September?
The blue graph shows the average number of weekly rigs operating during a given month as taken from the above weekly drilling chart. The rig graph has been shifted forward by 8 months to roughly coincide with the increase in the production graph starting in November 2023.
Clearly the production rise up to November 2024 is closely associated with the rise in the rig count and associated well completions delayed by roughly eight months.
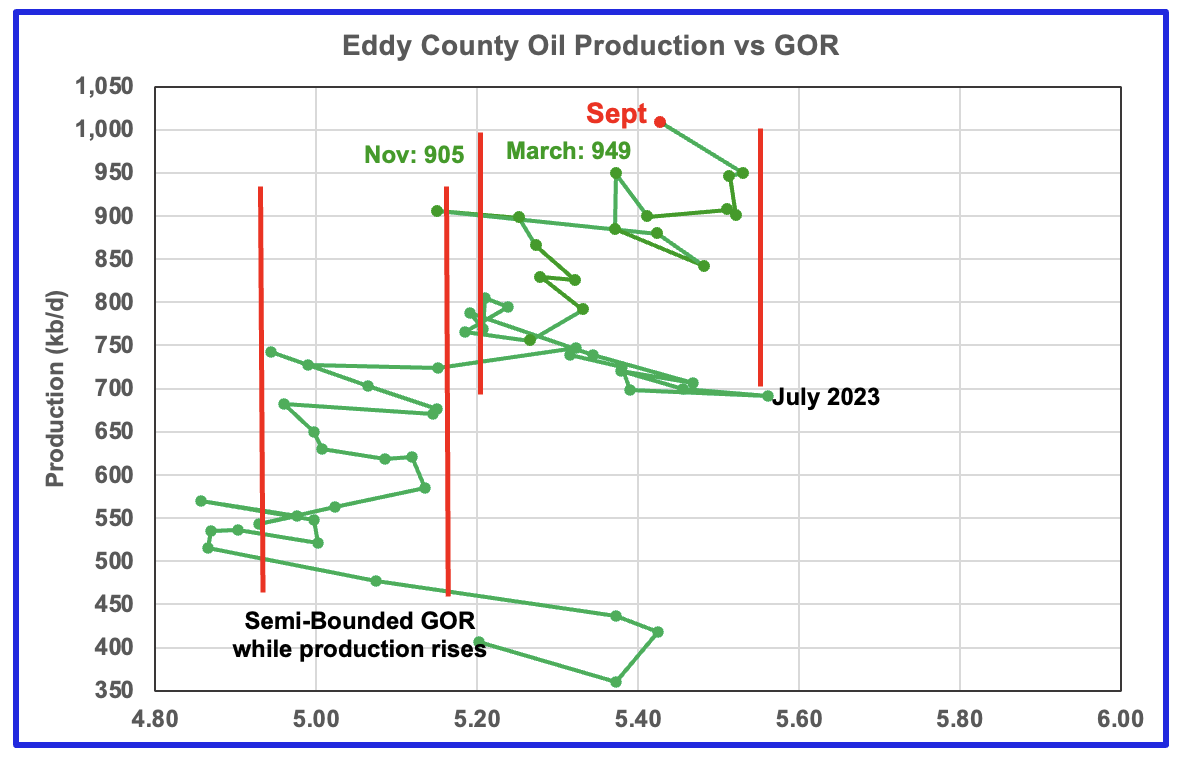
The Eddy county GOR pattern is similar to Lea county except that Eddy broke out from the first semi bounded range earlier and then added a second wider semi-bounded GOR phase. For September New Mexico’s Oil Conservation Division (OCD) reported preliminary oil production increased by 59 kb/d to 1,009 kb/d while the GOR dropped to 5.43 and remained within the second Semi-Bounded GOR range.
Texas Permian
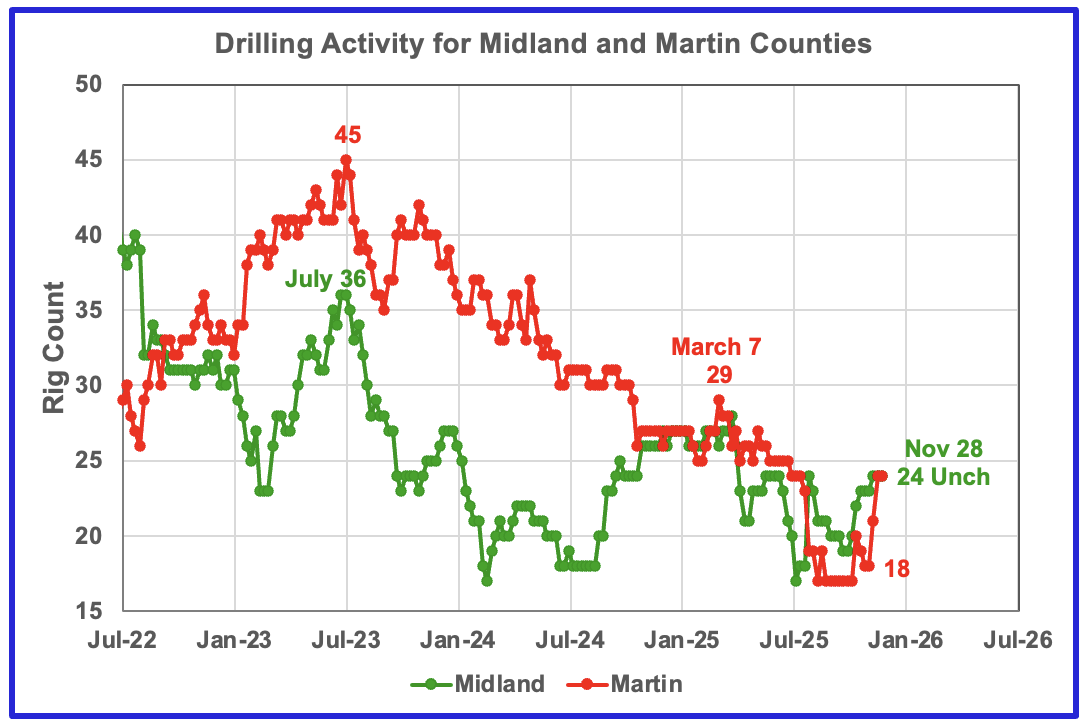
The rig count in both Midland and Martin counties have increased over the past month. Midland added 1 rig while Martin added 6 to 24.
Oil Production in Primary Permian Texas’ Counties
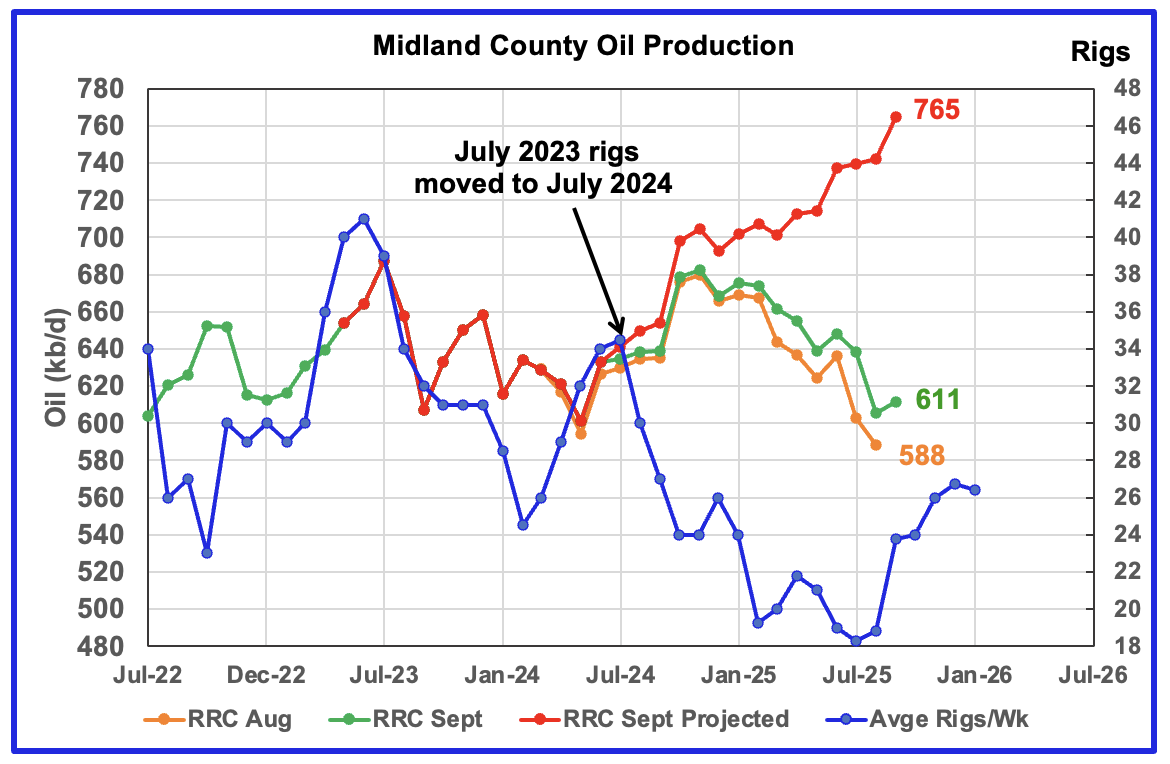
September’s projected production rose by 23 kb/d to 765kb/d. However I think September’s projected production looks optimistic because of production revisions dating back to June 2024. I think a more realistic production projection for September is in the 710 kb/d to 720 kb/d range. Projected production for October and November may see an increase associated with the rising rig count starting in time shifted August 2025. What is significant in this chart is the increase in September’s preliminary production over August by 6 kb/d to 611 kb/d. This may be an early indication of forthcoming rising production.
The orange and green graphs show preliminary oil production for Midland County as reported by the Texas RRC for August and September. The red graph uses the August and September data to project production as it would look after being updated over many months.
The blue graph shows the average number of weekly rigs operating during a given month as taken from the weekly drilling chart. The rig graph has been shifted forward by 12 months to better align with production. So the average 34.5 Rigs/wk operating in July 2023 have been moved forward to July 2024 to show the possible correlation and time delay between rig count, completions and oil production.
The 12 month rig time shift is much larger than the typical six to eight months used in other counties. It is not clear why there should be such a difference. If the twelve month shift in the rig count is approximately correct in that oil production can be tied to the rig count, oil production in Midland county should continue to rise for a few more months.
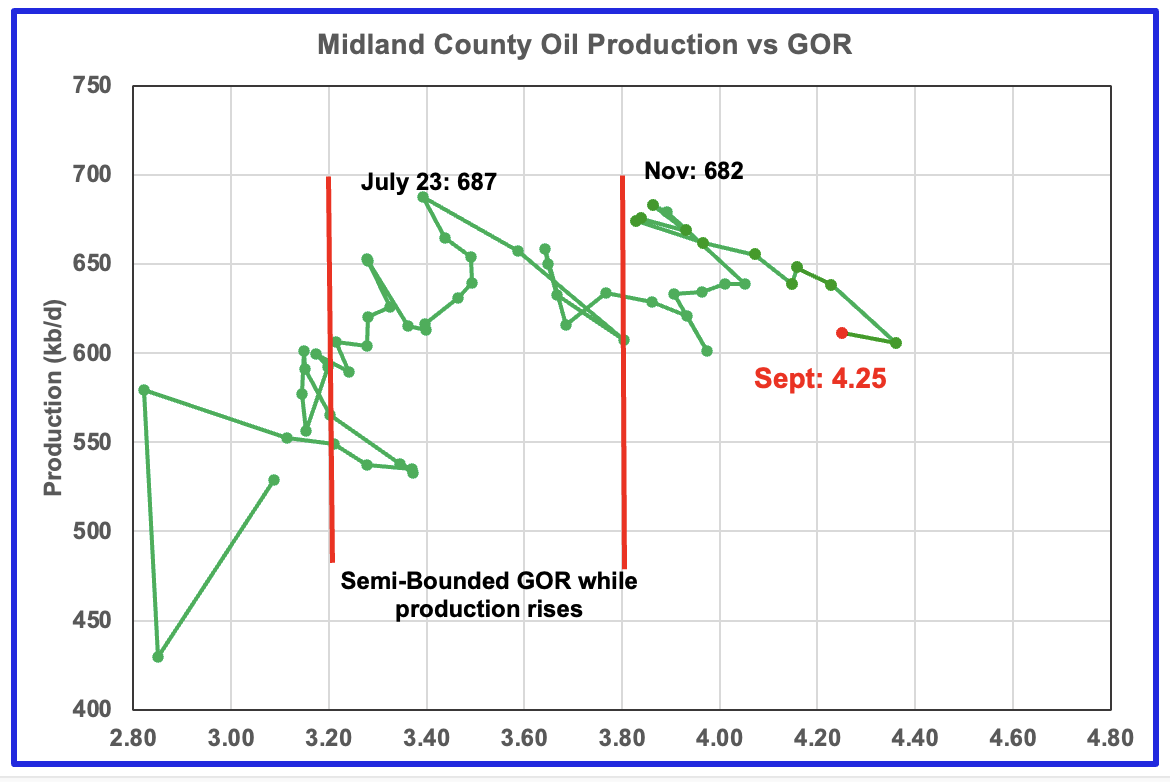
For September the Midland GOR ratio dropped to 4.25 from 4.36 in August while the reported preliminary oil production rose by 6 kb/d to 611 kb/d.
When Midland county GOR initially moved into the bubble point phase, oil production and the GOR stayed within a narrow range of 3.8 to 4.0 outside of the initial Semi-Bounded GOR region from March 2024 to March 2025. However after March, the April to August 2025 GORs broke out to new highs. The September GOR reversed the trend and the dropped to 4.25 but still stayed outside the Semi-Bounded region.
The oil production and GOR data shown in this chart are based on the RRC’s September production report.
For Comparison: Martin County production from last month.
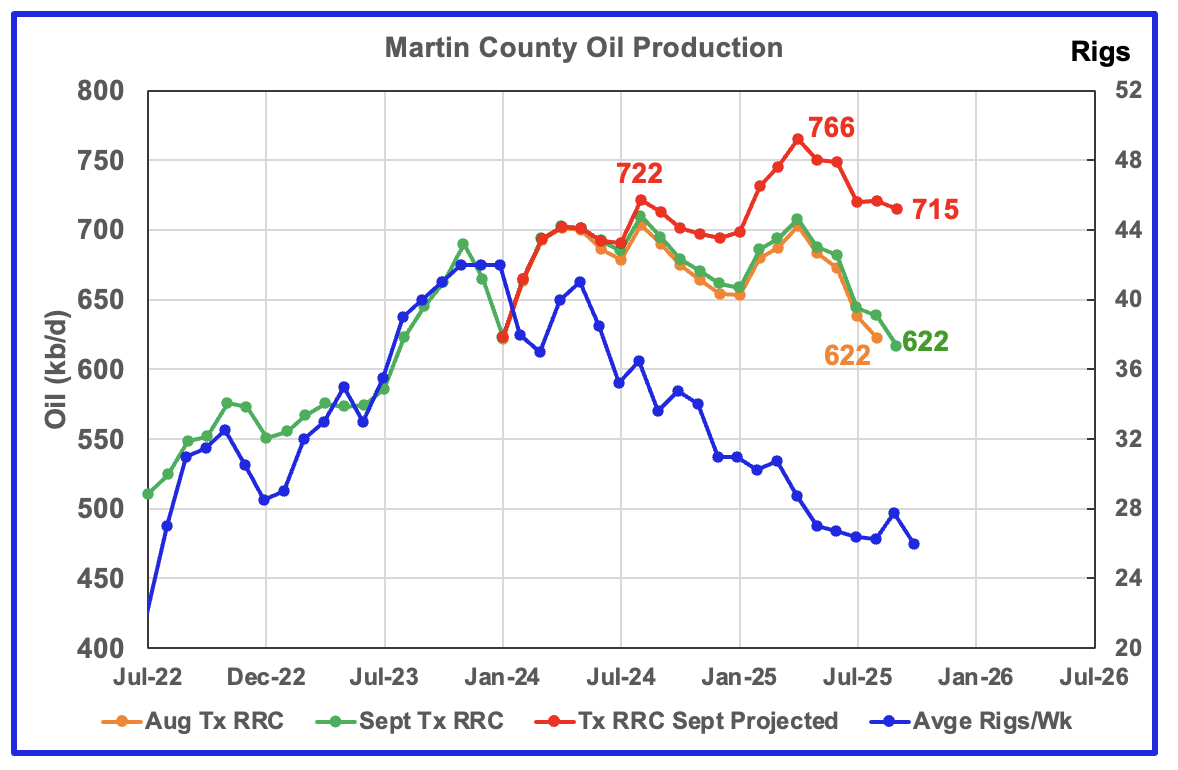
Martin county’s projected September oil production dropped by 6 kb/d to 715 kb/d. I think the September projected production is overly optimistic and a more realistic level would be somewhere between 665 kb/d and 680 kb/d. The April peak is probably closer to 725 kb/d. Note the peak production in the preliminary data for August 2024 and April 2025, green chart are both close to 715 kb/d.
The September projected production is overly optimistic because the MoM updates are larger than in previous months. In the comparison chart above, production revisions, which are indicted by the gap between the green and orange graphs, do not show up till March 2025. In the current chart, the orange green gap visibly starts in July 2024. More critically note that peak production occurs in April 2025 in both cases and then drops.
The projected production increase starting January 2025 is real but then peaks in April before starting a new declining trend. The more significant part of the projection is the last five months which shows production fell by 51 kb/d from 766 kb/d in April to 715 kb/d in September. Based on the April to September production drop, I think Martin County has entered its declining phase.
The red graph is a projection for oil production as it would look after being updated over many months. This projection is based on a methodology that uses preliminary August and September production data. The green graph shows the preliminary oil production reported by the Texas RRC for September. Production since May might have begun to track the time shifted rig chart.
The orange and green graphs show production for Martin County as reported by the Texas RRC for August and September. The blue rig graph time shifts the rig count ahead by 6 months.
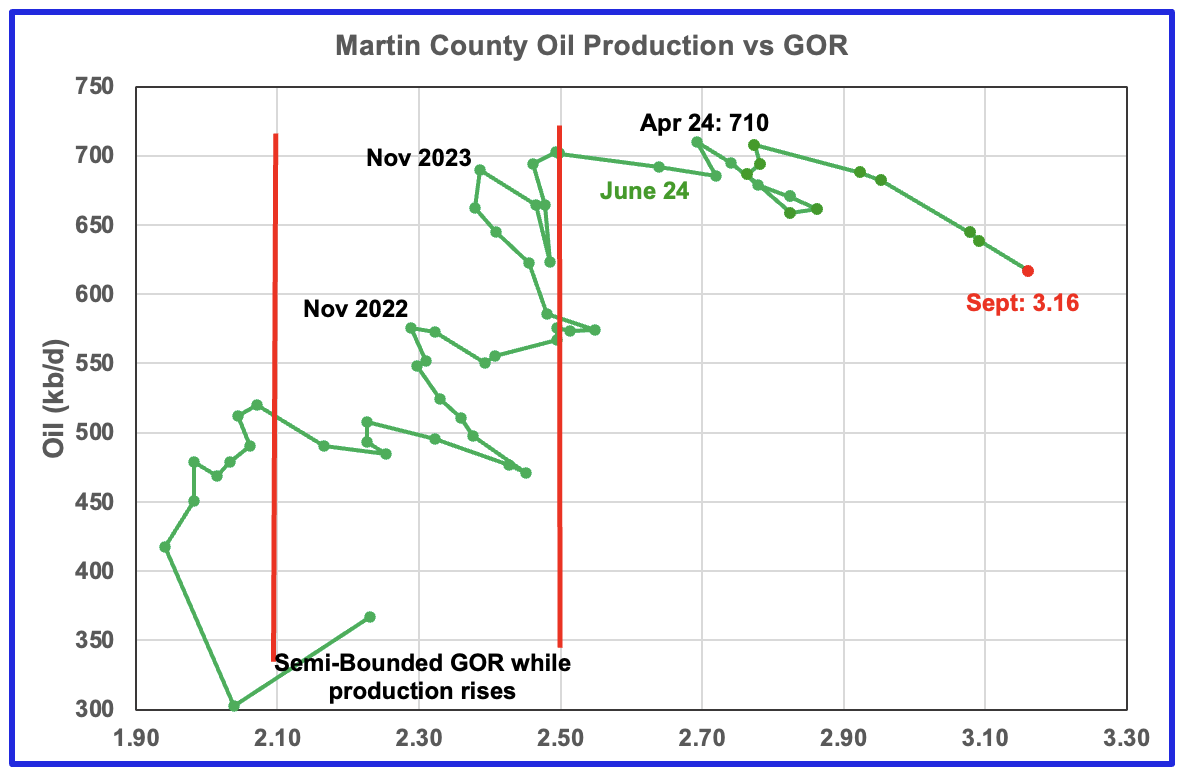
Martin county’s oil production after November 2022 increased and at the same time drifted to slightly higher GORs within the semi bounded range. However the June 2024 GOR saw its first move out of the semi bounded region. The RRC’s preliminary September 2025 production for Martin County shows a 21 kb/d decrease accompanied by an increase to the GOR to 3.16.
Martin county has the lowest semi-bounded GOR boundary of the four counties at a GOR of close to 2.50. The GOR is now clearly out of the semi-bounded region. Martin County has now entered the bubble point phase that should result in oil production possibly entering a slowly declining phase.
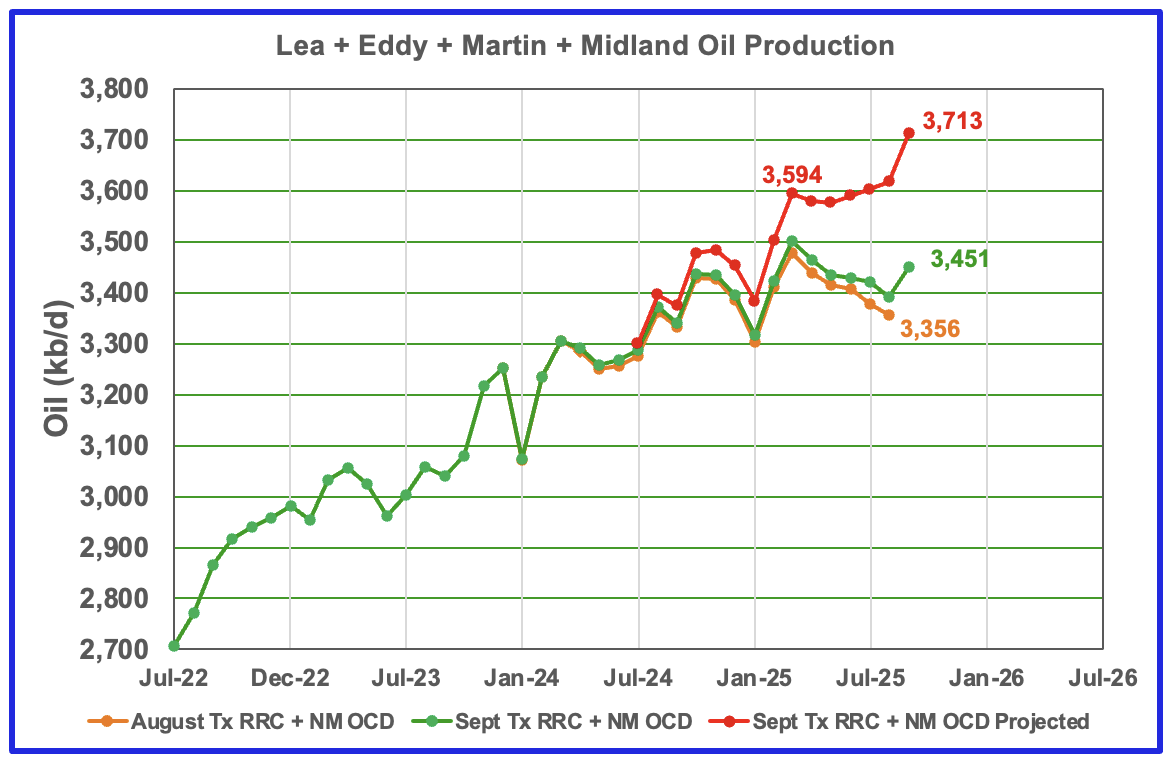
This chart shows the total oil production from the four largest Permian counties. Assuming current Permian production is close to 6,600 kb/d, these four counties account for 56% of the total. September’s projected production increased by 95 kb/d to 3,713 kb/d and is the fourth consecutive month showing increasing production.
The rising production is the result of rising production in Lea, Eddy and Midland counties. As noted above, production in Midland and Martin counties for the last few months is a bit optimistic and a more likely scenario is that September production from these four counties is closer to the 3,650 kb/d. Regardless it will be up. The big question is for how many more months can production continue to rise in the face of dropping WTI?
The August and September initial production data are shown in the orange and green graphs respectively. The red graph uses the August and September production data to project a more realistic estimate for the final updated September production.
Findings
– The preliminary September production data for New Mexico is very good. The Texas RRC production data had MoM revisions that resulted in slightly optimistic projections.
– Lea county entered its plateau phase in May 2024. While oil production is not following the rig count graph directly, the dropping rig count has resulted in Lea County production being in a steady flat plateau phase up to August 2025. However September had a 17 kb/d production increase.
– July, August and September production in Eddy County saw an increase to a record high and is possibly signalling the beginning of a short production increasing phase.
– Midland County’s production after December 2024 is real but a bit optimistic. A more reasonable estimate for September’s production would be in the range 710 kb/d to 720 kb/d. September’s projected production looks optimistic due to the production revisions starting in July 2024. However, the production rise matches the rising rig count in time shifted September. The addition of six new rigs to Midland county in real August 2025 to 24 was an unexpected surprise and makes one wonder what it implies for Midland county going forward, after allowing for a production delay.
– Martin County appears to be in a declining phase that started in April 2025.
Texas District 8
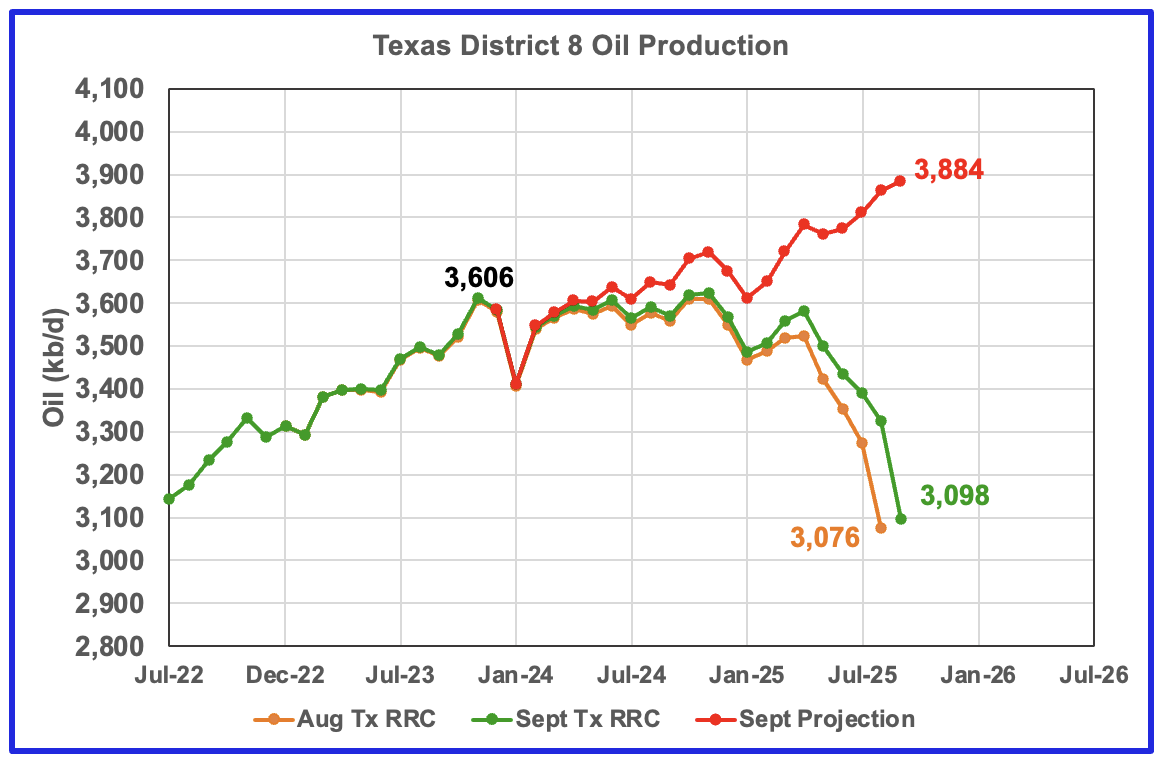
The District 8 production chart is showing rising production. However due to revisions to last month’s production all the way back to April 2024, the projection is optimistic. A more realistic production level for April to July is 3,700 kb/d and 3,800 kb/d for September. Notice that the three green peaks are close to 3,600 kb/d which maybe indicating an upcoming plateau phase.
September saw a projected production increase of 22 kb/d to 3,884 kb/d.
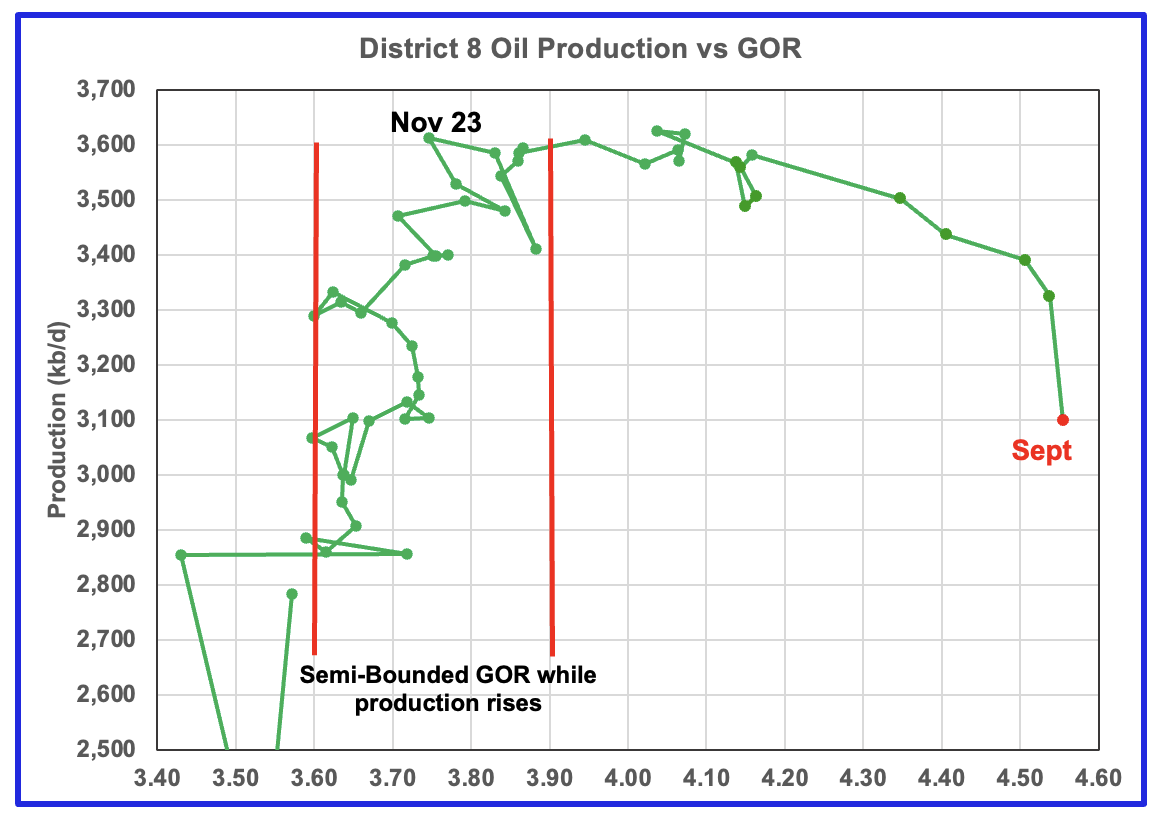
Plotting an oil production vs GOR graph for a district may be a bit of a stretch. Regardless here it is and it seems to indicate many District 8 counties may well be into the bubble point as the September GOR increased slightly to a record 4.55 as the preliminary RRC production fell by 226 kb/d
Oil Production and GOR Charts for Three of the Larger Texas Oil Counties
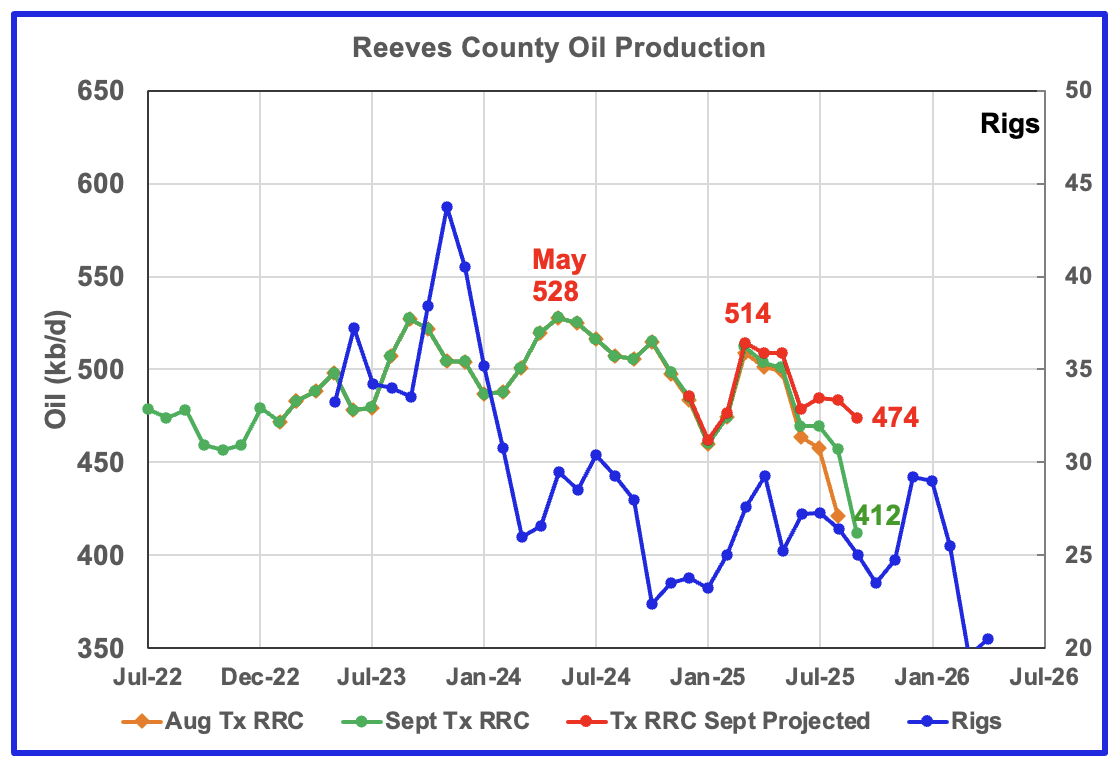
September’s projected oil production for Reeves County dropped by 10 kb/d to 474 kb/d. Note how the visible production revisions, gap between orange and green graphs, don’t start till April 2025.
Reeves County has entered its declining phase and appears to be dropping due to the falling rig count. Reeves county is ranked as #3 for oil production in Texas, after Midland and Martin counties.
Last month I noted that Reeves August’s production was optimistic and estimated it would be lower at around 540 kb/d. Even that estimate was too high. August has been revised down to 484 kb/d.
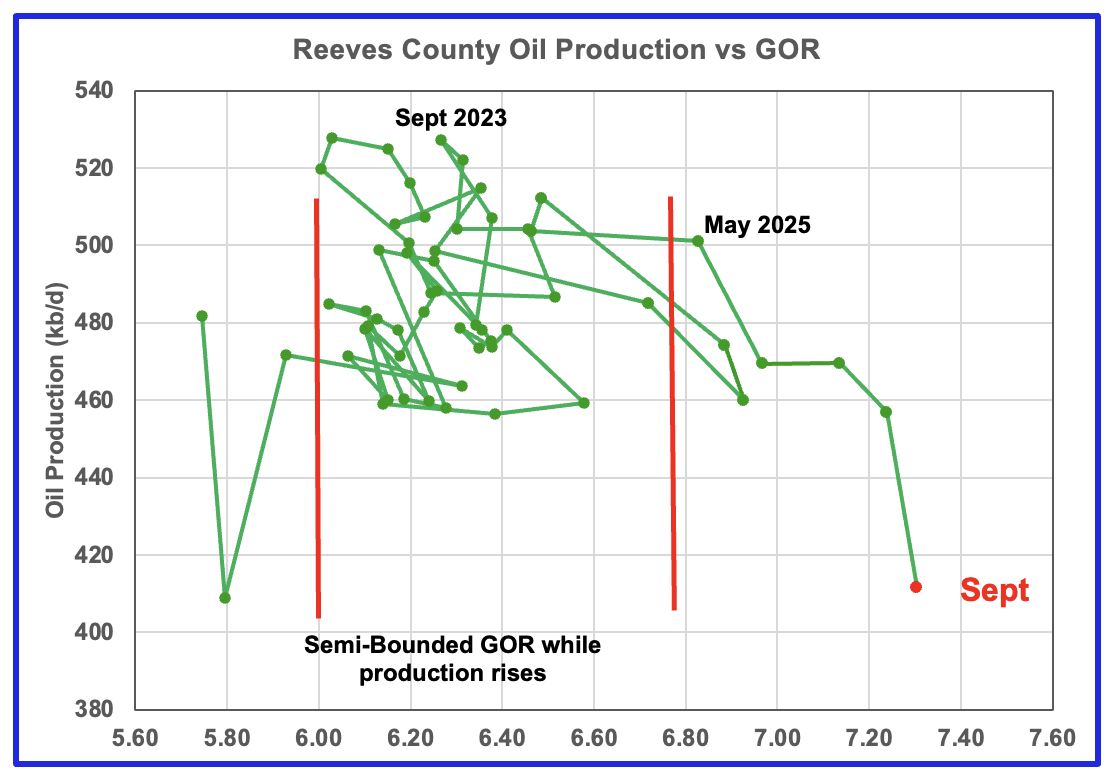
The GOR chart indicates Reeves County initially entered the bubble point phase in January 2025 and then reversed back into the Semi-Bounded region. September’s GOR is 7.30 and is at a record high. The May 2025 GOR was a definite breakout from the Semi-Bounded region.
Reeves county GOR is high because it is the number one Texas county ranked by gas production. The current C + C production is almost split between crude and condensate, with concentrate about 15% higher than crude.
The rig count is time shifted forward by 7 months.
In Real June, 29 rigs were operational in Reeves county. By late November the rig count had dropped to 18.
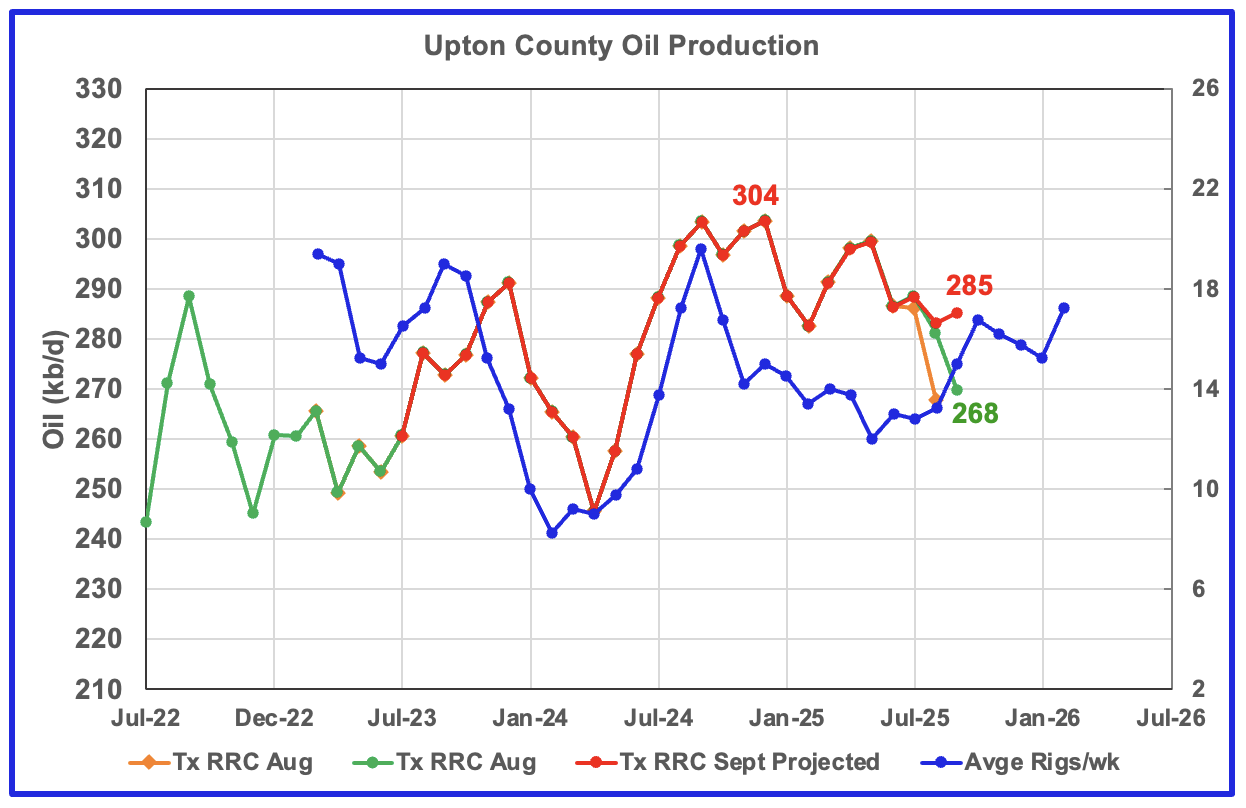
Upton County entered its declining phase in January 2025. September’s projected production rose by 2 kb/d to 285 kb/d. August’s production was revised down from 303 kb/d to 283 kb/d. For the next few months Upton county may see a production increase associated with the rising rig count in time shifted August 2025.
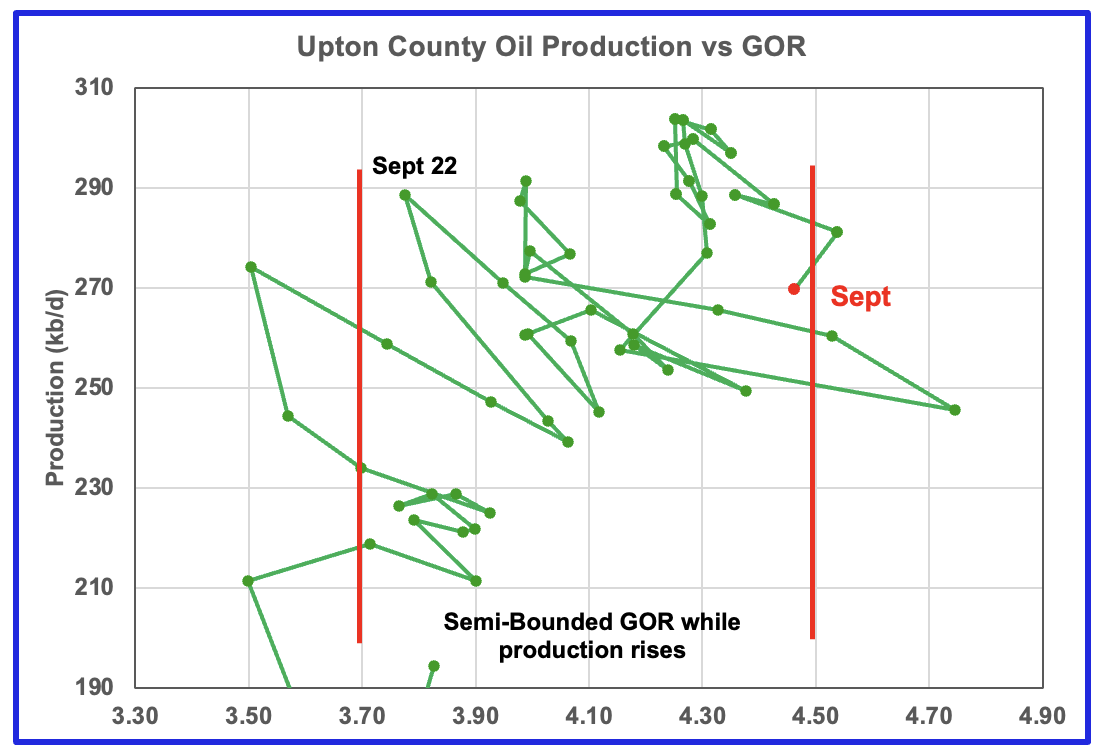
Upton’s oil production may be on the verge of entering the bubble phase since it popped out of the Semi- Bounded region in August and then barely re-entered it in September.
Upton’s rig chart has been time shifted forward by six months. Upton began the year with 13 rigs. In real September, 17 rigs were operating.
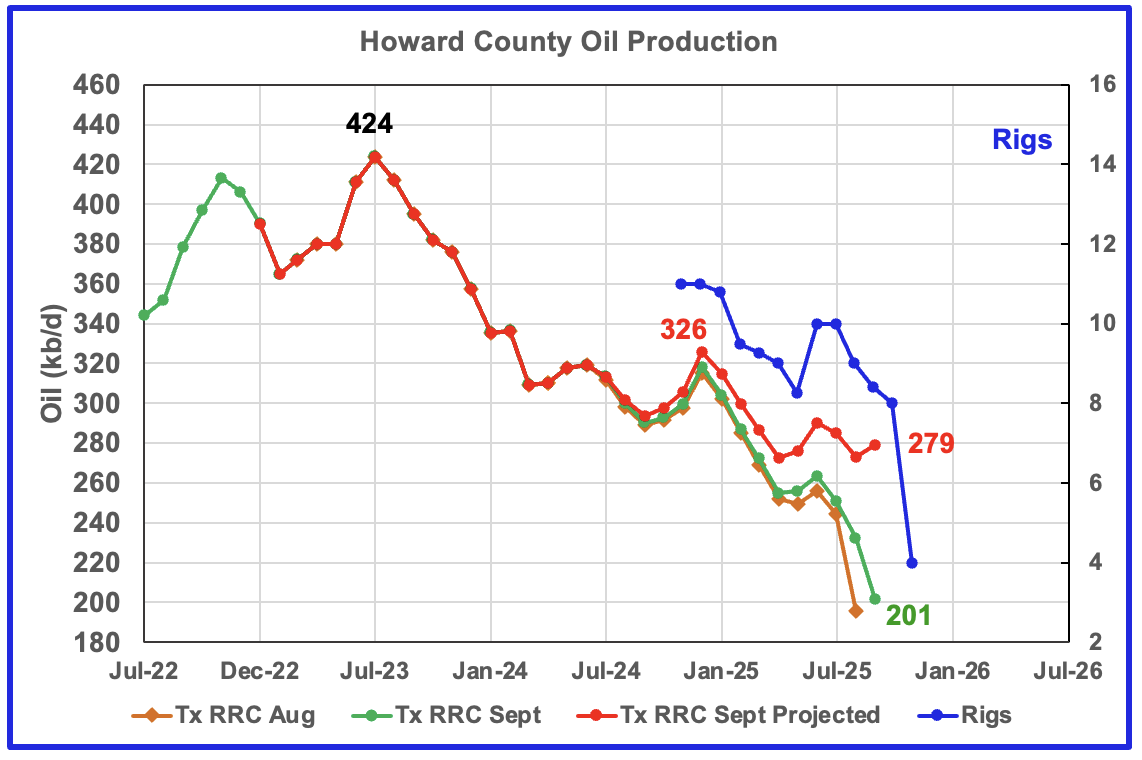
Howard County oil production peaked in July 2023 and has been in a slow decline ever since. The falling production has been falling along with the dropping rig count. In September the projected production rose by 6 kb/d to 279 kb/d. The rig graph is time shifted forward by 5 months.
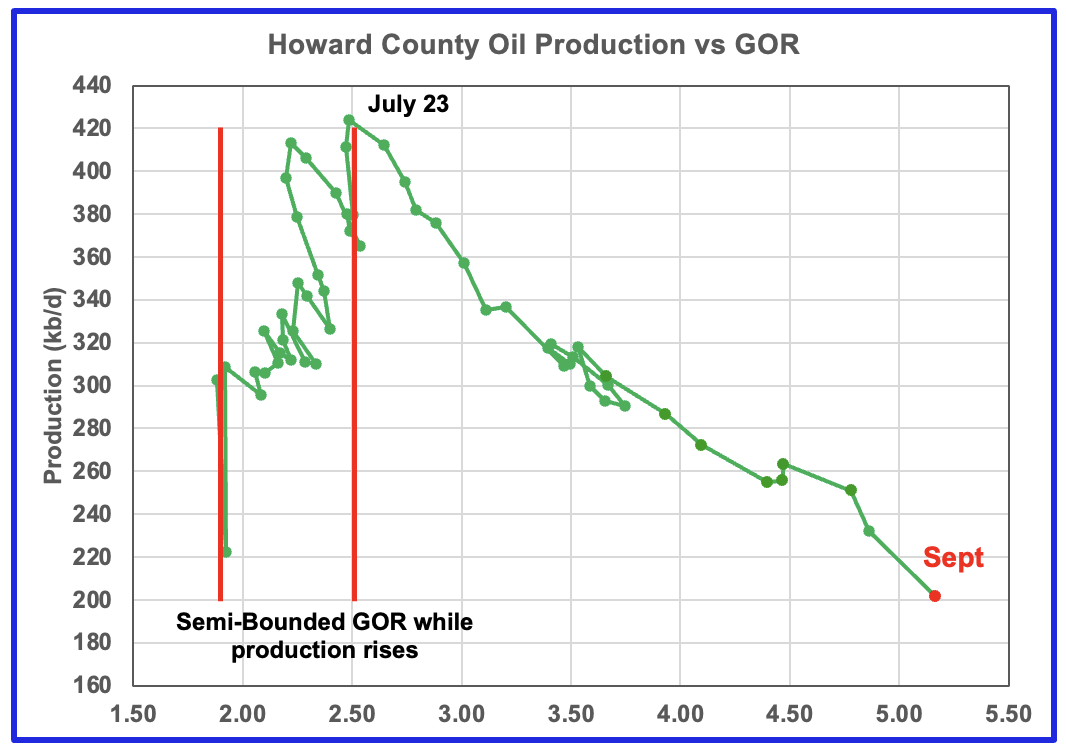
The GOR continues to increase as production drops. The GOR ratio reached a new high of 5.17 in September.
Drilling Productivity Report
The Drilling Productivity Report (DPR) uses recent data on the total number of drilling rigs in operation along with estimates of drilling productivity and estimated changes in production from existing oil wells to provide estimated changes in oil production for the principal tight oil regions. The new DPR report in the STEO provides production up to October 2025. The report also projects output to December 2026 for a number of basins. The DUC charts and Drilled Wells charts are also updated to October 2025.
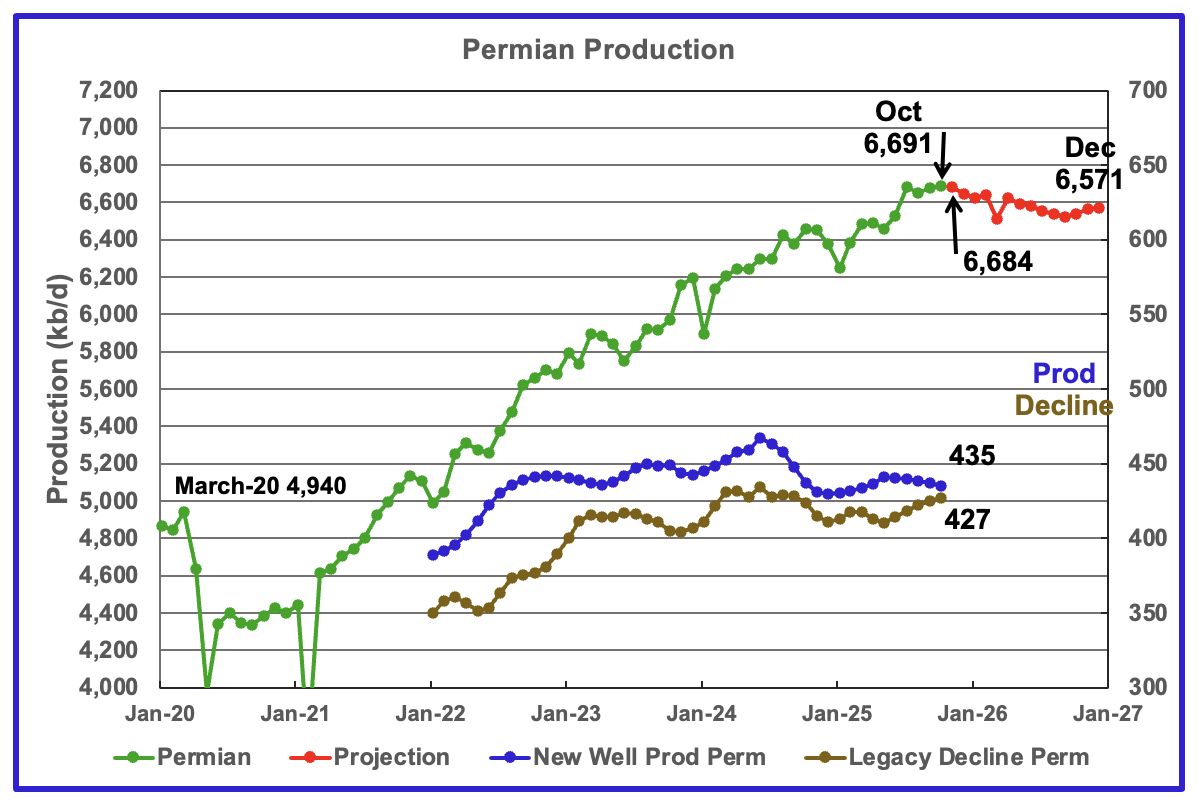
The EIA’s October STEO/DPR report shows Permian October output rose by 14 kb/d to 6,691 kb/d. October is expected to drop by 7 kb/d to 6,684 kb/d. From October 2025 to December 2026 output is expected to drop by 120 kb/d to 6,571 kb/d. Note that December 2026 production has been revised up by 52 kb/d from 6,519 kb/d to 6,571 kb/d.
Production from new wells and legacy decline, right scale, have been added to this chart to show the difference between new production and legacy decline. The gap has been getting smaller every month for the last six months. If this trend were to continue, it portends peak Permian production.
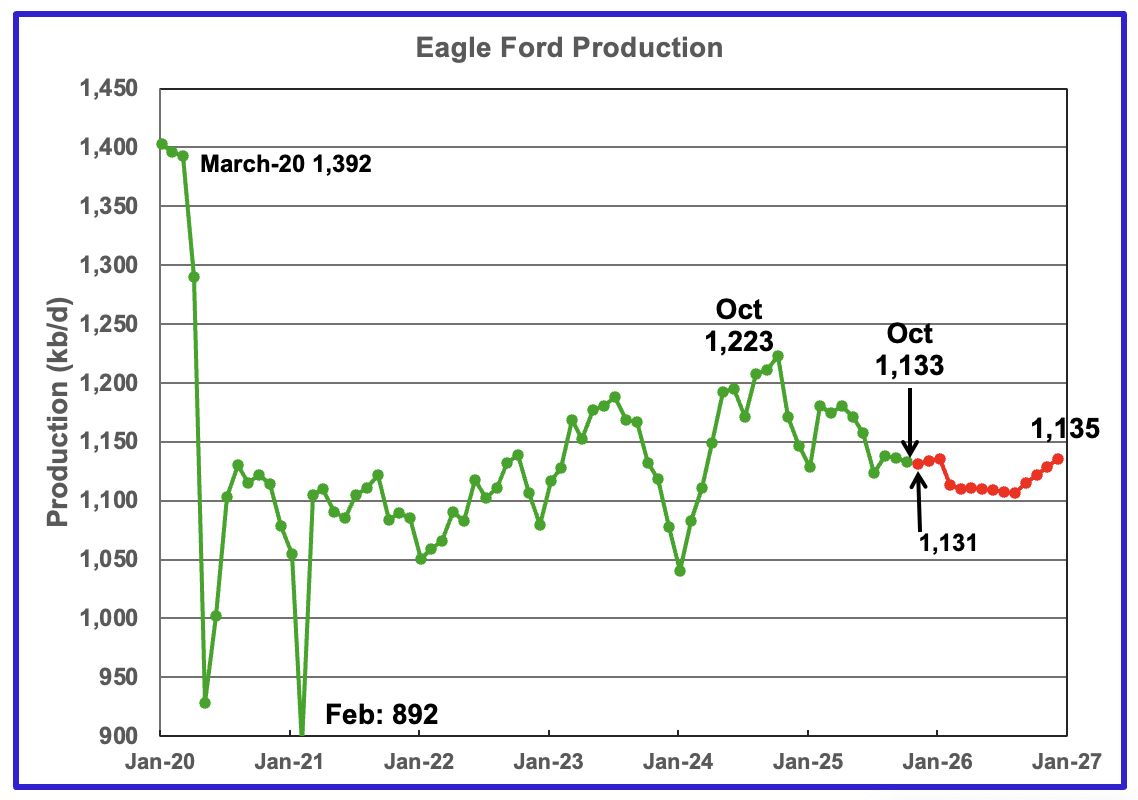
October’s output in the Eagle Ford basin decreased by 3 kb/d to 1,133 kb/d. November’s 2025 production is forecast to drop by 2 kb/d to 1,131 kb/d.
Output in December 2026 expected to be 1,135 kb/d, an increase of 54 kb/d from the previous report of 1,081 kb/d.
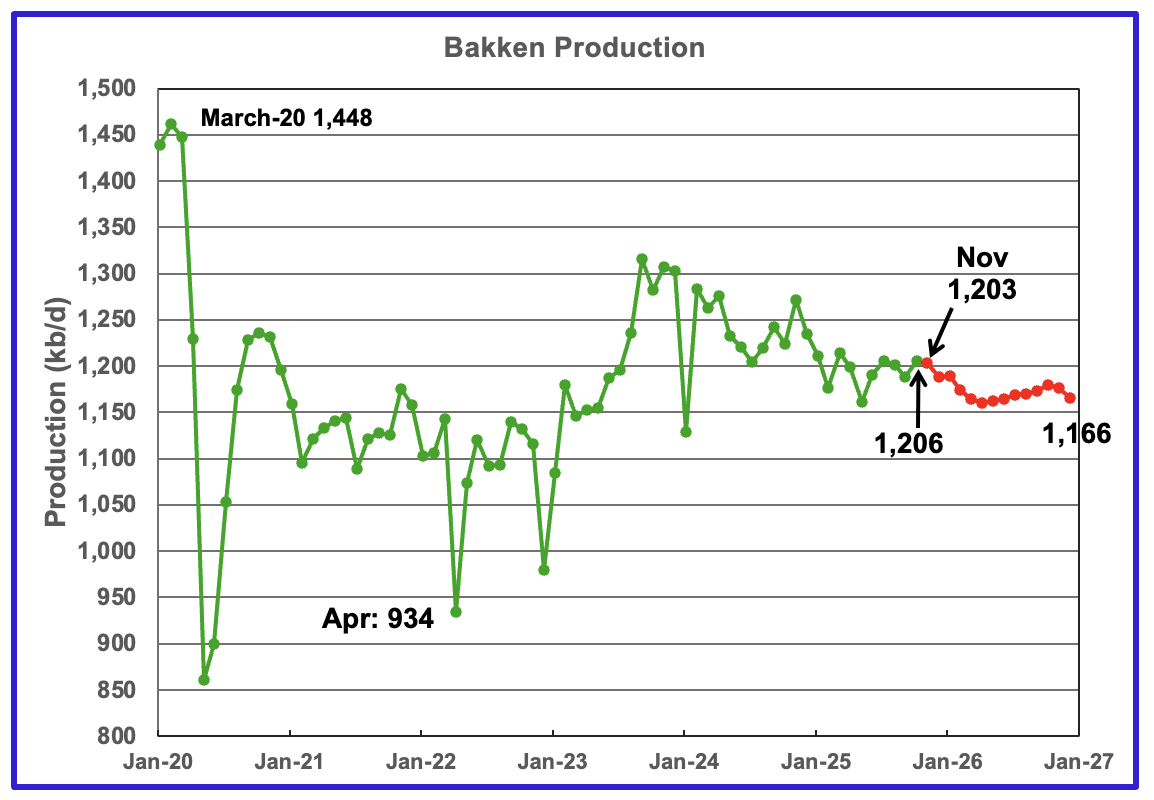
The DPR/STEO reported that Bakken’s October output rose by 17 kb/d to 1,206 kb/d. November production is expected to decrease by 3 kb/d to 1,203 kb/d. The STEO/DPR projection, red markers, shows output dropping to 1,166 kb/d in December 2026.
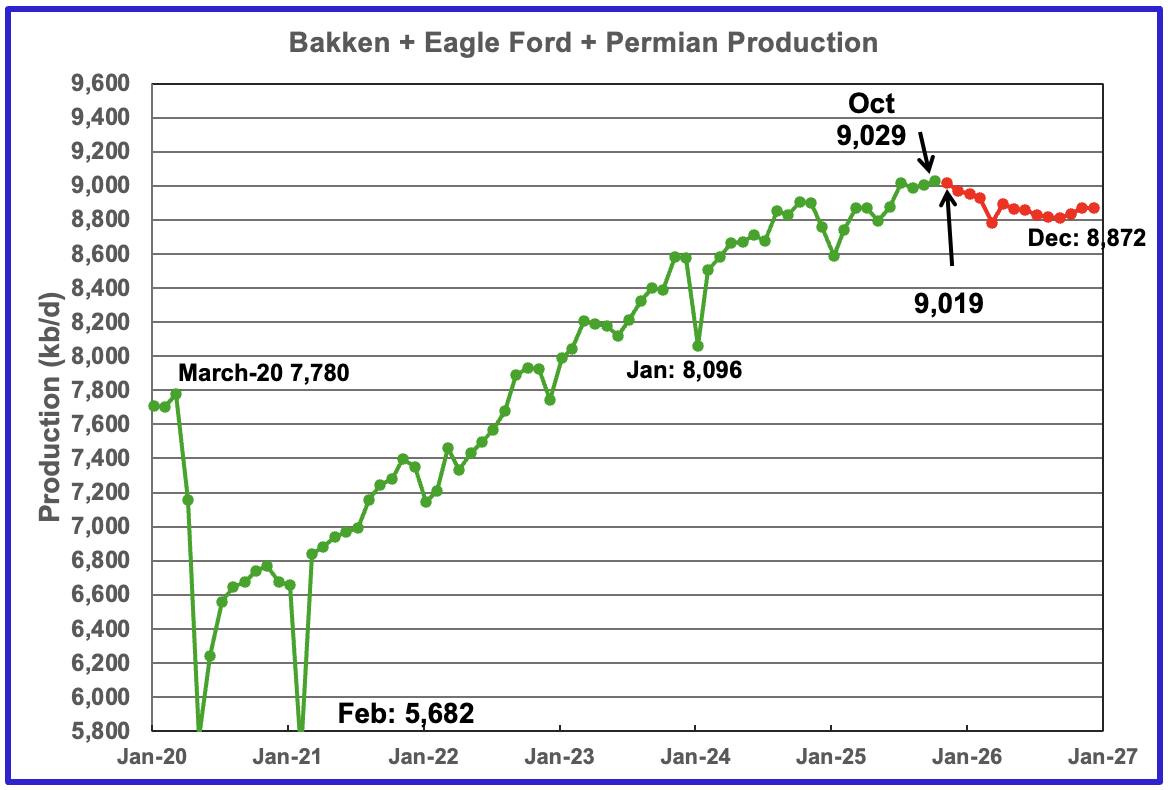
This chart plots the combined production from the three main LTO regions. For October output increased by 27 kb/d to 9,029 kb/d. Production for December 2026 is forecast to be 8,872 kb/d.
DUCs and Drilled Wells
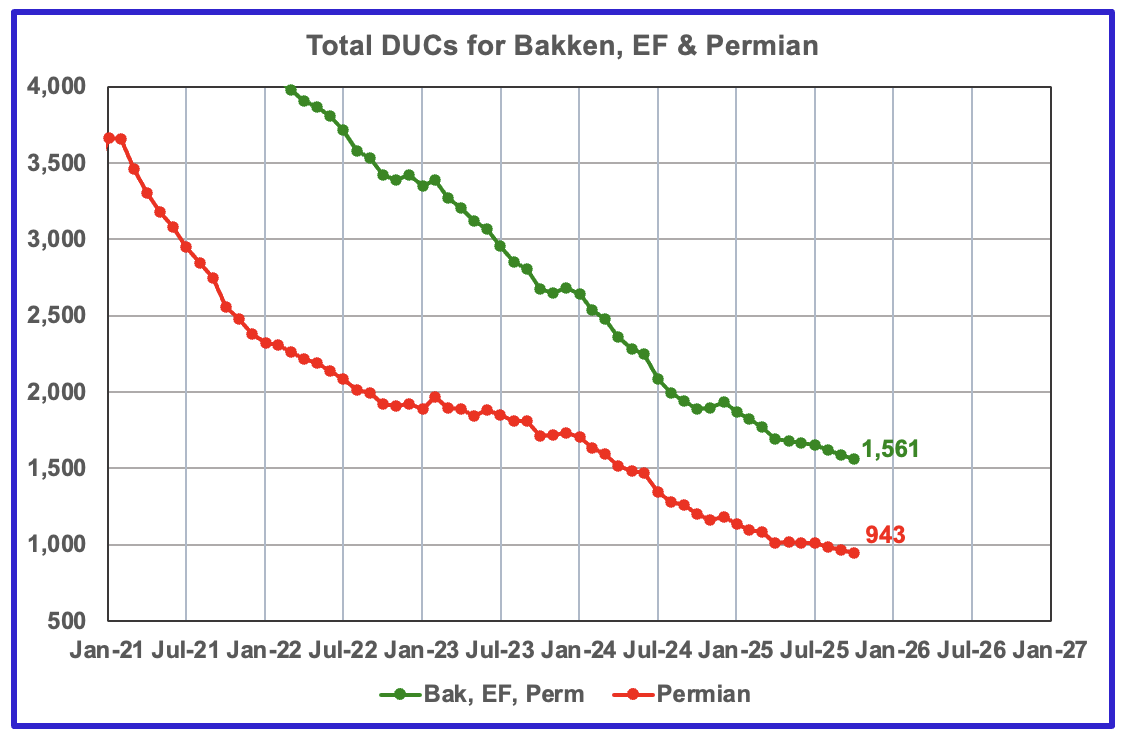
The number of DUCs available for completion in the Permian and the three major DPR regions has returned to a dropping trend. October’s DUC count for the three basins dropped by 27 to 1,561. In the Permian the DUC count dropped by 23 to 943.
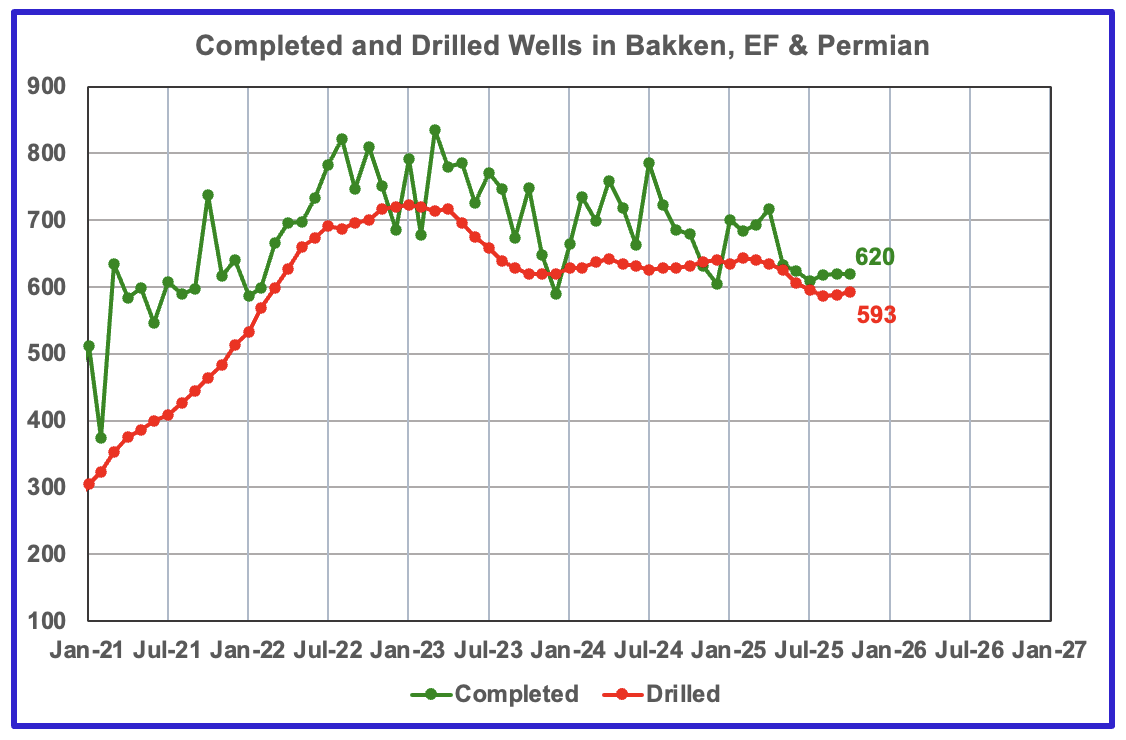
In the three primary regions, a total of 620 wells were completed in October, one more than in September. There were 593 wells drilled in October, 5 more than in September. For comparison, In January 2023, 722 wells were drilled.
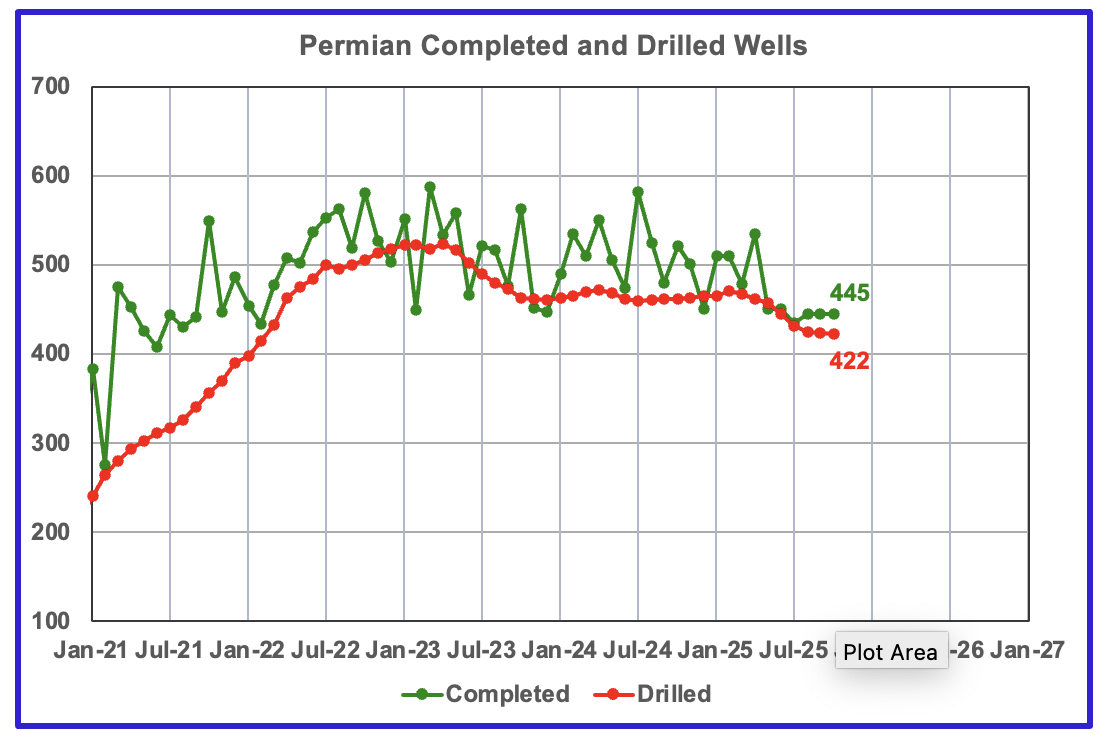
In the Permian, the monthly drilling rates have stabilized at 445 for the last 3 months.
In October 2025, 445 wells were completed and 422 new wells were drilled. This is the seventh month in a row in which the number of wells drilled has dropped.
87 responses to “Record US September Oil Production”
Trump Vowed Fewer Regulations and Lots More Oil. He’s delivered on One
This is a New York Time’s article that appeared in our local paper which I could not access. Used AI to cobble it together.
“As a candidate, Mr. Trump made a bold pitch to oil executives and lobbyists at a chopped-steak dinner at his Mar-a-Lago estate: Donate US$1-billion to his White House bid, and they would save more than that in taxes and legal expenses if he returned to the White House.
In fact, Mr. Trump’s tax and policy law is projected to deliver at least US$18-billion in government subsidies and tax breaks for oil, gas and coal over the next decade.
The biggest U.S. fossil fuel companies, including some of Mr. Trump’s top donors, are already reporting hundreds of millions of dollars apiece in tax savings, according to a review of investor calls and federal financial disclosures.
And yet, energy experts said the past year had hardly been rosy for the industry.
Companies may be saving billions because of tax breaks
Bribes of elected officials (aka “campaign contributions”) have an extremely high ROI.
It’s also worth pointing out that “Trump Vowed Fewer Regulations” is a FF advocate’s talking point: subsidies and tax breaks are not deregulation. Deregulation suggests efficiencies: faster permitting or simplified reporting, but these are just unnecessary handouts.
How OBBBA tax changes affect energy companies
Below is an article that breaks down what key OBBBA provisions mean for energy businesses and how sector leaders can help their organizations turn these policy developments into competitive advantages.
https://rsmus.com/insights/services/business-tax/obbba-energy-sector.html
The tax subsidy program for oil/gas production is consistent with the long-term US policy-
Use it up Fast.
Most of these new tax ‘reduction’ incentives via the BBNB, way different from “subsidies,” which imply that the oil and gas sector is sent taxpayers money to drill wells, are old, and a lie, which Nick is very keen on and forever ready to lie about. Why anybody listens to him is sort of humorous.
By the way is this a forum on determining “peak oil” or just just when the U.S can eliminate all oil whatsoever? Its very confusing.
My industry is able to reduce tax liability, some of the highest tax liability in the entire U.S. corporate tax scheme, but only if we are making money, or profit, by drilling more wells. The obvious benefit to all of that to the American society are obvious, present company excluded.
There are only three aspects of this bill that are new, for instance the ability to expense all leasehold bonuses paid to, for instance, BLM bonuses as high as $120K an acre in the Delaware Basin. Those bonuses benefit the American taxpayer, directly, by the way. Lease bonuses do not translate into automatic benefits to oil companies. The acreage bought from the FEDs then has to be proven productive. That should be obvious, except to anti-oil Nick. If oil is found on those BLM leases it would otherwise be logical, to any body but Nick, that more oil would lower gasoline prices, for instance, and benefit America society.
Sadly, for anti-oilbarrel.com, anybody that had any knowledge, explanation or insight into the real world has been run off. That is what happens when there is an agenda and a need to control the content of the forum.
If you only live from one stupid EIA press release to another and have no desire to dig deeper, you can’t see what is happening, what will happen in the near future. Tax incentives in a new, 4 month old bill, have NOTHING to do with the current state of affairs.
You folks need to do more work. From the bottom up. Don’t be lazy about it all or otherwise expect nobody to engage, which appears to be the case.
All this EIA shit, month to month, is ridiculous. It is the Energy Inaccuracy Agency for a reason. It has a political agenda, straight from headquarters.
My understanding is that accrual accounting is the standard for large corporations, especially publicly traded ones. It’s my understanding that accrual accounting requires lengthy depreciation of investments, using a depreciation schedule that roughly corresponds to the productive life of those investments.
It’s also my understanding that special exceptions to this rule, such as instant expensing, are “tax breaks”. These tax breaks are “tax expenditures”, which either reduce tax payments or create refunds.
Is it fair to say that these are generally accepted principles of accounting?
Dennis and Ron have blocked or belittled so many people who disagree with them that there is hardly anyone who bothers commenting now.
Hi Mr. Shellman,
Ovi provides extensive information from the RRC of Texas and the OCD of New Mexico in his analysis of the Permian Basin for comparison to EIA data and to provide a check on that data and to look at past forecasts to see how accurate they have been. He also uses data and news from a number of different sources in his reports.
I have also tended to focus on the Permian Basin using the Novi data and building a well by well model to anticipate future output from the Permian, this is independent of EIA forecasts and uses data and analysis from EIA/RRC/OCD and Novilabs as a check. A recent scenario has a low case base on Jorge Garzon’s analysis of pressure depletion in Midland and Delaware with oil prices of $60/b and $2.50/MCF in 2025$ or less at the wellhead in the Permian, the medium case assumes prices rise to the 10 year average in 2025$ and the high case assumes high prices of $100/b for oil and $5/MCF for natural gas or higher in 2025$ in the Permian Basin after 2030. I think somewhere between the low and medium cases is most likely, but I will be wrong no doubt. Chart at link below seems to have something to do with peak oil in my view.
I present the EIA AEO reference scenario to show how different it is from my analysis (it is even higher than my “high case” which is my guess with about a 5% probability of being exceeded.) Like wise my low case has by my guess about a 5% probability of URR being lower than that guess. I think your analysis would be lower for the low case maybe a URR of 35 Gb for Permian tight oil? Proved reserves plus cumulative at the end of 2023 was roughly 28 Gb for Permian tight. At end of 2023 2P Permian tight oil reserves plus cumulative tight oil output was about 35 Gb (assumes 2P reserves=1.5 times proves reserves).
EIA data is pretty good, forecasts by anyone tend to be inaccurate, just the nature of forecasts.
permian scen 251205
Mike
In the OBBBA document I attached in the comments section, there is this statement regarding Bonus Depreciation.
“For oil and gas companies, this means they can immediately deduct the cost of qualifying assets, such as rigs, well equipment, pipelines, and processing facilities— freeing up cash that can be reinvested in growth. Whether upstream, midstream, or downstream, the ability to expense these assets in the year placed in service improves returns and supports long-term investment strategies.”
I have looked at some of your Well Cost/Economic analysis at your site in the past. How does this rapid depreciation of qualifying assets change the economics?
Ovi,
My understanding is that “Intangible” expenses (like labor and fuel) were previously fully deductible in the year incurred (mostly the first year), and included very roughly 75% of the cost of drilling a well. If I understand this correctly, now tangible expenses (the other 25%) are fully deductible.
So 100% of the expense of drilling a well is now fully deductible in the first year?
Ovi, it changes nothing, essentially, or very little. Almost all lease bonuses subject to this new tax law are relative to Federal onshore BLM or offshore block bids. Privately, all shale oil basins are leased and only small tracts of Federal lands (New Mexico) come available and those lease bonuses benefit American’s directly. Nick wants additional taxes paid on that, which is stupid…like working your entire life to provide for your family, then having to give it away to pay taxes, again, when you die.
By the way the percentage of IDC is more like 65-35. Operators then drill wells on these BLM tracts and the royalty benefits Americans as well.
The reduction in BLM RI burdens from 3/16ths back to 1/8th are a much bigger deal and THAT may be causing some additional activity in Eddy and Lea, where almost everything is BLM/Federal land.
If the far liberal left is 100% sure that we do not need hydrocarbons in the U.S. to provide transportation fuel, then end fossil fuels tomorrow. Good luck.
That of course is not the case, nor will it be for several decades and the liberal, anti-oil left, like Nick, and Dennis, is just mouthing off without regard for the economic well being of the nation.
Otherwise, we’re at the end of the fossil fuel era, until the far liberal left gets its shit together about generating electricity for EVs, it ought to be promoting hydrocarbon incentives big time.
You want to know to. Ovi…why. Me too. Numbers for the sake of numbers are nothing. I understand the tight oil sector is trapped like goats with regard to dividend and interest expenses on long term debt, still in excess of $250B. I’ve been in the oil business. Its got no choice but to keep drilling unprofitable wells for cash flow.
The Permian sector is still drilling wells below $60 oil, <$1 gas because it has no choice. It likes 3 mile laterals in the Delaware Basin because they're IP360s are greater and providing immediate cash flow. Bone Springs in the Delaware and Eddy Counties is the place you wish to be, particularly with an increase in 0.0625 of all revenue relative to the new tax law. Its no more complicated than that. There is no new benches, no new technology, no bull shit proppant fixes, or soap fixes, those are all lies. No drama, just common sense.
The sector in the Permian is burning through its last well inventory to stay alive. You of anybody should know that.
This utterly stupid, never ending political dung heap on AOB is absurd. The ability to reduce taxable income, again for the U.S. oil industry is the highest in the world, promotes the drilling of additional wells and is keeping America in transportation fuel. Wackos like Nick think that is unfair. I say shit like what now appears to be $8B of welfare fraud in Minnesota is a lot more unfair. How come the Nicks on AOB never speak to stuff like that? Its good to call POTUS names, want him dead, impeached and/or in jail, broke…y'all say shit like that all the time. What does that have to do with oil and gas?
Nothing.
Hmmm. So the argument is that the oil industry needs tax breaks to produce enough oil.
And yet the US is a net exporter of oil & oil products. Wasn’t the argument that the US should conserve its oil resources?
Hi Mike,
As far as I can tell it is about $1B in fraud over a 4 year period (2019-2022) in Minnesota, not sure where you get $8 billion.
For the Federal Government as a whole from 233 to 521 billion of fraud was estimated by the GAO over the 2018 to 2022 period in the US (this is the 90% confidence interval). The $1 billion identified in Minnesota constitutes about 0.2% of the US estimated total. The percentage of US government obligations is about 3 to 7% represent fraud.
https://www.gao.gov/products/gao-24-105833
I have not made any comment about the tax changes in OBBB that affect the oil industry. I guess you think they are beneficial, over 2025-2029 the CBO estimates US government deficit will increase by 1.9 trillion due to $2 trillion less tax revenue.
https://www.cbo.gov/publication/61486
The fraud case in Minnesota is a story that Trump uses to spin away from the potential war crimes that might have been committed in September. A bigger problem is the rule of law and whether the Trump administration thinks it is subject to the Constitution.
This may seem abstract, but it affects the oil and gas industry which is not likely to be successful without viable public institutions, at least in my view.
On the dung heap of political stuff, I guess you mean the story I linked to of a person from Texas going to college in Massachusetts who was deported to Honduras by the Trump administration. I agree nothing to do with oil or gas and perhaps controversial. Some believe these actions are justified in the case of someone brought to the US illegally at 8 years old with no criminal record of any kind. Based on previous comments you have made I would not think you would agree. In any case, are these the kind of people that need to be removed from the US?
I do not think many were voting for this type of action and I would not think this is what many Trump voters expected.
Though I wonder about why it would be called dung heap, perhaps you support this type of action?
It is interesting looking at comments to these stories where many seem to support such action.
Seems pretty heartless to me, so much for the deportation of criminals. Do we feel much safer as a result? Personally the actions of the Trump administration should make one wonder if any of us is safe as the Trump administration seems to make up its own law. Not the way it is supposed to work.
An update to the story at link below and note the Trump administration ignoring Federal Court Orders, this is not how the US government is supposed to work, it is banana republic type behavior.
https://www.cnn.com/2025/12/01/us/babson-college-student-deported-thanksgiving-hnk
Morning Joe on Babson student case
https://www.ms.now/news/college-student-deported-trump-immigration-thanksgiving
CBO OBBB summary at link below
obbb
Mike
Thanks for clarifying where some of these tax breaks apply. It will be interesting to see if Eddy production continues to rise due to the enhanced tax breaks there.
If the far liberal left is 100% sure that we do not need hydrocarbons in the U.S. to provide transportation fuel, then end fossil fuels tomorrow. Good luck.
Mike
You think America needs hydrocarbons but at the same time think the industry needs subsidies. Apparently the need isn’t great enough to pay the cost of production.
The oil industry is like any other industry. It exists because it makes money. If it stops making money it will die, whether it is needed or not.
If an industry still hasn’t figured out how to make money after over a century of trying, then its political pull may be its only real value.
Mr. Alimbiquated, I think if you live in the UK, or anywhere in Western Europe, you should not be criticizing my country, nor its politicians, nor its policies, you should be thanking it, profusely, every day, since 1916 and other wise keep your meat pie intake closed.
As to the difference in being able to reduce taxable income (some of the highest in American industry) by reinvesting capital to replace finite hydrocarbon resources and… subsidies, like farm subsidies in the U.S. (getting a check), or being a lazy pig in the U.K. and living on the dole, you are either really stupid for saying that or really, really stupid, period. You folks would be very cold over there if it were not for Permian Basin tight oil and LNG imports. You’d be really cold and overrun by Russians right now if it were not for the U.S.
Dennis, I read your response to me just now. Jesus. I appreciate you occassionally saying something good about my blog, in between the criticisms, its not necessary anymore. I don’t get anything here (except from Ovi) except political hate. I am so done. Please, as a favor to me, to you, and your amazingly patriotic community, block me.
And seek serious help with this Trump sickness you all have.
Merry Christmas, y’all!
Patriotism. It’s a good thing. It’s great to love your country. I love the ideals of the US, which make it special.
“ You’d be really cold and overrun by Russians right now if it were not for the U.S.”
Yes, I’m glad to be in the US. What makes it special? It’s not the ability to make money – there are a lot of very wealthy people in Russia -we call them oligarchs, and we don’t respect them. Instead, it’s democracy, and power residing in the people not the politicians, and a unique ability to criticize our leaders and ask them to do what we want, not what is in their personal interest.
So, criticizing the current president is in the very best tradition of US ideals. Sadly, the current president doesn’t believe that. He feels that reporters and anyone else who questions him ought to be punished.
The current president really is more comfortable with Russian ways of doing things than he is with our US traditions. He would not have come to the defense of Europe in 1916 or 1940 – he believes in America First, which both in the 1930’s and now means not helping Europe.
It’s very, very possible to love the US and not like the current president. In fact, it’s essential.
There’s nothing more unamerican than trying to overthrow an election – I can’t understand how anybody can ignore that!
Informative report just released the other day by 3 professors who study hydrocarbon matters in California.
With all the ‘drama’ surrounding the recent/imminent closures of 2 refineries (~20% of Cali’s capacity), a knock-on effect has been highlighted … namely the possible shutdown of a pipeline supplying some crude to the remaining (essentially 2) refineries in the Bay area.
Pipeline owner – Plains All American – claims to be losing $2 million/month with larger losses projected when Valero’s Benicia refinery shuts down in a few months.
Absent the remaining refineries paying (much?) higher shipping tarrifs, the San Pablo Bay pipeline may halt deliveries.
This would mean increased imports of the needed oil/refined products.
Not only would higher ultimate higher prices ensue, the maritime import capacity may prove to be inadequate to satisfy downstream demand.
A particularly sensitive issue is the shortage of avgas for the numerous military aviation facilities in the state.
Interesting times.
Thanks.
Link to paper for those interested below
https://californiaglobe.com/wp-content/uploads/2025/12/Blueprint-Soluition-Defin-Final.pdf
Here an article providing more information on this subject-
https://oilprice.com/Energy/Energy-General/Californias-Oil-Rush-Slips-Into-Its-Final-Act.html
… aaanndd, in the ever-evolving, always exciting world of hydrocarbons, comes this tid bit …
Outfit called Glenfarne is expected to make FID in a coupla weeks on the $40 Billion (plus), 800 mile long natgas pipeline from Prudhoe Bay to a new LNG plant to be built on Cook Inlet ($15 Billion cost for that baby).
In addition, a ~$15 Billion treatment plant will need to be built on the North Slope to get the gas pipeline ready.
And I thought the data center/AI guys were ‘out there’ with the hundreds of billions of dollahs being thrown around lIke it’s no big deal …
Coffeeguyzz,
Seems most of the long term contracts are with Asia, so this does very little for natural gas prices in the US, but it is beneficial for those in Alaska who may benefit from the royalties and severance taxes.
https://www.wcvb.com/article/babson-college-student-deported-after-trying-to-fly-home-for-thanksgiving-speaks/69625870
This is a really bad look for the US.
The fascinating question is whether Trump realizes how bad it looks. Is he so completely insulated from reality by sycophants that he has no idea how bad he and his policies look to the majority of people in the US and the great majority of the rest of the world?
https://www.pewresearch.org/global/2025/06/11/us-image-declines-in-many-nations-amid-low-confidence-in-trump/
https://news.gallup.com/poll/699221/trump-approval-rating-drops-new-second-term-low.aspx
“ President Donald Trump’s job approval rating has fallen five percentage points to 36%, the lowest of his second term, while disapproval has risen to 60%.”
Nick G,
Publicly registered companies are required to report results to their shareholders using (GAAP) generally accepted accounting principles. They are required to report on their tax liability as required by the tax code. Most folks keep records so they can report on both.
Oil and gas companies need huge amounts of capital, and have raised bunches from wealthy people by combining the certainty of writeoffs with the promise of potential returns.
Dclonghorn,
I agree with all that, except…are you suggesting that the O&G industry isn’t viable without tax breaks?
Article from a few weeks ago on Permian Basin, well written.
https://www.reuters.com/business/energy/shale-rigs-idle-layoffs-rise-60-oil-tests-resilience-permian-2025-11-21/
Rig Report for the Week Ending December 5
The rig count drop that started in early April 2025 when 450 rigs were operating had a small rebound this week. Drilling continues at unabated rates with WTI at $60/b.
– US Hz oil rigs rose by 2 to 365, down 85 since April 2025 when it was 450. It is also up 3 from the low of 362 in the week ending August 1. The rig count is down 19% since April.
– New Mexico Permian added 1 to 97. Lea added 3 to 62 while Eddy dropped 2 to 35.
– Texas added 1 to 168. Texas Permian was unchanged at 133. Midland and Martin were unchanged at 24 each.
– Eagle Ford was unchanged at 26.
– NG Hz rigs dropped by 1 to 111.
A Rig
Frac Spread Report for the Week Ending December 5
The frac spread count was unchanged at 173. From one year ago, it is down 47 and down by 42 spreads since March 28.
A Frac
turned out that the Low GOR Black Shale oil from VM, Uinta and China lacustrine shale oil could have good productivity because they have very low asphaltene.
https://www.linkedin.com/pulse/copy-driving-forces-highly-productive-low-gas-oil-ratio-sheng-wu-fhutc
https://www.linkedin.com/pulse/differences-between-low-gor-api-black-shale-oillgabso-sheng-wu-bpfjc
Sheng Wu,
I just spent several – fruitless – minutes with ol’ Chatbot trying to locate the data/charts that the North Dakota’s EERC posted relating to Liberty’s Stomping Horse EOR project.
This 20 page EERC report came out in 2020, IIRC.
It has since been pulled off the net and is no longer publicly accessible.
Hmmmm …
Reason that I am posting this is because that report seems to 100% validate your observation (if my understanding is correct) that it is the asphaltenes that are the primary cause of the ‘dreaded decline’ in shale wells.
Specifically, the larger molecules tend to block the pore throats and only the smaller and smaller molecules get through.
Hence, the ever rising API numbers along with lower overall output.
This was clearly implied when the molecular make up from the recovered streams from Stomping Horse were heavily disproportionate containing C10 through C18 (going from memory).
If, as you say, the Dead Cow has fewer asphaltenes to begin with, this would buttress the observation that it is these larger molecules – not primarily pressure depletion – that prematurely curtails oil production.
The EERC folks have consistently shown that wet gas – ethane and especially propane – and NOT methane produces by far the most effective results in EOR.
This, clearly, would be due to its miscibility, aka ‘dissolving’ the blocking heavies.
Sumptin’ like dat.
Sheng Wu,
As Mr Shellman points out the high IP of most tight oil plays is a feature that improves short term profitability. Cash flow earlier is more valuable than cash flow later when considering the economics of the project.
Coffeeguyzz and DC,
I have been searching for a production model that explains high-yield LGBSO.
First, a technology history review on tight and shale oil and gas.
Note that Bakken is really not shale oil, i.e. producing from Mid-Bakken/Three Fork tight siltstone and feldspars with zero TOC and shale, but EF is really in the shale like Permian too. In Bakken, the mainstream already formulated the model that oil can not be produced from Shale with high TOC, because the TOC will adsorb the oil while zero TOC tight rocks could.
Barnett shale gas revolution happened almost in parallel to Bakken tight oil development, and yet they took independent routes in terms of fracking, Bakken still use conventional fracking and Barnett used slick water fracking. They both later used lateral drilling though.
First Bakken wells back in 80/90s indeed drilled in upper Bakken shale sweetspots and produced some oil, but not scalable, and then they found that they could apply fracking in the zero TOC tight rock mid-Bakken and scaled into today’s Bakken.
Barnnett field was first only drilling in the upper tight sand, and then George Mitchel persisted in testing the shale, and finally Nick Steinsberg succeeded using water fracking in shale — lowered cost and significantly improved production.
The current mainstream 2012 BP CANDER model for shale oil, posited that “viscosity is the determining factor,” suggesting that HGLTO with higher GOR & API is the requirement for shale oil to produce from ultra-tight shale with adsorptive TOCs. This is about 4 years after 2008 discovery well in Eagle Ford shale, and this time they are really drilling in the shale, sometimes with TOC over 7%. Cander 2012 model was to resolve the Bakken “oil can not be produced from shale” dilemma, arguing that in order to produce from the much tighter shale and adsorptive TOC, the fluid has to have low viscosity, i.e. High GOR LTO (HGLTO), and even HGLTO can not compete with shale gas. This effectively put a limit to true black shale oil. Leaving many shale bashers claiming shale oil is not oil, but NGL or gassy oil at the best, and US can not use and has to export.
Then, in 2018 there was a pilot shale lateral drilling in Bohai Bay DaGang, and the oil is API ~25deg, and GOR~200scf/bbl, and I was lucky to report it in URTEC2021, almost parrall, the Jimusaer shale patch reported good results with API~20~23deg and GOR~50scf/bbl. At first, I thought they are just conventional oil, but later on in 2023 more evidence came from Vaca Muerta where the Jimusaer similar well BPE2301 also reported 70KBO in 2 months, and now over 700KBO. Then, there are more reports of such LGBSO from VM, Uinta, Subei/Shengli China saline lacustrines. Data in past ~5 years confirmed that they could actually outproduce Permian in US.
DC,
Mike surprisingly gave some credit to shale drillers!
I agree with him that the high IP is the feature of shale/tight oil and gas, that is what made shale gas a frenzy bubble in the beginning. The pre-shale revolution shale gas production actually has a long slow decline but IP is too slow to begin with so it is not economical. When the high IP of Barnett shale appeared in 2005, operators and investors used the same slow decline curve and saw shale as a cash printer.
But, we see that improved completions had some positive improvements on shale gas, but not on shale oil. The IP is higher, but the decline is much faster in shale oil, although shale gas decline is somewhat slower. In Bakken, there is already an obvious invariable EUR normalized lateral?
https://novilabs.com/wp-content/uploads/2024/03/2.-Well-productivity-2.png
Similar EUR invariables happened in Permian.
So, I am also trying to find a model to explain this Shale/Tight OIL EUR invariable.
Coffeeguyzz,
The ~1% asphaltene (ASP) level unique properties of LGBSO is a surprise finding came to me only yesterday, and it is quite counter intuitive for black oil to have such low ASP levels, usually should be over 5% to 20%, averaging >10%.
It is not surprise to see ASP~1% for US marine sourced shale/tight oils, such Midland conventional light sweet oil also have below 5%, as low as 1% ASP oils. But it is a conventional wisdom that oil with API<35deg will see ASP level going up fast, and that is why there is a conventional conjecture that the lower API associated with low maturity and high level of ASP. So, high ASP level is associated with low maturity oil. But, the shale drilling results from Jimusaer with API20~23 deg oil has only 1% ASP is quite outlier. I will try to collect samples/data from VM, Uinta and other LGBSO basins in China.
But, so far only Jimusaer shale field in China reported such low ASP levels, and I could not find ASP data from VM or other shale field.
Dennis, you are out of your brain pain, man. You need to take 2 aspirin. shoot some Patron shots and see if you can get your Trump anxiety fixed tomorrow in your local emergency care store. Seriously, I feel sorry for you. You can’t think straight. When you go to the doctor, take Nick with you.
Sheng, you are a PhD in chemistry, and self described shale advocate. I would ask where you got all this oil experience, but I do not care. I’ve had working interest in shale oil wells. They suck. When and if the tight oil sector does something good, makes some money, I will root for them. Now, they are not helping American citizens, not even shareholders. It is, in fact, destroying America’s energy future.
When YOU go to the doctor you need to take Coffee with you, though I think he will be sent straight to Hospice. Annoying, I don’t care what you do with him/her.
Longer laterals, more perforated interval, bigger IP360s help nobody in American except American tight oil and tight gas importers. All those wells are doing is draining America, faster. That is the ultimate fallacy in your cheerleading.
Whose side are y’all actually on?
Ovi, all my ranting aside, a 1/6th change in RI burdens make a big difference in Delaware Basin well economics. But it does not entirely explain why rigs stay constant in Eddy and Lea County. The Bone Springs does. Honestly, you have to understand the business of oil when the asset you spend so much money on depletes 90% in three years. Its tough way to make a living. GOR aside, its all about remaining drillable locations in New Mexico and how negatively future wells will be adversely affected by pressure depletion.
The Bone Springs is a different animal…it is almost conventional like with exceptional porosity and recovery rates of OIP that can exceed 30%. What that means is that Bone Springs wells drain bigger areas, are more subject to parent/child problems, and ultimately will crash harder. And when that happens, in Lea County particularly, the big Permian miracle will be over.
Think the biggest producer, EOG, in Lea County does not know that? Why is it fleeing to Ohio, or Abu Dubai, or Trinidad? Its back in my country leasing some actual dog shit stuff. Its desperate. Tight oil companies can only do what they do, drill the snot out of tight oil for 8% RR.
Dennis, stay hydrated and seek help with the Trump thing.
Thanks Mike,
On occasion you criticize the Trump administration as well, though for different reasons. If you don’t think the assault on the rule of law by the Trump administration is a problem, I guess you need to imagine what you would think if Biden or Obama had operated the way Trump has since Jan 20, 2025.
I remember Mitch McConnell saying Trump should not be impeached because nobody is above the law. Unfortunately the Supreme Court moved the goal posts on that, so next time around Senators won’t be able to make that argument.
I look forward to November 2026, hopefully there may be some accountability at that point and some oversight by Congress.
Sheng Wu,
Those are not normalized well profiles and note that they assume 40 year well life which is very optimistic, my expectation is about 25 years at most, more likely 20 years. Also note these are average well profiles for the core counties of the North Dakota Bakken/Three Forks.
See post linked here or full explanation
https://novilabs.com/blog/north-dakota-update-through-jan-2024/
The best wells were in 2020 and second best wells in 2021 and third best in 2018, the 2018 wells about 400 kb at end of life at 20 years. The 2021 well about 4% higher EUR than 2018 well (416 kbo) and 2021 well about 7% higher EUR than 2018 well (428 kbo).
Note that if we normalize for lateral length EUR might be lower for 2021 wells, though I do not have lateral length data.
Chart linked below indicates well productivity declining in Bakken/Three Forks since 2020.
https://public.tableau.com/shared/3RXZKDHMS?:toolbar=n&:display_count=n&:origin=viz_share_link&:embed=y
I’m old enough to remember when the doomers were saying 10-15 year lifetimes. Now it is 20-25. Yawn.
DC,
you are correct on the Bakken EUR Novi plot interpretation.
I was confused, because there is a research done by Frank Male from BEG (now in Penn State), and his work used normalized length EUR, and conclusion is that the IP is higher, but EUR barely keeping up.
Some of the EUR over 5 years could be hard to predict — the type curve keeps on changing, and price also factor in shut-in limit.
So, it is close to say there is an invariable of EUR or recovery factor, although pressure drop and price etc. could all factor in.
Sheng Wu,
I disagree that the EUR is invariable, but it might be close. From 2017 to 2022 average Permian normalized EUR decreased at an average rate of about 1.24% per year in terms of EUR per 10 thousand feet of lateral length. Average EUR per 10k lateral feet from 2017 to 2022 about 453 kbo with a range of 420 kbo in 2022 to a high of 468 kbo in 2017. The ols linear trend is an EUR decrease of 5.6 kbo each year. The exponential OLS trend has an annual rate of decrease of 1.28% per year. As room for new wells in the core areas becomes scarce, I expect the EUR rate of decrease is likely to accelerate.
Nony,
The point was the chart that Sheng Wu linked to suggested a 40 year well life. For the average Permian 2020 well with an EUR at 22.5 years of 466 kbo (output at 5 bopd at that point) cash flow from all 3 streams (oil , NGL, and NG) becomes negative at 143 months (12 years, EUR=422 Gbo)from first flow at WTI of $60/b, NGL at 30% of oil price and natural gas at $1.50/MCF (typical of WAHA prices). An increase of the natural gas price to $4.50/MCF at current oil and NGL prices (assume natural gas egress is unlimited) would increase well life to 182 months (15 years, EUR=443 kbo.) Leaving natural gas price at the high $4.50/MCF level and raising oil price to $90/bo, with NGL at $27/b, cash flow becomes negative at 218 months (18 years, EUR=455 kbo). At an oil price of $160/bo, NGL at $48/b, and natural gas at $5/MCF, cash flow becomes negative at 269 months (22.4 years, EUR=466 kbo). Well output of C+C is 5 bo/d at 269 months from first flow, gas is 57 MCF/d and NGL about 4.3 b/d at 269 months.
EUR will depend on the price assumptions for oil, NGL, and natural gas and OPEX, royalty rates, and severance tax rates.
Note that I assumed 30 year well life when I started looking at tight oil in 2013, those with more knowledge pointed out that was a very optimistic assumption so I have adjusted to make the analysis more realistic.
https://www.reuters.com/world/europe/ukraine-hits-pipeline-sending-russian-oil-hungary-slovakia-source-says-2025-12-03/
Special Operations forces blow up Russian oil pipeline.
If they get to those Siberian pipelines????
Nick,
The oil business is known to soar with the eagles one day and scratch with the chickens the next. No matter what the economics were at any given time, the promoters were able to pass along significant tax breaks for decades, which helped deals get done, and wells to be drilled.
Today it seems a very small number of huge private and public companies are doing almost all of the drilling. I don’t think they are doing it to harvest tax losses.
So, you feel that oil & gas companies in general don’t need tax breaks? They’d be just fine with standard depreciation schedules, etc?
Of course they aren’t. Its a dumb, pointless allegation directed at an industry that people like Nick, and Dennis hate.
You can’t take advantage of reducing taxable income unless you are making taxable income and I suggest the oil industry subsidy whiners do their SEC homework on that. The new BBTB law, or whatever you wish to call it was signed in July.
Has the evil oil industry added a lot of rigs since July to take advantage of the new bill?
Hardly.
“Of course they aren’t”
So, the oil industry does not respond to tax breaks by drilling more than they would have otherwise?
Wow. Then what’s the point of giving the industry tax breaks? The traditional justification for tax breaks is that they incentivize behavior desired by the people giving the break. If it has no impact on the industry, why shouldn’t the government save the roughly $55B* that they cost??
———————————
*$35B for existing tax breaks and about $20B for the latest in the BBB.
https://thefactcoalition.org/report/oil-and-gas-tax-subsidies/
Thank you Ovi for the job. You wrote : ”In early 2026 the Alaska Picca field is expected to come online. At its peak, Pikka could produce up to 80 Mb/d from 45 wells.” I suppose you mean ”80 kb/d” because 80 Mb/d is roughly the world oil production (rather at 84 or 85 Mb/d)?
US oil and gas industry has a weird Imperial O&G Units.
They often use “M” for “K”, and “MM” as “Million”, while “B” still stands for “Billion”
They even have barrel, BOE and which is even more confusing that medicine prescriptions in Latin.
EU/UK also has some weird unit like BTU, eG T Joules, GWH, MMWH,….
Sheng Wu,
The M, amazingly enough, is a Roman numeral! M stands for 1,000, and MM stands for 1,000,000 (I guess the Romans never had to count to a billion).
I agree – it’s very odd. They really ought to move to the metric system (k and M), but if they did that then who knows, people might want them to stop using “barrels”, something which hasn’t been used to hold oil for about 150 years.
The O&G industry is pretty resistant to change…
Jean
Thanks for noting that. Yes 80 kb/d.
Fixed
Andre predicted 117 dollars a barrel at end of year.
I’ve got ~20 days for World War III to start and I may still have a chance to win!!
The average WTI spot price from Jan 1 to Dec 1 2025 has been $66.08/b, and on Dec 1 the price was $59.47/b. Looks like I will not be close to correct for my 2025 oil price guesses.
Not a surprise, I am always wrong when I guess what will happen in the future.
https://peakoilbarrel.com/us-november-production-rebounds-after-hurricane/#comment-713771
HOLE IN HEAD
02/04/2021 at 8:33 am
Dennis . $ 25 (in 2019$) by 2025 .
My calculation ;
Oil to Gold ratio
Year Price of gold per oz Price of oil per barrel Number of barrels available per oz
2019 $ 1392 $ 64 21 . 75
2025 $ 4000 $ 70 57 . 15
Price of oil today
21.75 x 64
———– = $ 24 . 36
57 . 15
Hole in Head,
In your 2021 comment you said nothing about the price of gold, it was $25/b in 2019 $ by 2025. The average price for 2025 would need to fall to $31.70/b in 2025$ to be about $25/bo in 2019 $. Gold price is irrelevant.
We don’t use physical goods as a measure of value in the modern economy. if we did there could be as many price schedules as there are goods as any good could be arbitrarily chosen as THE measure of value.
What makes an ounce of gold special? Not much really.
Sorry , I don’t know why figures are not aligning with the headings , however you will get the gist . Dennis , this is real money not the DXY index which is nothing but Fiat vs a basket of other Fiat currencies . Iron Mike was the only one who said ” possible ” .
Politics aside, please consider for a moment what kind of place the world would be without crude oil and natural gas. I would point out, once again, that the age of death prior to electricity, was 46. That wasn’t all due to the magic of electricity, but to other things that came in with the hydrocarbon world: pharmaceuticals, surgical garb, antiseptics, means of conveyance to a hospital when the old appendix ruptures and peritonitis is setting in. The flavor of this site should be, watch out, we’re getting closer to the point of peak oil. Rather, it has become, the sooner the better.
In my chosen field there were the talkers and the doers. They were rarely the same person. Mike Shellman has the capacity to irk me at times but the guy is one of the few people in the world who was blessed by the ability to think out a project, then do it, and also to talk about it in its many forms. We would all–even us old ones–be wise to listen to him. I don’t have the tools to figure out the yield of all the shale basins—Niobrara, Bakken, Granite Wash, Anadarko, Permian, Eagle Ford, Barnett, Haynesville, Utica, Marcellus, Monterey, Powder River, Texas Bossier, Buda, Fayetteville—that will soon provide electricity to the many data centers being manufactured, or otherwise make the LNG trains run to payout. I just don’t know that. But when Shellman says the Bone Springs formation–as thick and oil dense as it is–serves as the canary in the coal mine, I know enough to listen.
I’m pulling for America, because that’s my home. But I’m also concerned about Great Britain, Ireland, Scotland and Wales, because those were the homes of my ancestors. Additionally, I’m old enough to realize the futility of harboring animus against any man, so I’m not eager to see others suffer. There’s plenty of room out there to incorporate solar and wind into a complex energy mix. Even add in some nuclear. However, my fervent belief is that NG will always be at the backbone of the generation of electricity, spinning the turbine when nothing else under the sun works as advertised.
Now we can add in some politics. When you track the oscillations of the price of a barrel of oil, you’ll easily recognize that oil producers and oilfield workers and even investors do better during a Democrat administration. However, the global subsidies to push renewables so fast almost wrecked the economies of several major countries. Given normal market forces, oil and NG can readily hold their own, and with no “tax breaks” the prices of these commodities would rise to a level where they found a reasonable market and also didn’t create a frenzy. Given a non-corrupt Texas Railroad Commission, there would have been an automatic “governor” on methane flaring and venting. In short, politics has screwed this up more than the ordinary man could possibly do it.
I’m going to continue to read these spaces because now and again someone comes along who actually has either a niche view of a component of the oil and gas industry or a world view of the entire thing. Whoever Mr. Kaplan is, send him a Christmas gift, because he has an uncommon knowledge of the GOM and is willing to share it. That fellow who knows so much about refineries is a valuable poster. I like reading Sheng Wu, but not everything is “lacustrine,” nor does a low GOR always correlate with “Black Oil.” And yes it’s the asphaltenes that clog up frack fissures and pores but there are many hydrocarbons with aromatic rings and long chains that are culprits too–the mix is dependent upon the kitchen in which the oil was cooked to perfection. I learn from all of you.
Gerry, its frustrating to have devoted my entire life to a better understanding of ALL aspects of oil and gas, from rocks to tax laws and everything in between, so that I could feed my family and the families of my employees… to then be overrun by out of work internet experts who just 8-10 years ago did not know how to spell oil. I let that get the best of me sometimes and said something to you personally a while back that was stupid, that I regret. I know I irk you. I do everybody. Its just the son of a bitch I am.
You always have valuable insights and people should listen to you.
I detest politics, rail on all presidents over oil and gas policies, eleven of the bastards, by the way, but never called them criminals because they were stupid, nor wished them dead. Not even the worse. I find that pathetic beyond description. I try and stay in my knowledge lane and remain dedicated to trying to make people understand their hydrocarbon future better. I feel it my duty. Thank you for what you said, sir.
Mike,
I appreciate your personal thoughts. Like you, I feel a duty to help people understand their energy future.
A thought: you shouldn’t make any assumptions about the people you debate with. I, for instance, have been railing on *12* presidential administrations (counting Trump twice), and thinking about and working professionally on resource and energy issues since the Carter administration (BTW, I liked Carter – a nuclear engineer!).
I’m sorry I irked you with my comments about criminality. I take no satisfaction or pleasure in describing the current President that way – I greatly prefer to be able to respect our leaders. Sadly, this isn’t the first criminal president – Nixon resigned for a reason, and Reagan clearly broke the War Powers Act. But the current president is in a different level, a different world. Do you really disagree that Trump tried to overthrow the 2020 election? If so, Vice President Pence would really disagree with you – he reports that Trump personally asked him to engage in an illegal reversal of the election.
This president applied a 50% tariff on Brazil purely because it prosecuted its past president for trying to overthrow an election in precisely the same way. Bolsonaro was convicted and jailed for 27 years, and this infuriated Trump – this is a confession, on its face, and an illustration of Trump’s willingness, even eagerness to encourage criminality and attempt to coerce obedience in destructive ways.
Again, I take no pleasure in saying this about Trump, or in disagreeing with you about it. It’s simply the truth, despite the constant pretense by Fox News and Republican sycophants. It’s important mainly because Trump’s policies are equally arbitrary, capricious and incompetent. Trumps tendency toward illegal methods and coercion are hallmarks of an authoritarian approach which prevents broad consultation and consensus building which leads to realistic and effective policies. They appoint incompetent staff, who are afraid to speak truth to power (have you watched Trump’s cabinet meetings – the sycophancy is really embarrassing). They act alone and make bad decisions on badly inadequate information.
Examples include the recent tariff policy which has been extraordinarily badly planned, arbitrary, capricious and counter-productive; and the lifting of CAFE rules which will leave US automakers in a extremely weak competitive position vs China.
Authoritarian leaders typically harm their countries, and Trump is seriously harming the US (and the world – ask Europe).
Thanks Dr. Maddoux excellent comment.
I also have learned much from many who post here and I apologize that my tone offends many.
Hi Mike,
Thanks for your great comments here.
For those who do not already follow Mike’s Blog at http://www.oilystuff.com he has a recent comment in the forum at link below. He has great charts from Novilabs and insight that is unmatched.
https://www.oilystuff.com/group/economic-discussions-well-costs-debt-finance/discussion
If you address me in the future, Nick, you must refer to me as Mr. Shellman… until I give you the courtesy otherwise. That is the Southern way. I will extend you the same courtesy providing you come from underneath your rock, for the first time ever, and provide your full name.
I have, after nearly 10 years of commenting on POB, developed all the opinions I need to about you, sir. You are a pompous ass who feels he has the intellectual and moral superiority over others and who has constantly tried to control the content of this forum to suit his political agenda.
Who the fuck are you to lecture me about anything within a thousand miles of anything oil and gas?
I do not believe you “regret” anything you say negatively about the current political cycle in our country…I think you are, forgive me, an evil son of a bitch. And, someone who would love to forever split my country right down the middle. I think of you as very un-American.
Have a nice day.
Yeah, I get it. You’re defending your career, your industry that supports your friends, family and community. You want respect, not criticism, and you can only take so much. That’s normal.
So, we’re done for today.
I’m continually amazed at the USA’s oil and natural gas production despite low prices.
With the exception of during the initial phases of the Russian invasion of Ukraine, oil and natural gas prices have been weak since late 2014.
Yet the costs just keep on rising.
Same deal with grain. My family is in the middle of a pretty long double whammy on commodities.
I’m 56 and have owned stripper oil wells since 1997. After bottoming out in late 1998/early 1999, oil went on a tear for about 14 years, interrupted briefly by the GFC.
This was after a bear market from 1986-1999, which was preceded by a bull market from 1973-85.
Our dad first bought leases in the 1970’s, so he’s seen even more of the boom and bust personally than we have.
I clearly remember the 1986 bust, I was in high school. But it doesn’t quite resonate until it’s your bank account being hit.
We shall see if there is another price boom or not, God willing. Not looking favorable right now.
Gerry,
Thanks for the encouragements and all the nice inputs from all in this forum!
Here are my 2 cents about low oil price and new peaks,
Shale could survive low price and still make new peaks because
1. Much more abundant resources and continuing promises to improve with new technologies
2. Cheap capital that could count on the above more tangible, massive but “low risk” and low ROI
couple of things that could turn the shale peak into a nose dive:
1. Cheap capital suddenly dried up
2. Marginal ROI become zero or even negative for long and hopeless because the initial ROI estimate was based on an inflated EUR per well or PPP resources, oil price stay around or under $60 for long.
A goodbye, of sorts.
Gentlemen, I’ve been following the peak oil and collapse debates for coming on 17 years now, since late 2008. It’s amazing how much time has gone by.
I’m turning 45, and I’ve now come to the realization that I will die before I witness any major decline. I’m feeling fine right now, just call it a gut instinct. I am now almost 100% convinced I will not personally witness the decline. This is good for me personally in many ways, and all of you as well, but bad in others…all of our discussions are somewhat moot, since we aren’t even the generation that will witness the end.
So, I will leave it up to future young people to deal with and discuss this. Our role is to enjoy all that this modern world has to offer, without guilt, or without thought to past or future.
Thanks for your years and contributions, everyone.
dolph99,
You’re leaving right when the Party is starting?
While we will likely continue to see overall global petroleum production increase for the next several years, it looks like we have already hit PEAK of NET OIL ENERGY.
Watch now as Debts really increase as we head over the Net Energy Cliff 2030.
steve
Dolph99
There is much more going on than just peak Oil Production.
There are other things far more important. Peak soil where each year over 30 billion tonnes are lost, much from the best cultivated land. This loss is reducing the amount of food grown in many countries.
Unlike peak oil, there are no alternatives to soil. Rising population is crashing headlong into soil degradation.
https://www.unccd.int/sites/default/files/2025-05/DDD%20factsheet%20EN.pdf
On top of this we have now peak water. Each year the amount of water available for each human is declining. Some countries are better off than others. But even places like the States there are areas under severe strain and transportation of fresh water is very costly and opposed by people who have enough.
https://www.theguardian.com/environment/2024/oct/16/global-water-crisis-food-production-at-risk
The people who know nothing of the subject, claim that this simple solution will work here or there. The truth is complex costly and involves national governments protecting their water from going into another country. Often they hate each other. So believe me you will be affected by these issues before long.
Our food bill has nearly doubled in 10 years. This is just the start.
We are already at peak net energy return on investment. Bills are constantly increasing, cheap renewables is a stinking myth.
Things may not be as boring as you think
I’m feeling fine as well. At 45 the odds are you’ll be around another 30 yrs. Plenty of time to revisit the topic. Who knows maybe AGI will appear, fusion power developed and Jesus returns to do whatever is in the script.
“that I will die before I witness any major decline”
Yet, we are in the middle of a solar/wind/battery revolution. And data centers in the mix.
Historically,, declines are often obscured by transformations.
A new 12 month average peak in World C+C output has been reached. The old trailing 12 month peak in Feb 2019 was 82962 kb/d and based on new EIA statistics out today the trailing 12 month average for World C+C in Aug 2025 was 83135 kb/d, about 173 kb/d higher than the previous 12 month average peak.
Data at page linked below
https://www.eia.gov/international/data/world/petroleum-and-other-liquids/monthly-petroleum-and-other-liquids-production?pd=5&p=00000000000000000000000000000000002&u=0&f=M&v=mapbubble&a=-&i=none&vo=value&t=C&g=none&l=249–249&s=94694400000&e=1754006400000
Have we hit a new monthly record yet?
I’m still waiting to say “I told you so” to Ron’s peak oil call from 2018 (itself just a couple years after another failed peak prediction).
So far, I thought he still had cover. Unless I missed it, already.
Anonymous,
If you look at the EIA data that Dennis provided, you’ll see that we’ve hit a new monthly high.
Thanks for the info, Nick. (Link not working for me. Gives a EIA page, but not a graph or table.)
I knew we were getting close, but thought maybe Ron still had coverage on the monthly peak number itself.. Guess not, based on your comment.
There will be an offshore Gulf of Mexico Federal lease sale this Wednesday, December 10th. It has been billed “Big, Beautiful Gulf Sale 1”. Under the old lease sale naming convention it would have been called Sale 262.
This sale was already scheduled under the Biden Administration, but, since coming into office, the Trump Administration has set up a new GOM leasing schedule with sales twice a year, rather than once every 2 years as was established by the Biden Administration.
This should be an interesting sale because it has been 2 years since the last one. In my opinion, a “successful” sale should see at least 200 leases receiving bids. At the last sale, in December 2023, 311 leases received bids (299 accepted bids), but 35 were for Carbon Capture. The total high bid amount for the 299 accepted bids was $372 million.
Let’s see what happens!
Bob,
Please let us know how the lease sale goes on Dec 10.
Thanks.
BBB GOM Lease Sale
https://www.boem.gov/oil-gas-energy/big-beautiful-gulf-1-bbg1-oil-gas-lease-sale
“On Dec. 10, 2025, BOEM held Lease Sale BBG1. The sale generated $279,433,757 in high bids for 181 blocks across 80 million acres in federal waters of the Gulf of America. Thirty companies submitted 219 bids totaling $371,881,093.”
About 1.2% of the 81.2 million acres offered received bids (about 1 million acres)
Sale amount for accepted bids was about 279 million total.
Driverless Trucks Hauling Frac Sand Coming to the Permian
MIDLAND, Texas–(BUSINESS WIRE)–Aurora Innovation, Inc. (NASDAQ: AUR), the leader in self-driving freight, today announced a commercial agreement with Detmar Logistics, a leading provider in dry bulk and frac sand logistics solutions, to autonomously transport proppants around the clock for one of the world’s largest multinational oil and gas companies.
The deployment marks the first time frac sand will be hauled autonomously on public roads and highways in the Permian Basin.
https://www.businesswire.com/news/home/20251208402547/en/Detmar-Selects-Aurora-to-Deploy-Expanded-Fleet-of-Autonomous-Trucks-for-Major-Energy-Producer
In US and Canada there are about 3.8 million truck drivers, about 1/10th of which are north of the border. I suppose that heavily urban route drivers are less at risk for being replaced, for the time being.
Aurora is based in Pittsburgh-
“Aurora (Nasdaq: AUR) is delivering the benefits of self-driving technology safely, quickly, and broadly to make transportation safer, increasingly accessible, and more reliable and efficient than ever before. The Aurora Driver is a self-driving system designed to operate multiple vehicle types, from freight-hauling trucks to ride-hailing passenger vehicles, and underpins Aurora’s driver as a service products for trucking and ride-hailing. Aurora is working with industry leaders across the transportation ecosystem, including Aumovio, FedEx, Hirschbach, NVIDIA, PACCAR, Ryder, Schneider, Toyota, Uber, Uber Freight, Volvo Trucks, Volvo Autonomous Solutions, and Werner.”
Average futures price for HH for Jan to Dec 2026 futures contract as of 10:21 AM USET on Dec 10, 2025 is $4.06/MMBTU. The average future contact for all 12 months of 2027 is trading at $3.94/MMBTU. For later years such as 2038, there is prior settle data (probably modelled) which for all 12 months has an average price of $3.43/MMBTU.
The futures market is not predicting higher natural gas prices beyond 2026.
Data from link below
https://www.cmegroup.com/markets/energy/natural-gas/natural-gas.quotes.html
For WTI futures contracts for all 12 months of 2026 the average price is $57.50/b, long term futures contracts for Dec 2032 are at about $62.44/b. So expectations of high oil prices in the future (say over $63/bo) are not currently predicted by the futures market.
If the futures market is correct on future prices for oil and natural gas tight oil and shale gas would tend to be on the low end of my predicted scenarios as the production of shale gas and tight oil will not be profitable at such low prices.
The Venezuelan government has been arresting and killing political opponents for years.
https://www.amnesty.org/en/location/americas/south-america/venezuela/report-venezuela/
The desperate government is facilitating drugs production and export.
Trump is the only one with the guts to try and destroy this evil regime. Credit where it’s due.
If the United States states manages to install a democratic parliament then Venezuela oil production will certainly increase.
https://oilprice.com/Energy/Crude-Oil/Regime-Change-in-Venezuela-Could-Trigger-Oil-Price-Spike-Then-Slump.html
Another 2 million barrels of oil coming onto the market, which will ensure a longer peak and far more climate chaos.
Iver,
The US does not and should not rule the world.
It is up to the people of Venezuela to overthrow a dictator.
Trump talks tough, but at his core he is a coward.
US citizens are not up for another war. Send UK troops to do the job.
Nothing in your links about government association with drug trade.
DC
Don’t you know how to search
https://www.journalofdemocracy.org/online-exclusive/how-venezuela-became-a-gangster-state/
Are you saying that the U.S. government should allow islamic extremists to get a nuclear weapon?
I do find left wing woke like yourself enjoy freedom it never accepts that it has cost many lives to attain
An update to World Oil Production has been posted.
https://peakoilbarrel.com/record-august-world-oil-production/