A post by Ovi at Peakoilbarrel
All of the oil (C + C) production data for the US state charts comes from the EIAʼs Petroleum Supply monthly PSM. After the production charts, an analysis of three EIA monthly reports that project future US production is provided. The charts below are updated to November 2020 for the 10 largest US oil producing states.
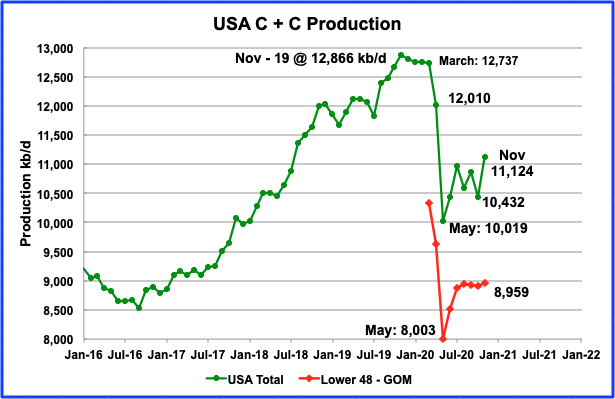
Novemberʼs US production increased by 692 kb/d to 11,124 kb/d from Octoberʼs output of 10,432 kb/d. Novemberʼs increase was largely due to the GOM coming back on line after being shut twice because of the October hurricanes. The effects of shutting the GOM can be seen in the November onshore L48 production graph which has been essentially flat since August at 8,959 kb/d, 13 kb/d higher than August. Of the 692 kb/d November increase, the GOM contributed 645 kb/d, 93.2%.
RANKING PRODUCTION FROM US OIL STATES
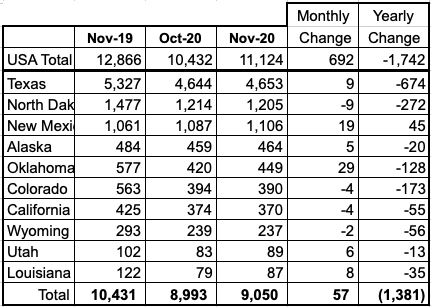
Listed above are the 10 states with the largest US production. These 10 accounted for 9,050 kb/d (81.3%) of US production out of a total production of 11,124 kb/d in November 2020.
Note that of all these 10 states, only New Mexico produced more oil in November than in the same month last year. On a YoY basis, US November production was down by 1,742 kb/d.
Note that November 2019 is the all time Peak in US Oil production, 12,866 kb/d
Production by State
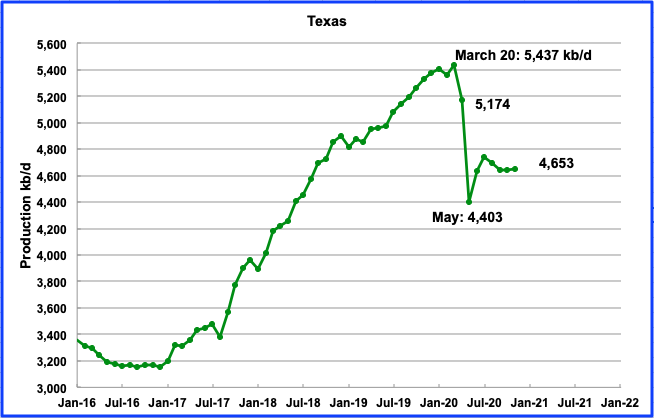
Texas production increased by 9 kb/d in November to 4,653 kb/d. During November, approximately 129 rigs were operating in Texas. By the end of January, 161 were operating. Will the increasing number of rigs be sufficient to increase production?
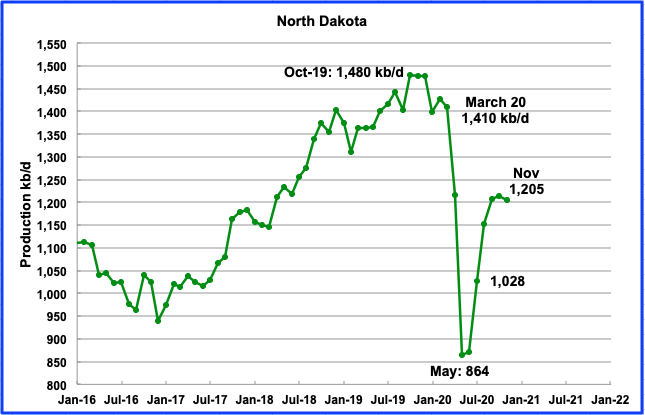
Novemberʼs output was 1,205 kb/d day, a decrease of 3 kb/d from October. During November, December and January, 11 oil rigs were operational.
According to this source: “A total of 74 well completions occurred in the state in November, but by December that had dropped to 44 due to harsher winter weather conditions. Helms noted North Dakota needs 60-70 completed new wells coming on each month to maintain production of 1.2 million b/d.
North Dakota’s rig count has also dropped lately as winter weather has taken hold across the state’s western production area.
In October through December, 14 rigs were active in North Dakota, but that has dropped to 11 in January, Helms said. By contrast, the all-time was 218 in May 2012.”
‘Concern’ over permits under Biden
As the US transitions in the coming days to the new presidential administration of Joe Biden, North Dakota has an “ongoing concern” about limits to new permits on federal lands, which Biden during his campaign had pledged to ban, Helms said.
Of the current 11 rigs in North Dakota, six are on federal lands, Helms said.
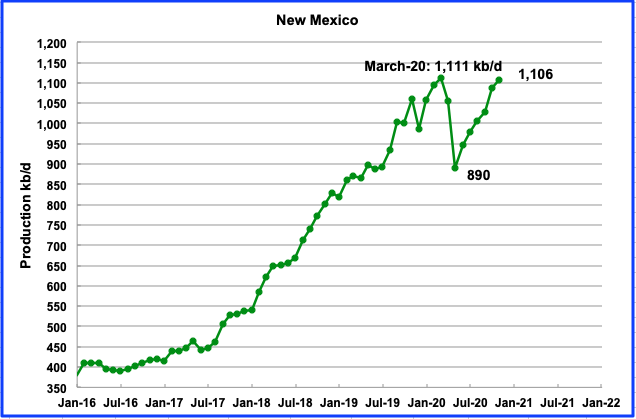
Novemberʼs New Mexico production increased by 19 kb/d to 1,106 kb/d. New Mexico has been adding rigs since late September which accounts for the increase in production. However NM has recently started to decommission rigs according to the next chart.
There is concern in New Mexico with President’s ban on fracking on Federal lands according to this source.
“Steve Pearce, the former New Mexico congressman who now serves as Chairman of the state’s Republican Party, pointed to another certain cost of this Biden policy action late last week. “I think we’re going to see companies choosing not to invest in New Mexico and take their jobs and drilling to Texas just 3 miles away,” Pearce said. “They can just scoot across the border where they don’t have federal lands.”
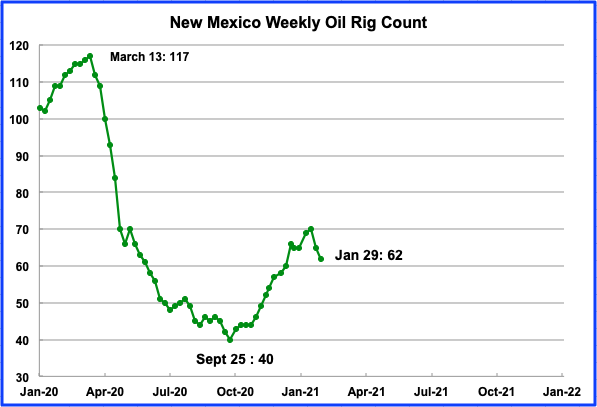
New Mexico has been adding rigs since late September and they peaked at 70 in the week ending January 15. Eight rigs were decommissioned over the last two weeks. Is this associated with the fracking ban on Federal lands?
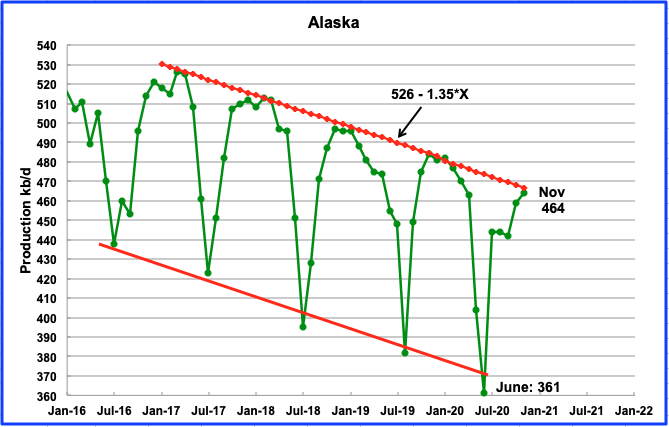
Alaskaʼs November output increased by 5 kb/d to 464 kb/d. The weekly EIA data indicates that Novemberʼs output should be over 500 kb/d. I am not sure why there is such a large discrepancy between the monthly and weekly reports.
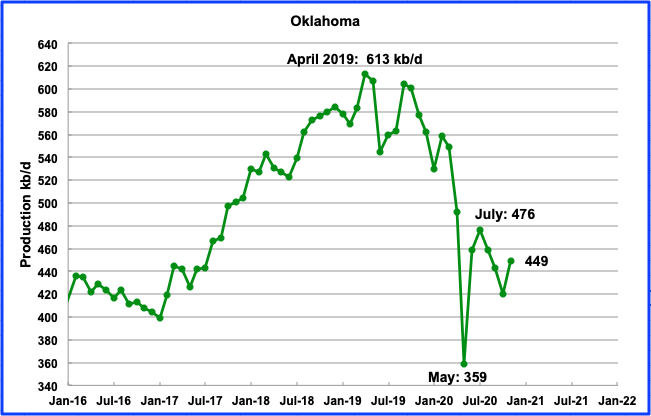
November production reversed the three month decline that started in August and added 29 kb/d to end up at 449 kb/d. During November, 13 rigs were operating and have gradually increased to average slightly above 17 by the end of December/January.
Oklahoma is also concerned with the fracking ban on Federal lands according to this source
“Yesterday, the White House killed the Keystone XL pipeline and thousands of jobs, including some in Oklahoma. Today, it temporarily froze federal onshore and offshore oil and gas activity to the detriment of national security, taxpayers, schools and local communities. This is just the start. It will get worse.”
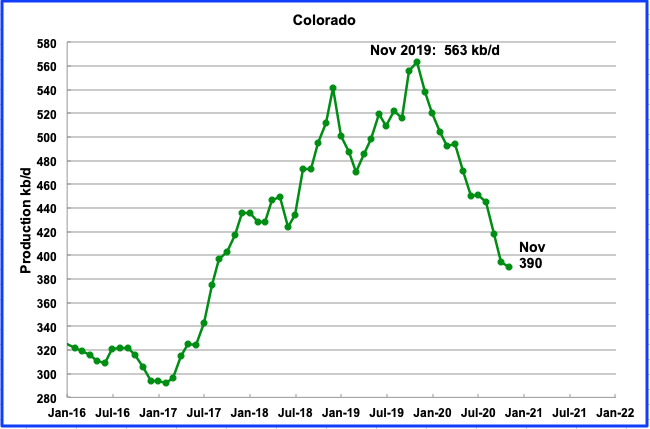
Coloradoʼs November output decreased by 4 kb/d to 390 kb/d. Colorado entered a steady decline phase after reaching its peak in November 2019 and has recently been adding rigs to reverse the decline (See next slide). Coloradoʼs declining production is related to the pandemic and new environmental regulations, according to this source.
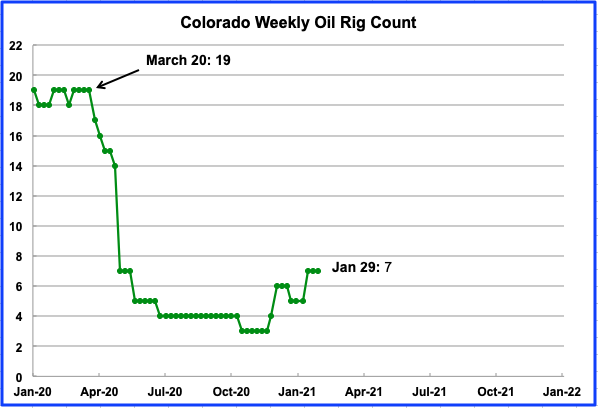
Seven rigs were operating in the week of January 29, up from a low of 3 in November.
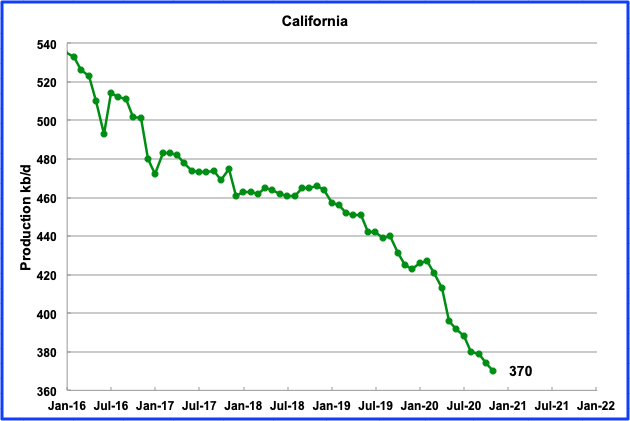
Californiaʼs slow output decline continued in November. Its production dropped by 4 kb/d to 370 kb/d. Since May, output has dropped by 26 kb/d for an average decline rate of 4.3 kb/d/mth.
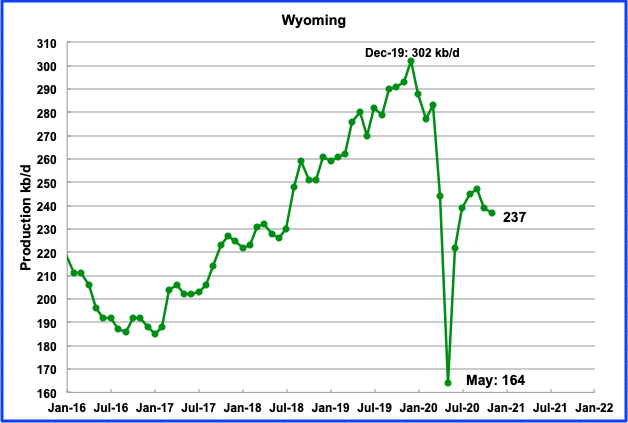
Wyomingʼs production in November decreased by 2 kb/d to 237 kb/d. Wyoming had a total three oil rigs operating from November to January.
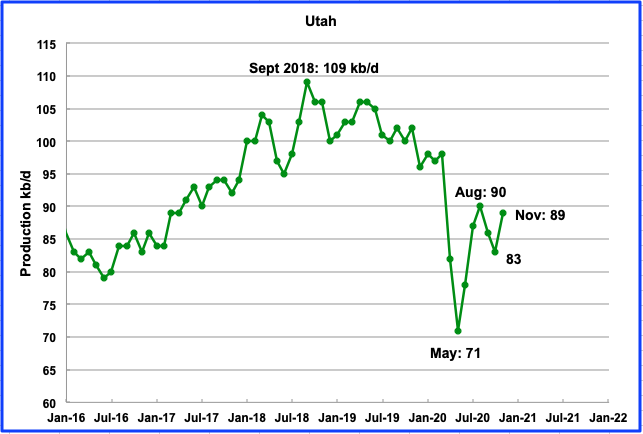
November production increased by 6 kb/d to 89 kb/d. Three oil rigs were in operation from November to January.
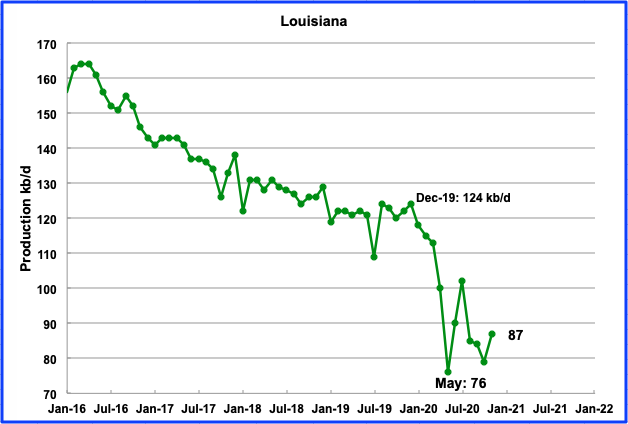
Louisianaʼs output increased by 8 kb/d in November to 87 kb/d. In November, Louisiana had 12 rigs operating. They have been slowly adding rigs and now have 18 rigs operating in the last week of January.
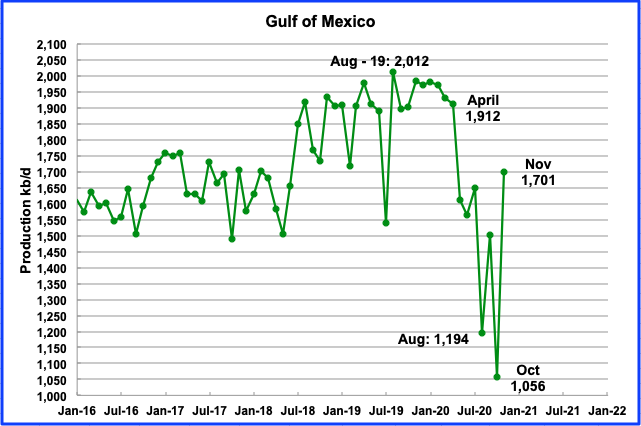
Production from the GOM rebounded to 1,701 kb/d in November, an increase of 455 kb/d. If the GOM were a state, its production would rank second behind Texas.
UPDATING EIA’S THREE OIL GROWTH PROJECTIONS
1) SHORT TERM ENERGY OUTLOOK (STEO)
The STEO provides projections for the next 13 – 24 months for US C + C and NGPLs production. The January 2021 report presents EIAʼs updated oil output and price projections out to December 2022.
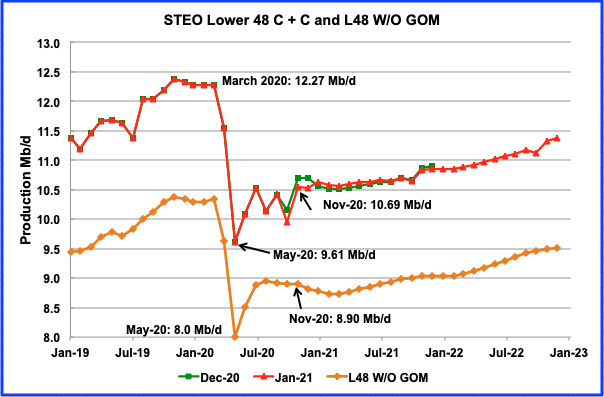
The January STEO output projection for the L48 states is very similar to the one that was provided in the December 2020 report. The main difference is that the January report projects output to December 2022.
The STEO’s November projection of 8,900 kb/d compares well with the actual production which was reported as 8,959 kb/d in the first chart above.
From November 2020 to March 2021, output in the L48 W/O GOM is projected to drop by 170 kb/d to a low of 8,730 kb/d in March before starting to increase. By December 2022, output in the L48 W/O GOM is expected to be 620 kb/yr higher than November 2020 at 9,520 kb/d.
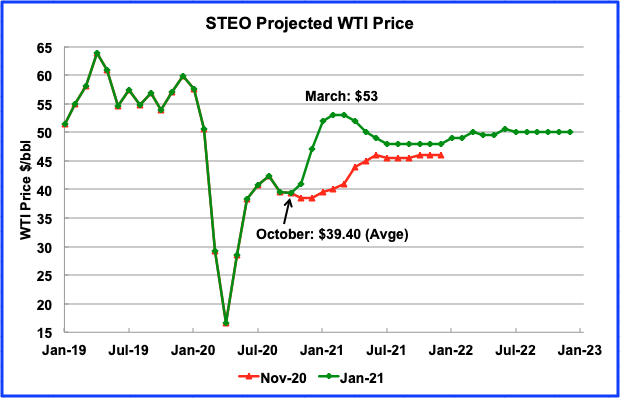
The January 2021 STEO is projecting a WTI price of $53/bbl in March 2021 before beginning to decline back to $48/b in July. On October 30, 2020 the WTI futures contract settled at $35.79/bbl. Since then it has climbed back to above $50/bbl and settled at $52.20/bbl on January 29.
2) DRILLING PRODUCTIVITY REPORT
The Drilling Productivity Report (DPR) uses recent data on the total number of drilling rigs in operation along with estimates of drilling productivity and estimated changes in production from existing oil wells to provide estimated changes in oil production for the principal tight oil regions. The following charts are updated to February 2021.
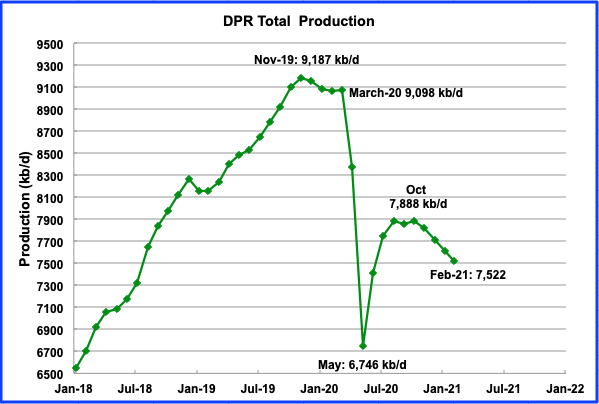
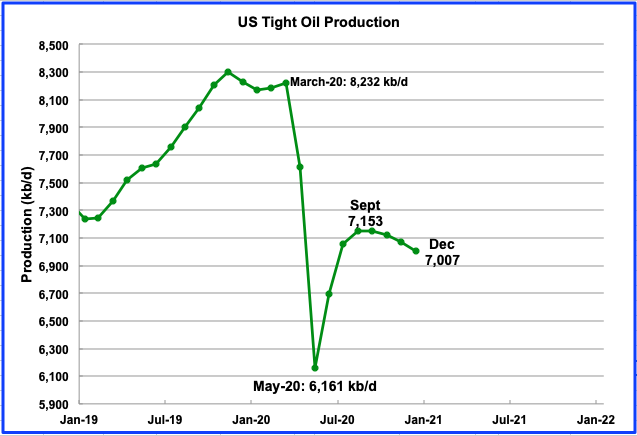
Above is the total oil production from the 7 basins that the DPR tracks. Note that the DPR production includes both LTO oil and oil from conventional fields.
According to the January report, the DPR basins oil output bottomed in May 2020 at 6,746 kb/d and recently peaked in October at 7,888 kb/d. The January report has revised up the output for the most recent months. For example the December report projected January output to be 7,439 kb/d. In the January report, January output has been revised up by 173 kb/d to 7,612 kb/d.
The DPR is projecting output for February 2021 to be 7,522 kb/d, down 90 kb/d from January. Since October, the average decline rate has been close to 91.5 kb/d/mth. According to ShaleProfile, the current number of horizontal rigs, 312, is not sufficient to increase LTO production in the US.
The contribution from three of the DPR/LTO basins is shown in the charts below.
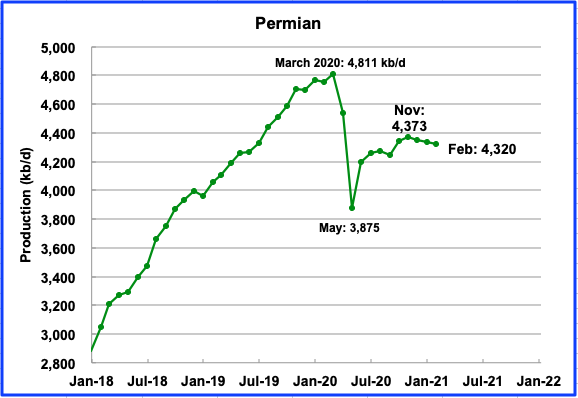
Permian output in February 2021 is projected to be 4,320 kb/d, down by 13 kb/d from January. Output rolled over after the recent November high of 4,373 kb/d. The average projected drop over the three months from November 2021 to February 2021 is 18 kb/d /mth. Note that January output in the January DPR was revised up 137 kb/d to 4,333 while November was revised up by 98 kb/d.
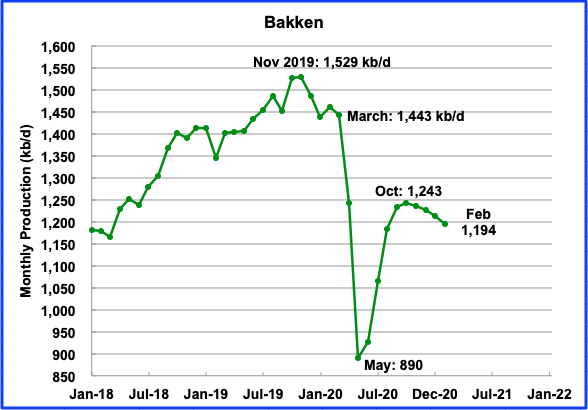
Bakken output in February is projected to be 1,194 kb/d a decrease of 20 kb/d from January.
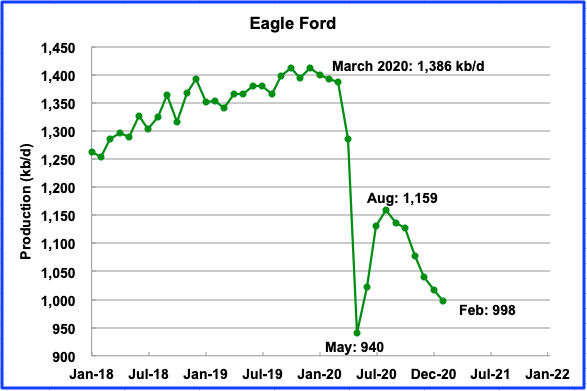
After bottoming in May, Eagle Fordʼs output reached a recent peak in August and then began to roll over. In February, EF output is projected to drop by 19 kb/d to 998 kb/d. The average monthly decline rate since August has been 26.8 kb/d/mth.
3) LIGHT TIGHT OIL (LTO) REPORT
The LTO database provides information on LTO production from seven tight oil basins and a few smaller ones. The January report projects the tight oil production to December 2020.
Decemberʼs LTO output is expected to decrease by 65 kb/d to 7,007 kb/d from Novemberʼs 7,072 kb/d. Note that the January report has revised up the LTO production for all of the months from August. For example, September was revised up by 39 kb/d. Assuming that US production is close to 11,000 kb/d in December, LTO output represents 63.6% of US production.
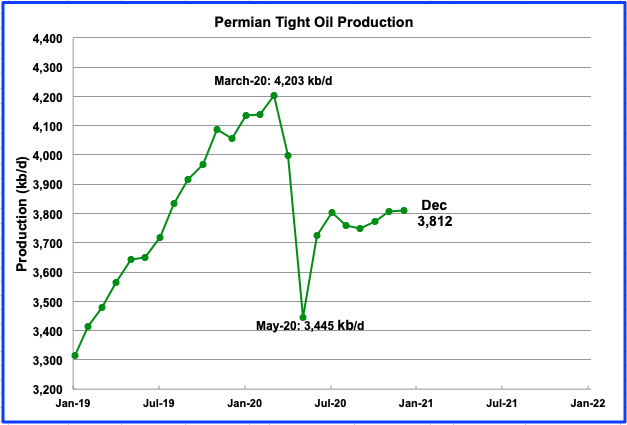
Permian LTO output in December is projected to be 3,812 kb/d, an increase of 6 kb/d from November. There were 153 rigs operating in the Permian in November and 172 in December.
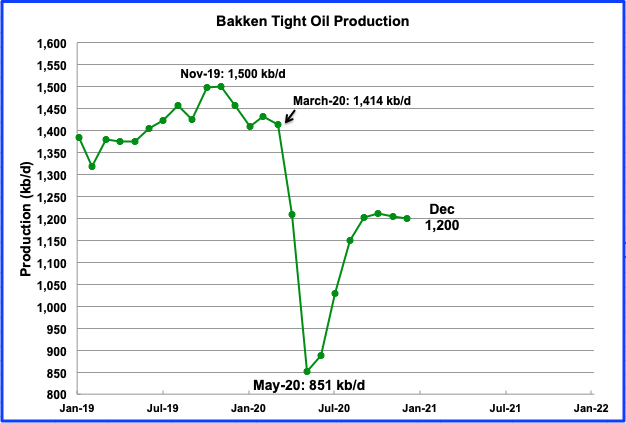
The Bakkenʼs December output has remained essential flat since September at 1,200 kb/d. In November and December, 11 rigs were operational.
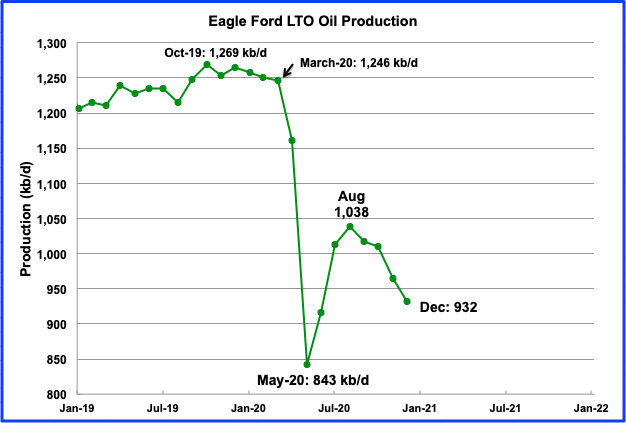
The Eagle Ford basin is expected to produce 932 kb/d in December, a decrease of 33 kb/d from November. Since August the average decline rate has been 26.5 kb/d/mth. The number of rigs operating in December was 25, up 6 from November.
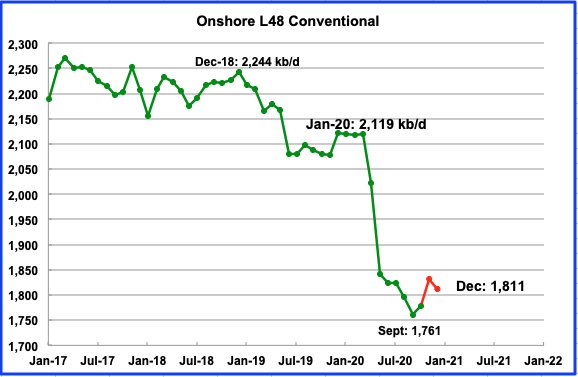
Conventional oil in the On-shore L-48 is expected to be 1,811 kb/d in December 2020. This estimate is based on a combination of the January LTO report and the STEO January report that projects US on shore L48 to December. (Red markers). Note that the October conventional output reflects the EIA’s actual production data for October.
World Oil Production
The EIA has updated its world oil production numbers today for October after experiencing some difficulty.
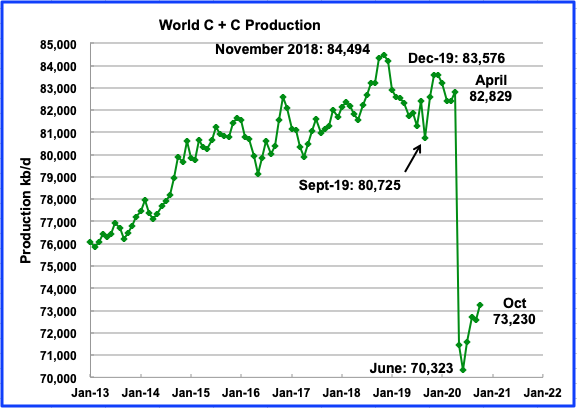
World oil production reached its lowest level in June 2020 at 70,323 kb/d. According to the EIA, world oil production in October recovered to 73,230 kb/d after adding 641 kb/d to September’s output. Of the 641 kb/d, 365 kb/d came from OPEC and 276 kb/d from Non-OPEC countries.
Will shale restraint last?
In the meantime, according to this source, the oil market is wondering how long shale restraint will last?
Shale producers swear this time is different. After years of profligate spending and unchecked output helped trigger a series of oil-price crashes, U.S. explorers say they’ve learned from their mistakes. They’ve pledged to keep a lid on production, even as crude rebounds amid OPEC supply cuts and the outlook for a recovery from the pandemic-driven global economic collapse.
What clues should we be looking for to see if the big oil companies are practising restraint. For example, will XOM spend more of their development money in Guyana or on Texas shale.
27 responses to “US November Production Rebounds After Hurricane”
A full month into 2021 and I am not seeing any articles about Chinese oil imports or India oil imports. There are usually some advanced suggestions by now.
American shale might turn out to be entirely dependent on Chinese consumption rather than US consumption
Watcher
Attached is picture comparing the IEA’s estimates for China demand as taken from the January 2020 report (Pre Covid) and the October 2020 report. As you can see, 2020 is coming in close to 360 kb/d lower than originally estimated.
Looking at 2021, China’s demand will be higher than the IEA’s original 2020 demand estimate by close to 400 kb/d made in January 2020. Considering that China produces close to 4,000 kb/d of oil, they will be importing close to 10,000 kb/d in 2021, unless they draw down inventory. On the other hand, they may think that oil is cheap now and may decide to fill their storage tanks. I do agree that China will be the main demand driver for 2021.
For 2021, both the IEA and OPEC are projecting a demand increase of 6,000 kb/d of all liquids, so let’s say 5,000 kb/d of C+C. Most of that will be supplied by OPEC. Of that the US will only supply at most 100 kb/d according to the STEO.
A decline of a few hundred thousand BPD doesn’t look anything like the horror scenarios discussed earlier in 2020. Now China typically increases 5% per year so any decrease at all is pretty big in the context of departure from trend. Still, that’s not much impact.
Watcher
I just found these two updates
China’s crude imports rose to 45mn t (11.08mn b/d) in November, rebounding from a six-month low of 10.06mn b/d a month earlier, preliminary customs data show.
November’s imports fell by a slight 0.8pc from a year earlier, in the second consecutive month of year-on-year declines following successive strong gains since May.
China’s demand for November-delivery crudes was supported by a contango in the underlying Ice Brent market in September. State-controlled Saudi Aramco increased its nominations to Chinese buyers in October and cut its official selling prices to Asia-Pacific for October-loading exports to a four-month low.
https://www.argusmedia.com/en/news/2166523-chinas-november-crude-imports-rebound-to-11mn-bd
Singapore — China’s crude imports fell to a 27-month low of 9.096 million b/d or 38.47 million mt in December, but total imports over 2020 were up 7% year on year at 10.86 million b/d, General Administration of Customs data released Jan. 14 showed.
https://www.spglobal.com/platts/en/market-insights/latest-news/oil/011421-chinas-2020-crude-imports-rise-7-to-109-mil-bd-dec-inflow-falls-to-27-month-low
7%? That’s astonishing. That’s says they had no impact at all from the virus over the course of the year. In the past when we looked at Chinese consumption it was important to also recognize that they produce a few million BPD domestically, so an increase in Imports did not entirely mean more was burned. They may have simply produced less.
But that’s contortion. The odds are their consumption did not decline anywhere near as much as elsewhere.
Just some random comments about the GOM:
Good to see GOM production rebound like it did with a month uninterrupted by storms or low prices causing shut-ins. From July-2018 to April-2020 we had 22 months of production averaging about 1.9 mmbopd. I suspect the GOM will never achieve sustained levels like that again.
We were supposed to be seeing a nice production boost from Appomattox, but, as we’ve discussed earlier, that is not going to happen.
The 2 biggest projects set to come online in the next year or so are Mad Dog 2 and Vito. Both are 100 kbopd or so projects. Both were set for 2021 first oil, but both could get pushed into 2022. They have the best chances of helping arrest gradual decline in the basin. While there are others, they are all smaller – 1-2 wells tiebacks, etc.
If the federal drilling permit moratorium only lasts 60 days, that, in itself will have little impact on production. Some operators who deferred development wells early last year are probably going to start revisiting those opportunities with oil prices in the $50 range. That new production won’t be seen for another year or so.
There are still a number of good projects out there being worked on – Anchor, Whale, Black Tip, Shenandoah are 4 of the best ones. Chevron is probably revisiting Ballymore in light of Shell’s problems at Appomattox.
Nice link below :
https://www.spglobal.com/platts/en/market-insights/latest-news/oil/011321-commodities-2021-us-gulf-of-mexico-activity-to-rise-despite-covid-related-delays
SLG – thanks for info and link.
Appomatox has been doing better in the last two months and is up to 100kbpd, individual well data will be out in a couple of days. Big Bend and Stampede seem to be back to ramping up a bit but it’s been slow going. Three recent tie-backs look like failures so far: Red Zinger ran for 10 months and has been offline since 2019; Stonefly ran for 8 months, peaked last March and was dead since June, but had a blip up in November; and Nearly Headless Nick started in November 2019 and looks to have problems with sustaining flows and with a high decline rate.
North Platte was mentioned as a large stand alone project but may have been downgraded, have you seen anything more? Kings Quay at 100kboed is due to start this year and the last I saw Murphy was saying it is still on schedule.
Thanks George,
Yes, I’ve noticed the better performance at Appomattox.
Regarding tiebacks – Commitments to pursue a tieback often get made on the results of a single well. If a certain amount of net pay is encountered, with favorable rock properties, the operator may decide to go ahead with a tieback. The operator may not realize that the reservoir is compartmentalized, or poorly connected to an aquifer until too late – that is, they have already installed the flowlines, completed the well, and started to produce it, then the well doesn’t perform as expected. The problem is many of these opportunities may be too small to support any real appraisal. Now alot of these are bright spot plays, so the operator has an idea how big the reservoir footprint is from the bright spot size, but is usually guessing as to what the net pay distribution is throughout the reservoir.
There is a comment about North Platte in the link above – that Total will probably approve the project, but that approval may not happen until 2022.
Of Interest: Testing the Waters – “as the WSJ reported on Sunday afternoon, the CEOs of Exxon and Chevron “spoke about combining the oil giants after the pandemic shook the world last year, ” Even more centralization?
https://www.zerohedge.com/commodities/make-standard-oil-great-again-exxon-chevron-have-discussed-merger
Frack spread count
https://www.aogr.com/web-exclusives/us-frac-spread-count/2021
WTI punched a $55 ticket this morning. Last time that happened was Jan 23, 2020. Looks like the extra SA cut is working.
Dennis , from Ovi’s post I think you are ahead on our bet (at least for the moment ) . 🙂 . There is many a slip between the cup and the lip . 😉
Hole in head,
Can you remind me of the bet? Was it on output or price, I can’t remember?
Dennis . $ 25 (in 2019$) by 2025 .
Hole in head,
Thx. I really don’t know about prices. I think 30 might be possible in 2025. I expect such a price would reduce oil supply below demand and drive price up. Perhaps by 2035 we might see 25 per barrel in 2019$.
”After years of profligate spending and unchecked output helped trigger a series of oil-price crashes, U.S. explorers say they’ve learned from their mistakes. They’ve pledged to keep a lid on production, even as crude rebounds amid OPEC supply cuts and the outlook for a recovery from the pandemic-driven global economic collapse.” Oooh! They began being mature? More seriously, is that not a very convenient excuse to not drill wells at the same pace because, perhaps, they know that the grounds they will drill are containing less oil than those they have already exploited?
The EIA posted their world oil output numbers for October and the chart and comments have been posted at the end of the post above.
I’m long oil since March. And while price did break above a recent lets just say 2 week consolidation pattern. Dollar shorts are starting to unwind. It means bets on reflation and or things getting back to normal are being reduced. It just hasn’t shown up in oil yet. I think what normal is now or what it was before Covid is a strong dollar and low oil and commodity prices. While I’ll remain long oil I’m looking for a top of some sorts to develop in oil over next few weeks.
Treasury yields on the 10 and 30 year bonds are headed higher. This means tighter monetary conditions. Which doesn’t really support higher prices. Bets are demand returns. I think people will start to see the prices have got a little ahead of themselves and correct lower as more and more of these dollar shorts get unwind.
HHH
Attached is the price chart for WTI from October 2018 to today. To me it looks like WTI has entered the $55 to $60 resistance range that occurred from roughly June 2019 to Jan 2020. It will be interesting to see if this will bring on more LTO.
Note that the backwardation in the futures market is getting steeper and this encourages immediate deliver of oil.
How to extend the age of oil for transportation/internal combustion engine industrial era, in these times when we face the global decline in oil production capability over then next decades and the continuing growth in population (another billion people over the next 14 years) –
One easy method to extend oil availability is to shift to vehicles with an ICE engine and a relatively small battery pack -so called Plugin Hybrid Electric vehicle (PHEV). [Perhaps it should have been called a ICE Hybrid Plug-in Vehicle (ICEP)].
Anyway, a study measuring the USA real world petrol vs electricity consumption of these vehicles reveals that 54% of mileage driven is electric and 46% of the mileage driven is petrol for the current fleet of such vehicles on the road.
Note that this could be further improved since more vehicles with slightly larger batteries are now available.
Example- Toyota RAV4 Prime ( small SUV) with 42 miles electric range, and an additional petrol 558 miles if you need to go further.
This vehicle class will help extend the years oil affordability (good news for the global economy), while still allowing those who like the smell of gas to keep up the opportunity to breathe it in deep.
If fuel were priced to capture it’s true cost (say, at $6 per US gallon), the electric percentage would go up to 80% or more. Most people drive less than 30 miles per day, most days.
The average MPG of us vehicles on the road is about 23. The Chevy Volt got 40MPG on the ICE extender. Combine that with 80% electric miles and you get a 90% reduction in fuel consumption. The remaining 1M BPD in US light vehicle fuel consumption could be covered by ethanol (with the proper fine tuning to take advantage of ethanol’s higher compression ratio).
“If fuel were priced to capture it’s true cost”
Well Nick, very little in this world is priced as “true cost”.
Just ask the Indians, African Americans, and countless other tribes whose land or labor or savings were merely expropriated, for example.
Do you think the cost of wars like Viet or Iraq are ever budgeted at ‘true cost’.
And environmental costs are pretty much just swept under the carpet.
So I wouldn’t suggest you use those ‘true cost’ numbers in any kind of energy price projection you make.
Hickory,
I wasn’t making a projection. Like you, I was making policy suggestions. I try to stay away from projections…
As I understand it, there are serious discussions underway about carbon taxes among experts advising the Biden administration
@ Mike Smellman
“A Former Trump Adviser May Have Revealed What The Fossil Fuel Bonanza Was Really About
It’s NOT the economy, stupid.
The concept of petro-masculinity suggests that fossil fuels mean more than profit; fossil fuels also contribute to making identities, which poses risks for post-carbon energy politics. Virginia Tech political scientist Cara Daggett
In 2011, a study in the peer-reviewed journal Global Environmental Change found that white males were overrepresented among people who denied the reality of climate change. Researchers attributed the phenomenon to a desire to “protect their cultural identity.”
“Perhaps white males see less risk in the world because they create, manage, control, and benefit from so much of it,” the study’s authors wrote. “Perhaps women and nonwhite men see the world as more dangerous because in many ways they are more vulnerable, because they benefit less from many of its technologies and institutions, and because they have less power and control.”
In 2014, researchers in Sweden found that climate denial was “intertwined with a masculinity of industrial modernity that is on decline.” Those who defended the industries destabilizing the planet were trying “to save an industrial society” that men like them had built and dominated, argued the researchers, whose work appeared in Norma: International Journal for Masculinity Studies.
In 2018, Virginia Tech political scientist Cara Daggett gave the concept a name: petro-masculinity.
“The concept of petro-masculinity suggests that fossil fuels mean more than profit,” Daggett wrote in the international studies journal Millennium. “Fossil fuels also contribute to making identities, which poses risks for post-carbon energy politics.”
Reflecting on this growing body of social research, the climate writer Emily Atkin asked in a recent edition of her Heated newsletter: “Do you ever wonder what the planet might look like if men didn’t control the world?”
“I’m not talking about all cisgender men, or the entirety of the male gender,” she wrote. “Really, I’m just talking about people who believe that because they have penises, they are required to act in a traditionally, almost performatively masculine way ― like ‘being strong’ and ‘never showing weakness’ and ’not ordering sauvignon blanc.’”
https://www.huffpost.com/entry/trump-fossil-fuels_n_601c626fc5b68e068fbccba6
If it looks like a duck, swims like a duck, and quacks like a duck, then it probably is a duck.
I am a proud white male!
New post up by George Kaplan
https://peakoilbarrel.com/uk-north-sea-summary-part-ii-reserves-recent-production-and-future-projections/
also a new open thread
http://peakoilbarrel.com/open-thread-non-petroleum-february-6-2021/