This post reviews my method for estimating output from tight oil and shale gas plays. The basic method involves convolution which sounds complicated (pr perhaps convoluted) but is fairly simple to accomplish using a spreadsheet. It may be helpful to review my post on this from over 11 years ago at this link.
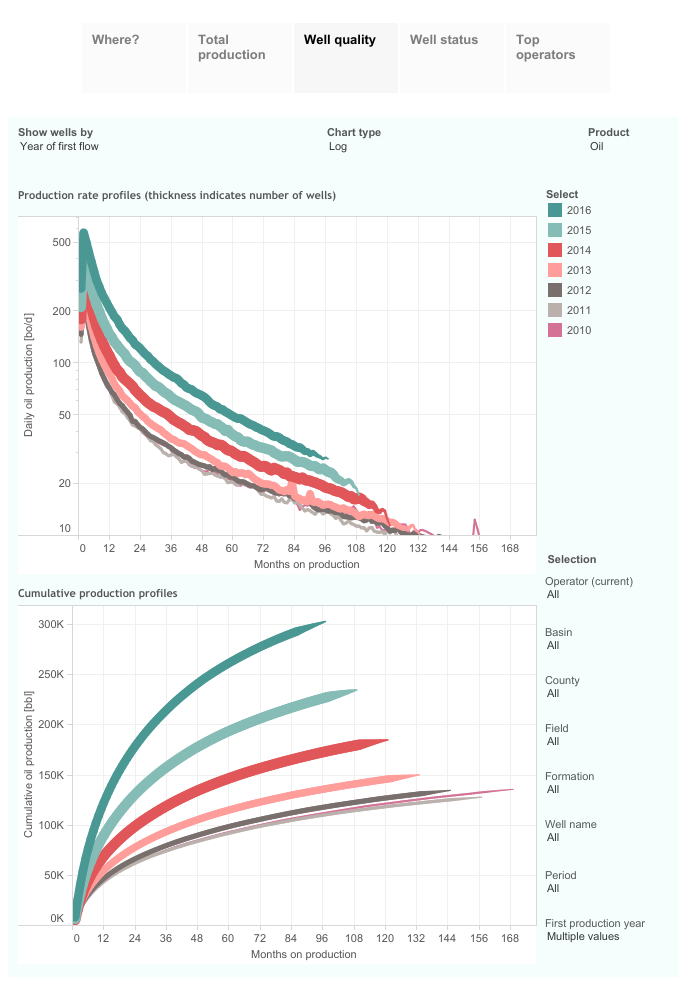
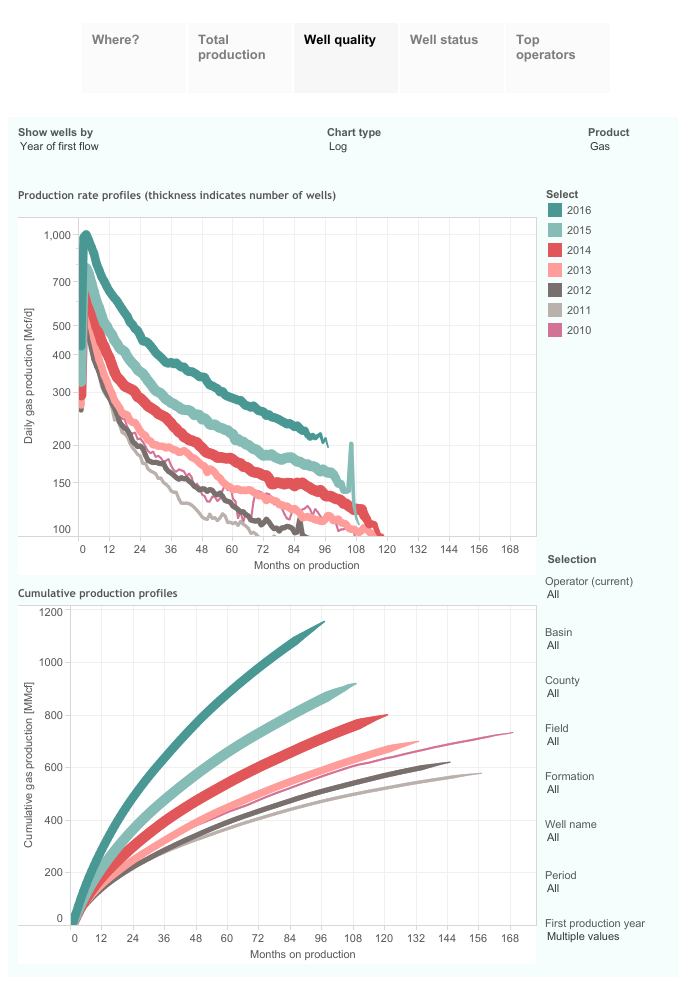
The two charts above show the average Permian Basin wells by year of first flow from 2010 to 2016 for both tight oil and shale gas for all horizontal wells completed in the Permian Basin, I used the well quality tab in a post by Enno Peters linked here to grab these charts. Links directly to these charts are here for first chart and here for second chart. At each of these links the data can be explored in greater detail.
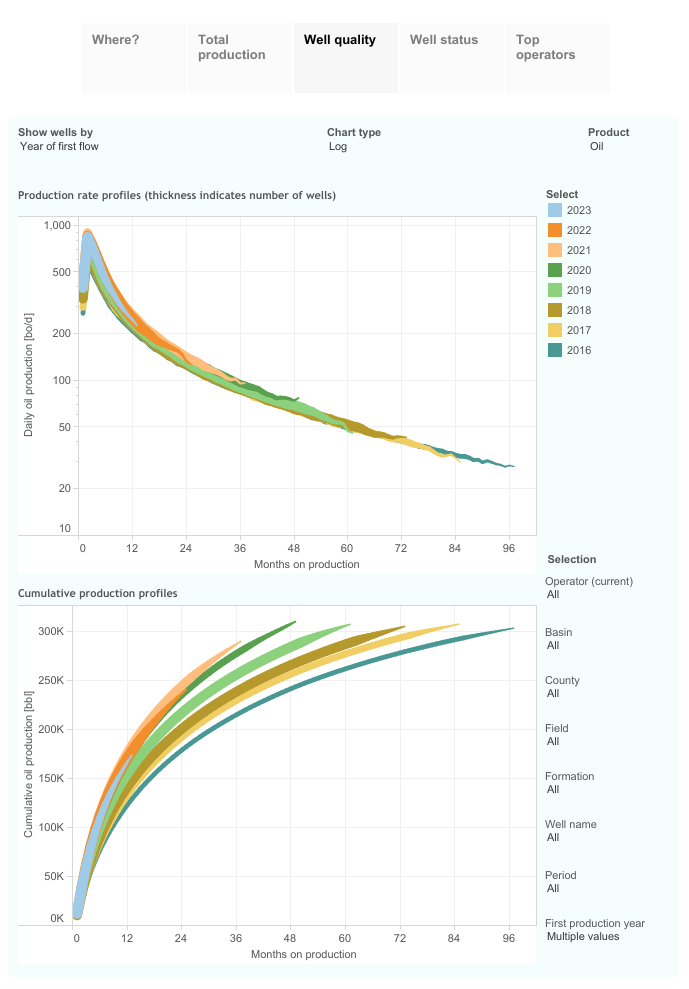

The second pair of charts shows average Permian Basin well profiles by year of first flow from 2016 to 2023 for both tight oil and shale gas. Links to the charts are here for tight oil and here for shale gas. Note that after 2020 for tight oil and 2021 for shale gas the well profiles stop increasing and in the case of tight oil decrease after 2022. These charts are not normalized for lateral length. The average lateral length has been increasing from 2010 to 2023, after 2016 the EUR of tight oil for the average Permian tight oil well when normalized to 10 thousand lateral feet has been decreasing since 2016 at roughly 2% per year.
Convolution
We start with an average well profile in our simple model, this is the average 2022 Permian Basin tight oil well profile.

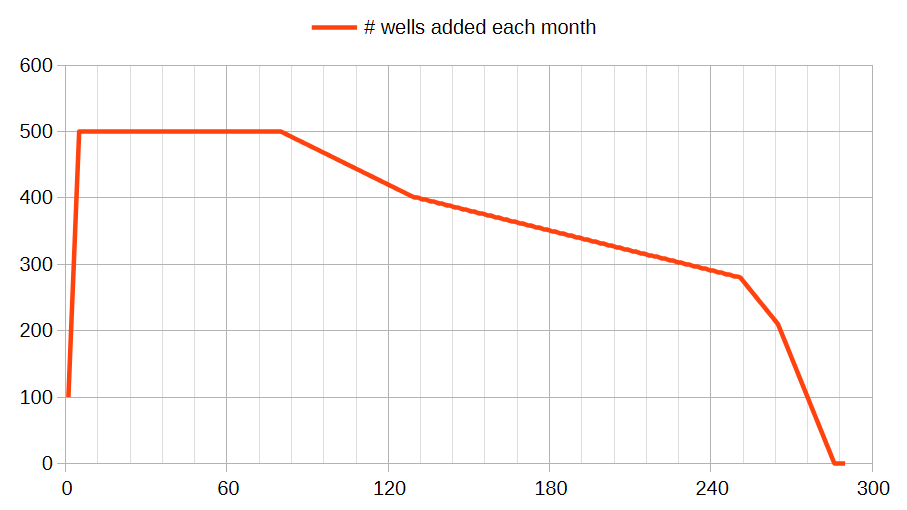
Then we have a chart representing the number of new wells added each month.
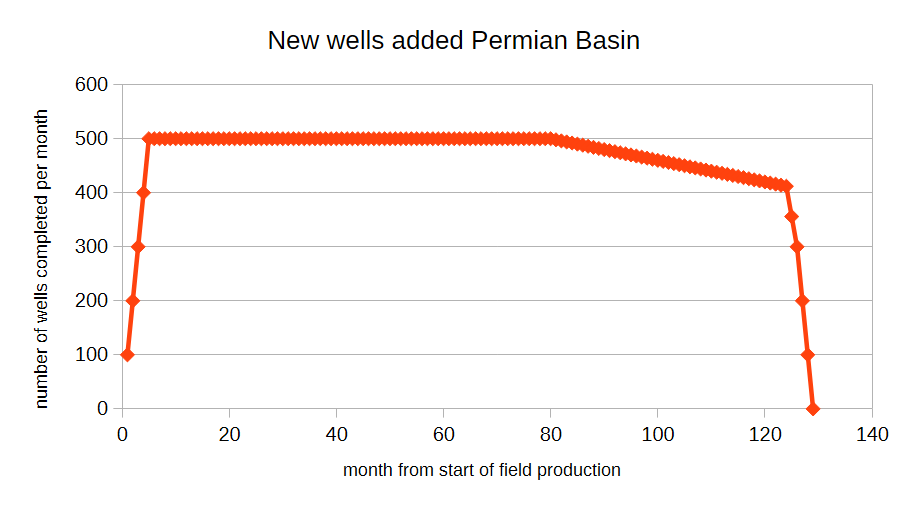
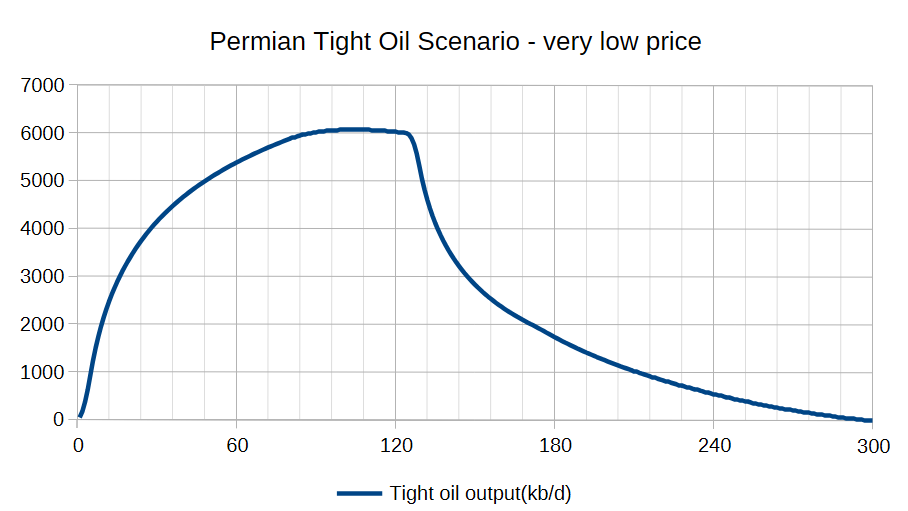
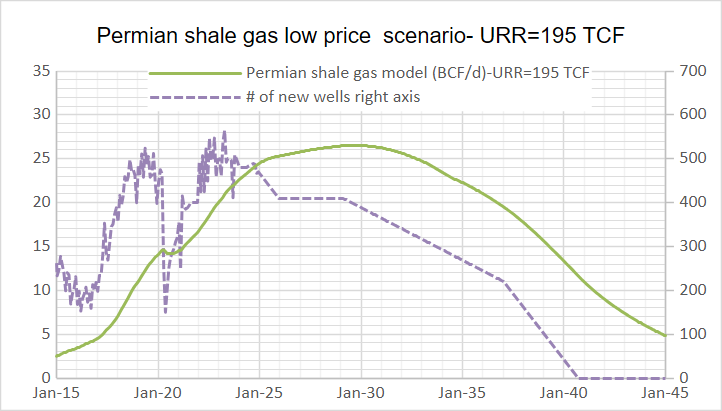
Wells are added from month 1 to month 129 in this scenario, the spreadsheet with the scenario can be downloaded here. This represents a very low price scenario, WTI under $45/b in 2025$.
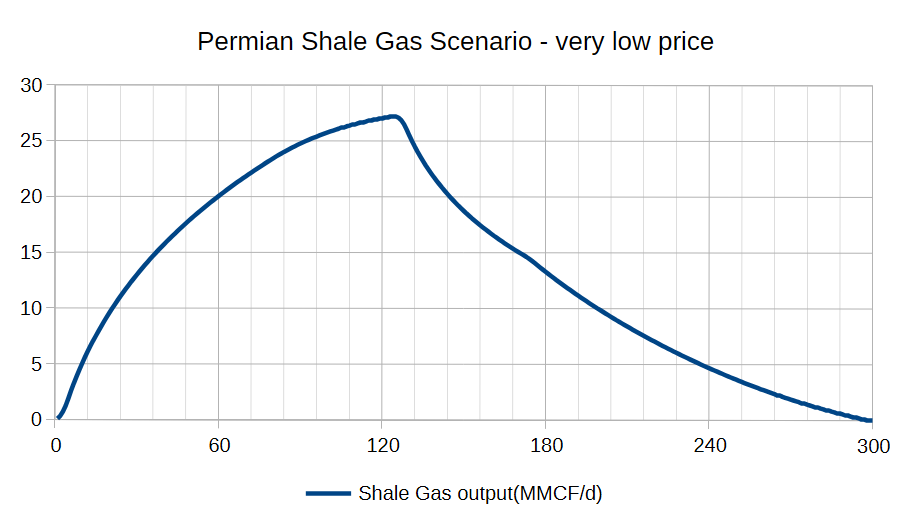
For the shale gas output for the scenario above we use the same chart for new wells added as presented earlier, but use the shale gas well profile below.
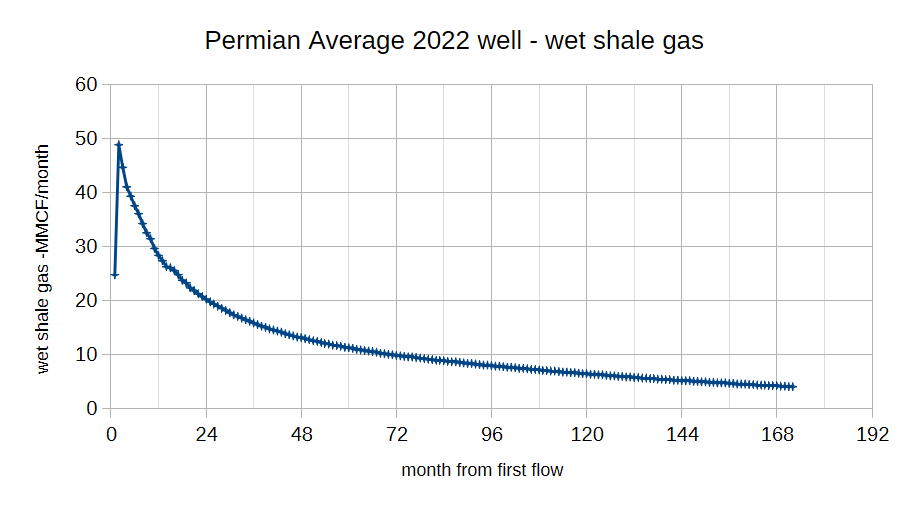
The spreadsheet is here for this shale gas scenario.
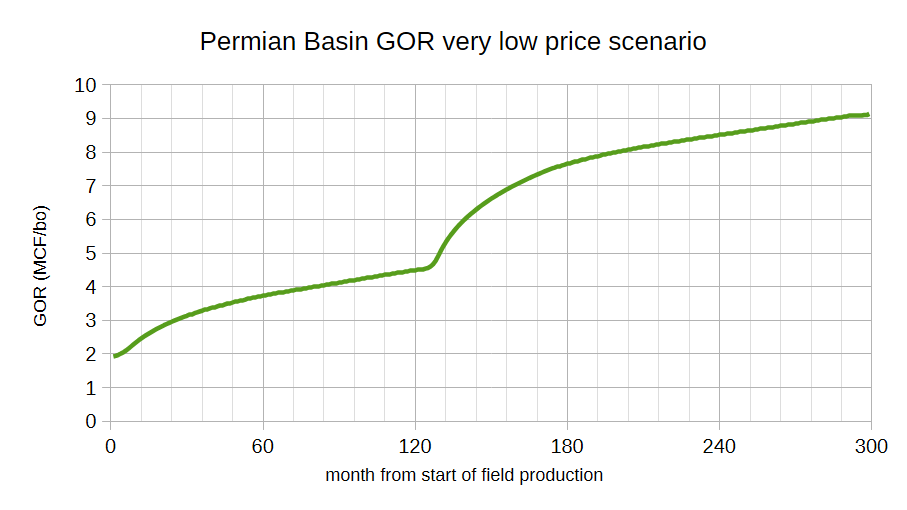
The GOR for this scenario (in second spreadsheet) is below.
To create a more realistic scenario we can use three scenarios and stitch them together as we need about 300 months or more to create a realistic scenario with about 108 thousand completed wells for a low oil price scenario (WTI is $65/b or less). For tight oil the results of the three spreadsheets are combined in the first here, the second spreadsheet (convolution 2) is here, and the third spreadsheet (convolution 3) is here. For the shale gas scenario there are also three spreadsheets, one, two, and three.
This is the number of new wells added per month for the scenario, note that the tight oil and shale gas well profile is unchanged from the short 129 month scenario (very low price scenario). The convolution spreadsheets result in the following output for tight oil and shale gas, see chart below.
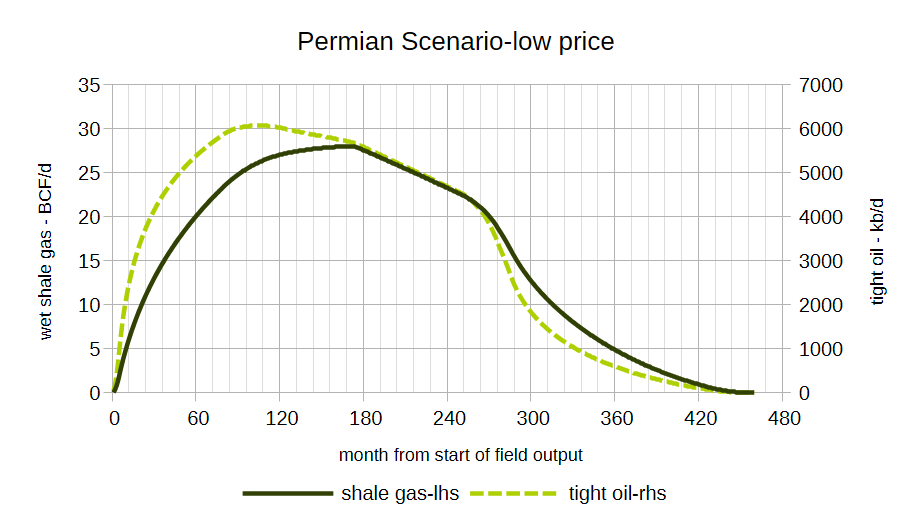
The tight oil scenario has a URR of 47 Gb and the shale gas scenario has a URR of 219 TCF.
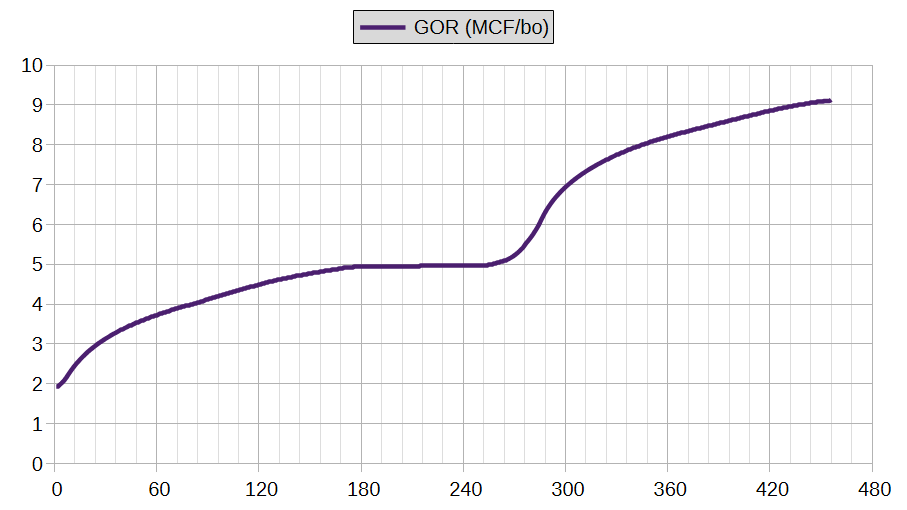
The Chart above shows the GOR for the low price scenario presented in the previous chart, total wells completed for the scenario is 108 thousand wells. The URR for this scenario is optimistic because no degradation of new well EUR is assumed after 2021, pressure depletion has been evident since at least 2022 and probably started in 2017 (but is hidden by increasing lateral length), when we account for this by normalizing for lateral length the degradation in new well EUR begins in 2017.
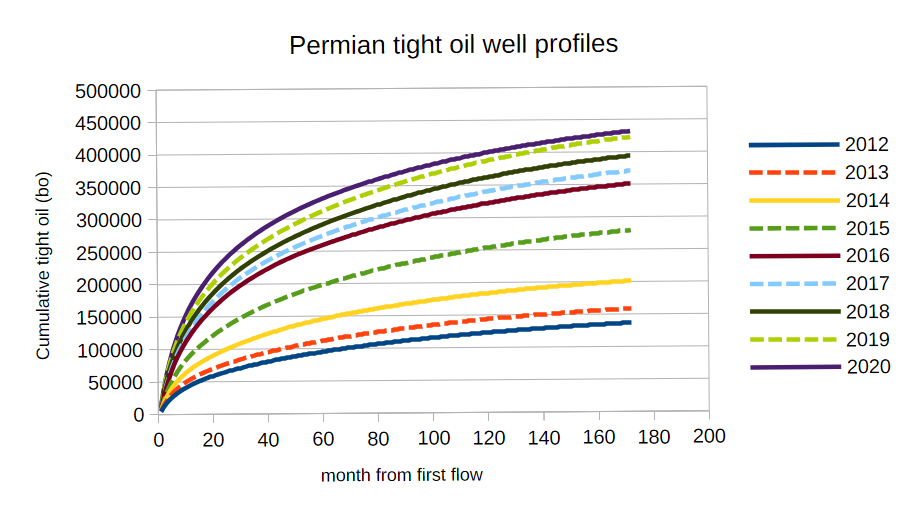
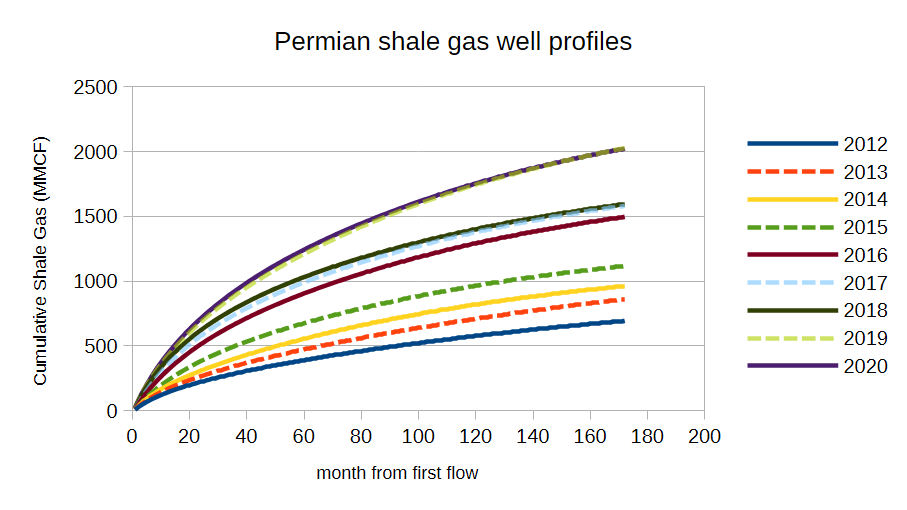
The two previous charts show how the Average Permian well profile changed from 2012 to 2020. The tight oil well profiles for 2022 and 2023 were very similar to 2020, with 2021 about 4% higher, I assume that the 2024 average new well was similar to 2022 and 2023. For shale gas the average 2021 well has an EUR about 3.37% higher than 2020 and the 2022 and 2023 wells look very similar to 2021. I assume the 2024 well is also the same EUR as 2021-2023 average wells.
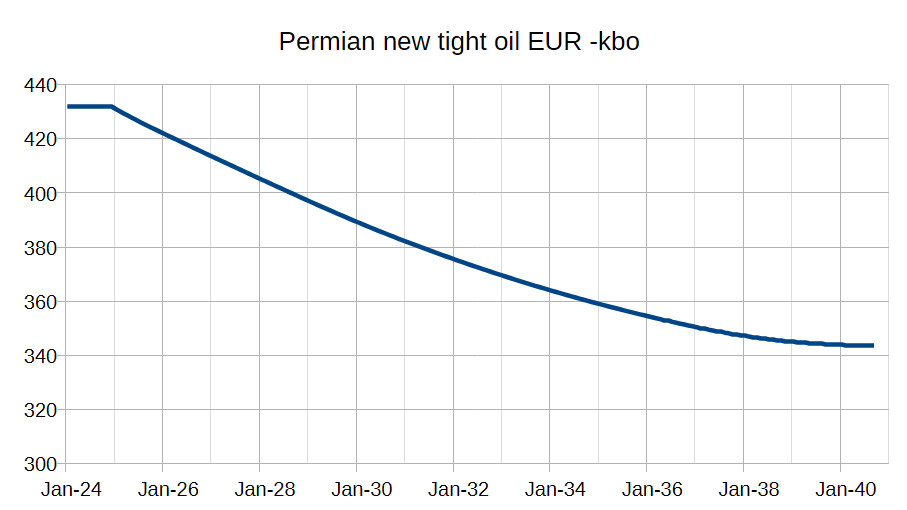
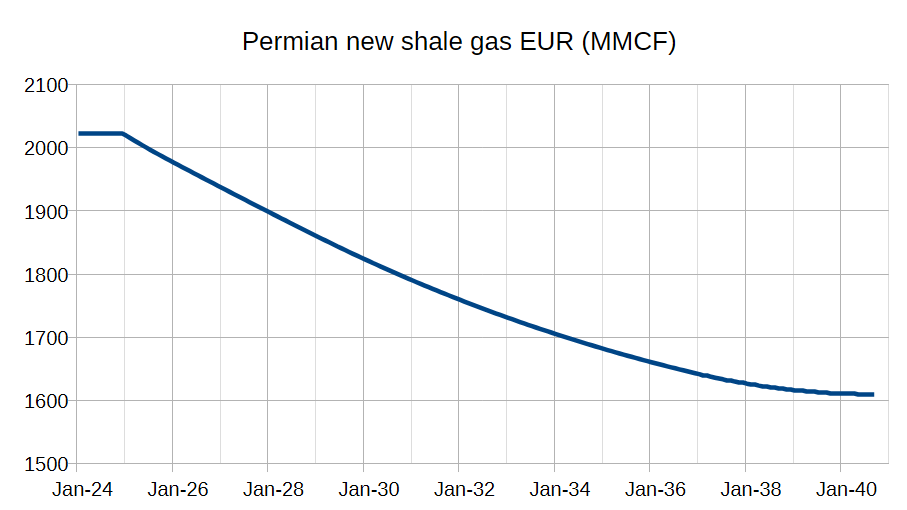
I assume the average Permian well suffers pressure depletion which reduces new well EUR as shown in the two charts above for the low oil and natural gas price scenario presented below. This scenario also assumes about 108 thousand wells are completed from Jan 2010 to August 2040. About 55 thousand horizontal Permian wells have been completed through September 2025. Analyses by Jorge Garzon of Novilabs of the Midland and Delaware sub-basins of the Permian (click links for details) suggest about 52 thousand locations with tier one or tier two economics remain in the Permian. For the low prices that I have assumed (consistent with current futures curves for oil and natural gas) I believe only locations with tier one or tier two economics will be viable.
Spreadsheet with tight oil scenario above can be downloaded here (about 5 Megabytes).
Spreadsheet for shale gas output for Permian low price scenario shown above is here.
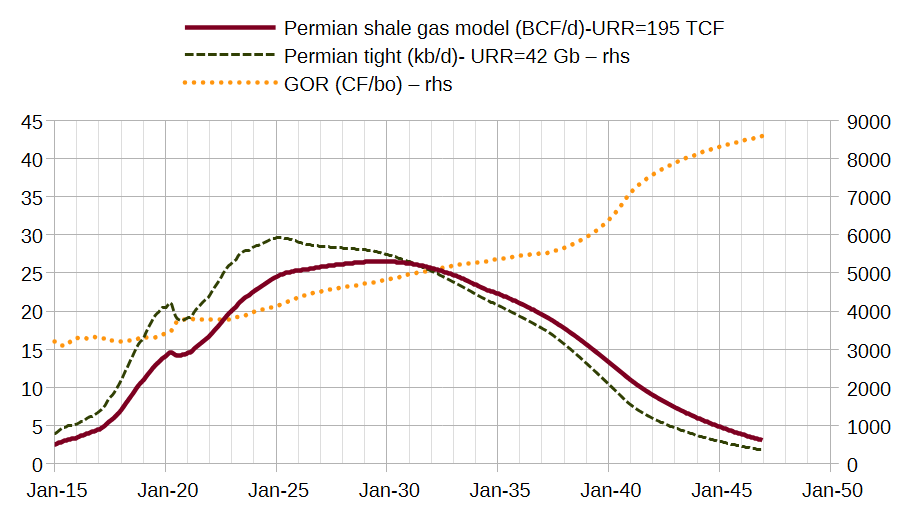
Tight oil, shale gas and GOR for Permian low price scenario in chart above.
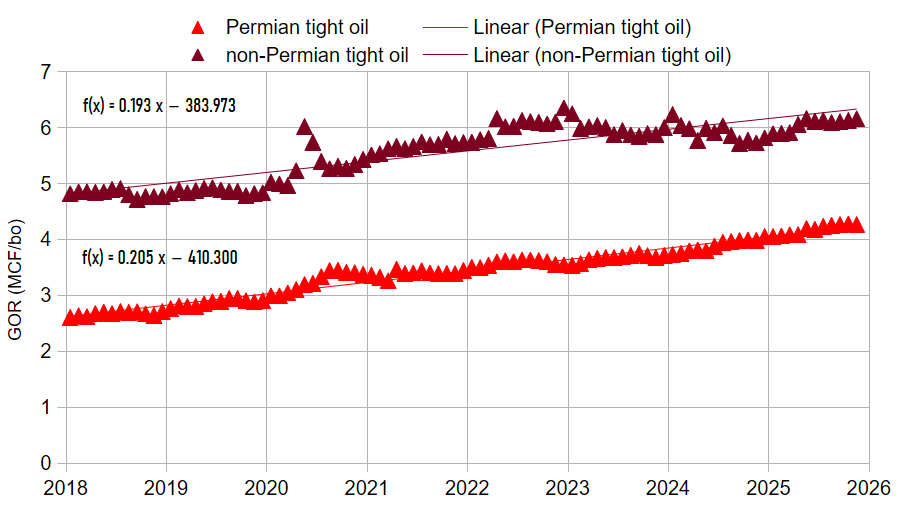
Using EIA data for shale gas and tight oil for the Permian and non-Permian tight oil plays we find that from 2018 to 2025 the trend in GOR has a similar slope (an increase of about 0.2 MCF/bo per year). The average difference in GOR is about 2 MCF/bo over this period with non-Permian tight oil having a higher GOR average than the Permian basin.
To get a rough estimate of US Shale Gas from tight oil plays in a low price scenario I use the Permian GOR shown in the chart before previous chart (second chart up) and add 2 MCF/bo to approximate GOR for non-Permian tight oil.
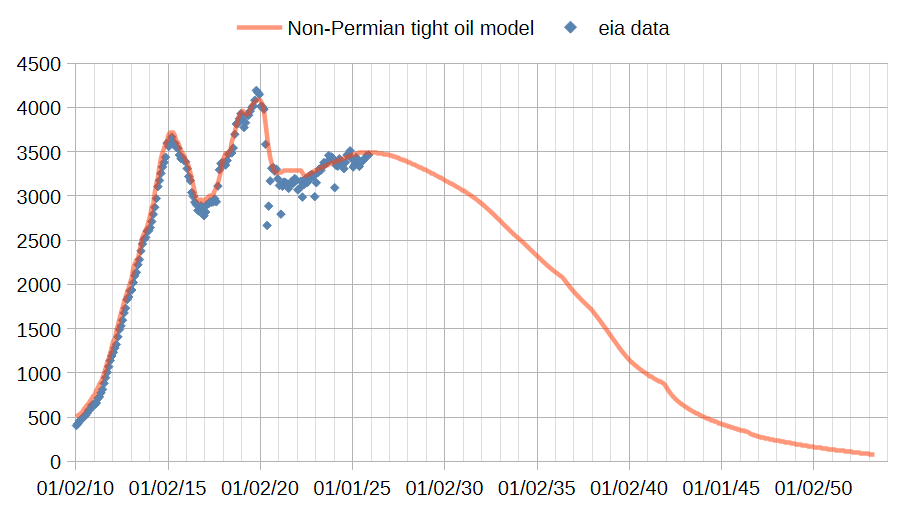
The chart above has a non-Permian US tight oil scenario for a medium price scenario for oil and natural gas (oil=75/b and gas $4/MCF), this is multiplied by the GOR scenario I referenced earlier (2 MCF/bo added to Permian scenario over the Jan 2010 to April 2053 period.)
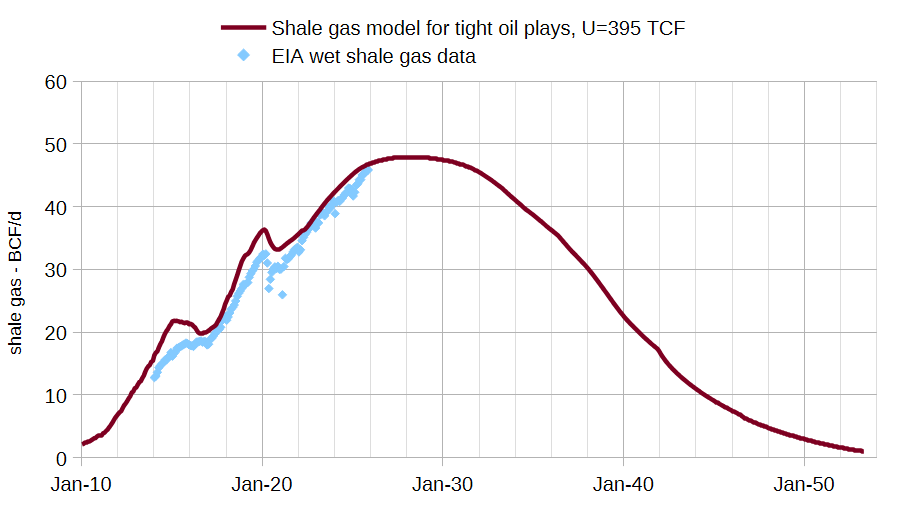
The scenario above adds the Permian shale gas to the non -Permian tight oil associated shale gas, the model is very approximate with the GOR used as a short cut to approximate shale gas output from several distinct tight oil plays (Bakken, Eagle Ford, Niobrara, Woodford, Mississippian, Uinta, and Powder River. Note that over the 12 year period from Jan 2014 to November 2025, the model mostly over estimates shale gas output, so the model might be on the optimistic side. In addition the medium price tight oil scenario probably overestimates non-Permian tight oil for a low price scenario by 25% or so which would also tend to make the scenario above too optimistic. In any case the future is always unknown. Scenario in spreadsheet here.
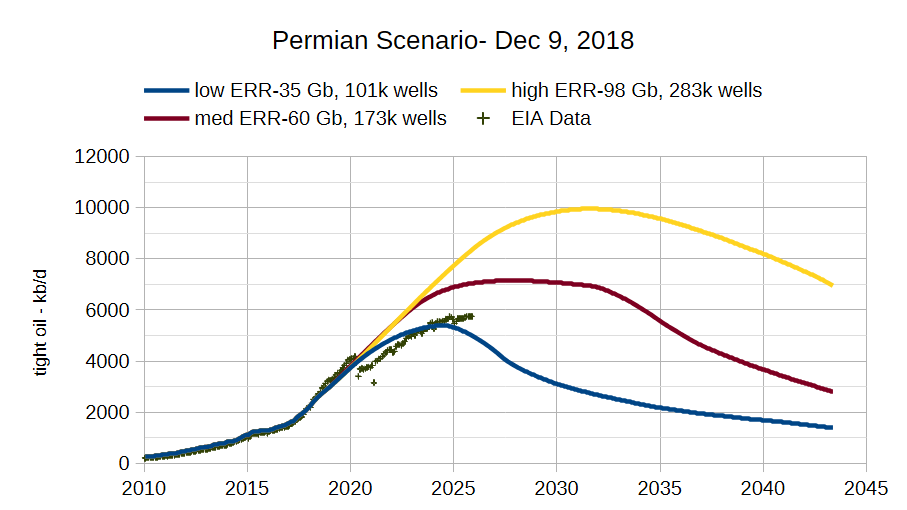
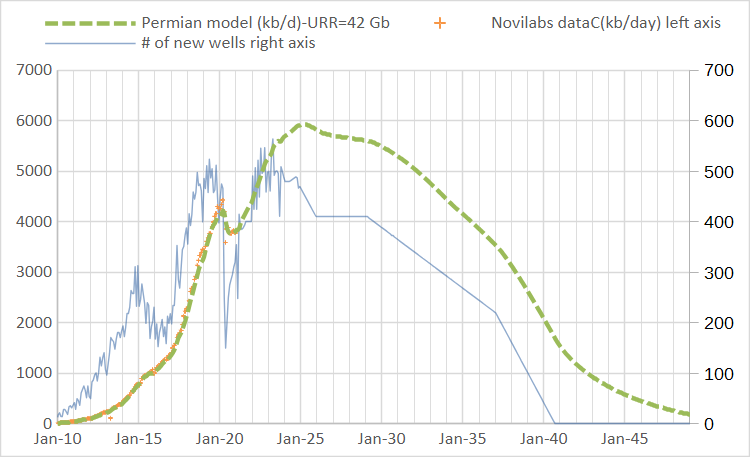
Above is a model I did in December 2018, my current best estimate for low, medium and high oil price scenario cases have a URR of 42 Gb, 52 Gb and 62 Gb respectively, roughly between my low and medium cases from 2018. The high case from the 2018 model would probably require an oil price of $250/b in 2025$ and natural gas at $10/MCF.
206 responses to “Permian Basin Shale Gas and Tight Oil and Shale Gas from US Tight Oil Plays”
Thanks for putting it down. Will read through. May have several questions, comments. Not just to peck critically…but that is what is needed to process complex article. Again, thanks.
Quick note on the simple low price scenario which used a single well profile for all 108 thousand wells and had a URR of 47 Gb compared to the more realistic scenario (with different well profiles over the 2010 to 2020 period followed by decreasing EUR after 2025 with a URR of 42 Gb. If we assume no decrease in EUR after Dec 2024, with no other changes to the scenario, the URR increases to 44 Gb. The other 3 Gb is due to the higher EUR of the first 27 thousand wells of the “simple scenario” with the single well profile used compared to the more reaslistic scenario with varying well profiles from Jan 2010 to Dec 2019. Clearly we do not know the future rate of decrease of new well EUR. I used the 1.5% annual decrease of normalized EUR over the 2017 to 2022 period as a guide and chose a 2% annual decrease in new well EUR at 6000 wells completed per year, the rate of decrease depends on average completion rate so if the rate of well completion were cut in half to 3000 wells per year the rate of decrease in new well EUR would also be cut in half to 1% per year. Obviously this will not be correct, it is a guess. The optimistic assumption of no decrease in new well EUR increases URR by 4.7%.
Nice work DC
https://www.youtube.com/watch?v=FwU4cGWDAAA
5 minutes
The end of Venezuela is here.
80% of food in Venezuela is bought from oil export revenue; Trump and Hegseth just cut that off
Venezuelan oil would go off the market for years.
This might have cascading effects around the world, leading to a wild ride in 2026
Says the chap in the video
Andre,
Thanks.
It is difficult to stop all oil tanker traffic, this may be Trump full of sound and fury, signifying nothing (from MacBeth). We will see, seems this will not be good for the people of Venezuela.
Venezuela has 3 ports that export oil.
That is nothing for the US Navy to stop.
I want low prices for consumers. Let the oil flow. Iran too. Russia too. I want Mike and Shallow crying. 😉
Don’t dick around with Vz. I hate this war crap, whether from Ds or Rs. Both a bunch of chicken hawks. I only want to fight if it is in America’s interest. And no…drug smuggling is not sufficient for going to war.
Only 40% of the Venezuelan oiltankers is sanctioned by the U.S.
Andre
Let me make several points.
Please look to Guyana to see want oil wealth can do for a country when the leaders have its citizens welfare as their top priority.
Ever since Hugo took power, the people of Venezuela has been the last priority. Gaining and maintaining power is all that matters for the leading elite.
Weather you like it or not Trump and Hegseth have the welfare of the people of the US as a priority and working to stop the 1000,s of drug deaths and ruined lives is what matters to them.
So the Venezuelans are starving but can buy $20,000 of outboard motors to put on a “fishing” boat loaded with a thousand gallons of fuel to race across the ocean.
And don’t forget the millions of dollars of oil given to Cuba so the elites can learn how to set up and run a proper terror and control apparatus so as to maintain their power.
Ervin,
When a nation blows up small boats in international waters with no due process, who is the terrorist? The US was once a nation where the rule of law meant something, now we have war criminals ( and convicted felons) running the show.
I agree Chavez and Maduro have done a poor job leading Venezuela, but also believe regime change often results in very poor results based on the historical record. It is up to the people of Venezuela to do something about Maduro.
Venezuela has mostly suffered as revenue from oil exports decreased both due to lower oil prices and sanctions imposed by the US, especially those on the petroleum industry starting in August 2017. The EU and Canada are also applying sanctions pressure on Venezuela in concert with the US. This has led Venezuela to become closer to Russia and China (Venezuela has been close to Cuba since Chavez came to power in 1997) in order to avoid sanctions.
Not clear there are any easy answers, doubtful a war will improve the lot of the people of Venezuela, but that should be up to them and not the US government.
Not an oil related comment.
Irvin, the few boats from Venezuela aren’t carrying fentanyl for the US as stated by Pete and Donald, it’s most likely cocaine getting transhipped to Africa and Europe. This is less of an example of Pete and Donald acting on America’s best interests than tariffs on Canada to stop fentanyl from Canada where more guns and fentanyl go north to Canada than south from Canada. The majority of fentanyl comes across the border from Mexico in vehicles. If drugs were a real concern for Donald he’d be funding the social system that treats addicts and reduces demand. But he doesn’t and he isn’t.
“ If drugs were a real concern for Donald he’d be funding the social system that treats addicts and reduces demand.”
True. He also wouldn’t be pardoning drug kingpins.
An AI summary(!):
President Donald Trump has pardoned multiple individuals described as “drug kingpins” and high-level drug traffickers during his time in office, a decision that has drawn significant controversy.
The most notable pardons include:
Juan Orlando Hernández: The former President of Honduras was convicted in March 2024 of conspiring to import over 400 tons of cocaine into the U.S. and related weapons offenses, and sentenced to 45 years in prison. Trump granted him a full pardon in December 2025, leading to his release from prison. Trump defended the decision by claiming the case was a “politically motivated” setup by the Biden administration.
Ross Ulbricht: The founder of the “Silk Road” dark web marketplace, which facilitated the anonymous sale of over $200 million in illegal drugs and other illicit goods, received a full pardon in January 2025. He was serving a life sentence without parole, but his case had become a cause célèbre among some in the tech and libertarian communities who viewed his sentence as excessive.
Larry Hoover: The former leader of the Chicago-based Gangster Disciples street gang, described as running one of the largest and most violent drug syndicates in the U.S., had his federal sentence commuted by Trump in May 2025. He was serving multiple life sentences for murder and continuing a criminal enterprise from behind bars.
Garnett Gilbert Smith: A Baltimore drug trafficker who ran a multimillion-dollar cocaine ring and was described by the DEA as “one of the largest cocaine and heroin dealers to be arrested… in recent history” was pardoned by Trump in May 2025.
These actions have been widely criticized as inconsistent with Trump’s “tough on crime” and anti-drug war rhetoric, with critics suggesting they undermine U.S. counter-narcotics efforts and the rule of law.
Always Trump, always Trump, always Trump! AWW…that was a yellow.
https://www.youtube.com/watch?v=ElJe5M54brI
Seems to me that some guy named Jefferson sent our ships to kill pirates in Tripoli. That set the standard for what the US was all about. Monroe issued the Monroe doctrine. Almost 100 years later, the ship Maine’s boiler blew up and we sent troops and invaded Cuba. We wanted a way to get from the Atlantic to the Pacific, so we “took” some land and built a canal. They made it pretty clear how the US would be run. So, here we are, over 100 years later – and everyone is perfectly free to leave. Have a nice day.
“everyone is perfectly free to leave”
Well, sure. The thing is, the US is a democracy. That means that the government operates with the permission of the citizens. The citizens are in charge, and they’re not only free to criticize the government, they’re obligated to. That’s the way it’s supposed to work.
So, if you like living in a country where you’re not allowed to criticize the government, you should really move to Russia or China.
America’s Biggest Oil Field Is Turning Into a Pressure Cooker
Drillers’ injection of wastewater is creating mayhem across the Permian Basin, raising concern about the future of fossil-fuel production there
https://www.wsj.com/business/energy-oil/americas-biggest-oil-field-is-turning-into-a-pressure-cooker-8a1bfe4e?reflink=desktopwebshare_permalink
I am posting this here as it came to the end of OPEC thread
Thanks Professor Korpela,
For me that article is behind a paywall.
https://mishtalk.com/economics/toxic-wastewater-turns-us-largest-oil-field-into-a-pressure-cooker/
Issues with WW disposal are serious but far (very far) from new. This is about the gazillionth article on this….and we should be astuted enough not to react to articlers that pose it as a new concern. A more grown up reaction would be to compare to previous warnings (issues going back 10+ years!) and see what is new.
thanks for the epic reviews and forecasts for Permian!
I would guess when investor realized that the EUR seems to be an invariable no matter how much they put into fracing, so-called magic coke proppant 10%ish increase is just marginal. Under the low price scenario, your off-the-cliff falling is quite possible.
Thanks Sheng Wu.
I am also a skeptic of coke proppant. But “no matter what” is a bridge too far. Go look at the Haynesville renaissance, for example. Remember when that was a post peak, old man play? Yeah…Pepperidge Farms remembers.
ANonymous,
You mentioned Haynesville renaissance, and I want to detail that renaissance.
In the Barnett revolution, they started with conventional text-book fracking, i.e. Massive Hydraulic Fracking (MHF), and it is totally different from todays’ massive slick-water fracking.
They have to use gua gel as proppant carrier, and in many cases, ceramic proppant, both are super expensive. Then, the frac fleet only charge by gel and proppant amount, not the water added.
Then, Nick Steinsberger bravely copied the success at tight sand gas in Union Resources, when he only applied slickwater and very small amount of sand, and this reduces the cost by 50~80%, and IP up 3~20X and EUR up 2~10X.
So, to qualify as revolution, you need some cost-down and production improvements close to what happened in Barnett.
But, when the E&P companies tried to copy the success in Barnett to Haynesville, they revert to text-book MHF, and used gua gel and ceramic proppant, citing the ultra-high pressure much higher than Barnett. This did not change until Haynesville had its first death sentence in 2013, and see off-the-cliff production drop. Then, in 2015, slick water and high strength white sand (from Michigan) were used, and see the IP up 2~5X, and EUR up 2~3X, and even some refrac with water and sand had super stellar wells. This basically repeated the revolution in Barnett more than 10 years ago. Now, they are starting to use local sand?
My impression is that it is more than just cheaper proppants and less gum. That they upped the solids loading and horsepower. CHK’s “Propageddon” was the starter.
There was a good overview on the overall change (I think on HGS, I think by William Demis, while he was at Goldman), but it seems to have disappeared or gone behind a paywall, or I just can’t find it, now.
There are many article overviews. Here is one:
https://archives.datapages.com/data/HGS/vol61/061005/21_hgs610021.htm
See also:
https://www.aapg.org/news-and-media/details/explorer/articleid/44930/new-methods-drive-haynesville-renaissance
Anonymous,
I agree that the larger frac size helps, but the mainstream always only mention the proppant volume, ignoring the slick water amount.
Imaging how ludicrous this logic is against textbook fracking design:
the principle is to use proppant with strength high enough to prop under the formation pressures.
If it over 7Kpsi, we already have to use ceramic to survive, and for Haynesville at over 12Kpsi to over 20Kpsi, using sand is like pumping mud.
Sheng Wu,
I only know the popular version. If there are some subtleties, I just don’t have the basis for them. Something had to be going on though. Look at the incredible rebound of the whole play…even after it peaked. And even at worse prices.
I always sort of wonder about the whole fetishization of “slickwater”. Is that a cost savings or a performance improvement? If cost were not an object and I just wanted performance, would guar be better?
Anonymous,
You could chatbot and easily find out the cost reduction switching from gua-gel to “slickwater”. For slickwater, the concentration is only 1~2% of the water and it is cheap chemical; for gua-gel, the concentration is like 20~30% and is much more expensive to pump the same volume.
The gua-gel is to increase the proppant carrying capability according to textbook, and one should avoid leaking water to the rock volume; and the slickwater only reduce friction and barely have 1/100th of the proppant carrying capability of proppant. So, the proppant to fluid ratio is like 3~5:1 when switching from gua-gel to slick watre, and to pump 10X more proppant, one need to actually pump 100s more liquid volume — but it is so ashamed for experts to say it is water they pumped.
In terms of performance or the key to revolution, it is really the water that did the X3~X>10 magic.
But for any people with normal petroleum production training — they have an inherent resistance to such magic story. You could read my story here,
https://www.linkedin.com/pulse/shale-revolution-arent-when-you-judge-conventional-wisdom-sheng-wu
The fact that a small mainstream “hard core” geologists refuse to admit oil could be produced from shale is based on the fact that they refuse such concept of “volume stimulation” — by which the rock volume permeability is changed by the magic water. Because the textbook of conventional fracking is only increase the contact at the production hole, not the volume, and water is actually harmful to the volume. If the volume permeability is not changed, then oil could not be produced as its viscosity is orders higher than gas. With this logic, they also coined that only “light tight oil” could be produced, i.e. API 35 is the lower limit. But, in the past 5 years facts have proven them wrong, not only API 25 shale oil could be produced, they could actually produce more efficiently than API 45.
Thank you very much for the donated brainpower and explanation DC.
A good chart of the Nat Gas output from the various US basins is attached, from
https://www.eia.gov/todayinenergy/detail.php?id=62283
nat gas
Thanks Hickory,
One problem with those EIA numbers is that shale gas and conventional gas are combined in each region, most of the output is probably shale gas, but it is difficult to get a good read on what is happening.
It’s probably not that big a deal. All of PA was 1 BCF/d, before the shale boom. Presumably that has gone through decline, also. So, it’s a small fraction.
For the Permian, it might be more. Per the DPR, the region was doing 6 BCF/d in 2014. Hard to say if that grew or declined. I would guess declined. There was some vertical drilling over last 10 years. But also even that 2014 number probably includes a fair amount of gas from hz wells.
For that matter, sort of, who cares. I mean…it’s in the region. It’s in the pipes. Would a gas molecule (rose) by any other name smell as sweet? For the customer it’s all production. And same for the midstreamers.
From earlier in the fall a good visual update on the balance of Asia Pacific basin oil production/consumption broken down by country, courtesy of Matt from down under.
For the combined country balance look to figure 9
https://crudeoilpeak.info/peak-oil-in-asia-2024-update
I read it. He does good stuff. Wish he would do more “so what” (the story). Even if wrong, I want some insight/import. Not just graphs. But still….good work.
I really hated the one chart with 3D columns. Such an awful format. and I could not read it either. Better off in a table.
Dennis
I would love to call you names, ridicule you and question the ability of your little gray cells but I won’t. The fact that the best you say “ a poor job leading” speaks volumes about your judgement of what’s right or wrong. Sure capture them and send them to court in the Eastern District of New York. Un*****ing believable. Please explain to me, using all the intelligence you have, why there are open boats cruising at 60 mph powered by $20,000 worth of Honda engines on the open ocean.
Sometimes Dennis you are bewildering.
What is it we celebrate about being American? What are the American freedoms that we honor soldiers for defending?
A big part of it is civil liberties: innocent until proven guilty, a court process with a jury of one’s peers, etc. Police aren’t allowed to just kill people because they’re confident that they’re guilty.
Even worse, soldiers aren’t police: they shouldn’t be used to do police work. Soldiers are supposed to fight wars, not smugglers. And killing civilian smugglers is against military law, and should offend our conscience: it’s absolutely considered a war crime for a reason.
Thank you Nick G!!!!
Thank you Dennis!!!
People like Dennis have a broken moral compass.
Nit picking of every tiny thing in America. Yet strangely silent about real brutality and murder committed by other governments especially those with so called left credentials.
https://www.hrw.org/world-report/2025/country-chapters/venezuela
These people are too stupid to realise that many of the world wars could have been avoided if the brutal dictators were stopped early on. Before they were allowed to build up huge armies.
Iver,
Either one follows the law or does not. I don’t support criminal activity either by the US Government or other governments. The UK can act as policeman of the World if you think that is the proper course. See to it.
I do not support Maduro, it is up to the people of Venezuela to remove him from office, this is what national sovereignty is all about. Try reading and comprehending what is written, it is not difficult.
Ervin,
It is not against the law to travel fast in a small boat. They can be sent to a court in Florida or Texas.
Do you believe in the rule of law?
Keep in mind that rule by executive order can cut both ways. The Trump administration is acting lawlessly, maybe after 2026 Trump will be impeached and removed from office due to his lawless behavior. Senators will no longer be able to make the argument that McConnell made in 2020 that no person is above the law. The Supreme Court has ruled that is not the case for Presidents and it seems the only recourse for a president that does not abide by normal rules of behavior is removal by the Senate after being impeached by the House.
It is doubtful there will be enough Republican Senators with the spine to convict Trump, which is unfortunate.
Keep in mind this will lead to no check on presidential power, a slippery slope to dictatorship.
Dennis
What you are talking about is not the law.
When a person kills somebody they get arrested and put in prison. Maduro, Putin, Chinese mass murderers would never be subject to the law thanks to people like you.
This is why the world is in such chaos.
https://globalinitiative.net/analysis/the-politics-of-murder-criminal-governance-and-targeted-killings-in-south-africa/
When America and other fought to stop North Korea invading the rest of the country they ensured millions of people and their children grew up in a free country.
You just don’t want to contemplate what freedom costs.
Iver,
On occasion interventions work, note that in the case of Korea one side invaded the other. Not the case for Venezuela, Iraq in 2001, Afghanistan, or Syria.
It is not the responsibility of the US to right every wrong in the World. In fact US action in Iraq and Afghanistan may have done more harm than good. Often US regime change as occurred in Iran and Chile put brutal dictators in power.
In any case if you think this is the right thing to do petition your government to do so.
Ervin, I would be very pleased if we could exclude political discussions, especially about such complex topics like Venezuela and Cuba. Peak Oil itself is a very complicated issue and its imminent political and economical consequences are highly demanding in themselves.
Peak Oil: Why the world can’t break its fossil fuel habit bold theirs
Climate change shifted the oil production debate from scarcity to demand. If countries do not deliver on ambitious green pledges, one expert predicts that production may peak within two years, forcing a chaotic decline.
Peak Oil once struck fear into policymakers, businesses and consumers as a looming moment when the world might suck the last drops of black gold from the ground, like a straw reaching the bottom of a milkshake.
The idea was popularized in the 1950s by geologist M. King Hubbert, who warned that US oil production would follow a bell‑shaped curve and eventually hit an unavoidable peak as fields matured and declined.
Climate change has flipped the narrative in recent years. Instead of the fear of scarcity, the debate now centers on when demand will finally peak as the shift to electric vehicles (EV) and other cleaner energy gathers pace.
At the same time, political pushback, from delays to combustion‑engine car bans to rollbacks of EV subsidies, is casting doubt on how fast that transition from fossil fuels will actually happen.
Experts divided on when demand will peak
Opposing views have emerged about when global oil demand will start to decline.
The International Energy Agency (IEA), a Paris-based body representing major oil-consuming nations, projects that demand will flatten to around 102 million barrels per day (bpd) by 2030. In its World Energy Outlook 2025, published last month, the IEA’s main Stated Policies Scenario assumes governments follow through on ambitious energy and climate goals.
OPEC, the Organization of the Petroleum Exporting Countries, takes the opposite view. In its latest long‑term outlook, the oil producer group forecasts that demand will continue to rise for decades and sees no peak before 2050, projecting consumption will reach nearly 123 million bpd by mid‑century.
The organizations share one underlying concern: Supply is becoming harder to sustain. OPEC believes that robust demand growth will justify steady investment to ensure ample reserves from its members for decades to come. The IEA, by contrast, offers a more restrained outlook.
Ron, in my humble opinion, climate change has always been to a certain extent a spin to make peak oil look manageable. This does not mean that ecological aspects of energy use and production have to be ignored. But everything has to be put in its real proportion and has to be related to the interests of strong economic and financial groups.
Westexasfanclub wrote: Ron, in my humble opinion, climate change has always been to a certain extent a spin to make peak oil look manageable.
Really now! Just spin to make peak oil look manageable? No, I don’t think so. I believe it is a real threat to millions of people and animals living in low-lying coastal areas. If anything, it is being denied by right-wing politicians who think it is just a conspiracy of the liberals. However, they have not explained why they would create such a conspiracy.
And that Antarctic glacier is a real threat. That alone could cause sea level rise on half a meter in the next 50 years, or as much as two meters if it should break loose and start sliding much faster.
It’s the Peak Demand concept. Not news. And I look side-eyes at articles that treat it as a new concept. It definitely matters and may in fact happen. (The whole “Stone Age didn’t end for lack of stones” quote from Saudi oil minister.) But an article (or commenters here) who treat it as an aha are way, way, way too simplistic.
You wrote: “Really now! Just spin to make peak oil look manageable? No, I don’t think so. I believe it is a real threat to millions of people and animals living in low-lying coastal areas. If anything, it is being denied by right-wing politicians who think it is just a conspiracy of the liberals. However, they have not explained why they would create such a conspiracy.
And that Antarctic glacier is a real threat. That alone could cause sea level rise on half a meter in the next 50 years, or as much as two meters if it should break loose and start sliding much faster.”
I am not discussing the fact of climate change Ron. But in this civilizational clusterfuck (rising sea levels or peak oil) we obviously have on both sides almost identical timelines and a very similar shape of the projected oil consumption.
So what would I prefer if I were in a powerful position? Tell everybody that we are screwed and that our way of life will end soon due to a lack of energy – or raise carbon taxes and promote renewables with the goal to save the planet? I obviously would chose the latter ( as a consequence there would surge the concept of peak demand). I would do so even if I knew that there were unsurmountable problems on that path – the convenience of a positive, proactive position is simply too tempting. It’s so obvious, you don’t even need a conspiracy to achieve the spin. Everybody simply takes his position out in the open and gradually climate change is weightiing out peak oil. And exactly that is what has happened IMO.
I have heard this argument long ago, maybe on TOD. Peak oil was cast as a more immediate existential threat to a comfortable way of life, while climate change was posed as a challenge that could be mitigated by gradually adopting alternative energy strategies. It’s obvious that the latter is less threatening to the status quo, so that’s why climate change pulls more weight.
But go ahead and make PO your main political platform and see how it works.
We are approaching the point where you may begin to hear more and more talk about geoengineering to counteract combustion related global warming. I suspect that by 2030 this talk will be widespread.
Forced migrations, flood and drought disasters, and escalating property insurance costs around the world will provide lots of motivation.
There are two mechanisms that seem to be worth studying, and perhaps even testing on a small scale.
One is sulfur aerosol dispersal in the high atmosphere (blocks some sunlight, like a volcano)-
https://en.wikipedia.org/wiki/Stratospheric_aerosol_injection
The other is Fe fertilization of ocean phytoplankton (takes carbon to ocean floor)-
https://www.whoi.edu/ocean-learning-hub/ocean-topics/climate-weather/ocean-based-climate-solutions/iron-fertilization/
I am deeply skeptical of any attempts to fix what we are breaking.
But I suspect some nations or corporations will try, at large scale, with or without anyone’s permission.
For example, OPEC could easily fund such an effort so that their products remain readily accepted for combustion and so that their water reservoirs, groundwater and rivers don’t continue to shrink.
Other big entities will have their own motivations…perhaps similar.
Paul Pukite wrote:
But go ahead and make PO your main political platform and see how it works.
Do you really think PO is a political platform? No, it is not, and neither is climate change. Hard facts of nature are not political, even though politicians argue about their validity. That is because politicians see denial as a political advantage and make it a political platform.
I am not arguing for action, one way or the other. That is because my argument would have no effect whatsoever. But I will tell you what the outcome will be. Some will attempt to soften the effects of both the decline of natural resources and climate change, but in the long run, all attempts will be futile. We will keep on doing what we have always done and behaving as we have always behaved. We will continue to take resources and territory from all other species until they have no territory left. Then they will simply die.
We evolved as hunter-gatherers, and we still have all those survival genes. So, doing what we are doing is just in our nature. Every species lives to the limit of its existence. One great ape, Homo sapiens, evolved a trait that gave it a huge and unfair advantage over all other species: intelligence. So once we developed the resources to wipe them out and take over their every niche, we did so.
Again, every species lives to the limit of existence. And, since we can create food supply for many billions, we will continue to do so. But once that food supply starts to dwindle because we have used up all, or most, of our natural resources, it will drop like a rock. And so will our population.
That will happen! It will happen because it is in our nature to continue to behave as we have always behaved. We cannot alter human nature.
It’s hard to say…especially when. To date the alarmist predictions have been too early. TOD and ASPO went bust after all.
I would also consider things like how fertility rate declines with wealth (starting to happen in more and more countries).
And maybe NickG, DennisC, and ElonM will invent some magic unicorn/rainbow clean energy device. 😉
It definitely seems like peak oilers are peaking well before peak oil. Deffeyes and Campbell and Staniford all gone. Meanwhile the world just hit another production record…and you got another failed peak call.
That is revisionist history. The conventional wisdom as determined by deep learning from available sources may be 2005. You may want to come up with a different measure to convince the historians otherwise.
deepseek-po
Record World Oil Production, 11DEC2025 article on this site.
But you go enjoy your deep learning. Along with closed for business ASPO and TOD.
You apparently don’t know how to specify a query. “When did peak oil occur for crude oil?” is a query. Here is another response from a different learning model :
gemini-po
Oh…wow…a query, for a large language model. Kissing cousin to a Google search. I prefer to use my brain, but here:
AI Overview
No, global peak oil (the point of maximum oil extraction before decline) hasn’t definitively happened yet, but experts disagree on when it will, with some predicting it within this decade due to slowing demand (EVs, China’s economy) and others seeing continued supply, though many large fields are past their peak production, and a supply peak might occur before a demand peak, with some forecasting strong annual declines post-2030.
Anonymous,
You claim peak oil too:
anon
Dennis
Nice job.
I am wondering in the chart below is this just tight oil and is it missing conventional oil or some condensate. I note the DPR Permian model shows peak production in December/January, the same as your model, close to 6,750 kb/d. Wondering what oil is missing. Is it the condensate from the NG wells,
Screenshot
Ovi,
This is a model of tight oil from horizontal wells.
See tight oil data in STEO rather than DPR data.
For 2025 Q3 they have Permian tight oil peak at 5.73 Mbpd.
https://www.eia.gov/outlooks/steo/tables/pdf/10btab.pdf
The missing oil is mostly conventional oil that is included in the Permian regional estimates. STEO has Permian regional output at 6.63 Mbpd for 2025 Q3, so about 900 kbpd of that is conventional C+C.
Regardless of who governs or further destroys Venezuela, I wonder
-What percent of their #1 global oil reserves are comprised of Orinoco Tar?
-Is there enough condensate/diluent domestically to get that tar to flow?
-What is the breakeven price for turning that tar into usable liquid fuel?
-What percent of the eventual Orinoco earnings will stay within the boundaries of the country?
-How pissed off will China be when the US renders their investments worthless, what will be the price to pay for that expropriation?
-Will the US escalation result in eventual palatable (for the average Venezuelan) stability, or a persistent long term chaotic state?
-Does Brazil and Colombia end up more or less cooperative/aligned with US?
-Does Marco Rubio end up being seen as a villain, or resolute and wise, by Latin America?
Hickory
Maybe not much of it will go into trucks but very useful anyway
https://en.wikipedia.org/wiki/Bitumen
Most importantly all people deserve to be free and have democracy. People like Dennis have no idea what a dictatorship is like.
Hickory
The big supplier of diluent to Venezuela has been Iran. They have a large condensate component in their C + C I think because of their large NG production.
https://www.argusmedia.com/en/news-and-insights/latest-market-news/2381419-iranian-diluent-boosts-venezuela-s-oil-output
https://www.vortexa.com/insights/mid-august-exports-snapshot
Iver,
I would love to see a democracy in Venezuela, this is up to the people of Venezuela, not me.
Iver.
Do you suppose the US will impose a democracy like ours,
where the leader pardons hundreds of extremists who were convicted for attack on the capital in attempt to disrupt the presidential election?
where gerrymandering prevents fair representation of the population in congress?
where a tiny state (Rhode Island or Wyoming) have as much power in congress as large states (Texas or California)?
Who are we to impose our dysfunction and severe wealth inequality on others?
Don’t fool yourself- this is not about proper governance. We generally tolerate authoritarians just fine, especially those with theocratic and fascist leanings.
Even in our own country.
Dennis
Thankfully most Americans in WW2 were not self justifying cowards and many died in order to get rid evil regimes in Japan and Europe.
You obviously would not have done so, from your own words.
https://www.dailymail.co.uk/sciencetech/article-15412467/Pentagon-report-WWIII-fears-China-missiles.html
“How pissed off will China be when the US renders their investments worthless, what will be the price to pay for that expropriation?”
How bout arming 100 Nuclear ICBMs capable of hitting the US?
First of all, the US doesn’t have the power for an invasion. Feet on the ground would be something too crazy to even consinder it. They can only establish a sea blockade and do some airstrikes. The response to these actions against Venezuela will be asymmetrical, think about Iran and that they control the strait of Hormuz for example.. Over all, these politics will fail, because such pressure is only hardening the Venezuelan government. Rubio and Trump will go down in history as unsuccessful politicians if they don’t get things straight. And for that, I perceive a lack of realism in their politics. From a Latin American point of view I would even say people generally reject any imposition from the north. And when it’s mixed with failure, there won’t be no sympathy at all for the US government.
The US has a lot of light oil, lease condensate, and plant condensate (pentanes plus) and even butane. All useful as diluent. We also need heavy oil for blending.
Howzabout we stop bombing and start trading? They got stuff we want. We got stuff they want.
We are natural partners. Send me a Vz hottie as payment for this brain storm.
Strong comment Hickory!!!
Annoying, eres un cerdo. Pendejo.
WestTexasFanClub said: “I perceive a lack of realism in their politics.”
I agree from the point of view of dealing with Venezuela. The best way to help a dictator is to create an outside enemy which unites a country under it’s existing leadership, and this president fits the role of imperialistic bogeyman perfectly.*
OTOH, I don’t think they really care about Venezuela. I strongly suspect that this is entirely theatre aimed at their voter base in the US. This president thinks in terms of perception, viewer ratings, and keeping a loyal followership. That informs most of his policies. No matter how destructive his policies are, if they keep his followers engaged they’re a success.
Fooling his followers isn’t’ his only goal. This president has a balancing act: he needs to keep his followers fooled and loyal, while he serves his true constituencies: his investments, the wealthy and the FF industry. It’s a balancing act because these constituencies have very different goals and needs. For instance, the true aim of his tariffs is to reduce or eliminate progressive income taxes. That, of course, harms his low income followers, so he has to pretend that he’s trying to protect or grow manufacturing jobs. In reality his tariffs have created enormous uncertainty and therefore only harmed both domestic and foreign investment in US manufacturing, but that doesn’t matter – only perception matters.
Similarly, his attack on wind and solar serves the FF industry but harms consumers (especially AI computing) and the country. And his attack on EVs helps FF but harms the domestic car industry and helps China.
————————————
*The value of bogeymen is something this president understands and values greatly. It’s the entire basis for his destructive foreign policy, including Venezuela, China, Iran and immigration.
Ovi, as far as can find there is very little of the Orinoco Tar being produced currently.
Dennis,
1. A minor comment to start. Mea culpa. The “convolution” gave me pause. What you are doing is (I think) a a many well summation. Generations of wells, by birth month, I guess.
Probably these are mathematically equivalent, but I will stick to thinking of it as a summation as it is more intuitive to me. And that is how I would code it.
“And that is how I would code it.”
waiting ….
I’m looking at the sheet now. He coded it as an addition of wells (or actually month-generation of wells, but each generation is a sum of wells within that generation and then the generations are summed).
It is better to have an intuitive physical understanding, not use fancy words/concepts, when not needed. This is the case in fluid dynamics, economics, wide bandgap semiconductors, market analysis or whatever.
Total production (time) = Sigma well production (time), from 1 to n, over all n wells. (Even the ones that have not started producing or have ceased producing, since the well function is just a “zero” at these parts of the domain.)
That’s more intuitive than star operator and box on box Wiki drawing.
I would also add that the idea of adding all the future wells is very similar to what is actually done for the production from the historic wells. That is just a summary of production from each well to give the field production. Not a fancy schmancy “convolution”. Appropriately named, I might add. 😉
Anonymous,
Any professional AI data scientist understands what convolution means. It’s at the heart of combining neural net layers. Condescending to call it “fancy schmancy” considering it’s importance in data analysis.
2. The 2010 to 2016 charts are interesting. I remember several years ago (c. 2017 or 2018, but I can’t find the thread), Mike saying something about Permian or perhaps PXD) wells getting worse. And I went and looked at Enno’s portal and it showed a very similar story to what you just showed. A story of massive getting better, at that time.
This is not to say that wells always get better as we can see them getting worse (not as dramatically as the got better, but still). But there definitely was a tendency to predict (or even claim observation) of wells getting worse, by peak oilers back in the day, that was a little bit jumping the gun. I think some of your 10+ year old Bakken analyses had a similar tendency, always expecting in the near future for those well to get worse, but they were not…the opposite.
Annoying, I have said numerous times you have the oil and natural gas literacy of an 8th grader; I don’t fault you for wanting to get even with me by lying.
From 2015 to 2022 when shaleprofile.com was bought from Novi Labs, Enno and I were close and we worked together on TRRC regulatory matters. He came to a well location of mine and to supper one night in my home. I had cursory subscriptions to SPC, then Novi, until 2023. I still have access to Novi data as current as November of 2025.
I would never had said that Pioneer wells were getting worse in 2017 because I had something to do with how the production profiles were created at SPC. The same images you saw, I helped create. You can’t find the comment, because I never made it. I have 3,000 SPC and Novi charts indexed; for me to have said that I would have provided proof. There was no proof of that; productivity was, indeed, improving.
Nice try, DH. I am not a peak oiler, just a real oil man.
You’re not.
One cannot project past performance to future results in the oil and gas business unless they live in the numbers matrix and are on an anti-oil agenda. New wells (in the Permian) are getting progressively worse, old wells are declining more rapidly, water is getting to be the single most factor affecting the future of American oil production…I don’t know what you will do with yourself after all these years, Nony.
I could actually care less.
https://www.oilystuff.com/group/oily-stuff/discussion/021eb38d-3fd3-4abe-bc48-124f59ce0a71
For Dennis:
This is an example of your Bakken expectations:
https://oilpeakclimate.blogspot.com/2015/06/eagle-ford-permian-basin-and-bakken-and.html?showComment=1436132391702#c7329748871877860722
“EUR decrease starts in June 2016 and takes 3 years to reach the maximum annual rate of decrease of 7%, wells are added at the rate of 200 wells per month starting in July 2013 and continuing for 250 months, 56,000 wells total.”
—
Back around that time, this seemed like a pretty consistent part of your modeling that soon wells would start getting worse. (Maybe even goalpost moved back as time marched on.) In fact, the Bakken wells got a lot better from 2015 to 2020, not worse.
Nony,
Yes I was wrong, Now they are getting worse, note that I expected an optimum lateral length would be established sooner. If I had been correct and lateral length had not continued to increase, EUR per well would have decreased. EUR per lateral foot has been decreasing for years in the Bakken. Also note that I was expecting about 9 to 11 Gb for Bakken/TF URR back in 2014, still looks about right, probably closer to 9 Gb if prices remain at current level.
Bakken lateral length was pretty stable in 2015-2019.
It’s not just neener, neener “you were wrong”. But why were you wrong? What basis or motivation drove you to make that -7%/yr prediction (a pretty bold one). IOW what did you learn?
Nony,
I made a guess based on logic, my expectation was that technological progress would slow down and that room in the sweet spots would run out and reduce EUR. Note that overall basin URR estimate was about 8.1 Gb in 2015 due to underestimating how many future wells would be drilled and underestimating what would happen to future new well EUR. How quickly EUR would decrease and when was unknown in 2015.
What I have learned is that predicting the future is difficult. Note that I explored different assumptions about decreasing future EUR in post linked below
http://oilpeakclimate.blogspot.com/2013/10/exploring-future-bakken-decrease-in.html
The scenarios ranges from 5 Gb to 17 Gb for TRR for scenarios with 50 thousand total wells, my best guess coincided with the USGS mean TRR estimate of 8.5 Gb for North Dakota Bakken/Three Forks.
Note that number of future wells and the rate that they would be completed was also unknown. I overestimated future completion rate and under estimated future new well EUR.
One of the middle cases from the October 2013 post at link below.
bakken 2013
3. The last 5 years wells Novi chart is excellent also. I agree that they are getting worse last few years.
Thanks especially for showing gas as well. Kudos. I had the idea (hope?) that natty might even be increasing while oil got worse. After all, drilling has been moving to the Delaware, which has higher GORs, for individual wells. So even if oil got worse, didn’t mean gas would. But I agree it has also.
It is interesting that the worsening for gas is less than the worsening for oil. So, perhaps this is some amount of the “moving to the Delaware”, but not enough to flip the switch to better gas.
4. The analysis (for gas, my interest) seems to have an implicit assumption that the price of gas does not matter. E.g. the very low price scenario is a very low OIL price scenario.
Now…I do think the Permian is oily and that this is extremely important to look at oil price, and then associated gas. But it is a complex basin with deep layers and areas that have high gas, low oil. So, looking at gas price also (or at least addressing in discussion) would be useful. Right now, at ~$0 HH, nobody is drilling for dry gas or for mixed wells supported by both fluids. But at $3-4, it is possible they will.
Again, the Permian is extremely rich and complex and does have gassy layers further down. In particular the Barnett.
4. Are you penalizing the new wells, with the expected 2%/yr EUR degradation or not? Like it seems like before you were, but now perhaps not? Did the analysis change versus previous recent graphs?
I just wasn’t even clear from your discussion. (Not even arguing, yet. For now, just asking.)
Nony,
New wells have decreasing EUR at about 1.8% oer year (at 410 new wells per month) starting in Jan 2025. See well profile spreadsheet (left hand column).
On prices I assume low oil, NGL and natural gas prices based on futures curve, I assume at some point soon Permian producers will get closer to Henry Hub prices minus transport cost from Permian by pipeline as more pipelines get built. NGL price is assumed to be 30% of WTI price.
I agree natural gas prices matter.
For a medium price scenario (WTI=$75/b, HH=$4/MCF) cash flow for average 2022 well becomes negative at about 204 months rather than 172 months for low price scenario. Also I assume about 50% of Tier one to tier 3 wells that do not have tier one or tier 2 economics are completed at the medium price scenario and 25% of tier 4 locations get completed, this results in about 140k total wells completed in the Perman for Medium price scenario. See chart below
permian medium price
A. When I look at the spreadsheet logic, I don’t see EUR changing by generation. (Or is it and I am missing the coding.)
B. Is the 1.8% per year the GAS decrease or the OIL decrease? You have a tendency to think of gas as oil. But we know (looking at the charts you provided) that oil has degraded faster than gas.
Nony,
It is both gas and oil with EUR decrease at 1.8% per year, see well profile sheet left column starting in Jan 2025.
5. Also, for gas (my interest), the degradation/yr has been less than oil (after all, we have the “moving to Delaware” trend masking things. So, instead of a 2%/yr, you would want to apply whatever holds for gas.
Nony,
When we look at EUR normalized for lateral length from 2019 to 2022, for tight oil the annual rate of decrease is about 1.7% per year and for shale gas well profiles the annual rate of decrease is about 3.3% per year, roughly 2 times higher. So adjusting for this would make shale gas less plentiful.
Looking at your charts, unnormalized, the charts look closer *(lower degredation) on the gas side than on the oil side. (2021 to 2023). Is that effect different than the 2019 to 2021 one? If you normalize, it ought to affect both of them the same (2021 to 2023), so comparing gas to oil, I saw less of a dropoff.
In any case, even if it IS -3.5%, then THAT is the number to cite. The gas number. Not the oil number. (when we discuss gas.)
I also don’t see in your model how you incorporate any -2% or -3% or whatever per year for any of the EURs. These feels like discussion, but is not a part of the model. Correct?
Nony,
In the first spreadsheets presented the model was “simplified” by assuming no change in well profile. For the “realistic” Permian models towards the end of the post look at the well profile sheet, there is a multiplier in the left column which reduces EUR starting in January 2025 in the well profile sheet. The multiplier is proportional to the number of wells, so if with 400 wells the decrease was 1%, at 800 wells it would be 2% and at 200 wells 0.5%.
6. It seems like there’s an implicit confounding of the normalized degradation to the per well degradation. Your model is in wells, not in lateral feet. If anything, you should put a thumb on the number of wells instead, not the well profile.
Nony,
Either number of wells could change or well profile (doesn’t really matter which we could assume well profile decreases by 10% or wells completed are reduced by 10%, output would be the same in either case.) We do not have lateral length information after 2022, so I assume lateral length is unchanged at 2022 average level in the absence of information. I assume Novi uses average lateral length in 2025 when assessing locations, they do not give us more information on this, so any adjustment would be a guess. Could perhaps be 10% more wells (an extra 5000 wells) if lateral length of assumed wells is at the 2025 level vs the 2023 level (average lateral length increased at about 500 feet per year from 2016 to 2022).
The assumptions on lateral length are not unreasonable. I just wanted to remind of the implicit assumption embedded.
Also, I am probably living in the past where lengths had not yet even gotten to 2 mile, 10,000 ft nominal average yet.
7. With respect to (6), this also brings up the question of what the “locations” in Novi catalog are in terms of average length. If they average X ft and the 2022 reference well averaged Y feet, you would want to compensate for that.
8. I like the idea of looking at the Novi location count. It’s novel and at least not one more USGS usage. This is irrespective of if the number works or looks good or whatever. Just kudos for trying something different.
Could you give a little more detail on what your source was? They have had several articles. And then also have used the tier 1/2 term in different contexts (e.g. ideal geology only, or after accounting for pressure depletion from nearby prior drilling).
[Edit: Just reread and saw the links, will read through. May still have questions, but will look.]
9. Not sure how I feel about T1/2 only. In principle seems reasonable, especially for the $45 WTI case.
Right now there is some drilling of the other tiers going on. So, not sure that none will be drilled at strip prices. E.g. for HBP. But also there is some T1 and 2 that won’t get drilled either because of landowner issues.
Also, it does raise the question of if the 2022 well profile (that so much of the analysis hinges on) is the same as a T1/2 average. Do we know how much T1/2/3/4 was done in 2022?
Nony,
I don’t have information on well profiles by tier, just basin wide averages by year. Most wells completed are probably tier 1 and tier 2 currently. Scenario below assumes EUR decrease starts in June 2029 when wells completed reaches 75k, which is when wells with Tier one economics run out, then the annual rate of decrease is assumed to be 4% per year when the annual completion rate is 4920 per year. Well profile from Jan 2022 to June 2029 assumed constant (no decrease). Title should say URR=259 TCF.
permian gas 2601
Novi had some post or article a while ago that showed depletion of the stock of tiers over time. It can be hard to find stuff from before. But not as hard as searching for old comments here. 😉 I kid.
I did find this presentation, see minute 14:46 and 17:46.
https://novilabs.com/resources/webinar-permian-staying-power-inventory-now-and-through-the-2040s/
It looks like about a third of 2022 was “geologic” lower tiers (even higher, factoring in pressure depletion, maybe to adjust to economic tiers). In any case eliminating all T3 and T4 would be high grading.
10. I think an ultralow price environment will not show continued worse wells. The opposite probably (similar to last note in para 9). We should expect high grading versus recent past. The impact would be more on the number of wells drilled. So, yes…minimal T3 or 4 at $45 WTI. But then the wells might actually have stronger average EURs than 2022. After all…we are cutting the worse ones from the average.
11.
I don’t understand the explication in the para “To create a more realistic scenario we can use three scenarios and stitch them together as we need about 300 months or more to create a realistic scenario with about 108 thousand completed wells for a low oil price scenario (WTI is $65/b or less).”
Like, you showed me that $45 scenario. Can’t you show me a separate strip scenario? 60ish, I guess. And then one that is high (e.g. $75). Perhaps there is some simple location math (low is T1, medium is T1 and 2, high is T1-3…or something analagous.)
Like, I get having 3 separate price scenarios to look at. but why show low (you call it very low) and then some sort of “stitching”.
I’m not even complaining about peakerism. I just don’t track what you are doing.
Nony,
The simple spreadsheet (first one with link) has only 129 rows (just the way I set it up years ago, didn’t want to create a new spreadsheet), so any scenario that lasts longer than 129 months needs a new spreadsheet that covers month 130-258 and another for months 259 to end of scenario. I have links to the three different spreadsheets, the output rows from the second and third spreadsheets are added to the bottom of the first spreadsheet (rows labelled convolution 2 and convolution 3).
The realistic spreadsheet is much larger with 543 rows, but that has a second spreadsheet with well profiles that I thought would create confusion.
The question about fast rampup is due to so few rows in the 129 row spreadsheet, couldn’t get close to current Permian output without fast ramp to 500 wells per month.
12. In chart “new wells added each month”, why does it have that big jump from zero to 500? Shouldn’t it just start at 500?
Similarly for the “# well added each month” chart further down. What is the explanation of the initial ramp?
“US shale oil production has turned negative [year-over-year] for the first time in history[.] That matters. Oil bull markets are born when depletion overwhelms new supply. Once new production can’t offset decline rates, prices do the work. …”
Link.
Not sure what/how exactly he is plotting. The latest 914 showed YOY growth of ~650,000 bopd. I wouldn’t be surprised if we see production turn soon. but it hasn’t been in the 914.
Maybe he is lumping in STEO (and considering it history) or looking at weeklies, which are STEO based. Often see those types of errors. But those aren’t historical data…are modeling/predictive trending.
13. Typical well profile:
a. How are you extending the 2022 Permian gas shale well through later life? (Not disagreeing, just would be nice to see it stated, the hyperbolic or exponential or whatever formula that is used.) Obviously, the historical only gives us 3-4 years, so there must be some extension.
b. And what are you capping end of life at (a X flow rate or Y time?) Obviously this affects EUR. Again, even before critiquing, like to just have stated how the model works.
Nony,
I use an Arps hyperbolic until annual decline rate reaches 12.5%, after that it is exponential decline at 12.5% per year. The Arps is fit to data using solver in excel, minimizing least squares, the 2020 well is used so about 36 months of data, the 2022 well looks very similar to the 2020 well over the period we have data. I use a discounted cash flow analysis looking at 3 stream output (crude, NGL, and gas). Cash flow becomes negative at around 171 months for the low price scenario. See first spreadsheet for well profile output in Barrels per month, output is about 15 b/d when cash flow becomes negative (oil at $60/b, gas at $3/MCF and NGL at $18/b.
a. I am looking at the first gas model, the “very low” price one, I think. Called “convolution-permiangasa”. I can see the typical well stopping production after month 172. That’s a little over a 14 year lifetime. (matches your comments)
b. At what month does the transition from Arps to exponential occur? I tried fiddling with your sheet and back-calculating, and it looks like ~5 year mark. [Not sure exactly as there is a small amount of noise in the reference well profile.]
c. 12.5% seems aggressive (in the peaker favor). I remember the arguments about 10% peakers versus 5% cornies. But we are espousing 12.5% now?
d. Also my understanding is that gas declines slower than oil. (GOR for an individual well increases over time, right?). So the 12.5% terminal decline for GAS seems especially aggressive. Is the oil terminal declining at 15%?
e. I don’t know the details of your cost model, but I have a hard time believing 15 bpd wells are cash negative and get shut in. Especially at the prices you noted. Do we see that in the Bakken? Does Shallow (a stripper well operator) think 15 bpd wells (even hzes, even in the Permian with more water) will get shut in. I wonder if you have some sunk costs (drilling/completion, bonds, land) mixed into your model (those are not cash costs). 15 bpd just seems very early to shut in wells. I guess if there is ton of water maybe. Otherwise, not making sense. I suggest to triple check your cost model.
f. [Edit] Doing the backcalculation, I’ seeing more like ~10% for the last couple years of life. Not 12.5%. Are you sure you put in a 12.5% annual decline?
Nony,
Sorry my explanation was incomplete, I use 12.5% per year for tight oil well profile, starting at month 98, note that first 21 months is Novi data, months 22 to 97 is based on Arps hyperbolic fit to the data and exponential decline after month 97 at 12.5% per year.
For the shale gas well I use a 10% annual decline rate starting at month 83. These decline rates match with the data from older wells and in fact may be optimistic because newer wells have been declining at faster rates and their tails might also show steeper decline.
Nony,
The low price model assumes long term oil prices of about $60/b with natural gas at $3/MCF no sunk costs are part of the net revenue calculation, I assume $18/bo (C+C barrels only) varialble costs and a fixed monthly cost of $25000 per month per well to cover future downhole maintenance. I was told by Fernando Leanme this was standard practice at major oil and gas companies (the fixed plus variable cost model). There are also royalties plus taxes of about 28.5% per barrel on average, I assume transport cost from wellhead to refinery gate averages $5/bo. Company overhead is included as a part of OPEX (often this is G&A in a 10k).
Note that operators often look at well payout when net revenue pays for the D&C for the well, for current Permian wells that cost about 12 million per well this would occur at about 134 months. cash flow becomes negative at month 172 under these assumptions. Total net revenue (not discounted) is $12.194 million at month 172.
10% (gas) doesn’t sound as unreasonable.
I found a paper on old conventional gas wells (30+ years old!) that said the average yearly decline was 6.5% (80-20 was covered by 2.5% to 9.5%). So, I get where people come with a 7% thumbrule. But then again these shale wells are still younger and declining faster, probably, not really in full terminal decline yet. So 10% (gas) not unreasonable for a 6-15 year old well.
I still don’t know about the EOL. Maybe they can cycle the wells? Do you still have to account 25,000/month maintenance for a well when it is idle half the year? (Donno, asking.) I realize these are a little more complicated, given the lateral. And the Permian is waterier than the Bakken.
Somehow, intuitively 15 bpd seems harsh for shutting the well down. I just think the history of U.S. stripper operation argues against it. Maybe the wells get sold to people with lower cost structures than the big guys.
Nony,
The 15 bopd cutoff seemed a bit high when Mr. Shellman first suggested this. The breakeven analysis confirms this at $60/b oil, $18/b NGL and $3/MCF natural gas, higher prices would increase the well life. I have long assumed higher oil prices and have been wrong since about 2015 on this. Maybe prices rise in the future, but I don’t see it in the futures strips, in fact when we account for inflation real prices actually fall, so in that respect my price assumptions are very optimistic relative to the futures strip. So the scenarios would be optimistic if anything. Prices are likely to be lower than my low price scenario in the future. For my medium price scenario (prices about 25% higher than low price scenario) well life is about 204 months (17 years) with cutoff for C+C production at about 10 bo/d.
Interesting article Explaining why OPEC’s Over Production is not Crashing the Price of Oil
China overtakes OPEC+ to become the primary oil price maker
The conventional wisdom on the crude oil markets is that producers like OPEC+ largely control the price of crude oil by changing output levels in order to achieve a desired result.
This shibboleth has been challenged by China in 2025, who used its position as the largest oil importer of the world to set an effective floor and ceiling for prices by increasing or decreasing how much crude was sent into storage tanks.
Prices were stabilized by the production cuts by OPEC+ in 2022. OPEC+ is a grouping of the Organization of Petroleum Exporting Countries (OPEC) and its allies, led by Russia. These gains faded once the organization began to reverse its cuts in April of this year. Faced with a looming glut of oil, OPEC+ decided to hold production steady for the first quarter next year.
China is left to clean up the surplus.
The biggest unknown on the crude market is what China will do in 2026. Beijing’s actions will likely influence the strategies of other participants.
https://www.marinelink.com/blogs/blog/russell-china-overtakes-opec-to-become-the-primary-oil-price-103879
Ovi
that is not a new strategy for China – I observed the same strategy decades ago in their purchasing strategy for pulp and paper products.
Not buying it. OPEC has been watching market response and adjusting its speed in coming off quota. Yeah…China matters, but much more short term than OPEC. It’s not like China can fill storage forever. Net, net: article is midwit.
Interregnum:
I’m going through the spreadsheet now. It’s pretty sweet actually. Still a bit of work for an outsider to parse (not heavily formatted, commented…but also very intuitive.) I am making a list of comments/questions so you don’t have as much of a stream of consciousness to respond to.
I do see where some of my questions from article are answered (like end of life criteria). But not all…and I don’t feel guilty for asking. 😉
The other major piece of work remaining is to look at the Novi analysis (itself) and then see how it was translated into your work. Even as mechanical as checking how many locations Novi cited and then how many wells you have. Haven’t started on that yet.
https://www.msn.com/en-us/news/world/russia-says-ukraine-tried-to-attack-putins-residence/ar-AA1Tegp0
Ukraine bombs Putin
Sheng Wu:
Was looking for the DeMis talk (it may have been at AAPG), and I found this:
https://www.aapg.org/video/articleid/59516/ursula-hammes-gas-giant-the-haynesville-shale-of-east-texas-and-northwest-louisiana
Pretty much a geology overview, not production, but there is a little bit on the renaissance at about minute 29.
There is also some very portentious talk at minutes 9 to 15 and at minute 27, saying people should look at the Waynesville. And this was a 2021 talk! So that term didn’t exist. She talks about the Pinnacle Reef instead.
I would say there is another 3rd life/renaissance for East Haynesville, given the facts:
1. Haynesville has the highest porosity, highest pressure
2. EUR is just on par with Marcellus core or lower, and seems that the pore throat closed earlier or not fully water fracked as Marcellus which has higher sand/quartz content
14. How are you accounting for the gas flow from existing wells? They will have a big impact on the eventual Permian peak and on midstream needs. It seems like your spreadsheet only shows the new well production. How are you estimating existing well production and adding it in for the basin total?
Nony,
Look at the last spreadsheets, Model starts in 2008. There were not that many existing wells at that point and output from any wells that existed in at the end of 2008 would be relatively negligible by now. Here is the medium price scenario 140k total wells for shale gas from Jan 2008 to Jan 2049.
permian med price2512
OK, I found it here:
“Spreadsheet for shale gas output for Permian low price scenario shown above is here.”
This kind of is what would be good for an in depth discussion. There is enough to fill a headpost, no need to pad out with oil or other plays. I’m sure the sheet works logic wise, but is a little hard to read (not a lot of row/column name markers, not clear where transition from historical to predicted occurs, etc.) so fulsome supporting discussion would be useful. I do see how there are differing well profiles by vintage now, I think.
15. On the spreadsheet (gasa), I don’t have much to ask or criticize. It seems to make sense in logic and layout. Doesn’t mean it’s right, if the assumptions are too conserative. But the sheet itself looks good.
I prefer a little more formatting for totals and headers. And showing multiple sheets for inputs (like the well profile) versus hard coding a cut and paste. And prefer to have the outputs on separate worksheets of the Excel, not floating graphs. But…the basic logic of the well count, typical well, generations, addition…the math guts of the thing…that all looks very sweet.
I guess I still need to look at the other two gas sheets. See how they differ.
Also, still need to look into the location math.
The global effort to survive without as much petrol for transport is going to get a boost soon courtesy of Contemporary Amperex Technology Co., Ltd.- CATL, which is the world’s leading designer, manufacturer, and seller of electric vehicle (EV) batteries and energy storage systems (ESS). The low cost and volume leader in the world, by a large margin.
They are on the verge of commercial production of a strong competitor to Lithium by a much less expensive alternative- Sodium. Their lead in the battery race will increase further.
https://cleantechnica.com/2025/12/29/catl-makes-big-announcement-on-sodium-batteries-for-2026/
Seems to me the critical application for electricity storage is in the power grid to complement intermittent solar/wind supply. While more money is available to continue the 5000lb personal vehicle lifestyle it’s that lifestyle that’s sucking up fossil fuels.
OK, I looked at all three spreedsheets, now.
a. They seem to differ mostly in the total number of wells added. I see “gasa” has a little under 60,000 wells added. “gas2” has a little over 43,000 wells added. And then “gas3” has only 3,675 total wells added. I don’t know how to understand this in terms of three different price scenarios. Especially since “gasa” I thought to be your lowest price scenario.
b. There are some differences in the shape of the well addition for each scenario. Not sure why we have to play with that also…but probably the total well count is the major feature, so…oh well. But I sort of would prefer one variable changed at a time. Or if there is some reason for the shape of the well addition curve to differ by price, some explanation/description to explain it.
c. I think the rest of the scenarios (sheets) are just the same in terms of well profile, no difference in well quality. This seems unrealistic. The highest price scenario should have the most wells added, but also a lower average quality well. And visa versa.
d. I think the basic logic/layout of each sheet is the same. (Fine.)
Nony,
The first spreadsheet is months 1 to 129 and second is month 130 to 258 and the third is months 259 to end of scenario. Price scenario is the same for all three of these spreadsheets.
Also output of each of these is included at the bottom of convolutionpermian1 spreadsheet for appropriate months.
OK, Dennis.
Kinda pooping out now. 😉
Probably the bigger spreadsheet would have made more sense to me. I am used to multisheet models for M&A and capex decisions (like a factory consolidation).
But…I’m tired now.
All…cool.
I looked at the two Novi LI posts that you linked to. I don’t see where you are getting the 52,000 Tier 1 and 2 well counts. Suspect there is a different source you are using. (They have had a lot of different posts on the Permian tiering concept.) I sort of want to check the number versus your scenario.
Also, trying to understand if you are using the before or after pressure depletion tier numbers. They have had posts where they said X Tier 1 in terms of geology. But then they did later posts moving some of the wells down because of parent-child. I.e. the effective Tier 1 count was lower.
Also, 52,000 (from your post’s text) is a lower number than your spreadsheet, which has just under 60,000 wells added. Although these are close….just not sure why the difference.
Hi Nony,
The two posts I linked to by Jorge Garzon have for Midland Tier1 economics 6154 wells, and 10065 wells with Tier 2 economics, a total of 16219 wells in Midland with Tier 1 and Tier 2 economics after accounting for pressure depletion.
For Delaware there are 14093 wells with Tier 1 economics and 21884 wells with tier 2 economics for a total of 35977 wells with Tier one or Tier 2 economics in Delaware. Total for Permian is 52196 wells with Tier 1 or Tier 2 economics in Permian Basin. As of July 2025 about 55000 wells had already been completed so total would be 107196 wells if no wells with tier 3 or lower economics were completed.
OK, I looked at the “eye charts” a little closer. 😉
I think I’m done fussing at it. Can’t really comment more until some of my comments/questions are addressed.
I didn’t get into the Permian oil or overall tight oil stuff. Trying to keep my focus on the Permian gas.
Actually I think there’s enough content, you could have just done a headpost on that. Would still be plenty long, especially if you had done some things like explain the typical well profile extension/EUR. But whatever…didn’t hurt me…I just kept my focus on first half of the post.
Did tight oil and shale gas because they are linked. To date pretty much all Permian Shale Gas has been associated gas, perhaps this changes in the future, but at futures strip prices (for both WTI and HH) it is very very unlikely.
Second half of post leads to estimate of shale gas from tight oil plays.
I’m getting OK with the model being ass gas only.
I would be a little more gentle with “very, very” unlikely when talking about the far out future though. Look how much has happened already that was different. Who would have thought ten years ago that we’d be kissing 14 MM bopd at low $40s (real 2015 dollars). And twenty years ago? You would have been banned by Leann at TOD for predicting what in fact happened.
I still remember saying ten years ago that you needed a wider uncertainty band. Look at the McKinsey cell phone prediction. Sh&$ happens when you try to predict decades out. Your own certainty level (of whatever you predict) should be quite low. So the possibility of something wonky happening exists. It might be “unlikely”. But “very, very unlikely” is A Bridge Too Far, when looking far out.
Again, not even saying to change your model. I would just back off from “very very unlikely” to “very unlikely” or maybe even just “unlikely”. 😉
I lied. Just some general thoughts.
1. It’s easier to criticize than to create. So kudos for going first. Also, it is really helpful to have something to respond to, to analyze, even if I see it different than you do.
2. The sheet is actually very sweet. I like how you coded it.
3. One addition you could make (not saying to do so, honest, just an idea). Insert a couple rows between 2 and 3. The headers would be “quality multiplier” and then “effective average well”. This would then allow you to high/low grade, based on price. (See next comment.)
4. I could sort of see (very crude and dirty as I don’t have tier counts or even know economic dependence) three different scenarios.
4.1. Base case, $60 oil: 60,000 wells. this is very similar to spreadsheet gasa. Just KISS it and do a ten year development with 500 wells per month. (Does that correspond to current activity? If not, extend it longer/slower). I think the well count is reasonable as there will be a few T3/4 wells that sneak in for HBP and drive the number up.
Set the “quality multiplier” at 1.0. I.e. the effective average well will exactly be the 2022 reference well. I think this is reasonable. There were some lower tiers polluting the 2022 reference and also will happen in future. Yeah, yeah, the normalized (oil) EUR is getting worse. But the unnormalized gas is almost constant. And we really have a well model, not a lateral feet model…and we don’t know the assumptions of “location” length…and it has been a characteristic of the basin to increase lengths…so I would just leave it as is. And yeah…yeah….pressure depletion, but also technology improvement. It’s really been a wash in recent memory.
4.2. The low case (I’m just calling it low, not “very low”, since the reference is strip) would correspond to $45 oil. For a back of the envelope, figure half the well count (250 per month, same play duration) and a 20% uplift in quality (1.2 QF). So the overall play EUR would be 0..5*1.2=60% of base case.
4.3. For the high case, figure that i $75 oil. Add 50% well count (750/month), but hammer the effective well with 20% worse. So 1.5*0.8=120% of base case.
Net/net: losing $15 of price hurts more than gaining $15.
5. You could get fancier with actual tier counts or researching the economic hurdle by “tier”. And even code the model to include the various tiers explicitly. But…whatevs.
6. I think the biggest uncertainty is in location count, which I still haven’t verified. If feels a little like your USGS assumptions. Linear impact on the result. I actually feel much better with Novi than USGS though. They actually map the whole basin and consider sweet spots and the like. USGS is VERY back of the envelope and mechanical, not thoughtful.
7. The decline curve work could do with an explication here (and the spreadsheet). I suspect it is about 25% too conservative (underpredicting) for GAS , given your harsh terminal decline rate and 14 year well life.
Nony,
For the Medium price scenario I have a 17 year well life (204 months) at about 10 bopd for the average 2022-2024 well. Look at data from Novi for wells that have been producing for more than 10 years and the 10% terminal decline rate that I assume is quite conservative, the data shows more like 11 % terminal decline for shale gas wells. Anything less than 10% is unrealistic.
Maybe. But honest, being firm about that would require a head post and a lot of analysis.
I pulled up Novi for the Bakken and it’s not clear that old wells are showing 12.5% (oil) and 10% (gas) terminal decline.
Look here: https://novilabs.com/blog/north-dakota-update-through-jan-2024/
Well Quality tab, 2010 generation, normal (linear) view.
OIL
Month 120 (10 yrs): 23.7 bpd
Month 132 (11 yrs): 24.9 bpd
Month 144 (12 yrs): 23.0 bpd
Month 156 (13 yrs): 22.0 bpd
GAS
Month 120 (10 yrs): 45.2 Mcfpd
Month 132 (11 yrs): 48.9 Mcfpd
Month 144 (12 yrs): 49.7 Mcfpd
Month 156 (13 yrs): 49.7 Mcfpd
NOTE!
I’m not arguing that you are wrong with 12.5% oil and 10% gas terminal declines. I actually have a very open mind. You might be right. And it may even be worse than you think. But. I have an open mind. It might be better than you think.
Yeah…I might have picked an outlier (not intentionally cherrypicking, but just got lucky) using 2010, Covid rebound, Bakken, etc. etc. But what I’m saying is that I need a holistic evaluation to endorse the 10% decline view. I remember Enno pushing that, but even at the time there were very few data points (since it was a few years ago) and I counseled to wait/look more. This doesn’t mean he was or is wrong…just I need more analysis to make me move from uncertainty.
Nony,
At the beginning of the post there are links to Novi data for the Permian, as that is what we are trying to model, that is the data that should be used, I used data from 2008 for chart below annual data in MMCF used natural log where slope of line is exponential rate of annual decline, about 12% per year. For the average tight oil well the decline rate is about 14.6% per year for the average 2008 Permian well. My estimates of 12.5% for tight oil and 10% for shale gas for Permian are conservative.
Also keep in mind that Enno had the entire data set well by well to analyze, his analysis tended to be spot on in my view.
On increasing development to 750 wells per month, we are not likely to see that at $75/b, last time we were high in 2022 the completion rate went up to 500 per month, we might see that again, but 750 does not seem realistic at $75/bo in 2025$ and gas at $4/MCF at HH.
permian gas 2008
Dennis:
I will look at the Permian data. I agree it is probably faster than the Bakken. (And the EF is probably worse than both.) I thought you were making a categorical statement, e.g. the term “shale gas wells”. Also, in the past, peeps here have categorically talked about 10%. But yeah, let’s keep it to the Permian, OK.
My point with Enno was just to wait and see. He was talking 10% after 10 years and we only had a couple years (for oldest generation) past 10 years, at that time. The point was just that nobody knows how the wells will decline at year 20 since we weren’t there yet. And extrapolating next 10 years based on last 2 years had some danger.
This was the case even if he ends/ended up right. It’s just a low basis for making that judgment.
I don’t think the “all the wells” is the exact key point. We should see (and what we care about) is behavior of well vintage averages over time. He did have all the months and all the years. And it is hella easier to do a general assessment with access to the base data (averaged by vintage) rather than you (or I) huddled over the web Tableau interface, pulling out data from scanning the cursor over a graph.
But this goes to my point that a general review is needed. Not you (or I) selecting one vintage for a crude analysis. There is more of a danger of an outlier (either way) from that method. After all, look at the crazy numbers for Bakken 2010 in years ten to thirteen. (And my point is NOT to push those as typical, even of the Bakken, but to highlight how a more holistic review is needed. Not just your 2008 Permian either.
This isn’t about Enno being a nice guy or smart. He is both. Nor is it about if a number is good for cornies or peakers. It’s about checking the info. Data rules. Analysis rules. If he said something several years ago, it still needs checking now. After all…if your 14% is the eventual answer, then his 10% was just as wrong as if 6% ended up being the eventual answer. 😉
AI Overview
The world population growth rate is slowing down from its peak in the 1960s, currently around 0.85% annually, adding about 70 million people per year as of 2025, with projections showing the rate continuing to decrease towards a peak of around 10.3 billion people by the 2080s. Growth is uneven, with high rates in Africa and parts of Asia, while Europe faces negative growth, with figures varying by region and country.
So, AI is predicted to peak in about 60 years. Well what about world petroleum production?
AI Overview
World petroleum demand and production are widely expected to peak by 2030, driven by the rise of clean energy, efficiency improvements, and climate policies. While some scenarios suggest demand could remain flat or grow slightly until 2050, most major forecasts—including the IEA—point to a peak in demand for all fossil fuels within this decade.
So, AI is predicting peak oil, both demand and production, to peak in about 5 years. Then it will start to decline, and that decline is likely to accellerate much faster than it increased. Bottom line, oil will be in steep decline while population is still increasing by another two billion plus.
We have think tanks that study everything. But, to my knowledge, there is no think tank that studies the effect of declining natural resourses while population is still increasing. But I would bet that will change soon.
“the effect of declining natural resourses while population is still increasing.”
For example, how to shift the global economic system of credit based growth to pay as you go contraction?,
and how to forestall absolute chaos while the downshift adjustments begin to happen?
I suspect this story will include a huge inter-generation conflict in many countries, such as in the US.
https://www.msn.com/en-us/news/world/chinese-oil-tankers-challenge-us-blockade-off-venezuela/ar-AA1Thgks
Chinese oil tankers challenge US blockade of Venezuela
https://www.youtube.com/results?search_query=Peter+Zeihan
5 minutes
Global oil shadow fleets are coming to an end.
“The world is in for a massive oil shock”
https://www.bloomberg.com/news/articles/2025-10-06/denmark-steps-up-oil-tanker-checks-to-stop-russian-shadow-fleet
Denmark steps up efforts to stop Russian shadow fleets.
Rewatch the video above, Russia might have to close Northern Siberian pipelines to keep them from freezing over if they can’t ship the oil.
Last time this happened it took 20 years to restore. But that was after fall of Soviet Union.
Any guesses/bets on what the 914 report tomorrow shows?
Last month surprised, with a 44,000 bopd increase. NM seems like the sole remaining source of consistent growth.
https://www.eia.gov/petroleum/production/
WTI prices in OCT (what will be reported) were a few bucks down from SEP and over ten buck down from the year before. And 60 is really like 45 (less than it!) from a few years. It’s not your father’s Oldsmobile.
My head says we are setting up for an overall drop or at least a stall. The recent increased growth seems a little bit of a surprise and maybe the tail end of plans made from year before. My heart is pulling for breaking 13.9 MM bopd. 😉
If we could somehow, by hook or crook, get to 14.0 bopd within next few months (before the turn, which I agree is coming) that would be so sweet. Gonna be hard with winter coming at us. NOV is sort of a winter month and DEC is definitely one, for ND and Rockies. Maybe FGOM (or FGOA, lol) can help us out? Some random projects coming on line? AK, too?
see the “light at the end of the tunnel” or “cliff off the peak”.
This is also the pattern of energy production at the national level, much like the money-lossing solar/renewable.
Report is not out yet. I think the Weekly came out at 1700 EST. They are starting to put in a new computer system.
Sheng Wu said “ money-lossing solar/renewable.”
You seem to be suggesting that this is a problem. Actually, a normal healthy industry has some companies that lose money: that’s what happens when you have healthy competition. Oil, on the other hand, has an anti-free market cartel that controls prices and often produces excessive profits for producers and excess costs for consumers.
It looks like the elephant in the room for your production estimates is the future price of oil. This is especially because the oil reserves in the US are so small in relation to the oil used compared to most of the countries with high oil reserves.
OPEC would be setting the price if they didn’t want the income from the oil so bad. How can one model loose concepts like this to come up with an actual price?
I would (pretty please) love to see an output graph for overall Permian gas production in the $45, $60 and $75 WTI scenarios. Three line on the chart.
You could use your standard methods. Decide whatever you want for assuming how many locations and/or well quality profile) are appropriate in each scenario. But like to know what assumption you made.
The HH natural gas price is pretty independent of WTI. Maybe even anticorrelated, as high WTI prices drive ass gas flooding the market. For simplicity, I would leave HH and NGL prices fixed, so we can isolate the WTI impact only. In any case, the HH and NGL have pretty limited impact in your model (just timing of end of life, and a minor part of that even).
P.s. And you don’t have to. Of course, of course. It’s a request. Por favor. 🙂
Nony,
Here is roughly what you are looking for, prices are oil prices low. medium and high in 2025$, assume natural gas prices are constant.
Low, medium and high price shale gas scenarios for Permian, high price case URR=312 TCF and low price case about 195 TCF (108k wells).
shale gas 2601
1. What percent of the T3/4 locations are consumed for the 60/75/90 scenarios? [I think you said the 45 scenario was 100% T1/2, 0% of T3/4]
2. Is the only driver of different scenario outcomes, the differing well counts and the later shutdown (from the cost model)? I.e. no provision of high or low grading, from going after different tiers?
2022 might be a reasonable proxy for the higher price scenarios (it had about a third non T1/2) and happened during $95 oil prices. But if you have a lot of T3/4, it may be too generous. Conversely, I think the 45 should show high grading (after all, it is all T1 and 2). And if you are not, then you are being too harsh with the well quality.
Nony,
The low price scenario is 60 per barrel in 2025$ at about 108k wells. EUR decrease of 1.8% per year at 410 wells per year.
As to well quality in the future, we don’t know what it will be. I assume well lateral length remains at 2024 level and EUR decreases less than the 2019 to 2022 rate.
Nony,
The low price scenario would be all Tier 1/ Tier 2, after Sept 2025, about 52k wells, of these about 20k are tier 1. high grading might result in higher EUR, but we did not see that in 2022, Eur per foot of lateral decreased. For medium price scenario, tier 1/ Tier 2 completions are about 60% of completions and for high price scenario tier 1 and 2 wells are about 44% of completions. Scenario below modifies low price scenario so that EUR does not decrease until all tier one wells are completed at 75k total wells, then EUR decrease starts in June 2029. Medium and high price scenarios unchanged from previous chart.
permian shalea 2601
I’m going to do an old school autistic Nony look at the Permian decline rates. Give me some time. It is a bunch of work with my “cursor scanning over graph and then transcribing to Excel” method. Wish I just had the database or a license to run queries. I’m not sure if even the $10,000 license would give me what I need. And I don’t have a few million to buy a company like Novi buying Shaleprofile. 😉
One mistake I made with the Bakken example was looking at rates. Yes that is what we care about. But the monthly rates have a lot of noise. So I will look at yearly cums (and hence yearly production) instead. I remember doing that back in the day.
If the answer comes back 12.5% (or 14% or 10% or 16% or 6% or whatever) I will be fair and give it. 😉
——-
To me, it’s sort of an intellectual puzzle, not just a “make cornies look good” or “make peakers look good” thing.
I could see physical reasons for the decline rate to be less than 10%. Yes, the transition from b to exponential might occurr. But it may not be sudden…maybe there is a trace of “b-ing” going on for a while longer. There is also that Payne paper on 30,000 old gas wells (showing 6.5% avg terminal decline). Yeah, the shale is different…but still…maybe it’s also similar. Who knows.
For that matter, I could imagine some physical processes occuring on different time scales. First production from macrofractures (existing), then from microfractures, then from adsorbed (or close to grain boundary in the microstructure). You can see how the later processes might have a slower time constant and lower decline.
There are probably other processes that could make late in life decline worse (e.g. proppant getting crushed and fractures collapsing, e.g. well retirements). I’m not even arguing for one or the other. Just these are the sorts of questions I wonder about.
Tight Oil Wells: Pressure Depletion
I have read through the maze of comments above and have read Mr. Garzon’s analysis at Novi, which is a claim that artificial intelligence has revealed an abundance of prime drilling spots in the Permian shale basin, specifically the Delaware sub-basin, and then circled around and covered his ass by saying that as many as 30% of these will be variably degraded by “parent-child” interaction. I have also looked at the admission by several people that it is nigh impossible to predict EUR’s in an active period of reservoir pressure depletion, because all the models are based on a static pressure. Then I looked at the decline predictions, and compared them to some real-life situations. I have been involved pretty much from the beginning of horizontal drilling (at least since the frenzy), and have had multiple chances to examine the dynamics, from bubble point to reservoir pressure, to water production and disposal. This doesn’t make me an expert, but it does make me capable of rendering a fairly indisputable observation that might clear up some of the confusion right now.
If you drill a shale well down to an oil-dense bench and then bend the drill string and stay in the center of a good porous mudstone interbedded with just enough carbonates to engender fracking planes, meaning that the mudstone had been laid down in layers, each of which took millions of years, and if that well is a virgin well and you don’t pervert it by drilling close to it, then you’re going to see an honorable decline curve whereby lots of NG drives up lots of LTO. And if you stay away from that well and just let it produce, I can assure you that the initial and terminal depletion curves look nothing like the “Family of Curves” generated by those 51,000 wells looked at en masse. Such a well—isolated, allowed to draw hydrocarbons from the frack territory—is a treasure. A decade along, such a well can still put a smile on your face. Such a well is also becoming rare as hen’s teeth.
The reason is that if you get excited and put in infill wells just as close as you can, the decline curves are going to degrade, because unlike initial common parlance of the early two-thousand-teens, there is equalization of pressures down there in the dense shale, and the fracture planes even may overlap drainage territory. There is a reason that one of the dictums of the original Texas Railroad Commission (Statewide Rule #37) was in regard to spacing distances toward the preservation of reservoir pressure. That was about 1920, and there was tight regulation to prevent destruction of driving pressures in the field. With the Permian they just flat neglected Rule 37, and also Rule 32 having to do with venting NG for 24 hours and flaring NG for ten days. That neglect will be costly.
Theoretically, artificial intelligence, or even a math whiz who also understands the oil field, could design fluid algorithms, calculating ever-moving decline curves based on reservoir pressure, which of course has a lot to do with bubble point but is not one-to-one. I respect the people who work at Novilabs and think they’re doing their best to provide accurate information in a competitive market where they also have to make a living in data sales. They’ve made some pretty wild claims re’ AI’s ability to reformat the Delaware, and then had to follow them with a disclaimer that infill wells and hydrocarbon price structure could render that calculation as useless as flatus and moonbeams. The end result of that sad story is that nobody truly knows how many wells can still be drilled in the Delaware, because nobody has come up with floating algorithms that are designed for each family of curves depicting individual clusters of wells.
This of course affects NG, as such a high percentage is associated. Dry gas is a different story. I’m still working on that one. Some of those old dry gas wells, especially the deep ones, seem to have a different lifespan. They’re the “super-agers” of American hydrocarbons. Not all, but some.
Gerry,
The analysis by DC above about Permian type curves over the years mimic those in Bakken — all seem to arrive at a maximum EUR limit, and degraded over years with more and more infills.
This leads many to speculate that the driving force or limit of EUR is the expansion of oil above bubble point. I tried to use empirical expansion formulas above bubble point here,
https://www.linkedin.com/pulse/copy-driving-forces-highly-productive-low-gas-oil-ratio-sheng-wu-fhutc
The PSM is out. But my favorite page, the 914 summary was not updated yet. [Edit: they don’t do it any more.]
1. Production up to 13.870 MM bopd. (Month before very slightly revised down.)
2. FGOM up significantly. Paging our GOM experts!
3. Looks like onshore L48 declined. (AK was up also.)
4. NM up as usual. TX down substantially. ND up slightly.
5. The rest of the cats and dogs varied.
https://www.eia.gov/dnav/pet/pet_crd_crpdn_adc_mbblpd_m.htm
Decline rates, post 1 of X
Summary (supporting details to follow): I looked at several year vintages, and across several years of life (for oil, for the Permian, using the JAN2024 Enno blog post, and Tableau interface):
1. It’s not a simple “no brainer” thing to look at and it stabs you in the eye and says the answer is 12.5%. There is a fair amount of variation between vintages and within vintages, from year to year. Even with hundreds (or thousands) of wells, there still is variation, at the yearly and averaged level! It is not some completely geometric object, there is some noise. This is part of why I want someone smarter than I to really look at it, in detail. It is not like looking outside the window and seeing if it is raining or not.
2. Big picture, I think somewhere between 10-12% makes sense. I would probably split the baby and go with 11%. You can try to make a case for 8% or 14%, but you really have to cherrypick to do either of those. There is NO support for 6% or 16%. I don’t think it’s a case of 14% was the real right answer and 12.5% was being “kind”. 12.5% is probably slightly on the high side. But not to an obscene amount. So…all this blather to discuss 11% versus 12.5%? Well…I said I would check it and report back. And that is what I’m seeing. I don’t have something massively different.
3. Also, even with ALL this info, we still really don’t know what the wells will do in year 20 or 25 or 30. For one thing we don’t have any data closer than about year 15. And then that is for some wells (2008) that are extremely small in number and likely very different than the wells being done now. We just need to be honest and say we don’t know for sure how those wells will behave in years 20-30.
4. The Arps hyperbolic to exponential idea is an appealing one. But it’s a model like any other one. We don’t know for sure that wells might not start getting slower (or even faster) decline rates a few years from now. Yes even after a few years of looking like they were all settled in on an exponential track. These are macroscopic systems with a lot of different processes going on (3 phase flow, artificial lift, economic decisions on maintenance and shutdown, different types of pathway, etc. etc.) Despite the urge to want to think of this as some simple, “box draining” flow problem, the actual time series does not have to oblige us by following a strict simple math model.
5. There are a lot of wells already below 15 bopd (formally stripper wells). Granted, much of this was at higher oilprices. But some of it was at low well prices (e.g. Covid year). Again, it’s not some Euclidean proof, but I think there are some inferences that wells will be operated as stripper wells, not shut down, when they move into the formal stripper well tax regime.
6. I didn’t do a formal well comparison versus the Bakken, but my general impression is on a “per well” basis, the Bakken is a better play. Bigger wells and slower decline. The Permian is just bigger in number of locations. (Bakken is also lower water than the Permian, but higher state taxes, not covered in this study, just my impression from previous reading.)
2 of X:
The 2008 Permian oil wells: There were only 219 wells in the sample. This was very early in the play.
Here is the extracted yearly cumulative production and calculated yearly decline information (apologies for formatting):
month CUM dCUM %decl bpd
month12 20,761 NA NA NA
month24 32,736 11,975 NA 32.79
month36 38,847 6,111 49% 16.73
month48 44,421 5,574 9% 15.26
month60 49,381 4,960 11% 13.58
month72 53,303 3,922 21% 10.74
month84 56,749 3,446 12% 9.43
month96 60,142 3,393 2% 9.29
month108 63,349 3,207 5% 8.78
month120 66,080 2,731 15% 7.48
month132 68,645 2,565 6% 7.02
month144 70,908 2,263 12% 6.20
month156 72,754 1,846 18% 5.05
month168 74,451 1,697 8% 4.65
month180 75,882 1,431 16% 3.92
Method: I used the cursor to extract cum data at 12, 24 etc. month points. Then calculated the change in cum (dcum, i.e. production for the year), the yearly decline (%decl) and then the implied average bopd, during the year. The period goes through JAN2023. (I ignored the very last data point, which would have been month 196 as it had very few wells left in the sample…I wanted the last data point that had the full well sample, before the start dropping out of the vintage.)
Note: The very first year (month 12) is sort of a partial year, since month 1 has wells coming in throughout the month. But when you look at declines from year 2 to 3 and later, this is irrelevant.
Observations:
1. It’s kind of all over the map. Look at the 9% percentage decline in year four and then the 21% in year six. I can’t help it…crazy numbers, but that’s what comes out.
2. Looking at the last column we can see how small these wells are later in life (and heck it was 2008, how bad they were early in life also). Big picture, by year four they were already tax regime stripper wells (below 15 bpd). And by year seven, they were under 10 bpd. The last year (year fifteen) the average well is below 4 bpd.
3. It sort of seems like year seven on is when the wells settle in (for this vintage and later ones), so I did some analysis looking at that.
decl avg amount comments
straight avg 10% years 7 to 15
cpd avg 11% years 7 to 15
A “simple average” of the last several years gives a 10% rate of decline. A proper (using compounding) average gives 11% over that time period. [The difference is just 10.4% versus 10.6%. However, I’ve left the percents in whole numbers as Excel defaults, since the variation is so much anyhow…I think a decimal is false precision.]
Since the numbers gyrate crazily (look at the 8% and 16% in last two years), it’s impossible to say if the first several years (of 7 to 15) were faster than the later ones. If anything it’s more like the last few years were worse. But…that’s the data (it’s just messy).
4. I was curious about the low bpd (much lower than 15) and so I checked well status to see if a lot of the wells were shutdown. Enno’s system (properly) keeps plugged wells in the average, but you end up averaging in some zeros then.
Here is the well status for the final data point (in this study):
JAN2023 status count percent
1 spud 0 0%
2 DUC 0 0%
3 first flow 0 0%
4 producing 157 72%
5 inactive 28 13%
6 plugged 34 16%
Total 219 100%
As you can see, just under three quarters of the wells are still operating (13% temp inactive, 16% permanently inactive). So the ~4 bpd for the last year is not an artifact of a bunch of zero wells being averaged in with 15+ bpd wells. Instead most of the vintage keeps operating deep into the stripper regime.
3 of x, Permian oil 2009: Only 139 wells! Very early in the play and a bad year for oil prices.
month CUM dCUM %decl bpd
month12 33,427 NA NA NA
month24 48,349 14,922 NA 40.85
month36 57,283 8,934 40% 24.46
month48 66,525 9,242 -3% 25.30
month60 74,001 7,476 19% 20.47
month72 79,044 5,043 33% 13.81
month84 83,821 4,777 5% 13.08
month96 88,112 4,291 10% 11.75
month108 92,066 3,954 8% 10.83
month120 95,524 3,458 13% 9.47
month132 99,063 3,539 -2% 9.69
month144 102,483 3,420 3% 9.36
month156 105,785 3,302 3% 9.04
month168 108,270 2,485 25% 6.80
1. More crazy year to year decline rates, look at year four, with -3% decline! It’s just not clean. Need meta analysis to see the whole picture, can’t grab isolated examples (yes, even with over 100 wells averaged within a vintage).
2. Wells hitting stripper bars at year six (under 15 bpd). At year ten, they are under 10 bpd.
3. The late in life decline rates gyrate a lot still–look at 3% penultimate year and then 25% (!) in the last sampled year.
Looking at year seven on:
decl avg amount comments
straight avg 8% years 7 to 14
cpd avg 8% years 7 to 14
Not pushing 8%…this is just how this screwed up vintage turned out. If you wanted to cherrypick, this would be the tree to latch onto though.
4. Well status:
JAN2023 status count percent
1 spud 0 0%
2 DUC 0 0%
3 first flow 0 0%
4 producing 85 61%
5 inactive 30 22%
6 plugged 24 17%
Total 139 100%
Only three fifths are producing (less than the 2008 sample). 22% are shutin and 17% are shutoff. I was curious about the crazy last year 25% decline and checked last year…5 wells were plugged in that year (a high amount, but still not explaining the big jump in decline rate, would be less than 5% of the damage at most).
4 of x: 2010 Permian oil. 332 wells. Still early in the play, but more wells than in 08 or 09.
month CUM dCUM %decl bpd
month12 41,245 NA NA NA
month24 62,290 21,045 NA 57.62
month36 75,986 13,696 35% 37.50
month48 84,882 8,896 35% 24.36
month60 93,150 8,268 7% 22.64
month72 100,156 7,006 15% 19.18
month84 106,944 6,788 3% 18.58
month96 112,269 5,325 22% 14.58
month108 117,394 5,125 4% 14.03
month120 121,406 4,012 22% 10.98
month132 125,405 3,999 0% 10.95
month144 129,018 3,613 10% 9.89
month156 132,459 3,441 5% 9.42
1. More crazy year to year decline rates. It still surprises me, given the averaging of hundreds of wells AND the implicit averaging through time, by using year to year changes, not monthly that we still see such massive scatter in the data. But it is what it is.
2. Wells holding off until year eight to hit the stripper pole (15bpd). By year twelve, they averaged just a tad under 10bpd.
3. Looking at year seven on, these were the average declines:
decl avg amount comments
straight avg 9% years 7 to 13
cpd avg 10% years 7 to 13
Not bad. 10% using the proper math formula, and whole period.
4. A little over three quarters of wells are producing. 12% shutin, 12% shutoff.
JAN2023 status count percent
1 spud 0 0%
2 DUC 0 0%
3 first flow 0 0%
4 producing 253 76%
5 inactive 39 12%
6 plugged 40 12%
Total 332 100%
5 of x, Permian oil 2011: There were 672 wells in the sample, starting to pick up speed, but still early days.
month CUM dCUM %decl bpd
month12 43,563 NA NA NA
month24 62,038 18,475 NA 50.58
month36 74,296 12,258 34% 33.56
month48 83,909 9,613 22% 26.32
month60 91,900 7,991 17% 21.88
month72 98,885 6,985 13% 19.12
month84 104,779 5,894 16% 16.14
month96 109,910 5,131 13% 14.05
month108 114,428 4,518 12% 12.37
month120 118,365 3,937 13% 10.78
month132 121,864 3,499 11% 9.58
month144 125,054 3,190 9% 8.73
1. For the first time, the data looks more clean (doesn’t have the wild gyrations). There are a few outliers like going from 13% to 16% decline from year six to seven. But in general, it mostly follows a more intuitive each year smaller decline “look”.
2. Wells hitting formal stripper status (under 15 bpd) in year eight. Under 10 bpd in year eleven.
3. Late in life decline averages:
decl avg amount comments
straight avg 12% years 7 to 12
cpd avg 12% years 7 to 12
I guess this is a good year, if you want to hang your hat on 12% for the final decline rate. I even checked the unrounded number and it is 12.2% (both averages). The last couple years were 11% and 9%…so you could argue that’s where the wells were heading…but the wells gyrate, so that is probably cherrypicking within a cherrypick!
4. Well status:
JAN2023 status count percent
1 spud 0 0%
2 DUC 0 0%
3 first flow 0 0%
4 producing 523 78%
5 inactive 90 13%
6 plugged 59 9%
Total 672 100%
Close to four fifths of the wells were operating (not shutin or shutoff).
6 of x, 2012 Permian oil. There were 1237 wells this vintage. Finally three figures! Note that we are starting to get closer in time. The analysis cuts off at year 11 of the well lives.
month CUM dCUM %decl bpd
month12 46,877 NA NA NA
month24 66,472 19,595 NA 53.65
month36 79,709 13,237 32% 36.24
month48 90,777 11,068 16% 30.30
month60 99,275 8,498 23% 23.27
month72 105,822 6,547 23% 17.92
month84 112,247 6,425 2% 17.59
month96 117,787 5,540 14% 15.17
month108 122,624 4,837 13% 13.24
month120 127,044 4,420 9% 12.10
month132 130,838 3,794 14% 10.39
1. Still some crazy gyrations. Look at year three to four to five (32% to 16% to 23%) or years six to eight (23% to 2% to 14%). Such is life, even with a massive 1000+ well sample, as well as the implicit time averaging in using yearly totals.
2. Wells waiting until year nine to hit stripper (<15bpd) status. As of end of analysis, year eleven, wells were still barely above the 10 bpd threshold.
3. Late life decline averages:
decl avg amount comments
straight avg 10% years 7 to 11
cpd avg 10% years 7 to 11
I guess this is a good tree (vintage) to pick if you want to tout 10%. Note the last year decline in sample was 14% (up from 9% year before), which shows the danger of the cherrypick within cherrypick comment I made in the 2011 well analysis.
4. Well status:
JAN2023 status count percent
1 spud 0 0%
2 DUC 0 0%
3 first flow 0 0%
4 producing 967 78%
5 inactive 201 16%
6 plugged 69 6%
Total 1237 100%
Again, a little over one fifth of wells are not producing (compare to 2011, expected a higher number). Note though, the very small amount, 6%, that are plugged (permanently retired).
7 of x, 2013 Permian oil. There were 1895 wells in sample.
month CUM dCUM %decl bpd
month12 59,954 NA NA NA
month24 78,044 18,090 NA 49.53
month36 93,527 15,483 14% 42.39
month48 105,459 11,932 23% 32.67
month60 115,022 9,563 20% 26.18
month72 123,035 8,013 16% 21.94
month84 129,941 6,906 14% 18.91
month96 135,745 5,804 16% 15.89
month108 140,972 5,227 10% 14.31
month120 145,655 4,683 10% 12.82
1. It’s not a perfect picture (monotonic decrease in the %decl), but not as crazy gyrating as some other vintages. Note though the strange 14% decline in year three.
2. Wells fall into stripper category in year nine. As of the last year (ten) in the vintage, they were still well above single digit land.
3. Late year decline
decl avg amount comments
straight avg 13% years 7 to 10
cpd avg 13% years 7 to 10
This is a good vintage for making the 13% argument (actually 12.5% or 12.6% if we expand the precision. But I already argued for rounding to nearest whole percent. Note the last two years are at 10%, but that can be a cherrypick.
4. Well status:
JAN2023 status count percent
1 spud 0 0%
2 DUC 0 0%
3 first flow 0 0%
4 producing 1621 86%
5 inactive 204 11%
6 plugged 70 4%
Total 1895 100%
Over 5/6th of the wells were producing. Less than 5% were permanently retired.
8 of x and final post for the oil group:
Permian oil, 2014. There were 2846 wells in the sample.
month CUM dCUM %decl bpd
month12 69,219 NA NA NA
month24 98,900 29,681 NA 81.26
month36 119,027 20,127 32% 55.10
month48 134,462 15,435 23% 42.26
month60 146,711 12,249 21% 33.54
month72 156,735 10,024 18% 27.44
month84 165,309 8,574 14% 23.47
month96 172,790 7,481 13% 20.48
month108 179,192 6,402 14% 17.53
1. Kind of a more well behaved vintage (close to monotonic decline in decline rate with time).
2. As of the last year in analysis (year nine), wells were still averaging higher than stripper (less than 15 bpd) category.
3. Late in life decline averages:
decl avg amount comments
straight avg 14% years 7 to 9
cpd avg 14% years 7 to 9
I guess this is a good vintage to pick if you want to argue for 14% terminal decline. Note, we are getting close to current day here, so there are only years 7 to 9 in the late in life analysis. Wells might moderate in second decade of life (but we don’t have the data, so…it is what it is…14%, for what we have.)
4. Well status:
JAN2023 status count percent
1 spud 0 0%
2 DUC 0 0%
3 first flow 0 0%
4 producing 2567 90%
5 inactive 222 8%
6 plugged 57 2%
Total 2846 100%
9/10ths of the wells were producing. 2% were permanently retired.
“Above is a model I did in December 2018”
Why not show the model from NOV2018? 😉
Or at least tell the funny story of how radically (2Xish) it suddenly got upsized in DEC. This would show a little humility and humor at your own crystal ball powers.
That was always a danger with the early USGS-based models, and you didn’t seem to highlight that danger enough at that time. (Despite being warned of it and despite a record of USGS upward revisions in other plays.)
Nony,
In November I has no USGS estimate for Delaware Basin, I guessed poorly on TRR for Delaware Basin TRR (about 2 times too low). Here is the Nov 2018 scenarios befor USGS assessment for Delaware Basin for Wolfcamp and Bonespring was published in early Dec 2018. Without information from experts my guesses are not very good. Note that EIA estimates were quite low for tight oil back in 2013 (AEO), predicting the future is difficult.
Note that this was not an upward revision, there wasn’t a previous assessment. Also note that tight oil plays there have not been upward revisions, when one realizes the assessments are for undiscovered resources, when adjusting for cumulative production and proved reserves the assessment for tight oil have been stable. I did highlight the fact that the Delaware TRR estimate was a guess, I based it on output of midland and delaware and assumed it would be proportional in the absence of information.
permian1811
Merry New Year all you young and old folks. Even t.he cranky ones
I looked at gas decline rates, manually. I will spare the detailed posts and give the 50,000 foot view:
1. Similar to the oil situation, it is not a no brainer what number to pick for a terminal decline % rate. Vintages differ from each other and within vintages, decline rate does not change mononically (yes even with the implicit averaging of hundreds to thousands of wells, and the time averaging, by using yearly cums).
2. Using my previous (year 7 on) assumption, I got (compound rates, and showing the decimal shown:
2008: 12.3%
2010: 9.7%
2012: 11.4%
2014: 13.9%
The last two vintages are early (and bigger flow rates through life). You might moderate later in life. Also, perhaps “flow rate X” is the trigger more than “year X” in the change to terminal decline. Who knows. But anyhow…those are the data (and analyses).
Net, net: I don’t think your 10% was unkind. IF anything, maybe that one was “kind”. Might even just use 11% for both oil and gas. Implicitly, I thought of oil declining faster than gas, but there is the artificial lift issue. Who knows. It’s a phenomenological situation, not a theoretical one.
Anyhow, not some massive repudiation…just reporting back what I saw.
Thanks Nony..
CNBC chitchat on oil prices:
https://www.youtube.com/watch?v=IGWWy4dtLFA (first couple minutes, then they switch to goldbug junk)
Takeaways:
*They keep predicting US oil to decline (based on price), but so far has outperformed. Still think it will turn. Just outran their forecasts a bit.
*Market is “oversupplied”. Not just shale, but BRA/GUY and return of OPEC bbls. Macro jitters only support the price temporarily.
*$58 is a good price for consumers but pinches US shale players (who have relatively high costs versus rest of the globe).
Nony,
Decline is indeed a very important parameter, nice stab at it. you’re right it’d be cool if someone smart did a very thorough analysis, including most recent data. Last 18-24 months everyone is puzzled as #rigs has gone down, productivity per foot is flat to down, yet total production has been going up. Occam razor leaves managed decline as to where there is probably significant improvement.
Thanks man. Bunch of work and not sure what it showed.
I would not be surprised if the US and the Permian have already peaked. We’re a couple months behind in data reporting. I think I predicted OCT or NOV as the peak. There’s a seasonality in US oil production…should get the ND winter drop soon.
And really last month, L48 was down. FGOA (and AK) are more megaproject and long delay time driven. So, they don’t turn as fast. And they carried the last month’s increase. NM is still going up, but it’s the sweetest spot in the Permian (and less developed). Interesting to see TX down a couple months in a row.
Also, of course, rigs are not linearly related to production. So, you can drop an excess and still hold flat. And there’s a delay for rig drops to lead to completion drops.
And then the return per linear foot commenting is interesting, but I would expect some high grading to happen with the rig count drops (maybe that is also a little delayed before it ripples through into completions). Every downturn in the past has shown high grading. That tends to partially mitigate rig dropping.
To me the story is really “surprised how well it is hanging in there”, not “US grows no matter what”. We’ve had price crashes in 2014, 2016 and 2020. And each time it led to a production decline. But less of a drop than the peak oil alarmists wanted.
The operators up their IP by pumping more in fracking, so IP keeps up and so does decline — delayed a couple of quarters, and when that is obvious coupled with lower prices, you will see “cliff off the peak”
When i see the higher IPs and higher declines, I figure half of the gain in IP goes to EUR. I don’t know the exact amount. It’s not 100 percent, because you are depleting pressure faster. But it is also not 0 percent. Since you did crack more rock. And expose resource that would be locked up forever.
I don’t know the exact balance, was a paper on it making similar points but behind pay wall. But failing a real study, I split the baby at 50 percent. So neither the hypers claiming 100 pe4cent are right, nor the peak oil dormers claiming no difference to EUR and acceleration only. Both of the above are wishcasting and showing bias, rather than analysis.
Rig Report for the Week Ending December 30
The rig count drop that started in early April 2025 when 450 rigs were operating rose this week. Drilling continues at unabated rates with WTI below $60/b.
– US Hz oil rigs rose by 1 to 367, down 83 since April 2025 when it was 450. It was also up by 5 from the low of 362 first reached in the week ending August 1. The rig count is down 19% since April. Of the 1 increase, 3 were added in Wyoming.
– New Mexico Permian dropped by 2 to 92. Lea dropped 1 to 60 while Eddy dropped 1 to 32.
– Texas was unchanged at 169. Texas Permian was unchanged at 134. Midland was unchanged at 24 and Martin was unchanged at 26. Loving added 1 to 15 while Karnes dropped 1 to 7.
– Eagle Ford was unchanged at 28.
– NG Hz rigs dropped by 2 to 109.
A Rig
Frac Spread Report for the Week Ending January 2
The frac spread count dropped by 1 to 153, a new low. From one year ago, it is down by 48 spreads and down by 62 since March 28. December/January is the beginning of the yearly spread count drop associated with Xmas holidays.
A Frac
Too bad that Nick G may have just been born yesterday. Roosevelt started sending arms to England long before a congressional law. Then, when WWII started, he put US Citizens of Japaneese origin, into concentration camps – without congress. The dust in Euorope had not even settled from WWII, Truman started a war in Korea without Congress. Johnson faked a mythical “attack” on a US battleship, by essentially a Vietnamese rowboat, to start the Vietnam War [without Congress]. Reagan took military action in Grenada, South America, the Falklands, all without Congress. Bush I, in effect, declared war against Iraq without Congress. Bush II did the same. Clinton bombed countries in Europe and Africa, without Congress. Obama dropped bombs on dozens of countries, sometimes just to eliminate specific individuals – all without Congress. Some of you guys were either born yesterday, or otherwise have never lived in the US and therefore know nothing about it’s history. Trump, like it or not, is pretty much mainstream America. Or, maybe you just want the US to be different in the next 250 years than it has been for the first 250 years. It is a good thing that we are all free to leave and follow the Rosie O’donnel path.
Maduro captured
Spectacular success of U.S. military under Trump leadership.
A brutal murderer to stand trial for killing so many people.
Thank God that Obama is not president. He just went around assasinating people we disagreed with – like Osama Bin Laden.
Love to kidnap heads of state under false pretences. Excellent upholding of international law.
Non-oil comment.
Deaths from suspended USAID contributions are expected to be in the 100,000’s.
AI Google response:
Estimated Deaths Already Occurred
Researchers tracking the immediate impact of the funding cuts that began in early 2025 have provided the following estimates:
As of November 2025, a model from Boston University epidemiologist Brooke Nichols estimated the dismantling of USAID had already caused the deaths of approximately 600,000 people, two-thirds of them children.
Other estimates based on current spending declines (as of December 2025) suggest lives lost may be in the range of 500,000 to 1,000,000 annually.
Kleiber,
Let’s include the violation of the US constitution which requires Congress to authorize wars.
Leeg,
You’re right: you’d expect a peace president to want to promote economic development (which prevents wars) and to promote the US image (which gives the US leverage to influence events). Not to mention simply saving lives, which ought to be make everyone happy.
Back when Kennedy went to the UN about Cuba, he benefited from a general trust in the US. The Iraq war put a big dent in that. But now, that trust is completely gone…
Iver, et al (and especially Dennis)
This Maduro/Venezuela situation might warrant a stand alone post as the oil/energy aspects look to be VERY profound … to say nothing about the geopolitical aspects going forward.
Not gonna engage in (pointless) political posturing here, nor unfounded speculation …
BUT, the early indicators implying MUCH more to the story than currently presented to the public are looking to be spot on.
Specifically, insider involvement may well have played a huge role in this (ongoing) op.
Big reason would be to effectively neutralize/bypass powerful officials such as Diosdado who is said to have had literal life or death power over Maduro.
Story is continuing to unfold.
Many years ago on this site I said to look out for the Monroe Doctrine
( the USA owns the resources of the South America and just letting other countries borrow them ).
Trump just called it the “Donroe Doctrine”
Maildog wrote: Thank God that Obama is not president. He just went around assasinating people we disagreed with – like Osama Bin Laden.
I have read a lot of dumb comments on this list since I started this blog almost 13 years ago, but Maildog’s comment tops them all. Obama did not assassinate Osama Bin Laden because he/we simply disagreed with him. He took him out because he murdered 3,000 American citizens on September 11, 2001. I will end this comment here because I must now go outside and scream at such utter stupidity!
What happens when Donny Deals finds out that oil is mostly dogshit?
I also have an inkling that they expected kidnapping Maduro would make the whole country fall over, like Assad leaving Syria or what happened with Noriega. Except the US did groundwork to take the nation before that move. These dipshits just thought you win this thing like a video game: kill the boss and the game ends.
The Wall St. guys lining up to cash in on this probably expected a plan. Without owning the nation wholesale, good luck getting that oil. The people ruling the nation are still there, as are the military and militia.
I don’t support Trump.
But honestly, from the videos I have seen the Venezuelans look very happy about this. Obviously, not the ones that were killed.
@kleiber
Venezuela has a significant amount of conventional reserves as well.
It will be interesting to see what the US oil patch can do to it, maybe with the help of the Canadians for the Orinoco tar sands.
Anyway, I hope they share the profits with the citizens.
Andre,
Good for you to view news sources NOT tied intrinsically to Legacy media ‘narratives’.
Fact du jour ..
Roughly 25% of Venezuelan population has fled the country in the last dozen years. Largest emigration crisis in modern times as per ol’ chatbot’s description.
Betcha won’t see that broadcasted loudly on MSM.
trump always charges outright.
The refineries in Gulf of America have been ripped off by Venezuela embargo to US and redirection China. Now, Trump will redirect it back.
Venezuela heavy oil shipment to China account to 21~37% of diesel processed in China.
The thugs who were part of the Maduro government now know that they are finished.
Venezuelans all over the world who fled arrest after they protested are celebrating.
It will take time to restore a country, now free elections can happen all things are possible.
I see from the pathetic comments how the woke left wing hate real freedom.
It’s important to keep in mind that Trump hasn’t actually accomplished anything. The United States does not control Venezuela in any way. Trump’s blather about running the country is meaningless. No doubt his plan to do that will be released shortly after his healthcare plan. Anyway, an interim president has already been appointed.
In a monarchy, kidnapping the head of state is a big deal. A good example is the vast ransom paid for Richard Lionheart. But modern society has moved on from the Middle Ages. Anyone who thinks this kidnapping means the United States now owns Venezuela is 500 years behind the times.
All Trump has accomplished is to make the US an international pariah. I thought declaring a trade war against the world and abandoning our allies was going to be his best attempt to destroy the country, but he’s upped his game.
Not oil related comment
Iver, the thugs in the Maduro gov’t are still there. The VP was part of the Maduro gov’t. No regime change has occured. This very expensive performative kidnapping didn’t change the drug trade, Venezuela is not a significant route for US bound drugs.
Remember the tv ad for gasoline that said “It’ll put a tiger in your tank!” It wasn’t really a tiger was it? This performance really wasn’t about TheWarOnDrugs. It wasn’t about liberating Venezuela. It was showing that don Don can do what he wants in His backyard. It’s his. Not yours. That’s the story.
I think it’s possible that the VP and the defense minister turned on Maduro (the dancer). If you look at the indictment, they are noteworthy of the whole entourage for not being named as accomplices. We also had very little resistance moving in country. And we have used bribery, factions in the past. (Is part of our toolkit.) Not saying it happened…just might have.
I don’t believe in the Maduro arranged it conspiracy theory. That makes no sense, given he is incarcerated, not in exile in third country (and living off his wealth). Also, based on Rubio’s remarks (he was basically offered that and turned it down.)
It’s also possible we did one of these “look good first day, but turns into quagmire” strikes. Like Iraq, Afghanistan. I hope not.
I think it was a really bad idea (like the Iran strikes) and had some (very cringeworthy) political theater to it. I do have the hope (best case) that it sort of blows over like Iran did. I have little hope that Vz (or Iran) changes into model actors. Just don’t want things to get worse.
Observations from various people with expertise on Venez here, worth considering-
https://www.politico.com/news/magazine/2026/01/04/us-venezuela-maduro-predictions-analysis-00710030
One concern I have-
This action gives China a massive green light to take Taiwan, which would result in an immediate and severe crash in western country equities (tech based valuations/prospects to be knee-capped).
China has almost 70$B invested in Venezuela. US would be wise to state out loud that all of those contracts/assets would be honored in full.
The same concern applies to Ukraine – the US now looks ridiculous objecting to a Russian invasion. Sadly, this president has always supported Russia more than Ukraine.
So, this made-for-TV adventure has done enormous harm to US foreign policy interests.
re. Venezuela’s oil resources. In a perfect world with minimal internal strife how much money and time would it take to develop the Venezuelan economy and oil industry infrastructure for a reasonable rate of oil extraction for long term security and minimal environmental consequences?
Or is the question unrealistic given the perogatives of power?
We’ve seen the miracle of fracked oil production. The investment and pre-existing infrastructure. What kind of miracle can be done to put Venezuela’s carbon into the atmosphere?
ok I found an article quoting Rystaad(?) that said $185 billion and 17 yrs.
LeeG
I don’t know about that Rystad article, but it is definitely time consuming to bring output significantly up. Two ways to attack it. 1. Bringing heavy oil out from the jungle inland; which can be done 2. Bringing in new technology to get more out of established assets. Both angles will bring results.
How much money will invested into this – I don’t know. But it is pretty much a guaranteed output increase over time. 17 years is a stretch and it is possible to do more – much more, more quickly in my humble opinion.
I guess the eagerness from oil and service companies to invest will give a hint of how big the opportunity is.
I don’t know about the capex (high or low), but you could build a massive system from scratch in 17 years. I call BS on that one. Show me a high level project plan that explains the 17 years.
Heck, the Panama Canal was carved out of the jungle in ~10 years, including the Miraflores Locks and the Gaillard Cut. And that was with literally 100 year old technology. And fighting malaria and exterminating mosquitos like crazy.
Again, burden of proof on the “17 years”. No way that is an engineering based timeline. That’s probably based on skepticism about security/corruption (which is quite warranted). But then just say that the project won’t work for those reasons. But don’t try to act like some mouse in the pocket engineering secret that gets you to 17 years.
Perhaps the comparison will be against the tar sands of Athabasca, extracted by strip mining at the surface extending over huge areas. In Orinoco, the tar sands average about a kilometer below the surface. The mind boggles in imaging trying to do this at the same scale — will they resort to an equivalent of blowing up mountain-tops like coal companies do in West Virginia? That’s considered technology too.
As reported elsewhere on the blog comments, Exxon is out (a la Shark Tank) , and Trump had some disparaging remarks toward them.
Exxon is out because of expropriation risk. They even said that.
OK…maybe the stuff is deeper (taking your info on that), but in other ways that area is actually geologically/technically easier to process. Less upgrading needed. S. Wu has discussed this.
Or, even just consider that the area did 3+ MM bopd in the late 90s (a very low price time). That’s a powerful counterfactual.
Note: I am in no way, endorsing the silly, ignorant, Trump remarks about turning things around. I just think the issues are WAY more societal/political than they are technical/physical.
Follow-up on my previous remark about Trump and Venezuela:
Trump has started threatening the people replacing his kidnap victims, proving my point: Ha has accomplished nothing. Get ready for a decades long shit show.
https://www.theatlantic.com/national-security/2026/01/trump-venezuela-maduro-delcy-rodriguez/685497/
https://bsky.app/profile/atrupar.com/post/3mbmifb5obk22
I’d also like to point out that even if he wins this fight the American Federal government doesn’t have the resources to run a conquered foreign country. The Iraq fiasco is a great demonstration of this. America has the military to swallow other countries, but lacks any institutional concept of nation building or colonization or whatever.
That core weakness of American aggression means that American oil companies won’t have much luck drilling Venezuelan oil. Failed states are not conducive to large scale investment. Iraqi oil production peaked in 2000, though it may get back this year, a quarter of a century later.
It’s an interesting contrast to the EU, which digests countries (aka harmonization) and then eats them. The US eats countries and then spits them back out when it can’t digest them.
An updated US October production report has been posted.
https://peakoilbarrel.com/record-us-october-oil-production/
Just a test post to see if I am still registered on this site . . . have been some years away.
Is OFM still around?