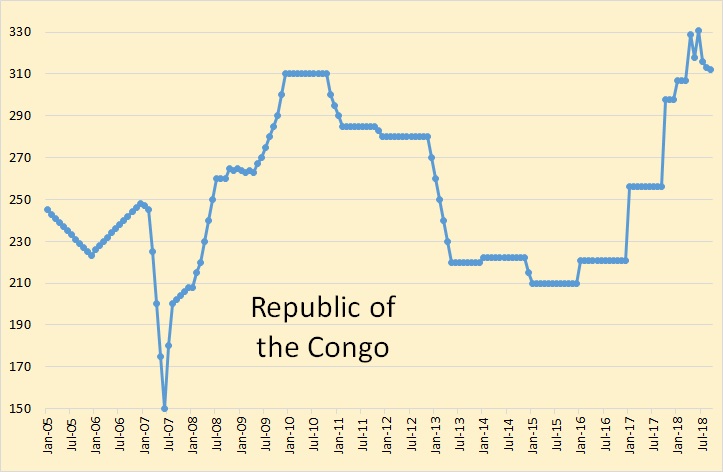
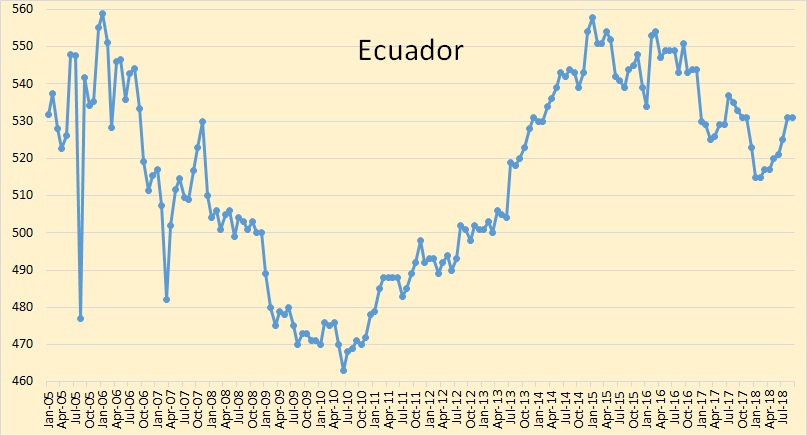
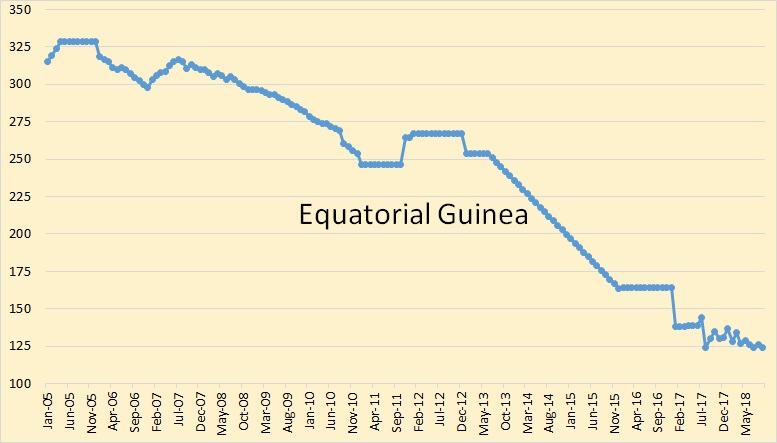
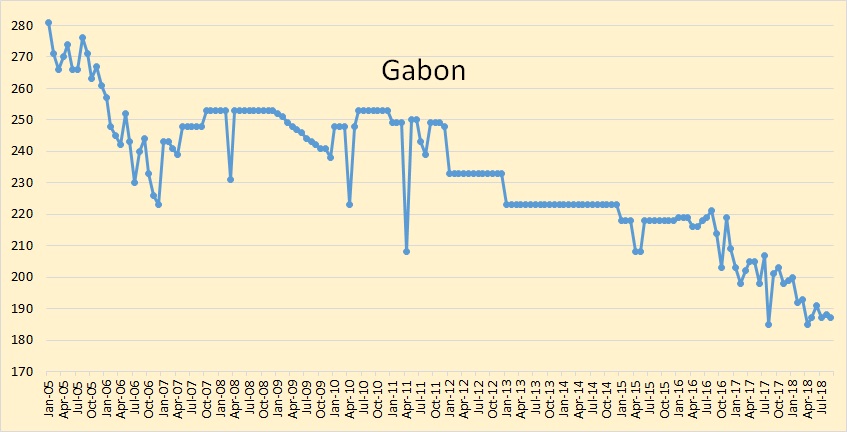
The below charts were created with data from the OPEC Monthly Oil Market Report and the data through September 2018.
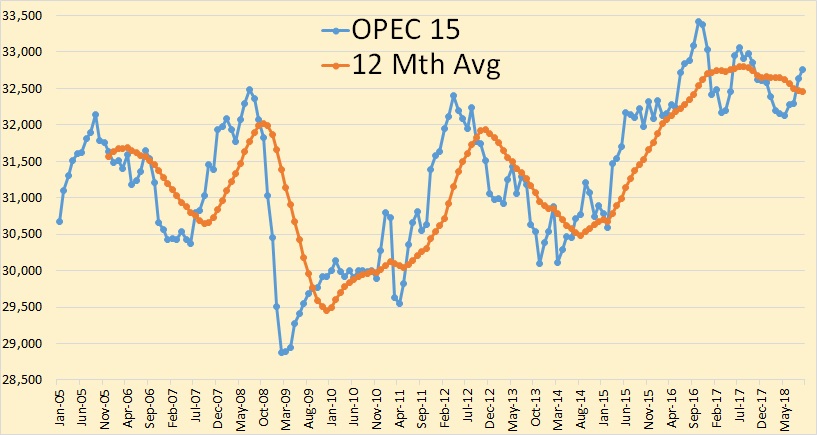
OPEC crude only was up 132,000 barrels per day in September to 32,761,000 bpd. that is still 650,000 barrels per day below their all time high in October of 2016.
August production was revised up by 63,000 bpd so production was actually up 195,000 bpd from what was reported last month.
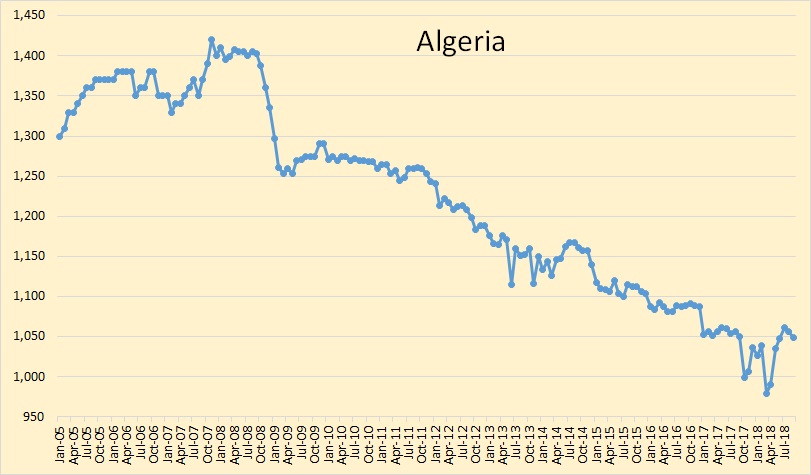
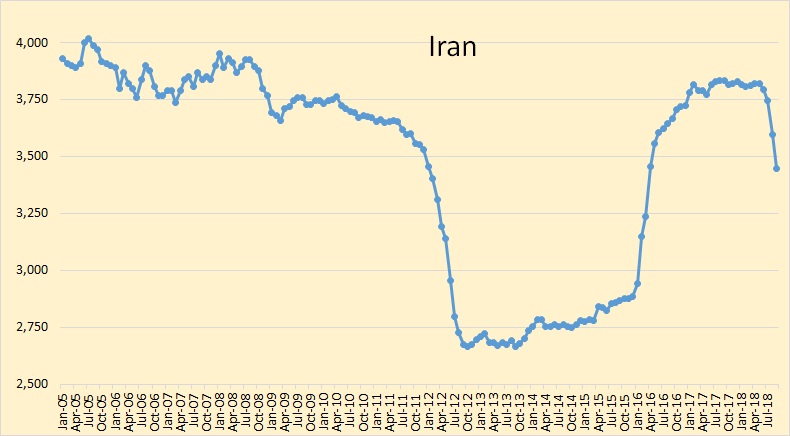
Iranian production was down 150,000 barrels per day in September. Sanctions are beginning to have an effect.
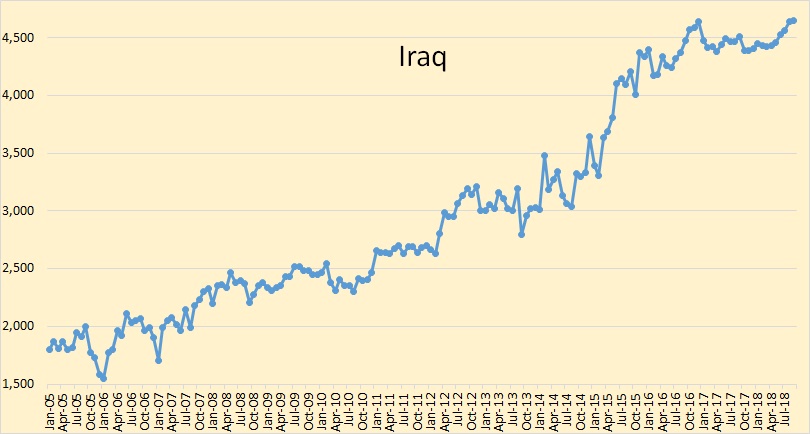
Iraqi production was up only slightly in September but they seem to be holding at their new all time high.
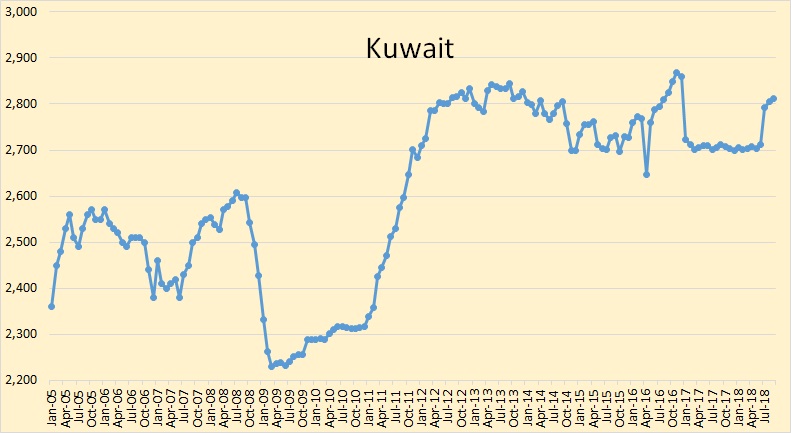
Kuwait was also up slightly in September. I think they will be holding at this level for awhile.
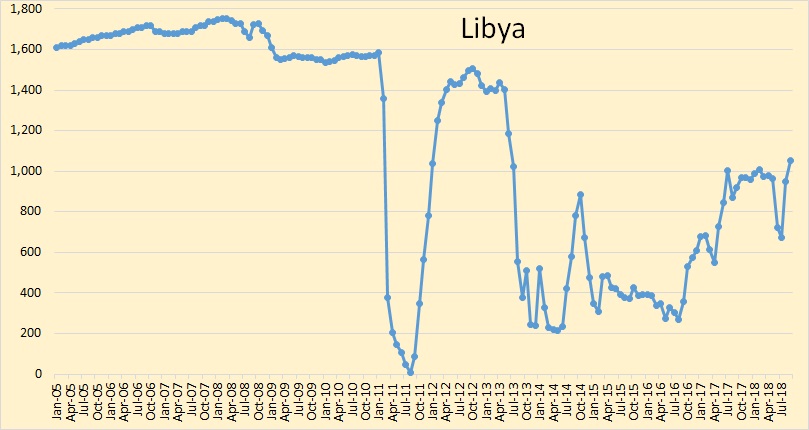
Libya was up 103,000 barrels per day in September.
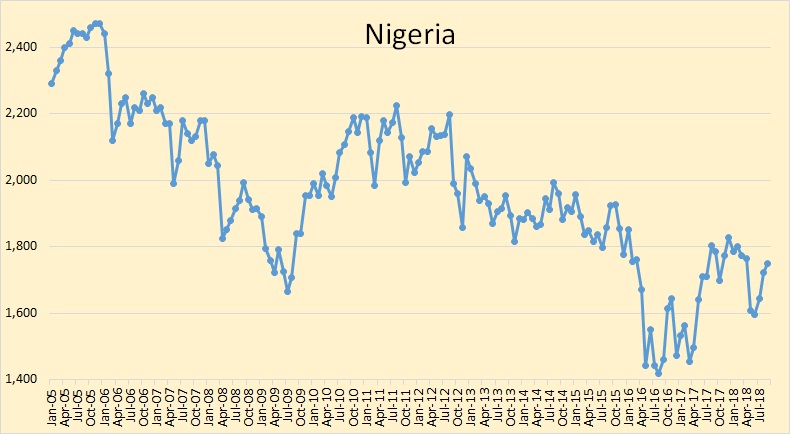
Nigeria was up 26,000 barrels per day in September.
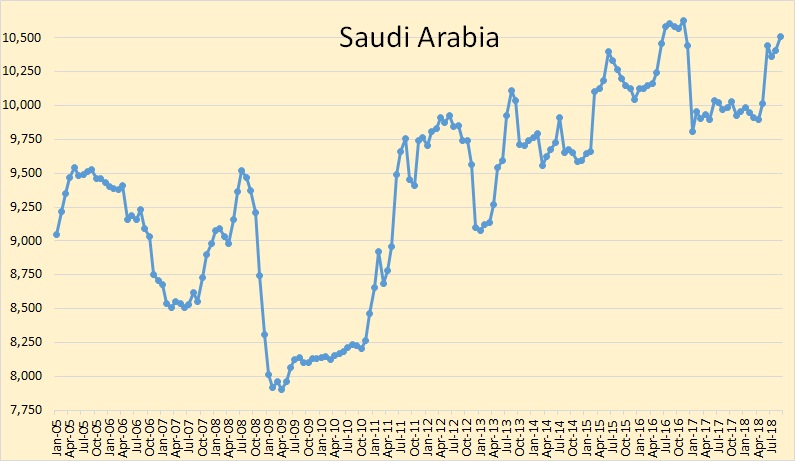
Saudi Arabia was up 108,000 barrels per day in September. They are now only 114,000 bpd below their high in December 2016.
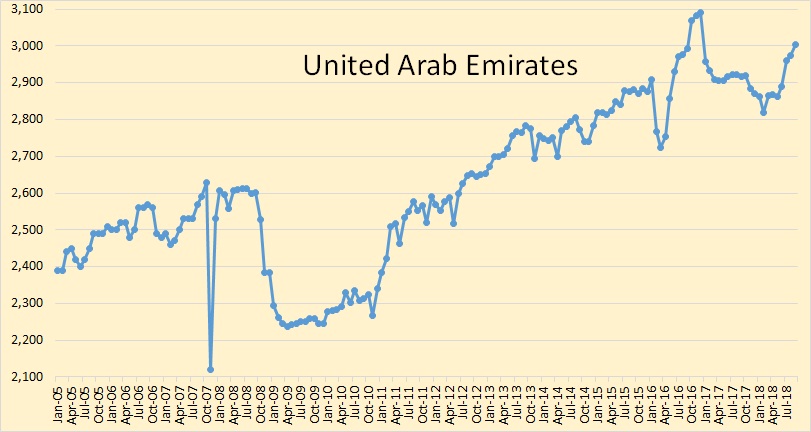
The UAE was up 30,000 bpd in September. They are 86,000 barrels per day below their high in December 2006.
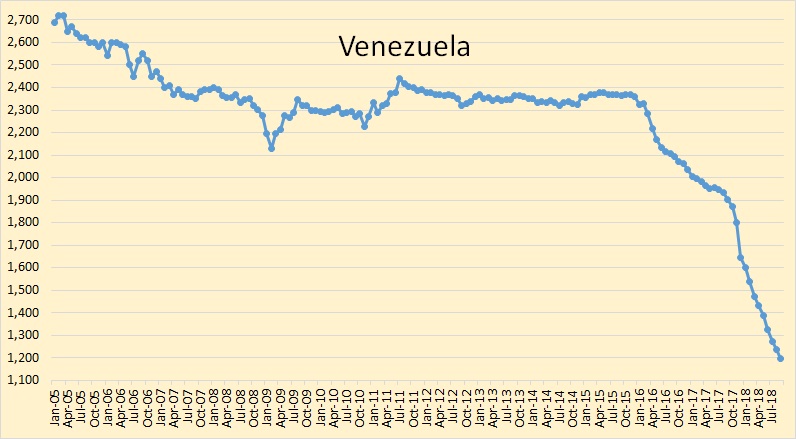
And Venezuela continues to plunge toward total collapse.
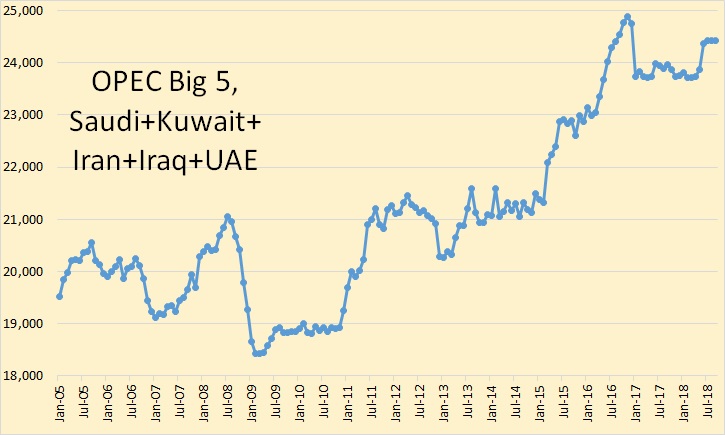
OPEC big 5 was flat in September. Declines from Iran was offset by gains from the other four.
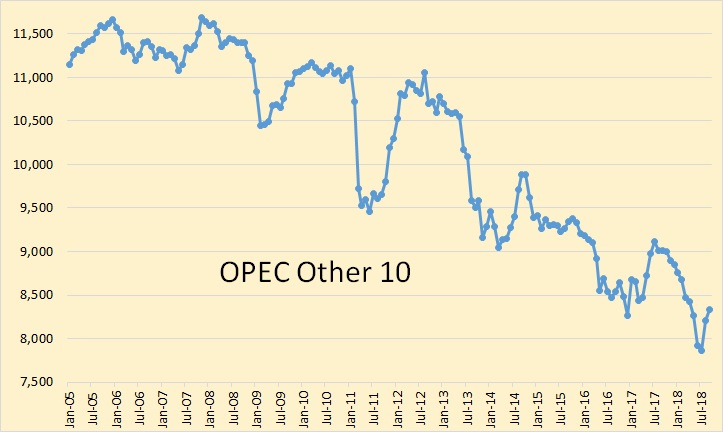
The other 10 OPEC producers were up 130,000 barrels per day in September in addition to the 345,000 bpd it was up in August. The lions share of this increase came from Libya and Nigeria.
If OPEC’s data is correct then the world reached a new all-time high is total liquids production in September.
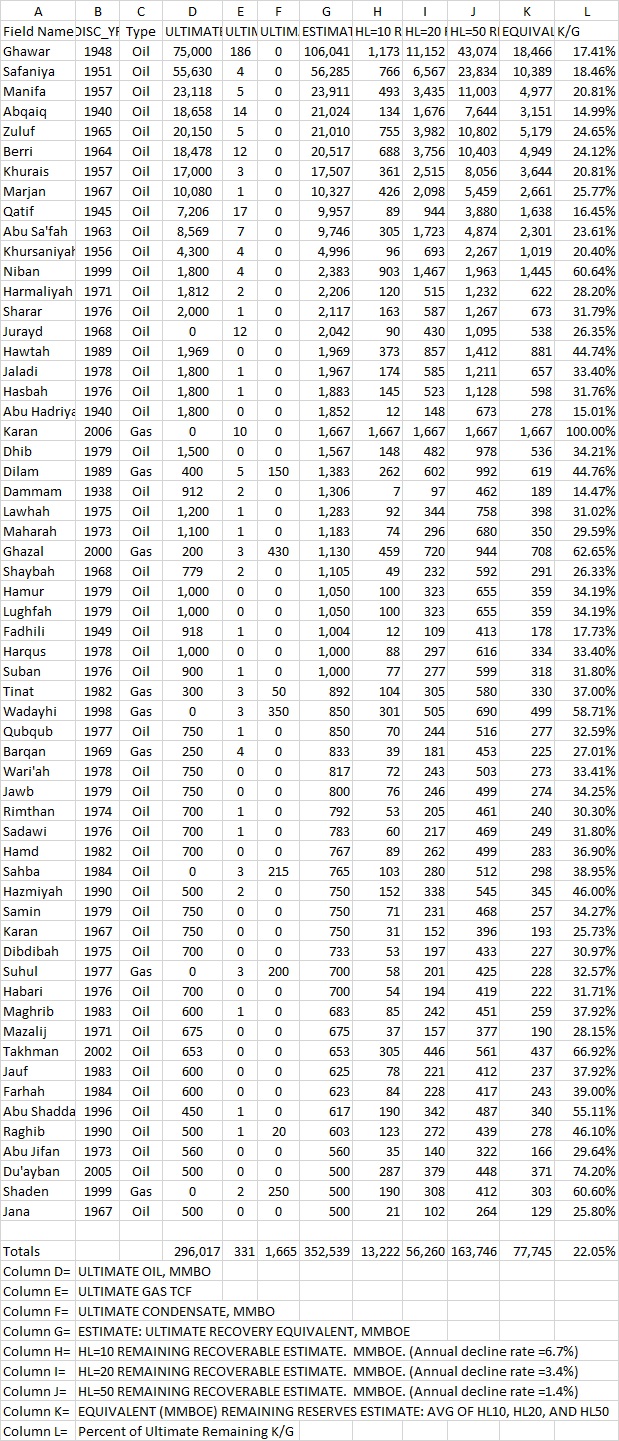
I have received data for all the world’s largest fields, created in 2013 by Mike Horn who is now deceased. He used the data of many of the great geologists who worked in the middle east. His sources are listed below:
Al Shdidi, Saad, Gerard Thomas, and Jean Delfaud, 1995, Sedimentology, diagenesis, and oil habitat of Lower Cretaceous Qamchuqa Group, Northern Iraq: AAPG Bulletin, v. 79, p. 763-778.
Beydoun. Z. R., 1991, SG 33: Arabian Plate Hydrocarbon Geology and Potential–A Plate Tectonic Approach: AAPG Studies in Geology #33, 77p.
Carmalt, S.W., and Bill St. John, 1986, Giant oil and gas fields, in Future Petroleum Provinces of the World: AAPG Memoir 40, p.. 11-53, Table 1. Dunnington, H.V., 1958, Generation, migration, accumulation, and dissipation of oil in Northern Iraq, in Habitat of Oil: AAPG, p. 1194-1251.
El Zarka, Mohamed Hossny, Ain Zalah Field–Iraq Zagros folded zone, Northern Iraq, in Structural Traps VIII, AAPG Treatise of Petroleum Geology Atlas of Oil and Gas Fields, v. VIII, p. 57-68.
Halbouty, Michel T., A.A. Meyerhoff, Robert E. King, Robert H. Dott, Sr, H. Douglas Klemme, and Theodore Shabad, 1970, World’s giant oil and gas fields, geologic factors affecting their formation, and basin classification: Part I: Giant oil and gas fields, in Geology of Giant Petroleum Fields: AAPG Memoir 14, p. 502-528, Table 1.
Horn, M.K., 2003, Giant fields, 1868-2003 (databases), in Giant Oil and Gas Field of the Decade 1990-1999, AAPG Memoir (in press).
Ibrahim, M.W., 1983, Petroleum geology of Southern Iraq: AAPG Bulletin, v. 67, p. 97-130.
Konert, G., A.M. Afifi, S.A. Al-Hajri, K. de Groot, A.A. Al Naim, and H.J.Droste, Paleozoic stratigraphy and hydrocarbon habitat of the Arabian Plate, in Petroleum Provinces of the Twenty First Century: AAPG Memoir 74, p. 483-515.
Majid, A. Hamid, and Jan Veizer, 1986, Deposition and chemical diagenesis of Tertiary carbonates, Kirkuk oil field, Iraq: AAPG Bulletin, v. 70, p. 898-913.
St. John, Bill, A.W. Bally, H.Douglas Klemme, 1984, Sedimentary provinces of the world÷hydrocarbon productive and nonproductive: AAPG. map and booklet (35 p.).
Versfelt, Porter, L., Jr., 2001, Major hydrocarbon potential in Iran, in Petroleum Provinces of the Twenty First Century: AAPG Memoir 74, p. 417-427.
There are 1,048 fields listed in this index. They are sorted by country. I list below the Saudi fields and then the fifty largest fields. I will post other data in later posts.
All Saudi Arabia fields:
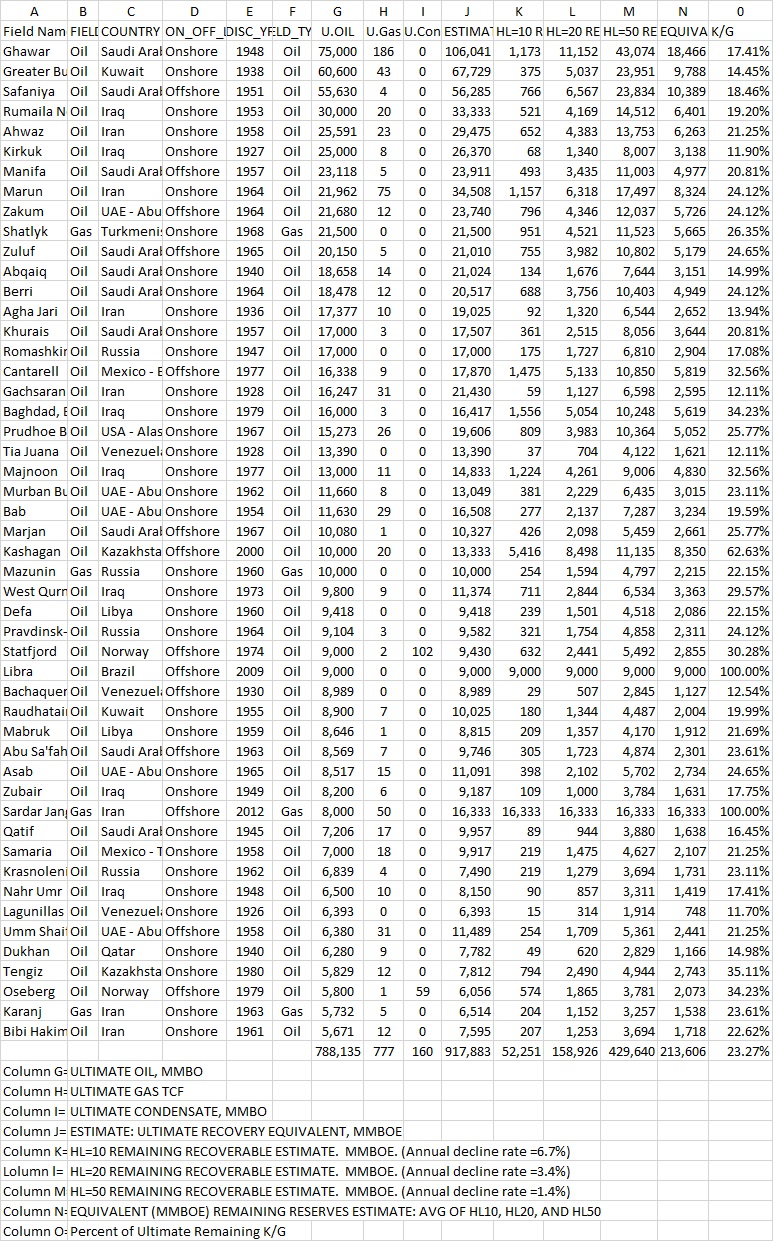
The Fifty largest fields in the world.
108 responses to “OPEC September Production Data”
Ron, Thanks again for the graphs, they are very revealing.
Thank you for sharing the Mike Horn info. Just a cursory look at how many of the worlds largest fields have a fifth or so of reserves left is shocking.
Hi Ron,
Please to excuse my unfamiliarity with the terminology. What do HL = 10, HL =20 and HL = 50 mean?
The remaining reserve numbers are stunning.
Tom
I really don’t know what the HL stands for but I suppose it is Hubbert Linearization. However, the legend tells us enough:
HL=10 REMAINING RECOVERABLE ESTIMATE. MMBOE. (Annual decline rate =6.7%)
HL=20 REMAINING RECOVERABLE ESTIMATE. MMBOE. (Annual decline rate =3.4%)
HL=50 REMAINING RECOVERABLE ESTIMATE. MMBOE. (Annual decline rate =1.4%)
Now I am not at all sure that we can use the annual decline rate to estimate remaining reserves. I really don’t think the decline rate is fixed. That is, the decline rate does not stay the same as the field enters the decline stage. It once did, or nearly so, back before they began creaming the giant fields with horizontal wells along the crest of the reservoir.
When that happened the decline rate went down. Saudi said their decline rate went from about 8% to just over 2% in or around 2006. Now that decline rate is increasing as the water to oil ratio near the top of their reservoirs is increasing.
But I just posted the data as I received it.
Are these data from the year 2013?
I think HL means half life
Of course it does. Why didn’t I think of that?
Hi Ron,
Years ago I found the satellite graphic of Ghawar with a steady march of wells closing in from all sides of the crest of the anticline very ominous. The outer wells were then used for water injection, as I recall. With these techniques – reducing the decline rate – this will eventually yield a water cut point of the horizontal wells at the crest that will result in a rapid crash of production. In other words, reducing the decline temporarily brings a rapid drop in production later. Is that your view? And, if Ghawar goes, as Matt Simmons once said, so goes Saudi’s spare capacity?
Yes, that is my view except that I don’t think old oil wells are used for water injection. Injection wells are a different animal, drilled only at the perimeter of the field and much deeper.
North and central Ghawar are nearing the end of their life. South Ghawar still has s ways to go.
Depending on the carbonate’s fabric, they can change from a peripheral to a five spot on reduced spacing, and get a few percent extra recovery. I haven’t seen detailed lithology descriptions and cross sections that show how contnuous are those Arab rocks, but we found a long time ago that a five spot and CO2 work well.
What happened to Samotlor?
Samotlor is listed as the 83 largest field in the world with UUR of 6,619 MMBOE and approximately 22.62 percent of that remaining… give or take.
Samotlor Oil Russia Onshore 1961 5,648 5 102 6,619 180 1,092 3,220 1,497 22.62%
Ron,
Interesting, the Rand study from 1978 by Nehring has Samotlor at 13 Gb and discovered in 1966 and number 11 in the World as of Dec 31, 1975.
Search on Giant Oil fields Nehring
see page 14 table 2.1
I would put Samotlor higher in the pecking order.
Hi Ron,
What is the oil ultimate total for all 1048 fields?
Ultimate Oil………………. 1,528,518,000,000 barrels
Ultimate Gas……………… 7,829,000,000,000,000 cubic feet
Ultimate Condensate…. 95,173,000,000 barrels
Ultimate Recoverable .. 2,813,550,000,000 BOE
Estimated Remaining.. 956,194,000,000 BOE
Percent BOE Remaining..34%
Thanks Ron,
So a original reserves of about 1600 Gb for C+C, for those 1048 fields. If we assume those fields constitute 80% of total, that would give original 2P reserves of about 2000 Gb.
In 2000 the percentage was up to 56.8%
http://www.searchanddiscovery.com/documents/2007/07032horn/images/horn.pdf
Have you checked against this table in this post:
http://peakoilbarrel.com/jodi-iraqi-reserves-and-ghawar/
We are at the point, now, where OPEC production is severely misrepresenting OPEC exports. A lot more than 150k drop in Iran production is not being exported, and in inventory and floating inventory. The exports in April were 2.5 million, and reportedly for Sept. they were 1.1 million, or a 1.4 million drop. Yeah, SA helped keep up production, but doubt it kept up with export drops.
Guym,
I have read that Iran has turned of the GPS trackers on many of their ships so we don’t have as good a handle on exports from Iran.
Yeah, I got that. But it’s pretty safe to say OPEC exports are down. World usable supply is down, not up.
Guym,
I cannot seem to find specific data on exports, but OPEC supply is not meeting demand as chart from the OPEC Oil Market report shows. Chart from page 83 of this month’s report.
https://www.opec.org/opec_web/en/publications/338.htm
Yes, and that is based on production, and not exports. Thanks.
As of the month of September Saudi was down 200k in exports compared to August (according to some tanker tracker information). True production estimated by some at 10.2-10.3 mb/d for the month. But from June-Sept there was a clear inventory draw. In Sept there was maybe a small build in inventory, and it could be a likely trend up in exports in October with a corresponding inventory draw based on the latest political signals. It seems like that exports can go up a bit due to the political signals we are seeing, but more than 200 kbpd a month from inventory seems like a stretch. So most likely the assumed extremely low KSA spare capacity from my point of view will got a point to prove pretty soon. And the salvation is the low demand season where production will go down to 10 mbpd anyway due to maintenace of the fields, but domestic demand is low. And therefore exports stay more or less the same. For OPEC exports the overall picture is very flat last 2-3 months with June as the pimped up month. Courius to see how the start of Oct will be; I guess OPEC will overall increase exports for another 1/2 a month.
When it comes to Iran my money is on (if odds were offered) that they don’t decrease production that much like tanker trackers are saying. Annual rate 10% down maybe, and oil exports still find their home one way or another. Much like OPEC cut agreements, in a lot of cases they just wait until natural decline does the work.
But still we should be at a global supply deficit that is difficult to hide…well they are trying as hard as they can. I don’t know what to say about the EIA weekly other that I am courious about what they turn up with after early November (Trump mid term and Iran sanctions due date).
The IEA makes a decent case of why we will see a build next year. They are using EIA’s estimates of current and future, and they point to the build in inventory the second half. Their inventory count does not include floating inventory, which was depleted at about the same time OECD linventories increased. To say EIA’s current and future estimate of US production is over optimistic is an understatement. I don’t see the vast majority being in anything but denial until the second half of 2019.
Interesting report on Giant Oil fields by Nehring from 1978.
https://www.rand.org/content/dam/rand/pubs/reports/2006/R2284.pdf
His estimate was 1700 to 2300 Gb of conventional oil URR, based on discoveries through Dec 31, 1975.
Laherrere’s recent estimate (August 2018) is 2600 Gb to 3000 Gb for World oil (excluding extra heavy oil) URR. Laherrere’s most recent estimate seems quite reasonable to me. My best guess is 2700+/-300 Gb for conventional oil (which I define as C+C minus extra heavy and tight oil).
West Canada Select current price (Oct 10th) $18.17 on oilprice.com!.
Western Canada Select: Bloomberg price charts on Twitter if anyone is interested.
WCS: https://pbs.twimg.com/media/DpPs-05XcAQbtyT.jpg
WCS discount to WTI: https://pbs.twimg.com/media/DpPC26VVAAEH2-m.jpg
Yeah, how come it plunged this much? It it just stock builds after refinery explosion, pipeline constraints or other?
This must surely be under production costs right?
If someone could give me the basics on how this oil is extracted i would be grateful, is it more like mining or like tight oil same process as we se in permian, bakken etc? Have been looking at some company presentations where it was claimed running cost after production was established would be low, if that is true i assume it works different than tight oil with huge declines and perhaps more like mining?
I work up here.
There’s several different extraction processes. Open pit mining and SAGD are the 2 major sources. But there’s a lot of different pilot projects testing new methods.
Few key things to note –
1. WCS oil is basically just the extracted bitumen. It’s very low quality. However, all the big players up here have upgraders on site. So they are turning WCS into higher quality oils before shipping.
2. Operating costs are low. CNRL and Suncor are close, if not already, producing at less than $20.
3. There is essentially no decline rates on oil produced here. If they are producing 100k barrels today, they will be producing the same (or more) next year without additional CAPEX. This is the complete opposite of shale.
Hi Doodles,
Thanks for your reply.
Could you explain the process a bit more both for open pit and SAGD.
I guess open pit is more like mining, you have your investment in equipment and process facilities and now you just bring more material by mining truck from the pit i guess? How does SAGD work?
3. Interesting, can you explain why that is the case, in open pit i guess its perhaps the capacity of your process plants volume/time and then its just about bringing enough material by truck as long as you have material so decline is not existing until you spent all material? How does it work in SAGD?
I was under the impression that this oil was very expensive to mine and required high oil prices, but perhaps that was some years ago? Seems if this is the case no decline compared to shale this stuff seems way more predictable and perhaps sustainable/profitable?
Thanks again for your time.
SAGD involves drilling two horizontal wells near the bottom of the oil sand. The producer is drilled a few meters underneath the steam injector.
The process usually starts by heating the reservoir running steam between the two wells. The steam starts rising towards the top of the reservoir, which sets up a zone saturated with steam. The oil in this steam zone drips down together with hot water (condensed steam).
The idea is to keep the layer where the producer is located saturated with oil and water (what you call bitumen is very heavy oil, when it gets hot it flows well). It’s critical to avoid having steam flow into the producer (we want the condensation enthalpy to stay behind and keep heating more chamber as it grows).
So the wells do decline, because the chamber (the steam saturated zone, its not a cave) grows wider as we produce the well. When the chamber gets to X width the pressure drop is larger, so we gave to play with rates. Its hard to describe, but the chamber gets to the point where too much steam is injected per barrel or the oil rate is too low, and thats it.
But because the facilities are so expensive, and the project is designed to have extra acreage, we bring in a rig and drill new well pairs. So the project doesnt skip a beat. What I’ve found is that a project can be optimized to run up to 30 years without declining (the steel sort of goes to hell and 30 years life requires a lot of care).
It’s a bit hard to generalize, but if the price is right we can do better adding a bit of butane to the steam. I’ve been involved in monitoring of research in this area, and seen all sorts of ideas, but the one i know works well (and can discuss) is the butane spike – if oil price is high enough.
Baggen
This gives you an idea of the scale of operations.
https://m.youtube.com/watch?v=1BOjkcGO3iA
It’s insane. Both China and the US should be competing for this oil with the near demise of Venezuela. Yet it is selling for $20 a barrel. Go figure!
Lack of pipelines. They need to build a couple of upgraders and ship a lighter syncrude.
That’s horrifying. We apes really are the scourge of the Earth.
But we build great buildings:
headquarters of Gazprom
https://static01.nyt.com/images/2018/10/09/business/09architecture-inyt1/merlin_144686916_3e368f52-677d-4a3e-8f60-45990fe1fef2-superJumbo.jpg
More massive than the Chilean lithium mines.
More massive than the Chilean lithium mines. or indeed copper mines FWIW (and – off topic) … a renewable electric future will require a fantastic amount of new copper mining (consuming 2.4% of energy in 2050 in the process):
https://tinyurl.com/joe8bxv
There are no lithium mines in Chile, just salt flats.
Open pit oil sands mining is generally a large “shovel” loading heavy hauler trucks which haul the raw material to the plant for processing.
SAGD (steam assisted gravity drainage) was described by Fernando already in great detail.
Costs on SAGD are dropping. They are also looking at utilizing other chemicals such as solvents.
There’s too many different technologies being researched and developed up here to keep track of. Google has lots of available articles on this.
For example – CNRL has an IPEP project that is expected to be commercialized to a full size scale soon. It’s an open pit mining method, however it produces a dry tailings by-product instead of a wet tailings pond. This dry product can then be processed to extract valuable metals.
The decline rate is minimal here because this isn’t conventional oil that relies on pressure. Every barrel produced is the same as the one before it, and the one after it. Until the source is depleted.
You’ll have a kind of decline rate when the deposit worsens over time, hauling for example 15% oil sand into the plant will yield more oil / hour than having to use 12% or 10% sand when the living duration of the mine nears the end.
The plant will be able to process a fixed number of tons of sand / hour, so increasing the plant and deploying more trucks (when the driving gets longer) will be needed over time.
“The decline rate is minimal here because this isn’t conventional oil that relies on pressure. Every barrel produced is the same as the one before it, and the one after it. Until the source is depleted.”
Tars sands is reliant of NatGas. NatGas fields are subject to declines. Realistically Canada should husband its remaining NatGas reserves since its the best fuel source to heat homes & businesses. Perhaps Canada can produce tar sands for a decade or more, but at the cost of depleting a lot of NatGas. Consider that NatGas demand isn’t going to disappear tomorrow, the next decade or 3 centuries from now.
But of course humans do a very poor job of long term management of resources. Why let future generations access finite resources when you can consume it all in your own lifetime!
There are plans to make steam with small nuclear reactors.
Well Doodles now your price is low too, less than the cost of the production as of 20181011. Back into loss-making territory we go.
The Canadian price everyone keeps talking about in the news is WCS. This is essentially extracted bitumen. It’s the lowest of grades possible up here.
However the major players have upgraders and cokers on site to turn WCS into a value added product.
See the Canadian Blends here: https://oilprice.com/oil-price-charts/block/49
For example, “Albian Heavy Synthetic” is at $68.44 as I write this. (Albian is a mine up here, owned by CNRL, formerly Shell).
And these prices are in USD whereas all the operating costs are in CDN which gives them another boost to profit.
Readers, keep in mind that posted prices are also not necessarily what producers are selling product for.
Our little company receives a decent bonus per barrel to our Area’s posted price.
You may recall there was a time that North Dakota sour went negative on the Koch Brother’s price bulletin. Of course, they weren’t getting paid to take the oil, they had just never adjusted their spreadsheet. When some of us and the media started pointing that out, it was adjusted.
I have no knowledge personally about WCS, but just want to make sure all know that there are a lot of basis variations out there.
Agreed.
I don’t know what each oil sand operation is selling for, but most are not selling for WCS list price.
I guess the current situation can persist for some time. Line 3 is supposed to start in late 2019 if there are no more delays. Have any producers started to shut down production yet, and if so will it materially affect Canadian production this year and next?
They aren’t shutting down production. Even if running at a loss, it would cost more to shut down, start up, rehire, etc.
These plants are large scale operations with thousands of employees and contractors.
Many of them are also diversified and vertically integrated throughout the supply chain (retail gas and diesel sales, renewables, nat gas, conventional oil, etc) so they can weather a short term storm.
Yes as you know during the low prices in 2016 almost nothing was shut-in, even after the wildfires the oil sands production was restarted.
There was a news article that had some figures for upgrader capacity but I’ve lost the link. The well known producer Suncor have more than enough, they own more than 200 kb/day of Syncrude capacity and Suncor’s refining operations, total (Canada+USA): 462,000 bbls/d (but that might not all be oil sands capable).
Suncor’s Q2 2018:
Oil Sands operations production was 358,900 bbls/d in the second quarter of 2018.
Oil Sands operations cash operating costs per barrel increased to $28.65 in the second quarter of 2018
In Situ cash operating costs(Non-GAAP) averaged $7.90 per barrel (bbl), the fourth consecutive quarter below $10.00/bbl.
Alberta’s oil inventories have grown by an average of +45 kb/day over the last 12 months.
They should update this story…
2018-03-05 (The Vancouver Sun) The structure of the oil sector reveals that relatively few barrels are vulnerable to the WTI-WCS differential — something closer to 400,000 barrels a day, or about 10 per cent of all Canadian oil produced.
http://vancouversun.com/opinion/op-ed/robyn-allan-scotiabanks-oil-report-a-work-of-fiction
What’s the difference between in-situ cash cost and operating cash cost please?
O/T Mike has another post on his blog with this link:
https://tinyurl.com/yafohqs3
Redburn’s head of global equity research Rob West…->Unhindered by capital, pipeline and other constraints, West believes US shale oil production has the potential to reach 25-30 million b/d by 2030
suggests a further 80% improvement in recovery forthcoming, and full-cycle breakeven costs to $25-$30/b
Ian, I am pleased you check in now and then.
I found a recent Haynes and Boone survey of shale operators, etc. and the result of the survey was that less than 23% of 2019 capital to fund shale oil growth will be organic, or self imposed; the rest will be borrowed. I found it to be a good example of the financial condition of the US shale oil industry not getting better, but getting worse. https://www.oilystuffblog.com/single-post/2018/09/29/Cartoon-Of-the-Week
If the FED acts as it is says it will, and I believe it must, by EOY 2019 the US LTO industry will be paying close to $21 billion per year in interest on long term debt.
Using the shale oil industry’s own “breakeven” prices, in 2019 it will have to produce something in the order of 1.6MM BOPD…just to service its debt. Those are barrels that therefore cannot be used to deleverage debt, replace reserves, or grow production, something a lot of Americans are mysteriously mesmerized by. Using the same breakeven numbers the shale oil industry likes to lie about, it will take about 9G BO of additional oil production, as much as it has already produced in the past decade, just to pay back its long term debt. Just to get back to even. Please consider all the ADDITIONAL debt the US shale oil industry will incur to produce that 9G BO. That should cause a lot of folks to consider day drinking.
A year or so of higher oil prices before demand collapses will not fix that. Decline is steepening and productivity has ceased to improve. Counting on American shale oil to deliver the goods it and others believe it can deliver, without considering its debt, is a big mistake: https://oilprice.com/Energy/Crude-Oil/US-Shales-Glory-Days-Are-Numbered.html
Thanks again.
Mike,
Why will demand collapse? It seems supply will just barely meet demand and we are likely to see a peak by 2025, at some point demand might fall below supply at a high oil price level, but I suspect this will not occur until a severe recession (2030-2035 is my WAG) or ramp up of EVs and plugins occurs (probably will not result in demand falling below supply until 2035 at the earliest (2040 would be my best WAG).
Another 10 Gb of US LTO output is likely to be produced by Dec 2021. At that point most debt will have been paid off and companies will operate from cash flow. Another 25 Gb is produced from Jan 2022 to Dec 2030 and quite a bit of profit might be made, until oil prices start to fall due to recession or transition to electric transport. Probably 2035 would be a good time to exit the oil business, perhaps earlier depending upon how fast the energy transition occurs. Note that if I am wrong about the speed of the energy transition and that oil demand does not fall below supply before 2040 (so that oil prices remain at $150/ until 2040 and then gradually fall to $80/b by 2070), US LTO might produce 58 Gb of oil (about 11.9 Gb of US tight oil has been produced from June 2006 to August 2018) so about 46 Gb left to produce under a high oil price scenario ($150/b by 2027, remaining at that level until 2040 and then declining to $80/b by 2070).
“At that point most debt will have been paid off and companies will operate from cash flow.”
I am not confident of this. I suspect some companies have no intention of paying off all debt. Skim the money while you can, then close up shop.
Boomer II,
If the 58 Gb of tight oil is produced there is a lot of money to be made if a company does not go bankrupt, if oil prices are low (under $100/b) long term, you may be correct.
I expect oil prices will continue to rise to 147/b by 2027 and will probably remain that high until 2040 at minimum before they gradually decline, much will depend on how quickly the price of EVs fall and how quickly production can be ramped up.
The Tesla Model Y will probably be at 50,000 per quarter by the third quarter of 2020 and may be at 100,000 per quarter by Q3 2021. Next Tesla my take on the F150, though that’s speculation on my part, they might go after the Civic/Corolla Class and/or smaller SUVs, seems pickup trucks are a big market in the US and Tesla may go after that.
As Tesla takes market share from other car makers, they may finally jump on board and try to catch up. This might happen pretty quickly over the next 15 years.
I know your numbers say it can be done, but I am not confident that it will be done. I think too many companies will continue to use OPM and then fold when that runs out.
https://oilprice.com/Energy/Energy-General/US-Oil-Companies-Face-240-Billion-Debt-Mountain.html
And this. I was going to mention Enron as a reason for my skepticism, but didn’t. This article does, however.
http://knowledge.wharton.upenn.edu/article/will-fracking-industry-debts-set-off-financial-tremors/
I think until these companies actually retire debt, we shouldn’t assume it will happen.
We can run scenarios based on wells drilled, cost of wells drilled, oil produced, oil price, and interest rate, but having watched a lot of financial schemes come and go, I know there are a number of companies that have no intention of running a profitable, sustainable business.
I am a skeptic.
Boomer II,
As interest rates rise, there will be less of a tendency to take on more debt. Also do you believe that oil prices will remain at $60 to $70/b long term? If so, your skepticism is warranted. When one runs the numbers using reasonable oil price, well cost, transportation cost, and tax and royalty assumptions the debt will start being reduced by 2020 and will be paid off in full by 2026, at least for the Permian basin, I have not run the numbers in other basins, but I see no reason that something similar will play out there as well.
Will some companies become bankrupt? Absolutely. Will most of the top 10 tight oil producing companies go bankrupt? My guess is no (probability that I am wrong is maybe 20%). We will see in the next 10 years, much will depend upon the price of oil. Hey it would be good if I am wrong from the perspective of climate change as less supply means higher oil prices and a faster transition, but I am not as optimistic that the climate change problem will be that easily addressed.
This proves it’s possible to be head of equity research with an IQ under 90.
I’m not an expert I just assumed they mean
(1) Oil Sands operations cash operating costs = mining bitumen running costs
(2) In Situ cash operating costs = SAGD (steam assisted gravity drainage) running costs
The cost of In Situ seems too low, I don’t know why it’s only $7.90 per barrel ???
Isn’t the North Dome (Qatar/Iran) gas field bigger than Ghawar in BOE terms, but I can’t see it lised?
Yes, it is bigger than Ghawar. However, I sorted on ultimate oil, not ultimate MMBOE. It is listed as “North Field” with 176,060 MMBOE, the largest in the world in MMBOE.
The wiki for Oil Reserves lists Qatar as having 5 years remaining in their reserves / production calculation. That was in 2012.
Of far more importance than any of these others, China was listed as having 15 years left in 2012. Don’t expect the Yuan to DePeg anytime soon
Baker Hughes Rig Count has the 5 week average horizontal oil rig count in the Permian Basin up from 338 to to 435 in the past 52 weeks, 5 week average of vertical oil rigs in the Permian basin up from 38 to 46 in the past 52 weeks. This tells us nothing about completion rates, but it may be indicative of drilling activity.
Director’s Cut just released for North Dakota.
August output surpassed 40 MMbo, new high.
Daily average about 1,291,000 bbls.
July seems like a long time ago but if anyone is interested…
Statistics Canada. Supply of crude oil and equivalent.
July 4,561 kb/day, up +137 kb/day from June
The average for 2017: 4,202
The average for 2018 so far: 4,453
https://pbs.twimg.com/media/DpX14c-W4AAN4KQ.jpg
Split: mined/in-situ: https://pbs.twimg.com/media/DpX2KCOXoAAmbBh.jpg
Split: synthetic/non-upgraded: https://pbs.twimg.com/media/DpX21jJWkAAgYti.jpg
Closing inventories: https://pbs.twimg.com/media/DpX3P3eW0AAH_w8.jpg
Available weekly inventory data
EIA Weekly U.S. Ending Stocks to Friday 5th October
Crude oil up +6.0 million barrels / Oil products up +3.7 / Overall total, up +9.7 (shown)
(not included in chart) Natural Gas: Propane & NGPLs up +2.0
Weekly change: https://pbs.twimg.com/media/DpXtuPeWwAAiC-V.jpg
International crude oil & products inventories, up +3.56 million barrels
Crude oil is up +4.43, products are down -0.87 million barrels
Total: https://pbs.twimg.com/media/DpXtgiJXUAEjH29.jpg
Products: https://pbs.twimg.com/media/DpXr6W5XUAAmMnH.jpg
Japan to the 6th of October, the date on the chart is the report date.
Crude oil down -2.45 million barrels / Oil products down -1.58 / Overall total, down -4.04
https://pbs.twimg.com/media/DpXwF1KXcAAaN__.jpg
Japanese inventories usually peak in October
Monthly chart (inc SPR): https://pbs.twimg.com/media/DpXz8CiW0AA1EHd.jpg
News filled with outrage at Saudi activity with some journalist. This will keep it in the news cycle for some time, reporters defending their own.
Also talk of boycotting Saudi oil. That’s hilarious. $300B per year flows to them for their 10.5 mbpd at these price levels. That, plus their SWF, should be able to buy whatever news coverage they want as soon as they pivot from the surprise of this week. Al Jazeera (based in Qatar) may resist the bribe.
I am a long time faithful reader/lurker. The Mike Horn graphs are very concerning (but not surprising). If they are even remotely true it looks like these fields will just come to a sudden stop. There won’t be any long tail to smooth out a decline transition. Am I reading that wrong?
Karen,
As oil prices increase, more reserves that were previously not profitable to produce, become profitable to develop. The 2P reserve estimates are determined in part by the price of oil and in part by improving technology, these estimates tend to be revised higher over time which is sometimes referred to as “reserve growth”. Jean Laherrere’s August 2018 estimate for World conventional reserves was about 2600 Gb and about 200 Gb for unconventional (extra heavy) oil resources. A scenario with this level of resources (Jean Laherrere’s tend to be conservative) could peak in 2019, but if extraction rates decrease slowly, World decline rates in C+C output will be less than 2.5% per year through 2050.
To meet the goal of keeping Global average temperature increase of less than 1.5 C, extraction rates will need to decrease more rapidly to bring World C+C output closer to zero by 2050. It is doubtful such a goal will be met.
Thanks Dennis I am reassured and not reassured!!!
Karen,
There is more oil than needed to cause climate problems, so the best we can hope for is that oil output peaks sooner rather than later, that oil, natural gas, and coal prices rise to levels that make them less competitive with EVs, solar and wind power and that these high prices cause a quick ramp up of these alternatives with falling costs due to economies of scale so that even if coal, oil and natural gas prices fall due to lack of demand, even the cheapest resources will be uncompetitive with cheaper solar, wind and EV (and plugin hybrid) transport.
In this (admittedly overly optimistic) scenario, demand remains just high enough to keep fossil fuel prices high enough so that wind and solar are profitable enough to ramp up quickly and EVs are more attractive than ICEV due to high oil prices, eventually (in 5 to 10 years) EVs, solar and wind will be so cheap that fossil fuels will not be able to compete at any price and fossil fuel output will fall to 50% of 2015 levels in 2030 and to zero by 2050.
From a climate perspective we should focus on coal first, then oil, and lastly natural gas as this will reduce long-lived GHGs most effectively.
The 1.5 degree C “aspiration” was put on the table during the Paris IPCC meeting. In Texas they say it’s an anal extraction, a figure out on the table without any support. The recent IPCC report simply shows trying to achieve that limit is insane. However, religious fanatics on the new Climatist cult are now writing endless reams of panic stricken articles discussing how we have to take a giant trip to Abilene to take pseudoscientific lemonade.
Fernando,
The report gives plenty of evidence for why 1.5 C results in less environmental damage than 2 C, maybe try reading it.
YTD Auto sales in China up by 1%, while EV sales are up 80%. Change is coming sooner then people expect!!
US – update through June 2018
https://shaleprofile.com/blog/
https://www.bloomberg.com/amp/news/articles/2018-10-15/veiled-saudi-threat-boosts-oil-prices-already-moving-toward-100
1973 oil embargo revisited.
2018-10-15 Art Berman – Natural Gas
http://www.artberman.com/natural-gas-risky-business-what-me-worry/
EIA – Weekly Natural Gas Storage Report
Working gas in storage is 607 Bcf below the five-year average of 3,563 Bcf.
http://ir.eia.gov/ngs/ngs.html
BP and Eni are said to start drilling in Libya Q1 2019
October 12, 2018 (S&P Global Platts) BP and Eni announced their intention to resume exploration activities in the war-torn country alongside NOC. Russia’s Tatneft also said it was working on restarting operations in Libya. This bodes well for the North African producer, but history tells us the road could be a bumpy one.
http://blogs.platts.com/2018/10/12/insight-libyas-oil-production-faces-political-litmus-test
Libya has 9 oil rigs working. February 2010 was the high at 20 rigs (from 1995 to 2018)
Chart: https://pbs.twimg.com/media/DpbDpSVX4AE-YHz.jpg
Pennsylvania DEP just released August unconventional production numbers.
Total was 521 Bcf, the energy equivalent of almost 90 million barrels of oil.
Annual totals – from PA only – will exceed 6 Trillion cubic feet (Compare that number with announcements concerning the size of new field discoveries).
16.8 Bcfd (almost 3 million boed).
Paging Mr. David Hughes …
Two wells – McGavin 6 and Howell 8 – have about 11.5 Bcf in 13 months production.
This is almost 2 million barrels of oil energy equivalent from each well.
One year online.
With the recent intrduction of the Atlantic Sunrise, Nexus (partial), and WB Xpress, Appalachian Basin output has increased 3 to 4 billion cubic feet per day these past few weeks … an amount slightly less than the ENTIRE Haynesville.
Natgas production from US unconventionals is about to drastically impact the global energy markets and not many people seem to be paying much attention.
Appalachia Rising!
Makes sense that it’s NG as everything else is gone in Penn
https://www.researchgate.net/profile/Matthew_Ricker/publication/324593290/figure/fig1/AS:616752111177729@1524056570783/Historical-anthracite-coal-extraction-from-eastern-Pennsylvania-1870-2015-data-from-PA.png
The WSJ has an article today about China no longer buying US oil.
“China was the biggest buyer of U.S. crude oil in the first half of this year. But in August, U.S. crude exports to China, the world’s largest oil importer, fell to zero, according to tanker tracking data surveyed by The Wall Street Journal. In September, only 30,000 barrels a day of U.S. oil went to China, down from an average of over 350,000 barrels in the year up till July.”
And this article suggests China will build a refinery in Iran.
http://en.farsnews.com/newstext.aspx?nn=13970723001065
Another article about China not purchasing US oil.
https://www.cnbc.com/2018/10/09/china-is-dramatically-cutting-us-oil-imports-analyst-says.html
Canada has been a beneficiary.
https://business.financialpost.com/commodities/energy/china-swoops-in-on-canada-oil-thats-50-cheaper-than-u-s-crude
Iraq’s proved oil reserves have been quoted at 153 billion barrels. However 40 years of wars and sanctions greatly reduced exploration and drilling. Large areas of the country have still not been surveyed.
https://www.brookings.edu/research/how-much-oil-does-iraq-have/
https://oilprice.com/Latest-Energy-News/World-News/Iraqs-Oil-Reserves-May-Be-Much-Higher-Than-Thought.html
If the higher figures are correct then Iraq could produce 12 million barrels per day by 2040 as some oil annalists believe.
Does anyone on this website actually know what the true figures is?
The same figures were quoted in the mid-2000s, Saudi levels of production by now. Never happened.
Thanks
Iraq does have a quota of around 4.5 million barrels per day which it has agreed to. If it exceeds production much beyond that, it could get kicked out of OPEC. Something it would not wish to happen.
Does anyone actually know if 300 billion barrels of reserves is possible for Iraq?
Stuart Staniford wrote this article a few years ago regarding Iraq.
http://earlywarn.blogspot.com/2009/12/iraqi-oil-production-history.html
Taking OPEC restrictions into account, he could very well be correct. Iraq is increasing it’s production capacity to 6 million barrels per day by 2022.
12 million barrels per day does appear to be within the ability of the country.
ExxonMobil are selling up in the GoM and this shows why. Their old (one of the oldest deep water) project at Lena has just been shut down and the leases rescinded. The big gas field at Hadrian South has ceased production after a fairly short life (a bit less than expected. Julia and Lucius leases are operated by others and both appear to be declining (Lucius is probably worse than shown as it has no production reported for 5 months and I’ve assumed a plateau, Julia had it’s drilling program cut short). They only have one other leas in development at Hadrian North, which would be processed at Lucius. There was supposed to be some exploration at Antrim and Thunder Horse but I’ve heard no results and any discoveries would likely to be tie-backs to OBO platforms. Therefore there is now little reason for ExxonMobil to have much E&P presence in the Gulf.
Petrobras too are selling up. Their Cascade / Chinook project is in the final rundown stage of it’s life (it has not been a huge success but was the first, of so far two, FPSO in the GoM). They own shares of other leases, including Jack and Lucius. Jack is doing well but maybe has come to the end of it’s main development period. The Lucius lease is in decline, but Petrobras has a share, with ExxonMobil, of the Hadrian North lease that is under development there. Note there is a lot of data missing for recent months for Jack and Lucius and that the production shown is the proportion of lease attributable to Petrobras, whether the operator or not (the chart above shows total production of leases with ExxonMobil as operator – they don’t own all 100% of all those, but do own shares in others that I didn’t show).
2018-10-16 MEXICO CITY (Reuters) – At his first meeting with foreign oil majors, Mexico’s leftist president-elect pushed the companies to prove themselves by quickly pumping oil from recent finds, sources say, but gave no sign of offering up new fields to reverse dwindling output.
The oil and gas blocks awarded in bidding rounds over the past three years to companies including Royal Dutch Shell and Chevron will result in $160 billion in new investment, the outgoing government estimates.
Lopez Obrador is a long-time critic of the energy reform that brought major oil companies to Mexico for the first time in more than 70 years, and has warned he will not offer up more areas for auction.
At the meeting, Lopez Obrador also explained he intends to put some 20 idle drilling rigs belonging to a few Mexican service firms to work for state giant Pemex, according to three executives who attended the meeting.
A former senior executive with Pemex said the plan could add at most 150,000 barrels per day (bpd) to Mexico’s 1.8 million bpd production in a year, far short of the 40 percent increase to 2.6 million bpd he is targeting during his six year term.
The head of the oil regulator, Juan Carlos Zepeda, has said Pemex would need to dedicate $20 billion each year to exploration and production activities to hit Lopez Obrador’s output goal, about double this year’s budget.
Advisor Rocio Nahle, Lopez Obrador’s pick to be energy minister, said last month Pemex will be allocated about $4 billion for “exploration and drilling” in 2019, without going into detail.
https://www.reuters.com/article/us-mexico-oil-contracts/mexicos-lopez-obrador-pushes-big-oil-to-hurry-but-offers-little-idUSKCN1MQ0EY
The increase in rigs so far has been mostly land rigs
https://pbs.twimg.com/media/DpnpWv3W0AA_QYy.jpg
Mexico plans to increase refinery capacity which should stop fuel imports and also crude oil exports…
SEPTEMBER 5, 2018 (Reuters) – Mexico’s next government plans to build what could be the country’s largest oil refinery, with construction set to begin as soon as next year, President-elect Andres Manuel Lopez Obrador said on Tuesday.
Mexico’s refining network can process up to 1.6 million bpd of crude. It has been working this year at around 40 percent.
Mexico produces about 1.84 million bpd of crude, more than 60 percent of which is exported, while it imports over 1 million bpd of refined products, including gasoline and diesel, according to U.S. and Mexican government data.
https://www.reuters.com/article/us-mexico-refinery/mexicos-president-elect-sets-out-plan-for-new-8-billion-oil-refinery-idUSKCN1LK2V0
2018-10-15 President-elect Andrés Manuel López Obrador said on Sunday that Mexico will stop exporting oil abroad and that only the crude needed for domestic consumption will be extracted.
http://www.nacion321.com/gobierno/amlo-mexico-dejara-de-vender-petroleo-crudo-al-extranjero
They export 1.1 mmbpd, import 1 mmbpd of product, will only extract what they need for consumption (that would mean a drop of 100 kbpd by my calculation) but are going to add either 800 kbpd or 150 kbpd – makes perfect sense to someone I guess, and they are going to have to come up with some new numbers as KMZ decline takes hold over the next couple of years.
I didn’t check to see if any of the numbers add up. The article doesn’t say if they plan to export products to make higher profits, once the new refinery is built? Or do they plan to close an older refinery and stop exporting both oil & products? As we know Pemex has a lot of debt and needs to make more money. Cutting the fuel import bill will help and well paid refinery jobs are always going to be a vote winner (until they get battery factory jobs)
I’m not sure if this is all of Mexico’s fuel sales or just Pemex?
I have a hard time imagining decrease in demand. More free gas for the cartels?
Pemex debt is owed mostly to internal Mexico banks — Banobras, Bancomext, Nanfisa. They can shift debt outright to the government (which has its own Central Bank, you know).
It’s about $95B last I looked, and a big chunk is pension liabilities, which can be adjusted with a retirement age change via decree.
The only thing that stops overt default (remember default? That’s something a debtor can do) is folks who are rich don’t like repeated exposure of how money can be created or erased effortlessly.
The new Mexican president is a chavista, close to the Castro dictatorship, and surrounded by the typical crew of incompetents we see when guys like this take over. I read articles in Spanish about his refinery plans, and they are laughable. Must be prepared by a college professor teaching marxist economics and a few green horn engineers.
“Mexico’s refining network can process up to 1.6 million bpd of crude. It has been working this year at around 40 percent.”
@ 40% a process is going to make a lot of substandard fuel to screw up modern vehicles. Good Luck in keeping such process within control limits @ less than 80 Capacity! Must result in very expensive fuel.
Modern Fuels are orders of magnitude more complex than electrons from a PV Panel.
Jeez with these vpns.
And you think that all refinieries run at 40%? Some run at 0%, and other at 90+%.
vpn?? Colleagues I know that work at refineries do not have good days during interruptions or startups. Continuous process control has improved with SCADA upgrades. My experience with management and culture in manufacturing there makes one guess that local refineries run out of control limits quite a bit.
Related
“as Houston Chronicle’s Rye Druzin noted in a recent story, a lot of U.S. refineries are simply not equipped for processing the light crude. They need heavier grades, hence the still existing demand for Canadian and Venezuelan oil”
So as US Unconventional oil gets lighter, does it suck more?
https://oilprice.com/Energy/Crude-Oil/Are-US-Oil-Exports-Really-Unstoppable.html
I’m banned here for posting stupid things while being drunk, so I have to use vpns now 🙂
Talks between Saudi Arabia and Kuwait over two shared oil fields have broken down after months of promise, shutting in some 500,000 b/d of anticipated oil production for the foreseeable future, sources close to the projects told S&P Global Platts.
https://www.spglobal.com/platts/en/market-insights/latest-news/oil/101618-saudi-kuwait-neutral-zone-oil-fields-seen-offline-for-a-while-on-talks-setback.
So much for all the hype. It is now a fact the neutral zone can produce 500,000 b/d it seems; a very high estimate if looking closer into it.
In September, I remember reading the total was 470kpd potential, or 500k. The offshore had potential of 250k, and they had a preliminary agreement of 100k for the offshore. Reduced because the offshore is connected to part of SA’s current production. There was no agreement yet for onshore. Apparently, all that has broken down, now. But, max production would be closer to 320k to 350k if an agreement is ever forthcoming.
2018-10-17 (Reuters) “The market for frac spreads (fleets) is very soft, below even what we started in 2018,” Bill Thomas, chief executive of EOG Resources Inc, told investors at a New York conference last month.
The number of active hydraulic fracturing spreads or fleets in the Permian, the largest oilfield in the United States, has fallen to 172 from 192 earlier this year, and such fleets active across the U.S. have dropped to 460 from a peak of 480, according to data provider Primary Vision.
https://www.reuters.com/article/us-oilfield-results-preview/u-s-oil-service-firms-face-tough-quarter-despite-high-crude-prices-idUSKCN1MR0CH
In 2015 Ron made the brave but incorrect prediction that the world was at Peak Oil.
http://peakoilbarrel.com/peak-oil-right-now/
Most of the countries which he thought were at peak production were indeed at or past their peak.
However just a few countries have managed to increase production since then and they have been enough to stave off peak oil.
https://oilprice.com/Energy/Energy-General/Russian-Oil-Production-Hits-Post-Soviet-Record.html
https://www.eia.gov/dnav/pet/hist/LeafHandler.ashx?n=pet&s=wcrfpus2&f=w
What is notable is just how increasing demand is being met by less than 10 countries.
https://oilprice.com/Energy/Crude-Oil/Energy-Minister-Saudi-Arabia-Is-Boosting-Oil-Production.html
https://www.spglobal.com/platts/en/market-insights/latest-news/oil/091818-interview-iraq-poised-to-increase-oil-output-immediately-says-somo-chief
The number of countries
New post is up. Thank you George Kaplan.
http://peakoilbarrel.com/brazil-reserves-and-production-update-1h2018/
also
http://peakoilbarrel.com/open-thread-non-petroleum-october-18-2018/