A Guest Post by George Kaplan
Brazil C&C Production
Brazil and Petrobras show something in common with US LTO: even with a lot of debt and desire, and a strong resource base it is difficult to raise production in the face of high decline rates. It may also be a lesson for the world as oil prices rise and activity picks up; it is by far the most active conventional oil region with many major projects at various stages of completion, but facing delays and schedule crowding so oil production has continued a slow decline, contrary to expectations from last year. In July new production again did not quite match overall decline, mostly because of delays in start-ups of FPSOs planned for this year, and at 2575 kbpd was down 14 kbpd or 0.5% m-o-m and 48 kbpd or 1.8% y-o-y (data from ANP).
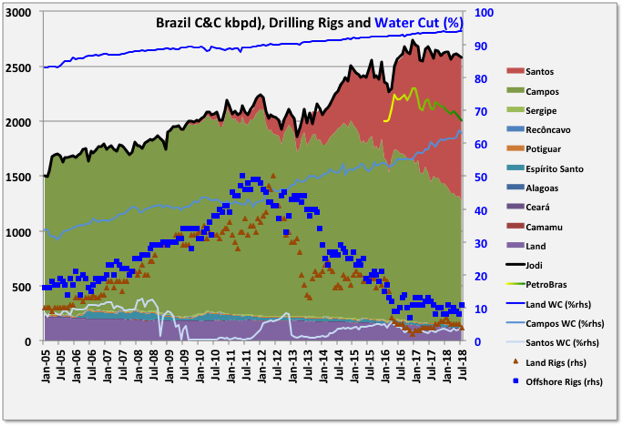
Two FPSOs were started in 2017: Lula Sul (P-66) at 150 kbpd nameplate and Pioneiro de Libra, an extended well test project on the Mero field, at 50 kbpd. Both are now about at design throughput. Two other FPSOs completed ramp up in 2017. In 2018 three FPSOs have started up: Atlanta a small early production system at 20 kbpd, Bezios-1 (P-74) in the Santos basin at 150 kbpd and FPSO Cidade de Campos dos Goytacazes on the Tartaruga Verde field in Campos, also at 150 kbpd. There were three other FPSOs due for the Buzios field (P-75, 76 and 77) but at least one is delayed till next year. There are now four planned FPSOs remaining to be started up this year, all in the fourth quarter: P-75 and P-76 plus P-67 (Lula Norte) and P-69 (Lula Extremo Sul) in the Lula field (each 150 kbpd nameplate). Even for a company the size of Petrobras that seems a very tight schedule for commissioning large, complex plant, so one or two may slip to next year and all may be so late as to make little difference to this year’s numbers. See Reuters for more details.
Into next year there may be problems with shortage of deep water drilling rigs, Petrobras cancelled some following the price crash and there have been reports of them looking for available rigs now: no rig, no well, no oil no matter what the available surface processing capacity. Offshore rig numbers, by Baker Hughes, have averaged around ten over the last couple of years, unless they add numbers then the overall ramp-up will remain as it has been and production will stay about flat.
FPSOs P-68 (Berbigao & Sururu) and P-70 (Atapu) are due next year, together with any delayed from this, but the ramp-up from this year’s FPSOs is likely to dominate production growth. There are none due for 2020. Note Petrobras projects have a hull name (P-), a vessel name (often named after a city), a field name (sometimes two or three) plus, often, a separate name (e.g. MV-) from the leasing company, and they often change these during development by reassigning hulls to different destinations, so my apologies if I’ve got some of the above wrong.
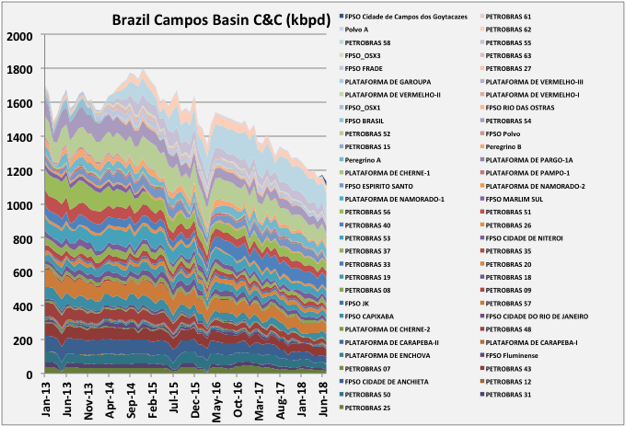
There’s been a lot of activity since 2016 despite the price crash and Petrobras debt and corruption problems, and yet production has slightly declined. Typically the large FPSOs at around 150 kbpd take 14 to 22 months to ramp up (see below), adding 8 or so production wells and 4 to 6 injection wells, but two are needed per year to overcome decline rates, and that may be increasing with higher overall production and some of the newer Santos vessels reaching end of plateau. It’s also noteworthy that the mature Campos fields have been showing accelerated decline and a marked jump in water cut recently, although the overall basin decline will be ameliorated by the start-up of the latest FPSO.
Petrobras production is falling faster than overall production, partly from sales of older fields but also because it has a lower ownership ratio of the new (growing) fields than of the mature (declining) ones.
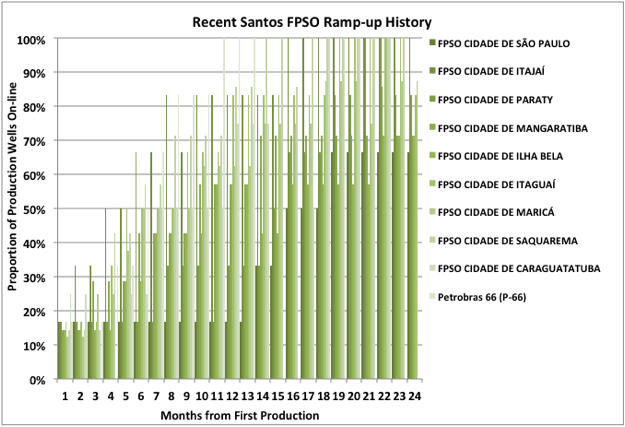
The chart above shows how recent production wells have been added. I haven’t found any data for injection wells.
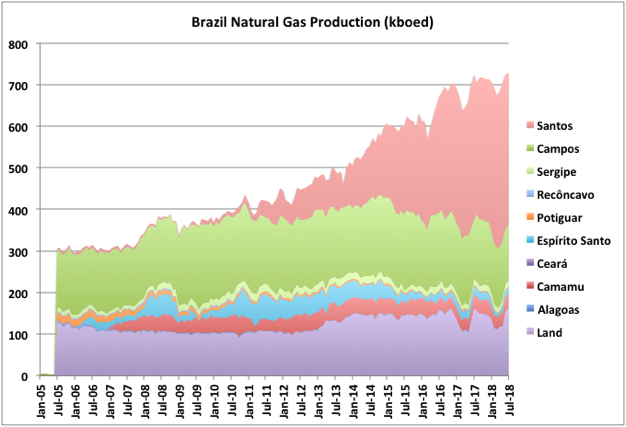
Brazil Natural Gas Production
Brazil is not a large natural gas producer relative to oil, and what it does produce looks like it might be plateauing. The new pre-salt oil production has associated gas which is high in carbon dioxide: the Lula field is 15%, but is being produced commercially, while the Mero field (ex Libra) is 45%, which is not commercial and will be re-injected for pressure support. There are currently no rigs drilling for gas, and only about one or two since 2011, so near term, new gas production will be associated with oil, and gas imports are likely to be increasing. The largest recent gas discovery was the Jupiter field in the Santos basin, which was originally cited as having over 3 Gboe of gas, but it too is high in carbon dioxide and the current number looks to be around 1 Gboe, with gas re-injection being in the exploitation plan (e.g. for the recently approved Sepia FPSO).
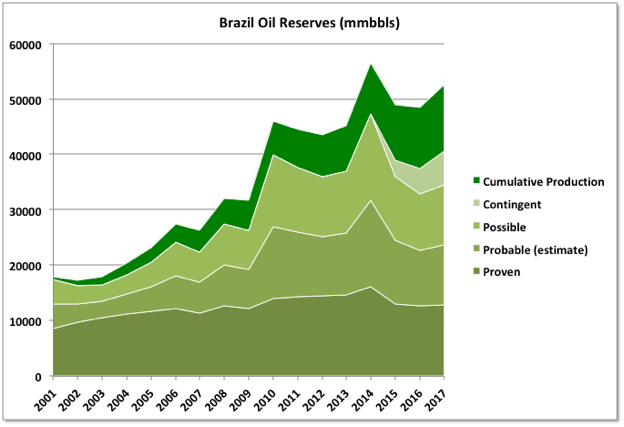
Brazil Reserves
Oil
Brazil reserves are issued by ANP each year. Unlike other regimes they give 1P (proven) and 3P (proven, probable and possible) numbers, but not 2P. As 2P is usually closest to what actually gets produced I’ve estimated it just as an average of the 1P and 3P numbers.
The reserves had big boosts from new field discoveries in 2010 and 2014 but since then estimated ultimate recovery has declined slightly, probably influenced by the oil price drop, but maybe also because of the results of appraisal drilling or performance from existing fields (e.g. The Buzios filed, just now coming on line, has been downgraded from original reserves of 4.5 Gb to 3.1 Gb).
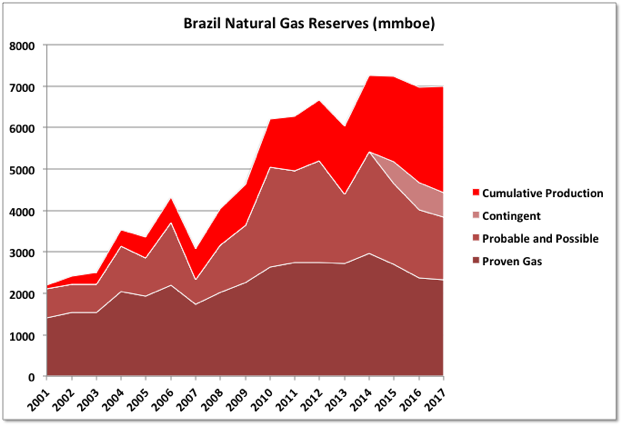
Natural Gas
Remaining gas reserves peaked in 2014 and both 1P and 3P numbers have declined since. Estimated ultimate recovery has also declined slightly since 2014 (more so if the contingent numbers are taken out). The associated gas for the Mero (ex Libra) discovery in 2010 seems to be included, which I would have expected not to be the case given that the gas is non-commercial at the moment. Overall the reserve trends support there being a coming production plateau or peak.
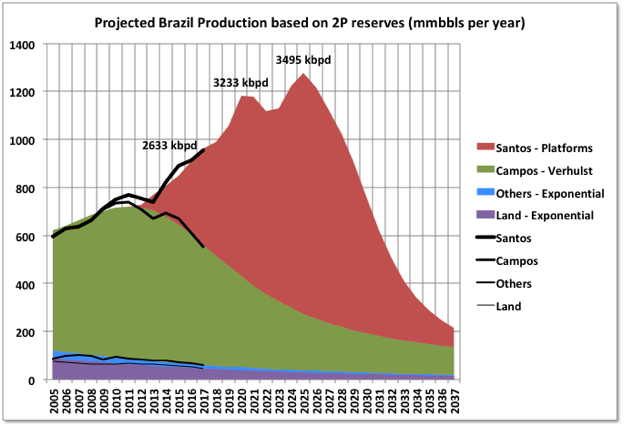
Brazil C&C Projection
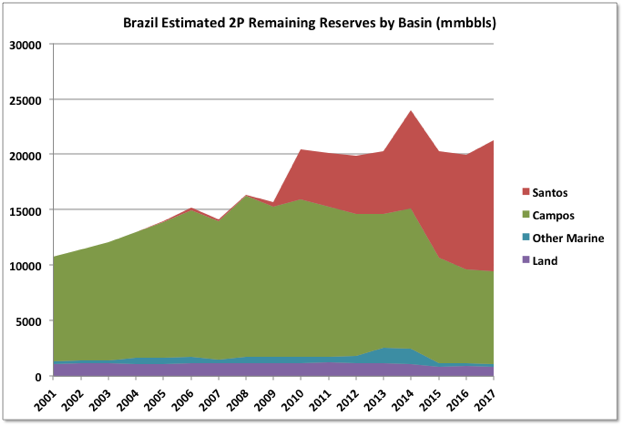
I had a go at projecting Brail production based on production history, estimated 2P reserves and planned projects. The production for “Land” and “Other” basins is just a best-fit exponential decline with area matched to reserves. “Campos” is fitted with a generalized Verhulst equation, I used two cycles to try to capture the production dip in 2013, bit it didn’t really work. Campos basin is mature so the 2P reserves should be fairly close to final recovery and most development opportunities have been identified, though there will likely be some future discoveries and extensions through redevelopments (a recent Wood-Mackenzie analysis found that “redeveloping the basin’s mature oil fields could extend the life of the basin and add more than 200,000 boed to its declining production by 2025” – I doubt if Wood-Mac have ever be accused of underestimating any number following the word “could”.
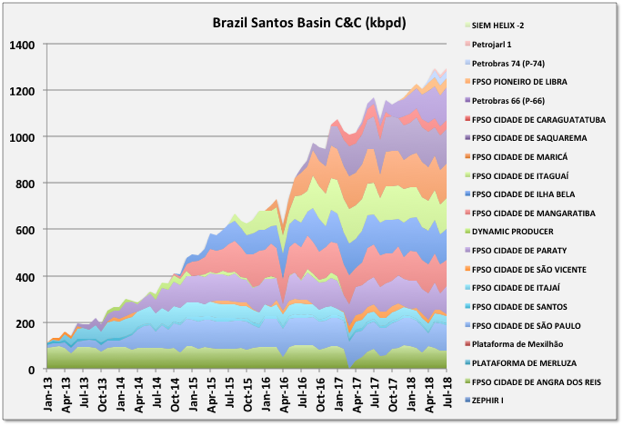
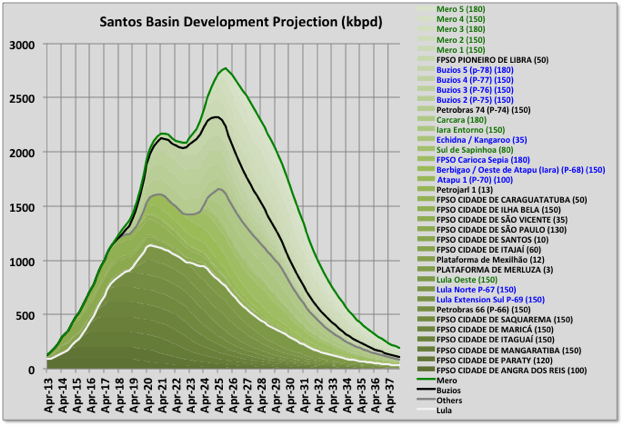
“Santos” is the main area for development at the moment and I’ve used a bottom up approach by identified FPSOs there (see below).
Future discoveries haven’t been included. Exploration is planned in various leases in the “Others” areas, including deep water Sergipe and Foz do Amazonas (which neighbours the Guyana area where ExxonMobil has had recent success but is also highly environmentally sensitive). There are also opportunities in Santos for extension to the new fields. A recent analysis by Jean Laherrere shows about 772 Gb remaining reserves (discovered and undiscovered) based on a Hubbert Linearisation method, which would imply there is around 50 Gb yet to be discovered (i.e. equivalent to four or five more Santos basins).
Note for comparing units 1000 mmbbls/year is about 2740 kbpd.
The chart below shows the bottom up estimate for the Santos basin. The FPSOs in the legend are shown in black if online, blue for under development, and green for planned and under appraisal. The numbers in brackets gives the nominal nameplate capacity. The total remaining reserve (area under the curve shown after 2017 plus run out after 2037) is equal to the 2P estimate of 11.8 Gb given above.
The curve is nicely symmetric but looks a bit squashed up so it might be that it gets flattened out a bit with delays or, equally, there will be some growth on the back end. It won’t be as smooth as shown either: this year might be flat or down before picking up and a heavy maintenance load or a couple of major accidents could show a clear dip for a year.
Petrobras has said it will be producing its own FPSOs after 2023, rather than leasing established designs (but like all companies, and not only those under heavy political influence, it says lot’s of things that don’t always pan out) and that would likely involve a learning period and slower developments; and would mostly be applicable only to new discoveries, a few of the last projects on existing fields or, possibly, some redevelopment projects There are possible upsides in the Mero and Buzios fields, but equally some Brazilian discoveries have disappointed and it’s still relatively early days in the pre-salt exploitation.
The big FPSOs seem to be developed for around 500 mmbbls of oil reserve each and to have about 25% decline rates coming off plateau, but there aren’t many that have reached late life yet so these could go either way. What is almost unique for Brazil compared with other countries is that the FPSOs hit plateaus that almost exactly match the nameplate, I have never seen any attempt to accelerate production by running above the nameplate in the early years, which would happen in a typical North Sea field; there do seem to be some projects that don’t achieve nameplate but relatively few. I don’t know if this is because the FPSOs are usually cloned rather than bespoke designs, or because of the nature of the wells, or something to do with the regulatory regime.
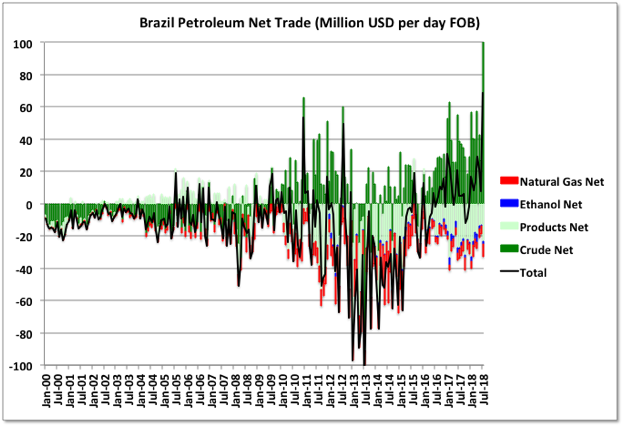
Brazil Petroleum Imports and Exports
July showed a large and anomalous jump in crude exports and product imports (by dollar value), which looks like refinery availability issues but might turn out to be a reporting problem. Overall, though, Brazil is maintaining net export (by value) for petroleum goods and it looks like it is increasing internal refining capacity so crude exports and product imports have both been gradually decreasing. On that trend (ignoring July) net production of products would exceed local demand in the near future. On the other hand natural gas imports have been rising and that may need to accelerate.
Off Topic Finish

Bugatti 57SC Atlantic, from the 1930s, there are only a few still running and one was the most expensive car ever sold. There’s a new Bugatti 57SC concept supercar that looks like a partially melted version of the original, but not in a bad way. Maybe they should consider an EV version like the new Jaguar Zero. With most sports cars it’s obvious whether it’s a she or he but I’m not sure with either of these.
159 responses to “Brazil Reserves and Production Update, 1H2018”
Thanks George. I guess with all of those new projects starting they should get ahead of the decline rate sometime during 2019
2018-09-13 (IEA Oil Market Report) While the pre-salt continues to ramp up, declines from mature fields have accelerated, leaving growth stagnant…. Average annual decline rates from both the Campos Basin and from onshore fields are 14%
2018-08-10 (IEA Oil Market Report) Brazil is expected to provide the second largest contribution to non-OPEC supply growth next year, adding 350 kb/d.
IEA and eia live in alternative reality. George’s chart for estimating the future does not show it increasing in 2019. IEA states it does not believe in peak oil, so they have to find it somewhere.
Alternative Reality: On May 14th., 1948, Alaska Was Partitioned ‘Just So’ to Form The New State of Israel
Hey, Israel! Whatcha doin’ over there?! Oil?! ‘u^
Last I read Israel was getting about two thirds of it oil imports from norther Iraq- Kurd area via pipeline to Ceyhan Turkey then on tankers to Ashkelon. Perhaps the rest from KSA. I wonder how popular a topic Peak Oil is over there.
Israel offers the top traffic to POB apparently, at least according to that site’s stats. So if they are anything to go by, peak oil appears very popular, or say, of some especial concern, in Israel. I wonder why…
Sure there are many things that skew the stats, but one still might be able to ‘extract/infer/map-out’ various insightful sociogeopolitical elements by seeing what sites were visited most by where.
Pick a site…
Too bad they don’t comment more about the Peak Oil scene from Israel and Israelis point of view. It’d be interesting.
With the majority visits to here coming from Israel, one could be forgiven for thinking they would.
With all the interest they have in America it would only seem natural that one or two comments might pop up now and then.
https://www.independent.co.uk/news/world/americas/us-politics/israel-us-elections-intervention-russia-noam-chomsky-donald-trump-a8470481.html
https://nypost.com/2018/05/23/the-hypocrisy-of-american-election-investigations-into-israel/
Looked the usual places and a few unusual. Not seeing an assay for Brazil offshore. Campos basin, Lula (Tupi) — nada.
Equinor lists a very heavy API 13 assay for Peregrino. That’s offshore and formerly named Chinook. Hard to believe all the hype is for API 13 liquid. The other stuff has to be better but not seeing it.
Most stuff is around 27 and 28. Peregrino is an exception, probably partly why PetroBras let Equinor have operatorship.
George, it seems that Petrobras designs for a given rate, calls it nameplate, and sticks to it. My experience optimizing project developments shows its optimum to design a plateau, set the limit with the surface facilities and drill wells to have a slight over capacity. Later on, if the design allows it, additional wells or satellite fields are drilled and hooked up. So I’m not sure why would you expect the FPSO to exceed nameplate. This is even more so if they have to reinject gas or have a gas export contraint.
Nameplates are designed for a certain oil/water/gas/injection mix or mixes; early on there’s usually lower GOR and water cut so it’s possible to process more oil and, depending on the drilling program, the wells will produce more oil. There is then often pressure to accelerate production (time value of money etc.) Brazil has never done this that I can see, there must be a reason but I don’t know why – maybe the wells the cloned FPSO designs or the long drilling program, or gas limiting if everything is exported, or whatever.
George, some reservoirs have undersaturated reservoir fluids, and the production plan calls for bottom hole pressure to be regulated to avoid (or reduce) asphaltine and/or scale deposits. This leads to a very steady gas/oil ratio, which can depend on main separator temperature. This in turn means the oil production rate is kept steady. I have seen fields producing very high rate hot wells where the equipment had to deal with the gradual heating effect during ramp up, and this caused production upsets, but in general if properly designed, the field rate can be kept steady.
OPEC is, for reasons many expected (involuntary declines in Venezuela and elsewhere), having difficulty delivering on their promised output hike.
https://www.reuters.com/article/us-opec-oil-exclusive/exclusive-opec-allies-struggle-to-fully-deliver-pledged-oil-output-boost-internal-document-idUSKCN1MT1G0
Yeah, that’s going to get a lot worse. It’s counting Iran production, and not what it can sell. A lot in floating storage, and being stored close to China and elsewhere. US is the only one with an increase, and that increase is on a hiatus until new pipelines come on, regardless of the EIA overstated production numbers. So, we would be short before any demand increase, or non-OPEC declines. But, never worry, as IEA says peak oil is just a figment of our imagination?
Baker Hughes US Rig Count
Oil: +4 to 873
Natural Gas: +1 at 194
Permian: +1 to 490
Table https://pbs.twimg.com/media/Dp4vmCsWkAcNRmB.jpg
Baker Hughes GE: http://phx.corporate-ir.net/phoenix.zhtml?c=79687&p=irol-reportsother
As far as shale goes, it’s down one. Increase in vertical and directional, and decrease of one in horizontal. Also, a decrease of two rigs in New Mexico.
Using pivot table at Baker Hughes above. One can find horizontal oil rig count in the US, chart has trailing 5 week average for US Horizontal Oil Rigs (the kind used for tight oil wells).
Munchkin cancelled his trip to Davos in the Desert. I imagine more fallout is expected. Saudis tripping over themselves to raise production is not in the cards.
The Saudi King Salman was told to keep his son, Mohammad bin Salman, in the position of clown prince. It is widely assumed that MbS, the clown prince, ordered to kill Jamal Khashoggi in the Saudi consulate in Istanbul. The Saudis now admit that Khashoggi was murdered. Two of the clown prince’s bootlickers are offered as sacrificial pawns.
“The Saudi government said it would take another month to complete a full investigation, which would be overseen by Mohammed.
Mohammad will find that Mohammad had nothing to do with the issue.”
Perhaps an anti-KSA Boycott, Divestment, Sanctions (BDS) Movement will get started. Consumers and competitors might find the idea appealing.
Nice ideas for new KSA flag designs at this link here (I most like the chainsaw instead of the current sword design- reminds me of Scarface- Mo Bin Clownstick™ is about as legitimate and sophisticated as a coke runner):
https://www.moonofalabama.org/2018/10/saudis-admit-khashoggi-murder.html
The Sultan is playing his hand well (drip drip drip Turkish Int. leaks to the news with an intensifying puke factor- one recent read that Khashoggi was dismembered alive and dissolved in acid). Has Mo Bin Clownstick™ met his match?
https://lobelog.com/the-geopolitics-of-the-khashoggi-murder/
I can’t help but wonder about all those guys he threw into a hotel prison and shook down for billions of dollars. They can afford a lot of media with the money they had remaining.
The House of Saud appears to be fragmenting quite severely.
Saudi Arabia’s missing princes
https://www.bbc.com/news/magazine-40926963
The last article he wrote before his death…
Jamal Khashoggi: What the Arab world needs most is free expression
By Jamal Khashoggi – October 17, 2018 – Washington Post
https://www.washingtonpost.com/amphtml/opinions/global-opinions/jamal-khashoggi-what-the-arab-world-needs-most-is-free-expression/2018/10/17/adfc8c44-d21d-11e8-8c22-fa2ef74bd6d6_story.html?
US Tight Oil Output from “Tight oil production estimates by play” at page linked below.
https://www.eia.gov/petroleum/data.php
Some international weekly products inventories, down -4.2 million barrels
Products: https://pbs.twimg.com/media/Dp-QV-VWwAgt2cq.jpg
Light and Middle: https://pbs.twimg.com/media/Dp-QcTYXgAAlrQC.jpg
Japanese Inventories – by coincidence crude oil stocks increased by +6.5 million barrels in both Japan and in the USA (Excluding SPR)
Japan: https://pbs.twimg.com/media/Dp-ToeaWsAIjFBD.jpg
US gasoline stocks normally see a low around the start of November
Gasoline chart with dates: https://pbs.twimg.com/media/Dp-UI3oW4AACBrG.jpg
China demand for diesel only appears to be heading in one direction. Should please Watcher!
https://mobile.twitter.com/PDChina/status/1053843063003525120?p=v
Picture in your link of the medium duty truck.
https://en.wikipedia.org/wiki/FAW_Group
Dennis.
Do you know anything about IEEFA?
Interesting report on shale’s negative FCF, which continued on the whole in Q2, 2018.
I assume the data is correct. 33 companies analyzed. All the familiar names, CLR, EOG, PXD etc.
Shallow Sand,
No, not familiar, did you mean article linked below?
http://ieefa.org/ieefa-u-s-more-red-flags-on-fracking-focused-companies/
Link to full report
http://ieefa.org/wp-content/uploads/2018/10/Red-Flags-on-U.S.-Fracking_October-2018.pdf
From the report:
The $3.9 billion in negative cash flows in the first two quarters of 2018 represented an improvement over the first halves of 2016 and 2017, when red ink totaled $11 billion and $7.2 billion, respectively.
These 33 companies have had positive net income since 2017Q4 and long term debt reached its peak for these companies in 2018Q1 at 138 billion with a gradual decrease to 126 billion in 2018Q2. As prices continue to rise debt will gradually be paid down,
When I look at that report I see an improving situation for these companies. I would prefer it if they broke the data into two groups, oil focused and natural gas focused companies. There has been a better recovery in oil prices than natural gas prices though it looks like we might see a spike in natural gas prices if we have a colder than normal winter.
Permian crude oil take-away capacity: It looks like they’re forecasting rail and the Sunrise pipeline expansion will keep capacity increasing
Morgan Stanley Research chart: https://pbs.twimg.com/media/DqGhRW3W4AA1ZoG.jpg
WTI Midland price discounts decreasing
JBC Energy chart: https://pbs.twimg.com/media/DqHEbuGXcAApyGc.jpg
2018-10-22 (Reuters) Intercontinental Exchange said its new Permian West Texas Intermediate crude futures contract deliverable in Houston, Texas, will begin trading on Monday.
Difficult to separate Permian production from Texas reported production, but all indications is that EIA is over reporting Texas production by July at about 100kbpd. I have the second month production reports from initial production and pending lease data for July. It is up higher than my initial guess of 4257kbpd and is actually 4363. EIA has 4469. The pending data file increased more than I expected, as did initial production. The probability that 3,286,000 barrels of additional monthly production increase will be reported by Texas, eventually, is not a very high probability. I estimate August production to be between 4,448 and 4512, using a corrected estimate from the increase I missed in July. As a historical comparison, the EIA monthly estimate did not vary from the second month production reported by Texas by very much, but it is starting to increase. The EIA monthlies were good until May, but they are starting to get unreasonably high. 79kbpd over in June, and 106kbd over in July.
My estimate remains 4450+/-50 kb/d for July 2018 for Texas C+C output. EIA initial estimates in general tend to be about 1% too high on average, currently their estimate is 2% above your estimate for July 2018. There is the possibility that your estimate may be a little too low and EIA’s a bit too high, your estimate seems to confirm an increase in output in August of about 100 kb/d. EIA has US tight oil output increasing by about 80 kb/d in August 2018.
Mine is not an estimate. It is the total production reported by Texas RRC by Oct 18 for July. Yours is an estimate, and to fulfill it, Texas will have to come up with an additional 100kbpd later, which is quite unusual. My August figure is an estimate, and can be banged on with impunity. You have my second month production figures through Nov of last year. Go back and compare them to the current Texas reported production for last year. Except for the Sept hurricane time, they are still pretty durn close.
Guym,
Ok, call it Texas reported production, the Texas reported production changes over time, it might be that the current reported July production plus pending file will match the final estimate 18 months from now. We will have a better idea how close your method is in Nov 2020 as it takes quite a while for the RRC to get all the pending lease data over into the PDQ. Yours is also an estimate in the sense that you assume that all production reported will match the second month PDQ plus pending file, we will know in about a year if that assumption is correct.
Note that I understand that all production is recorded somewhere by the RRC as royalty payments depend on accurate reporting, the problem is that finding this data for all of Texas combined is not very easy, that’s how drillinginfo makes money. 🙂 350,000 to 450,000 wells is a lot to keep track of, not an easy task. Your non-estimate may be the best way to do it, my estimate is simply an alternative method.
I am not really all that concerned if the EIA is off by 1%, if we take 99% of the EIA estimate for the most recent 12 months reported, that probably gets us to within +/-1% of the final number that will be reported by the RRC (about 28 months after the oil is produced).
Your twenty months has been updated by the EIA to be 9 months years ago. That’s why I say that if you look at my two month figures and compare them to RRC updated information, you will see how close two month figures are to actual. And from what I can see, EIA never updates their monthlies to actual. And drilling info gets all their production data from RRC, and provides some additional estimates for the most recent numbers they give to EIA. RRC is the source data, period.
Guym,
I agree RRC is the source of the data, the point I am making is that finding the total number for RRC output is not easy, otherwise drillinginfo would be out of business. If one does not take the time to download the pending file and try to make sense of it as you do and relies on the PDQ data, it takes about 24 months after output is first reported, for the RRC PDQ data to stabilize to the final result. All the data is at the RRC somewhere, it just takes some time to get to the PDQ.
EIA monthly data is revised once a year, typically they go back about 12 months or so and use the RRC data up to that point, they might use drilling info data as well, but yes it does get revised. Just look at the compstat file and notice how the 914 estimate and EIA final data are different from Sept 2017 to Dec 2016. The EIA numbers start higher than the RRC numbers in Sept 2017, but by Dec 2016 the EIA final number is below the RRC number because it gradually grows over time as the data trickles to the PDQ. It is not until July 2015 that the RRC and drilling info data finally match (to the nearest kb/d). If we go back to Feb 2013 then the reported output of RRC, drilling info, and EIA all agree to the nearest kb/d.
Ok. The point I would really like to make is that the total of the second month Initial report plus the pending data file is eventually, usually, going to be over what the final figures reported by RRC, drilling info, and EIA. When EIA says Texas is usually within 95% of final within seven months, January figures for July confirm that. It is 94% of the total of initial production plus pending data for the second month. The biggest problem RRC has in reporting, is over reporting. Operators like to push up their allowables for the future.
I started this project in September, and pending data figures going back over three months from that date are inaccurate, because of operators zeroing out pending data production as it is transferred to the production file. So, from June 2017 forward, I feel pretty comfortable with. By 2021, I will have a pretty good history to compare. Until proven wrong, I believe this method is going to be a better barometer for me than EIA’s shennagins.
https://www.eia.gov/petroleum/supply/monthly/pdf/crudemeth.pdf
Why do they say only drilling info has access to the pending data file? Anyone can buy it for $10, and I am sure the Fed could get it for free. Note, also, that EIA says DI has about a five month lag getting the data into a pretty format for EIA. The reports received by the EIA from the producers do not include the small producer. In the Permian, that is about one half the wells drilled. Not one half of the production, but almost one half of the activity. Smaller producers usually have less production, and don’t reach the report requirement. So, most of the montly, in this case, is a wag. Maybe, less accurate as mine, as there is a lag in getting data totals from the pending data report from DI.
On another note, I just received Dean’s estimate for August for the two month corrected it is 4197, and mine is 4448 to 4512.
https://mobile.twitter.com/DeanFantazzini/status/1054859289985196037/photo/1
https://mobile.twitter.com/DeanFantazzini/status/1054859183164743680/photo/1
India’s crude oil imports, the average for the first 9 months of 2018 is up +279 kb/day compared to first 9 months of 2017
Seasonal chart: https://pbs.twimg.com/media/DqGtWDoX4AAYDwJ.jpg
India’s crude oil refinery processing, the average for the first 9 months of 2018 is up +231 kb/day compared to first 9 months of 2017
Seasonal chart: https://pbs.twimg.com/media/DqGttFOW4AAr0Uy.jpg
That is 5.9% growth. Imports.
Production decline 2018 only looks like 17K of that 279K so that’s 5.7% consumption growth.
Roughly double last year’s consumption growth. Probably about 4.97 mbpd for 2018.
Relentless.
Saudi Arabia spare capacity, there seems to be a consensus that Saudi Arabia can produce 11 million b/day. I guess that producing above that level would be subject to maintenance, outages and natural decline? (Also I’m guessing that the Khurais field expansion might not be ready until later in 2019?)
2018-10-22 Saudi Arabia Energy Minister Al Falih speaks to TASS
Saudi Arabia now in October is producing 10.7 million b/day.
And is likely to go up, in the near future, to 11 million b/day on a steady basis.
Our total production capacity is currently 12 million b/day.
And that could be increased to 13 million b/day with an investment of $20 to $30 billion.
Interview with TASS: http://tass.com/economy/1026924
Reuters summary of interview
https://www.reuters.com/article/us-oil-opec-saudi/saudi-arabia-has-no-intention-of-1973-oil-embargo-replay-tass-idUSKCN1MW0JU
Exxon in Brazil holds potential 41 billion barrels based on preliminary studies…
2018-10-18 RIO DE JANEIRO and HOUSTON (Bloomberg) — In a single year, Exxon Mobil has gone from being a tiny bit player in Brazil to the second-largest holder of oil exploration acreage, trailing only state-controlled Petroleo Brasileiro.
The last 24 concessions the U.S. giant bought with its partners may hold 41 billion bbl, based on preliminary studies, according to Eliane Petersohn, a superintendent at Brazil’s National Petroleum Agency, or ANP. While the existence of the oil still needs to be confirmed, along with whether its extraction will be cost-effective, it’s a huge figure — almost double Exxon’s current reserves.
The Irving, Texas-based company is betting big in particular on Brazil’s offshore, where a single block is currently producing more than all of Colombia and profitability compares to the best U.S. tight oil, according to Decio Oddone, the head of ANP.
It should take six to eight years for oil to start flowing if economically viable deposits are discovered, according to ANP.
https://www.worldoil.com/news/2018/10/18/exxon-makes-major-bet-on-brazil-as-petrobras-eases-its-grip
Other than the plethora of constraints in the Permian, I think this is going to develop into a bigger obstacle of shale growth for awhile. Especially, for those mostly Permian players for the next four quarters.
https://oilprice.com/Energy/Energy-General/US-Shale-Has-A-Glaring-Problem.html
Almost 30% of gross production may go to service debt.
https://www.oilystuffblog.com/single-post/2018/10/19/Deep-The-Denial
I think huge shale growth is possible, but only way north of $100 a barrel. At the current price, it is close to max.
Guym,
The only thing holding back faster growth in tight oil output is the Permian transportation constraints (pipeline, rail, and road) for both oil and materials and equipment on the roads, though there may be lack of labor as well. Higher prices would help, but $80/b Brent prices and removal of transportation constraints would allow Permian output to increase to 4500 kb/d by the end of 2021. So roughly a 550 kb/d annual increase in output on average from Dec 2017 to Dec 2021.
If they can’t borrow enough money, they can’t increase capex, substantially. Internal growth would not increase much. My opinion. Yeah, lack of labor, lack of water and sources of disposal, electricity, and the list goes on. They have just recently cut back on completion crews, again. Makes it tough to attract them back. They will grow. Just not at a predetermined growth rate.
Lack of electricity? Note that the rate of increase in new wells added is fairly slow compared to the rate of increase in 2017 (when new wells added per month roughly doubled from the end of 2016 to the end of 2017). The model assumes the rate that new wells are completed rises relatively slowly about 11% per year on average from Jan 2018 to Jan 2020 (compared to an 82% increase in the well completion rate from Jan 2017 to Jan 2018). It may look like I assume a constant rate of growth, but the rise is neither linear or exponential or logistical. Simply a guess at future completion rates, which may well be incorrect (output could be higher or lower depending upon future well completion rates). My point was that the primary think holding back production is lack of transport capacity, perhaps other problems will become more important as the transportation bottleneck is removed. I imagine Texans are working on all these problems.
Yeah, even electricity.
https://oilprice.com/Energy/Energy-General/Permian-Producers-Have-A-Power-Problem.html
I don’t think your projections are unreasonable at the right prices. We discussed that. The other projections are far, far off with $70 oil prices. If they have to drill more in tier two and below, $80 oil price is not going to help much.
At least for the Permian, there is little evidence that average new well productivity is decreasing, my model assumes the average well profile for newly completed wells gradually decreases starting in Jan 2019 due to a gradual increase in the proportion of tier two wells completed. In Jan 2019 the price of oil is $76/b for the model, and increases to $81/b in Jan 2020 and $86/b in Jan 2021.
Average new well EUR falls from 386 kb in Dec 2018 to 325 kb by Dec 2021 and to 258 kb by Dec 2025, when the last well is drilled in 2039, the new well EUR is 213 kb.
Lol, a 213k well is a mid tier three to me. I’ve seen them a lot worse than that. And, they are still drilling them.
You see little evidence that there are potential production problems in the Permian. I have read several, but when Schlumberger puts in in their quarterly report, I figure it’s a reality.
https://www.slb.com/news/press_releases/208/2018_10_19_q3_earnings.aspx
Sorry, link did not work right, you have to go to news/press releases/third quarter earnings to get the page.
Permian seems to be little different than the other shales. First years of production are wild with projections, and three or four years later, the real constraints show up.
I remember reading projections for 20 to 30 year output for Eagle Ford wells (which is still being used for some dog and pony shows). The reality is many are money losing stripper wells after five years.
For the Permian, output increased as lateral lengths increased. They probably have found the optimum lateral length, number of frack stages, and proppant at this point and the EUR is likely to be +/- 10% of what I have estimated, though we only have 5 to 8 years of data, so perhaps the Permian will behave differently than the Bakken and other plays.
Below is an estimate for well profile of average 2013 Permian well based on 50 months of data from shaleprofile.com. I assume exponential decline after the annual decline rate falls to 9% per year, in this case at 8 years the hyperbolic decline ends and I assume an exponential decline at 9%/year after that until the well gets to 8 b/d which I assume is end of life. EUR is 170 kb. If we assume the well is shut in earlier at 12 b/d, the EUR is reduced to 168 kb. At 15 b/d shut in EUR is reduced to 155 kb.
For the average 2016 well we have less data, only 17 months, the hyperbolic well profile that fits the data has a different shape than the 2013 well, see chart below. The hyperbolic has
output=q/(1+D*b*t)**(1/b)
where t is month since first output, I use t=0.5,1.5,… to reflect mid month output.
For the average 2016 well EUR is 385 kb assuming shut in at 8 b/d, 370 kb assuming 12 b/d, and 360 kb assuming 15 b/d. exponential decline (9%/year) begins at 10.3 years for he 2016 well.
Guym,
There are potential problems with well completion rates, on that I agree, though I believe Texans are pretty smart and can resolve many of these problems.
On the sweet spots, these will no doubt run out of room, I am predicting Jan 2019 (that is in 3 months). For the Bakken in 2012 I predicted new well EUR would start to decrease in 2015 and since 2016 I have had to keep moving it forward because as of yet there has been no evidence that new well EUR has decreased (in fact it has increased up to 2017).
I will only know in Sept 2021 if 2019 average well profiles show a lower EUR, my point is that I agree it will happen, but I do not know when that will be, I only have the data to determine about 2 years after the fact.
A problem with that report was that it did not break the companies up by sector (oil or natural gas). To do the analysis properly on would need to look at revenue streams and call those companies with more than 50% of gross revenue from natural gas sales as “natural gas producers” and those with more than 50% of revenue from crude plus condensate as “oil producers”. Also we might want to weight the companies by their C+C output, many of the major oil producing companies (EOG, Continental, and Whiting) were cash flow positive in the first half of 2018. There are definitely some companies that are struggling, but the net income of this group of 33 companies has been positive since 2017Q4. Also long term debt has been decreasing over the 2016 Q1 to 2018 Q2 period ( a downward trend of about 5.6 billion per year over that 9 quarter time span.) Things may not have turned around as quickly as forecast by the IEA, but headed in the right direction, if oil prices remain above $75/b the financial position of oil focused producers will continue to improve.
There are a few companies that are financially sound.
The ones you mentioned are exceptions. However, if you look at their total production in relation to the total, you can’t see them as representing anywhere close to a big representation of the total. Most are closer to the edge. Which, is not an unusual position for E&Ps.
Those three companies only represent 14% of tight oil output in the Shale Profile data, so you are correct, even just looking at the top 40 probably only covers a portion of output (no idea what percentage). Basically 9 of 33, or 27% has positive free cash flow for the first half of 2018, this may gradually improve as oil prices continue to rise. If we see $90/b by 2020, I expect output may continue to rise for US tight oil at close to 900 kb/d each year. If oil prices drop back to $65/b, output may still rise, but at a lower rate, maybe 300 kb/d in a year.
Any guess what the price of crude would be today if we had no fracking in N. America?
Wild guess is all I’ve got, but I’m saying $142 (and much lower economic growth over the past 9 yrs- maybe even flat averaged for the whole period).
Any other speculations on this?
USA LTO is ~7.5 million bpd. That exceeds global spare capacity over demand as-is today by at least four times. So if the world was still trying to consume what it is today, we would be several million short and would have been short by seven figures for several years.
I think we would have found out if there really are any huge but uneconomical fields out there by now as the panic from that set in a few years ago. A shortage on that scale means arbitrary prices pending demand cap/destruction.
US tight oil output was about 6200 kb/d in August 2018 according to the EIA, not that the DPR includes oil from the region of tight oil plays that is conventional oil, also it is a model that is not very good so I ignore the DPR.
WAG on oil price with zero LTO output is $120/b in 2017$, plus or minus $20/b.
Canada (offshore), Hebron is expected to produce around 150,000 barrels a day, from about 40,000 barrels a day now.
2018-10-22 (The Globe and Mail) It’s been one year since ExxonMobil’s long-awaited Hebron platform off the southeast coast of Newfoundland started pumping crude from its first well. It took four years, $14 billion, 132,000 cubic metres of concrete and a few thousand workers to bring it online, and so far, it’s churning out about 40,000 barrels a day, with the crude bound for markets in the U.S. Gulf states, Europe and much of eastern North America. Eventually, Hebron will drill 20 to 30 wells, and is expected to produce around 150,000 barrels a day.
With an expected reserve of 700 million barrels of recoverable crude, the Hebron project is expected to operate for 30 years. As Newfoundland’s fourth offshore platform, it will play a key role in the province’s plan to double overall production to more than 650,000 barrels a day by 2030.
https://www.theglobeandmail.com/business/article-why-hebron-has-a-leg-up-on-albertas-oil-sands/
Hebron is already at 70 kbpd and has been for a few months. I thinks its expected annual average for oil only is 135 and it will take a year or so to get there as the coming wells will be less productive that the first ones. In the mean time the three other platforms are in decline (Terra Nova was originally due to be taken off line next year – not sure what the latest thinking is). They dropped about 35 kbpd last year but that may accelerate as Hibernia is coming off a secondary plateau.
Yes a more realistic impression of the situation than just reading the article 🙂
Petrobras presentation updated September 2018
Start-up of 19 new production units by 2022 (Although Egina is offshore Nigeria)
https://pbs.twimg.com/media/DqJQZQPX4AEyjW4.jpg
Growth expected due to the startup of new systems
93% of wells for 2018 have been completed
https://pbs.twimg.com/media/DqJP0YKWsAYEN4m.jpg
Download pdf file: http://www.investidorpetrobras.com.br/en/presentations/overview
They may have an outage on Superlight oil production as it’s down -80 kb/day over just one month.
MEXICO CITY, Oct 22 (Reuters) – Refining firm Phillips 66 was awarded a tender to supply Mexico’s Pemex with at least four 350,000-barrel cargoes of U.S. Bakken crude for November delivery, traders with knowledge of the offer’s results said on Monday.
The purchase, which will be the state-run company’s first crude import in over a decade, was requested last week to cover needed oil supply for Pemex’s 330,000-barrel per day Salina Cruz refinery amid Mexico’s falling production of light grades.
https://www.reuters.com/article/mexico-crude-tender/update-1-phillips-66-wins-tender-to-sell-us-crude-to-pemex-traders-idUSL2N1X21AP
Kazakhstan – planned maintenance at the Tengiz field from the start of October is giving the the current production dip. And then Kashagan will be briefly shut for maintenance in the spring of 2019. They’re planning to squeeze another +20 kb/day out of Kashagan.
ALMATY, Sept 26 (Reuters) – Oil output at the giant Kashagan field in Kazakhstan is set to exceed the target level of 370,000 barrels per day after an equipment upgrade next year, a senior executive from the consortium of oil majors developing the field said on Wednesday. The field will be briefly shut for maintenance in the spring of 2019. Kashagan currently produces about 350,000 barrels per day.
https://af.reuters.com/article/topNews/idAFKCN1M71YH-OZATP
Colorado voters will weigh in on whether to ban fracking on non-federal lands without a 2500′ setback.
Pretty big deal. Proposition 112 is leading in the polls, by a bit.
“This initiative was designed to mandate that new oil and gas development, including fracking, be a minimum distance of 2,500 feet from occupied buildings such as homes, schools, hospitals, and other areas designated as vulnerable.”
https://ballotpedia.org/Colorado_Proposition_112,_Minimum_Distance_Requirements_for_New_Oil,_Gas,_and_Fracking_Projects_Initiative_(2018)
The gas and oil industry is significantly outspending the bill’s proponents for ads.
The gas and oil industry is trying to give the impression that it is a significant driver of the state economy, but it isn’t. When it comes to sector/industry contributions to the state’s GDP, gas and oil come in tenth.
In terms of state non-farm employment, gas and oil only employ about 2% of the state’s workers.
Gas and oil drilling close to housing, schools, and parks is running into a major pushback. The state needs those homes more than it needs new wells.
Yes, and I am sure the 6% State severance tax on oil and gas sales will not be missed at all either. All the Boulderites that are pushing the measure drive cars, use plastic and enjoy hot water. It is a classic case of NIMBY. It is easier to ignore basic thermodynamics and economics when you live on a trust fund.
Hi Quiet One. I don’t live in Colorado, but the ‘not in my back yard’ phenomena is universal, and of course it makes perfect sense. Like most people I don’t want industrial noise, lights, chemicals, air and water pollution near where my family lives. Unless I was desperate. No other choice. I’d rather migrate.
People make exceptions if they are paid well, although still they’d certainly rather have it in someone elses backyard.
btw- living on a trust fund is a very rare thing. Maybe some in Aspen, not much in Boulder. The trust fund people are more likely owners in the oil and gas industry.
Hickory, I do live in a part of Colorado that would probably end up with drilling operations very close to my house if the industry has its way. I still cannot get myself to vote in favor of shutting down an entire industry when I ultimately use their product for nearly every part of my life. Furthermore, I also spent 30 years as a petroleum engineer, and voting for it would make me a much bigger hypocrite than the normal NIMBY proponent.
Colorado’s legacy of extraction industries has not been a good one.
Abandoned mines that leak toxic wastes.
Streets and backyards collapsing throughout Colorado Springs because they were built atop abandoned mines.
Explosions.
Storage tanks floating away in floods.
So now we have neighborhoods that don’t want more of this. It’s a zoning issue. They want to prevent industrial activities within their borders.
Yeah, there is pushback because extraction industries have done what they wanted, and then left messes for someone else to clean up.
And although they weren’t extraction industries, Rocky Flats and Rocky Mountain Arsenal provided Colorado with vast toxic sites that had to be dealt with.
So yes, Colorado residents are wary.
We have this in Germany, too.
From coal mining of the last 150 years, now finally closed.
It’s called “eternity costs” because some of them are almost as eternal as radioactive waste.
For example parts of the Ruhr area with bit towns are up to 10 meters under the level of the river Rhein – so every infrastructure only works with water pumps. Also some of the local river run backwards and have to be pumped. Otherwise Germany would have a new lake with several 100 square kilometers size.
Extra heavy levees have to be maintained at the Rhein, too. And all the old mines lead to collapses as in your country.
A map of those cities with the potential flooded areas, a few million people live there:
https://www.waz.de/region/rhein-und-ruhr/wenn-die-pumpen-stillstaenden-id12359424.html
Those areas will be flooded one day and you will have these wonderful large lakes. Like Finland.
Also it turns out Colorado has been generous to gas and oil companies when it comes to taxes.
“Among nine Western states, Colorado’s effective severance tax rate, which includes deductions, ranked second to lowest at 1.7 percent, according to the nonpartisan Colorado Legislative Council. Only Utah had a lower rate. When other state and local taxes are added, Colorado’s total effective tax rate on energy producers and miners ranks fourth to lowest at 5.2 percent, compared with an average of 6.2 percent.”
“In the midst of all the spending, lawmakers have left untouched tax deductions that the energy industry in Colorado enjoys far in excess of those offered by neighboring states. Those deductions cost Colorado an average of more than $270 million annually, according to a Colorado Legislative Council study this month.
Colorado and Wyoming energy companies took nearly identical amounts of oil and gas out of the ground two years ago, with Colorado firms extracting an amount worth $15.6 billion to the $15.1 billion extracted from Wyoming, that study found. Yet the firms in Colorado paid $811 million in state and local taxes, nearly half the $1.5 billion their peers in Wyoming paid, even though Wyoming does not have a corporate income tax. A big reason for the difference is the generous severance tax deductions allowed in Colorado, where drillers can exempt from taxation lower-producing wells and can claim tax credits for virtually all of their prior year’s local property tax.”
https://www.denverpost.com/2017/01/27/n-dakota-4-billion-saved-oil-gas-colorado-none/
Boomer, I apologize for the misinformation on severance tax. I have never worked the DJ Basin and I am surprised the find out that Colorado collects half the state and local taxes of Wyoming for very similar total revenue. Thanks for passing that on.
Lots of Americans drive SUVs, not cars. If they drove cars they wouldn’t waste so much gas. It’s a fashion choice that has nothing to do with thermodynamics. So two cheers to the Boulderites, if you claim is true.
Plastics are a single digit percentage of oil consumption, and are mostly wasted, so I don’t see why you mention them. And most hot water is not produced with oil and gas.
alimbiquated,
I have never lived in a house that did not have a gas fired furnace and hot water heater. I know there are some houses with electric heat, but they are much less common (in the Rocky Mountain region) and the monthly heating bill is higher. Therefore, I believe your comment about hot water not being generated with natural gas is just plain wrong, and arguably getting more wrong as more electrical generation is switching from coal to natural gas.
I agree with your comment that many Americans drive SUV’s (and trucks) as opposed to cars simply as a fashion (and comfort) choice. So I guess, cheers to them for driving an even more inefficient and higher fuel consumption vehicle, just as a fashion statement, all while protesting oil and gas development. You are correct. It has nothing to do with thermodynamics. All we need is one of those perpetual energy thingamajigs. Ignorance truly is bliss!
I lived without electricity or running water for a year.
Water off the roof, into split bamboo shaft, then into a 55 gallon drum.
After a while, you don’t even notice.
Good for you.
Unfortunately for me, the precipitation here has been 2 inches (5 cm) in the last year. I still have managed to collect a 100 gallons of water for the salt intolerant plants in the green house.
And this american fever now spreads in EU, too.
VW plans to build lots of electric cars in the next 5 years …
mostly SUVs …
This is completely nonsense to build this pseudo off road vehicles with litterally no offroad to go, and all these cramped parking lots and garages.
Typically even a farmer here drives a mercedes (when he can afford it) and not a jeep or pickup truck. When he works he uses his supercharged tractor – these can drive where even a pickup truck gives up.
Yep, American fever is spreading, in the form of fracking to Great Britain.
https://www.youtube.com/watch?v=QUBS-By-Tzk&t=30s
Mercedes are poor performers, get lower mpg than many SUV’s. Their highest performing 4 cylinder cars get 27 mpg combined. New SUV’s beat that in many cases.
https://www.fueleconomy.gov/feg/bymake/Mercedes-Benz2018.shtml
Although I agree, we need to go all electric, much more efficient and no oil demand.
Well a heat pump is usually electric and makes a lot of sense. Also you don’t really need to heat at all if you build a Passivhaus, even in CO.
People don’t want gas, they want a warm house. So opposing gas drilling is not hypocritical if you want a warm house. Gas is only one solution, and thinking otherwise shows a lack of imagination.
“Everything that can be invented has been invented.”
– Charles H. Duell, Commissioner of US Patent Office, 1889
I am not really arguing what could be. I am more focused on the reality of what is currently going on. What percentage of houses in CO have heat pumps or are Passivhaus? What percentage burns gas?
I am all in favor increased efficiency in home construction and heating systems. Who’s not? Personal transportation is my favorite area to find hypocritical behavior in. It is so wasteful and I can’t really tell that people even realize it or care. I guess it is easier to blame the oil and gas producer than take personal responsibility. How many people driving a Porche Cayenne or Toyota Sequoia will be voting to shut-down the local industry that provides the fuel? I saw a Jeep Wrangler 4×4 zipping down I-25 several months ago with a “ban fracking” bumper sticker. WTF? At least they could drive an electric and dream that someday the grid won’t be dependent on burning hydrocarbons (if they have enough imagination).
I will not be voting for the proposition, but I am not that dependent on the outcome personally. It probably makes sense to leave it in the ground. Future generations will likely be happy to have it.
Boomer.
I have been reading this with interest.
I appears there is also a ballot initiative 74 which would provide for just compensation from the reduction in value of real estate, including minerals, should the 2,500’ ban pass. Is this correct?
What immediately comes to mind is that if the residents are ok with fairly compensating the oil companies and mineral owners, I suppose the 2,500’ ban might fly.
If 4/5 of all non-public lands would become off limits, I suspect the damages to leaseholders, landowner and mineral owners could be enormous.
Read a little more.
74 is a constitutional amendment. Doesn’t pertain to just minerals, but to all property.
However, if Prop 112 passes and Amendment 74 passes, I predict Colorado mineral owners will be filing a lot of lawsuits against the State of Colorado.
Amendment 74 needs 55% to pass. Most recent poll has 63% in support. I will be following this for sure. Don’t know that other states will follow suit, never know.
Yes, 74 is a mess. There will be tons of lawsuits, and not just from mineral owners. Lawsuits could be filled by anyone who claims regulations lowered property values.
I wonder if it could be used by landowners who claim loss of property values due to regulations that allow environmental damage.
Some background on it.
https://www.coloradoindependent.com/2018/10/10/colorado-amendment-74-takings-just-compensation-regulation/
And this.
https://www.denverpost.com/2018/10/23/amendment-74-colorado-farm-bureau-election-2018/
This is an even better explanation. Lawyers will love it.
https://www.coloradoan.com/story/news/politics/elections/2018/10/12/colorado-election-2018-amendment-74-does-protect-property-rights-threaten-budget-cuts-ballot/1585047002/
Boomer.
I presume the minerals are usually severed from the surface in Colorado?
The surface owner and mineral owner in this situation would have competing claims, of course.
Proposition 112 increases values for surface owners that are in areas that have development potential. Decreases values for mineral owners on the same land.
It is a tough one.
Also, seems to me that Prop 112 doesn’t take into account the type of oil operations at all.
IMO 2,500’ would be overkill for operations like ours. Methane is minimal. Low volume fracks. Minimal surface equipment.
Plus, almost all of our leases are anywhere from 40 to over 100 years old. We would be damaged financially from such a ban.
Should operators and mineral owners be compensated? Was this a foreseeable risk?
Legislative risk has definitely grown for oil producers over the past few years.
I think 112 is not the best option. I would prefer to see local communities deal with setbacks individually because it would provide more flexibility. However, the state ruled there couldn’t be different rules for different areas, so this was the step that was taken as a statewide ballot measure.
Those housing developments have been essential for the growing economy in Colorado. Having drilling in the middle of them or adjacent to them has not been a good fit.
As for land owners and mineral rights owners, yes, rarely are two the same. So there’s little or no financial incentive for home owners to embrace the drilling. It’s in some folks’ backyards and they aren’t happy about it.
Classic stupid. EIA reports a total drop of crude plus products of 8 million, and the market has fits because crude is up.
EIA Weekly U.S. Ending Stocks to Friday 19th October
Crude oil up +6.3 million barrels
7 oil products down -12.3
Overall total, down -6
(From the end of Dec2017: Crude + Products is still down -2.2 million barrels)
Natural Gas: Propane & NGPLs down -1.8 (From the end of Dec2017: N.G. is up +29.9 million barrels)
Chart: https://pbs.twimg.com/media/DqSzfsEXQAAfRgj.jpg
Saxo Bank chart summary: https://pbs.twimg.com/media/DqR9IdFWoAAaVO4.jpg
Does your down by 2.2 million include the SPR draws? Because EIA is reporting a 31 million draw on total since this time last year.
I didn’t include the SPR. For anyone who is interested, SPR…
The latest week, down, -1.2 million barrels
October so far, down -3.5 million barrels (approx -1.2 per week)
From the end of December 2017: The SPR is down -7.3 million barrels
Thanks
Third quarter results are starting to be rolled out in the upstream sector.
For anyone looking to get a sense of the size of Appalachian Basin resources, slide #6 from Range gives a glimpse of what is projected/proven.
300 wells expected to produce over 40 Bcf.
Another 400 between 30 and 40 Bcf.
This is Marcellus formation ONLY.
Couple years back, Dennis, you made the comment that Cabot should expect EURs of 2 Bcf or so.
Hmmmm …
As an almost throw away comment, that slide #6 mentions a half million acres of Upper Devonian acreage not depicted on the graphic.
With several recent Upper Devonian wells – particularly Genesee and Geneseo formations – producing wells with sustained 10 MM cubic feet/day output for months ongoing, the UD is clearly amongst the most prolific on the planet.
With the 2 Big Brothers in the basement, no one is even watching this development.
Coffeeguyzz,
The comments always reference the average well profile, where you tend to pick the best 10 wells out of 10,000 and call it “typical”. Can you find the comment where I said that, perhaps you are remembering wrong. What I probably said was that the average well would have an EUR of about 6 to 8 BCF, roughly half the wells will produce more and half the wells will produce less (for wells which started producing from 2010 to 2012. I may have assumed that optimal lateral length and number of frac stages had been determined at that point. Of course if companies double the lateral length, they may get double the production per well, but cubic feet per dollar of capital spending only increases if well cost does not increase by a factor of 2 or more on the process. Has Cabot been drilling longer wells and how has it changed over time?
Dennis
Cabot has not appreciably increased lateral length due, in part, to the somewhat constrained size of their acreage.
That said, the quality of the rock is easily amongst the best on the planet.
Numbers from Enno’s site show 1,780 wells of 8,400 are already over 5 Bcf … 21%.
For comparison sake, converting to the more familiar ‘oil’ terms … 1,306 wells have exceeded 5.8 Bcf … the energy equivalent of a million barrel oil well … almost 16% of the total in Pennsylvania alone.
It is said that over 30 Bcfd is now flowing out of Appalachia with the recent additions of takeaway pipelines.
These types of numbers will accelerate the adoption of natgas over alternative fuels, particularly oil based.
Next week, Mariner East 2 may be operational with 275,000 bbld NGLs heading to Marcus Hook, along with the 70,000 bbld on Mariner East 1.
Lordstown Energy Center in Ohio just came online.
Near thousand Megawatts fueled by cheap Utica gas.
Yesterday, your Maine PUC just postponed till next Wednesday decisions on the crucial Clean Energy Connect, aka Maine’s version of Northern Pass, aka another extension cord for Massachusetts.
Observers are saying it could cause a huge delay or, potentially, derail the line completely.
While I wish you the best with your new Tesla, both the availability and cost of electricity in New England the next several winters may be a lot more precarious than many currently recognize.
“the quality of the rock is easily among the best on the planet”
When you say things like this it hurts your credibility.
You are not doing yourself any favors.
RT
Cabot has almost 400 wells of their 600 total already exceeding 5 Bcf in output. Virtually all of the remaining 200 are newer wells with way higher production profiles.
Of the top 40 wells in Susquehannah county with record per day flow rate, Cabot has 34 … all exceeding 20 million cubic feet per day.
4 of these have been online over a year including the Howell 8 with 11.4 Bcf cum in 403 days.
T Flower 2 produced over 21.4 Bcf in 5 and a half years … still flowing 3 MMcfpd.
Cabot is projecting 4.4 Bcf per 1,000 foot of lateral for their future wells, about 40 billion per.
If numbers like these do not constitute extraordinarily high quality rock, I do not know what would.
You said “the quality of rock is easily the best on the planet”
I am not a geologist, but I do put my own money into drilling oil and gas wells. What constitutes rock quality is porosity and permeability. Comparing shale. Any shale. The best shale, to any of the world class fields is ridiculous.
There is a reason they drill hz and put massive fracs on them and it is not because the rock is easily the best on the planet.
Your statement is ignorant. With all due respect.
With all due respect, I should have qualified my statement to refer to unconventional development, that is, shale or tight sands.
Reservoirs – including North Dome/South Pars – will always contain way more hydrocarbons per square mile than shale/LTO by their very nature.
However, as unconventional transitions into ‘conventional’ in the US (check out the rig count), both the size and the economics will accentuate increased focus on the best areas with a ripple effect to more outlying regions.
This is already happening.
Getting back to Cabot, Susquehannah county, and the vast Appalachian Basin overall, there exists here a gaseous hydrocarbon resource that will be acknowledged in the coming years as the biggest in the world … bigger than Pars when all the known horizons are evaluated by the USGS and other organizations.
Mr. Coffee, for people like Mr. Hightower and myself, you are insulting and disrespectful to 150 years of oil and gas history and folks that actually have to go out and look for, and find hydrocarbons. The shale industry is less than 18 years old; it cannot function without credit and the extent of its geological/engineering expertise is to see how close it can drill those lousy wells without ruining other nearby wells. Shale represents the bottom of the barrel in America; its expensive and unprofitable as hell. It is actually some of the lousiest “rock” in the world and its getting gazillions of dollars thrown at it…because that is ALL there is left.
North Dome and Pars in the Persian Gulf will be fully developed for 1/1000th’s the cost of 50,000 lousy shale wells in the Appalachian Basin. Here is an oil field in the ME, with some real rock, that will out produce all shale basins in America by itself: https://www.oilystuffblog.com/single-post/2018/03/20/The-Perfect-Oil-Field.
Your message is falling on deaf ears. You are not waking people up to the wonders of shale, it does not appear to me. Nobody is buying your chili.
Good morning, Mr. Roughneck.
My ‘message’ consists of little more than communicating verifiable information that anyone can double check and draw their own conclusions.
While you – or anyone – can interpret my postings as insulting, I choose to leave inaccurate, condescending bluster to others who seemingly prefer to misconstrue what a blind man can see occurring right before them, that is, a profound transition is taking place in the oil/gas upstream world whereby previous non recoverable resources are now being accessed.
Your 2 points of non profitability and ‘bottom of the barrel’ descriptions are being disproven on an ongoing basis as this year’s reporting by the main operators continually show.
Please spare me the ‘studies’ that are continuously rolled out like the recent one with 33 (?) operators showing cum quarterly losses of just under $3 billion.
Not only was that conflating capex with operating costs, 2 of the 33 (Anadarko and Noble ?) alone were about 1/3 the total. 4 others, IIRC, provided another billion or so more.
I read through most of these types of reports to constantly evaluate biases/prejudices of both myself and the authors. Enlightening though they can be, these ‘analyses’ often portray data in the most skewed fashion so as to produce hilariously incorrect assumptions.
(The most recent one by that Steve guy being just one example).
Whatever one brings to the table of trying to understand this world of unconventional development … be that individual a Teutonic investor, a Down East environmentalist, an unabashed Okie ‘tea’ totaller, or a long term South Texan oilman, using clear, unvarnished data alongside with astute evaluation will clearly show that US unconventional production will extend for decades regarding oil and multi generations regarding natgas.
Anyone wishing or expecting otherwise will continue to be shown wrong.
Coffeeguyzz,
You give numbers like 40 BCF. Those mean nothing. How many wells have actual cumulative production (rather than “expected” UR) of 40 BCF?
The average 2013 Marcellus well ( 1000 wells) that has reached 60 months 0f cumulative output has produced and average cumulative output of 4 BCF. The newer wells may be a little more productive, though decline is steeper and probably only 2 to 3 BCF will be added to UR, so 6 to 8 BCF per well is probably pretty realistic.
The pipeline project is to serve Massachusetts, in Maine much of the heating in rural areas is with oil and propane as population density is too low for many areas to get natural gas. This is true in much of the rural US.
I came across an investment paper prepared by Altacorp which looks into the currently high differentials for Canadian heavy oil. The basic premise is that the Canadian oil is stranded because of a lack of takeaway, but that this heavy oil is much needed by the refiners because of shale’s lack of distillates. While this does not directly effect peak oil the mix of oil types and prices is of interest to some on this forum.
https://www.dropbox.com/s/q4lp8ch3vdv2bvy/AltaCorp%20Canadian%20Heavy%20Oil%20-%20CVE.pdf?dl=0
Keystone XL might be operating in the not too distant future.
Canadian heavy shipped right to da Guf.
Upstream players need to boost spending to meet future demand
https://www.woodmac.com/press-releases/upstream-capital-investment/
Wood Mackenzie forecasts that global oil and gas development spend needs to increase by around 20% to meet future demand growth and ensure companies sustain production next decade.
…
The result is a corporate sector divided in two: the US tight oil “haves” with a strong outlook for investment and growth; and the “have nots”, the majority of which face a looming production challenge next decade.
I feel like I’m in two parallel worlds. In one climate change is going to cause widespread catastrophe unless we do something and in the other (where apparently almost everyone lives, certainly everyone in the oil industry) all that matters is growth. Maybe they have some of those peril sensitive sunglasses from The Hitchhikers Guide to the Galaxy that go black when inconvenient news is reported. Really the article heading should be: “Oil industry still overinvesting and needs further reductions if civilisation is to be saved.”
Alternatively party like there is no tomorrow. Because there isn’t!
I have my doubts about the future at so many levels.
1. Insufficient planning for climate change.
2. Mounting expenses as a result of damage caused by natural disasters.
3. Increased military spending which either isn’t going to be used and is money poorly spent, or is going to be used setting off potentially years of war.
4. A business-as-usual view among big companies, economists, and the financial system.
5. Right wing nationalism and dictatorships spreading across the globe.
6. Migration of people to places that don’t want them.
7. Clean water issues.
8. Peak oil and not enough planning to deal with it.
I’m not hopeful.
The phenomena that is most striking to me is how so much of the population can simply ignore the issues. Being able to live with cognitive dissonance and denial really does look like it was an important evolutionary step for us (though ultimately also destructive).
9. 83,000,000 more people on planet Earth every year.
“Really the article heading should be: “Oil industry still overinvesting and needs further reductions if civilisation is to be saved.”
That’s a nice philosophical musing and all that, but, let’s be realistic, we both know consumer demand for natural resources isn’t going to let up in the next decade. If I were making big money investment decisions, the Wood Mackenzie report is where my focus would be.
International Energy Agency – Oil Market Report: 12 October 2018
now available to non-subscribers
download from here: https://www.iea.org/oilmarketreport/omrpublic/currentreport/
Charts of OECD inventories
Gasoline & Middles: https://pbs.twimg.com/media/DqcgD3PXcAIsiyb.jpg
Crude oil + major products: https://pbs.twimg.com/media/Dqcgb95XQAA1cE8.jpg
Baker Hughes US Rig Count
Oil: +2 to 875
Natural Gas: -1 at 193
Permian: -1 to 489
Williston: +4 to56
Table: https://pbs.twimg.com/media/DqczKbGXgAAk2nz.jpg
Baker Hughes GE: http://phx.corporate-ir.net/phoenix.zhtml?c=79687&p=irol-reportsother
GoM oil rigs are pretty low suddenly – in fact the BSEE overall deep water activity report is down to only 30 at the moment, the lowest I’ve ever seen it after averaging closer to 40 for the last year (it shows all well activity including work overs, not just active drilling which is 13 oil and 5 gas by BHGE).
Another thing why demand is a bis lower than it should be:
Germany is tapping its national reserve instead of importing oil.
Why?
The hot and long summer, going into a hot and dry autumn, has emptied the rivers. Lots of oil is transported there – and now the ships can only load 20% of their normal cargo. So the reserve is tapped.
I think it will be refilled afterwards.
I have it only on german, take google translate when you want to read it:
https://www.focus.de/wissen/natur/duerre-in-deutschland-oel-route-trocknet-aus-jetzt-muss-deutschland-seine-oel-reserven-anzapfen_id_9803769.html
Yes, there is nothing suggesting that demand is tethering at these oil prices (75-85 dollars/barrel). It is still too low, even if the dollar exchange rate is high for some countries. The much more likely scenario is destocking of inventory to avoid to high prices, where that is an option. And destocking can go on for quite a while; a deficit of 2mill barrels/d globally means 180 mill barrels less a quarter, 360 mill barrels less for half a year and 720 mill barrels for a full year. And this suggests it can only go on for so long, if this thesis is the right one. A hint to look for is that inventory build during low demand season in first half of 2019 turns out to be lacking (I think Saudi Arabia is hard hit at some point having to cope with increasing decline rates and for political reasons destocking hard at the same time).
Yes Switzerland is releasing fuel too
2018-10-26 (Reuters) Earlier this week, the Swiss government had also authorized the temporary release of diesel from the country’s compulsory stockpile after low water levels on the Rhine reduced supplies to the country.
https://uk.reuters.com/article/uk-germany-oilreserve-release/germany-releases-oil-product-reserves-to-ease-strain-from-low-river-levels-idUKKCN1N01AK
2018-10-22 (Bloomberg) The Rhine river level is at a low, making nearly impossible the shipment of refined oil products by barge. The water level at the choke-point of Kaub fell this morning to 24 centimeters, something unseen in at least 15 years.
Bloomberg chart, Rhine water level: https://pbs.twimg.com/media/DqGr3-2WsAAWB2P.jpg
ARA Gasoline Inventories, high for this time of year, chart: https://pbs.twimg.com/media/DqXuUpBX0AAzqdy.jpg
Chart from Oilytics on Twitter: https://twitter.com/OilyticsData
I received a mailing from a brokerage company.
The ten year return for $10,000 invested ten years ago for the indexes and some energy and non-energy stocks:
Dow $24,606
S & P 500 $25,189
Baker Hughes $9,848
Chevron $21,907
ConocoPhillips $21,323
EOG $30,880
ExxonMobil $14,681
OXY $17,548
Pioneer $35,796
Schlumberger $9,743
Amazon $288,066
McDonald’s $35,753
Coca Cola $23,297
Proctor & Gamble $16,119
3M $40,855
General Electric $7,045
Apple $164,505
Microsoft $56,069
Ford Motor $27,393
O’Reilly Automotive $119,920
Nike $129,506
Didn’t find Tesla on the list, but presume it outperforms most, if not all of the above. Did find mention that from 2010 to its all time high, $10,000 became slightly over $220,000.
Is there a multi year ratio for exploration spending to production (or even discoveries)?
I’ll bet it varies so much that there is no meaningful ratio.
Today’s Wall Street Journal suggests the fracking boom won’t last.
——-
“While this has helped the world meet rising demand for years, it cannot go on forever. Signs are mounting that shale won’t keep growing at the same rate in the U.S. Drillers face pipeline bottlenecks moving crude out of West Texas. This week, Halliburton Co. Chief Executive Jeff Miller said its oil-producing clients were facing ‘budget exhaustion’ and he expected some to take extended breaks from drilling new shale wells. That is coinciding with warnings of plateauing, or even declining, production elsewhere in the world.”
“For years, shale helped keep enough spare capacity in global markets that volatility began to feel like a relic of the past. In the years to come, the world may no longer have that shale shock absorber, ending a relatively peaceful decade in oil markets.”
Well, luckily all the worlds citizens and governments have used this “relatively peaceful decade in oil markets.” to save up lots of money and reduce debt loads so they can whether the coming decade of peak oil.
Some Weekly Products Inventories, the list is on the chart.
Down -6.1 million barrels week/week
https://pbs.twimg.com/media/DqgIk3ZX0AAWNbm.jpg
Products inventories, down -6.1 million barrels week/week
Crude oil (Japan + USA): up +7.1 million barrels week/week
https://pbs.twimg.com/media/DqgI03QXgAAmMuv.jpg
Products Inventories, split: Light & Middles
https://pbs.twimg.com/media/DqgJZoGX4AA9VLB.jpg
Fuel hubs (ARA + Singapore), total products, seasonal
The monthly figures from the OPEC MOMR and the latest weekly figure for October
https://pbs.twimg.com/media/DqgKGLvXQAArRVG.jpg
The official production numbers reported (so far) for September
Changes month/month (units: kb/day)
Russian Federation +142
China -75
OPEC15 +132
Oman +15
Colombia +3
Norway -195 (maintenance)
India -4
Mexico +9
Chart: https://pbs.twimg.com/media/DqgUXVZXQAEoaXN.jpg
2018-10-27 Petróleo Brasileiro produced in Brazil during September 1,878 kb/day of crude oil, condensate and NGLs, down nearly -2% from 2,014 kb/day in August
A reduction in the oil production mainly due to the maintenance stoppage of the P-57 platform, located in the Jubarte field, and P-52, located in the Roncador field, both located in the Campos Basin.
http://www.investidorpetrobras.com.br/en/press-releases/oil-and-natural-gas-production-september-2
2018-10-24 (Shell) production is underway today at Lula Extreme South in the Brazilian Santos Basin, with the start of the new FPSO P-69.
Brazilian oil production chart: https://pbs.twimg.com/media/DqhBD0SW4AAZesK.jpg
Shell and BP pumped up by oil prices
Giants amass cash for share buybacks and dividends
Behind a paywall in the Sunday Times – the gist seems to be the oil companies have lots of cash but won’t be spending it so much on new exploration or development, more on dividends, buybacks and M&A (like BP has already spent for BHP US LTO assets), partly because or worries over possible future price drops (such articles are never allowed to say that there may not be many attractive exploration or development prospects even at current prices but that’s what it comes down to if the share price is better served with buybacks).
Buybacks have become a less popular way to return capital to shareholders. This is over the last 18 mos, not limited to oil. Dividend increases are replacing buybacks.
If you buy back shares for too long, your company shrinks. You also run out of willing sellers, especially since Sovereign Wealth Funds own so many shares of everything now. They just don’t sell.
So you jack dividends instead.
Maybe worth noting that all companies in all industries decided to do this (share buybacks starting 15 yrs ago) because they could not find ways to grow in which they could invest money. Just like not spending on exploration.
I look at the major to see what their perception of the future holds.
And I think they see more value in giving the money back rather than sinking it into more projects. They can’t openly say there aren’t a lot of opportunities, for fear stock prices will go down, but they can get as much cash out of their companies as they can before it becomes widely evident that the age of oil is on the decline.
Canada – some data reporting trivia…
The EIA in their international data (MER too) seem to have used an estimate for Canada’s July production number, released Oct 26th. And yet Statistics Canada had already released an offical number by Oct 12th. The two numbers are 531 kb/day different. Maybe it’s just a typo but I seem to remember this happening before. The EIA always revise their number to the Statistics Canada number the following month.
July C+C
EIA: 3,783
StatsCan: 4,314
Moody’s says oil service debt ‘unsustainable’
https://www.chron.com/business/energy/article/Moodys-says-oil-service-debt-unsustainable-13344946.php
With limited options to restructure their debts or bring in new investment, the only option left to many companies is to cut expenses or generate more cash. “The volatile nature of (oil service company) earnings makes current debt levels unsustainable in the long term without a substantial improvement in cash flow,” the report reads. “The beleaguered offshore (oil field services) segment is probably years away from rationalizing and fully recovering.”
I don’t know if the debt was taken on mainly following the price crash or they have continued to load up expecting a recovery to the boom years type activity. With so few discoveries now I don’t see how offshore is going to recover, whether “years away” or not.
OPEC Should Boost Crude Production at Next Meeting, the IEA Says
https://www.oilandgaspeople.com/news/17463/opec-should-boost-crude-production-at-next-meeting-the-iea-says/
“Global oil markets are going through a very sensitive period — global economic growth as well,” IEA Executive Director Fatih Birol said in an interview in London Thursday. “If the oil producers care about the health of the growth of the global economy, which I believe they do, they should take the steps to further comfort the market.”
Without an increase in output from the Organization of Petroleum Exporting Countries, Birol reiterated his warning the global economy will enter “a red zone” because momentum is already slowing amid trade disputes. The world still needs more oil to compensate for losses from Iran and Venezuela, he said.
So there’s at least one economist who thinks oil prices have a big and immediate impact on the global economy. It doesn’t say where he thinks the spare capacity might be – presumably he is really talking to Saudi. I don’t think anybody is going to act on his request alone, and he probably knows that, so really it’s just about optics for the IEA.
Earlier this year IEA were saying supplies would be OK in 2019 and tighten in 2020, presumably most of the change is from Iran, but even if a 2019 shortfall can be averted it probably makes things worse for 2020. Despite a lot of small FIDs this year UK will start declining again in 2019, and more so in 2020, some Asian countries look like they may start accelerating decline as well, reports also indicate Russia is likely around it’s peak, Oman is on plateau or shallow decline, I think Nigeria may be struggling late in 2019, Canada will probably plateau.
There hasn’t been a time since OPEC started when there hasn’t been some spare capacity (whether real or imagined – either way it probably has some dampening effect on price volatility) and there was always an assumption that if it was lost things could go haywire in a hurry, we might be about to find out.
George Kaplan.
I agree with you, which is why my expectation is that a high oil price scenario is more likely, possibly $90/b by May 2019, with maybe $100/b by late summer 2019, then we will see if Permian output is able to fill the gap (I doubt it) as new pipeline capacity comes online in the fall of 2019, likely to be too little too late in my opinion and oil goes to $120/b by 2020, eventually we might see a bit of extra output at higher prices (or at least more than would have been the case at low oil prices), but at best a plateau in World output or slow decline may be the higher probability scenario.
Also it is certainly the case that high oil prices may reduce the rate of economic growth, perhaps to the point that a World recession is reached.
According to Wikipedia:
The International Monetary Fund defines a global recession as “a decline in annual per‑capita real World GDP (purchasing power parity weighted), backed up by a decline or worsening for one or more of the seven other global macroeconomic indicators: Industrial production, trade, capital flows, oil consumption, unemployment rate, per‑capita investment, and per‑capita consumption”.[1][2]
According to this definition, since World War II there were only four global recessions (in 1975, 1982, 1991 and 2009), all of them only lasting a year (although the 1991 recession would have lasted until 1993 if the IMF had used normal exchange rate weighted per‑capita real World GDP rather than the purchasing power parity weighted per‑capita real World GDP).
This definition was actually invented in 2009, prior to that Global real GDP growth of less than 2.5% was considered a Global recession, according to article below,
https://blogs.wsj.com/economics/2009/04/22/whats-a-global-recession/
Looking at real GDP growth for the World from 1960 to 2017 using market weighted exchange rates there were 3 years over that period with World real GDP growth of less than 1% 2009 (-1.68%), 1982 (0.51%) and 1975 (0.9%). So a simpler definition of a Global recession might be real GDP growth at market weighted exchange rates of less than 1%, and perhaps a global depression could be defined a set of consecutive years (2 or more) with real global GDP growth of under 1%.
Kazakhstan’s oil production
It looks like the Tengiz field (and Karachaganak?) is coming back from planned maintenance in October.
In 2019, the Kashagan field will be briefly shut for maintenance in the Spring.
The oil minister said, production is planned to average 1,880 kb/day in 2019 (which is approx the same as H1 2018)
Daily chart https://pbs.twimg.com/media/Dqvr2E8W4AUfGxD.jpg
EIA long term monthly chart https://pbs.twimg.com/media/DqvwUiTWsAEhId1.jpg
Update on IMO2020 0.5% sulfur fuel for shipping…
October 29, 2018 (Platts) If any doubts remained that the International Maritime Organization’s tighter sulfur emission limits for ships in 2020 could be delayed or otherwise watered down, those doubts should have been laid to rest at a key committee meeting of the UN body last week.
.
Last week’s MEPC meeting also adopted another measure designed to help with enforcement of the new sulfur limit – a ban on the carriage of non-compliant fuels, now coming into effect at the start of March 2020. – The carriage ban empowers port states to check whether the vessels leaving their waters have sufficient 0.5% sulfur fuel for their entire journey.
http://blogs.platts.com/2018/10/29/imo-meeting-eliminates-doubts-over-2020-delay-fuel-for-thought/
Estimates for August US Crude Oil Production (EIA 914 Survey due Oct 31st)
EIA STEO (Oct 10th): 11,051 (1000 barrels per day)
EIA Weekly average for the month: 10,958
EIA Weekly average for Line 13: +196
IEA, Oil Market Report, estimate: 10,946
EIA 914 Survey, July: 10,964
October 30, 2018 (Rystad Energy) On the eve of publication of the EIA-914 and EIA PSM reports tomorrow (October 31), providing US monthly oil production data for August 2018, Rystad Energy analysis indicates that the market should expect significant outperformance of US oil production compared to the EIA’s predictions.
Gulf of Mexico = The growth is largely driven by Anadarko and Hess, which exhibit a combined jump in operated oil production of 66,000 bpd in August amid completion of temporary field maintenance as very limited volumes come from new wells.
Lower 48 states = The most recent data shows that wells and leases with complete reporting through August 2018 generated collective additions of 112,000 bpd from July to August.
https://www.rystadenergy.com/newsevents/news/press-releases/US-oil-set-to-beat-EIAs-forecast-again-11.15-million-bpd-is-low-case-for-August/
Long term chart https://pbs.twimg.com/media/DqxudEMUUAAYOrf.jpg
From second to last paragraph …
“Even in a scenario of $55 per barrel we see US oil output growing to 16.5 million bpd by 2030.”
The sort of flashy, unqualified analysis like Rystad’s, made without regard for where this vast amount of oil actually is (phfttt on Hamm and his recent Bakken bullshit), fresh water, sand, employment, produced water and earthquakes, political headwinds, like 95% of the world being pissed off about climate change, trade wars, declining exports, rising costs, wasted associated gas, recessionary fears, questionable demand, alternative fuel source development, past, present and future bankruptcies, M&A’s, like the really stupid one between CHK and Wild Horse, or the one between Denbury and Penn Virginia that left PV’s stock holders with NOTHING, and finally, drum roll please….where in the bloody hell all that money is going to come from to make all that imaginary production growth really occur, is really right up your narrow minded alley, ain’t it, Coffee? It must plum give you goose bumps to read this Rystad stuff. And least us never forget, if its on the internet it must be true, right?
Ignorance is bliss, hand.
https://www.zerohedge.com/news/2018-10-30/energy-junk-bonds-tumble-dragging-high-yield-spreads-2018-wides
Yep. They just can’t quit trying to grow production at any cost.
Share prices of these names have been hammered.
Has been such a relief this year to have better oil prices. Always worry that they won’t last and the shale people will do their part to kill them.
Hoping I don’t see WTI below $50 ever again. $65 for a few years would be ok.
Don’t think shale would ever do that great at $65 WTI. Tough to maintain production and pay down the debt at that price, especially as rates move higher.
Tariffs going to bite. Big spread between WTI and Brent. Farmers getting hammered on grain. Another farm crisis could be coming. At some point, land prices will have to drop, and the crisis will begin. That was the big shoe to drop in the early 1980s. Land fell up to 60% in Midwest. Soviet grain embargo played a big part. History repeating itself?
Its important to remember that cheerleading for the unconventional shale industry to succeed in the United States is no longer a matter of nationalistic pride, as some people clearly think. We can do nothing more with light tight oil in America other than what we have already done with the shit; refineries don’t want it anymore. So any growth from here on out is…leaving our nation forever. Its gone. Exported to bumfuck Eqypt or somewhere, for what? It does America no good other than to provide some jobs, fluff the pillow of CEO’s and Wall Street, and make 1/1000th of the America population that are lucky enough to own minerals, even wealthier.
That’s it, story over. No more affordable oil, gone. Then we’re begging OPEC for help again.
So, what good did you really do your fellow American for all that stupid cheerleading and speculating, and guessing, and modeling based entirely on what ifs? You did nothing more than create a false sense or security for others, or confusion, for little reason other than to feed your own frail ego. To feel important.
The shale biz, oil and gas, is a business/ financial disaster.
Mike,
My models are simply to show what might happen. Note that your speculation is also a “what if”, unless you have some secret insight into what the future holds.
Consider that whether the oil gets used by the US or someone else is not really relevant, it is a World oil market and the oil will move to the refineries that can process the oil most efficiently, whether those refineries are in the US or not makes little difference. All that matters is whether the companies can make money or not, at low oil prices we are in agreement that the tight oil producers will lose money. My guess is that oil supply will be less than oil demand at low prices and this will tend to increase the price of oil over time, but my guess may well be wrong.
Note that my best guess (medium scenario) is about a 4 fold lower increase in US oil output relative to the Rystad high oil price case (which is similar to the “low oil price” case I presented.)
Mike,
Agree that Rystad’s estimate for future US output is likely too high at the price levels they predict. At $55/b my expectation is that US tight oil producers would struggle to maintain current levels of output, at $75/b we might see a modest increase in output.
For the Permian basin and my “low oil price scenario”, I get the following scenarios with low to high TRR (based on USGS estimates), with well completion rates depending on profitable wells based on economic assumptions (9.5 million well cost in 2017$ and nominal annual discount rate of 9.5%), discounted net cash flow over the life of the well must be positive for given oil price assumption with the oil price is the Brent oil price in constant 2017 dollars.) If most of the US increase in output is from the Permian basin and current output is about 2750 kb/d, then the medium case (USGS best guess) would result in about a 900 kb/d Permian basin increase in output, if this is 70% of the US total increase in output (recent results are about this amount), then US output would invrease by about 1300 kb/d to maybe 12.3 Mb/d by Sept 2020, that would be the peak for US output under this oil price scenario and for the F50 TRR case (labelled med TRR on the chart).
An update on Venezuela
2018-10-30 (Argus Media) Chinese, Russian officials in Caracas for debt talks
https://www.argusmedia.com/en/news/1782713-chinese-russian-officials-in-caracas-for-debt-talks
Hi All,
Any ideas when world peak production will occur? I’ve been reading 2040, is that about right?
One evaluation in this blog
http://peakoilbarrel.com/world-oil-2018-2050-world-energy-annual-report-part-2/
IIRC, about 2021 global.
Sean,
I would expect 2025+/-3 years, potentially a plateau in output might be maintained from 2025 to 2030 at about 85 Mb/d of C+C output, see EIA page below for C+C World output numbers. Click on the International Petroleum tab, then Table 11.1b for World C+C output.
https://www.eia.gov/totalenergy/data/monthly/
The trailing 12 month average World C+C output is about 81.7 Mb/d, I expect the peak oil output level will be 83 to 87 Mb/d, the higher the peak, the shorter will be the plateau near the top, in other words the 2025 to 2030 plateau scenario is more likely to be at 83 Mb/d than at 85 Mb/d.
Much will depend on the price of oil and the state of the World economy, these are difficult to predict with any accuracy.
So far the peak occurred in November 2016. It is yet to be determined if we exceed that peak in the future.
If one focuses only on a single month you are correct, I use the trailing 12 month average of World C+C output, the highest point is July 2018 at 81,721 kb/d (latest data point).
2018-10-31 (Bloomberg) U.S. *net* imports of crude oil and refined products down last week to only 1.2 million barrels a day (the lowest in weekly data going back to 1991, and compares with a peak of 14.3m b/d in 2005). Bloomberg chart: https://pbs.twimg.com/media/Dq2CDVcW4AE4wMq.jpg
EIA overview pdf file: http://ir.eia.gov/wpsr/overview.pdf
Saxo Bank chart summary: https://pbs.twimg.com/media/Dq1_5pOW4AAaInk.jpg
Long term chart, U.S. net imports of crude oil and refined products
https://pbs.twimg.com/media/Dq2QZQkXQAASvHQ.jpg
EIA: US crude oil production rose +416 to 11,346 kb/d in August vs July 10,930 kb/d
(July revised from 10,964)
Texas +126 to 4,577 kb/day
New Mexico +55 to 724 kb/day
GoM +74 to 1,918 kb/day
https://www.eia.gov/petroleum/production/#oil-tab
U.S. Ending Stocks for the month of August (million barrels)
Crude oil -2.5, Total products +5, Overall total +2.5 (shown on chart)
LPG +16.8 (not included in chart)
Chart: https://pbs.twimg.com/media/Dq30l-ZWsAEi3i7.jpg
US & Europe monthly inventories up to August. With the weekly number for October 26th for the USA
https://pbs.twimg.com/media/Dq35I3cWoAAnof3.jpg
Canadian pipeline bottlenecks
2018-10-31 (Bloomberg) Tanker trucks laden with oil are journeying almost 500 miles (800 kilometers) to pipeline and rail terminals.
Almost 230,000 barrels of crude were exported by truck in August, the most in data going back to January 2015, according to data provided by Statistics Canada.
A record 229,544 barrels a day exported on trains in August, National Energy Board data shows.
https://www.bloomberg.com/news/articles/2018-10-31/canadian-producers-turns-to-oil-trucks-as-supply-glut-grows
The Scotiabank Commodity Newsletter – pdf file: http://www.scotiabank.com/content/dam/scotiabank/canada/en/documents/18/10/SCPI_2018-10-31.pdf
30 October 2018 – IEA – World Energy Outlook 2018, which will be released on 13 November.
In a sign of great progress, over 120 million people worldwide gained access to electricity in 2017. This means that for the first time ever, the total number of people without access fell below 1 billion according to new data from World Energy Outlook 2018.
.
Updated data from the World Health Organization and the IEA’s Energy Data Centre also show that the number of people without access to clean cooking facilities has begun to gradually decline, in part due to an increased reliance on liquefied petroleum gas (LPG) and on improved biomass cookstoves.
https://www.iea.org/newsroom/news/2018/october/population-without-access-to-electricity-falls-below-1-billion.html
Worldwide fossil fuel consumption subsidies almost halved between 2012 and 2016, from a high point in 2012 of more than half a trillion dollars. But the estimate crept higher again in 2017, according to new data from World Energy Outlook 2018, and the run-up in the oil price in 2018 is putting pricing reforms under pressure in some countries.
https://www.iea.org/newsroom/news/2018/october/hard-earned-reforms-to-fossil-fuel-subsidies-are-coming-under-threat.html
Of Interest – Jimmy Dore Show covers the US Judge blocking the Keystone XL – The dirtiest oil on the Planet will not yet flow thru the US to other countries. https://www.youtube.com/watch?v=e7OJhCkbRhk