A guest post by Ovi
Below are a number of oil (C + C ) production charts for Non-OPEC countries created from data provided by the EIA’s International Energy Statistics and updated to August 2021. Information from other sources such as OPEC, the STEO and country specific sites such as Russia, Brazil, Norway and China is used to provide a short term outlook for future output and direction for a few countries and the world.
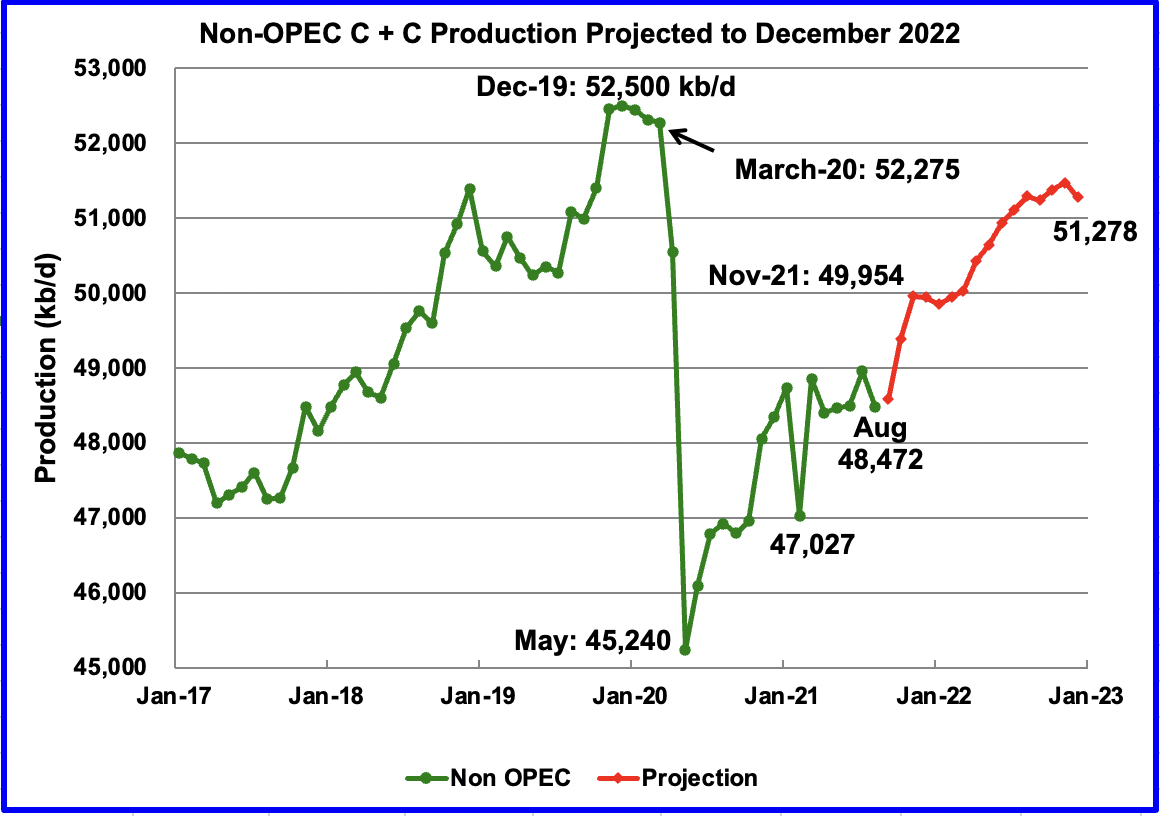
August Non-OPEC production declined by 480 kb/d to 48,472 kb/d. The three biggest contributors to the decrease were Kazakhstan, 251 kb/d, US, 185 kb/d and Canada 70 kb/d, for a total of 506 kb/d. Russian output dropped by 35 kb/d.
Using data from the December 2021 STEO, a projection for Non-OPEC oil output was made for the time period September 2021 to December 2022 (red graph). Output is expected to reach 51,278 kb/d in December 2022, which is 301 kb/d lower than reported in the previous post.
From August 2021 to November 2021, with projected output of 49,954 kb/d, an additional 1,375 kb/d of oil is expected from Non-OPEC countries. The two biggest increases occur in October and November
Each successive STEO report has reduced the forecast December 2022 output. For instance, in the August report, Non-OPEC output was projected to reach 52,213 kb/d in December 2022, which is 935 kb/d higher than projected in this report.
In the previous November report, the difference between the peak production in 2019 and 2022 peak was 921 kb/d. In the current report, the difference has increased to 1,222 kb/d.
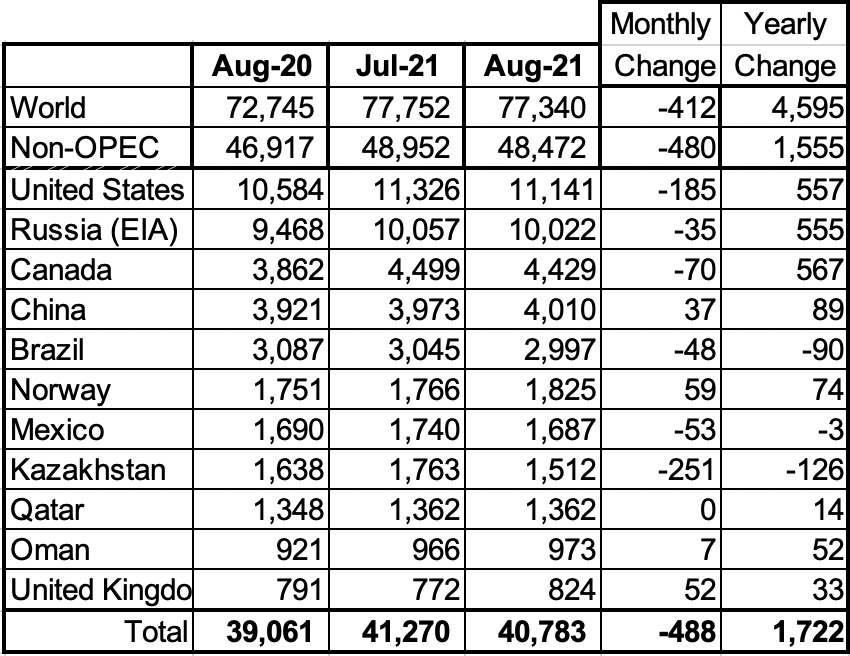
Above are listed the world’s 11th largest Non-OPEC producers. The original criteria for inclusion in the table was that all of the countries produced more than 1,000 kb/d. The last two have currently fallen below 1,000 kb/d.
In August, these 11 countries produced 82.7% of the Non-OPEC output. On a YoY basis, Non-OPEC production increased by 1,555 kb/d while on a MoM basis production decreased by 480 kb/d to 48,472 kb/d. World YoY August output was up by 4,595 kb/d.
Production by Country
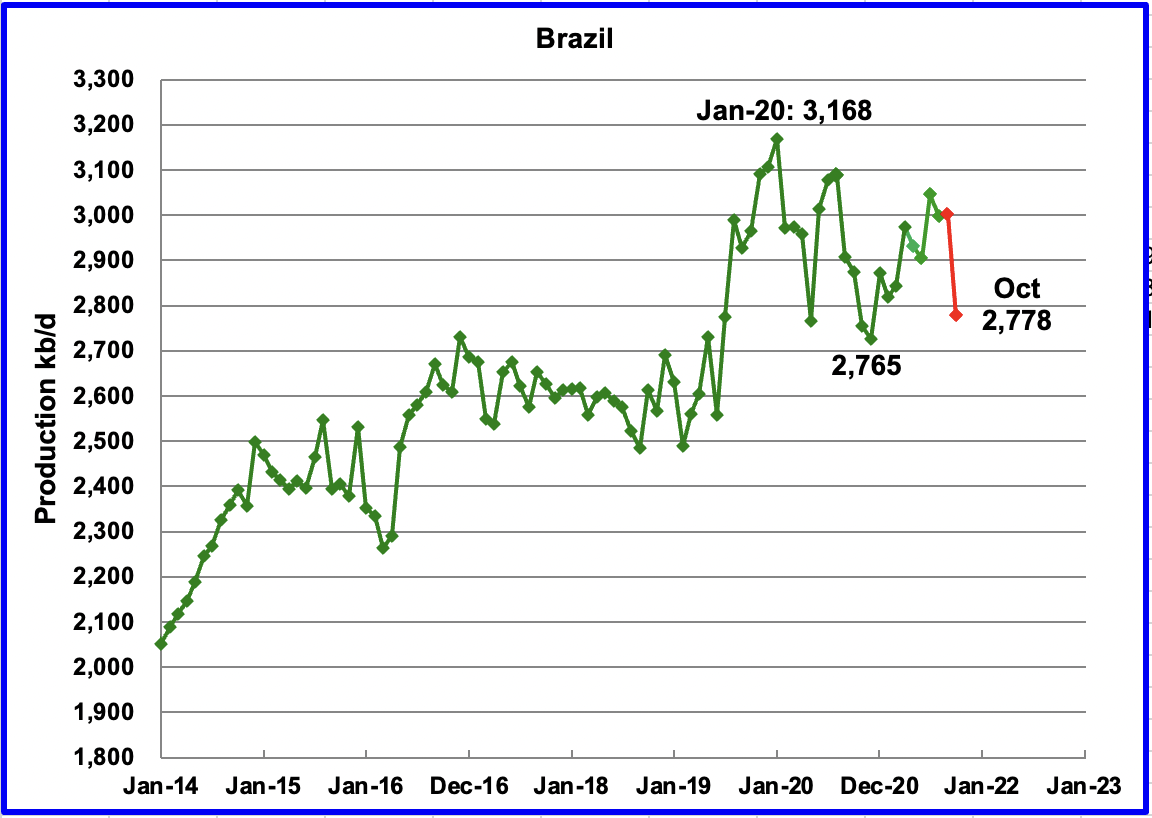
The EIA reported Brazil’s August production decreased by 48 kb/d to 2,997 kb/d. September increased to 3,001 kb/d according to this source and then dropped by 223 kb/d to 2,778 kb/d in October. (Red Markers).
According to OPEC, production in October declined mainly due to maintenance in the P-76 FPSO in Buzios field. Maintenance has impacted crude production this year and this is expected to continue until the end of year.
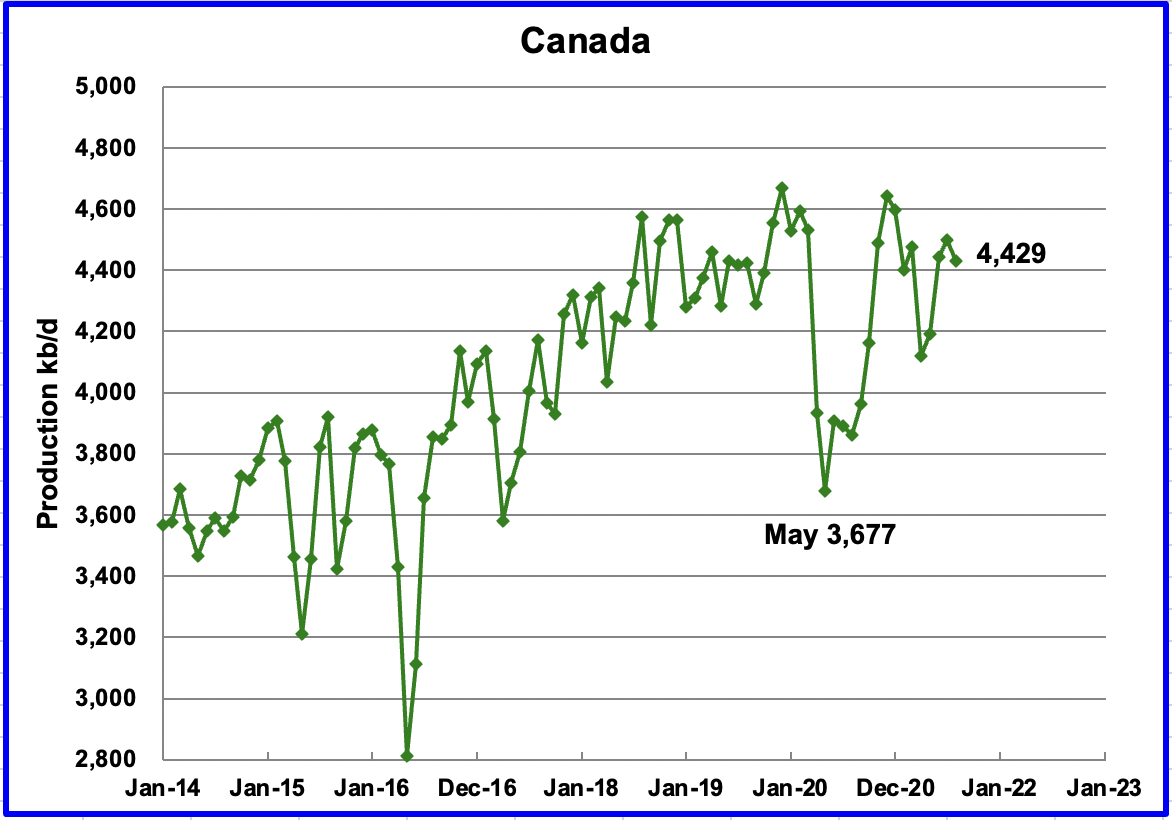
According to the EIA, August’s output decreased by 70 kb/d to 4,429 kb/d. The Canada Energy Regulator (CER) has retracted its earlier August production numbers and consequently no estimate is available from them.
On October 1, the updated Enbridge Line 3 pipeline began operating to deliver crude to Superior Wisconsin. The new line delivers more crude and is safer since it replaces a 50 year old pipeline.
Michigan has moved its attempt to shut Line 5 from Federal courts to state courts. Canada has invoked the 1977 Canada/US treaty, which Canada claims prohibits Michigan from interfering with the operation of a cross-border pipeline.
In September Canada shipped 164.2 kb/d by rail to the US which was 4.5 kb/d lower than in August.
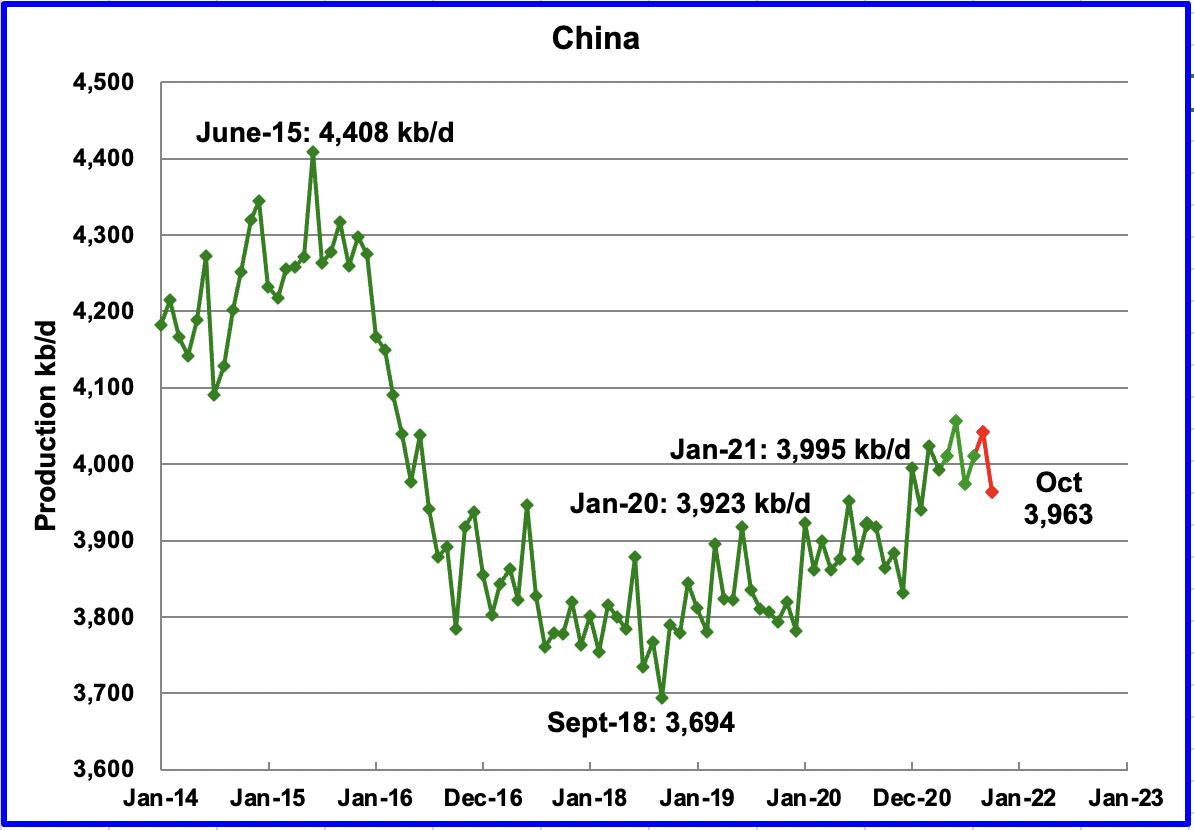
The EIA reported China’s August output increased by 37 kb/d from July to 4,010 kb/d. In September it increased further to 4,042 kb/d and then dropped 79 kb/d to 3,963 kb/d in October according to this source. (Red markers)
From January 2020 to January 2021, China’s daily output increased by 72 kb/d to 3,995 kb/d. For 2021, no growth is apparent up to October 2021. Note that October production is slightly lower than January 2021.
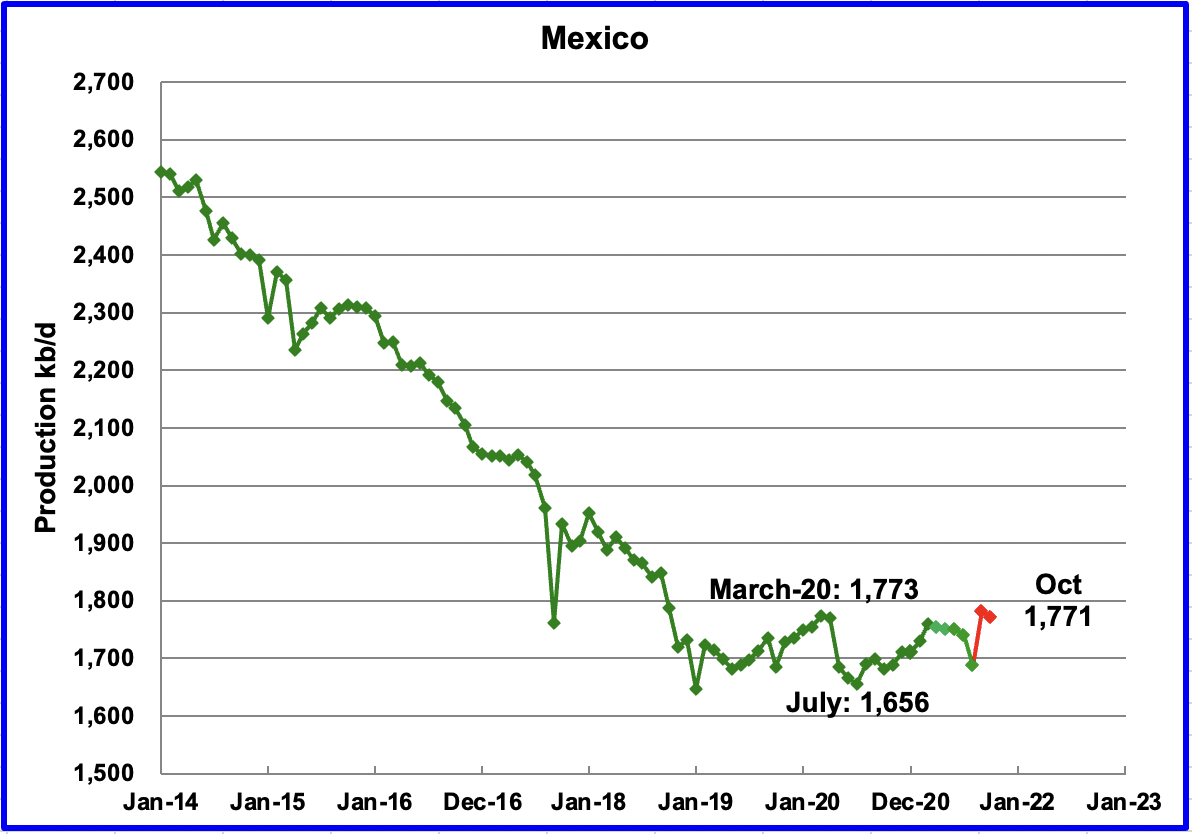
Mexico’s production, as reported by the EIA for August declined by 53 kb/d to 1,687 kb/d. Data from Pemex shows that September output rebounded to 1,782 kb/d and then dropped slightly in October to 1,771 kb/d. (Red markers).
Production has been range bound between 1,650 kb/d and 1,800 kb/d since January 2019. Note that October production is essentially the same as March 2020.
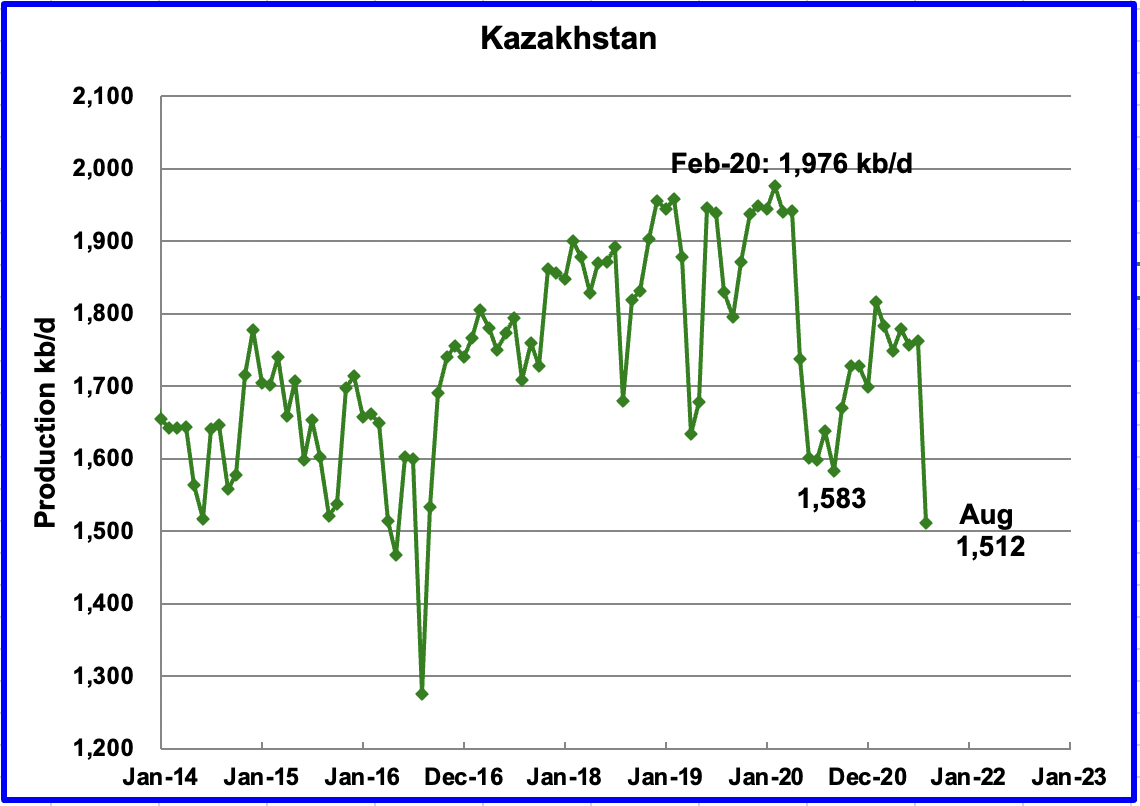
Kazakhstan’s output decreased by 251 kb/d in August to 1,512 kb/d due to maintenance in the Tengiz field. September output is expected to recover to close to 1,700 kb/d,
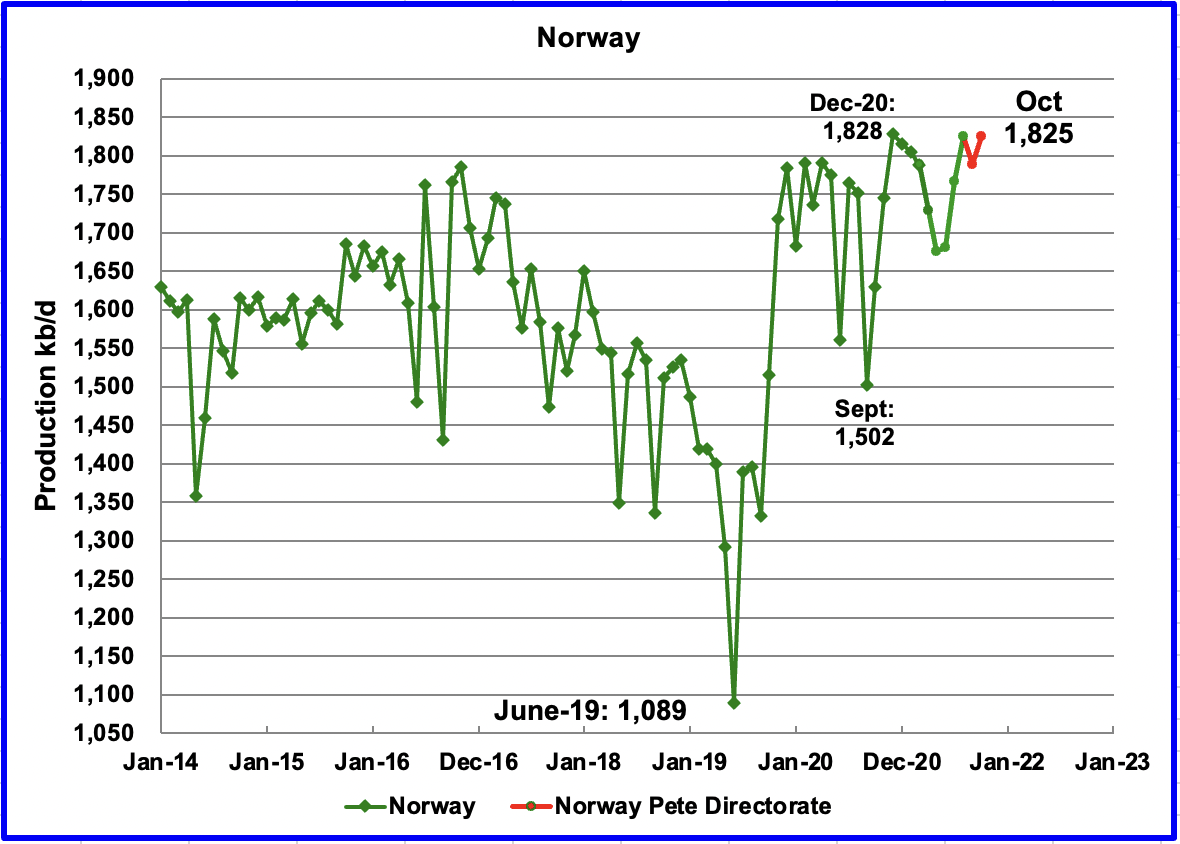
The EIA reported that Norway’s August production was 1,825 kb/d, an increase of 59 kb/d over July. The Norway Petroleum Directorate (NPD) reported that production in September decreased to 1,789 kb/d and then rebounded to 1,825 kb/d in October, red markers.
Earlier this year, the NPD implied that Norway’s production would exceed the December 2020 output in the latter half of 2021. There are still two months to go.
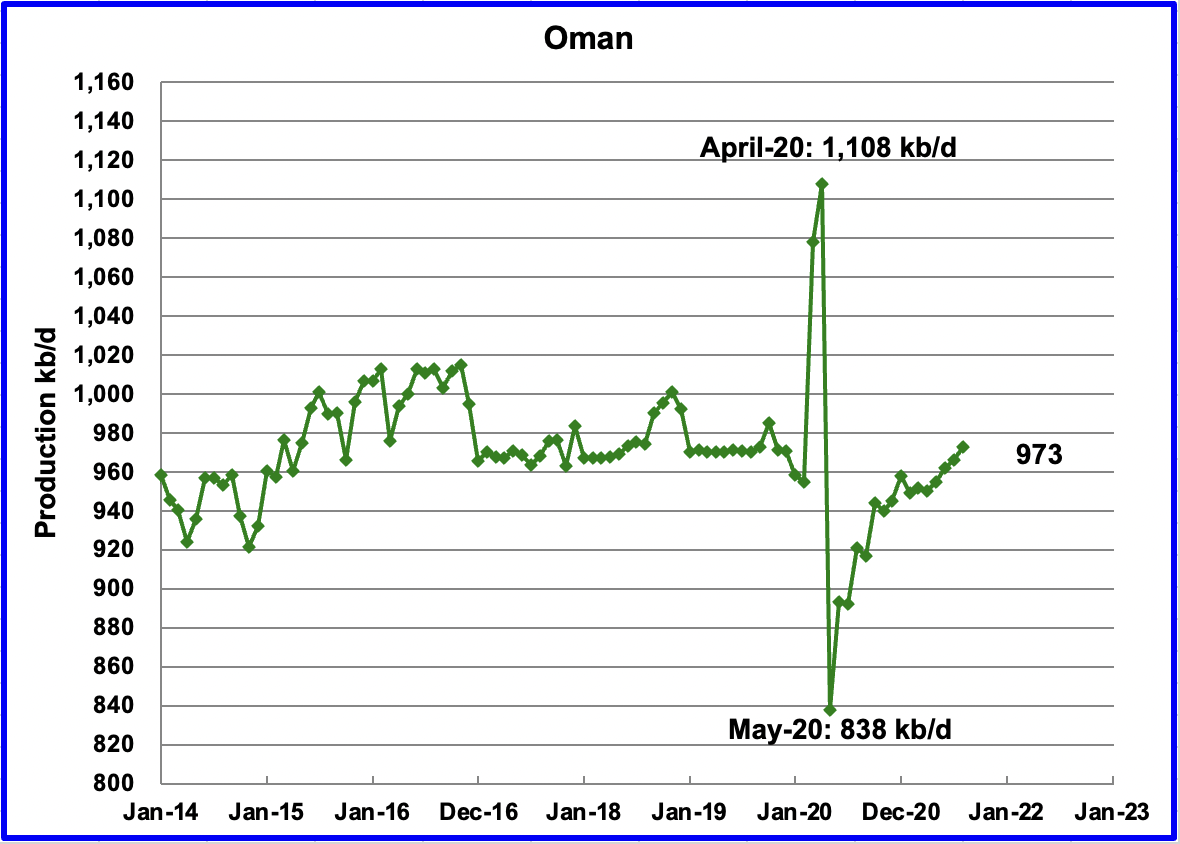
Oman’s August production increased by 7 kb/d to 973 kb/d.
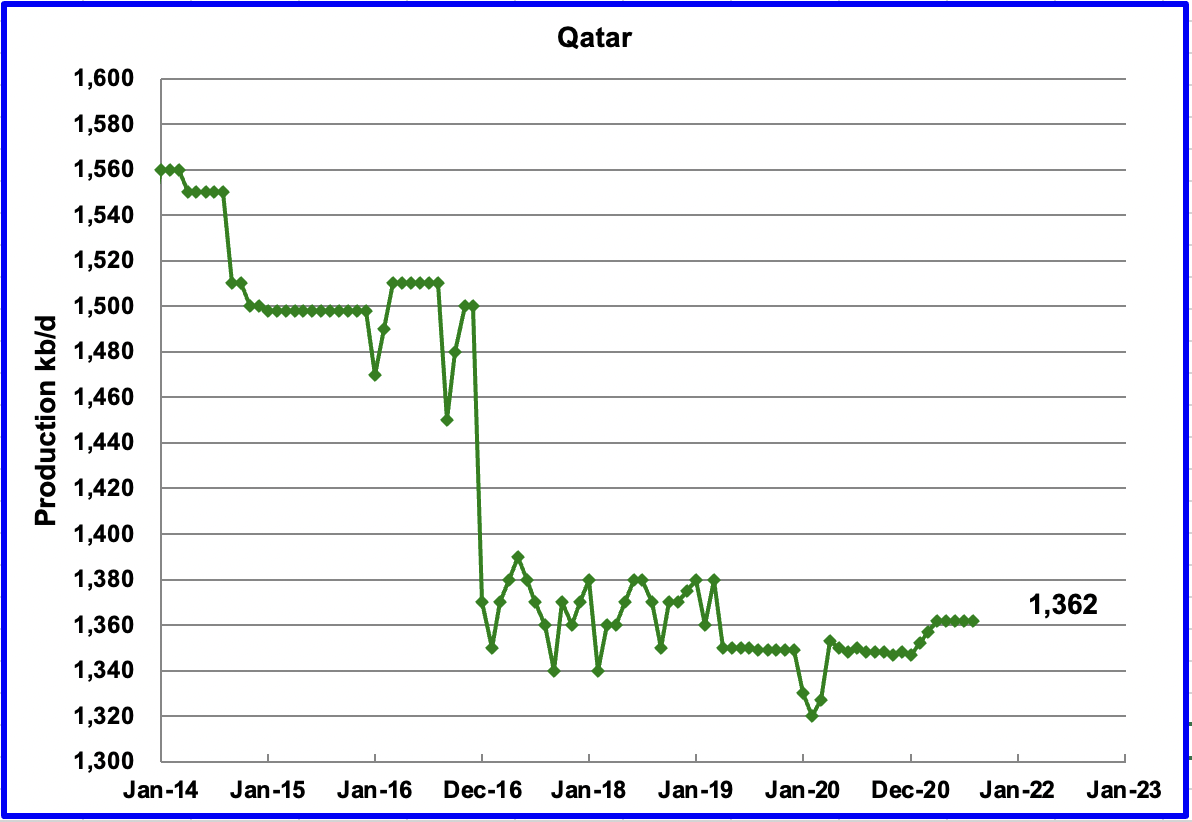
August’s output was unchanged at 1,362 kb/d.
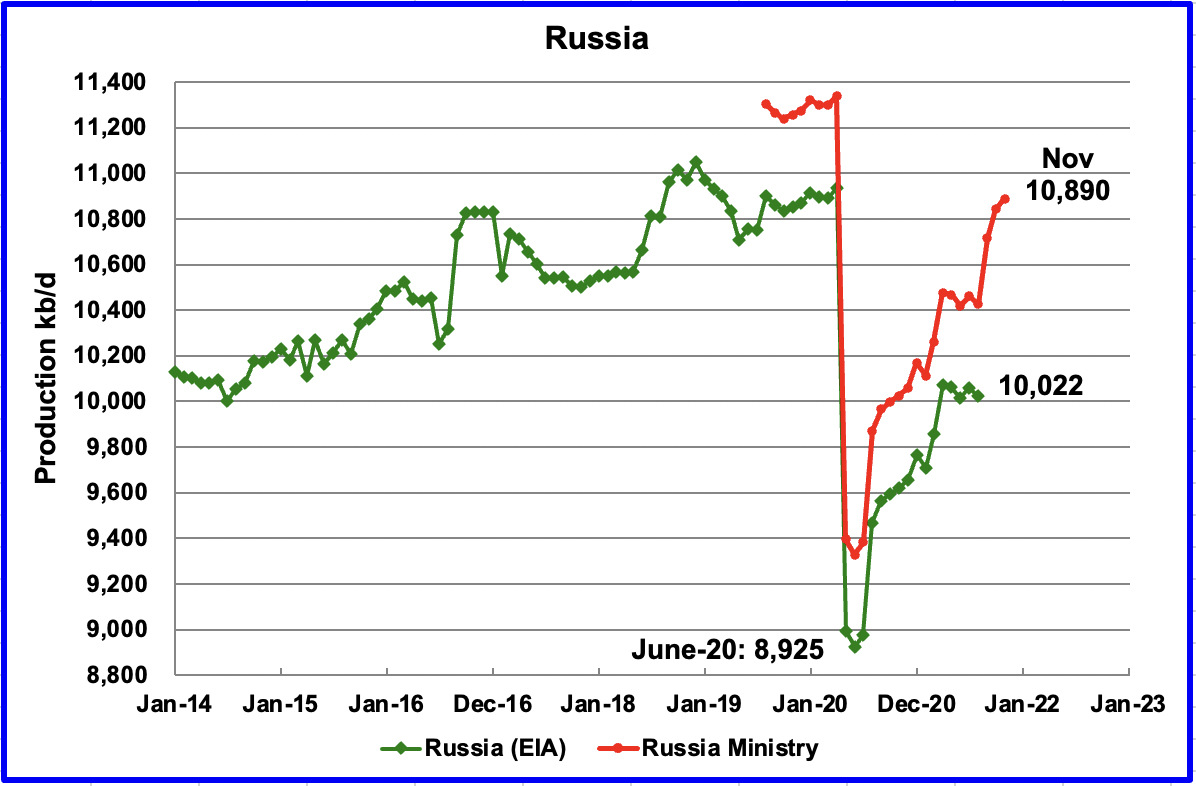
The EIA reported that Russian output decreased by 35 kb/d in August to 10,022 kb/d. According to the Russian Ministry of Energy, Russian production increased by an additional 417 kb/d in October. This source reported that output in November increased by an additional 47 kb/d to 10,890 kb/d.
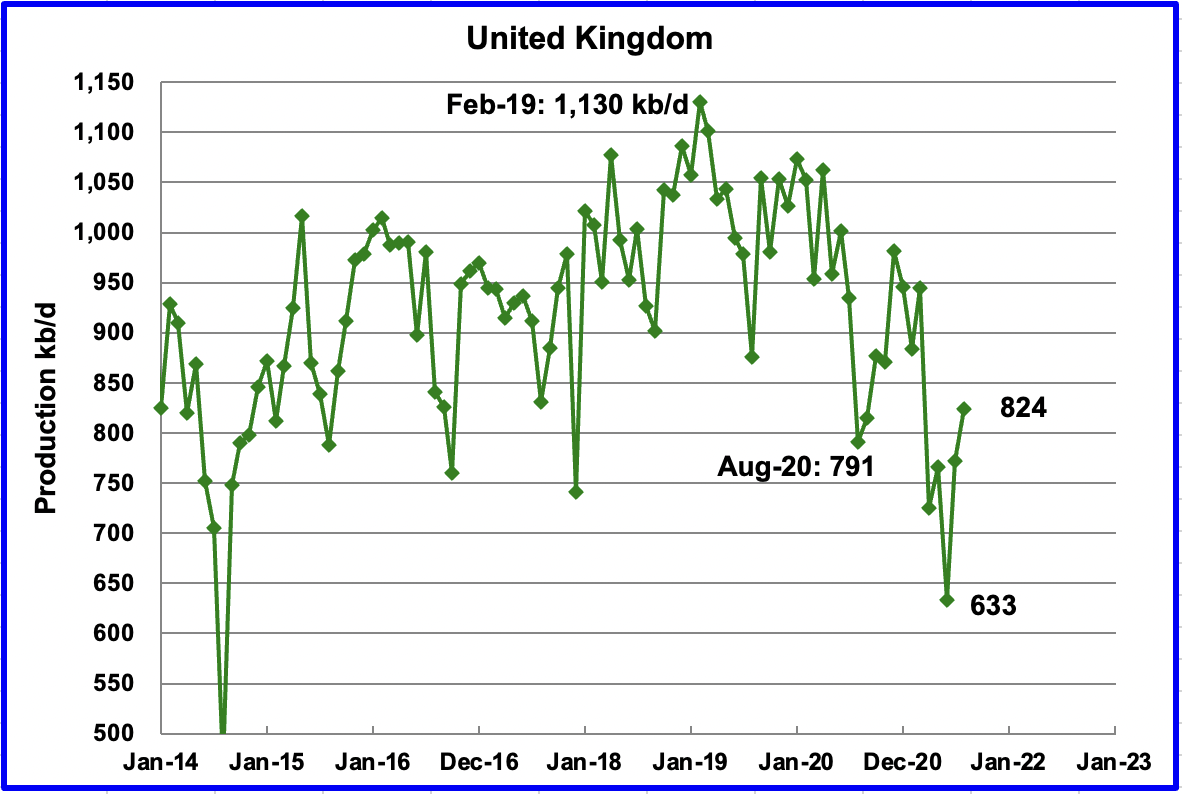
UK’s production increased by 52 kb/d in August to 824 kb/d due to the completion of some of the planned maintenance.
According to OPEC, the lowest-ever production recorded this year of 633 kb/d was due to extensive maintenance on the Forties Pipeline System (FPS), planned work overs, and a full production shut-in at the UK’s largest producing field, Buzzard.
Assuming that UK production can return to 950 kb/d by February 2022, that implies a decline rate of 60 kb/d/yr. Will drilling be able to slow or stabilize output at this level or will the decline continue?
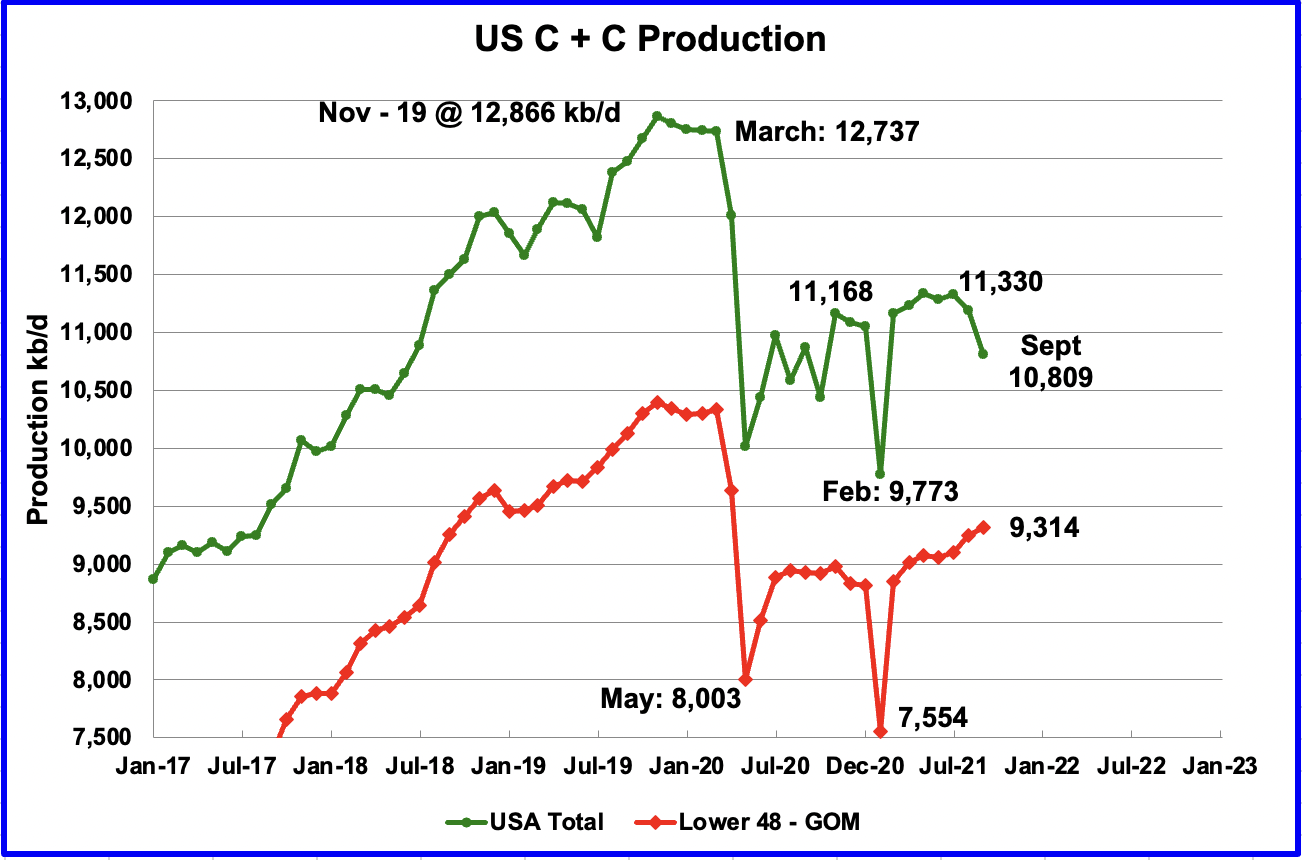
U.S. September production decreased by 380 kb/d to 10,809 kb/d. The drop is largely due to Hurricane Ida’s impact on GOM production. The GOM output dropped by 464 kb/d due to unexpected and extensive damage to platforms in the gulf.
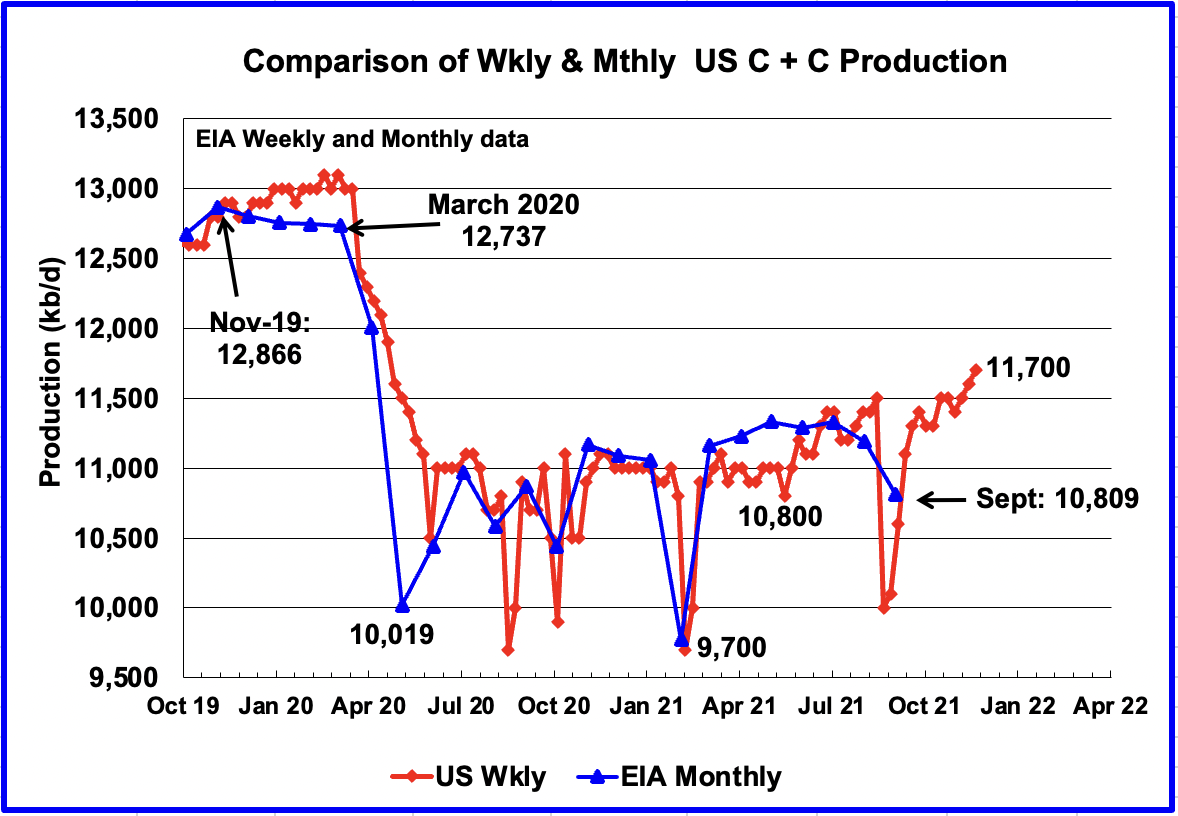
The EIA weekly report has shown a continuous increase in production of 100 kb/d each week for the past three weeks since November 12.
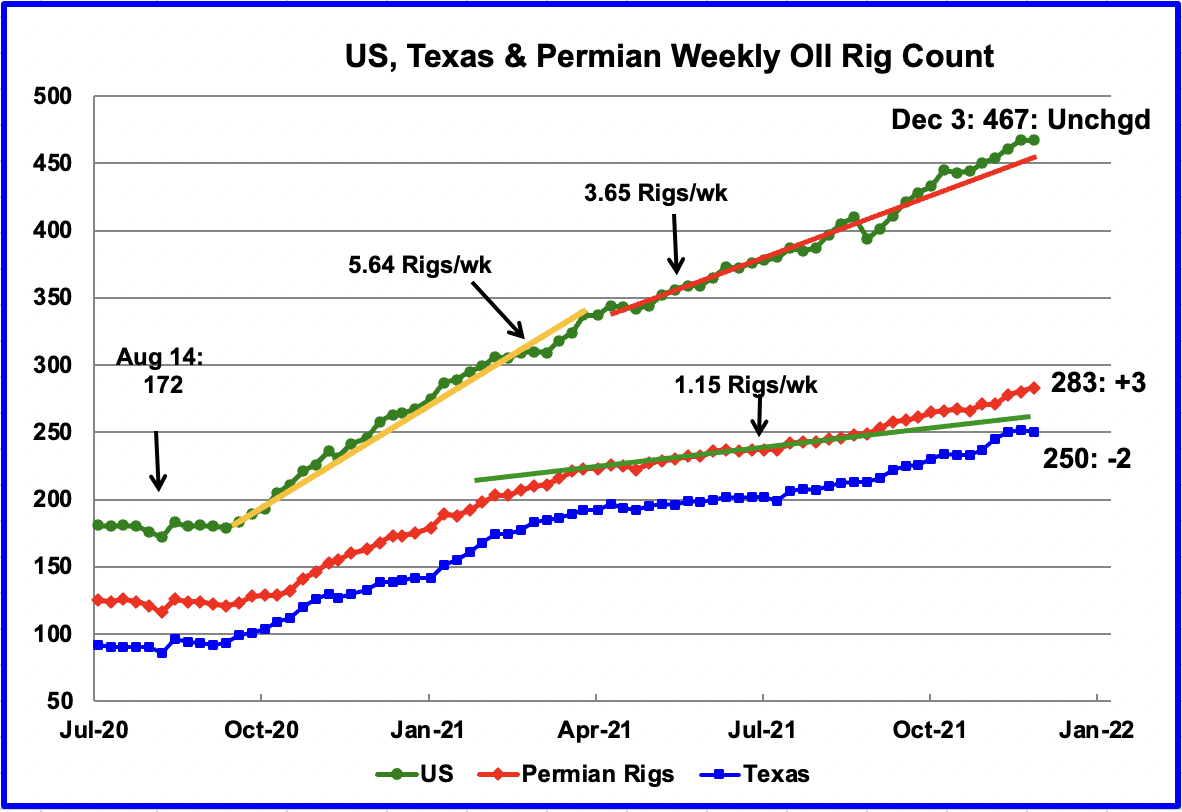
Since the beginning of April, the US has been adding oil rigs at a rate of close to 3.65 rigs/wk. For the week ending December 3, no oil rigs were added and remained unchanged at 467. Permian rigs increased by 3 while Texas rigs dropped by 2.
Since the end of July, the addition of oil rigs in the Permian has been at a rate closer to 1.15 rigs per week. However starting in September, it appears that rate of adding rigs has started to increase as can be seen by the red graph breaking away from the green line. Could this higher rate be related to the increasing price of WTI and a reduction in the completion of DUCs?
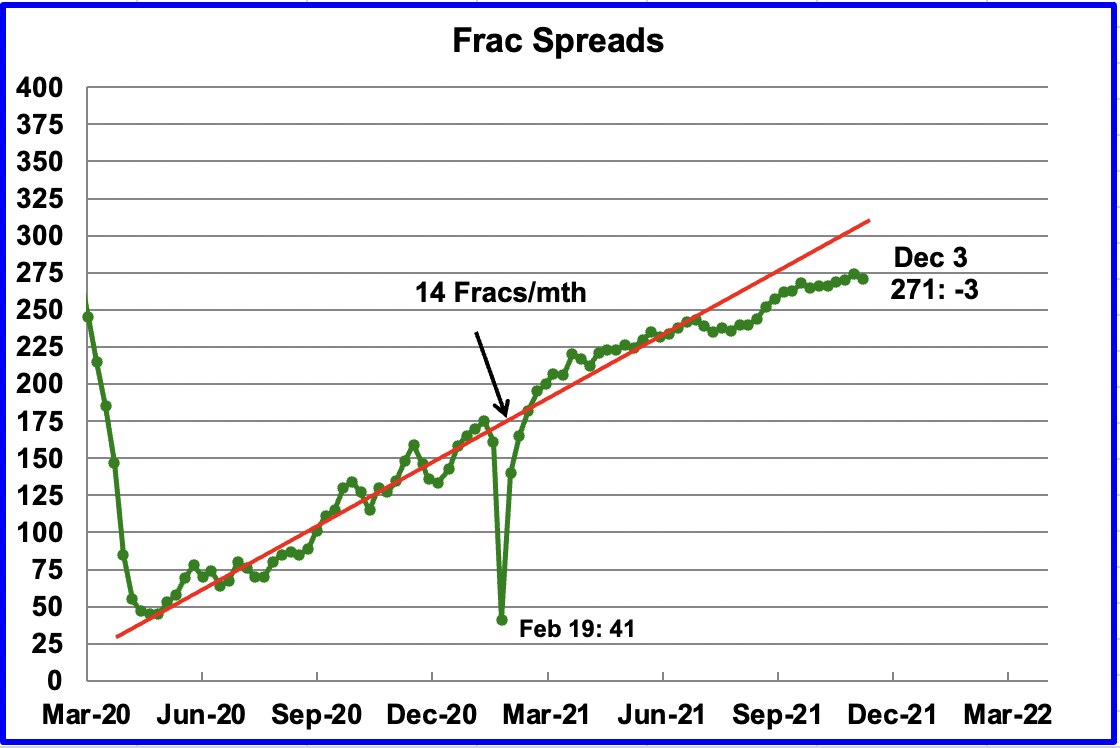
Starting from the week of July 23, 2021, frac spreads were not being added at the previous rate of approximately 14 spreads per month. While there has been an increase since then, there is a definite indication of slowing. During the week ending December 3, three Frac spreads were decommissioned.
Note that these 271 frac spreads include both gas and oil spreads, whereas the rigs information is strictly oil rigs.
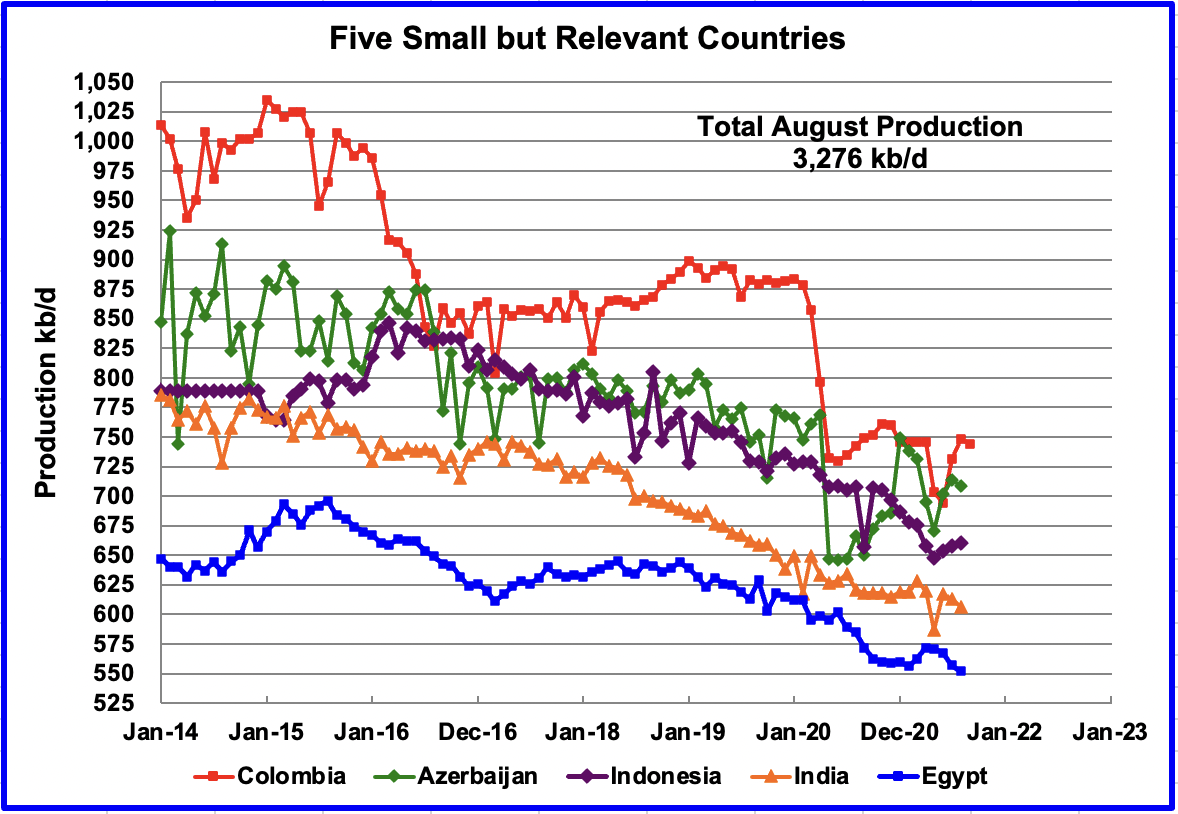
These five countries complete the list of Non-OPEC countries with annual production between 500 kb/d and 1,000 kb/d. Their combined August production was 3,276 kb/d, up 4 kb/d from July.
World Oil Production
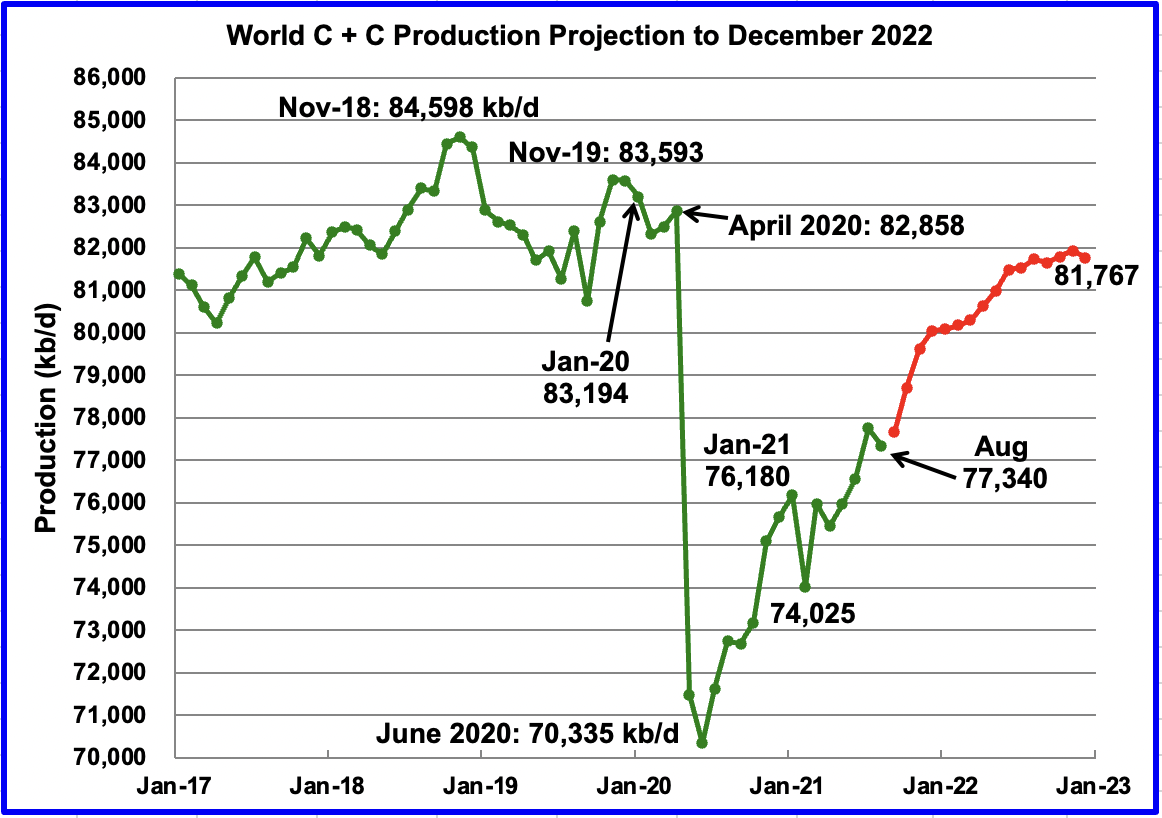
World oil production in August decreased by 412 kb/d to 77,340 kb/d according to the EIA. Of the 412 kb/d decrease, the three biggest contributors with declines of over 100 kb/d were Kazakhstan, 251 kb/d, US, 185 kb/d and Nigeria 170 kb/d, for a total of 606 kb/d.
This chart also projects world production out to December 2022. It uses the December STEO report along with the International Energy Statistics to make the projection. (Red markers) It projects that world crude production in December 2022 will be 81,767 kb/d, 380 kb/d lower than forecast in the previous report.
The current December 2022 forecast is 2,831 kb/d lower than the November 2018 peak of 84,598 kb/d. As best that I can remember, this may be the biggest gap that has been reported and it continues to get bigger. Also note that August production is 5,854 kb/d lower than the January 2020 pre-pandemic rate of 83,194 kb/d. Which countries will reduce this gap by producing more oil when demand returns to the January 2020 level?
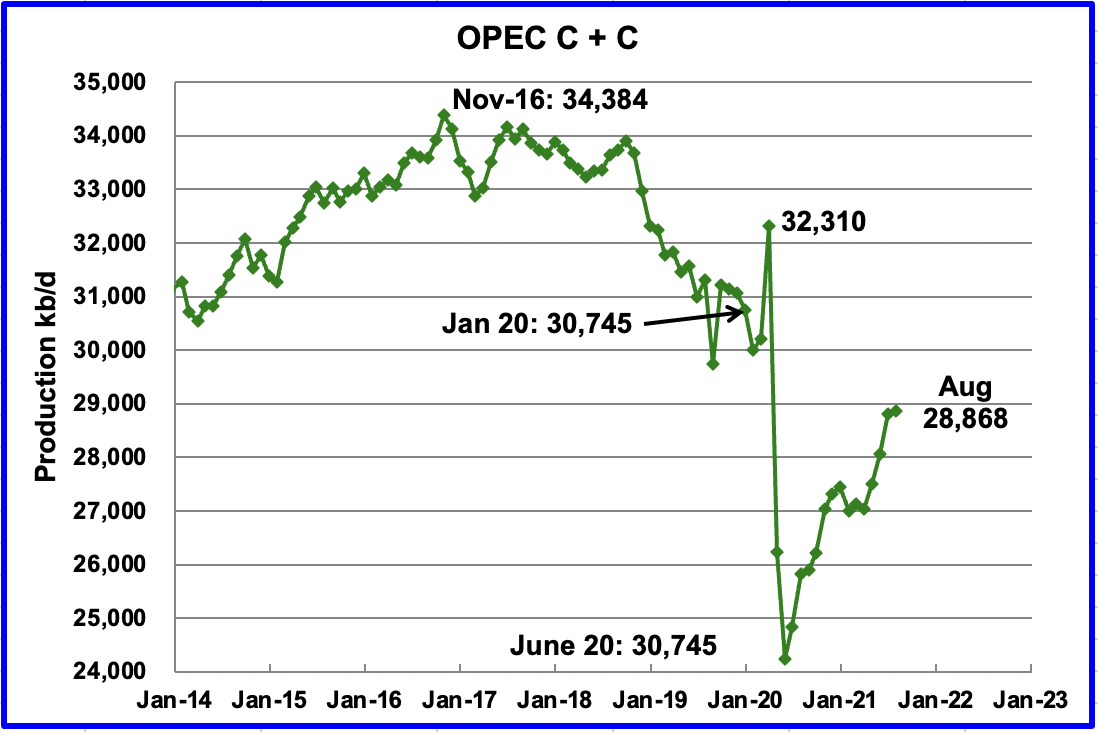
OPEC produced 28,868 kb/d of C + C in August, which is 1,877 kb/d less than in January 2020. That means that the Non-OPEC countries need to supply 3,977 kb/d (5,854 – 1,877) of oil if world demand/supply were to get back to the January 2020 level, say by late 2022.
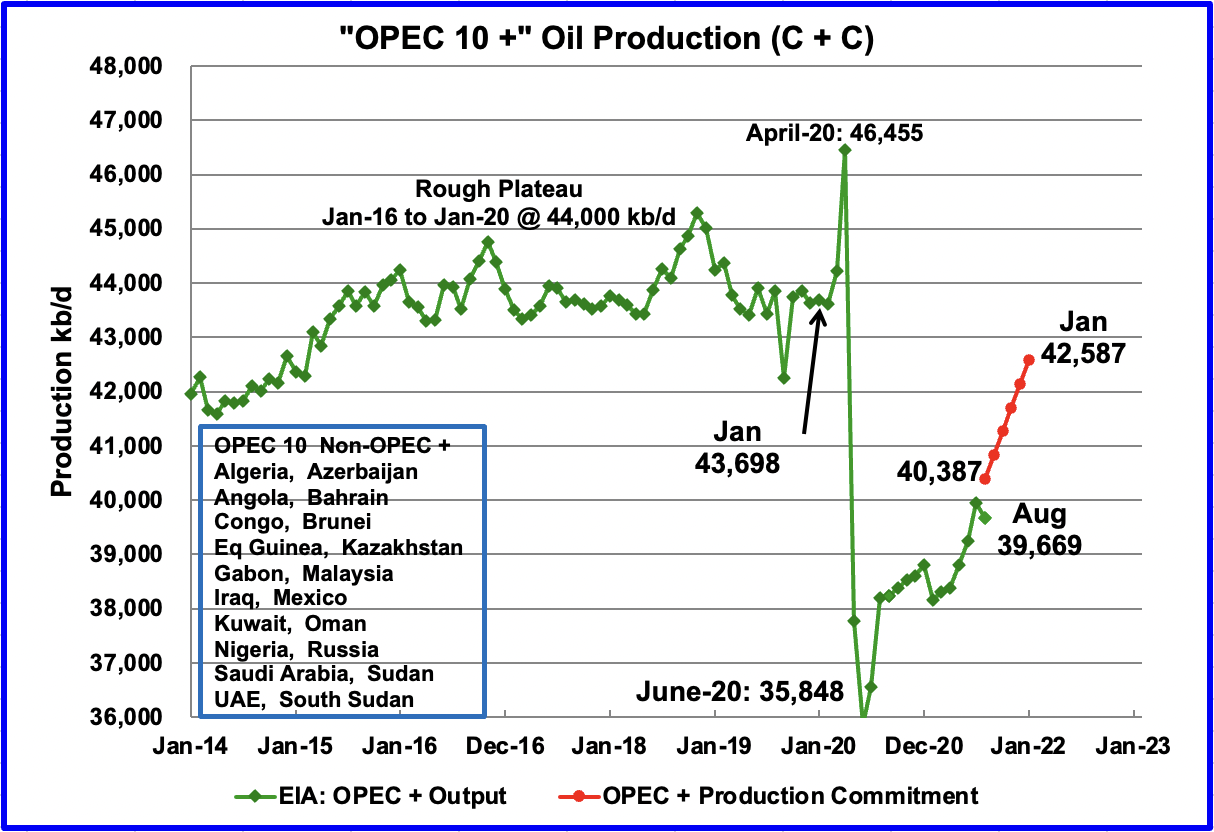
Another way to look at future supply requirements is to ask what do the “Non-OPEC +” countries need to supply to meet the former demand/output rate of January 2020? To get back to the January OPEC + rate of 43,698 kb/d, OPEC + needs to supply an additional 4,029 kb/d (43,698 – 39,669). To make up the difference, the Non-OPEC + countries need to supply 1,825 kb/d (5,854 – 4,029). Can the US, Canada, Norway, etc., increase their supply to meet this challenge over the next year or two?
Either way one examines the question of re-meeting the January 2020 demand/supply for oil, a year or two from now, it sounds like a daunting task for either the OPEC + countries or the Non-OPEC + countries.
The red line in this chart is the projected output as promised by the OPEC + countries starting in August 2021. OPEC + has committed to add 400 kb/d to the market every month till January 2021. Since the chart reports oil output in terms of C + C, 10% has been arbitrarily added to the 400 kb/d (440 kb/d) to roughly account for the condensate in the OPEC portion of OPEC + output.
For August the target output was 40,387 kb/d, based on July’s output of 39,947 kb/d. The actual output was 39,669 kb/d, short by 440 kb/d in large part due to the problems in Kazakhstan noted above.
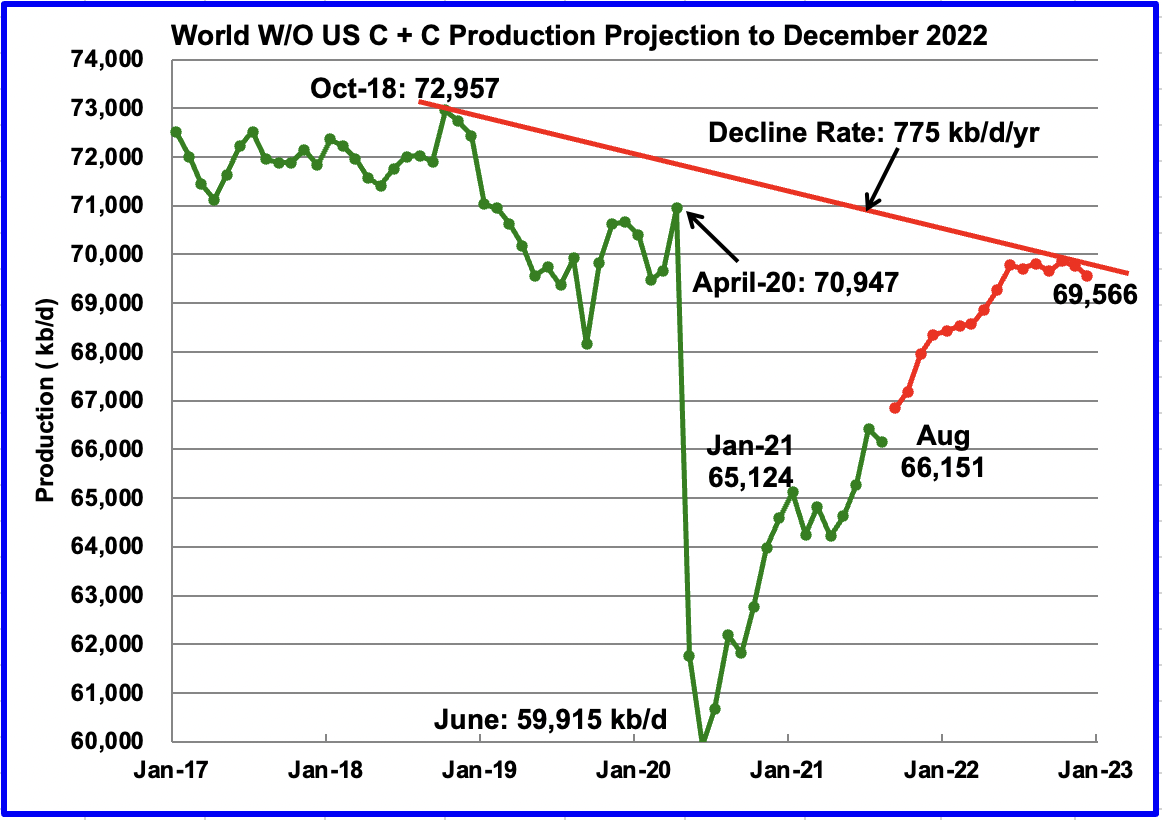
August World oil production W/O the US decreased by 271 kb/d to 66,151 kb/d according to the EIA.
This chart also projects world production out to December 2022. It uses the December STEO report along with the International Energy Statistics to make the projection, red markers. It projects that world crude production W/O US in December 2022 will be close to 69,566 kb/d.
The current December 2022 forecast is 3,100 kb/d lower than the October 2018 peak of 72,957 kb/d. If the Oct 2022 output were to be the next future peak, that would imply that the net decline rate of world oil fields, except for the US, is close to 775 kb/d/yr.
267 responses to “Non-OPEC Oil Production Drops in August”
Activist Investor Dials up Pressure Against Exxon Mobil to Act on Climate
In an interview with Yahoo Finance, van Baal said his investor group FollowThis has filed a shareholder resolution requesting that Exxon Mobil (XOM), for the first time, set and publish medium- and long-term targets to reduce greenhouse gas emissions and energy products, consistent with the goal of the Paris Climate Agreement.
“Big Oil can make or break the Paris Climate Accord and we need shareholders to support them and if needed to push them to commit to the Paris Climate Agreement and start investing differently,” van Baal said. “That’s the only way we have any chance to fight the climate crisis.”
Specifically, the resolution from FollowThis calls on Exxon to go beyond addressing operational emissions, but all of their emissions, including Scope 3 or indirect emissions stemming from activities or assets that are not directly controlled by the oil giant. Van Baal said that accounts for 90% of the firm’s carbon footprint, making it a critical piece of addressing climate action.
The resolution, filed ahead of the 2022 annual general meeting (AGM) frames Exxon Mobil’s failure to act as a financial risk, making limiting global warming “essential to risk management and responsible stewardship of the economy.”
“On the demand side, we have to make different choices. But on the supply side, the energy industry, which is now the fossil fuel industry, should completely overhaul the supply of energy,” van Baal said. “The only way to achieve that is to stop investing in exploration of more oil and gas and start the exploration of new business models in renewables.”
Another wunderkind helping to move the peak oil date forward.
https://finance.yahoo.com/news/activist-investor-dials-up-pressure-against-exxon-mobil-to-act-on-climate-201859590.html
A very informative update, much appreciated!
But from the frac spread chart, if you create a line from march to december -21 you´ll get a quite less steep increase, and with that in mind, the Non-opec projection (first graph) might be seen as quite optimistic, possibly…?
Laplander
You are correct in that there is an indication over the last months of 2021 that the weekly frac spread additions are slowing. In the DUC section of the previous US post, one can see how the completions are also slowing. This ties together nicely.
What is not clear is whether seasonality has something to do with the slowing of frac spread additions, i.e. Xmas is around the corner. Maybe someone in the business could provide some insight on whether completions slow around Xmas/New Year.
To clarify my point to new readers, from Jan -21 to Aug -21 Non-opec (first chart) seems quite flatish/slight increasing but with a projected rise in the works. But since a large part of the increase has been supposed to come from the US I guess them boys will have to frac a lot more, not less?
Ovi,
There is a growing divergence between # of rigs to wells drilled/ # of frac spreads to total completions performed.
As the length of laterals continues to increase in the Permian, a single rig will trend towards drilling fewer wells in a given time frame. (This is somewhat offset by the ever faster rates of lateral feet drilled).
Likewise with frac spreads, it is becoming more common for 2 spreads to be operated by, essentially, one crew as the hardware has evolved so 2 pairs of wells are frac’d simultaneously.
Hardware such as the Hydraulic Completion Units – pioneered by Deep Well Services and their imitators – are playing a role in greatly boosting the efficiencies in creating these longer laterals.
While this can muddy the waters somewhat in attempts to continue with historical comparisons, the ‘Appalachian Basin’ model may offer an effective framework for ongoing analysis.
To wit, due to the wildly hetergenous nature of AB leasing/drilling units, most AB operators use the metric ‘lateral feet drilled per 24 hours’ and ‘number of stages frac’d in 24 hours’.
Thus, a 4 well pad with individual lateral lengths of 18,000′, 15,000′, 12,000′, and 7,000′ containing stages varying in length from 150 feet to 280 feet can be homogenized in the just-described manner.
(An operator may present this pad as, say, 52,000 lateral feet drilled in a total of 12 days, with completion rates of 14 stages per day for the ~260 stages frac’d).
I have no idea how observers could easily ‘crunch the numbers’ and produce an AB model to the Permian or the wider US, but – again – the direct rigs to wells/spreads to completions framework is becoming increasingly disconnected.
CoffeeGuyzz
Interesting info on what is happening in the drilling and fracing world. Need to ask a question. Appalachia is gas. Do the same variations in gas technique and progress also apply to oil drilling/fracing.
I have been tracking Fracs vs Rig count and have noticed that the number of frac spreads to rig count started to fall off in early September, see attached chart. However as noted in the post, the frac spreads include both gas and oil spreads, whereas the rigs information is strictly oil rigs.
Ovi,
Although a bit of an overstatement, there is essentially no difference between the drilling/completion process of an unconventional oil well versus an unconventional gas well.
The biggest differences arise in the hydrocarbon recovery process which is way harder/more expensive for oil than it is for gas. This should be understandable when one is getting a viscuous liquid out of a rock, flowing into a fist-sized ‘pipe’, travelling 2 miles sideways, and then 2 miles to the surface as has been done every day for almost 20 years in the Bakken.
Natgas flows much more readily with liquid removal (mostly water) in the vertical being one of the bigger (and more easily overcome) challenges.
From all accounts, the completion companies have repeatedly stated that qualified labor shortages are their biggest difficulties right now.
How much of that may be reflected in your data, I do not know.
Coffee.
You mention labor issues, and I wholeheartedly agree that is a major issue.
Do you see that subsiding?
I have been beating the drum on this for awhile. We saw it getting to be a problem in our field before COVID. Now it is to the point that we don’t know what we will do as our employees retire.
Very few with any skill are interested because they see it as a dead end career. There is a lot to know, and it is a dangerous job too, so you cannot just throw somebody out there.
Add in the serious drug abuse issues in the oilfield, I don’t see how we have another boom, even if the geology allows for it.
But I am not in a shale field and assume our wage scale is lower.
Shallow,
‘Do you see that subsiding’?
No, quite the contrary.
Not to go off topic (oil thread wise), it seems to becoming increasingly rare to encounter anyone under 30 who is hungry to work, willing to put in an extended period of training, can focus on instructions, and exhibits excellent customer/interpersonal skills.
Easy for me to write all this off as routine curmudgeonly evaluations on my part, but … there really does seem to be a sea change in culture when it comes to younger people – collectively – willing to roll up their sleeves and get ‘er done.
The era widely populated by such individuals may be in our past.
Coffee.
I don’t know that I completely agree that it is an age issue, I do think we all tend to spend too much time on these smart phones, even the 50+ crowd.
Working in the oilfield is a challenging job physically. It is outdoors in extreme weather. It is dangerous work. There are so many more jobs now that don’t require these physical demands, more than ever before. Think of how many can work from home now, as compared to just 10-15 years ago when shale really took off.
Oil and gas work occurs in mostly rural areas. The desire of the populace to live in rural areas is shrinking. The population of rural areas is shrinking. I have children and nieces and nephews. Right now not looking like any will live in a rural area for their careers. The enrollment at our high school is just 2/3 of what it was when I went there 35+ years ago.
The great financial crisis occurred 2008-2009. Many were willing to move to the Bakken, EFS and Permian to work at jobs that paid higher than where they lived. Now, there are plenty of jobs everywhere, and those jobs pay as much or more comparable to the oilfield jobs.
Next, for younger people, job stability doesn’t look good at all for the oilfield. There have been three bad busts in the oilfield since 2008. Policy makers want to move away from using oil. Surveys show many don’t want to work in the industry because of its perception as dead end, or worse, an immoral industry due to climate change issues.
Last, the oilfield mostly has to drug test due to the dangerous nature of the work. This eliminates millions of Americans. Many millions of Americans love their drugs. Pot is becoming legal in more places. Pot stays in the system for a long time. If you are committed to smoking pot, it isn’t easy to keep your oilfield job. Same is true for the harder stuff, although those on the harder stuff tend to not show up for work much anyway.
Of course, all these things could change. But not looking that way right now.
Ovi,
Maybe the chart would be better if it included all horizontal onshore rigs vs frac spreads?
Thanks again Ovi!
Ovi,
There are good explanations for World minus US decrease in output over Oct 2018 to Dec 2022, OPEC plus cuts from 2018, US sanctions on Iran and Venezuela, and Worldwide pandemic causing a crash in demand and oil prices. This is hardly what I would call net decline.
There is likely to be a shortage of oil and high prices by the end of 2022, this is likely to increase investment in the oil industry and output may also rise and also demand will be destroyed due to high prices. The market will be forced into balance.
Dennis
We only have data up to August 2021. The line I put in the chart goes to October 2022. I have no idea what the EIA assumes in their forecast. I note though that from July 2020, Iranian production has increased from 2,516 kb/d to 3,241 kb/d. Not sure how much additional output the EIA has added out to October 2022. Venezuela has bounced back and now seems stuck around 550 kb/d from a low of 360 kb/d.
I do keep track of the net decline in 27 countries and it is closer to 500 kb/d/yr. Venezuela and Iran are not among those 27.
I guess that if Hillary had not done her Veni, Vidi, Vici thing, at the expense of Stevens et al, Libya would still be extracting 1,6 mbpd… But K trusted E over USD, see where that got him…
Edit: or maybe not 1,6, but who knows?
Ovi , now that is what I call a performance . The real stuff , ” All beer , no froth ” .
Ovi,
What is the basis for choosing the 27 nations in your chart?
I get a similar result for Jan 2010 to Dec 2019 for World C plus C minus the C plus C output from the following list of 11 nations (Venezuela and Iran are included due to sanctions and politics causing an arbitrary drop in output)
Brazil
Canada
Iran
Iraq
Kuwait
Norway
Russia
Saudi Arabia
United Arab Emirates
United States
Venezuela
I use EIA data, the trend in annual decline in output for the “rest of World” is about 500 kb/d over the 2010 to 2019 period.
The average annual increase in C plus C output from the 11 nations listed above over the 2010 to 2019 (using OLS trendline) is 1497 kb/d per year.
Also notice in chart below for “rest of World” (World minus 11 listed nations) that decline was practically nil from mid 2016 to the end of 2019 (only a decrease of 14 kb/d per year).
Dennis
Here are the countries. There are more than 27. I just counted the cells in the visible line of Excel. My Bad. This uses the EIA world data. At the end is the formula to save you the trouble of typing it in, in case you want to look at it before tomorrow when I get around to sending you the spread sheet.
Cell D7 is Jan 2004 for Algeria. The rest should line up.
I will send you my spread sheet tomorrow and I will update this reply with an explanation for every one to see.
Algeria, Angola, Argentina, Australia, Austria, Azerbaijan, Belarus, Belize, Brunei, Burma, Cameroon, Chad, Croatia, Cuba, Czech R, Cote d”Ivoire, Egypt, Eq Guinea, France, Gabon, Georgia, Germany, Greece, Guatemala, Hungary,India, Indonesia, Italy, Japan, Lithuania, Malaysia, Mexico, Netherlands, New Zealand, Nigeria, Norway, Peru, Philipines, Romania, South Africa, Spain, Sudan,Tomor-Leste, Trinidad, Tunisia, Ukraine, UK,Uzbeekisstan, Vietnam, Yemen.
D7 D9 D12 D15 D16 D17 D21 D23 D32 D35 D39 D43 D52 D53 D55 D56 D62 D64 D77 D80 D82 D83 D88 D93 D101 D103 D104 D109 D111 D125 D130 D137 D148 D151 D154 D159 D166 D167 D173 D193 D196 D198 D208 D211 D212 D221 D223 D226 D229 D232
It occurs to me that some of this decline in the “rest of world” might be due to libya. It seems you have focused on non-OPEC less Russia and US, where I include some of the declining OPEC nations (except Iran and Venezuela). To me, an inclusion of all declining nations gives a clearer picture.
No I was incorrect, it seems you include most of the declining OPEC nations.
Dennis
I started looking at the list of declining countries in mid 2019 and made up the final list in March 2020 after looking at countries in decline in different ways. I ended up with three criteria.
Mar 20 – Jan 2004: Output in March 2020 had to be less than Jan 2004
Mar 20 -Dec 07: Output in March 2020 should be less than December 2007. This was to cover countries that were low in production and then increased for a while and then started their decline again. Egypt.
Feb 20 – July 18: Output in Feb 20 should to be less than July 2018. For instance, if some country had a big output decline and then went flat or slightly up, I would include it. A variation on the second criteria.
These were not hard and fast criteria. They were guidelines used as I looked at each country’s chart. In the end it was an Eyeball Decision. For example, Norway had a big decline up to 2012 and then goes sideways and adds a bit. It is in my list.
I stopped looking at declining countries when Covid hit. Recently, as world production started to recover, I updated the chart to July and July was back on the line after the divergence before and after covid. That is why I posted the chart. It will be interesting to see what happens going forward.
There is a pretty clear steady downtrend in the totality of output from these countries and no discernible flat spots at this point.
I have sent you the spreadsheet. If someone would like to see it, they can get it from you.
Thanks Ovi,
If we add libya to my original list and call “rest of world” all oil producing nations besides that group of 12 that I listed, I think we arrive at a similar number. I use Jan 2010 to April 2020 for the data range. Annual decline rate is about 460 kb/d per year.
Dennis
By adding Libya, your slope declined. Also you have much more production than in mine. In 2010, the production in your chart is 29,000 kb/d. Mine only has 19,000 kb/d. I guess we agree that there is a decline of roughly 500 kb/d. Will it continue or will it slow.?
Dennis
I wonder if the bigger producers have more funds to do maintain drilling while the smaller countries in my list don’t do much or as much maintain drilling. That could affect the net decline slope.
Ovi,
There must be a group of relatively flat or slightly increasing producers that are included in my group which is mostly nations that are not significantly increasing output. Looking at your chart it looks like output was pretty flat from 2004-2008, so to me the slope from 2008-2019 would be of greater interest.
The 12 nations on my list (when we add Libya to the original list) increased output roughly 1500 kb/d per year from 2010 to 2019. I imagine they can increase by 1000 kb/d as a group from 2022 to 2027, this gives a net increase of about 2500 kb/d for the World over that period and my guess is that the increase may be somewhat more than this when we add Guyana (with an expected increase of 850 kb/d from 2021 to 2028.)
Dennis
I will look at my rest of the world and check their increase and post later.
Dennis
Here is My Rest of the World W/O US. I left the US out to get a better idea of what the rest of the world was doing. From Jan 2008 to October 2018, rest of the world W/O US was increasing at 935 kb/d/yr. I tried to take the steepest part of the graph.
Ovi,
So your rest of world is every nation except your group of declining nations, the drop after 2018 is the OPEC plus nations that are not part of your declining group reducing output to try to support oil prices. US output increased by 567 kb/d per year on average from Jan 2008 to Dec 2017.
Dennis
Just to clarify, the US is not in there also. Maybe you intended that in your reply but I don’t see it specifically. So the US rate has to be added to the 935 kb/d/yr, which I don’t think is correct for late 2021 and 2022 and beyond.
Ovi,
Yes the US rate would be added to the 935 kb/year, the US can probably increase output at 500 kb/d per year from 2022 to 2027, much will depend on the price of oil and whether tight oil producer realize that they have a narrow window from 2022 to 2028 to produce as much as they can without causing a supply glut, after 2028 demand may start to fall faster than supply and the window for profits in the tight oil space (and the oil sands space for new projects) will be closed.
See comment linked below to see an alternative tight oil scenario.
https://peakoilbarrel.com/non-opec-oil-production-drops-in-august/#comment-731530
David Hughes 2021 assessment for shale oil is just out. Required reading!
https://www.postcarbon.org/publications/shale-reality-check-2021/
o The total tight oil projection is 4.5 times higher than proven U.S. tight oil reserves and more than triple all proven U.S. crude oil reserves at yearend 2019.
o The total shale gas projection is 3.6 times higher than proven U.S. shale gas reserves and 63% of proven reserves plus unproven resources.
o In most plays the EIA forecasts exit 2050 at high production levels—often significantly higher than current production rates —implying that vast additional resources would remain after 2050.
And here is the killer, Bold mine:
SUMMARY FINDINGS
• The EIA’s AEO2021 reference case play-level production forecasts through 2050 are found to be highly to
extremely optimistic for the most part and therefore are unlikely to be realized (although they are
somewhat less optimistic than in its earlier reports).
• In most plays, meeting EIA production forecasts through 2050 would require the recovery of all proven
reserves and a high proportion of the EIA’s estimates of unproven resources. (In one play over 100% of
proven reserves plus unproven resources would be required.3)
o The total tight oil projection is 4.5 times higher than proven U.S. tight oil reserves and more than
triple all proven U.S. crude oil reserves at yearend 2019.
o The total shale gas projection is 3.6 times higher than proven U.S. shale gas reserves and 63% of
proven reserves plus unproven resources.
o In most plays the EIA forecasts exit 2050 at high production levels—often significantly higher
than current production rates —implying that vast additional resources would remain after 2050.
• The EIA appears to have overestimated drillable area in most plays, and also extrapolated well estimated
ultimate recovery (EUR) over wide areas when they are in fact highly variable.
o As sweet spots become saturated with wells and drilling of necessity moves into lower quality
parts of plays where average well production is lower, per-barrel drilling and completion costs will
increase to levels significantly higher than the EIA’s optimistic assumptions of less than $30 per
barrel for most tight oil plays and less than $15 per barrel of oil equivalent for most shale gas
plays.
So much for the EIA’s URR estimates. 🤣 They are not worth a bucket of warm spit. 😂
Oh oh – I think it is the labor shortage.
Their dealer of coke and happy pills has run away – now they are sober and have to rewrite everything ;).
In an earlier thread I showed a tight oil scenario based on two separate oil price scenarios. The scenario has been corrected to a single oil price scenario that rises to Brent price in 2020 $ of $75/b maximum that starts to decrease in July 2028 and reaches $36/bo in 2020$ in July 2041 and then remains at $36/bo.
The chart below compares my scenario with the AEO 2021 tight oil reference scenario, my URR is 69 Gb(2000-2060), the EIA has URR=137 Gb, if we assume linear decline of the EIA scenario to zero output in 2060.
Note also that Hughes has not given any output scenarios since 2014, there he only gave output scenarios for Bakken and Eagle Ford and my scenarios for those two plays are consistent with his best guess in 2030, about 750 kb/d for Eagle Ford plus Bakken output in 2030 for both my scenario and Hughes in Drilling Deeper. Peak 12 month centered average output for my scenario (DC) is 9.27 MB/d in 2027.
Link to 2014 Report by Hughes on tight oil
https://www.postcarbon.org/wp-content/uploads/2014/10/Drilling-Deeper_PART-2-Tight-Oil.pdf
See Fig 2-95 on bottom of page 143. My scenarios for Bakken and Eagle Ford have cumulative output of 13.1 Gb from 2012 to 2040 vs 13.9 Gb for Hughes scenarios from 2014, he has never updated these scenarios.
Price scenario used for tight oil scenario in chart below.
In my opinion this oil price scenario is exceedingly conservative.
The “DC” tight oil scenario is updated to account for lower Permian completion rates due to falling oil prices in oil price scenario above see link below
https://peakoilbarrel.com/non-opec-oil-production-drops-in-august/#comment-731394
URR falls from 69 Gb to 59 Gb.
FOA Food price index continues up. Current reading is higher than the 2011 average but still lower than the peak.
“The FAO Food Price Index (FFPI) averaged 134.4 points in November 2021, up 1.6 points (1.2 percent) from October and 28.8 points (27.3 percent) from November 2020. The latest increase marked the fourth consecutive monthly rise in the value of the FFPI, putting the index at its highest level since June 2011.”
https://www.fao.org/worldfoodsituation/foodpricesindex/en/
Opec+ adds 410,000 b/d but remains short of target
Opec+ deal participants raised their combined crude output by 410,000 b/d last month on the back of strong increases from Nigeria, Saudi Arabia and Iraq, but the group was still 580,000 b/d short of its November target, according to Argus’ latest survey.
Opec’s two largest producers also delivered strong output growth in November. Saudi Arabia raised production by 110,000 b/d and Iraq increased by 90,000 b/d. Iraq was one of only five in the wider Opec+ group to exceed its quota last month. It must make up for its historical overproduction through a compensation scheme that has been extended until the end of June next year, although the coalition’s focus on compliance has waned as several countries struggle to meet their growing targets.
There is a more extensive compliance table at the end of the article.
https://www.argusmedia.com/en/news/2282120-opec-adds-410000-bd-but-remains-short-of-target
The days of OPEC worrying about its members overproducing has past.
“Between August and November, OPEC+ added 1.04 million bpd in total to its production, which was nearly 600,000 bpd below the target for the four months
https://oilprice.com/Energy/Energy-General/OPECs-November-Oil-Production-Still-Below-Target.html
So OPEC + which had supposedly cut production by 3 or 4 mbpd during the peak of the Covid crisis to support prices can’t get it up again . Solution : Send them Viagra . Hopefully it might work . 🙂
Maybe viagra is one of the secret ingredients in those frack cocktails those Permian boys are sending downhole. Don’t tell the Saudis!
Shell had announced another discovery in the Perdido Fold Belt area in the deepwater GOM
https://www.rigzone.com/news/shell_makes_another_discovery_in_gom_perdido_corridor-10-dec-2021-167263-article/
This is the 4th discovery they and partners have made since 2018 – including Whale, Blacktip and Leopard.
One reason it took so long to make these discoveries (the Perdido host itself has been online since 2010 or so) is most of them are subsalt/subraft, and the overlaying salt and rafted material is very complex. Alot of advances in seismic processing has gone into creating usable images that resulted in identifying the prospective structures.
Assuming all of these discoveries ultimately get developed, there has to be at least a billion barrels of recoverable oil out here (my estimate). The investment decision has already been made for Whale – with a new facility and estimated recoverable resources of 490 mmboe.
By the way, I used to be SouthLaGeo. Retired now so going by my real name.
Mr. Meltz,
Thanks for the link.
Considering that 20,000 psi hardware is being developed (initially for Chevron’s Anchor project), and that the outrageously high estimates for Brazil’s pre salts continue to be trumpeted, is it reasonable to think that significantly more hydrocarbons may be found in the GOM sub/pre salt?
Or, at a minimum, vigorous exploratory efforts may be expended as – noted in your post – seismic improvements continue to evolve?
Coffeeguyzz,
Will significant discoveries be made in the GOM sub-salt? In my opinion,, not a lot, with a caveat – that caveat being I’m not sure how many more discoveries Shell and partners could make in the subsalt part of the Perdido Fold Belt,, as seismic data quality continues to improve. The subsalt in this part of the Gulf has always been very challenging. I suspect, though, that they are nearing the end of quality prospects, but that is just a guess.
In other prospective subsalt areas – such as the subsalt Miocene centered in Southeast Green Canyon and extending over to Mississippi Canyon and Atwater Valley,, I believe only small opportunities remain there,, those that would be tied back to existing facilities, like BP’s Puma West discovery announced earlier this year. In these areas, I don’t believe improvements in seismic will result in significant discoveries. Seismic improvements will probably result in more effective field development though.
The other remaining area of new reserves in the GOM subsalt will be Wilcox/Lower Tertiary fields that have already been discovered and are either on a development track, like Anchor, or are likely to be developed, like North Platte and Shenandoah, and I suspect a few more.
Gentleman , ” technically feasible does not mean economically viable ” . How many times must I repeat this ” mantra ” .
Hole in head,
Bob Meltz (aka SouthLageo) has probably forgotten more about geology than you or I will ever know.
When he speaks, I just listen and learn.
Dennis , let us get things in order . I have posted several times that when it comes to GOM Mr Kaplan and SL Geo ( now Bob Getz) were my ” go to guys” . I hold these gentleman in high esteem on GOM matters . Mr Getz and Mr Kaplan will confirm that . My post was in response to Coffeeguyz post of some technical achievement of 20,000 psi . I followed your interaction with Coffee on the last post regarding NG . I did not intercede . Reason ?? In all your posts all you talked about was technical possibilities and not a word about price or about financial markets . I know of my limitations as an armchair guy , so I always bow to the opinions of the ” on hands ” . As to “When he speaks, I just listen and learn. ” , well that is what I do not only for Mr Kaplan or Bob Metz but also SS , Mike S , LTO , Rasputin etc . By the way no offense to your post , just clearing the muddy waters .
Hole in head,
When you say “Gentleman”, it is far form clear who is being addressed, if the comment was directed toward Coffeeguyzz, then address the comment to him, then it is clear and I would not have commented.
Hole in Head,
So what you are getting at is it is technically feasible for the operators to produce the discoveries I mentioned, but it may not be economically viable. I agree with that. I assume when an operator sanctions a project that at least they believe it to be economically viable. The only projects of all I mentioned that have been sanctioned are Anchor and Whale.
That doesn’t mean the others won’t be sanctioned, just that the operators need more appraisal information to make that call, and some may end not getting developed (at least initially) after appraisal.
Bob Meltz,
Do you expect this will impact GOM output over next 5 to 10 years?
You are always welcome to do a post on anything here if you are interested.
Thanks as always for keeping us up to date.
Dennis,
These projects, are significant enough to have a measurable impact on GOM output – either resulting in another peak, or at least a plateau.
Let me mull around the offer of a post – I’ve been thinking about putting one together on the current state of the Wilcox/Lower Tertiary in the deepwater GOM – how well has the trend lived up to early expectations, etc.
Thanks Bob.
I think you have my email, if not give a shout out here at the blog. Thanks for all of your insights.
More detail on Whale project at link below, first output expected in 2024 with peak output of 100 kboe/d, recoverable resource expected to be 0.49 Gboe, note at peak output about 36.5 million boe/year are produced. So if the resource estimate is correct output could be at this peak level for about 13 years.
https://www.shell.com/media/news-and-media-releases/2021/shell-invests-in-the-whale-development-in-the-gulf-of-mexico.html
Another Shell development expected to start producing in 2022 is Vito with peak output of 100 kboe/d and a resource estimate of 300 million boe, enough for about 8 years of peak output. Info on Vito at link below
https://www.offshore-energy.biz/shell-makes-fid-for-vito-development-in-gulf-of-mexico/
The design of the Whale project is similar to Vito according to Shell.
This the current outlook from JP Morgan-
“According to the investment bank, household net worth is at all-time highs in many developed countries, and excess savings are elevated. Consumption will likely be strong for years amid strong labor market conditions and the capacity to take on more debt,”
“A vibrant economy means robust demand for oil, and JP Morgan even said last week that crude oil prices could soar to $125 per barrel in 2022 and $150 in 2023 due to OPEC’s limited capacity to boost production.”
https://oilprice.com/Energy/Energy-General/JP-Morgan-Predicts-The-End-Of-Covid-A-Strong-Economy-And-125-Oil.html
Market disagrees with this projected future. Global bonds yields peaked back in October. Obviously short term rates are pinned near zero in most places. And long term bond yields are falling and flattening the curve.
Every time FED goes into tightening mode long end of curve flattens. If you don’t know the 10 year is at about 1.5% currently.
FED only has 1 maybe 2 interest rate hikes in them. Anymore than that the entire yield curve all the way out to the 30 year is going to invert. And only way to correct that is negative nominal interest rates.
How do you square that when CPI is running at 6.8%? You can’t and you’ll be roasted in the next election cycle.
China cutting their RRR rate only happens when things aren’t going well.
In a vibrant economy the dollar’s value falls. Because everything is smooth sailing. Well if DXY is heading back to 80 then maybe we get $125 oil.
Not going to happen. And only way FED can tame inflation is a stronger dollar.
I mark 2022-2023 as the biggest economic crash any of us will ever see in our lifetimes. Hope I’m wrong. But this vibrant economic outlook is for lack of a better word donkey shit.
I agree, inflation has the potential to spiral out of control yet. I think oil prices could have the potential to continue rising in this environment, with the DXY increasing as well (which seems counter intuitive) but the current environment allows for this to occur.
I can see the S&P and Dow continuing to edge higher and higher as inflation spirals. The trend can break dramatically only if the fed decideds to make some serious moves against inflation.
But at the moment i just dont see that happening. The fed serves the rich upper echelon of society. So the stockmarket not tanking is their primary motivation, regardless of whether inflation hurts the little guys, i don’t think they give a shit unless there is significant social unrest.
Deflation could occur only if the feds hand is forced and then we might witness the biggest exit out of assets (property and stocks) the likes of which the world has not seen before. The signs are there already with distorted price discovery and company evaluations. So there is going to be potential for a significant market downturn but it is hard to predict when, maybe when we see a signficant sharp increase in the 10 year yield, the end game starts. I don’t know.
Pension funds and insurance companies are loading up on safe and liquid assets. Long end of bond market. In some cases theses are negative yielding assets depending on where your talking on the globe.
They’d rather own safe and liquid assets. And lose money instead of buying risky assets. That gives you a little window into what they are thinking.
Stocks continue their march higher due to CEO decisions to do buybacks regardless of what the current price is. Regardless of what economic outlook is. Stock are completely 100% divorced from reality. They don’t tell you anything about the economy.
Money isn’t leaving bonds. Bond market doesn’t believe the growth story that the media, politicians and central banks are pushing.
Which is why as FED exits QE long end of yield curve falls towards 0%
I see commodities getting absolutely hammered including oil as inflation not only cools off but disinflation returns. It’s exactly what bond market is saying. Exactly what the offshore dollar funding or Eurodollar market is saying. It’s what the pension and insurance companies are saying.
I think FED is going to get forced by markets to make a choice between everything blowing up and nominal negative interest rates. During 2022-2023
Good call – I believe the CRB just turned Bearish after a 17 month bull run. Those calling for “spiraling inflation” have not gotten the message – accelerated QE tapering
Well , even Art Berman discounts $100 oil . See the link in my other post . Another point he brings up is that the Permian is past peak or expiry date .
There is always the chance of severe downturn, for so many legit reasons.
[the biggest one that is underappreciated is the chaos that may ensue after the 2024 US election]
But speaking of chances, it is more likely that the delaying game of ‘kick the can down the road’ will continue to be played with surprising success by the worlds big financial policy makers for the next 2-3 years.
And if so, oil price is going up and up.
Hicks , no there are no chances of a severe downturn because we are already in a severe downturn . If you ignore to recognize it then I have nothing to add . The second part of your post ” kick the can down the road ” you are correct ” so far , so good ” . The problem is that we have run out of road . Oil prices ?? I keep out of this, but my bet with Dennis stands ” $25 by 2025 .” Day to day chatter on this is not worthwhile ,at least for me .
“then I have nothing to add”
perfect truth
Hole in head,
No evidence of downturn on a World basis. The expectation for the World is 5.9% real GDP growth in 2021 and 4.9% in 2022. You are correct that we have fallen off the previous growth path for World real GDP, inflation is due to the World economy growing faster than the supply chain can keep up, at least in part.
For US 2021Q4 seasonally adjusted annual rate of real GDP growth we have
https://www.atlantafed.org/cqer/research/gdpnow
Excerpt
The GDPNow model estimate for real GDP growth (seasonally adjusted annual rate) in the fourth quarter of 2021 is 8.7 percent on December 9, up from 8.6 percent on December 7.
Your oil price prediction is likely to be off by a factor of 3 or 4.
Dennis , the first part of your comment was already replied in the last post when I mentioned about the ” base effect ” and the BS of IMF , WB etc . No need to repeat myself .
“Your oil price prediction is likely to be off by a factor of 3 or 4.” . I can say the same for all the forecasts you make and I believe there are many who support my POV . Only time will tell . We are going to be in 2022 in a fortnight , so three years is not a long time . POD ( Rockman) is now in play full time .
Hole in head,
Find a reputable forecast thats supports your POV and we can discuss.
In the mean time, calling forecasts you don’t agree with BS is a pot kettle thing.
Hmm,
So you think my guess for oil price of $95/bo is 3 to 4 times too low? I don’t think so. I would guess there is about a 99% probability that the price of oil will fall between $50 and $150 per barrel, probably a 67% probability it will be between $75 and $125/bo these are annual average Brent oil prices in 2020$ and this is the range of annual average oil prices I expect from 2022 to 2028. Your guess of $25/b in 2025 is that a month average or are you going for daily or minute by minute oil prices?
Dennis, I agree with your price projections with the caveat that I could be horribly wrong. Let me explain. Peak oil is definitely on the horizon. That would send oil prices through the roof if that became generally known. However, peak civilization is also definitely on the horizon. That could send oil prices through the floor if that became generally known. So,…. it could go either way.
Ron,
Yes peak oil will cause higher prices until we get to a point that demand falls faster than supply, my guess is 2028 or so. If we get to peak civilization that would also reduce oil prices, it is less clear to me when that occurs. Do you have a time frame in mind?
My oil price predictions assume we muddle through until 2030, after that we see oil prices falling to match supply with demand.
I never get oil price predictions right.
If we get to peak civilization that would also reduce oil prices, it is less clear to me when that occurs. Do you have a time frame in mind?
No Dennis, I have no time frame in mind. But I would bet 10 to 1 that peak oil will come before peak civilization. So I would bet prices would rise, rather dramatically, before they collapse. But of course, that is just a wild-ass guess.
Ron,
Surprisingly we agree on most points, where we probably disagree is the likelihood of civilizational collapse in the next 20 years or so, my guess is that this proabability is less than 10%, your guess would likely be higher (maybe 90% or higher). Longer term if carbon emissions are not reduced along with human population (from falling fertility ratios) the probability of civilization collapsing increases unless humans become smarter than yeast.
Surprisingly we agree on most points, where we probably disagree is the likelihood of civilizational collapse in the next 20 years or so,
Dennis, I am pessimistic but not that pessimistic. I would give it 40 to 50 years at least. And I don’t see a sudden collapse. I think the collapse itself will last perhaps 20 years as one country after another slide into anarchy.
But I am not really worried about myself. As I tell my kids, I will be safely dead by then. Of course I am deeply worried about them and my grandkids.
Ron,
Thanks. We are in pretty close agreement on several things, it is just the peak supply vs peak demand for oil where we have different opinions. My guess is that we will see peak supply from 2024 to 2027 with a rough plateau in output, but by 2028 there may be enough electrically powered light transport on the road that the pressure will be taken off of oil supply and oil prices will start to fall, then we will see significant decline in output as more expensive resources (new tight oil and oil sands projects) are postponed permanently and supply decreases to match falling demand for oil.
You probably see this playing out very differently. Oil price scenario below.
Yes Dennis, very differently.
Worldwide number of battery electric vehicles in use from 2016 to 2020
There were some 6.8 million battery electric vehicles in use globally in 2020. That year, more than three million new battery electric vehicles were added to the worldwide fleet.
HOW MANY CARS ARE THERE IN THE WORLD IN 2021?
There are about 1.446 billion vehicles on Earth in 2021. About 21% of those vehicles are in the United States.
Do the math, at that rate it would take 482 years to replace them all. Of course, the rate will pick up. If they double then it would take only 240 years to replace them all. And if they quadruple, then it would take only 120 years to replace all the internal combustion automobiles. Heavy trucks are another matter altogether.
Dennis, all this is really beside the point. The point is demand will not drop nearly as fast as you expect it to drop. But right now demand is still quite low due to the pandemic. When it does return, if covid declines, it will hit the production limit. Then all hell will break loose. I expect prices to rise dramatically at that point.
Ron,
I just addressed this question at the comment linked below.
https://peakoilbarrel.com/non-opec-oil-production-drops-in-august/#comment-731563
The average annual growth rate of new plugin vehicle sales from 2014 to 2021 is about 38% per year. If we assume the sales growth continues at 35% per year from 2022 to 2028 then the plugin vehicle fleet grows to 185 million by 2028 and to 694 million by 2035. I assume the growth in new plugin vehicle sales falls from 35% in 2028 to zero in 2033. New plugin vehicle sales continue at the 2033 rate of 76.4 million per year until the entire light vehicle fleet is replaced in 2050. Half of the World light vehicle fleet is replaced by 2035.
Note also that in reality most miles travelled occur in newer vehicles, but in my scenario I have made the conservative assumption that on average old vehicles are driven the same number of miles as newer vehicles. By 2035 in my scenario, demand for C plus C falls to 75 Mb/d, an amount that can easily be met by World supply. I also assume a transition for heavy trucks starts in 2025 and proceeds at a similar rate to the earlier light vehicle transition. About half of the heavy vehicle fleet is replaced by 2045 and 99% of the heavy vehicle fleet is replaced by 2060. For simplicity I assume fuel demand for air and water transport remain at the 2018 level (basically I do not try to analyze air or water transport demand).
Update of car sales diagram
Following the discussion, if the inflation corrected or the current oil price is better to use for the diagrams, i now prefer a different unit: The oil price has been transformed in a percentage value corresponding to the energy content of a barrel of oil (in boe, barrel of oil equivalents.). For this the energy productivity diagram has been used.
The maximum price which has ever been paid was on July, 3rd, 2008, with 144 $/bbl, that is 20.5% of a boe. Therefore, 20.5 % has been the practical limit up to today.
For car sales, the following diagram results. About 7% of a boe seems to be a limit. Below 7% the car sales can increase, above 7% they decrease.
Hi Berndt , could you convert the percentages into BTU’s available from a barrel of oil ? Makes it easier for a “dumbkoff ” like me to understand . Your posts are always interesting . Tks
Energy unit conversion is here:
https://www.traditionaloven.com/tutorials/energy/energy-multimenu.html
1 BOE = 1700 kWh
1 BOE = 5 800 640.78 British thermal units (BTU / energy)
Energy productivity is time dependent and about 0,54 $/kWh in 2021.
Norway horrified as new rates make EV charging prices higher than petrol
https://thedriven.io/2020/01/20/norway-horrified-as-new-rates-make-ev-charging-prices-higher-than-petrol/
That company won’t be around long in Norway they charge those kind of rates.
They propose to charge the equivalent of 89 cents/kwh,
whereas at my house I pay a fixed rate 11 cents/kwh-
Which also happens to be the national average in the USA.
It costs us less than $10 dollars to go 300 miles.
SK,
That article is almost 2 years old.
It would be interesting to learn how current electricity pricing translates into costs for recharging EVs.
“Norway, March 2021: The price of electricity is 0.136 U.S. Dollar per kWh for households and 0.078 U.S. Dollar for businesses which includes all components of the electricity bill such as the cost of power, distribution and taxes. For comparison, the average price of electricity in the world for that period is 0.135 U.S. Dollar per kWh for households and 0.124 U.S. Dollar for businesses.”
Very good prices.
Sounds like that company quoted above is charging a huge markup. People will work hard to charge elsewhere- like at home or work.
Here are the spot prices in September.
These are the spot prices today
Car sales peaked and were declining in all 5 of these countries well before COVID was even a thing.
The so called record savings here in the US. Is actually just $2 trillion in government transfer payments that are on the balance sheets of non bank entities within the economy. No goods and services were created and attached to the creation of this so called savings.
When the stimulus money hit people’s bank accounts. Banks actually take the money and buy US treasuries. Banks have to have a asset to back the $2 trillion in deposits which are their liability.
Well the assets that are backing these deposits. Which are mainly short term US treasury bills and notes. When FED raises short term rates the assets backing the deposits loses value. So banks will have to buy larger amounts of treasuries to back these deposits.
Which is why we see US banks holding a record amount of US treasuries. Over $4 trillion worth currently.
Current problem is FED through QE removed too many bills and notes from financial system. They removed too much of the collateral from the financial system and financial system lacks the collateral it needs to function properly. We know this is true due to the amount of reverse repo or banks using their cash at the FEDs reverse repo window to borrow collateral.
Shortage of collateral equals less dollars being created or borrowed. Inverted Eurodollar curve is screaming that this is taking place right now.
Look anybody or any article that you read that paints a rosy future is purely propaganda and when a large bank does it it’s to sell you on an idea.
Berndt,
Apologies, I seem to be a bit slow. 20.5% of what? What value was 144 divided by to get 20.5%? 100/20.5*144 = 702, so 144/702 = .205. What is 702?
Niko, my energy productivity diagram gives a value of ~0,412 $/kWh for 2008. With a barrel of oil (1700 kWh energy content) a GDP of ~702 $ has been created in 2008. 144 $ is 20,5% of 702 $.
Berndt.
The chart shows no relationship between oil price and global car sales over the past 8 years.
For example, both the highest and lowest oil price times were associated with low end car sales,
and the higher periods of car sales were associated with mid range oil price.
Clearly, other factors are much more important. Things like interest rates, general prosperity and pandemics.
Also take note that EV’s,PHEV’s now comprise over 10% global new sales [and growing rapidly]. These don’t require petrol, btw. Tesla, VW and the various Chinese manufacturers are far out in front, but others like GM and Ford have big aspirations.
I’m still experimenting, how to optimize parameters, to find out the relevant oil prices limiting car purchases. There are time effects:
– Each point in the car sales diagram is the average for 12 months.
– A person who decides to buy a car does not get the car in the moment the decision is made, it takes some weeks or months until the car is received.
If i assume a delay of three months between oil price value and car sales value, the following diagram results.
Up to now, the 3 months delay has given the highest R2 values.
The oil price limits for car purchases for the three time spans are:
2013-2015: ~237 $/bbl
2016-2018: ~57 $/bbl
2019-2021: ~48 $/bbl
Especially the 2016-2018 time span has a very high R2 value of 0.76. The red crosses form nearly a straight line.
Invitation: Take the diagram above and play with the numbers.
Example: For an oil price of 70 $/bbl about 150000 less cars are sold in 3 months (blue straight line), that is 50000 cars less per month. That is 600000 less cars in a year. How high will the oil price go, and how long ?
I have no idea how realistic such Gedanken Experiments are.
Finally, my oil price and production diagram.
The oil price is for Brent and it is in BOE.
I interpret the price maxima and their fit line as the maximum the world economy can afford for oil.
The price minima and their fit line are the minimum the oil producers can tolerate. Blue stars indicate the price limits for car production, transformed to BOE.
Both lines crossed each other in the autumn of 2020.
The y-scale is in percentage of BOE. The price is not dollar, it is energy. The blue triangle with the question mark shows an energy amount. This energy is additonal energy, which was not required before the autumn of 2020. This energy must come from somewhere. Somebody must sacrifice his percentage of the BOE so that the oil producers can get it.
Why do you assume that “I interpret the price maxima and their fit line as the maximum the world economy can afford for oil.”?
Prior price maxima in your timeframe were temporary supply/demand imbalances and price volatility in a notoriously dysfunctional market, and did not cause any sustained economic contraction. Furthermore, these price peaks were not occurring at times of oil supply constraint.
The minima explanation is simpler : they are caused by OPEC actions.
The maxima are:
03.07.2008 143,95
02.05.2011 126,64
13.03.2012 128,14
08.02.2013 118,9
29.08.2013 116,91
19.06.2014 115,19
04.10.2018 86,07
25.04.2019 74,94
06.01.2020 70,25
11.03.2021 69,63
1. Most of them are caused by political action. Some are caused by speculation. Some are caused by economics.
2. Physics tells me, that the oil price has upper limits and must have maxima.
3. Most important: The maxima exist.
Berndt,
What is your reasoning behind Physics tells me, that the oil price has upper limits and must have maxima.?
Oil prices are more or less dictated by supply/demand, speculation, geopolitical tension, monetary and fiscal policy.
The only physics that comes into it is technical recoverable resource (TRR). I think.
I will offer a contrary view-
The upper limits of oil that the world can ‘afford’ have not been tested yet.
It would take a sustained average price above a certain level for at least 6 months with resultant decline in global economy activity to invoke the idea of reaching an unaffordable price.
But its a lot murkier than that- some places and some people will pay any amount for their oil products, and yet much of humanity will priced out of discretionary use at somewhere less than $100/b. For uses that are not discretionary, much higher prices will be tolerated by most who are currently consumers of the products.
And of course- higher prices will stimulate production from reserves that are now marginal.
The chart shows global airline passenger from 1970–2019. 100% of this travel is discretionary (sorry to burst anyones bubble on this). By the end of the decade we will see how covid and peak oil and other events affect this trend.
@Iron Mike
Sorry, but i can’t explain the derivation, the formulas and results here. It’s too complicated.
@Hickory
Thesis against thesis.
Limit reached against limit not reached.
Physics against economics.
We can’t solve that.
PS: The blue triangle in my last diagram is your “Gedanken Experiment”.
Iron Mike,
Berndt may be thinking that from a big picture perspective we cannot use more energy than we have available, and that observation is correct when we look at all energy that is available to society.
Where these types of analyses miss the mark is to assume this type of analysis applies to individual types of energy (say oil production). This would be true perhaps in a World where only energy derived from oil could be used in the production, refining and distribution of oil and for every input into each of those processes.
That is not the World as it exists so a more general analysis of all energy used by society would be required and it would indeed be a complex analysis.
Hickory —
It’s also worth mentioning that airlines don’t live to move passengers around. They are mostly a tax scam and operate private currencies, aka frequent flier systems. They idea that the world would come to an end if these useless entities went out of business is ludicrous.
https://www.youtube.com/watch?v=ggUduBmvQ_4
Dennis, you are wrong.
All energy types included in oil production are included in the oil price.
I have described that in detail in the book:
Die kurze Endphase des Ölzeitalters: Erdöl, Autoproduktion und Thermodynamik
ISBN-10 : 3347487311
ISBN-13 : 978-3347487314
available at amazon.
It is in german, not english.
The blue line of the following diagram shows the required exergy calculated using thermodynamics, and the violett line shows the exergy calculated using the oil price.
Because thermodynamics does not include all exergies of the oil production process, the oil price calculation gives higher values (as to be expected).
Berndt,
I would need a German speaker to comment on your book. The price of a product is determined by supply and demand in the short run, long term in a perfectly competitive market where business attempt to maximize profits the price will move towards marginal cost of production, but average costs can be very different from marginal cost and will depend on the cost curve of the entire industry relative to demand, price will be determined at the margin, both the physics and the economics are important.
Perhaps the main point is that oil does not need to provide any net energy to be useful as other properties such as its energy density can make it a useful product, just as electricity is useful due to its convenience. As long as the total net energy provided by all energy sources meets the needs of society, we are ok.
Dennis,
the oil price since the beginning of 2020 is determined by two things:
The Covid19 pandemie drove the price down
and OPEC, reducing the amount of oil reaching the market, drove the price up.
Only if that is generalized, so that all details vanish, the “law of supply and demand” is determining the oil price.
In reality, today OPEC is ruling the oil price.
The “law of supply and demand” always has been valid for the past. It is impossible to use it for correct prediction of the oil price. Despite the law can’t be used to correctly predict the price in two weeks, when the two weeks have passed, people will say, the law has determined the price.
Compare this prediction capability with a law of physics, for example the law of gravitation.
Excuse me, but the “law of supply and demand” is useless.
“As long as the total net energy provided by all energy sources meets the needs of society, we are ok.” No, its the other way: The needs of society adapt to the energy available. That is recognizable from the number of cars sold, which goes down since 2017.
Berndt,
The causality runs in both directions, supply adapts to demand and demand adapts to supply. Which blade of the scissors cuts the paper? I agree future demand and supply cannot be predicted and so future price cannot be predicted. Social science is far more of a challenge than physical science both because controlled experiments are impossible and because a theoretical understanding of society affects how individuals behave, thus changing society and rendering the theory obsolete. The only way to develop a social theory to avoid this second problem would be to not reveal the theory to anyone.
Price is always an interaction between seller and buyer, so saying one or the other is “the” cause of the price is not sensible.
OPEC does not rule prices any more than Covid-19, there are many things that will influence the price of oil both now and in the future.
Berndt . ” “As long as the total net energy provided by all energy sources meets the needs of society, we are ok.” No, its the other way: The needs of society adapt to the energy available. That is recognizable from the number of cars sold, which goes down since 2017.”
Very well explained . I will be use this in the future to help others in better understanding of our energy conundrum . Tks
Berndt,
Well said.
The price is determined by supply and demand, or rather, marginal supply price and the marginal demand price, when these 2 meet that is the free market price.
However, as you said, covid is decreasing demand amount and hence the marginal demand price. But we can do nothing about it.
The supply side is in the hands of opec or rather, the marginal supply is only with opec (plus is included). Till the point in time that opec supplies the marginal barrel of oil, i.e. it has spare capacity, it will be in control. Shale was in control from 2015-2020 but it will move from their hands to the Saudis, where all or most of opec spare capacity resides. That’s what the Saudis wanted and they got it with the stunt they pulled last year.
Let’s see how long opec spare capacity lasts. Till then opec or rather saudi will have power over the oil price. after they, they will also lose power over the price because of limitations on their ability to produce. The limitations of anyone (Saudis) to produce will be reached for the first time ever in history. Let’s see how oil price moves with that realisation in mind.
I am predicting OPEC Plus will lose control in Fall 2022.
One of my favorites Art Berman . Very interesting connecting the dots .
https://www.youtube.com/watch?v=r1ohXxKWiI8&t=3490s&ab_channel=RebelCapitalist
Very good interview.
Shows clearly that we are between a pair of teeth.
Collapse the economy, or burn to a crisp. Take your pick.
Like the Late Bronze Age collapse, it will happen, regardless.
Revision to Permian model to account for falling prices after 2028 assumed in my oil price scenario, well completion rate falls faster after 2028 than in the previous scenario and reduces total weels completed to 89000 wells from Jan 2010 to June 2032 (no horizontal oil wells completed in the Permian aftr June 2032 in this scenario). ERR from horizontal oil wells completed after Dec 2009 falls to 34 Gb. Most of the change in output is after 2028 compared to earlier scenario so peak is unchanged, just a thinner tail.
Using the Permian scenario above with my previous scenarios from Bakken, Eagle Ford, Niobrara, and other US tight oil (not in the big 4 tight oil plays) the chart below compares the new US tight oil scenario with the AEO 2021 reference case tight oil scenario. The new “DC” tight oil scenario has a URR of 59 Gb compared to the earlier scenario with URR of 69 Gb. EIA’s AEO 2021 tight oil URR is roughly 137 Gb from 2000 to 2060.
Note also that the oil price scenario that I use is very conservative so the 59 Gb would be an F95 estimate, if a more realistic oil price scenario was utilized (perhaps a maximum Brent price of $95/b in 2020 $ in 2025), tight oil URR would be higher than 59 Gb, perhaps in the range of 70 to 80 Gb.
Shale profile supply projection at link below
https://public.tableau.com/shared/6FDHZG3ZH?:display_count=y&:origin=viz_share_link&:embed=y
More explanation at
https://shaleprofile.com/us-tight-oil-gas-projection/
From Shale profile, a supply projection for US tight oil. This assumes no increase in completion rate and no change in rig efficiency or average new well productivity from Nov 2021 to Jan 2028. In reality the completion rate will increase while average new well productivity is likely to decrease (that is what I assume in my scenario for future tight oil output).
For this scenario from shaleprofile, tight oil output is about 9570 kb/d in Jan 2028. My scenario has US tight oil output at 9280 kb/d at peak in March and April 2027 with Jan 2028 output at 9170 kb/d. The shaleprofile projection has US tight oil output at 9386 kb/d in March 2027.
Dennis.
When these projections are made, are there any comments made as to how many locations are physically left in each county, for example?
I looked at Midland County, TX. The county is 900 square miles. It is my understanding that for two mile laterals that two sections are needed, so 1.280 acres. This means if the entire county was divided into 1.280 acre drilling units, there would be 450.
Per shaleprofile there have been more than 3,000 horizontal shale wells completed in Midland County, Texas. How many wells can be drilled per 1,280 acre drilling unit before the problems LTO Survivor has mentioned become an issue?
I assume you have reviewed some granular studies on how many locations are actually possible and at what point well communication becomes a serious problem.
It seems like maybe these projections don’t take into account how many locations are actually left, and how productivity per well may decline as tighter spacing necessarily occurs.
I know this subject has been discussed here many times. Maybe someone has done the math by actually identifying each drilling unit, looking at the number of wells already completed, and estimating the number remaining? Maybe this in depth study would be proprietary? Maybe shaleprofile has this in its subscription service?
Shallow sand,
At shaleprofile I do not think the number of locations are taken into account. David Hughes looked at this for Bakken and Eagle ford and I have done so for Permian basin based on USGS studies. One thing to keep in mind for the Permian is that there are several different “benches” or horizons that can be drilled. Lets assume for simplicity there are at least two viable benches on average in Midland county, each 2 section unit can have 4 10000 foot wells in each bench. so 8 times 450 or about 3600 locations.
According to USGS Permian basin assessments (see link below)
https://www.usgs.gov/centers/central-energy-resources-science-center/science/permian-basin-oil-and-gas-assessments
There are about 50 million net acres of undiscovered resources in Permian (Midland and Delaware basins), of these the highest productivity benches have about 30 million net acres to be developed (as of the end of 2018). Based on comments by LTO survivor the optimum set up is a well spacing of 1320 feet, if we also assume average lateral length of about 9500 feet we have about 273 acres per well on average, so 30 million divided by 273 is 110 thousand potential locations, in my Permian scenario has about 68.5k wells completed after Dec 2018, economic limitations based on my assumed oil price scenario leads to only 62.2% of potential locations being developed.
Note that from Jan 2010 to Dec 2018 roughly 21k horizontal oil wells were completed in the Permian basin.
I do not have access to the full potential of shaleprofile as it is quite expensive for a full subscription ($3348/year), not really in my budget as this is simply a hobby.
The scenario from shaleprofile has a total of 25128 wells completed from Jan 2022 to Dec 2027, the assumption of no productivity decrease is clearly not realistic, but neither is a fixed completion rate for the next 6 years, the realistic scenario is a gradually increasing completion rate and a gradually decreasing level of new well productivity, that is how my model works.
My question ? Does it really matter how much shale can produce ??? The US refineries can’t use it so it must be exported at a loss . Not a very intelligent move as far as finance is concerned . Further the capacity of the foreign refineries to use shale is limited since all of them were designed before LTO came on line . What can you do with more production ( disclaimer : I know there will be no additional production , US peaked at 11.8 mbpd ) ? Send it to the SPR to replace what Biden released( sell 30 API and replace with 47 API, what a joke ) or flush it down the toilet ?
Hole in head,
There is plenty of capacity to handle the ligher tight oil throughout the World, it is very easy to refine. There are some who would like to stop the US from expoting any crude oil, if that becomes law, then there will be little point in any increase in tight oil output because US refineries can only handle about 5 Mb/d.
Many oil producers do not think this would be wise policy.
US peak C plus C output was about 12.5 Mb/d in Oct 2019 (centered 12 month average).
Your model for gradually increasing completion rate is due to your prediction that oil prices will increase during that timeframe?
Also, I do know there are multiple formations and benches within each formation. However, some of these have been very uneconomic to date. Also, it is my understanding there is communication between the benches and formations when it comes to fracks, such that maybe the multiple layered approach will not be as successful as initially hoped. For example, I think Encana’s (now Ovintiv?) “cube” completion efforts didn’t work out well at all. There were stories about that not working out in 2019. How are the RAB Davison wells doing now?
In any event, I think you have production falling off steeply after 2027. That isn’t all that far off.
I decided to look up the RAB Davidson lease. Encana drilled and completed 34 wells in their first “cube” design there. Those were completed in 2016 and 2017. Those 34 wells were all active in September and produced an average of 621 barrels per day, or a little over 18 BOPD per well.
So, I think is apparent 34 wells per 1,280 unit is too many, at least without much higher oil prices.
I note in reading about this Concho tried 23 wells in the Delaware Basin in Lea County. Those were completed in 2019. They are already down to 41.5 BOPD per well in 9/2021.
It looks like OXY has figured out 5-6 wells per unit is best. Likewise, even though Encana (now Ovintiv) still uses the term cube, a cube can be as few as six wells.
I suppose if oil gets well over $100 it might be worth it to drill on tighter spacing? Is that the idea?
Shallow sand,
Thank you for the information. I agree the tighter spacing does not make sense, I use 1320 foot spacing (4 wells per section width) with 9000 foot average lateral length (272.72 acres per well) for my scenarios.
I do not know how much communication there is between benches, I imagine the wells could probably be laid out in a manner that minimizes this communication, LTO survivor has suggested that 1320 foot horizontal spacing between laterals is optimal, I do not know what the optimum spacing is in the vertical direction between benches. I do not have data on actual spacing of wells, I have used the information from USGS and comments by LTO survivor to make a guess at the total potential number of wells.
The USGS assessments of Wolfcamp, Bonespring, and Spraberry in Midland and Delaware basins published in 2016, 2017, and 2018 have a total mean undiscovered(U) TRR of 70 Gb, I have assumed only the most productive benches are viable which reduces the UTRR to about 55 Gb and reduces the total net acres to about 30 million net acres (of 50 million net acres total in USGS Permian basin assessments). If we assume the average well will be about 273 acres this amounts to 110 thousand potential locations in the premium (highest average EUR per net acre) benches of the Wolfcamp, Bonespring, and Spraberry. In my Permian scenario, only 68.5 thousand of 110 thousand potential locations are utilized. Taken as an average over all Permian this amounts to 437 acres per well and an average spacing between laterals of 2100 feet (assuming average lateral length of 9500 feet). Clearly this will vary with core areas having tighter spacing and non-core areas having wider spacing.
The Permian scenario is quite conservative in my view as the oil price scenario is very conservative (Brent oil price is capped at no more than $75/bo in 2020 $).
Note that a different oil price scenario or completion rate scenario would give a different output profile. For example I have arbitrarily limited the completion rate to 525 new wells per month in the Permian basin, about 10% higher than the previous 12 month average maximum completion rate of 479 new wells per month. From Jan 2017 to Jan 2019 the 12 month average completion rate increased from 229 to 475, currently the completion rate is about 400 new wells per month completed in the Permian basin, if I assumed the rate increased to 800 per month the output profile would be very different, but we would run out of locations more quickly and see steeper decline.
Note that the completion rate scenario is arbitrary, I have no idea what it will actually be. Scenario for Permian completion rate (centered 12 month average) in chart below.
Shallow sand,
If one believes as I do that peak demand for oil will be reached by 2028 and that we might see decreasing oil prices after December 2028, then there is a narrow window from 2022 to maybe 2026 (roughly 48 months) where it may be very profitable to produce tight oil (especially if the average oil price is $85/bo or more over that period as I expect). After 2028 any tight oil resource that has not been developed might never be developed and any leases held will be less valuable.
So the reason to ramp up completion rates is to produce the oil while it is profitable to do so. Scenario below assumes a much higher completion rate in the Permian basin than my earlier scenario (800 wells per month maximum vs 525 wells per month maximum). The higher completion rate results in higher cumulative net revenue for the oil price scenario I have used (same for both scenarios). Also about 6 Gb higher URR for this scenario than the previous one (65 Gb vs 59 Gb). Only the Permian scenario has been changed, other plays are the same as my previous scenario.
New Permian scenario used for scenario above in chart below. Maximum completion rate is 800 new wells per month from July 2025 to Feb 2027, previous scenario had a maximum completion rate of 525 new wells per month, in 2019 the maximum 12 month average was 479 new wells per month.
Peak for monthly output in new scenario is 8794 kb/d in 2027 and for centered 12 month average peak Permian tight oil output is 8767 kb/d in August 2027.
Click on chart for larger view.
Dennis, eyeballing your graph shows an average of around 8 million barrels/day of US tight oil produced between 2018 and 2028. This works out to around 8 million x 365 days/year x 10 years = 30 billion barrels. According to Wikipedia there’s an estimated 78 billion barrels of technically recoverable tight oil in the US. I couldn’t find how much tight oil has been produced prior to 2018 but must have been billions of barrels. So by 2028 at least half of all the technically recoverable oil would have been produced. he oil past the halfway point is unusually more difficult to produce. Yet your graph shows a continual increase in production past the halfway point.
Frugal,
Your 30 Gb estimate for tight oil output from 2018 to 2028 is correct for my scenario. My scenario has output decreasing after 2027 rather steeply. I show a projection from shaleprofile (not my scenario), and from EIA AEO 2021, my scenario is the DC scenario which has output rising until 2027 and then falling steeply thereafter due to the nature of the oil price scenario I have used.
For tight oil alone the TRR is about 105 Gb, see province totals at link below.
https://certmapper.cr.usgs.gov/data/apps/noga-summary/
My scenario has total tight oil output at 59 Gb from 2000 to 2050, cumualtive tight oil output is about 21 Gb as of October 2021, the halfway point of 29.5 Gb is reached in Sept 2024, at the peak for my scenario cumulative output is 37.8 Gb at about 64% of the URR, some of this is just the assumption of falling prices due to lack of demand and the low oil price scenario I have used. At a higher oil price level (say peak price of $95/bo in 2020$), URR would be about 70 Gb and this would mostly result in a fatter tail after the peak, in that case the peak occurs at 54% of the URR. There are an infinite number of possible scenarios, most of the reasonable scenarios will have higher URRs than the 59 Gb scenario shown upthread.
Took a quick look at wikepedia for US oil resources, the article is seriously out of date.
Permian TRR is about 75 Gb, Bakken about 13 Gb, Eagle Ford about 12 Gb, no doubt there is more in Niobrara, Scoop, Stack, Austin Chalk and condensate from shale gas plays.
See USGS link above for more details, note that proven reserves need to be added to TRR reported by USGS which gives undiscovered TRR, note that not all of TRR will be profitable to produce.
At the end of 2019 proved tight oil reserves were 23 Gb, add those to UTRR and we get 128 Gb, the real number will be lower because some of those reserves were likely included in some of the older USGS assessments. Maybe 117 Gb for US tight oil TRR would be a reasonable estimate.
Frugal,
So there is no confusion, my US tight oil scenario and EIA data in chart below.
Cumulative tight oil output to Dec 2017 is 11 Gb and to Dec 2027 cumulative output is about 40 Gb. At peak cumulative output is 37.8 Gb. TRR based on USGS is at least 105 Gb (reserves and cumulative output would add to undiscovered TRR reported by USGS).
See Province totals at USGS link below
https://certmapper.cr.usgs.gov/data/apps/noga-summary/
Thanks Dennis, your projection for a tight oil peak in about 5 years looks reasonable. The previous graph showed continual increase with no peak up to 2028, which isn’t reasonable in my opinion given the resource base.
Frugal,
Thanks. I think the chart you did not agree with was from shale profile. I do not think Enno thinks that projection is realistic it is just a what if scenario where it considers what output would look like if rig efficiency, completion rate, and new well EUR were to remain constant over the Nov 2021 to Dec 2028 period. It does not consider resources, spacing, etc, those may be available in the subscription service at shale profile, I do not have access to that service.
Wikipedia does not take into account pressure depletion and communication between Wellbore frac stimulation. EOG is making 18 bopd per per well. This is barely economic even at todays price. Good luck with these predictions. Every day that goes by, pressure is depleted and yes these wells can make 18 bopd but with water disposal cost, workovers, labor and electricity costs we are entering into shale Stripperville and that will not be pretty.
LTO Survivor,
My scenarios assume that Permian wells are plugged and abandoned at 20 bo/d with cost to do so at 500k per well in 2020$. Spacing assumed to be 1320 feet between horizontal laterals (4 wells per section width). I imagine the geophysicists and petroleum engineers at the USGS are aware of pressure depletion.
My scenario ERR ranges from 34 to 40 Gb for the Permian Basin, the USGS F95 TRR for Permian is 45 Gb (this includes 5 Gb of cumulative output and reserves at the end of 2017), undiscovered TRR was 40 Gb for the assessments in 2016. 2017, and 2018 for Midland Wolfcamp and Spraberry, and Delaware Wolfcamp and Bonespring formations. For those unfamiliar with the terminology an F95 estimate is at the low end, it is expected that there is a 95% probability that resources will be 40 Gb or more.
The mean (best guess) estimate for undiscovered technically recoverable resources for the USGS assessments of the Permian basin is 70 Gb, when cumulative output and proved reserves are added to the undiscovered TRR the total TRR is 75 Gb for the best guess estimate. My scenarios have 45% to 53% of the mean TRR as economically recoverable resources with an assumed maximum Brent oil price of $75/bo in 2020$ from 2022 to 2028.
Link to USGS Permian basin assessments below
https://www.usgs.gov/centers/central-energy-resources-science-center/science/permian-basin-oil-and-gas-assessments
https://www.zerohedge.com/energy/us-shale-slams-bidens-oil-policies
I guess most of this was for consumption at IHS convention in Houston. It is a bit surprising mainstream media did not ask for their opinions on gas prices.
March, maybe abstracts going out.
FED will likely double rate of taper think it’s Wednesday when they meet. I won’t be surprised if this is bullish for stock prices. You know because economy is doing so well an increase in rate of taper is in order.😁
I doubt it will be bullish for oil. Dollar becomes risk on trade for awhile. Market will look at it as, as long as FED is comfortable moving towards trappering QE to zero and rate hikes we want to be long dollar denominated assets.
We seen this before and commodities and oil didn’t do so well. Stocks did fine though. Well they did fine for awhile right up until DEC 2018 when things broke and FED stepped in with drastic measures.
The 2000 tech crash was a few months after the FED dried out the money supply too much. The 2008 crash, too.
The stocks always managed to stay a few months in free air, like Coyotee from Roadrunner.
If they pull off this whole stunt – oil will fall first, stocks crash later. And the FED will reverse, doing new QE in double speed. The USA still can’t afford a total stock crash – since they will take the whole banking and credit system down in their fall if it is not prevented. And this will lead to BLM on crack and speed type of riots in the streets when small business will fall because of credit problems.
Next stop for WTI is somewhere in the $50’s
And then, when QE get’s near zero, the next stop for the S&P is at 2200, the 2020 low. No real support has been created until this value – only a long weightless levitation based on the FED put. This will continue running for a time, until the most reckless margin trader has to sell.
Insider selling is big the last month (I think on ATH) – it’s not only Musk that takes billions out of his Tesla stock.
Guys , insiders are selling but to whom ? The answer is here . I have a gut feeling that ” the unravelling ” has began .
https://wolfstreet.com/2021/12/12/share-buybacks-hit-record-ahead-of-potential-1-tax-on-share-buybacks-buy-high-dont-buy-low/
What could go wrong ?
https://www.zerohedge.com/markets/chinas-banking-assets-are-52-trillion-growing-40-trillion-2008-what-hyper-mmt-looks
52 trillion China plus 30 trillion USA plus 25 trillion EU . Oh forget it . What is trillion between friends? . If all the minerals that remain on the planet were mined they would still not cover the ponzi . Enjoy it while it lasts .
It’s just numbers to keep the game on. They will be paid back some day, all. In one or another way, but the natural worth of all paper money systems has always been Zero.
When it gets too bad, it’s time to start a new one with other president or king heads on the paper.
And this is even more easy with the new digital currencies. Switch off the old one, generate a new seed and off you go.
It’s still not the time for this – there is still enough life in the current state of the system.
My great-grandmother once paid a billion for a bread. And my grandmother papered a wand with money – the before 1949 money was just devalidated, not inflated.
And that’s the way the money will go, someday. Money is just the tool to make people go to work and to distribute the outcome of the work. Works more or less good.
When it is disturbed too much and nobody drills for oil and everyone creates TikTok videos, then it’s time for a restart. And when everything is regulated, making sense or not like corona rules, it’s called socialism.
Exactly what I was talking about the other day. And they have a currency that’s been appreciating against ever other currency for more than a year straight an not just a little bit.
But if you tell people crisis is imminent in China they brush it off like it can’t happen.
HHH , taper what ? The FED is trapped .
https://pbs.twimg.com/media/FGexSKyX0AQ1kNh?format=png&name=small
FED is going to taper. Stocks are probably going to fall this week, next week too as corporate buybacks are in blackout. So don’t read too much into that. Soon as corporates can restart buybacks the the dip will be bought. Regardless of whatever is going on in the world.
In real world pay attention to bond yields, consumer sentiment things of that nature to get a real reading on how well we are doing.
There are currently about 11 million job openings in US. If corporate USA were to pay a wage clearing price for labor there wouldn’t be 11 million job openings.
Now ask yourself why won’t they pay? If economy was doing great and growth was going to be what FED and IMF says it’s going to be. Why wouldn’t they pay whatever is needed to fill jobs?
Corporate USA doesn’t see growth in the future. And only way to increase shareholder value is stock buybacks.
Weimar is back . Eulen & others get the pitchforks and wheelbarrows ready . The inflation genie is now out of the bottle .
https://wolfstreet.com/2021/12/13/wholesale-price-inflation-in-germany-totally-blows-out-highest-in-the-data-going-back-to-1962/
Hole in head,
The average annual rate of inflation from 1918 to 1923 in Germany was about 251% per year, about 15 times higher than the increase in German wholesale prices in the past 12 months (16.6%). Much of this is probably a result of high energy prices in the EU.
Dennis , I know my history . Weimar was used as a metaphor . I don’t know how many Germans you have interacted but I have with a few during my days as an importer of used machinery in India and then later exporting auto parts and supplying rebuilt VW engines from Budapest . The two things that get them uncomfortable are the Weimar inflation and Hitler . For Germans inflation and Nazism are dragons . The Euro would have been formed in the time of Degaulle but for Ludwig Erhard who knew that the weak French economy wanted to ride on the shoulders of the strong German fiscal discipline . The Euro would never be made because the German CB’s knew that they would foot the bill . They insisted that the head of the ECB will be a German to ensure discipline and that the ECB will do what the the head of CB of Germany will tell them to do . The Euro launch got stuck in limbo for 30/40 years . What changed ? The collapse of the FSU . A deal was made . German reunification in return for Germany agreeing to a common European currency and to drop the insistence that the resultant ECB be run by a German . French president Mitterrand and GWB 1 were the architects of this deal . Kohl agreed . Just to inform you that 1 Ooster mark ( worthless) was changed for a solid West German DM on reunification . It took 10/15 years for Germany to recover from this . Well that is history . We are where we are today . 16.6% may mean nothing to you but to a German that is flashing DEFCON 1 . We can argue the reasons for this rise , but the issue we should be discussing is , will these reasons go away ?? Germany’s “Energiewind ” program , closure of nuclear facilities etc , with an increasing dependent on foreign resources mainly Mr Putin are going to be the straw that broke the camel’s back .
P.S : The first ECB president was Wim Duisenberg from Holland who strictly followed the dictates of the Bundesbank . The second was an idiot Frenchman named Jacques Trichet whose actions have bought us where we are today , just as Ludwig Erhard feared in the 50’s and 60’s . Germans on the blog please rectify if I am wrong . By the way Jans Weidmann the boss at Bundesbank resigned after the elections ” to spend time with family ” . The last line of resistance has been breached . Watch for Lagarde at ECB hit ” Print to infinity ” .
HiH, remember that americans never had to use wheelbarrows of cash to buy a loaf of bread… But an excellent post nontheless!
Hole in head,
My point was simple, the metaphor was not apt. I also am familiar with the history. These are unusual times, supply chain problems have lead to shortages and price spikes.
We are very far from hyperinflation in Europe. The ECB will tighten, and the Fed, most nations will follow suit. If the tightening is not over done inflation will subside without an economic crash, usually too much is done and this leads to a recession. Simply talk of tightening and a tiny move in interest rates may be enough.
Laplander,
It is doubtful there are many alive who would have been old enough to be buying a loaf of bread in 1923, this implies a birthdate of at least 1918, there are not a lot of Germans left that are 103 or older. For most this is a story told by grandparents or in history lessons.
Dennis . If the FED is in a bad place with tapering and interest rate problem , the ECB is in an even worse situation . ECB is now the sole buyer of EU bonds and its balance sheet is stuffed with junk bonds of Italy , Spain , Portugal etc . ECB is now the largest “bad bank” in the world . Italian 10 year is 1.16% , even lower than the treasury . The situation is out of whack and now add to this the energy crisis . Grab some popcorn .
Edited to add: I have real life experience of inflation .25% per annum in India and 33% per annum in Hungary . In Budapest menu cards were in laminated plastic and prices were written with a felt pen everyday . Luckily for me ,my income was in USD while in India and German Marks when in Budapest .
Dennis, that was part of my point regarding americans, if they had grandparents telling about it, it would be more obvious that it can, and in some case will, happen. But with fiat money and digital “money” things are a bit different now, so interesting times!
HHH . How do you taper a Ponzi ? 🙂
It can be done. Just going to be painful at some point. And that point might not be immediate. So crash can be blamed on some other future event.
Emerging market dollar denominated debt on other hand might blowup fairly fast. But as long as the credit spigots are open to corporate USA I see the downside being limited at first. Right up until some of the monetary plumbing breaks. And that might take awhile. Then FED will ride back in to the rescue.
I think a short hyperinflation as excuse for a new currency is the more clean and painless way.
What do you do if you taper a ponzi? You cut money supply – then the stock and much more the real estate market will crash.
And all these trillions in mortage bonds will go from AAA to D–, since the security isn’t there anymore. Office buildings (a huge market) are on the brink anyway with all this corona home office stuff. And then banks and pension fonds will go broke – and at this point no company will get any more credit. And don’t forget – they all have been busy the last 10 years to stock buyback on cheap bonds. When they can’t roll anymore, they are toast.
If you let this run, everyone is broke and you have war in the streets. Liberal and repuplican states will seperate, trying different solutions.
So the FED will step in before this and print even faster than the last time, buying up all distressed bonds (and even stocks this time) until even “Shady Shack Company” can lend for 1%.
And at the moment the belief in money breaks, velocity pulls up and you get hyperinflation. Or, when the belief ist still there, endless stagnation and slow decay – the Japan scenario of slow dying empires.
37% of all Permian active horizontal wells that had been in production more than 24 months produced 25 BOPD or less in September, 2021.
61% of all Permian active horizontal wells that had been in production more than 60 months produced 25 BOPD or less in September, 2021.
Thought this might be of interest. Easy to understand for me at least.
The question I have is the same question you have asked several times: who is going to manage all these stripper well operations in 5-10 years? Somehow it doesn’t sound very sexy for large companies to be managing thousands of stripper wells.
Schinzy,
The large companies will try to sell the low output wells to smaller operators, if they cannot find a buyer the wells will be plugged. Mike Shellman believes this will occur at a maximum output of 20 bopd, he would obviously know much more than me. One thing that is tricky about the shaleprofile data is that if there are 5000 wells that have been producing for 60 months or more, Enno takes the total output from those 5000 wells and then divides by 5000 to find average output. In many cases there will be a large proportion of these older wells that are inactive due to maintenance or other problems, for simplicity let us assume that on average, wells older than 6 months tend to have about 50% of the total population inactive and their average output is 25 bopd. This implies that the active wells have an average output of about 50 bopd. This might change the economic analysis a bit because inactive wells might have lower OPEX than an active well, though this would need to be confirmed by someone more familiar with the nuts and bolts of producing oil than me.
Shallow sand,
From shaleprofile.com in August 2021, 48% of Permian horizontal oil wells that started producing from 2008 to 2016 were producing less than 25 bopd. Of that group of wells, (all that started producing before 2017) 10338 were producing, 1580 were inactive, and 230 had been plugged as of Aug 2021. The total number of wells is 12148 and they were producing 309308 bopd, so average output of all wells was 25.46 bopd, but if we take the active wells only the average output of the active wells was 29.9 bopd. The average output of the wells producing 25 bopd or less that started producing before 2017 is only 10.5 bopd, but I do not know how many of these low volume wells were inactive or plugged.
Data from post linked below
https://shaleprofile.com/blog/permian/permian-update-through-august-2021/
Dennis.
One thing to note, Pioneer operates as a many as 10k vertical low volume wells. Those mostly make under 15 BOPD.
I suppose if these wells do not make much water and do not require a lot of down hole repairs, they might be profitable in a higher price environment.
However, those wells have flattened out whereas the horizontal wells don’t seem too.
Horizontal wells are generally more expensive and more difficult to operate compared to vertical wells.
Shallow sand,
Thanks. I imagine horizontal wells will have roughly 10% terminal decline rates at levels of output that are feasible (say more than 10 or 15 bopd) and yes I am aware that expensive down hole repairs and higher OPEX will make the low volume horizontal oil wells unprofitable at a far higher output than vertical wells for a similar level of water to oil ratio.
I am mostly thinking that sometimes small operators can run with lower overhead expenses than a larger company and make low volume wells profitable, the same might be true for some of these horizontal tight oil wells, but based on your comments, (and clearly you know far more than me) it would be a high risk endeavor and probably not a high enough reward for the risk involved.
Am I correct in my guess that on average an inactive well would have lower OPEX than an active well? No doubt there are many things about the business that I am unaware of so I would not be surprised if it was the opposite of what it looks like to me.
Dennis.
An inactive well would have lower OPEX. But inactive wells generally cannot be left shut in forever. They eventually have to be returned to production or plugged and abandoned.
P & A of these shale wells is likely an expensive matter. Also, leaving such wells shut in for a considerable time could require expensive workover if returned to production.
Oil price will be a big factor, of course. Also, if natural gas prices remain higher, this could also help the economics.
I like to mention these wells because few people do. The reality is almost all shale wells become stripper wells 10-15 years after completion, and there are reasons why they cost more to operate than most Lower 48 US conventional wells.
Shallow sand,
Thank you.
For my model scenarios I assume wells are shut in at 20 bopd and use an average PA cost of 500k per well in 2020$.
Can you give me a rough idea of what you expect the net PA cost for these wells will be after any usable equipment is sold?
Also note that I assume OPEX per barrel is $35.36 per barrel when the average 2019 well reaches 20 bopd at 141 months from first flow. EUR is 406.5 kbo at that point. Breakeven price at 20% annual discount rate is $56 per barrel in 2020$ at wellhead assuming a full cycle well cost in 2020$ of $10.5 million. I assume natural gas sells at $2.50/MCF (2020$) and NGL sells at 33% of the price of crude. Cumulative natural gas output over the 141 month life of well is 1814 Million cubic feet, and cumulative NGL is 150.6 kb.
By the way, a dirty little secret that we all quietly suspected to be true is that these wells will not have hyperbolic declines but exponential down to stripper levels.
LTO Survivor.
I assume exponential decline after 66 months at 15% per year for the average 2019 Permian well, EUR is 406.5 kb of crude plus condensate with well shut in at 20 bopd after 145 months. Well profile in chart below that is used for my scenarios.
https://oilprice.com/Energy/Crude-Oil/Investors-See-Peak-Demand-Happening-Much-Further-In-The-Future.html
Excerpt:
Two and a half years ago, a fifth of oil investor clients polled by Bloomberg Intelligence said that oil demand would peak by February 2021, BloombergNEF’s Chief Content Officer Nathaniel Bullard notes. In June 2019, another one-third of oil investors thought we would see global oil demand peak by 2025. In previous surveys, most investors expected peak oil demand by 2030.
But the latest survey from last month showed a stark difference in the general timeline to peak oil demand compared to the previous four polls.
Currently, just 2 percent of oil investors believe peak oil demand will occur by 2025, and fewer than 40 percent see that peak before 2030. One-third of investors expect oil demand to peak between 2025 and 2030, but another one-third think that peak would be after 2030, at some point between 2030 and 2035.
If they only knew! 😥
I find this astonishing. Fifteen years ago everyone was talking about peak supply. But peak supply didn’t materialize, we got it wrong. The word went out that there was enough oil in the ground to last 100 years. Now peak supply is not even considered a possibility. Only peak demand is even ever mentioned. Now they are the ones who have it wrong. They are in for a big surprise.
Ron , ” He laughs last ,laughs best ( a small change “laughs loudest ” ) . 🙂
How the heck is voluntary reduction is fossil fuels going to take place while at the same time billions of impoverished people attempting to claw out of poverty by burning more fossil fuels. Peak demand isn’t going to happen.
Latest DPR report shows Permian output and total output continuing to rise.
It looks like only Dennis and the DPR continue to believe that LTO hasn’t peaked. We may get a better read six months from now when there are not many DUCs remaining and the rate of completions starts to slow. In the meantime check the attached table which shows the November DPR output and today’s numbers. Permian and EF production continues to grow.
I picked this comment from Kurt Cobb’s blog . This was made in relation to the David Hughes report . Very interesting what he says about DUC ‘s . I have long maintained that they are “red herrings ” . LTO etc please chip in .
“For years in my mineral rights valuations, my decline curve expert has estimated reserves well under that of projections, in the Fayetteville Shale. The 40 BCF per section seems to top out at about half that.
Further, the decline is steeper than predicted and those 30 year wells are mostly gone by year 8 or 10. One issue is communication. In application to the AOGC, operators want to delay completion or refracc’ing often arguing that the wells are communicating. As a result numerous “DUC”s are sitting idle after 4 or more years and probably will never be drilled. Milk it or move it I say. Operators should not be allowed to shut in wells for a decade and some of them are basically doing that.
If communicating across section boundaries, which is a given, then some mineral owners are suffering undue loss while others benefit from a windfall. “
Ovi,
So you are not convinced that tight oil will not reach a new peak?
If the trend of the past 8 months continues for the next 14 months, a new peak in US tight oil output will be reached.
If, if, if? Yeah, if all those things happen then there will be a new shale oil peak. And if US conventional oil production suddenly stops declining, then we could have a new US peak. But even more important if all those world production nations that are in decline, suddenly stop declining, then we could have a new world peak sometime around 2027.
Yeah, if, if, if.
Ron,
The declining nations have been declining at about 500 kb/d per year. The increasing nations have been increasing at about 1500 kb/d per year. No assumption is made that declining conventional in the US or declines from the rest of the World stop, simply that increases will continue. If they do not then oil prices will rise enough to reduce demand and increase supply.
There is little sign that increases will stop any time soon.
Dennis, World C+C production, less the USA, Saudi, and Russia held a two-year bumpy plateau at about 51 million barrels per day. Then in just two years, their production fell by 2 million BPD, just before the pandemic hit. Now, after somewhat recovering from that drop they are down by another 2.5 million BPD and stuck there. They are down, from their two-year plateau, 4.5 million BPD.
Russia has peaked so it is up to Saudi and the USA to take up this slack after they reach their pre-pandemic level. Dennis, that is not going to happen.
Ron,
From August 2017 to August 2019 the centered 12 month average crude output of OPEC less Saudi Arabia fell by 2268 kb/d because output was being reduced to support oil prices (along with sanctions on Iran and Venezuela). That is the main reason for the drop in your chart above.
If we look at World C C less US, Russia and OPEC from Jan 2017 to Dec 2019 we find that output increased bu 109 kb/d per year (using OLS trendline).
Russia can increase output to 11 Mb/d and hold that level for a while, US, Russia, Canada, Brazil, Norway, Guyana, Saudi Arabia, Iraq, Iran, UAE, and Kuwait can all increase output from current levels and above the level of the centered 12 month output in 2018 when the World was at peak output. This group of nations will be able to increase to above the previous peak and will be able to make up for decline from the rest of the World, probably by the end of 2024 (12 month centered average for July 2024 will likely be more than the current World 12 month average peak in C plus C output.
“If they do not then oil prices will rise enough to reduce demand and increase supply.”
Which is the not the definition of supply peak.
Supply peak is when the supply can not increase regardless of price.
I appreciate all the work you put into your modeling and generally I accept your guesses. But I’m pretty sure that people aren’t all that concerned about paying a buck or two more for a gallon, they’re concerned about paying $10 more and perhaps not having access at all.
Otherwise this is just an economics equation.
Pops,
People will complain if they pay more for gasoline, real gasoline prices in the US are not going to increase to $13 or $14 per gallon before 2028 and likely not ever (probability less than 5% in my opinion for any 12 month average price over the next ten years.
I do not expect peak supply before 2027, though we might see a plateau in output from 2025 to 2029 with high oil prices which would qualify as peak supply in my estimation, by 2029 the transition to electric land transport will reduce oil demand to less than oil supply and oil prices are likely to fall when this occurs.
In addition, OPEC and other producers (US, Russia, Canada, Brazil, Norway, and China) will begin to realize peak demand is approaching and may start to develop their oil resources more aggressively as they may become worthless as demand for oil wanes after 2028. In that case OPEC plus might fall apart and everyone may produce all out in a fight for market share, such a scenario might keep oil prices relatively low (perhaps under $80/bo). Much will depend on the sales growth rate of new plugin vehicles which has been at an average annual rate of 38% from 2014 to 2021.
Link below to a bloomberg report on evs
https://about.bnef.com/electric-vehicle-outlook/
interesting chart at link below
https://cdn.fs.turtl.co/ojiOtAOiTcEEDMe2BaJw
Dennis
I think you mis interpreted my comment. I don’t believe everyone else saying that the Permian has peaked. I agree it will continue to increase for the next 6 to 9 months. By that point most of the DUCs will be gone. I am not sure what happens after that. It will depend on the price of WTI.
Also I am not sure of the role of the majors and the smaller drillers. Will the major oil companies refrain from drilling to keep the price up while they spend capex on other sites and divy’s and share buy backs for the shard holders.
Note that at the end I pointed out that output is continuing to grow.
Ovi,
If there is demand for more tight oil, it is likely that oil prices will be high, if oil prices are high (WTI over $75/bo) rig counts are likely to increase to a level that DUC count can be maintained at whatever level the industry prefers. If the market demands Permian tight oil it can increase to as much as 8500 kb/d by 2027, all that is needed is more horizontal oil rigs drilling wells in the Permian basin. At 1.3 wells drilled per rig per month and a completion rate of 800 new wells per month about 615 horizontal oil rigs would be needed in the Permian basin. The highest level for Permian horizontal rigs historically was 443 in Jan 2019, enough to drill 576 wells in a month, so 615 rigs would be about 38% higher than the previous peak number of horizontal oil rigs. Over the past 12 months the Permian horizontal oil rig count has increased at an average rate of 4.2% per month, if that rate continued for the next 20 months the Permain horizontal rigs would be at 615. I assume the Permian reaches this level in July 2025 or roughly 42 months, so only a 2% monthly growth rate in horizontal oil rigs would be needed in the Permian basin for my “high completion rate scenario” which has peak Permian output reaching 8794 kb/d in July 2027.
This level of output is only likely in a high oil price environment, my conservative completion rate scenario (525 completions per month with 404 rigs needed) has a peak of 6562 kb/d in Jan 2029.
An intermediate scenario (average of low and high scenarios) has a peak in Dec 2027 at 7581 kb/d.
The Permian tight oil scenarios in chart below URR ranges from 34 to 40 Gb (34, 37, 40). Of course an infinite number of scenarios is possible between the low and high scenarios as well as infinite possible scenarios above and below my low and high scenarios. The future completion rate is unknown.
https://twitter.com/JavierBlas/status/1470459005390798849
NEW RECORD: The European natural gas benchmarks closed today at a ***record high settlement price*** (intraday was higher in October). Dutch TTF closed at at €116.084 per MWh and UK NBP closed at 294.54p per therm (chart below). That’s alike ~$220 per barrel of oil equivalent.
Dutch TTF:
https://www.barchart.com/futures/quotes/TG*1
European Gas And Power Prices Jump As Supply Shortage Fears Erupt
French power contracts rose to 329 euros per megawatt-hour, the highest ever.
Latest European Power Markets data:
https://www.energylive.cloud
Germany power prices > Eur 200 per Mwh in history . Goodbye industry .
https://pbs.twimg.com/media/FGfMgI-XsAAH2XI?format=png&name=4096×4096
Up another 9% so far today. €127 ~$240 per barrel of oil equivalent. French power contracts at 346 euros.
…and up another 8% today. €142.7 per MWh ~$270 per barrel of oil equivalent.
Hinkley point C locked in prices seems like a bargain, buy now, or lose out!
(it´s not yet operational, and will not be for a few years, but who cares… )
Edit, to clarify, the locked in price is currently at 125E/MWh.
https://en.wikipedia.org/wiki/Hinkley_Point_C_nuclear_power_station
Saudi Oil Minister Says Global Production Could Plunge 30% This Decade
Saudi Arabia said global oil production could drop 30% by the end of the decade due to falling investment in fossil fuels.
“We’re heading toward a phase that could be dangerous if there’s not enough spending on energy,” Oil Minister Abdulaziz bin Salman said in Riyadh. The result could be an “energy crisis,” he said.
Prince Abdulaziz’s comments came shortly after the Saudi finance minister made a similar warning.
In Saudi Arabia, oil rig count fell to record low in November:
https://ycharts.com/indicators/saudi_arabia_oil_rotary_rigs
Saudi Rig count. They went from 69 in January 2019 to 27 in November 2021. Why?
They’ve probably already drilled everything worth drilling. Their only short-term hope is the Neutral Zone but it won’t be enough to compensate for their exhausted super giants.
Interesting claim, evidence?
Ron,
Pandemic is the main reason and low oil prices.
Oil prices reached pre-pandemic levels in March 2021 and are now slightly above pre-pandemic levels. Saudi oil production is now slightly above their pre-pandemic production level.
I think perhaps they have run out of new places to drill. Virtually all their drilling for the last decade have been infill wells. Then again, there may be another reason.
Ron,
They no doubt would like higher oil prices and currently claim the market is well supplied. The rigs are adequate to keep production at the level they believe is required. If there was no place to drill, the count would be lower.
If there was no place to drill, the count would be lower.
Not necessarily. They have enough places for 27 rigs to drill, just not 28. 😂
Ron this is a rate thing, 27 gives them enough output to meet their output target, 28 rigs would result in more output than needed.
No, it doesn’t work that way, Dennis. Rigs do not produce oil. The oil is not produced until the well is already drilled and pipelines are laid to deliver the oil to the GOSP. It is sometimes months after the rig has left before the oil starts flowing, depending on how remote the well is.
Ron,
Often oil rigs are used to drill oil wells. It is quite difficult to produce oil if a well is not drilled, shovels can work in some cases, but it takes longer. 🙂
As wells deplete, more wells are drilled to maintain output levels to send to the GOSP.
As wells deplete, more wells are drilled to maintain output levels to send to the GOSP.
Dennis, Saudi doesn’t have any shale wells. When their wells deplete that means the field is depleting. Of course, when the field is an anticline, the lower wells will decline before the wells higher on the anticline. But they cannot just replace these wells by drilling more wells higher on the anticline. They already have wells there. And those wells are horizontal wells pulling oil right off the top of the reservoir. And when those wells water out it’s all over.
But Saudi has been drilling infill wells for two decades now. You know they must be running out of places to drill. And when those infill wells start to water out, it’s all over. That is happening in spades right now in Russia. And I would bet my bottom dollar it is happening right now in Saudi Arabia as well.
Ron,
We will see. They have been managing pretty well since Matthew Simmons claimed this back in 2004, eventually all nations will peak, there is little evidence Saudi Arabia is near that point.
In fact when Saudi rig count increases some people say this shows they are near their peak, now rigs decrease and the same claim is made, basically people will say Saudi Arabia is very near peak output, as has been the case since 2004, eventually the claim will be correct, my guess is that it will be between 2028 and 2035.
But if they keep drilling and finding nothing but oil-stained brine, why keep drilling? Of course, I don’t have proof of this, as you have no proof of your theory that they have so much oil that they don’t need to drill.
We are all speculating Dennis, and I am sure you know that. So why do you demand that Frugal show evidence of his speculation? Shouldn’t you hold yourself to the same standard?
Dennis . Your reply to Pops “may start to develop their oil resources more aggressively ” .
What resources ? Have you become a believer in abiotic oil ? Ron is right on dot . How can you bring oil which does not probably exist online ? Your argument is ” if ” this and “if ” that . I will not add more . Ron has said enough on your “if ” .
Hole in head,
there are a number of peer reviewed articles which suggest there are a lot of resources, whether they are developed remains speculative. Claims that their are no resources is specious.
See Section 3b of paper below
https://royalsocietypublishing.org/doi/10.1098/rsta.2013.0179
In 2011 2P reserves reported by IHS for the World were about the same as reported proved reserves by BP.
OPEC has reserves, less than they claim but significantly more than zero.
See also work by Jean Laherrere, in a 2018 estimate he had World URR at about 2800 Gb.
https://aspofrance.org/2018/08/31/extrapolation-of-oil-past-production-to-forecast-future-production-in-barrels/
see summary on page 115 and charts on pages 15 and 16 where he has recent HL estimates of 2600 Gb to 3000 Gb for World C plus C less extra heavy oil, if we took the average of these two (2800 Gb) and add Laherrere’s estimat of 100 Gb for extra heavy oil URR we would have a World C plus C URR of 2900 Gb.
I would note that Ron’s , your’s and everyone’s speculation about the future contains if’s, there are no facts about the future, it is ifs all the way from now to any point in the future.
The “if” argument is very weak indeed.
Dennis , you forgot the Monterrey formation resources which were discounted 95% by USGS from their initial assessment . Resources are not reserves . You know better .
Ron,
I have never said they do not need to drill, I said they have adequate output when they drill wells at the rate that 27 rigs can deliver.
Nor have I have ever said they have so much oil they need not drill, they have had rigs running since 1995 and likely since 1950 (or earlier).
My evidence for there being reserves in Saudi Arabia from
https://www.demac.com/dm-confirms-independent-assessment-of-reserves-in-saudi-arabia-for-the-saudi-arabian-oil-company/
This was an independent audit, the result was 268 Gb of proved oil reserves at the end of 2017.
Hole in head,
Wrong. It was an EIA report by a company called Intek, not the USGS that made the bad estimate for Monterrey (15 Billion barrels).
The USGS assessment of tight oil (USGS calls this continuous oil) was 21 million barrels in 2015, this was the only USGS study of tight oil ever done by the USGS for the Monterrey Shale. Other USGS studies were for conventional oil. See link below for USGS report
https://pubs.usgs.gov/fs/2015/3058/fs20153058.pdf
I have always said that EIA report was crap, I use resource estimates by the USGS (where the geophysicists are in charge), the EIA is more focused on economics. I would note that my tight oil URR estimate is about half of the EIA’s tight oil URR estimate (62 Gb vs 137 Gb).
Link to EIA report below
https://www.eia.gov/analysis/studies/usshalegas/pdf/usshaleplays.pdf
On page 75 is Monterrey estimate of 15 Gb, my estimate has always been no tight oil from this basin. On page 5 of the report we have the total estimate for tight oil in the US, it was 24 Gb, if we deduct the 15 Gb mistake it would be 9 Gb as of Jan 1, 2009.
Currently cumulative production of tight oil from Jan 1 2009 to Dec 2019 is 14.9 Gb, proved reserves of tight oil at the end of 2019 were 23.2 Gb for a total of 38.1 Gb, note also that proved reserves are an F95 estimate, the engineering best guess s 2P reserves which are typically 40% more than proved reserves. Tight oil 2P reserves would be about 32.5 Gb, add cumulative output to Dec 2019 and the total is 47.4 Gb, about 2 times the bad estimate from July 2011 and over 5 times the 9 Gb estimate found by deducting the 15 Gb mistake.
Jean Laherrere knows his stuff, URR stands for ultimately recoverable resources and they are the resources he expects to be recovered.
My Shock models have URR at about 2500 to 2600 Gb as demand falls in the future reducing oil prices and making much of the potential resource not economic to recover, probably 600 to 700 Gb of crude plus condensate.
Longer term Saudi Oil Rig count, 1995 to 2021 from
https://bakerhughesrigcount.gcs-web.com/intl-rig-count
Dennis , so now the independent auditors . From their website “DeGolyer and MacNaughton is pleased to acknowledge the recent completion of the first contemporary independent assessment of reserves in Saudi Arabia for the Saudi Arabian Oil Company. ”
So they were paid by Saudi Aramco . 🙂 . Hey that reminds me of all those housing junk bonds classified AAA+ by the rating agencies just prior to the GFC 2008 . Guess who paid the rating agencies
?. Follow the money .
Hole in head,
Every audit of reserves is paid for by the oil company, is your argument that no reserve numbers can be believed anywhere? In that case we could assume nothing about reserves anywhere in the world. Or about financial statements for any company because those audits would also be paid for by said companies, so they must all be fraudulent. Is that what you would like to claim?
Dennis ,exactly . The auditors are a case of ” The fox guarding the chickens ” . By the way this audit report was presented to Wall Street when MBS wanted to list Aramco on WallStreet . It was junked as ” not worth the paper written on ” . Eventually Aramco was listed on the Riyadh or Jeddah stock exchange and all the Saudi billionaires were made to buy the shares at gunpoint . Look up the Marriot incident where they were all locked up . As to audits worldwide . Well were Enron, Worldcomm, Lehman, Madoff , Washington Mutual audited or were they operating without auditors ? Is Shell audited ? How come they wrote off 3.9 BILLION Boe of reserves in 2004 ? Maybe you heard of an auditor called Arthur Anderson ? Can’t find them in the telephone directory . Vanished .
On a personal note my son and daughter in law work at Ernest and Young since 15 years and my son in law is a top honcho at Pwc . Company fraud is our dinner table talk . I think I will just keep shut up now . You can believe all you want to believe . Best of luck .
What, the Saudi’s are not going to develop their 268 billion of proven oil reserves by 2030?
So Saudi’s are warning of underinvestment. And are underinvesting themselves?
27 rigs doesn’t look like they are stretching their budgets ;).
Perhaps they derive from themselves to others… The only ones with real reserves in the region are Iraq, Iran and Lybia in my opinion. They had so much political troubles the last 50 years so they aren’t as pumped out than the others. But these troubles continue… and now China wil step in.
Only thing China can really do is loan US dollars. That Iraq ,Iran an Libya will struggle to repay. Because of their instability.
I think China will find out investing with a foreign currency that they have to have and can’t simply print more of will end badly when they are defaulted upon.
HHH , China’s ability to bail out the world is overestimated . Right now they cannot even cover the need of their vassal and strategic partner Pakistan for US Dollars . Pakistan has asked IMF for funding . China has basically abandoned the OBOR project because of defaults . China lowered it’s RRR to release $ 188 billion into the Fx market because it is facing problems with its dollar funding . USD’s are needed for all energy imports . Coal imports up by 200% .
They’ll have to send their own companies, with own workers – payed in their own currency. They’ve done this in Afrika lots of time – most chinese infrastructure projects don’t give jobs to the local population.
It has been pointed out previously that this decade of oil peak/plateau will shuffle many of the geopolitical relationships, as countries that are big importers struggle to avoid energy price escalation and/or energy poverty.
India is a prime example, requiring large imports of oil, gas and coal to keep growing and to attempt to slowly continue the battle against severe poverty- as china did over the past 40 years.
Here is a small story in part of the big picture on this-
https://oilprice.com/Energy/Energy-General/Putins-coup-In-India-Will-Shock-The-US.html
Up above Dennis has said “My guess is that we will see peak supply from 2024 to 2027 with a rough plateau in output, but by 2028 there may be enough electrically powered light transport on the road that the pressure will be taken off of oil supply and oil prices will start to fall”
I see a lot of uncertainty on the timing of events on this. The relative shortfall of oil supply later in this decade could come more slowly or quickly than the replacement of demand by electric vehicles.
The trend magnitudes are far from clearly established.
Shortage of transport energy could be possibly avoided, or could come considerably slower or much faster than any of us can accurately predict.
In addition to the oil supply wildcards, there are unknowns regarding the electric vehicle adoption side- will battery manufacturing capability be developed rapidly enough?, will general global prosperity be at the level where a huge fleet of industrial machinery can be rapidly exchanged for a more energy efficient mechanism (EV)?, will enough decision makers wake up to inevitable and thus alter policy and planning [Toyota is finally starting to get the picture a decade late, and this is their particular industry!]?
The answer to all of these supply and demand issues is unknowable.
Its a race and a scramble.
I place no bet on timing or relative success of transition (other than long term investing in some of the clear industry winners).
Hickory,
I agree my guess could be wrong, it is based on past trends in plug in sales growth, and on the supply of oil which is based on resource estimates , past production and rate of development of discovered oil resources (aka the shock model) and past extraction rates and a guess about future rates. A peak of about 86 to 88 Mb/d in 2027 /-1 year for oil supply.
By 2028 more than half of all new light vehicle sales will be plugin vehicles using the growth rate in plugin sales assumed in the scenario below, about half of the World fleet of light vehicles will be a plugin based on this scenario by 2036. Demand for crude plus condensate falls to 85.5 Mb/d in 2028 from a peak of 86.2 Mb/d in 2026 and less than my best guess for Global supply of C plus C in 2028 (85.9 Mb/d).
Looks like the Dutch Govt can’t “Guarantee” Natural Gas supplies to Businesses this winter
Dutch gov’t can’t guarantee gas supply to businesses this winter: report,
The Dutch Cabinet cannot currently guarantee the security of gas supply for companies in the Netherlands this winter, experts said to Nieuwsuur. The government is leaving the gas supply entirely to the commercial market. And the current high gas prices make it unattractive for the market to purchase gas. Household supply will not be affected, according to the program.
https://nltimes.nl/2021/12/13/dutch-govt-cant-guarantee-gas-supply-businesses-winter-report
This wasn’t a surprise if we understand that Europe is the most heavily reliant on Natgas imports. Furthermore, the Netherlands was one of the weakest links in the European Natgas Market due to its “Liberal” Govt policies on Free Market Capitalism.
Kind of an irony…eh?
steve
Steve , your info on NL is surprising for me because I live in Belgium only 40Km away from the connecter in Zeebrugge and follow all energy issues . Guess I am sleeping . Tks for the wakeup call .
HOLE IN HEAD,
Seems that many in the Netherlands were also quite surprised when I tweeted about this earlier today. Also, while Europe’s total natgas storage is 72% of what it was at the same point compared to the past two years, the Netherlands is at 54%!!
https://twitter.com/SRSroccoReport/status/1470766659703128066
steve
Steve . What can I say ? Stunning and shocking . Guess I am going to buy some blankets tomorrow .:-)
HOLE IN HEAD,
I truly wish you all the luck. However, these energy scarcity dynamics are going to spread across the world. We in the United States may be a bit behind those in the FRONT of the line, but we won’t escape.
This is the kind of info we put out on the SRSroccoReport.com website.
steve
An update on Dutch nat gas situation . Storage capacity full on 17/11/2021 — 60.1% . Storage capacity full today 17/12/2021 —- 43.7 % . Back to the future .
HiH, Just don´t forget to order some three glazed windows as well, but I guess there is quite a backlog on those at the moment… 😉
A man can hope, at least…
Edit: Btw, we´ve had a brief moment of high electricity prices here in the far north of sweden too, but the spot price has gone down quite a bit the last few days, for tomorrow the spot price is at 22 öre in my region, or 0,022 E per kWh, top so far is 0,23 E/kWh but only for a short time. We even imported electricity for short periods but mainly we´ve been exporting, so first order of business would be to cut the lines to Finland, in my view.
https://www.nordpoolgroup.com/Market-data1/#/nordic/table
Yeah, unlike Sweden and Norway Finland is too flat for large scale hydroelectricity. But didn’t they just commission a big nuclear power plant?
Frugal, yes, the Olkiluoto 3 has been loaded (ten years late and 3x budget, minimum) and testing just started, online in mid 2022, maybe… (My estimate 0,1 E/kWh)
(Rosatom´s involvement in Pyhäjoki has also thrown some wrenches in the works, thankfully, in my view)
Edit, But the Finns were also required, at least a while ago from what I learned on a business trip to Tampere in the late 90s, to have a second heat source, preferably wood fired, in their houses but the sauna qualified so they will be fine.
Like all Baltic countries, Finnland has excellent offshore wind resources.
Also the Brits thought they had excellent offshore wind resources until they turned out to be not excellent . You can take the horse to the water , but you can’t make it drink . Same goes for wind .
@Ali
Finnland wind is not that good as north sea.
They get russian highs in winter – extreme cold then, and no wind. Good combination when future heating should be done with heat pumps…
At least they have started building a nuclear reactor, I think they will need more.
Eulenspiegel
Saying Finland’s offshore wind resources aren’t as good as North Sea resources isn’t saying much, since the North Sea has the world’s best resources.
@Alimbiquated : the offshore wind ressources there are not as good as the wind ressources in North sea or Manche sea.
@eulenspiegel The addition of Olkiluoto 3 will allow the elimination of coal, peat, oil and gas combustion for electricity production and eliminate as well the imports of coal and gas for this purpose. Adding other nuclear reactors will allow the decrease the importations of electricity.
Laplander , buy those iodine pills before there is a shortage .
https://www.edf.fr/en/the-edf-group/dedicated-sections/journalists/all-press-releases/reactors-of-the-civaux-and-chooz-nuclear-power-plants-replacements-and-preventive-checks-on-parts-of-the-piping-of-a-safety-system
The Belgian nuclear plants have the same problem but they keep them operating . If any accident happens they will have to evacuate all between Antwerp and Rotterdam plus more . All they do is issue iodine pills .
HH, if you put a space between your last character or period then it will automatically create an emoji.
No space: …tomorrow .:-)
With space: tomorrow . 🙂
If there is no space then the program just thinks what type is part of the word.
Ah,ah . Got it Ron . Have been wondering why I was getting different results . Tks .
Exactly!
Saudi Oil Minister predicts Peak Oil
Global oil production could plunge 30% this decade: Saudi oil minister
Saudi Arabia said global oil production could drop 30 per cent by the end of the decade due to falling investment in fossil fuels.
“We’re heading towards a phase that could be dangerous if there’s not enough spending on energy,” Oil Minister Abdulaziz bin Salman said in Riyadh. The result could be an “energy crisis”, he said.
Saudi Arabia said global oil production could drop 30 per cent by the end of the decade due to falling investment in fossil fuels.
And meanwhile they only have 27 operating drilling rigs. I guess somebody else is supposed to pick up the slack.
Ron
I think the question is. Is it 3% per year (or roughly 2.5 M/d/yr or is it a slow transition toward a Seneca Cliff?
Isn’t the statement “due to falling investment in fossil fuels” just a way of dodging the geological peak issue?
(I guess that way they could blame someone.)
I would say the Saudi oil minister did no more than check Rystad’s UCube energy database. Nothing new under the sun…
So what if dollar index in short time goes above 110.00 and trades between 110.00-120.00 for a decade. Oil trades below say $12 for a decade. Shale oil disappears in say 3-5 years it essentially goes to zero.
Sounds unrealistic right? If shit ever really hits the fan in Europe. I’m talking uncontrollable energy prices that lead to famine or war. Something so economically bad that everyone gets their money out of Europe all at the same time. And since they have no capital controls it can happen.
Point I’m making here is we can all try to predict how the end of the oil story will play out all we want. Nobody has crystal ball here. There will inevitably be circumstances that actually play out. That nobody really considered.
But the probability of the oil story ending badly is extremely high. And probability if it ending without much of a fuss is extremely low.
Peak now or peak 6 years from now doesn’t really change the predicament.
Oil Futures Curve Sends Warning Sign to Bullish Investors
> Prompt Brent crude spread points to potential surplus in 1Q
> Demand worries due to omicron variant spark oversupply fears
https://www.bloomberg.com/news/articles/2021-12-14/oil-futures-curve-sends-warning-sign-to-bullish-investors
Omicron cases may already be peaking in South Africa, less than a month after the COVID-19 variant first surfaced
In Omicron’s very short history, two features seem to have emerged: First, it spreads at wildfire speed. Second, it appears less deadly than COVID-19’s original strain—perhaps because 56% of the world has now received at least one dose of a coronavirus vaccine. A study last week of patients in the South African city of Tshwane showed that few COVID-19 patients needed ventilators, and of those that did, most had been admitted to the hospital for other health reasons.
We’ll find out soon enough how this variant affects oil prices. In my opinion, no long term effect.
So for now taper and rate hikes are risk on. Oil is even bouncing from the news.
I think it was already priced in. However if inflation runs out of control. Risk off knee jerks might be the way forward. Eitherway volatility will remain rampant from here on out in my opinion.
It’s always the same.
We will see this coyotee phase while the stocks will continue to rally in thin air over the cliff.
It was 2000 2008 and now.
Stocks will crash when it goes harder for companies to buy back stock on cheap credit.
That’s what tightening is for – reducing abundand cheap credit.
I don’t believe long end of bond market buys the narrative. I see 10 year yields falling to 1% or less before FED even makes it to the first rate hike.
I highly doubt any yield curve steepening takes place because the narrative is BS. FED is going to have to introduce negative nominal interest rates within two years or we get to watch everything burn 🔥
yes
If they don’t reverse fast, real estate will crash. And then all mortage backed long bonds will suffer, too. Small town bonds, with the income based on home taxes will suffer fast, too.
Only cure for this is to go the ECB way and introduce negative interrest. There is no way out of low interrest rates – too much debt already allocated.
Here house prices are sky high, too. No way to finance this without these less than 1% loans. No way out for the ECB.
The other problem is: More than 20% of all companies are zombie companies now – without cheap credit they’ll burn, too and take their creditors with them.
Corporate debt needs lower interest rate to roll over debt and continue taking on more debt to do more stock buybacks.
Everything under the sun needs lower interest rates. Global monetary tightening will blow up in the central bankers faces.
I don’t see global monetary tightening being good for risk on assets and commodities beyond a few weeks. But I also don’t see that just because they end QE and do a rate hike or two being enough to cool price inflation that isn’t really monetary in nature. I expect inflation to continue. Supply chains are unlikely to respond to monetary tightening.
Inflation might actually get worse due to supply chains not obtaining proper funding because central banks thought they knew what they were doing.
Yes, that’s my opinion, too.
Only one aspect – commodities have been one big part of the inflation problem. At the moment the price of electricity on the spot market tops at 400 Euros / megawatthour. I pay 300 on my bill, but theres a load of taxes on it. So utilities will make a real bad deal when they don’t have enough long term contracts.
https://energy-charts.info/charts/price_spot_market/chart.htm?l=en&c=DE
Crazy these numbers – and end of the month half of the remaining nukes are shut down. Let’s see if we get up to 1 Euro / Kwh.
So dumping commodities with tightening can solve some of the inflation problems indirect, perhaps by inducing an economic crisis…
I think the S+P500 has to dump 20 or 30 % in a few weeks as a shock to make them reversing and loosening again, giving everyone the cheap money back.
I’m sure shale oil can’t afford higher interest rates. Keep an eye on junk credit. While 10 year might be headed to zero.
Riskier credit can absolutely blow out in the other direction.
Central banks have been pushing everybody further out the risk curve since 2008. If you need yield you have to go further and further out the risk curve. Shale oil and gas are a product of yield seeking investors.
HHH and Eulen , all your arguments are sensible but this also deserves a thought . I am more in agreement with Mish . The FED will jaw bone as long as it can until everything falls down or seizes .
https://mishtalk.com/economics/the-fed-expects-3-rate-hikes-in-2022-i-dont-and-you-shouldnt-either
Long end of yield curve will have them boxed in under 1% by the time they even get to the end of taper in March.
As little as two interest rate hikes will invert entire yield curve. Fed will be cutting rates by end of 2022. Nominal negative interest rate or else everything burns.
And if nominal negative interest rate aren’t acceptable then we all get to witness the greatest economic crash that ever happened.
My scenario is this:
During or at the end of the taper – at least at the first increase, someone in the stock market trips. And then it crashs, like 2000, 2008 or the taper tantrum. Or at least it begins to crash with -2-3% day after day. Real estage will crater, too.
I give the FED 2 weeks of this – and then, like during taper tantrum, they will increase or reintroduce QE. And, as HHH things, lower interrest rates.
Negative rates are possible, the ECB has demonstrated this already.
That’s my scenario. If they don’t taper, the DOW will test the 2020 lows during a margin call and gamma fueled crash. Nasdaq will fall deeper than this – there is so much bloat and air ballooning – when this starts sliding it’ll be difficult to stop without thrown one or two trillions in it’s way.
Stocks would get hammered for sure. But it’s the much larger credit market that underpins stocks that will be at risk.
That why negative nominal interest rates in in the cards. How that will look in an inflationary environment won’t be good. Maybe inflation goes away in a risk off environment before nominal negative interest rates are adopted.
I don’t see any other way forward. Interest rates have to go lower.
Negative interest rates might be bullish for oil. Turns the dollar into a low yielding funding currency. Unless Japan, Swiss and European central banks just go even more deeply negative in response.
Everybody is trying to avoid all out economic collapse with monetary policy. They can delay collapse but in long term it happens no matter what they do.
@HHH
I googled a bit. The US stock market has overtaken the US bond market with 58 : 56 Trillions “worth” – looks like a basketball score. No wonder when a Tesla is worth more than all “old” car companies together and a PE Ratio of 50 is “cheap”.
They ballooned a lot – so crashing stocks will impact bonds a lot, too. And they make more noise – as far I know much more US citizens have their pension plans on base of stocks than in Europe (here is mostly bonds for the non state part – they are bleeding money the last 10 years).
I’m not talking government bond market. I’m talking corporate credit. About $11 trillion. I’m talking anything that is not government bonds. Anything that is considered private credit.
I’m also including margin debt. Which is the credit that juices the stock market. Most people point to FED’s balance sheet. But real culprit is margin debt that is the money funneling and flowing into stocks.
Bank reserves the FED creates never leave the FED.
I checked – US government debt is 29 Trillion at the moment, from
https://www.usdebtclock.org/
Bank loans come additional to the debt I cited, so the whole debt market is (still) bigger than the stock market.
But stonks have overtaken pure bonds in the USA.
But yes, margin debt is almost 1 Trillion now, ATH….
https://www.yardeni.com/pub/stmkteqmardebt.pdf (nice site about margin debt)
Thats an atomic bomb under the wall street, ready to explode. I think a slide of 10% should be enough to ignite this bomb – and only the FED can stop it then.
FED reserves never leave the FED – but it’s Tier 0 money. Banks can buy anything they like with it, including bonds or stocks or other banks or private jets for their managers. Or they can swap it to cash – cash is FED reserves, too.
In old time (before Lehman and the papered over financial crisis in 2008) reserves where given out only very carefully, because they have been the base for inflation. For every $ in reserves banks own they can create round about 10 or more $ in bank loans.
Now there are too many reserves, more than needed by banks. When they start moving, because the common public starts to distrust money – boom sudden inflation. The money base for a hyperinflation is already there.
But the don’t move at the moment – they just sit there. Money velocity is slow. This “not needed so much” prevents monetary inflation.
(I’ve discussed central bank reserves with a investment banker and economist)
Yes we still have factional reserve banking. For every $1 deposits a total of $10 dollars can be loaned out by the commercial banks.
Right now the figures I’ve seen only $2 instead of $10 dollars are being loaned out for every $1 in deposits.
That’s how I can say we don’t have monetary inflation.
Because loans just aren’t being made anywhere near enough.
We have price inflation due to supply shocks. Only supply shocks are here to stay. Which is an enormous problem for central bankers.
It’s this lack of money growth in commercial banking that will drive long end of bond yields lower. 10 year at 1% or less by time FED gets to it’s March end of taper date.
If 10 year is between 1% and 0.75% in March. How many rate hikes can they actually do?
My answer is none. We headed for train wreck in 2022.
Ecuador pipeline rupture
https://www.reuters.com/markets/commodities/key-ecuador-crude-oil-pipeline-ruptures-while-halted-by-erosion-2021-12-15/
Almost All Of Russia’s Oil Could Become “Hard-To-Recover” In The Coming Years
Due to the lack of new exploration leases, almost all of Russia’s crude will soon be ‘hard-to-recover’ according to the country’s Energy Minister. The difficulties in extracting the oil will mean higher production costs. And the fact that the country’s oil and gas discoveries fell to the lowest in five years in the first half of 2021 does not bode well for its future output.
Following restrictions and lower demand during the 2020 pandemic, several major Russian companies reduced their exploration operations and funding to contend with the market instabilities. Therefore, the country needs to attract greater investment in exploration projects if it hopes to continue developing its oil and gas sector at its projected pace.
While Russia undoubtedly requires greater funding in exploration projects if it hopes to maintain its high oil output, new agreements with India and plans to keep boosting production in line with OPEC+ quotas show promise for the recovery of the country’s oil and gas industry. As one of the world’s largest producers, Russia looks likely to maintain its position as a global oil major for years to come.
Russian liquids output growing slowly
Crude production was 9.94mn b/d in November,…
Russia’s crude quota is 10.02mn b/d for December, and will rise to 10.12mn b/d in January.
Russia produced 10.5mn b/d of crude in the early months of 2020…
Russia’s largest private-sector oil producer Lukoil said in November it still had 30,000-40,000 b/d of spare capacity that it expects to be on stream by late January or February 2022. State-controlled Rosneft and Gazpromneft are even closer to the limit of what they can add. Rosneft said last month it brought on line all of its spare capacity in the third quarter, and Gazpromneft said it had almost none left.
The scale of any further crude production growth next year will depend on the productivity of new wells, including those drilled this year, according to several major Russian oil firms.
In other words, it will be very difficult for Russia to meet it’s increasing quota in 2022.
Ron , “new agreements with India .” There was no new agreement . Rosneft owns 49.13 % of Essar Oil and is committed to supply the crude to the refinery which is a subsidiary of Rosneft . For Rosneft ( Russia) it is beneficial to trade with India as they do not use the USD and transactions are done under the Rupee-Ruble pact between the two countries . A lot has been made of the agreements (Hickory has posted a link above ) but there is nothing of real substance . Example Russia has agreed to put up a unit to manufacture AK 47 . However it can’t find a private partner because the conditions are too restrictive . The govt will not participate in the venture as it is in the process of selling its ordinance factories . 10 years ago agreements were made for nuclear plants . Not even the land has been allocated till date . Just clarifying . Of course the rest of the article confirms what you have been pointing out from now over a year .
https://www.rosneft.com/press/releases/item/187527/
Half of US oil pipelines remain empty.
https://oilprice.com/Energy/Crude-Oil/Half-Of-US-Oil-Pipelines-Sit-Empty.html
Is this a symptom of depletion?
TonyH,
This is due to the fall in demand during the pandemic and US oil production falling as a result. It is less a case of depletion and more of a case of a lack of drilling by tight oil companies. As oil prices rise drilling and completion of new tight oil wells is likely to increase and tight oil output will rise, in 2027 tight oil output may rise to 9 to 11.5 Mb/d depending on the rate that new wells are completed, most of this will be Permian basin output with Permian basin output rising to between 6.2 and 8.7 Mbpd in 2027. This assumes Brent oil prices rise to $75/bo by 2022 (in 2020$) and remain at that level (or higher) until Dec 2028. Lower oil prices would result in lower output.
Tight oil scenarios
It occurs to me that many will think the high scenario is not reasonable (or even the low scenario).
Consider the Rystad projection at link below (base case has oil price at $55/b), from Sept 2019.
https://www.rystadenergy.com/newsevents/news/press-releases/us-shale-to-grow-to-14.5-million-bpd-by-2030/
Chart from link above
Dennis, One thing that stands out to me with the 3 scenarios is you show less uncertainty in the out years, say 2033 and beyond, than in the near term years, 2023-2033 or so. How do you think your URRs would change if you kept the midcase as it is, but at least carried the uncertainty range that you have in 2027-2028 (years of peak uncertainty) out to 2040?
Bob Meltz,
Note that most of the uncertainty is based on changes in assumed completions. Aside from that the three scenarios assume identical costs, prices, well profiles etc.
The different scenarios are not intended to be confidence intervals, they are simply logical scenarios based on the completion rate scenarios shown below which are consistent with maximizing profits under the assumtions I have made for cost, price, future well profiles, etc (which are the same for all three scenarios).
Bob,
It occurs to me I could rework the models to accomplish this, it will take a bit of time.
Note that after March 2032 there are no new completion in the Permian basin for these scenarios so output tends to converge in the tails. The chart below shows how I might modify the completion rate to give more similar uncertainty ranges over at least the 2025 to 2032 periods after which the output is simply determined by the natural well decline rates.
New posts will be up some time tomorrow.
Thanks
New posts are up
https://peakoilbarrel.com/opec-update-december-2021/
https://peakoilbarrel.com/open-thread-non-petroleum-december-17-2021/
A very interesting article on Russian future oil production. Bold mine:
Analysis: Russia seen missing its May target for pre-pandemic oil output
MOSCOW, Dec 28 (Reuters) – Russia is unlikely to hit its May target of pre-pandemic oil output levels due to a lack of spare production capacity but could do so later in the year, analysts and company sources said on Tuesday.
Deputy Prime Minister Alexander Novak, in charge of Moscow’s ties with the OPEC+ group of oil producers, has said output by May is expected to hit pre-pandemic levels, or about 11.33 million barrels per day (bpd) of oil and gas condensate, as seen in April 2020 .
However, many oil producers have reported they are almost out of spare production capacity having reduced output in tandem with other OPEC+ producers.
Part of the problem is old wells, mostly in Siberia, that are struggling to increase output, industry sources say.
Production of oil and gas condensate in December stayed at around 10.9 million bpd, in line with November, despite Russia’s OPEC+ quota rising by 100,000 bpd.
“It’s possible that Russia will be behind the output increase schedule in the first half of 2022 and not reach its pre-crisis level until the end of summer,” said Dmitry Marinchenko of Fitch Ratings.
Marinchenko said it would be hard for Russian companies to increase monthly output by 100,000 bpd and that they would need to intensify drilling.
“That would take some time,” he said.
A source at one Russian oil major said efforts to boost oil production have also been hampered by a lack of new wells at oilfields with high levels of water, as well as declining oil well production rates at hard-to-recover fields.
He said Russia would not likely hit pre-pandemic output levels before August.
Obviously Russia is struggling to increase oil production but finding that more and more difficult due to their very old brownfields with high water cut. They have been infill drilling those old fields and now find that there are no more places to drill. They try but just get mostly water.
Those who think Russia will be a major player in helping world oil production to reach new highs are dreaming. Russia will soon be in decline and part of the problem, not part of the solution.
The chart below shows Russian oil production thru December 2021 as per my post above where Reuters stated that December output would be the same as November. The below link gives a very confusing prediction for 2022 Russian oil production:
Russia expects 2022 oil output to beat pre-pandemic level at 11.045 mil b/d
However as you can see, the chart below puts Russian pre pandemic level at 11,250 million b/d with the last four months pre covid averaging 11.314 million b/d. Then the article goes on to say:
Russia’s production of crude and condensate in 2022 is expected to rise by 5% on the year to about 540 million-550 million mt, or up to 11.045 million b/d, deputy prime minister Alexander Novak said Dec. 24.
I did the math:
540 million tons = 10.844 million b/d
545 million tons = 10.944 million b/d
550 million rona = 11.045 million b/d
I think they are trying to move the goal posts here. 11.045 million barrels is over a quarter million b/d below their pre covid oil production. And they stress that their production could beup to 11.045 b/d. Meaning their production could possibly reach that level but not likely.