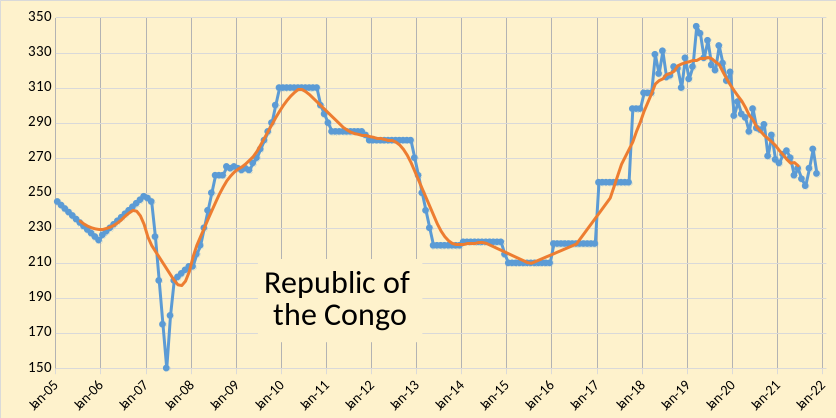
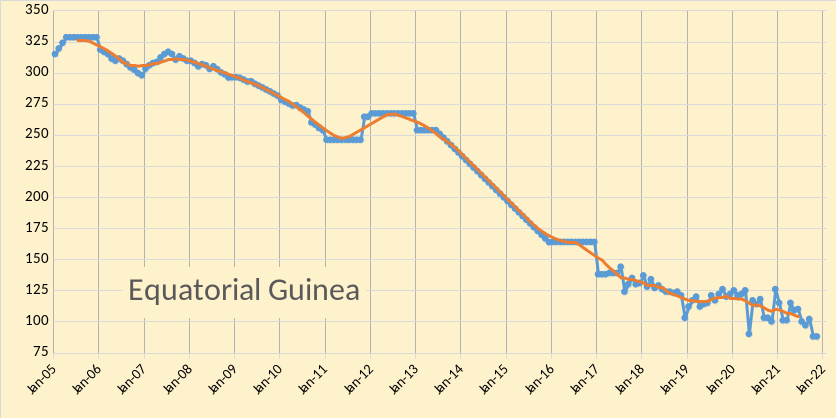
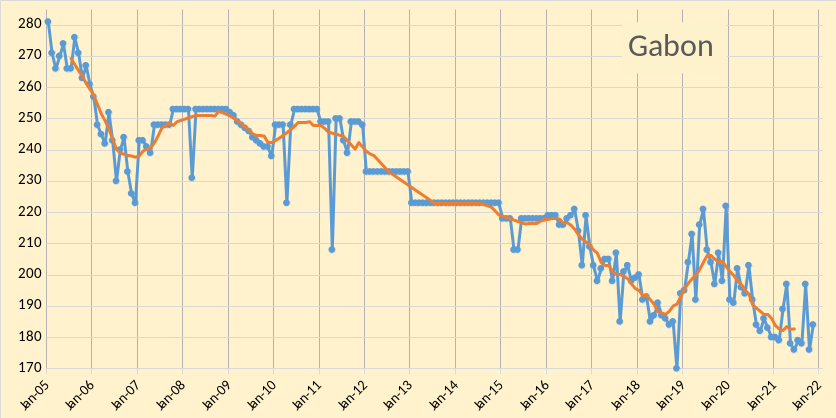
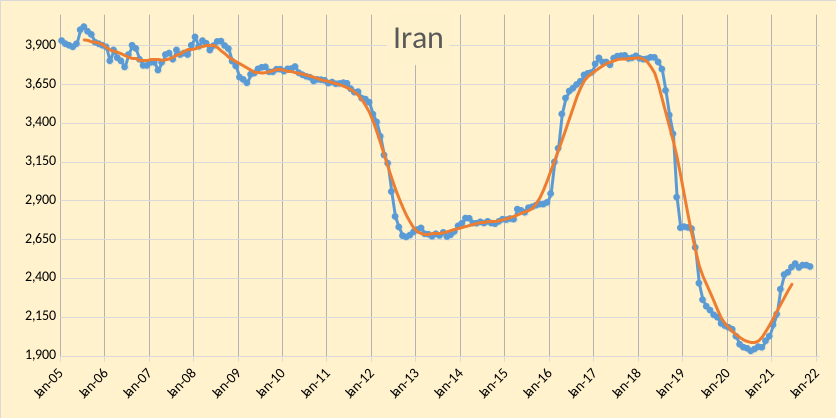
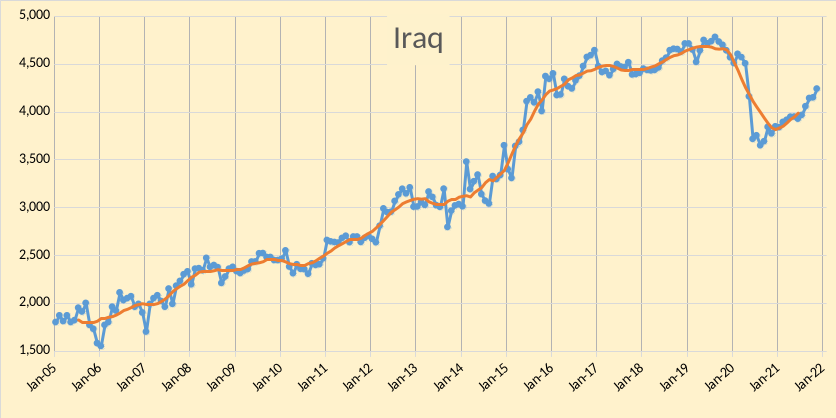
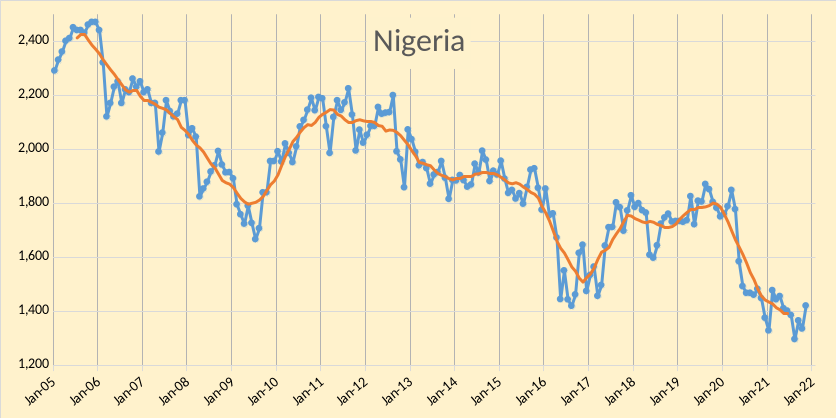
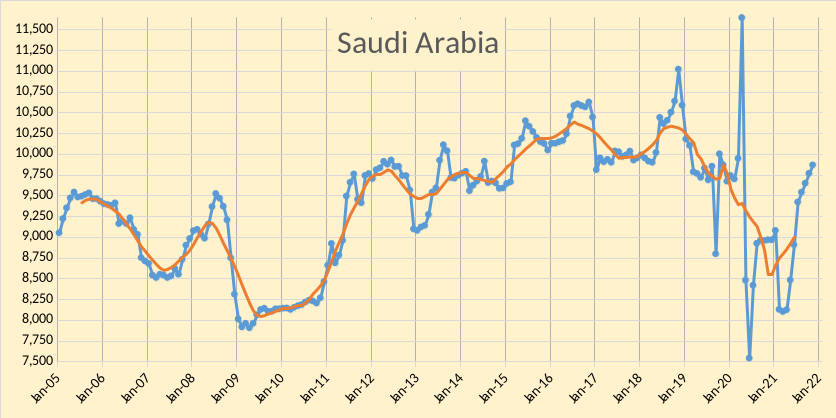
The OPEC Monthly Oil Market Report (MOMR) for December 2021 was published this past week. The last month reported in each of the charts that follow is November 2021 and output reported for OPEC nations is crude oil output in thousands of barrels per day (kb/d). In the charts that follow the blue line is monthly output and the red line is the centered twelve month average (CTMA) output.
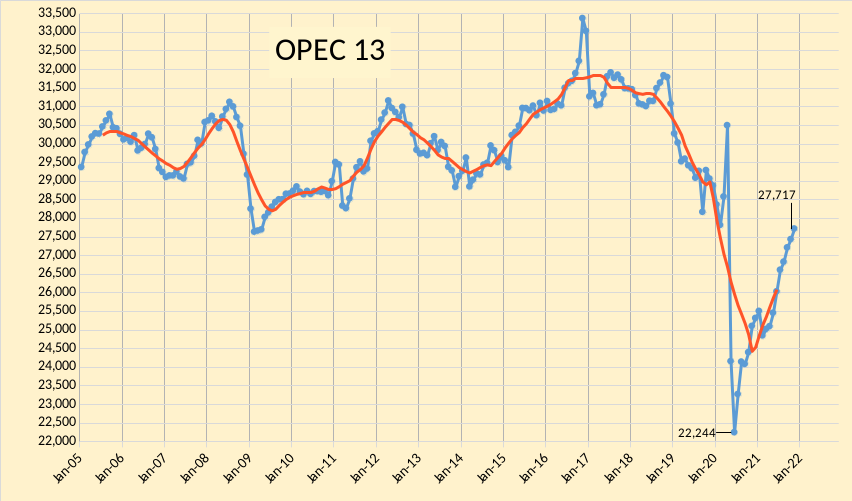
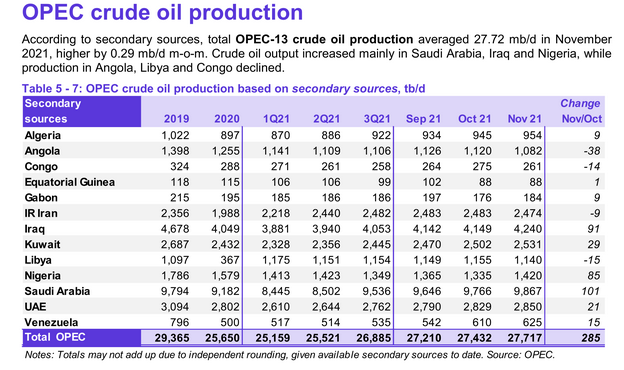
OPEC produced 27717 kb/d of crude oil in November 2021 based on secondary sources, an increase of 285 kb/d from October 2021. October 2021 output was revised lower by 21 kb/d from what was reported last month and September 2021 output was revised down by 26 kb/d compared to the November MOMR. Most of the increase in OPEC output was from Saudi Arabia(101 kb/d) followed by Iraq (91 kb/d), and Nigeria (85 kb/d). Six other OPEC members saw increases of less than 29 kb/d in November 2021. Decreased output from Angola (38 kb/d), Congo (14 kb/d), and Iran (9 kb/d).


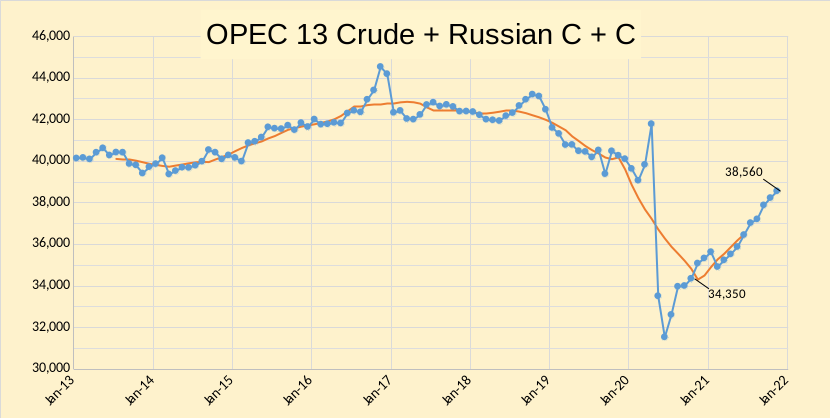
OPEC crude plus Russian C + C output was 38560 kb/d in November 2021, this is 1543 kb/d below the December 2019 level (40103 kb/d). The most recent centered 12 month average was 36490 kb/d in May 2021. In the past 12 months OPEC 13 crude plus Russian C+C has increased by 3475 kb/d. My expectation is that Russia, Saudi Arabia, Iraq, UAE, and Kuwait may be able to increase their combined output from the November 2021 level by about 1610 kb/d, raising OPEC plus Russian output to about 40165 kb/d or to slightly above the December 2019 level of output. Potentially Iran could also raise output by 1300kb/d over a 12 month period after sanctions relief from the US. Currently I do not expect this will occur based on reports on talks with Iran about the JCPOA.
World liquids output increased by 0.88 Mb/d in November 2021 to reach 98.28 Mb/d, this is about 3.2 Mb/d less than liquids output in November 2019 (101.5 Mb/d). OPEC crude output was about 1.2 Mb/d less in November 2021 than two years earlier (27.7 Mb/d vs 28.9 Mb/d).

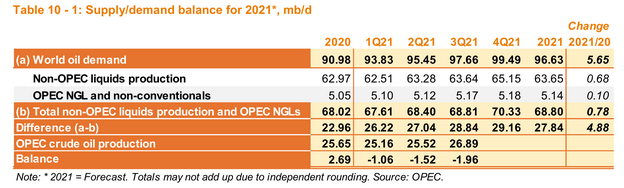
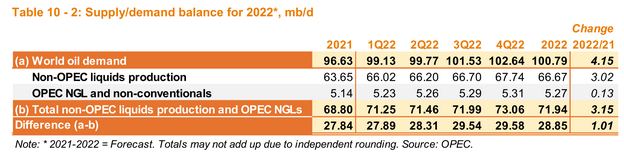
There is a poor estimate of future Russian liquids output in the December MOMR where output increases by 680 kb/d in the first two quarters of 2022. For comparison, from 2021 Q1 to 2021 Q4 ( over a 3 quarter time span) output increased by 680 kb/d or 227 kb/d per quarter. A more reasonable estimate would be a 453 kb/d increase in Russian output over the first half of 2022 (227 kb/d per quarter). Making this adjustment increases the call on OPEC to 28 Mb/d for 1Q22 and to 28.54 Mb/d for 2Q22, assuming demand estimates are correct and other non-OPEC supply estimates are correct.
OPEC might be able to increase output to as much as 28.5 Mb/d for 1Q2022 and meet the call on OPEC for that quarter and they could also meet the call on OPEC for 2Q2022 of 28.54 Mb/d, by the third quarter of 2022 OPEC will fall short by 615 kb/d and possibly by 815 kb/d because they have likely overestimated Russian output by at least 200 kb/d for 3Q2022. See MOMR Appendix for breakdown of non-OPEC supply for 2022.
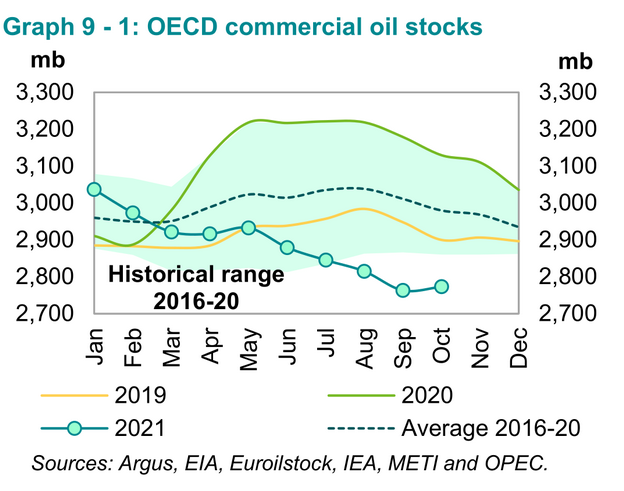
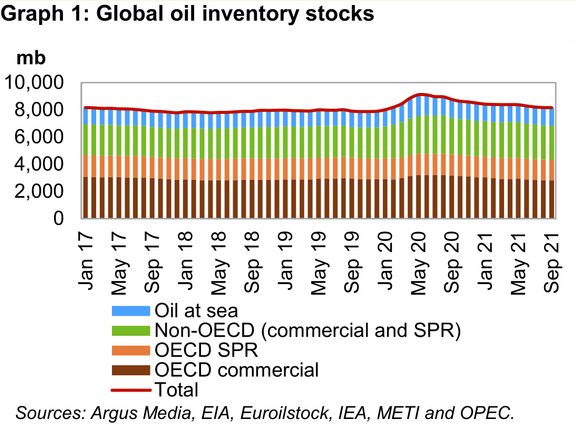
OECD commercial stocks rose by 9.9 million barrels in October to 2773 Mb, this is 207 Mb below the 5 year average and 174 Mb below the 2015 to 2019 average. Typically low stock levels put upward pressure on oil prices. Unfortunately we do not have a very good estimate of non-OECD stocks, but based on the November MOMR report on World stock levels, it looks like non-OECD stocks are at about 57 days of forward consumption vs OECD stock levels of 94 days of forward consumption, the stocks need to rotate to non-OECD nations and until that occurs there will be upward pressure on oil prices. I have assumed about 8500 Mb for total World stocks for 2021Q3 based on the November MOMR chart, reproduced below.
212 responses to “OPEC Update, December 2021”
Ron
This image has been shared on social media. A picture is worth a thousand words.
Saturation.
Lightsout . Tks buddy . That looks like a cancerous cell image to me . It seems the cancer cannot spread further ( no more places to drill ) . You just confirmed what Ron and others like have been spouting ( along with the Russia situation ) for over the last year . Excellent find .
Lightsout,
Wrote this in 2019, seems relevant again.
https://aktiertips.se/northern-ghawar-water-and-production/#more-214
Check out water saturation, and dates. Then draw the obvious conclusion.
That water cut is for the very northern part of Ghawar. Ghawar is long. This leads to the question of what are the water cuts for the other parts of Ghawar?
From Twilight in the Desert, the further south you go, the less conducive the oil formations are for producing. From what Matt Simmons was trying to get across was that the Saudis were going to proceed southward and harvest the oil as they went along. The northern part would be harvested first and the southern part would be harvested last. With wells all along Ghawar, I’m not so sure of my interpretation.
Seeing the decline in production is not surprising. I think Ghawar reached a peak production in 1985(?). But I know the Saudiis have other fields that are producing to try to make up for the decline.
Seeing the decline in produced oil storage is of real concern. Thank you all for what you are doing!!
Happy Holidays to you all!!
Peterev,
Exactly, the northern parts were of course produced first as they were of superior quality. The field is actually 4 fields separated by faults and different rock quality.
The northern part is today more or less done, it will be a massive amount of water produced per barrel produced. This is something that they can handle as those facilities is in place and such massive investment was economical due to the size of the field. But today in northern parts it will be water with specs of oil in, northern parts are at the very end.
Southern will produce for a good while longer. But this is also a reason why the ipo came as a shock to most people when the 3 mboepd number was revieled, as everyone had just been repeating the 5 mboepd number that was considered the production level for what 20 years without applying effect of time and common sense to that number.
So basically, Saudi Aramco has to rely on other fields to make up for any Ghawar shortfall or pump more from more difficult to extract parts of Ghawar. In either case, Ghawar is past peak and we have to transition to alternatives to make up for the shortfalls.
So the blue is water, green is oil/water mixture, and red is oil? And when they started extracting oil from Ghawar, all of it was oil?
I’m guessing the answer is “mostly yes.” Oil floats on water, and water was always part of the original formation, but since the 90s or so they have injected massive amounts of sea water into the rock, driving out the oil. Now horizontal wells sit on top of that fragile remainder of “red” in the picture. Oh. Fuck.
Colours look like elevation markers to me
Thanks Dennis for all the effort inspite of all the disagreements we have . Take care and be well .
Hole in head,
You are most welcome. I like different points of view, though perhaps my tone sometimes suggests otherwise.
My apologies if I come across as rude in some cases. Happy holidays.
You are anything but rude! You put many of us to shame….
Mike B,
Thanks, I try not to be, but do not think I always succeed.
Dennis, as someone who disagrees with you often, I will say that I have never seen you be rude. Quite the opposite.
Niko,
Well I guess I assume I come across as either rude or annoying to others. My explanations sound like lectures I guess and it makes it seem as if I think I know everything, which is quite far from what I believe.
I often seem to inspire rude responses from others so I assume that to those people my comments are offensive. Hard to know what is in the minds of others and often I type something quickly without considering carefully how it might be misinterpreted by others.
Typically when I ask questions or explain myself in detail, I am simply trying to learn from others, if I explain the details of my thinking clearly others can point to things I have missed. When I don’t understand something someone says, I ask questions and perhaps these are too pointed in some cases and I offend.
It’s good to be self-aware Dennis, but don’t take it too far. That way lies madness.
FWIW, I think those who get annoyed with you are more often annoyed not because you are offensive, but because they disagree with the assumptions which feed into your analysis, and because you tend to refer back to that analysis endlessly. That can be very frustrating for those with a different view.
Niko,
Probably true. Often the argument runs along the lines that the USGS studies are not to be believed, for my Permian Basin analysis I only pick the best areas (those with the highest EUR per acre) and eliminate about 40% of the prospective net acres in the 3 USGS assessments of the Permian Basin (I use 30 miilion acres of the 50 million acres proposed in the USGS studies and reduce undiscovered TRR from 70 Gb (USGS mean estimate) to 50 Gb for my best guess estimate. For comparison the USGS F95 estimate for Permian UTRR is about 40 Gb, so my estimate is pretty conservative. The USGS F5 estimate for Permian UTRR is 110 Gb (they believe there is a 95% probability the UTRR will be less than 110 Gb and a 95% probability it will be more than 40 Gb with a 90% probability the UTRR will fall between 40 and 110 Gb.)
Of course when I do not explain in enough detail, I am accused of having a “black box” model, such as the oil shock model by Paul Pukite, the details of which can be found in a university library as in link below.
https://ursus.maine.edu/search~S1?/Xmathematical+geoenergy&searchscope=1&SORT=D/Xmathematical+geoenergy&searchscope=1&SORT=D&SUBKEY=mathematical+geoenergy/1%2C3%2C3%2CB/frameset&FF=Xmathematical+geoenergy&searchscope=1&SORT=D&1%2C1%2C
Algeria, Iraq, Kuweit, UAE and SA have their output steady increased the last months. They are the only ones in OPEC that still have reserve capacities – they are mostly the countries with the biggest reserves, too.
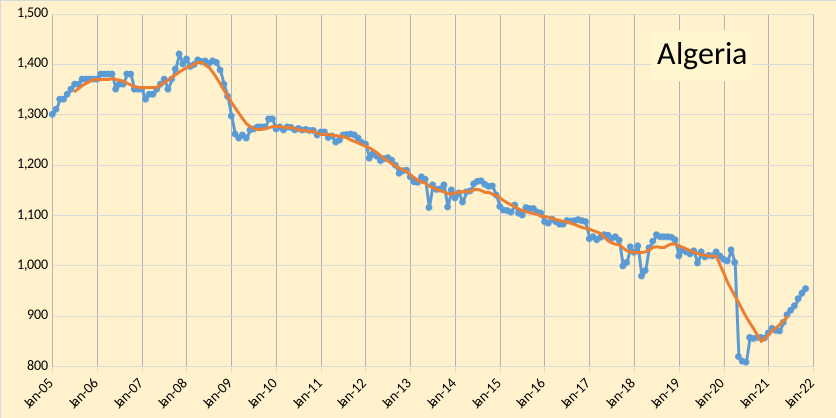
I don’t know how you got Algeria in that group. They certainly don’t belong there. Algeria is in terminal decline with no spare capacity and very little production. They have been recovering from their Covid cuts but have almost reached their production limit as the line on the chart below shows.
Eulen , yes but all except KSA are below their 2019 figures . In 2020 all had cut output to put a floor on price which was plunging . Hey , but KSA is selling from inventory . Someone posted about KSA inventory a couple of posts ago . As to reserves , I will ask Ron to take the call on this . He has blown the fraud on this earlier and I am sure he will love to do it again along with the cartoon he posts .
Hole in head,
The must have very large inventories. Lets see in the past 12 months Saudi Arabia has produced 3.5 billion barrels, but most of it is coming from stocks, that is a big stockpile, especially considering that OPEC estimates total World petroleum stocks are about 8 to 9 billion barrels, so I guess the Saudis hold over a third of this.
Do I have that right? Can you produce a reliable source confirming this?
Dennis , I think though not sure but Seppo had posted somewhere the world inventory going from 3.1 billion barrels to 2.9 billion barrels over the last year . Maybe Seppo will read this and revert . As to the Saudi’s use of inventory to mask decline was Rationalluddite ( again not sure ) . Really would have to go thru the posts of the last 3 months to search .
Dennis , I did not say that all they sold to the market came from inventory . What I implied was that some portion of their sales came from inventory . Just clarifying . A case of bad communication here .
Hole in head,
Yes misinterpreted sorry.
OPEC and OPEC plus production and quotas
Thanks for the work Dennis, always appreciated.
Putin: The feasibility study of a gas pipeline project from Russia to China through Mongolia will be ready in the coming week
According to the President of Russia, the optimal route and length of the gas pipeline have already been determined
MOSCOW, December 16. / TASS /. Russian President Vladimir Putin is pleased with the progress of the project to build a gas pipeline from Russia to China via Mongolia. Speaking to reporters with a statement following the Russian-Mongolian talks, the Russian head of state said that a feasibility study (FS) for this pipeline would be ready in the coming weeks.
“In practical work – a project to build a transit gas pipeline through Mongolia from Russia to China. Work is progressing, and is moving forward successfully,” Putin said. In his opinion, this gas pipeline “may become a continuation of the Russian Power of Siberia – 2” pipeline.
“The optimal route, length and other parameters have already been determined, a feasibility study is being prepared. I think it will be ready in general in the coming weeks,” the Russian president said.
The Soyuz Vostok gas pipeline will run through Mongolia and will become an extension of the Russian Power of Siberia-2 gas pipeline, the export capacity of which may exceed the capacity of the Power of Siberia gas pipeline by more than 1.3 times. Construction work on the project may begin in 2024.
On December 5, 2019, Gazprom and the Government of Mongolia signed a Memorandum of Understanding, which provides for a joint assessment of the feasibility of implementing a project for pipeline gas supplies from Russia to China through Mongolia. In April 2021, a feasibility study for the construction of the Soyuz Vostok gas trunkline was approved. The feasibility study for the gas pipeline construction project includes a detailed calculation of investment and operating costs; it is being prepared by the special purpose company Gas Pipeline Soyuz Vostok.
PS Initially, another option was considered for the route through the Russian-Kitpai border (in Altai) But there is a difficult mountain route, the absence of roads in settlements, reserves.
From Mr Shellman . He never disappoints .
https://www.oilystuffblog.com/single-post/the-binge?postId=2afb1d74-471f-429f-be16-d0f75059cce2
It’s worth the look just for that “Drilling Binge” chart (and Mike’s jeremiad tone). Holy crap.
Very well written, something the average lay person can understand. Wonder what was the vote tally that repealed the export ban.
The initial vote in the house of representatives was 261 to 159.
https://babin.house.gov/news/documentsingle.aspx?DocumentID=458
That stalled in the senate and later the bill passed both houses as part of budget reconciliation. Republicans allowed an extension of renewable energy tax credits in exchange for ending the export ban.
https://www.bloomberg.com/quicktake/u-s-crude-oil-export-ban
It was mostly republicans in support of the end of the crude export ban.
Another home run by Mr Shellman . Scroll thru the comments section especially . Love this .
https://www.oilystuffblog.com/forum/forum-stuff/reserve-replacement
Some people here, despite having an interest in energy issues, have some profound misunderstandings.
To correct a statement from the last oil post 5 days ago, and in the spirit of presenting facts rather than opinion
“Also the Brits thought they had excellent offshore wind resources until they turned out to be not excellent”
To the contrary, the wind reserves of offshore N.Europe are world class outstanding- they just need to be developed. Its like Texas or Saudi after only 2 wells had been drilled.
The offshore wind energy production will blow the nuclear and onshore wind energy production out of the water (far outstrip) over the next couple decades for most of the N European countries.
If factual information is of any interest in regard to the only real bright spot in the European energy future north of the Alps, here is a treasure trove of geographically based info.
https://globalwindatlas.info/
Note that average annual wind speeds at hub height greater than roughly 6.5 m/s on land and 7.5 m/s offshore are currently economically viable and are thus energy reserves- like a ripe fruit waiting to be plucked.
For individual offshore country analysis here is a gift of great information- https://esmap.org/esmap_offshorewind_techpotential_analysis_maps
(click on the country of interest on the map)
For example- The current offshore wind reserve of Finland is estimated to total 302GW if fully developed with the current generation of turbines. That is roughly equivalent to the electrical output/yr of 100-120 full size (1000MW) nuclear reactors, conservatively.
And for UK- the wind reserve total offshore is 1,800 GW- roughly 6 times that of Finland.
And lastly, all things ‘Wind Europe’- https://windeurope.org/about-wind/daily-wind/top-countries
Lets recall that current production does not equate to reserve status or future production, whether on the upside for solar or the downside for coal or oil.
Hicks . ” To the contrary, the wind reserves of offshore N.Europe are world class outstanding- they just need to be developed. ”
Not important . If the crude in Ghawar does not get into the tank of Joe Six-pack in Montana it’s value is nothing more than the sands of Sahara . What matters is not the size of the tank but the size of the tap . The ” if ” part has been addressed by Ron and me to all the forecasts of Dennis so no need to elaborate . The rest of your post and the scenarios therein only work if we have nett surplus energy . Unfortunately we are 6 years past ACP , over NG and peak coal next year as per Doug’s post on the other thread . I am not going into quality issues of oil and coal because they indicate we are over tipping point and at best doing ,what Rune calls the ” red queen ” on the total energy mix .
P.S : I need to loose 10 kg and all I ” just need” is to get my a*** out of the chair .
Hey, its up to you and a couple hundred other northern European residents to decide whether or not it is important to develop the domestic energy sources available.
You do have alternatives to developing the huge offshore wind resource. I’ll list them for you in case you’ve lost perspective
1. rely entirely on imports from Russia and the middle East. [This will be much more expensive in the post-peak era, and will likely be unreliable for too long. You will be competing with the Asians for that oil, gas and coal]
2. build hundreds of nuclear reactors. A few dozen a year few should be a good start.
3. burn the forests. that will give a few years of warmth.
4. run huge electric transmission cables up from solar generating facilities in the Med/Saharan zones [if they’ll willing sell the energy to you- I suspect they’ll be using most of it domestically].
5.deploy wind turbines
6. downsize the economy/population very rapidly, to match the decline in available energy
Its a tragic mix of choices.
Ignore the wind option if you would like to adhere to your 20th century outlook on this.
You have plenty of company- That is the attitude and current path of most of the world.
Hicks , you are one of the commentators with a round head on square shoulders . First let me quote Brendt from the last post and my response . I never knew it would come in such a short period .
“Berndt . ” “As long as the total net energy provided by all energy sources meets the needs of society, we are ok.” No, its the other way: The needs of society adapt to the energy available. That is recognizable from the number of cars sold, which goes down since 2017.”
Very well explained . I will be use this in the future to help others in better understanding of our energy conundrum . Tks .
So from your bullet points 1to 6 the only option is number 6 . Just as peak oil is a predicament then so is overshoot . Malthus ,Catton , Paul Elhrich warned us , but nobody was listening . Time to pay the piper . I agree with you ” a tragic mix ” . Number 6 is not an option by choice or desperation , it is the only option by default . Tragic , yes but then ” predicaments don’t have solution , they have only results ” .
P.S : Write off Asia . China is wobbly with a single default of Evergrande and in India 2/3 of the population survive on 5Kg of wheat / rice provided free per month for a family . Who is left ?Pakistan , Sri Lanka .? The future is not globalisation . The future is ELP ( Economise, Localise, Produce) . Who coined ELP ? I have forgotten but I think it was Richard Heinberg . Long supply chains will not work at the twilight of the oil age . Mankind will be forced to adjust to dwindling energy resources . TINA ( There Is No Alternative ) . This is our future . ”
In 1944, 29 reindeer were introduced to the island by the United States Coast Guard to provide an emergency food source. The Coast Guard abandoned the island a few years later, leaving the reindeer. Subsequently, the reindeer population rose to about 6,000 by 1963[6] and then died off in the next two years to 42 animals.[7] A scientific study attributed the population crash to the limited food supply in interaction with climatic factors (the winter of 1963–64 was exceptionally severe in the region).[1] By the 1980s, the reindeer population had completely died out.[2] Environmentalists see this as an issue of overpopulation. For example, ecologist Garrett Hardin cited the “natural experiment” of St. Matthew Island of the reindeer population explosion and collapse as a paradigmatic example of the consequences of overpopulation in his essay An Ecolate View of the Human Predicament.[8]
ELP was coined by Jeffrey Brown, “westexas,” whom I miss hearing from.
Thanks Mike B . Would love to have him back plus some others like Rockman , Rasputin etc .
That is ELM
Hole, et al-
there is a big different between being hopeless and despondent as you are (if I understand the position you stand on correctly),
vs advocating for doing nothing adaptive or innovative.
Hole in head,
Every statement about the future in involves if statements. So not a criticism of any weight in my opinion.
It is a case of the pot calling the kettle black.
Both you and Ron also have ifs, so what?
@Hickory ”The offshore wind energy production will blow the nuclear and onshore wind energy production out of the water (far outstrip) over the next couple decades for most of the N European countries.” That’s clearly impossible due to the the fanciful nature of the wind power supply. Below, you have the production of electricity in Germany with the pale blue and dark blue representing respectively electricity coming from onhsore and offshore wind turbines. How the grid managers can cope with that? How a regular economy can cope with a messy energy supply? German industrialists have warned that if the electricity supply was to become a mess, they would leave Germany and go elsewhere where the electricity supply is regular.
https://www.agora-energiewende.de/en/service/recent-electricity-data/chart/power_generation/20.11.2021/20.12.2021/today/
Regular (I guess that means even in this case) or cheap? But I guess they could buy some quick-built and cheap reactors from Areva? /S
For the unfamiliar, read up on Hinkley point C and Olkiluoto 3, regarding grid stability look into HVDC.
Edit: because I don´t think the industry is willing to pay more for electricity than it absolutely have to.
Areva is also proposing a gen 3 model rated at 1100 MW (ATMEA). Then, less costly to build.
On variable sources of electricity- “How the grid managers can cope with that? How a regular economy can cope with a messy energy supply?”
It will be hard work compared to a managing source that is on 100% of time, obviously.
[Lets remember that even nuclear plants generally have capacity factor of roughly 80-90 of the time-not 100%, and worse if they have problems]
Across the world the grid managers are struggling to learn how to make it all work better, and yes there is a long way to go.
Nonetheless it is a hell of better to have variable energy source to manage than a constant shortfall.
Long duration energy storage mechanisms, like pumped hydro or hydrogen, will be used to help even out the load vs demand.
And perhaps some of these northern European will decide to go faster and further with nuclear energy as well, but even so they will need to get on with the wind deployment fast. No one solution is going to replace the energy we have all become used to.
Pumped hydro is only intraday storage for a few hours. You’ll need deep hydrogen caverns, + a complete infrastructure of modified gas plants ( or hydrogen cells). That’s not cheap, and not fast to build either. And you need a hell more wind turbines to create the reserves, since you’ll have to fill the storing losses.
Otherwise, you’ll have the problems we have now here in Germany:
https://energy-charts.info/charts/power/chart.htm?l=en&c=DE&stacking=stacked_absolute_area
At this chart you see pumped hydro at work, it’s the light blue. They are loading up in the night.
We have cold sunny calm weather at the moment.
Wind is build strong enough to deliver more than 50% of complete load – if there is wind. Lot’s of these turbines sit at the north sea, which is not a bad wind area.
Still, doubling won’t help much in the moment.
The result you can see here, the current spot market prices – they are between 30 and 60 cents at the moment:
https://energy-charts.info/charts/price_spot_market/chart.htm?l=en&c=DE
(When the wind is blowing they are between 0 and 5 cents normally).
These are base prices, luckily we have fixed tarifs here. Otherwise loading a tesla would be much more than 100$ – there come a lot of taxes and clean energy distributions on top of these prices.
Eulenspiege-
certainly these things like electrical or hydrogen storage, and transmission, and generation beyond coal are going to take time, money and sense of urgency to get done. So would building many dozens of nuclear plants.
Use the time of nat gas wisely. It won’t last forever.
And regarding the management of an increasingly complex grid and variable sources of energy- managers will learn to handle it much better. Probably the hard way.
That is going to be painful during heat waves or arctic spells.
I wouldn’t advocate retiring coal or gas burners anytime soon, but they can be turned down when electricity is available form other sources.
” Man’s gotta know his limitations ” Clint Eastwood in Dirty Harry .
https://notalotofpeopleknowthat.wordpress.com/2021/12/20/power-when-you-need-it-not-with-wind/
Dennis,
There is an absolutely fascinating ‘story’ being played out right now in your area regarding electricity – specifically cost and looming scarcity.
If you are somewhat familiar with your region’s ISO site (or wish to learn … no better time than now and in the coming weeks), the ongoing data is showing nosebleed prices that are clearly intertwined with temperature, dearth of wind, and plunging temperatures.
In similar fashion to our European friends, New England is on the cusp of experiencing a white knuckle ‘ride’ – energy wise – as winter is just getting underway.
Coffeguyzz , what is surprising ? I posted about “The Olduvai Theory ” a couple of posts ago and was given a tough time . Understand the three basic legs of what we call as industrial civilisation are oil , electricity and metals . Oil is the key . Once oil goes so do the other two legs of IC . We are now 6 years past ACP (After Current Peak , tks West Texas fanclub for the acronym ) . The great unraveling has begun . See how fast the CC narrative has changed by the governments worldwide . Read this on the Non Petroleum thread . All are rushing to burn coal . Fascinating for those who believed in the “tooth fairy ” , nothing fascinating for those who live in reality . Coming from Netherlands . NG storage was 60.1% exactly a month ago today it is 43.7 % . By mid Feb we (Benelux) are out until and if Mr Putin is not kind . Grab some popcorn .
HIH,
Regarding New England’s electricity situation in particular, it is not at all surprising to those who have been closely following … rather it is instructive to the nth degree.
Tomorrow’s cost for New England’s wholesale electricity – at this time of day – is about $128/Mwh.
Neighboring New York is ~$50 per and PJM is ~$43/Mwh.
The biggest differences (of several) is New England’s scarcity of nat gas and the dramatic increase in reliance on both coal and oil (!) to generate power.
There. Is. Virtually. No adequate replenishment for the coal and oil when it is consumed … and winter has yet to arrive.
(The 1,100 Mw dropoff in 14 hours from wind generation – the equivalence of 1 of that region’s 3 nuke plants – is greatly magnifying the precariousness of this situation).
Bob Meltz,
You asked about a scenario for tight oil with a more consistent confidence intervals from 2025 to 2040.
I redid my scenarios with the maximum oil price at $75/bo for Brent in 2020$ from 2022 to 2028, the ratio of high to low scenario is about 1.26 to 1.37 (about 1.28 at peak). I use a log scale in chart which corresponds to ratios better.
Thanks Dennis,
That’s still an awfully tight range of URRs by 2040. How would you have to change your model to have, for example, something closer to a 2:1 ratio between your upside and downside cases? By the way, what is the current cum production for US tight oil?
Bob Meltz,
From Jan 2010 to Oct 2021 cumulative output of tight oil is about 18.7 Gb.
The reason for the tight range is that all assumptions about TRR, oil price, etc are the same for the three scenarios. The what if question being asked here is how do the scenarios change if the completion rate is different. A more realistic confidence interval would consider different TRR (as in your GOM scenarios), different oil prices and different completion rates.
Also note that the URR estimates are from 2010 to June 2046.
As to getting 2 to 1 ratio, a simple way to accomplish this is to assume different TRRs for the scenarios and different oil prices.
I could try this as well, in steps, first price and then maybe TRR.
These scenario assume only a change for Permian basin (to simplify things for me), Permian basin scenario is in the range of 31 Gb to 39 Gb, TRR assumed to be 55 Gb for all scenarios and oil price scenario identical, these could be changed, do you prefer price or TRR?
Max price change to 50/b for low scenario to $100/bo for high scenario might get us to your 2 to 1 ratio. If not we could change TRR assumptions.
Also for Permian scenarios from Jan 2022 to June 2046, the cumulative output is 24 Gb to 32 Gb.
Thanks for the explanation.
Hi Bob,
I will try price first. TRR for permian I would use 45 Gb, 50 Gb and 57 Gb. I can definitely get to a 2 to 1 ratio. But my best guess for now is $85/b max Brent Price in 2020 $ and 50 Gb TRR for Permian basin. So I would revise my price scenarios to 75, 85 and 95 $/b in 2020$.
Correction, my best guess TRR for Permian tight oil is 55 Gb, so I would likely use a range of 50 Gb to 62 Gb for TRR.
Bob Meltz,
USGS mean undiscovered TRR (UTRR) estimate for Permian basin tight oil is 70 Gb with about 5 Gb of cumulative production and proved reserves at the time of the estimates (2016 to 2018).
The F95 UTRR estimate is 40 Gb and the F5 UTRR estimate is 110 Gb. I use a very conservative UTRR estimate of 50 Gb for Permian basin tight oil for the scenarios I have presented, this might be roughly an F80 estimate for UTRR, an F20 estimate might be a UTRR of 95 Gb.
Also my middle Permian scenario with URR of about 35 Gb is only about 46% of the mean USGS TRR of about 75 Gb for Permian basin tight oil.
Federal estimate of Bakken’s future oil potential lowered after thousands of wells drilled
A new report from the U.S. Geological Survey suggests the Bakken and Three Forks rock formations contain another 4.3 billion barrels of untapped recoverable oil, a 40% drop from the agency’s last estimate in 2013.
The decline is in part due to 11,000 wells that have been drilled into the formations in the last eight years, collectively producing billions of barrels of oil predicted in the earlier estimate.
“We weren’t all that surprised that the number went down,” State Mineral Resources Director Lynn Helms said Friday during his monthly press briefing on North Dakota’s latest oil and gas data. “I think we were surprised how much the number went down.”
The wells drilled into the rock formations have produced 4 billion barrels of oil to date. Helms said he anticipates the future output of those wells will consist of another 4 billion barrels. The USGS estimate released this week covers oil production anticipated from future drilling. Combined, those figures add up to 12.3 billion, which Helms characterized as “on the lower side” of his expectations for the formations.
A significant amount of drilling has occurred in the core area of the Bakken oil patch around Watford City. Helms said about 80% of what’s considered the best mineral acreage in the Bakken oil patch has already been drilled, and companies are looking to innovate in parts of the region farther from the center.
A typical oil well in North Dakota extends for 2 miles horizontally underground, but some companies plan to drill longer 3- or 4-mile wells in outlying areas to produce an amount of oil equal to wells in the heart of the oil patch, Helms said.
The USGS also revised down its expectations for natural gas production in the region. The 2013 estimate anticipated 6.7 trillion cubic feet per day of additional recoverable gas in the Bakken and Three Forks. The latest estimate puts the figure at 4.9 trillion cubic feet per day.
Helms said the Oil and Gas Division plans to take a deeper look at the USGS analysis in the future.
The state’s latest data released Friday shows that North Dakota’s oil production in October again held steady at 1.1 million barrels per day, where it has hovered for all of 2021. Daily natural gas production fell 1% from September to 2.998 billion cubic feet.
The oil and gas industry is capturing 94% of all gas produced, meeting the state’s target in place to reduce the amount of gas wastefully flared, often due to a lack of infrastructure. There are several parts of the Bakken where flaring is significant, however, and Helms said he plans to work with companies that have wells in those areas to try to mitigate the issue.
Ron,
The USGS estimate in 2013 had a TRR of about 12 Gb, the current estimate confirms this. One needs to add cumulative output and proved reserves to undiscovered URR to get a proper URR estimate.
Ron,
There have not been any new assessments of tight oil in the North Dakota Bakken since 2013, the newer assessments in 2020 were for shale gas and conventional resources, a bit of tight oil in Tyler formation, but only 0.125 Gb. See
https://www.usgs.gov/centers/central-energy-resources-science-center/science/williston-basin-oil-and-gas-assessments
In 2013 undiscovered TRR was about 7.4 Gb and reserves were about 3.2 Gb, so roughly 10.6 Gb of remaining resources at that point. From Jan 2013 to July 2021 about 3.4 Gb have been produced form North Dakata Bakken Three Forks, of the original undiscovered TRR roughly 80% was in North Dakota so in Dec 2012 North Dakota Bakken/Three Forks remaining TRR was about 9.1 Gb. At the end of July 2021 remaining TRR would be about 5.7 Gb. Note that at the end of 2019 about 5.4 Gb of proved tight oil reserves were in the North Dakota Bakken/Three Forks, about 0.6 Gb of North Dakota tight oil was produced from Jan 2020 to July 2021, so if there have been no additions to proved reserves in those 18 months, the remaining proved reserves would be 4.8 Gb, with the potential that 0.9 Gb might be added in the future, in fact it is likely that proved plus probable reserves (2P reserves would be the petroleum engineer’s best estimate) in the North Dakata Bakken/Three forks might be 5.7 Gb or higher as of July 2021.
Ron,
I was incorrect, there is a new assessment at link below by USGS
https://pubs.usgs.gov/fs/2021/3058/fs20213058.pdf
As of the report (published in December 2021) the mean estimate of undiscovered technically recovereable resources in the Bakken/Three Forks is 4.3 Gb with 90% confidence interval of 1.3 Gb (F95) to 7.3 Gb (F5).
About 3.3 Gb of tight oil has been produced from the Bakken Three/Forks up to Dec 2019 and proved reserves at that time were 5.5 Gb adding cumulative production proved reserves and UTRR gives us total TRR which is 3.3 plus 5.5 plus 4.3 equal to 13.1 Gb. This essentially confirms the 2013 USGS assessment.
Also note that my estimate of Bakken URR is about 7.4 Gb and my guess is that about 1.4 Gb of “proved reserves” in the Bakken Three/Forks may not be profitable to produce. This would suggest that all of the undiscovered technically recoverable resources in the 2021 Bakken/Three Forks assessment might not be developed. Note however that my Bakken scenario uses a low oil price maximum of $75/bo in 2020 US$. A higher oil price may result in a higher North Dakota Bakken URR than my scenario, I am doubtful that much of this undiscovered TRR will be produced, perhaps 1.3 Gb at most which suggests a URR of perhaps 10 Gb (if proved reserve estimates are accurate).
“In similar fashion to our European friends, New England is on the cusp of experiencing a white knuckle ‘ride’ – energy wise”
As coffeeguzz said, a white-knuckle energy ride is in store, and not just for a few months this winter and not just for a few regions- for everyone.
Most of the worlds citizens and decision makers have failed to grasp or digest are some of the major ramifications of what is beginning-
First- it is going to take a lot more money to keep the depleting oil and gas and coal energy production ‘spigots’ flowing. Collectively, a lot more money will have to be spent- just to keep running in place for a while,
and before long even more money will have to be spent just to keep the backsliding on supply from being too steep.
This money will come from your pocket, from your credit if you’ve got some, and from your savings.
You, and your relatives, and your neighbors and your state, and your country. That means there will be less money for other things- Other things that people are accustomed to or reliant on.
Secondly, a huge amount of money will have to be spent simultaneously on attempts to deploy all sorts of other energy mechanisms that aren’t on the verge of global depletion. There will be different options for different regions, but will certainly include a huge transition from personal combustion engines to electric motors vehicles, and generation from various sources like nuclear, wind, solar, geothermal (perhaps), and in yet 50 more years- fusion power.
And this will all require huge money expenditure. As will infrastructure like transmission and energy storage.
The point here is that we cannot continue to pretend that that we can take only one path at a time. These huge dual energy paths will need to be traveled ( and purchased) simultaneously.
At this point we are at least 20 years late on full-scale dual energy (fossil and non-fossil) adaptation to the time of post-fossil peak (roughly now). It has been much easier to ignore those who have been telling the story and instead spend money on other things, all less important. And easier to just pretend that the fossil energy was inexhaustible.
We won’t be making up that 20 (or 30) year delay. We will be playing a very sad game of scramble, with a few more billion people on deck than there was when this whole situation should have been taken seriously.
Despite the very late date there are still big choices on spending and goals that need to be made now.
Some regions, and companies, and countries will handle this much more poorly than others.
RWE of Western Germany warns of a possible natgas shortage at its power plants this winter
https://news.in-24.com/news/401637.html
Martin , welcome to the blog . Very interesting info for me based in neighboring Belgium and following what is happening in Netherlands with regard to natural gas . Please keep updating . Tks
A comment was made above regarding use of crude stocks by SA to boost output. There is some evidence of that in the two attached charts for very short time.
On September 2019, Abqaiq was attacked. Drop in stocks can be seen as they used them to maintain commitments to their customers
On April 2020, SA increased output to pressure other OPEC plus countries. A drop in stocks can be seen.
However since January 2021, stocks have been essentially flat.
https://peakoilbarrel.com/opec-update-december-2021/#comment-731810
Ovi,
What source do you use for stock data? It is not clear how good this information is. Generally petroleum stocks anywhere except the OECD tends to proprietary, the JODI database tends to be incomplete, though I have nort looked at ot for a few years perhaps it has improved.
The production amounts given by secondary sources is the oil produced which flows to stockpiles, some is consumed locally and some is exported and that will affect the level of stockpiles.
I question whether Saudi stockpiles decreasing to half of the Jan 2018 level is reasonable, though more history would be needed to know the “normal” level of stocks. For the World stock levels are approximately 8.5 billion barrels for yearly production of about 36 billion (all liquids) so roughly one quarter of annual production is held in stockpiles, Saudi production is roughly 3.6 billion barrels per year, but consumption is only 1.3 Gb per year and 25% of this would be 325 million barrels, it is surprising that petroleum stocks would be only 135 million barrels, but perhaps that is crude stocks.
In any case, my guess is that the secondary source production data is fairly accurate, and the stockpile data less so.
Dennis
I went to the Jodi site and it had the option of creating your own chart. So I selected stocks, SA, and the time period Jan 2018 to October 2021. I then requested that the data be downloaded.
What puzzles me is where did all of that crude stock go that was released from January 2018 to January 2021.
I have sent you the Excel file.
Thanks Ovi.
Dennis
As requested, more history.
Still wondering where all of that crude stock released from August 2015 to January 2021 went. Implies the world was consuming more than was being produced during that period.
Also note that the slope is not that different between the first chart and this one.
That looks a little strange to me. There was a stock build when the price came down in 2015 and they cut production. And in 2020 when the price crashed stocks were drawn. That looks like a cash flow problem.
Toby
The April 20 draw down is associated with the SA increase in output to 11,700 kb/d of crude. After that they cut back production, but oil deliveries were lower and the excess output went into increasing their crude stocks. After July, stocks started to drop again.
However I do agree that it would be insightful to have a full explanation of that huge draw down.
Correct. When they were back at close to 9 mb/d of production in august (secondary sources) stocks went down further.
In early 2021 production reported by secondary sources was a lot lower and stocks also decreased. Then production went up to almost 10 mb/d and stocks were flat.
So if production reported by secondary sources (tanker tracking data) includes the stock draws, that would mean that proction ist fluctuation a lot or Saudi consumption is.
I don´t think that data is really acurate.
Thanks Ovi,
I wonder how accurate the Jodi data is. In any case in my mind it is World stock levels that are important, there was a glut during 2020 and in 2021 stock levels have come down. From Jan 2014 to Sept 2021 Saudi crude stocks fell by 140 million barrels. When one considers cumulative World output of crude plus condensate from Jan 2014 to August 2021 (224 billion barrels), the Saudi stock change is a tiny amount (0.06%=140/224000).
To me, the “saudi selling from inventory” story is much ado about nothing.
Also note last figure in post where global petroleum stockpiles are about 8000 million barrels, current Saudi stocks (if Jodi data is accurate) would be 1.75% of the total.
Dennis
This discussion did not start because of world stock levels. The question that keeps coming up is whether SA uses its crude inventory to adjust its deliveries and production numbers. Since one cannot see deep into SA, this question keeps arising. As noted above, there appears to be two instances where stocks could have been used to make production levels look bigger. The stock change is not proof but only an indicator.
There is another case that also looks interesting. From September 2018 to November 2018, production (C “+”C) went from, 10,738 to 10,938 to 11,218 kb/d. This extra boost in production resulted in an extra 20,880,000 bbls of output. Over that same time period stocks dropped by 15,586,000 bbls (223,804,000 – 208,218,000). So while 20.9 M extra barrels were pumped, stocks dropped 15.6 M bbls or 74.6% came out of inventory. Coincidence or intentional. Who knows, but interesting.
Also note that Nov 2018 is our current peak oil. Maybe it really is about 480 kb/d lower using the SA September production of 10,738 as their previous peak. Also the SA September 2018 output level was the same as the previous peak of July 2016.
This raises the question of whether SA was trying to send a message that their production capability continues to rise.
A bit of speculation to add to the “What’s happening inside the KSA puzzle?”
Ovi , a very well defined post with all the figures and the correct questions .
Ovi,
Pretty sure the secondary sources have this figured out, ending stocks are previous period stocks plus production minus domestic consumption (refinery input and direct burning of crude) minus exports. The reported production is the oil produced that period.
Chart below looks at delta stocks each month vs delta production using data reported at JODI from Jan 2002 to Oct 2021for Saudi Arabia. Not really correlated.
Dennis
I was looking for particular situations when SA could have used inventory to mask production drops or to send a different message to the market. A general analysis over all time would not find a needle in a haystack.
Now that the stocks have stabilized in the 135,000,000 bbls range post January 2021, it may be easier to see anomalies.
Looking at the SA April output surge to 11,642 kb/d from the March output of 9,946 kb/d, the increase was 1,696 kb/d. In April SA stocks dropped 12,747,000 bbls, or 425 kb/d or 25% of the increase. The drop in stocks sticks out very clearly in the stocks chart above.
Looking at the distribution of the deviations above and below the OLS line, both September 2019 and April 20 stick out as anomalies. For me the coincidence is too big to ignore.
Ovi,
The explanation for either case (Sept 2019 or April 2020) would simply be that stocks changed due to Saudi Araamoco decisions. In Sept the attack on facilities slowed production so the flow into stocks decreased and stock levels decreased, so that one is pretty obvious.
In April 2020 the Saudis were trying to send a strong message to the Russians so they tried to flood the World market with oil by increasing output to as high a level as possible and by drawing down their stocks.
The idea that some seem to have (others besides you) that the Saudis are maintaining production by drawing from stocks is silly. Their average monthly stock levels have been 215 million barrels from Jan 2002 to Oct 2021 and their average monthly crude output has been 281 million barrels over the same period, how is it that production could be maintained by pretending that stocks are production?
Consider the thought experiment that Saudis are claiming 500 kb/d of output that is really just being sold from crude oil stocks. Let’s also assume they do this for 12 months. Each month stocks would need to decrease by about 15 million barrels, so if stocks started at 280 million barrels they could maintain such a posture for at most 18 months and in the 19th month stocks would fall to zero. Over the July 2020 to August 2021 period, Saudi Stocks fell by about 1.3 million barrels per month while monthly average production increased by 44.5 million barrels above the June 2020 level.
If we are going to assume “production” increases are simply a draw down from crude stocks, only 3% of the production increase would be explained. To me,this explains very little based on the Jodi data.
Dennis
Let me be clear I never intended to send the message that SA was dumping inventory on a steady basis to boost output.
From my last reply “I was looking for particular situations when SA could have used inventory to mask production drops or to send a different message to the market.”
My takeaway from this discussion and looking at the data is that SA maximum sustainable production is closer to 11 Mb/d rather than 12 Mb/d like they claim they have. I think the Sept effort was also trying to demonstrate their 12 Mb/d capacity and they couldn’t quite get there so they used their crude inventory.
I am still curious about the huge draw down from January 2016. Did they need the cash or was it some concern with the “stranded assets” theory that was starting to circulate.
Ovi,
Others have claimed that Saudi Arabia is declining and hiding it by drawing stocks.
I agree that Saudi capacity is likely overstated, I take maximum 12 month average output as capacity, a single month output total is of little interest. For Saudi Arabia this maximum is 10388 kb/d in July 2016 (centered 12 month output).
Dennis
I would buy that 10,500 kb/d is closer to the truth. It could be more clear in a year or so when SA may have to offset the decline in some of the other OPEC countries.
Saudi Arabia C Plus C output
Hi Tks Ovi for bailing me out . Muchos Gracias .
HIH
Your welcome. Those two spikes were obvious places to check.
There is also a possibility that the increase starting in April 18 and ending in November 18 at 11,281 kb/d might have been assisted with the use of inventory. Stocks dropped from 235,421,000 bbls in March to 208,218,000 bbls in November. Not sure what the issue would have been back then. A lot of maintenance?
Ovi,
Is there stock data From Jan 2013 to Dec 2017?
Dennis
See above
Updated charts by Jean Laherrere
https://aspofrance.files.wordpress.com/2021/12/graphsjhl-17dec21.pdf
See page 8, world oil production & discovery. He shows discovery at lowest ever since 1930s. Where’s that oil hiding??
As of the end of November, total global discovered volumes this year were estimated at 4.7 billion barrels of oil equivalent (boe), the Oslo-headquartered energy researcher said. With no major finds announced so far this month, the industry is on course for its worst discoveries total since 1946.
https://www.energyvoice.com/oilandgas/374382/2021-sees-oil-and-gas-discoveries-sink-to-lowest-level-in-75-years/
————
This is less than two month supply!
Oil is falling hard this morning.
Let’s see if next year gets hard for shale, again. Falling prices with taper tantrum from the FED, and ambitious drilling plans to execute in a supply chain chaos enviroment.
HHH – let’s see at which % reduced stock prices the margin credit bomb will ignite. When this happens, it will tear down oil prices next to 0, too – just by all these hedge fonds having to sell to scramble cash.
I think this will be the most important factor to oil production next year.
Only asymmetric way to play this is being long US dollars. Now there are certain things it’s better to be long US dollars against. But the heart of the problem is not enough dollars to service debt and push prices higher. So when margin calls go out it’s a cascading effect. Market takes escalator up but it’s an elevator in free fall on way down. All kinds of things will get sold into and illiquid market to meet margin calls.
Easiest thing to watch for the average people who don’t really dive deep into markets and how and why they work is just watch 10 year government bond yields. As FED and ECB and other central banks attempt their exit of QE. 10 year bond yields will fall towards zero and in all likely hood go negative. Ushering in negative nominal interest rates. Not only in US but also in Australia, New Zealand, Canada and UK.
This is deflationary. Not the inflation story you hear and read about everywhere. 2022 is shaping up to be a train wreck.
Government debt is one thing (they can print via ECB/FED), but private long bonds…
You’ll pay negative interrest on a AAA corporate bond, just to probable get it defaulted during a real deflationary scenario. Deflationary crashs are all about getting money to be able to pay back debt.
To stop this the FED will have to send out the money dumping helicopters…
But the 10 year market will have to orientate new when QE runs out. The biggest buyer will go away – and what a buyer. It’s like stock buyback – independend of valuation, chart , macroeconomic thoughts bind buying like a robot.
At least I know the stock market can’t live without these buybacks (from cheap money as you already stated) anymore.
Another thougt I had this weekend.
At the moment the turkish lira crashs hard. But the central bank does the same as here – having lower interrest rates than inflation. Only the believe in Euros and Dolloars is much higher – and that’s the only thing that keeps a monetary inflation away.
Biden’s $2 trillion spending plan got shot down by fellow Democrats. US treasury will be issuing less debt if that remains a no go.
Mean less debt for central bank to buy. But the bigger problem is less collateral being made that is used to make loan and ultimately that means less dollars created by commercial banks. Margin debt takes a hit with less collateral to used to borrow more money to pump prices.
It’s deflationary.
They need fresh money fast. Or a new spending program, fast.
Wallstreet has started moving. It’s just still in the trend channel, so no damage to the upwards chart – so far. But several stuff is near key support, including oil. And as written, there is this 1 trillion dollar atomic margin bomb under wallstreet.
Times get interresting.
In another arena, the turkish lira is crashing hard today, nearly 10%. Turkey is the 19th biggest economy world wide, so no tiny country.
In another arena, electricity spot prices reached 60 cents in Germany. People are shielded now ( tarifs here are at least fix for the year ), but damage is done under the hood. No mention in the newspapers.
In the same arena, first utilities announce they could need to shut down their gas power plants for some time in the winter. We shut down some atomic plant in 10 days.
Oil price has so far been hit hardes from the current price jitters – could crash soon, while shale companies plan to increase drilling for next year.
Times get very interesting. Should I buy a generator?
There are a few large systematic European banks that have a lot of exposure to Turkey.
They about to lose their shirts. Partly the reason the Euro is rallying today. Some unwinding going on.
I think WTI will be doing well to average $50 in 2022. Oil needs everything running smoothly to go to $85 or higher and stay there.
https://cms.zerohedge.com/s3/files/inline-images/eu%20power%20prices.jpg?itok=ya-GyQJp
TSHTF in Europe electricity markets . Poland is cheapest . Why ? Coal powered plants . Try stopping coal burning .
Europe gas up another 7% so far today. €147 per MWh ~$280 per barrel of oil equivalent. French power contracts at 442.88 euros (new ATH).
https://www.barchart.com/futures/quotes/TG*1
https://www.energylive.cloud
https://twitter.com/JavierBlas
EUROPEAN ENERGY CRISIS: Day-ahead electricity prices across much of Europe set fresh and frightening record highs. Germany jumps to an incredible €431 per MWh. At current prices, energy-intensive industries will rather shut down and re-sell their power on the spot market
Anyone here know what causes this? Nat gas here in Europe too.
…up another 4% so far today.
Russian gas flows to Germany via Yamal-Europe stop, Gascade data shows
Russian gas flows to Germany via the Yamal-Europe pipeline stopped on Tuesday morning, data from German network operator Gascade showed.
… up over 19% right now. French power contracts at 452.94 euros (new ATH).
https://twitter.com/JavierBlas/status/1473211653806338051
France is resorting to **burn fuel-oil** to keep the lights on this morning.
https://twitter.com/alexlongley1/status/1473258236308557828
UK gas at $320 a barrel of oil equivalent
Libya’s Sharara, Hamada oil fields and Zawiya terminal shut due to PFG blockade
Libya’s key southwestern oil fields of Sharara and Hamada, and the 300,000 b/d Zawiya oil terminal, have been shut down after a blockade by a unit of the Petroleum Facilities Guards, sources close to the matter said Dec. 20.
Yeah, the oil supply is bound to collapse after peak oil, which is in the past.
Saudis Are Right to Warn of a Collapse in Oil Supply
The world’s need for affordable oil isn’t going to disappear anytime soon. If supply doesn’t pick up, that won’t bode well for any of us.
This won’t win me any friends among the green lobby, but Saudi Arabia’s Oil Minister Abdulaziz bin Salman is right to warn of a potential energy crisis resulting from falling investment in fossil fuels. Here’s why.
The prince warned that worldwide oil production could fall by 30 million barrels a day by the end of the decade because there is not enough being spent on the exploration for and development of new resources. That implies production of less than 70 million barrels a day.
Of course, he is talking his own book. The kingdom holds vast reserves of oil beneath its sands and under the shallow waters of the Persian Gulf — and it wants to see a healthy market for that oil for years to come.
But his warning isn’t entirely self-serving. Saudi Arabia’s oil riches aren’t open to foreign investors, so his call for more spending is actually aimed at encouraging competition with the kingdom.
This serves as a recognition of two things: First, the world’s need for affordable oil isn’t going to disappear anytime soon; and second, despite its oil reserves, Saudi Arabia can’t supply it all by itself.
Even the International Energy Agency, which has been incorrectly cited as calling for an end to new oil developments, sees oil demand remaining near pre-pandemic levels by 2030.
Even with the environmental policies that had been announced prior to the United Nations COP26 Climate Change Conference in November, the agency saw 2030 oil demand at 500,000 barrels a day — just 0.5% below its pre-pandemic level. In its “Sustainable Development” scenario — which sees advanced economies reach net zero emissions by 2050, China around 2060, and all other countries by 2070 at the latest — the drop by the end of the current decade is estimated to be just 9 million barrels a day, or 9%. That would still leave the world needing about 90 million barrels a day of oil by 2030, a supply shortfall of 21 million barrels a day — more oil than was consumed by the U.S. in 2019 — according to the Saudi minister.
There is a lot more to this article, along with a couple of great graphs. You should read it.
The ND Monthly Oil Production Statistics is just out. Not much change, production was down 3,700 barrels per day. Their production has been flat for nine months. Their production is down just over 400,000 barrels per day since their peak in November 2019.
Wrong URL for the ND stats. Here is the correct one:
https://www.dmr.nd.gov/oilgas/stats/historicaloilprodstats.pdf
For ND Bakken/Three Forks production the link is below
https://www.dmr.nd.gov/oilgas/stats/historicalbakkenoilstats.pdf
Bakken scenario below, ERR is 7.4 Gb from Jan 2000 to Nov 2044, output is zero for ND Bakken Three Forks tight oil after that.
Thanks Ron.
There are companies that are investing at a pace comparable to pre-Covid level like CLR and MRO and these companies hold production flat. Others like XTO and COP are not investing right now despite the fact that there is a lot of good acreage left to drill. XTO and COP have around 150 DUCs there but probably focus on the Permian. Production will go up with the price of oil and 4 Bbl left to be developed.
This is what I keep seeing. Lots of drilling and zero production increases. At current prices, drilling will diminish in 2022 despite budget increases. Costs are going up daily and pipe is hard to come by. The energy crisis is coming soon if the price keeps gyrating like it has the past seven years. There is no way to plan if you can’t hedge and you can’t predict profits. It’s uninvestable politically and economically in its current condition.
This is what I am seeing, the past 4 months US tight oil output has increased at an annual rate of about 1027 kbd. Data from spreadsheet linked below (EIA official tight oil data).
https://www.eia.gov/energyexplained/oil-and-petroleum-products/data/US-tight-oil-production.xlsx
About 70% of the increase in tight oil output over the past 4 months has been from Permian basin tight oil which is at a new peak of 4395 kb/d, the March 2020 peak was 4314 kb/d for Permian basin tight oil output.
LTO- “The energy crisis is coming soon if the price keeps gyrating like it has the past seven years. There is no way to plan if you can’t hedge and you can’t predict profits. It’s uninvestable”
Unfortunately price gyration in this industry seems just about guaranteed. I don’t know of any reason why it won’t get worse than last decade. The upswing in LTO production in the last decade was somewhat of a steadying influence on the pricing. The only steadying mechanism I am aware of going forward is the very gradual shift of demand toward electric vehicle miles.
LTO.
An example of the volatility:
Received quotes for WTI puts this morning.
Calendar 2022 $61.50 WTI put quote was $6.70.
Calendar 2023 $57.50 WTI put quote was $10.37.
I assume somehow the big players are able to use SWAPS and cost less collars without having to post margin?
We always had to use puts because we would have had to post cash margin.
This is how volatile the WTI market is.
We bought puts back in the day for less than $1 per barrel.
Shallow sand,
My impression is that hedging has not been affordable for smaller producers for some time.
When was the last time you actually bought puts for crude?
Toby,
Not all of the undiscovered technically recoverable resources will be developed in North Dakota unless we see higher oil prices. The Permian basin has lower transport costs to refineries (or export terminals) and the focus on developing resources might be Texas and New Mexico rather than North Dakota. Potentially there might be 2 Gb of probable reserves that might be developed in the Bakken, but only if proved reserves are not overstated, it may be that the final 2P reserves end up being close to current proved reserves, in which case none of the undiscovered TRR might be developed. I doubt it will be more than the F95 estimate.
Dennis,
I am not sure if I unstand that study and Helms´comments correctly. Helms says 4 Bbl were produced and there will be another 4 Bbl produced from producing wells. That would mean the 4.3 Bbl of undiscovered resources includes PUD reserves. Is that correct?
Toby,
Helms is incorrect about the amount of future production from producing wells. He is basing that on a very optimistic EUR estimate for the average producing well. Helms is correct that about 4 Gb has been produced so far from the Bakken/Three Forks. If no new wells were completed in the future, (so that the total number of completed wells is unchanged in the future) then only 1.4 Gb more oil would be produced in the Bakken/Three Forks. My scenario has about 16200 horizontal wells completed in the Bakken/Three Forks of North Dakota from Dec 2004 to October 2021 and total wells completed of 22745 from Dec 2004 to July 2029 (no wells are completed after that date in my scenario.)
The USGS assessment has 4.3 Gb of undiscovered technically recoverable (UTRR) resources in all of the US Bakken/Three Forks, we would add cumulative production (4.4 Gb) and proved reserves (about 5.8 Gb) to the UTRR for an estimate of total TRR of about 14.4 Gb. Some of this TRR is in Montana (unclear what proportion). Note that if we assume 95% of this will be from North Dakota (that’s speculation on my part) the North Dakota TRR would be about 13.7 Gb, my scenario is for North Dakota only and uses a conservative oil price scenario, but even with a higher oil price scenario I doubt the North Dakota Bakken/Three Forks will produce more than 9.5 Gb, 8.5 Gb might be my current best guess (I believe the scenario presented is quite conservative).
Dennis,
I absolutely agree that 4 Bbl of future output from existing wells is too optimistic. The question is, what is the definition of UTRR.
https://www.usgs.gov/faqs/what-are-technically-recoverable-oil-and-gas-resources
As the USGS does not classify any kind of reserves the USGS doesn´t care about reported PUD reserves. I think PUD reserves are part of what the USGS classifies as TRR. Undiscovered simply means undrilled according to google.
That means you can not add up cumulative production plus undiscovered TRR plus proved reserves to get total TRR.
Toby,
See the following article
https://www.willistonherald.com/news/oil_and_energy/bakken-still-has-4-3-billion-barrels-of-undiscovered-oil-out-there-in-addition-to/article_772d86de-61e2-11ec-9515-334eb210643b.html
I think the author explains things pretty well where they say 4 Gb of produced oil and 4 Gb of proved reserves and then add the UTRR. I would do it a bit differently with proved reserves at the end of 2019 at about 5.3 Gb and cumulative production up to Dec 2019 at about 3.3 Gb for a total of 8.6 Gb, then add 4.3 Gb to that for a total TRR of about 12.9 Gb, so the 4 Gb is a rough estimate of current proved reserves (assuming there have been none added since the end of 2019 it would be 4.6 Gb actually).
On proved undeveloped reserves, those are the portion of proved reserves that have not been developed and are not yet producing any oil, these reserves are included in the proved reserves total and are not considered a part of undiscovered TRR, total TRR is cumulative production, proved reserves and UTRR.
Undiscovered is not the same as undrilled, consider a 2 square mile lease with 4 potential locations for wells, but only one well has been drilled. If all 4 wells that are eventually drilled have similar EUR of 400 kb, but only one of the 4 wells has been drilled and completed, the PDP reserves would be 399,999 b after the first barrel is produced, and the PUD reserves would be 1200 kb, but the total proved reserves would be booked as 1600 kb.
See pages 9 and 10 of following document from Society of Petroleum Engineers (SPE)
https://www.spe.org/en/industry/petroleum-resources-management-system-2018/
As I am not a petroleum engineer I will defer to those in the business that know more than me.
Dennis, given the enormous amount of drilling that has been done in US tight oil plays, are there really any undiscovered reserves left? If there are indeed undiscovered reserves, where would these be located?
Dennis,
I can´t acces the website but anyway.
How could the USGS take into account any PUD reserves from the E&P companies 10-Ks when estimating UTRR? The USGS knows existing wells and makes an estimate on future wells.
I am still pretty sure that UTRR refers to all undrilled wells so that past production + PDP reserves + UTRR = total TRR. 4 Bbl of PDP reserves is optimistic but that is what Helms is talking about.
Toby , USGS and EIA are the only agencies that have the resources( funds) , manpower and mandates to collect the and correlate the data on the O&G industry . Both of them have been proved to be useless . The problem is that Dennis uses this as his base ( not his fault and not discount his effort ) but the basic of mathematics is ” if the hypothesis is incorrect then the result will be incorrect ” . One does not have to be a nuclear scientist to understand . To compound the problem are the definitions . 2p , 3 P , PUD , DUC etc , the worst is ‘” oil yet to be discovered ‘” .
P.S ; The two agencies can only provide data on the US oil and gas . US only produces about 10 million barrels against the current world production of about 78 million barrels . I have from a long time supported the ELM model of West Texas . That will be the tipping point .
Hole in Head,
the problem is, that there is no other data than the data published by USGS and EIA. But if that data is used we should make sure that we know what we are talking about.
ELM might hit hard, I agree. Some oil exporting countries will have to cut subsdies for fuel etc. like Egypt did and the Saudis are also doing this right now. If oil is your only source of income you can´t afford not to export it.
Toby,
I assure you that undiscovered TRR does not include proved reserves. Remember that not every website has correct information.
Undiscovered resources are those that are estimated to exist based on geologic, geophysical and geochemical information for the assessed rock layers. Undiscovered resources are contrasted with proven reserves, which are those quantities of oil and gas that have been confirmed to exist via drilling and production.
The excerpt above is from the press release from the USGS linked below.
https://www.usgs.gov/news/national-news-release/usgs-releases-oil-and-gas-assessment-bakken-and-three-forks-formations
When we use the term PUD reserves it stands for Proved UnDeveloped Reserves, there is a another category called PNP reserves which are proved reserves which are not yet producing.
On the page below look for “proved nonproducing reserves”, then look up North Dakota, see link below
https://www.eia.gov/dnav/pet/pet_crd_nprod_dcu_SND_a.htm
For North Dakota at the end of 2019 there were 2239 million barrels of proved nonproducing reserves in North Dakota.
At page linked below
https://www.eia.gov/dnav/pet/pet_crd_pres_dcu_SND_a.htm
we have at the end of 2019 5897 million barrels of proved reserves in North Dakota.
Proved producing reserves would be 5897-2239=3658 million barrels at the end of 2019. Where we differ in opinion is that you believe the 2.239 Gb of proved nonproducing reserves are part of UTRR. It is quite clear to me that this is not the case as the USGS says explicitly that proved reserves are not a part of UTRR, perhaps you believe the only reserves that are proved are those that are producing, but then why would we have a category of PUD or PNP reserves (where the first “P” in each of these stands for “proved”).
A comment by an oil industry insider or retired geologist might be of some help.
Dennis,
I did not say PNP reserves are part of UTRR. PNP reserves are part of the proved developed reserves whereas PUD reserves are not developed. And yes, I think PUD reserves are part of UTRR, at least kind of, as the USGS can not take PUD reserves into account. That doesnt make sense. UTRR is all that is undrilled.
We obviously disagree here. Perhaps some experts can comment.
And the 5.9 Bbl of proved reserves in ND probably also include PUD reserves, so PDP reserves should be a lot lower.
Frugal,
Their are large areas in each tight oil play that have very little drilling, the sweet spots likely have very little undiscovered resources, it is the non-core areas where the undiscovered resources might exist, note that for the Bakken/Three Forks in North Dakota I doubt that much of the undiscovered technically recoverable resource in the mean estimate will be profitable to produce at $90/bo or less in 2020$ (WTI price). Perhaps 1 Gb or so at most.
For other areas such as the Permian Basin the number is far larger with an ERR of about 35 Gb from Jan 2018 to Dec 2050, but proved reserves and cumulative production (Jan 2019 to Dec 2019) at about 14.5 Gb as of Dec 31, 2019, so roughly 20 Gb of undiscovered resources that may be profitable to produce of a mean USGS estimate of UTRR of about 55 Gb as of Dec 2019.
Toby,
Proved undeveloped (PUD) reserves are a part of proved nonproducing (PNP) reserves (if they are not developed, they are not producing). The PNP reserves can be further divided into PDNP (proved developed non-producing) reserves and PUD reserves and these would be added to PDP (proved developed producing) reserves to get the proved reserves total.
Basically the rule is quite simple, proved reserves of any type (PUD, PDP, or PDNP reserves) are not a part of UTRR (Undiscovered Technically Recoverable Resources).
Maybe Bob Meltz, Doug Leighton, George Kaplan, or Shallow sand could confirm this?
Hi Ron, from what I have read on this site it is exspected a slow increase in US shale unthil 2027, gues the output might furter slow down before it reach top. This is only 5 year to go. What I see is EIA is predicting oil surplus from 3Q 2022 and oilprice below 70 usd/bbl.
Other that follow this market is not agree with EIA conclusion and see a very tight oil market from 2022 where prices might go as high as 125 usd/bbl.
As I see it there are two main factors and it is the Spare capacity off Opec that varies a lot but might be 2 mill barrels a day even they predict it is 4 and than the US oil production is it able to increase as much as EIA predict?
Regarding Permian I see some majours are planning to double the production, but to me it seams the more production dthe higher decline that need to be replaced with more riggs, pepole, equipent that increase spending and capex. This might stop off it self before peak because off funds, pepole, equipment, places to drill as huge posibility for well interference that will increase with utilization off the Area.
If you think EIA estimat off shale is to optimistic when can we exspect a reviced version?
Well, the EIA’s estimate of US production is not really that important as far as peak oil is concerned. Even if us production does surpass its 2019 peak, which I doubt, it will not make any difference. The world C+C peaked in late 2018 with the average peaking in 2019. End of story.
I have taken a close look at all the world’s major producers and most of the minor producers. As a result, my confidence could not be any stronger that we are post peak.
Ron, I agree with you that the EIA is not much important. Today came their weekly update that show a draw on oil storrage off 7.2 mb incl SPR. The oil storage there is now below 5 years average with good margin.
The intetesting in this report was at a oilprice WTI at aprox 70 usd the L48 falls by 200k barrel a day and US oil production are now at 11.6 mbpd.
From EIA Steo they exspect US oil production will be 12.1 mb pr. Day in Q3 2022. and as I see this is with oil price about 70 usd each barrel. They exspect market to be oversupplied Q2 2022. The problem in Europe is gaz price that is more than 5 fold and compared to oil sold for 300 dollar each barrel. Many now use oil. As I know Sweden and France to produce electricity. I agree with you that peak US and Peak world is past. Permian will be the last hot spot but seems also there now is needed above 75 usd each barrel wti. This is caused by underinvestment in conventional oil and gas for several years and the green transmission that now we feel in Norway as electricity price here is in period almost 1 dollar each kwh incl. Fee or more than 10 fold. Our hydro power is exsported to EU trough some cables. When cold, no wind as the turbines can produce lots off pepole here is freezing in their homes as they cant afford to use electricity for heating. It is a terrible situation for many here.
Currently (20211222, 22:24 local swedish time) Norway is exporting 5544 MW, destination unknown, but probably to the highest bidder. (not Sweden, we are exporting too, but only 2097 MW
https://www.nordpoolgroup.com/Market-data1/Power-system-data/Exchange1/ALL/Hourly111/
And according to the same source, your base price is 228E/MWh, so I guess that fees and VAT adds about 3x that to get to 1 dollar per kWh, so the state and power line accountants should be happy at least.
So my suggestion would be to cut the outbound lines, in line with the discussion upthread about oil and Nigeria etc.
Yes it is all a big tragidy. Norway have lots off Hydro Power that is Green Energy. There have also been built out some windpower. This summer a new Exsport cable was finished and I think there are cables to both Germany and U. K. Suddenly the energy price in Norway became equal to U. K and Germany. When it is cold here and no wind in U. K price in Norpool might be for a period off day 6 nok + 25% vat and about 0.6 nok in fee for Grid i. e. If Hydropower it cost about 0,15 nok to produce. Norway is sepearated in 3 zones and in South it is most exspensive. To take a shower in yhe morning might cost 30 nok. Lots off pepole here fears the electricity bill for December. To drive Tesla espesialy at South off Norway have become more exspensive than diesel car even fuel price is 18 nok or 2 usd.
I read Sweden had some restriction related to how nuch power could be sent to Norway. The income goes mostely to the power Companies that owns the Grid and Cables Statkraft and thisagain is owned mostely by the Goverment and dividend 85% off the profit. This the Goverment use in their budget and a small fraction about 10% have been paued back to some consumers. Many are afraid this will get wurst as the politican want also cable out to the oil platforms to cut emisions. What is the difference to use the gaz in turbins at the plaftorms or exsport it to Germany and they produce electricity by use off same gaz turbin.?
Here is development off prices in November, in additional we pay 25% vat and about 0.6 nok in fee each kwh.
https://www.nordpoolgroup.com/Market-data1/Dayahead/Area-Prices/NO/Daily/
Saudi Arabia ‘pleads’ for US Patriot missiles amid Houthi aerial barrage
https://www.middleeasteye.net/news/saudi-arabia-yemen-pleads-patriot-missiles-houthi-attacks
Synopsis- low cost drones, “$10,000 flying lawn mowers”, are being used to deplete KSA’s stock of million dollar interceptors.
KSA is hands down the shittiest army on the planet. This is gonna get interesting.
Copy ,paste from Twitter .
Tracy (𝕮𝖍𝖎)
@chigrl
·
13h
Global Crude Oil Floating Storage -21.9% according to tracker Vortexa this past week.
The sharpest decline since Sept. 2019
Asia floating storage fell 38.2% W/w
Europe floating storage fell 28.8% W/w
What is happening ? Burning fuel instead of gas ???
Yes… It Seems as if we have reached the ENERGY CLIFF.
German power plant operator RWE warns of gas shortages
According to a report, the German energy supplier RWE has warned its trading partners on the EEX electricity exchange of power plant failures due to a lack of gas. In the period up to April 1, operations in several power plants in North Rhine-Westphalia could be interrupted, the reason being the increased risk of delivery problems for natural gas, quoted the newspaper “Welt am Sonntag” from a report by the company to the information platform of the electricity exchange EEX.
https://www.sn.at/wirtschaft/welt/deutscher-kraftwerksbetreiber-rwe-warnt-vor-gasknappheit-114244120
steve
China is looking like a sitting duck with the new omicron variant. They have pursued a zero case strategy that will not be possible to maintain because the new variant is too fast to track and isolate. Their vaccine is worthless against it. They are on the cusp of a debt crisis with Evergrande fiasco. They are attempting to hold the Winter Olympics in two months but the only means of accomplishing this is to force every citizen to stay locked indoors until then. If the economy locks down and the debt bubble bursts on top of that, oil prices could plummet.
The main problem is they’re loosing face when they let this variant run. They need an excuse to do it – otherwise they’ll be captive of their own propaganda.
Here in Germany the panic orchestra is playing again. The main fear is collaps of the infrastructure – not because of corona, but because all essential infrastructure workers “must” be in quarantaine because of too many corona cases.
It’s getting more crazy from day to day.
https://www.reuters.com/world/china/china-reports-100-new-covid-19-cases-dec-22-vs-77-day-earlier-2021-12-23/
“ Rising COVID-19 infections in China’s city of Xian have spurred a lockdown of its 13 million residents, with stretches of highway eerily bare on Thursday, as many people queued in the cold to get their noses swabbed at testing sites.”
Let’s see how this goes
Apologies if this has already been posted.
GLOBAL OIL AND GAS DISCOVERIES SET TO HIT 75-YEAR LOW IN 2021
• As of the end of November, total global discovered volumes this year are calculated at 4.7 billion barrels of oil equivalent
• Liquids continue to dominate the hydrocarbon mix, making up 66% of total finds
• The monthly average of discovered volumes this year now stands at 424 million boe
https://oilprice.com/Energy/Crude-Oil/Global-Oil-And-Gas-Discoveries-Set-To-Hit-75-Year-Low-In-2021.html
Doug
Thanks for the article. Interestingly, I was wondering this morning where we we were in oil finds this year. I have attached a better picture than is in the article, along with the original link.
https://www.rystadenergy.com/newsevents/news/press-releases/2021-global-oil-and-gas-discoveries-projected-to-sink-to-lowest-level-in-75-years/
The link below is from January-2021 indicating what Westwood thought the 20 biggest explorations wells of 2021 will be. George Kaplan, are you still keeping track of these things? I never heard anything about the results of Chevron’s Silverback well in the GOM. The two biggest northern GOM discoveries I know of are Blacktip North and Leopard, both drilled by Shell in the Perdido Foldbelt area, and neither on the Westwood list.
https://brazilenergyinsight.com/2021/01/11/high-impact-exploration-in-2021-could-reach-100-wells-westwood-says/
Thanks Bob,
I can try to get you in touch directly with Mr Kaplan, just shoot me an email if interested.
European natural gas prices rise by more than 23% to stratospheric levels
Cold weather in Europe and the lack of pipeline flows from Russia as they deal with very cold weather have pushed European TTF benchmark natural gas prices to new record highs at €180/mw.
This and the related surge in power prices is absolutely crippling to heavy industry and a huge burden to anyone who heats their home with gas.
The wind also isn’t blowing in Germany so that’s further driving demand.
Any plants that can switch to oil instead of gas have now surely switched over or fired up, adding to demand for oil. Given that storage is increasingly likely to be drawn down to the absolute minimum, the chance of this extending to next year is growing by the day.
Is there anyone here who is at all surprised to see these things happening?
Maybe we will will see some occasional times of stability with energy supply going forward, but these kinds of results are just the beginning.
More money to just keep running in place, and more money to try to fill the gaps with other mechanisms.
And more money, at some point, will not even get the job done.
Hicks , not me . Over the peak is the decline . WE are already 4 years into ACP ( After Current Peak) .There will be bumps and one might feel that they are on an upline but the fact remains that decline is decline . The phase of money printing to disguise the decline is also over . The law of diminishing returns is immutable . The CB’s have realised this and that is why the taper talk . There are going to be asymmetric consequences like currency crisis , food shortages , social upheavals etc over which we have no control . Rockman correctly termed it as POD ( Peak Oil Dynamics ) .
I have another alternative scenario that could play out in 2022. Actually a path way to higher oil prices even though most of world will be in chaos.
If you take the FED at face value. Say they go through with everything they plan to do. End of QE by March then rate hikes shortly after.
If your wealthy and living in an emerging market. Places like Brazil or Mexico or Chile. Can throw Turkey in there as well and a lot of other places. If you have a little wealth say $1 million or $100 million and you know that your local currency is going to take a big hit. You want to get your money out of your local currency. By buying assets denominated in US dollars.
We could see a flow of money into US. Most obvious place to park it would be US stock market. And I say that because of how the daisy chain of financial engineering works here.
Which is pension funds have to have 7% return come hell or high water. Pension funds buy the corporate debt that allows the corporate CEO to do stock buybacks. And they don’t really give a shit how bad things are in economy. They have to have 7% return and that is all that matters.
We could see stocks crash to the upside. And that might carry oil higher.
Just an alternative way to look at things.
HHH , yes a lot of outflow from emerging markets .
https://www.telegraphindia.com/business/35000-high-net-worth-entrepreneurs-left-india-during-narendra-modi-regime-amit-mitra/cid/1835449
This is the official figure . Multiply by 5 and you will get the actual figure . However your assesment that the money will go the stock market is incorrect . All these guys are very conservative . For them ROI takes a back seat . Security of capital is primary . Negative interest rates they will tolerate .
Turkish Lira is a conundrum . I have written it off at least twice but it has been bailed out by the international organisations ( Washington ) . Reason . It is the second largest provider of manpower to NATO after the US . Can Washington afford to loose Turkey especially after the recent ultimatums sent by Moscow ? More things happening behind the curtain than we know .
Let’s not forget the lessons of history, either.
Around 1200 BC, the whole Near East/Mediterranean–from Iberia to Afghanistan, from Anatolia to Punt–was a massively interconnected, global network of trade and alliances. Stressed by megadroughts, perhaps earthquakes, and ensuing social unrest, trade routes were disrupted–and it all collapsed within 50 years. Grand cities were burned and never reoccupied. Even literacy was forgotten in many places.
A whole world fell apart. Who are we to think it couldn’t happen again?
Hole in head,
Peak for 12 month centered average World crude output was Nov 2018, so closer to 3 years, by the end of 2023 there is likely to be a new peak in World 12 month average crude output.
by the end of 2023 there is likely to be a new peak in World 12 month average crude output.
Oh my goodness Dennis. Now you have gone off the deep end. Even without covid, there would be little chance of that happening. But with covid, the chance of a new C+C peak by the end of 2023 is slim to none, and slim just left town.
Ron,
World C plus C output has had an annual rate of increase of 4683 kb/d per year from July 2020 to August 2021 (EIA data), if that historical trend continues for another 16 months and then output remains flat for the next 12 months, the centered 12 month peak of November 2018 (83129 kb/d) will be surpassed by Jan 2023, in July 2023 World C plus C output would be 83675 kb/d, though the assumption of flat output after December 2022 is likely wrong and World crude output (12 month centered average) will continue to increase until 2026 or 2027 reaching a peak of 86 to 87 Mb/d followed by decline.
Dennis, that was all recovery from the covid demand crash. Again, I thought you knew that. The covid recover has gone almost as far as it can go. Only the USA and a couple of OPEC nations has any covid recovery left to recover from. Almost every other nation has already recovered to as much as possible. True, most of them are not yet back to their pre covid production level but they have stopped gaining and are back to their old declining ways.
Ron,
We will see, US, Brazil, Canada, Norway, Saudi Arabia, Iraq, UAE, Kuwait, and Russia can all increase output further, claims that they cannot will need to be proven. Note also that I said likely, this essentially means a probability of more than 50% (as in more likely than not). It is possible the new peak will happen in 2024 (65% probability it occurs by 2024 or sooner) or even 2025 (90% probability a new peak occurs by 2025 or earlier).
Of course this is recovery from the demand crash, you simply assume output cannot return to previous levels, based on World resources and past extraction rates and rate of development of discovered resources it is highly unlikely that a new peak will not be reached by at least 2025 in my opinion (less than a 10% probability).
Dennis wrote, bold mine: US, Brazil, Canada, Norway, Saudi Arabia, Iraq, UAE, Kuwait, and Russia can all increase output further, claims that they cannot will need to be proven.
Nonsence, claims that they can have the same need to be proven. And even if they can increase production that means nothing. They must increase production above their 2018 peak plus several million barrels per day to make for all those nations that have declined production since 2018.
Note also that I said likely, this essentially means a probability of more than 50% (as in more likely than not). It is possible the new peak will happen in 2024 (65% probability it occurs by 2024 or sooner) or even 2025 (90% probability a new peak occurs by 2025 or earlier).
I once saw a movie where Shirley McLain kept quoting statistics to here kids telling them how many kids fell with popcicle sticks in their mounths last year, and one and on with such statustucs. Then her friend asked her: “Where do you get all those statistics?” “Oh I just make them up” she said. Dennis, you just make up those stats. They have no more validity than the validity the nine nations you listed above will cause another peak in world oil production.
And I don’t just assume that thes nations cannot return to their pre covid levels of production. The majority were already in decline well before covid hit. They are simply continuing what they were doing before the pandemic hit.
Ron,
Claims that someone else’s comments are nonsense is not an argument. So we have the Canadian government, Brazilian government, Russian government, Norwegian government, OPEC, IEA, and EIA all spouting nonsense, but you know the truth of the matter, which is different from the conclusions of these governments and organizations.
Based on my research I come to slightly different conclusions. I believe World Crude plus condensate output will see a centered 12 month final peak in the 2026 to 2028 time frame, depending in part on the price of oil and the rate thate resources are developed in response to those prices.
A scenario with lower prices such as a maximum of $75/bo for Brent crude in 2020$ would result in a lower peak of 85 Mb/d possibly in 2026, a higher oil price scenario with Brent reaching $100/bo or more in 2020 $ by 2025 might see a higher peak of 87 Mb/d as late as 2028, beyond 2028 I expect oil prices will start to fall as the World may have reached peak demand and oil demand will start to fall faster than oil supply. Oil supply will fall at that point at a level that matches with demand at the prevailing oil price that balances the market. Expensive resources such as tight oil, oil sands, deepwater offshore, and Arctic oil will no longer see any new development.
Ron you put some of your own words in italics, making it seem the are my words, you should correct that.
You are correct that the probabilities are my assessment of what will happen, to give others a better idea of how likely I think an outcome might be.
All scenarios of the future are made up and any probability about which future scenario might be more likely would also be made up.
I try not to belabor the obvious.
In any case, time will reveal the correct answer.
Yes there are many nations that have been in decline for years, I expect that decline may continue, after the 2018 peak many of the large oil producers cut output and this accounts for the decline in those nations, the nine nations I listed will increase output by more than declining nations will decrease.
You also make stuff up, you have the notion that the nine nations I have listed cannot as a group produce more than in the centered 12 month average of Oct/Nov 2018 or enough to make up for the decline in other nations. There are many besides me that disagree.
Dennis, see my reply to Hickory below, after my Non-OPEC chart. That should answer your question about what the Russian goverment is saying. And if anyone should know, then you should know, that all nations alwayse are overly opmistic about what their future production will be. Just look at what Len Helms of North Dakota, and other North Dakota officials, said just a couple of years ago. Now they are 400K bpd below what they were back then. It happens to everyone Dennis. I am a little surprised that you would put so much weight in what folks promoting their own agenda would say.
Ron,
The EIA forecasts other nations besides the US, IEA has no specific nations agenda, OPEC makes forecasts of nation that are not in OPEC. There are also mpeer reviewed publications I use, past discovery data from Lahererre along with historical output data and resource estimates by Laherrere, and others. You base most of your analysis on only historical production data, I use that same data, along with backdated discovery data, development of resources by using technical 2P reserve data combined with the discovery data. It leads to a better estimate in my opinion.
Dennis wrote: You base most of your analysis on only historical production data,
Yeah, I do. If a country has been decline for a decade, I presume they are going to continue to decline. Of course some find a new fileld, like Norway, that will give them a temporary reprieve from their decline trajectory. But of course it is temporary.
Then there are others which I also base my projections on, like Russia. You seem to think that they will go on increasing their production every year, like they have in the past. Pity that you are so nieve on that subject.
All nations peak Dennis. The three top world oil producers have peaked. The USA has peaked. Russia has peaked. Saudia Arabia has peaked. The world has peaked. End of story.
Ron,
No I expect Russia will plateau at around 11 Mb/d from 2021 to 2027 or so. I expect nations that have been declining to continue to do so, but a few nations such as the US, Canada, Brazil, and Norway to increase output, these nations have pretty good government projections over the next 5 to 7 years, Guyana is also expected to increase output. We can look at past World extraction rates for conventional oil and past discoveries to get an idea of how fast resources get developed to model future World output. Jean Laherrere has excellent estimates of resources, my resource estimates are based in part on his research, along with that of Steve Mohr.
Note that those three nations peak output at the World peak is what is of interest, Saudi Arabia and Russia can return to that level and US centered 12 month output was considerably below its peak level for the centered 12 month output of Nov 2018. Also US is unlikely to have peaked and Saudi Arabia may not have peaked, it is the output of all nations that matters in determining the World peak, we may see higher output especially from US, Canada, Norway, Iraq, UAE, and Saudi Arabia as well as Guyana.
Perhaps this has already been posted.
Canada’s oil output may start declining in 2032, regulator says
Canada will peak at 5.8 in 2032
https://www.worldoil.com/news/2021/12/9/canada-s-oil-output-may-start-declining-in-2032-regulator-says
Survavilist wrote: Canada will peak at 5.8 in 2032.
That means they will increase production by 100K barrels per day per year. Not really that impressive, just going steady. Not enough to have much impact on peak oil.
Just my wild ass guess, but I suspect Canada’s consumption will increase more than its production. They have higher per capita consumption than USA. As well, I think I had read that Canada’s conventional oil had peaked, so the new production coming online will be from oil sands, which is basically taking energy from natural gas to feed the production of semi synthetic crude.
Energy Return on Investment of Canadian Oil Sands Extraction from 2009 to 2015
https://www.mdpi.com/1996-1073/10/5/614/htm
Yes indeed Hickory – more and more money $ with less value due to accelerating inflation chasing less and less oil & gas that takes more and more energy & resources to get out and refine! Shrinking EROEI just as Kenneth Deffeyes stated in his 2004 book (Hubbert’s Peak: The Impending
World Oil Shortage) paraphrased “We used a trillion barrels of oil and there’s one or two trillion left, but that last trillion barrels takes ever increasing energy and is of lower quality.”
Nigeria rig count down by 38% .
https://www.vanguardngr.com/2021/12/nigerias-crude-oil-exploration-loses-steam-as-rig-count-falls-38/
Hicks , asymmetric consequences . POD in play .
https://www.aljazeera.com/news/2021/12/22/nigeria-ethnic-violence-toll-jumps-to-45
I find it hard to believe that you extract any oil from tribal societies like Nigeria, Libya, and Iraq. Everybody wants the oil but nobody wants to share it with other tribes.
Good point, it was possible before, usually with the help of some armed forces, like they say, every country has an army, their own or someone elses… But things might change due to ELM effects.
Frugal ” hard to believe ” . Why ? An old Afghan saying ” Me , my family , my clan , my tribe , my nation ” ‘. This is the order of survival when resources are scarce . Another good one ” Me against my brother but my brother and me against the invaders ” . The US military learnt the lesson the hard way . 🙂
A new consumer of oil arrived: France.
Since the outage of a few atomic plants – 2 due to defects, others with a strike, they started using oil burners to create electricity:
https://energy-charts.info/charts/power/chart.htm?l=en&c=FR&stacking=stacked_absolute_area
It’s only between 100 and 800 MW at the moment.
Any news on the NS2 situation?
Natgas may not/is in fact not a long term solution but it might help short term during the adaption/conversion/down scaling/insulation process.
Related, what about LNG prices and delivery, how´s that looking?
(I think restart of Snövit/Melköja, Norway, was delayed until march?)
Edit: I think Norway has been much smarter during this energy deficit situation than us, they have been exporting electricity mostly when prices are high, while we in Sweden, in our solidary way, has been exporting as much as possible while prices are low and then importing (not much, but still) when they are high…
Laplander , NS2 is now the bargaining tool for Mr Putin . I had earlier commented that NS 2 does not mean additional gas for Europe it is only a better way to deliver gas bypassing Ukraine . Putin can wait ,he is in no hurry . When Europe freezes he will say ” not my fault ” . I burned a few commentators when I said ” don’t mess with Putin ” and ” Hail Don Putin ” . Well it seems some just learn the hard way as the US army in my response to Frugal . As to prices ??? I don’t know ?? Even today they are at about $ 350 per barrel of oil . Ridiculous . Supply ?? Be nice to Mr Putin , he is the man who has the hand on the tap . Of course we can always expect the politicians to do stupid things . Best of luck to myself . 🙂
I hope, and don´t think, you´ll freeze in the dark in continental Europe this winter at least, but I really hope people are getting aware, and start getting wool underwear, two or even three glazed windows, cut power to server halls for Facebook et al., bitcoin miners etc.
But the last points might not work well with snowflake millennials…
Edit, to nuclear proponents, we were learned at young age here that peeeing in your pants gets you warm for a while when it´s cold but it is not a long term solution. And it also leaves a nasty mess for your offspring.
Laplander, I think nuclear power is the only hope for Europe — what else is there? It seems like Finland is the only European country that has figured this out.
Well, if you look at price (both total and per kWh) I don´t think Flamanville 3 and Hinkley point C, as well as your mentioned Olkiluoto 3 shows any strong business cases.
But we´ll see, since the build time is at least 10 years, and more, much will happen in the meantime.
Edit, permission for construction of Olkiluoto 3 was granted in feb 2005…
https://en.wikipedia.org
wiki/Olkiluoto_Nuclear_Power_Plant
Edit 2, and as mentioned before, Pyhäjoki has been halted due to Rosatoms involvement.
Laplander,
Re LNG prices and delivery …
At least 2 US-sourced shipments have been diverted from Asia to Europe.
One made a U turn just off Indian coast and went back through Suez.
Second ship traversed Malacca Strait and will keep on going to Europe.
Of particular interest, an Aussie-sourced shipment made a partial drop at China and is now about to dock at Barcelona with the balance.
This reeks of desperation.
Peru is shipping cargo to Europe as is Nigeria.
Spot is hovering around $55/$60 per mmbtu … about $20 above JKM (Asian price).
To all European members . Don’t know whether to laugh or cry .
https://www.zerohedge.com/commodities/us-sends-fleet-lng-ships-fuel-starved-europe
So all those ships have ~5 million cubic meters of gas en route.
Nordstream 2 has a capacity of 55 billion cubic meters per year. That is around 150 million cubic meters PER DAY.
Hope the US has a lot of ships.
Also Yamal carries 90 million cubic meters of capacity .
How so very intelligent . 🙂
HIH
Those 5 M cubic metres are liquid. Multiply by 600 to get to the gaseous state. So that would be about 6 B m^3.
Ovi , I think you are wrong . Europe imports 175 B^m3 per year . Then if 30 loads = 6B^m3 which would imply if the US could ship 30 loads a day then in about 175/6 = 29 days they could supply enough for the whole year .?? Picked it from the comments section . Seems more like this .
“In 2020, Gazprom Export LLC supplied a total of 174,9 billion cubic meters of gas to European countries.”
so on average throughout the year, gazprom sends 480 million cubic meters of gas to europe…..daily.
that works out to 20 million cubic meters of gas to europe…..hourly.
finally works out to 333 thousand cubic meters of gas to europe………each minute.
hooray, we’re saved from the evil poootin!
uncle sammy done sent us the equivalent of 4 minutes and 48 seconds of Gazprom imports.
just need 2,880 tankers daily to make up for the loss of russian gas.
Ovi thanks.
LNG tankers can carry 210,000 cubic meters of LNG and 1 m^3 of LNG expands to 600 m^3 of dry natural gas (in gaseous state) at 1 atmosphere of pressure.
so as you said the 5 million cubic meters of LNG (about 24 tankers) would deliver 3 billion cubic meters of natural gas.
For reference Europe consumed about 1.3 billion cubic meters of natural gas per day in 2019, so these tankers would supply enough fuel for 2 days of European average consumption.
Hole in head see
https://lclngmessenger.energytransfer.com/InfoPost/resources/documents/PropertiesofLNG.pdf
Ovi is correct each tanker supplies about 200 thousand cubic meters of LNG, then multiply by 600 to get 120 million cubic meters of dry natural gas per load. The pipeline provides about 479 million cubic meters per day, the equivalent of 4 tankers of LNG per day or roughly 1460 LNG tankers per year.
HIH/Dennis
More info from reference below.
“A Q‐Max tanker can carry about 266,000 cubic meters of LNG, equal to roughly 5.5 billion cubic feet of natural gas in the vapor form”
I was just quoting the piece in the article. To convert, 1 m^3 = 35.315 ft^3.
https://www.arlis.org/docs/vol1/AlaskaGas/Paper/Paper_OFC_2014_LNG_CarriersCalledFloatingPipelines.pdf
Ovi , cubic metres of LNG and cubic feet of vapor gas . Apples and oranges . Please rectify . Use ,metric or British system . Tks .
HIH/Ovi,
Pretty sure 1 cubic meter of LNG becomes 600 cubic meters when it is standard temperature and pressure of 20 C and 1 atmosphere.
I think the numbers are mixed up – normally for Journalists not knowing anything. So much for fake news. Most if it is produced in news.
Pipelines transport gas, LNG tankers LIQUID gas.
You have to convert.
Just a sanity check – it is a loosing game to transport a million cubic meters gas over the atlantic in many really huge ships.
Some info on the LNG regasification facilities in Europe . Takeaway is that since these facilities are located in isolated locations ( to prevent damage in case of an accident ) they lack exit pipelines connected to the main pipelines . Example Dunkirk loads 3000 trucks per day .
https://www.natlawreview.com/article/lng-europe-2021-current-trends-european-lng-landscape-and-country-focus#:~:text=The%20current%20large%2Dscale%20LNG,%2C%20Spain%20(seven%20terminals%20%E2%80%93%20six
So as Eulen put it correctly burning high quality diesel in ships and then burning diesel to get it to the final destination is like cooking ” caviar to make a fish stew ” .
In my view the current diversion of cargo destined to Far East and diverted to Europe is similar to the ” Berlin Airlift ” . Is it sustainable for months or even a year ? Mr Putin is well placed as far as his Fx reserves are concerned . Replacing a $12 mcf gas by $ 25 mcf gas is suicide . Heavy industry has already put in its papers to the govts of Europe . Next they will be sending the keys by post . The politicians of EU are ” cutting their nose to spite the face ” .
P.S ; I would like to point out that gas-liquid -gas means a loss of 35% BTU’s . So even if you deliver enough by volume you receive less by form of energy useable . Can’t beat physics . Best of luck to myself . 🙂
Dennis , you are correct . My problem was that Ovi mixed up the two in his post and so requested a rectification . His post
““A Q‐Max tanker can carry about 266,000 cubic meters of LNG, equal to roughly 5.5 billion cubic feet of natural gas in the vapor form “
Hole in head,
In the US we often use cubic feet and Ovi may have fallen back on that, though as a Canadian I would think he usually thinks in metric units, not sure.
Dennis , as the Simon & Garfunkel song ” nothing lost , nothing gained ” . The ground reality will be decided by neither the metric system or the British system ,that is an academic discussion . So I suggest we end this now and continue with it later on the next thread . With appreciation for all you do , best wishes . Take care and be well .
It is a thermal power station among a few which is kept in reserve by EDF and which is awakened from time to time to provide a small complement. I would say that there won’t be more than 800 MW of electricity coming from a thermal power station using oil in France.
And another new customer in 2025 .
https://www.france24.com/en/europe/20211223-belgium-to-close-all-current-nuclear-reactors-by-2025
and then we have this
https://michaelshellenberger.substack.com/p/netherlands-goes-nuclear-in-massive
NS2 held up purely by a German certification step, and it is scheduled for review no sooner than mid 2022.
Germany itself will have to get cold before one could envision a waiver.
In the US the percent of GDP spent on end-use energy expenditure is 5.7% as of 2019.
This is down from a Saudi/Iranian oil embargo decade high of 13.6% in 1980.
We will need to ramp up the spending back to those prior high levels to make an attempt to adapt to the situation we are now confronting.
Hopefully some money will also be spent on mechanisms that improve prospects for longer term adaptation rather than just short term combustion, but that would take a government that had its eye on the ball and focused on the task at hand. Sorry to point it out, but we do not have a government with energy policy as a priority, and we haven’t since 1980. Wasted 4 decades.
I wonder what percent of GDP European countries spend on energy expenditure?
Oil edges higher after ending at nearly 1-month high
Oil futures were slightly higher Thursday, on track to end a holiday-shortened week with gains after the U.S. benchmark finished the previous session at a nearly one-month high.
Encouraging data regarding the effectiveness of COVID-19 vaccine boosters against the omicron variant of the coronavirus were helping to underpin oil, analysts said, as well as studies indicating the strain was relatively less severe than the delta variant, though more infectious.
“It seems all the major catalysts that await oil in the New Year lean towards higher prices,” he said. “This week, supply disruptions from Libya and Nigeria and a bullish EIA report have WTI crude trading comfortably above the $70 level. The U.S. is a net exporter again, diesel demand roared back, and stockpiles are dropping.”
The Covid recovery is just about over for Non-OPEC. In the 8 months from May-20 To Jan-21 Non-OPEC production increased by 436,500 barrels per day. In the next 6 months, Jan-21 to Jul-21 OPEC production increased by only 34,000 barrels per day. That’s over 12 times the rate in those 8 months than in the last 6 months.
Again, for Non-OPEC, the covid recovery is almost over. And they are still down almost 3.5 million barrels per day from their pre covid level.
“The Covid recovery is just about over for Non-OPEC.”
What do you base that on Ron?
It looks to me like most sectors will take minimum 1-2 more years to recover form Covid.
And this affects things like the worker availability in the sector and piping supply, for example.
Additionally the high price for oil has barely started to make its mark on project funding and startup, I suspect.
I think it will be 2023 before we can say we are moving beyond an economy in the grip of Covid (assuming everything goes very well with the pandemic from here).
We will have a good idea of when we are beyond Covid affects a few quarters beyond the time when there are no more ships waiting to offload cargo at the big ports, and there are no cities or businesses under quarantine, and vaccination status is no longer an issue.
I suppose I am missing your point.
I meant Hickory, that almost all Non-OPEC nations are producing flat out, and have been for six months now, but still cannot increase their production. I know, a lot of this has to do with a lack of funding. Investment is just not there, even after the price increase. I suppose covid has a lot to do with that as well.
Normally Non-OPEC goes the way the USA and Russia goes. Russia increased production by quite a lot in September and October but slowed dramatically in November. And they are scheduled to slow even further in December.
Russian liquids output growing slowly Bold mine.
Russian crude and condensate output increased by less than 0.3pc in the first two weeks of December compared with the daily average in all of November, suggesting producers are edging closer to the limits of spare capacity after restoring much of the production cut under the Opec+ deal.
That’s about 8K bpd less than their small increase last month. Russia is almost at their post-covid peak which will be about half a million barrels per day below their pre-covid peak.
No Hickory, I do not think Non-OPEC has much more uumph to go. They will certainly never reach their past peak of 52.5 million barrels per day. Well, not in my opinion anyway. I have been wrong.
There is an event which may end up being a major wildcard in the whole US scenario- production, demand, and even function.
Its the big issue everyone should be hoping doesn’t come to be-
a broken 2024 election. Real or perceived- these days there doesn’t seem to be a difference.
The stage is set for national disruption unlike anyone alive has ever seen in this country.
And anyone who thinks that this is a remote risk has not been keeping track of the situation.
Too bad I’m not fabricating a concern here.
An attempt at fabricating a crisis is underway folks.
World peaked, so far, three years and one month ago, November 2018, at 84,599,000 barrels per day. (C+C) We do not have an exact production data for the latest C+C data, but it is about 4.5 million barrels per day below that November 2018 level.
I will try to keep posting as to how far we are from this point, monthly, in the future, if I live long enough. But I am 83 years of age. And I am absolutly confident that I will not live long enough to ever see that threhold breached. And to be honest, I don’t believe any of you will either. 🤣
Ron,
I hope you remain healthy for another 10 years or so and you are very likely to see a new World peak in C+C output.
Perhaps all non-OPEC nations are producing flat out at current oil price levels, but higher oil prices are likely to lead more new wells completed and higher output levels.
Your non-OPEC chart end in July 2021.
Russian output has increased by 425 kb/d from July 2021 to Nov 2021, and US tight oil increased by 342 kb/d from July 2021 to Nov 2021, so an increase of 767 kb/d for just US tight oil and Russian output over the past 4 months or at an average annual rate of 2301 kb/d.
I agree Russian increases may slow in the future, but I doubt this occurs for US tight oil until 2025 or so.
Ron , from Dennis’s post ” hope you remain healthy for another 10 years or so and you are very likely to see a new World peak in C+C output. ”
I hope and pray so . Learnt so much from you . Be well .
Ron, stay healthy. Live another ten years if you want to, or twenty or thirty or forty. Very unlikely you will see another global peak even if you do. Also, merry Christmas all!
Stephen,
I believe you think demand will be the limiting factor, I doubt that will be correct until 2028 or later, in the mean time demand will return to 2018 level and supply is likely to follow, it is likely to occur in 5 years time, hopefully Ron lives as long as he wishes.
US tight oil output was about 7000 kb/d for centered 12 month average at the previous World peak in Nov 2018. My high oil price scenario has US tight oil output reaching almost 12000 kb/d, some 5000 kb/d higher than at the level at the previous World peak. There will also be higher output from Canada, Brazil, Norway, and perhaps OPEC plus relative to the level in Nov 2018.
Bless you Ron and I hope you are enjoying your retirement. And thanks for your excellent C + C production analysis. I definitely think that you are correct in your oil production peak prediction but the only way I see that world production could go higher is if any other region of the world that has shale resources gets developed the way the USA shale plays got developed. There must be other shale plays around the world that could potentially be developed. What is your opinion on that?
Global Oil And Gas Discoveries Set To Hit 75-Year Low In 2021
Global oil and gas discoveries in 2021 are on track to hit their lowest full-year level in 75 years should the remainder of December fail to yield any significant finds, Rystad Energy analysis shows. As of the end of November, total global discovered volumes this year are calculated at 4.7 billion barrels of oil equivalent (boe) and, with no major finds announced so far this month, the industry is on course for its worst discoveries toll since 1946. This would also represent a considerable drop from the 12.5 billion boe unearthed in 2020.
Liquids continue to dominate the hydrocarbon mix, making up 66% of total finds. Seven new discoveries were announced in November 2021, unearthing around 219 million boe of new volumes. The monthly average of discovered volumes this year now stands at 424 million boe. A reduction in cumulative volume highlights the absence of large individual finds, as has been the case in previous years.
“Although some of the highly ranked prospects are scheduled to be drilled before the end of the year, even a substantial discovery may not be able to contribute towards 2021 discovered volumes as these wells may not be completed in this calendar year. Therefore, the cumulative discovered volume for 2021 is on course to be its lowest in decades,” says Palzor Shenga, vice president of upstream research at Rystad Energy.
Well duh! Just what the hell would one expect when peak oil is three years in the past.
It’s hard to believe that a lot people think that the volume of discoveries is directly proportional to the amount of exploratory drilling taking place, and ignore the fact that there’s less and less oil to be found.
Frugal,
That’s my view as well – there just aren’t that many big prospects out there. Even if exploration drilling is down, companies are still going to find a way to drill their best prospects. Now if oil companies think oil prices are going to continue to stay high, you will probably see exploration budgets increase somewhat, but I don’t think that is going to result in much improvement in exploration results in future years.
Frontier areas that do get pursued seem to either end up gas prone, like offshore South Africa (Total’s Brulpadda discovery from a few years ago) or offshore Vietnam (Eni’s Ken Bau discovery a few years ago), or result in either full blown dry holes, or non-commercial discoveries, like offshore Bahamas (BPC’s Perseverance well this year) or the Barents Sea (Aker BP’s Stangnestind this year).
Ron,
I am another person that values each and every one of your posts. Your insights and vast knowledge is invaluable IMO. I too hope that you have 10 plus years to go. Merry Xmas
There will be an update later tonight.
U.S. LNG Cargoes Flock To Europe Amid Record-High Gas Prices
At least 30 tankers with liquefied natural gas from the United States are headed to Europe
Ten LNG tankers from the U.S. have already declared Europe as their destination while another 20 cargoes appear to be crossing the Atlantic en route to Europe
Another ten LNG cargoes have been diverted from Asia to Europe as European LNG prices are now much higher than the prices in Asia
A new thread Oil Production Outlooks has been posted.
https://peakoilbarrel.com/eias-december-oil-production-outlooks/
A new Open Thread Non-Petroleum has been posted.
https://peakoilbarrel.com/open-thread-non-petroleum-11/