A guest post by Ovi
Each month the EIA produces four reports which project oil output for the US and the World. The Short Term Energy Outlook (STEO) forecasts oil output for a period of 12 to 24 monthsg into the future for US and World oil production. A second report, the Drilling Productivity Report (DPR) forecasts the combined production for conventional and tight oil in the main tight oil basins, four months ahead of the EIA monthly report. Their third report, Light Tight Oil (LTO), reports on only the tight oil produced in seven tight oil basins and a few smaller ones. A fourth and final outlook is the Monthly Energy Review (MER) that forecasts US output two months past the official US production numbers, for this report that will be October and November.
Normally the Outlooks report appears at the end of the monthly US report. For this month it has been posted separately and early.
1) Short Term Energy Outlook
The December STEO provides projections for the next 15 months, starting with October 2021 to December 2022, for US C + C and other countries.
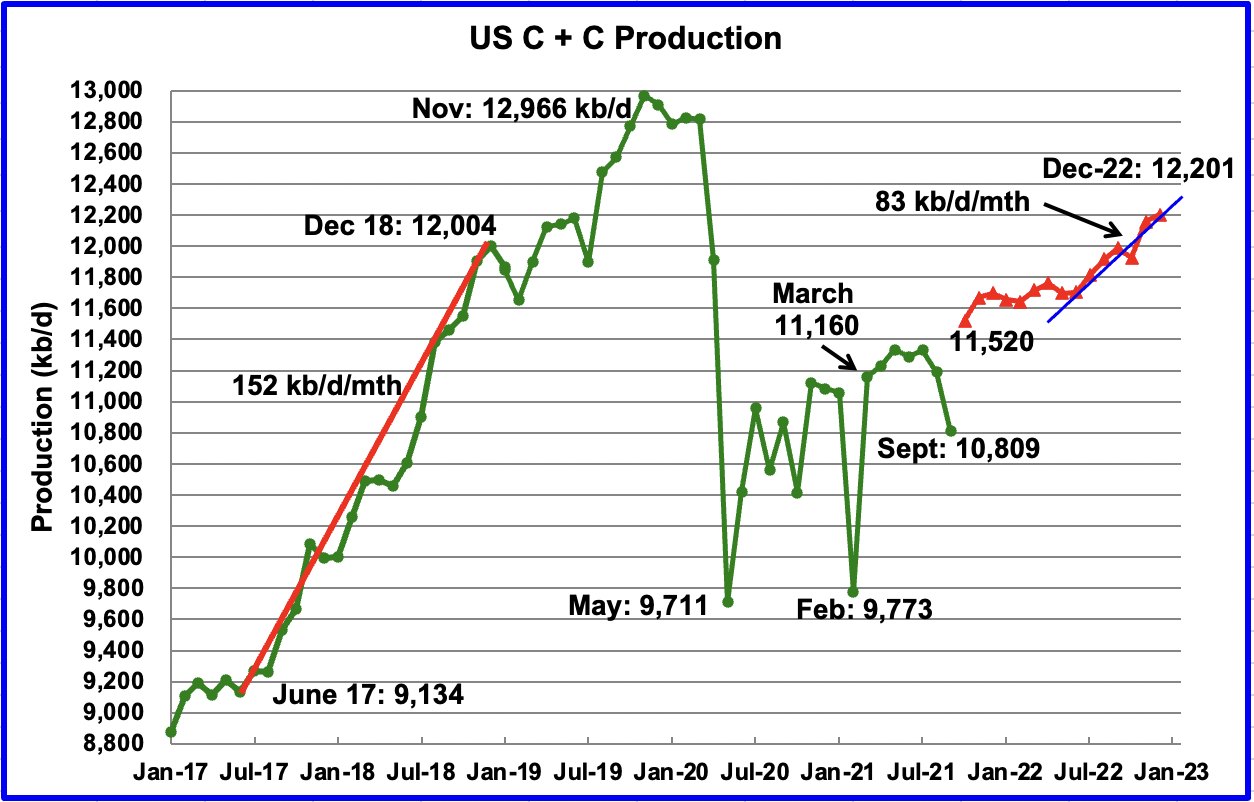
There has been a major downward revision to projected US output in the December STEO. Output from November 2021 to June 2022 will remain essentially flat at close to 11,700 kb/d. Output in July 2022 will then begin to ramp up to the end of the year and increase at a rate of 83 kb/d/mth. The projected December 2022 output has been decreased by 49 kb/d from the output reported in the November report to 12,201 kb/d.
October 2021 output is projected to rebound to 11,520 kb/d. The weekly estimates issued by the EIA for October indicate an average output of 11,381 kb/d, 139 kb/d lower than the STEO estimate.
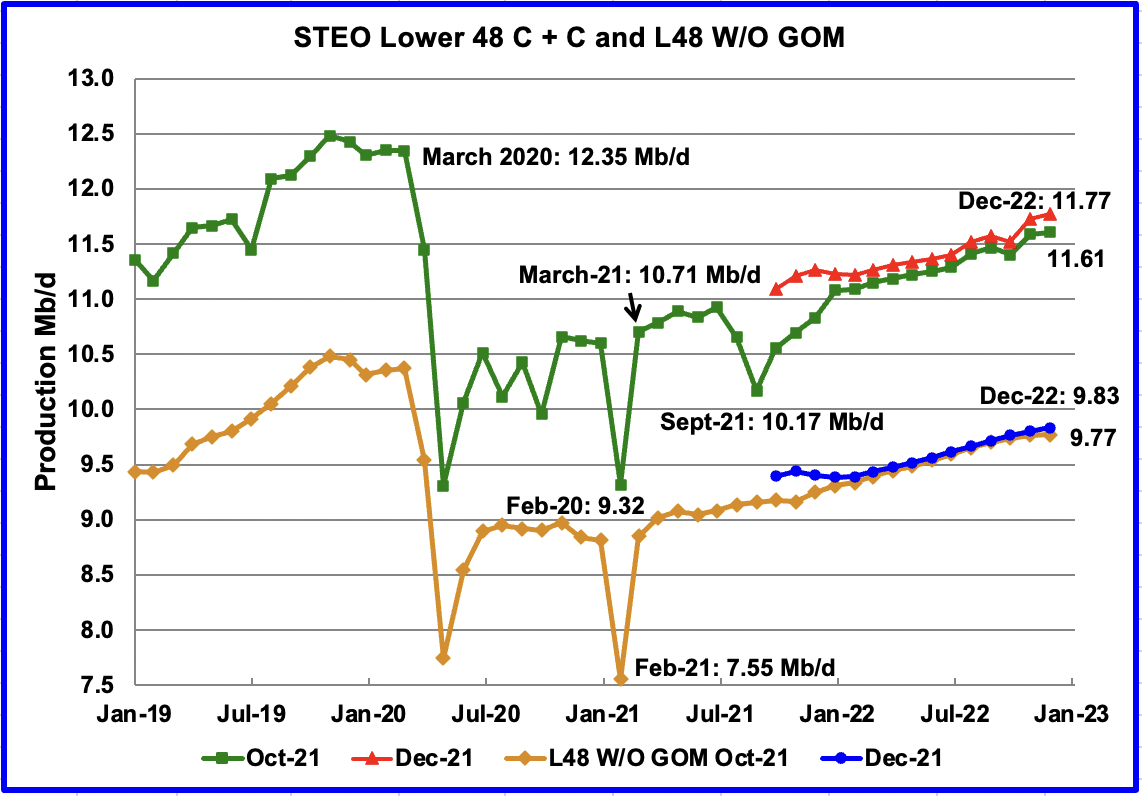
This chart compares the STEO forecast from the October report with the current December report to better illustrate how the output forecast for December 2022 changed. For the Lower 48, the December 2022 output has been revised down by 40 kb/d from 11.81 Mb/d to 11.77 Mb/d. For most of 2022, production was revised down by approximately 60 kb/d closer to the earlier October forecast.
The December output projection for the Onshore L48 states has also been revised down closer to the October forecast. For the Onshore L48, the output projection for December 2022 has been decreased by 60 kb/d to 9.83 Mb/d. From March 2022 to December 2022 output is forecast to increase at an average rate of 43.3 kb/d/mth
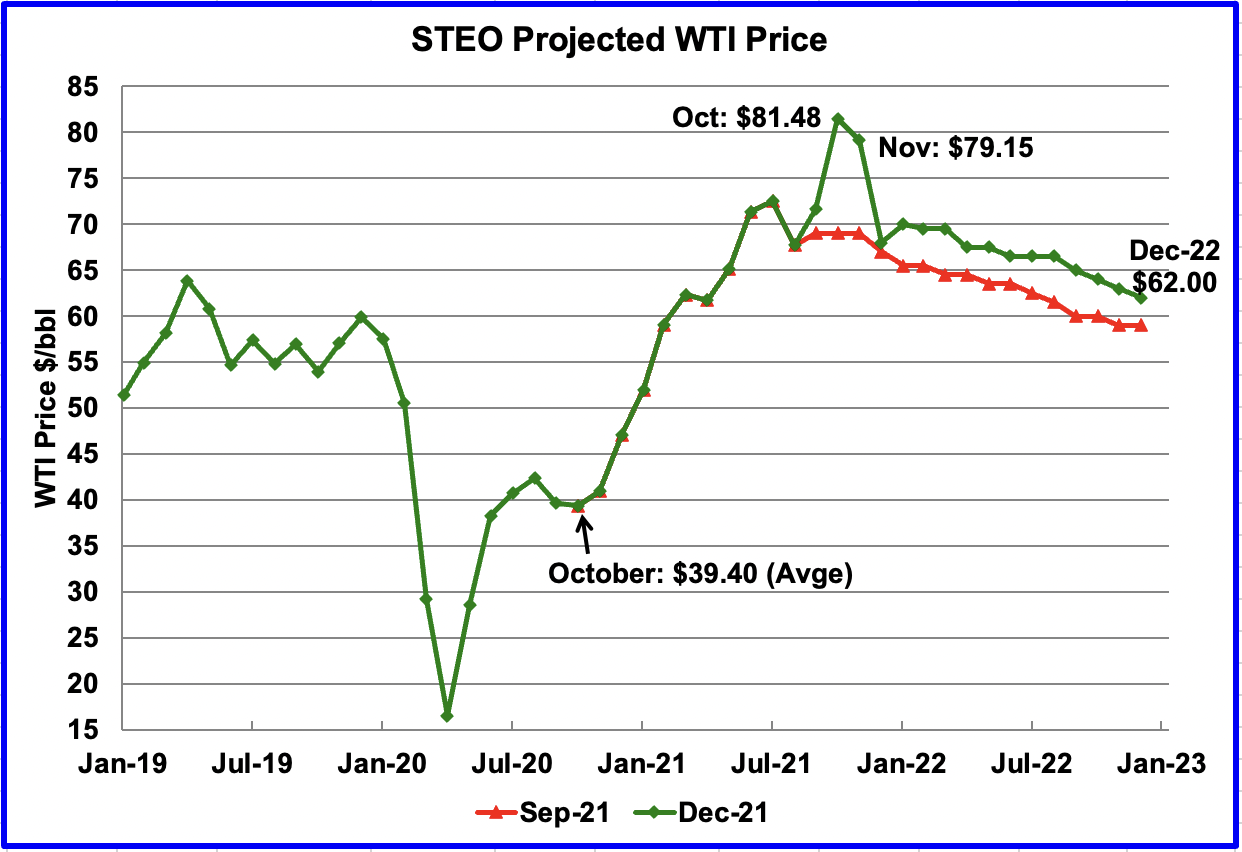
The December 2021 STEO oil price forecast continues to show a steady decline from the October peak of $81.48/bbl to $62/bbl in December 2022. The December 2022 price has not changed for the last three months.
The big forecast change for WTI occurred in updating from the September report to the December report. The major change in the current December forecast is the drop in the average December 2021 price to $68/bbl and then popping up to $70/bbl for January 2022 and then essentially staying flat for February and March.
The February WTI contract settled at $73.79 on December 23, $4.29 higher than the EIA projection of $69.50 for their February forecast.
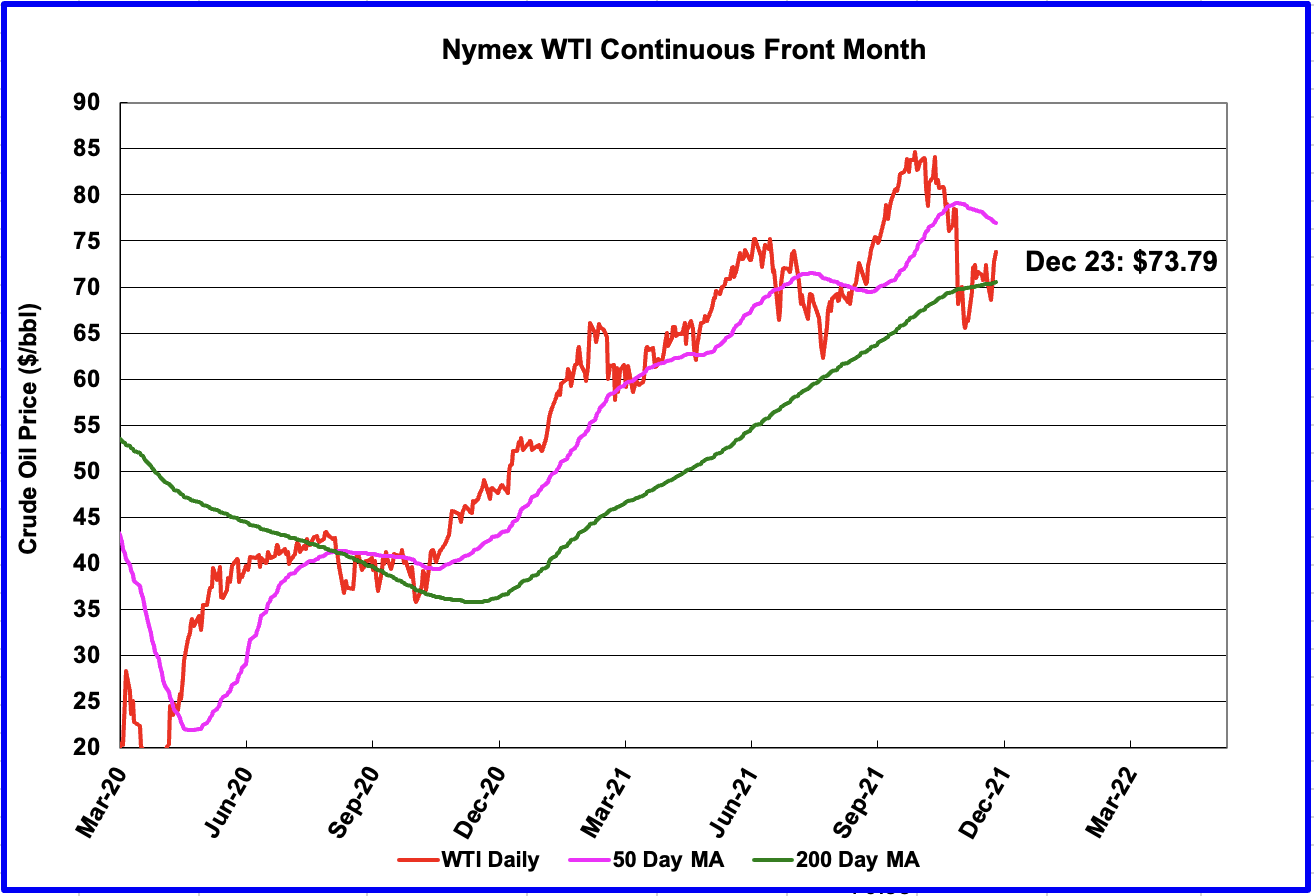
WTI on December 23 settled above the 200 day moving average. The recovery can largely be attributed to the initial over reaction to the Omicron variant and how it would affect the economy and oil demand.
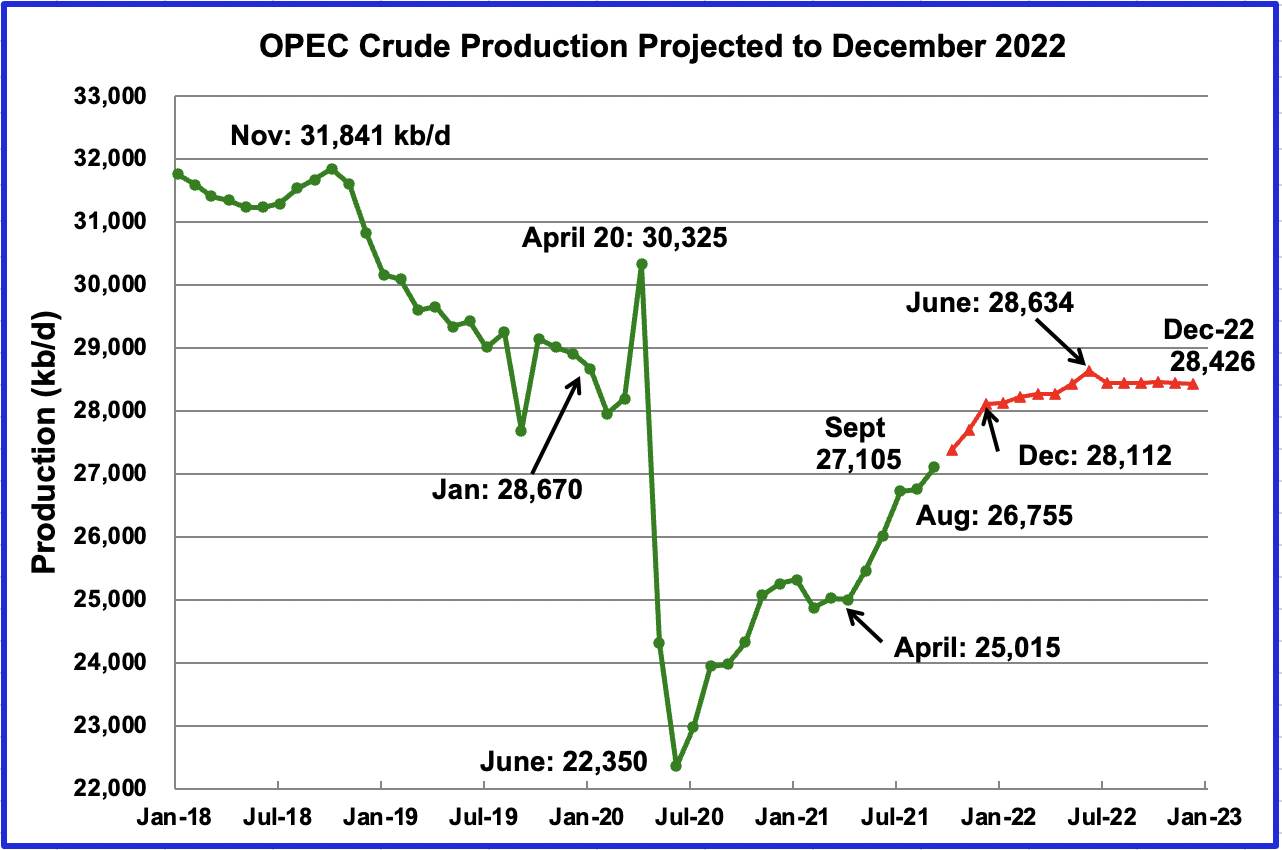
This chart shows the STEO’s December forecast for OPEC crude output to December 2022. OPEC’s output is projected to increase from April 2020 to December 2020 by close to 3,100 kb/d, which is roughly 100 kb/d less than forecast in the November report.
From March 2022 to December 2022, OPEC output is expected to be relatively flat, close to 28,400 kb/d, and with a June peak of 28,634 kb/d.
For November 2021, the EIA STEO forecast production to be 27,695 kb/d. Actual November production as reported by OPEC was 27,717 kb/d, higher by 22 kb/d. Amazingly accurate projection by the EIA.
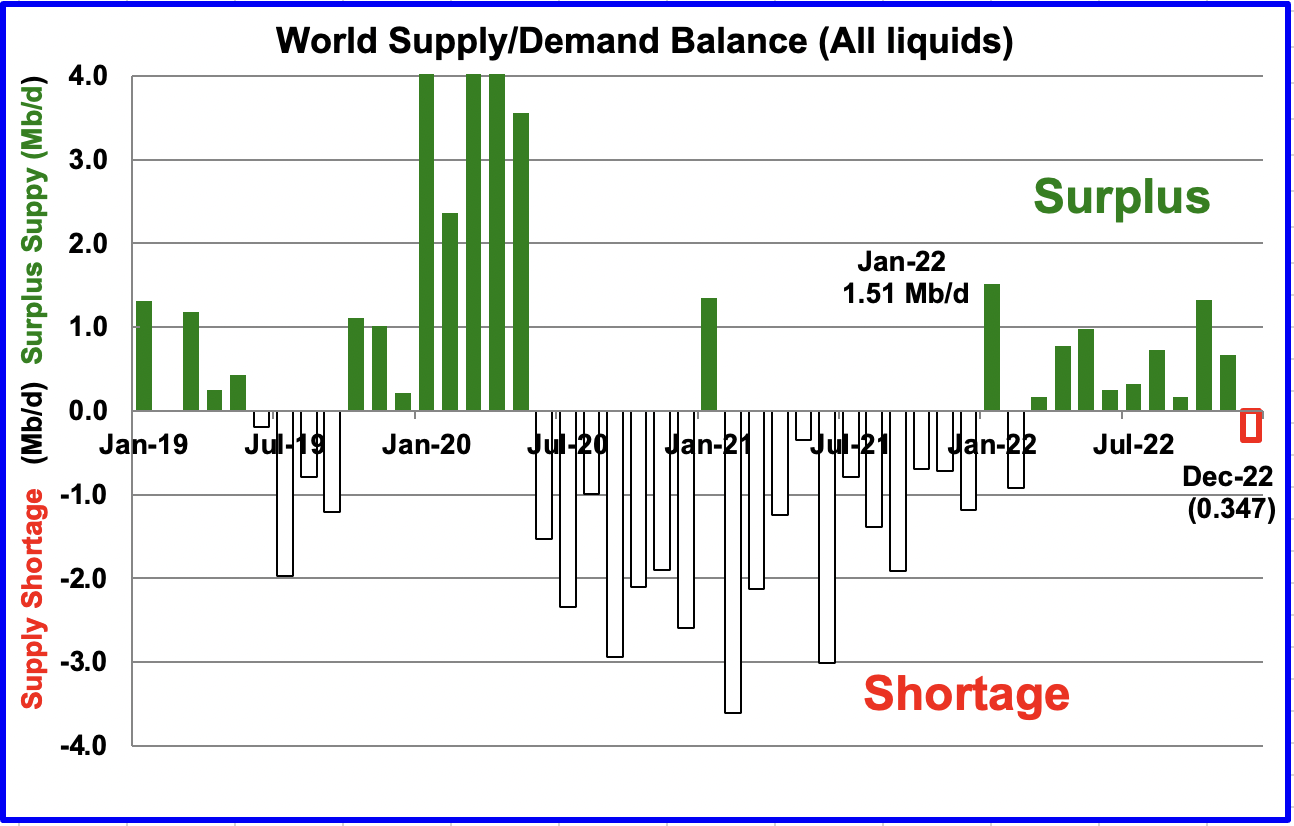
This chart show the historical supply/demand balance up to November 2021 and after that, the EIA’s forecast out to December 2022. From March 2022 to November 2022, the STEO is forecasting an average surplus of close to 595 kb/d. For December 2022, demand is expected to exceed supply by 347 kb/d.
This expected surplus between April and December, along with the variant, Omicron, and the US SPR release may make OPEC + reconsider their planned monthly 400 kb/d production increase after January 2022 at their January meeting.
January 2022 is expected to be the first month with a surplus of 1.51 Mb/d since July 2020, followed by a deficit in February and then back into a surplus.
2) Drilling Productivity Report
The Drilling Productivity Report (DPR) uses recent data on the total number of drilling rigs in operation along with estimates of drilling productivity and estimated changes in production from existing oil wells to provide estimated changes in oil production for the principal tight oil regions. The December DPR forecasts production to January 2022 and the following charts are updated to January 2022.
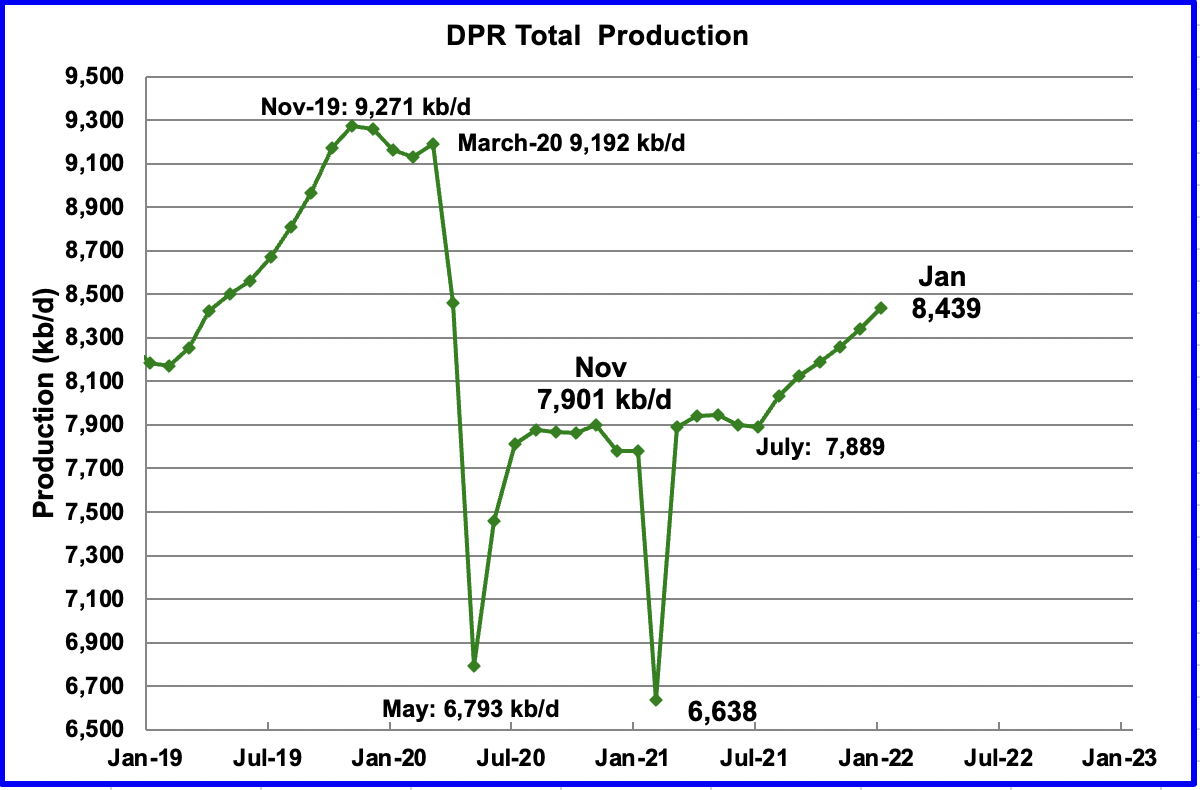
Above is the total oil production from the 7 DPR basins that the EIA tracks, projected to January 2022. Note that the DPR production includes both LTO oil and oil from conventional fields
The DPR is projecting that output for January 2022 will increase by 96 kb/d over December to 8,439 kb/d. From July to December, output in the DPR basins is forecast to increase by 550 kb/d or 91.7 kb/d/mth and appears to be accelerating since January added 96 kb/d. The Permian basin is the primary contributor to the US production increase.
If the average output rate of 91.7 kb/d/mth were to continue for another year, this would add 1,100 kb/d/yr to US production, which could potentially begin to disrupt world oil supply and cap the increase in the price of oil to below $100/bbl.
This 1,100 kb/d /yr projection is in sharp contrast with the STEO forecast above which indicates that from November 2021 to June 2022, output will remain essentially flat at close to 11,700 kb/d.
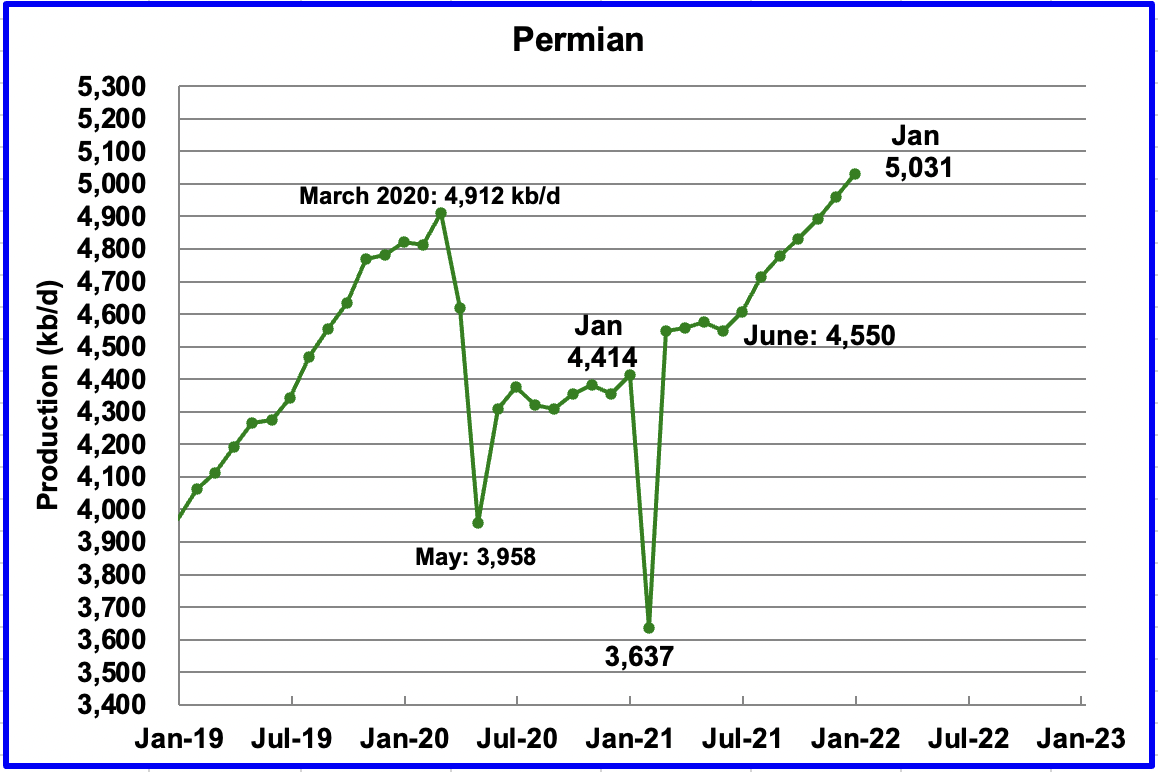
Permian output is projected to reach a new production high of 5,031 kb/d in January. From June to January production is forecast to increase by 481 kb/d or at an average rate of 68.7 kb/d/mth.
During November, 300 wells were drilled and 405 were completed in the Permian. The completed wells added 312 kb/d to the forecast November output for an average of 770.7 kb/d/well. The overall decline was 251 kb/d which resulted in a net increase of 71 kb/d. Of the 405 completed wells, 324 were required to offset the decline. It is the completion of the additional 81 DUCs, over and above those drilled, that accounts for the increase in the production in the Permian.
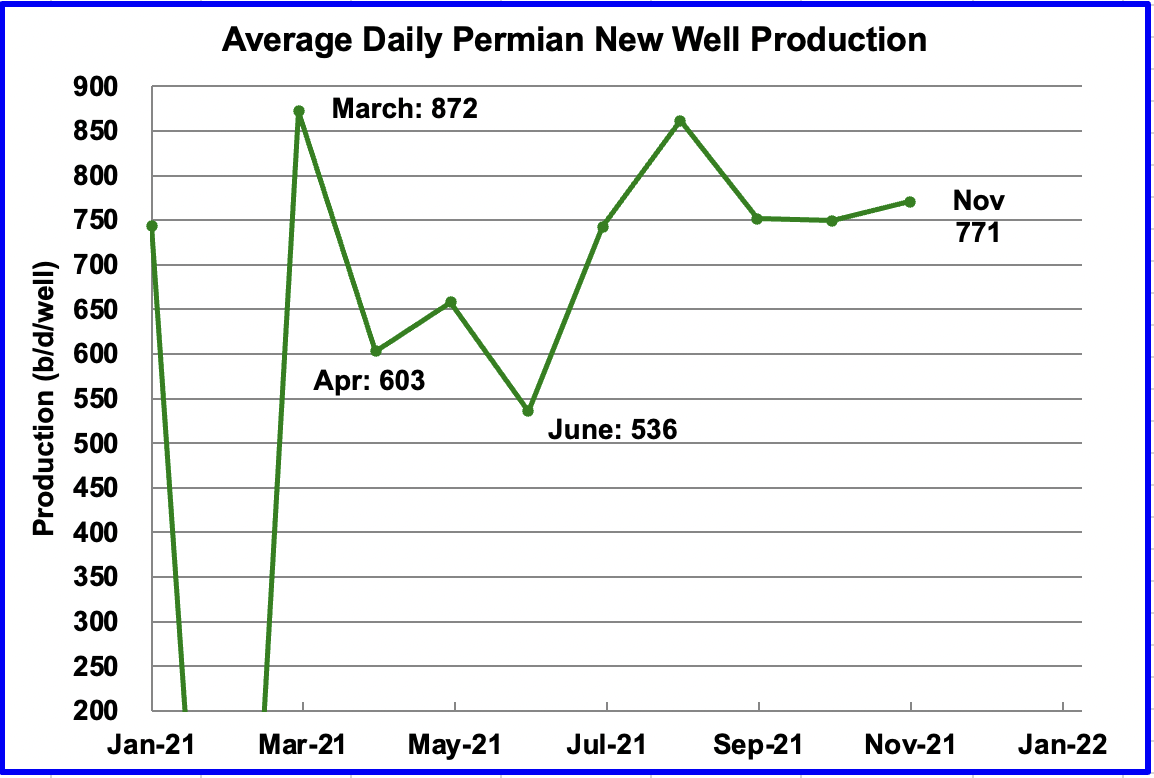
This chart shows the daily production from the average new Permian well tracked on a monthly basis. The daily output from new Permian wells was divided by the number of completed wells, as reported in the DPR and DUC reports.
For instance, during November, the new wells produced 312 kb/d from 405 wells for an average of 771 b/d. The DPR back checks their earlier estimates and it appears that the average first month output is bouncing around 750 kb/d. Well data is only available up to November to make this estimate.
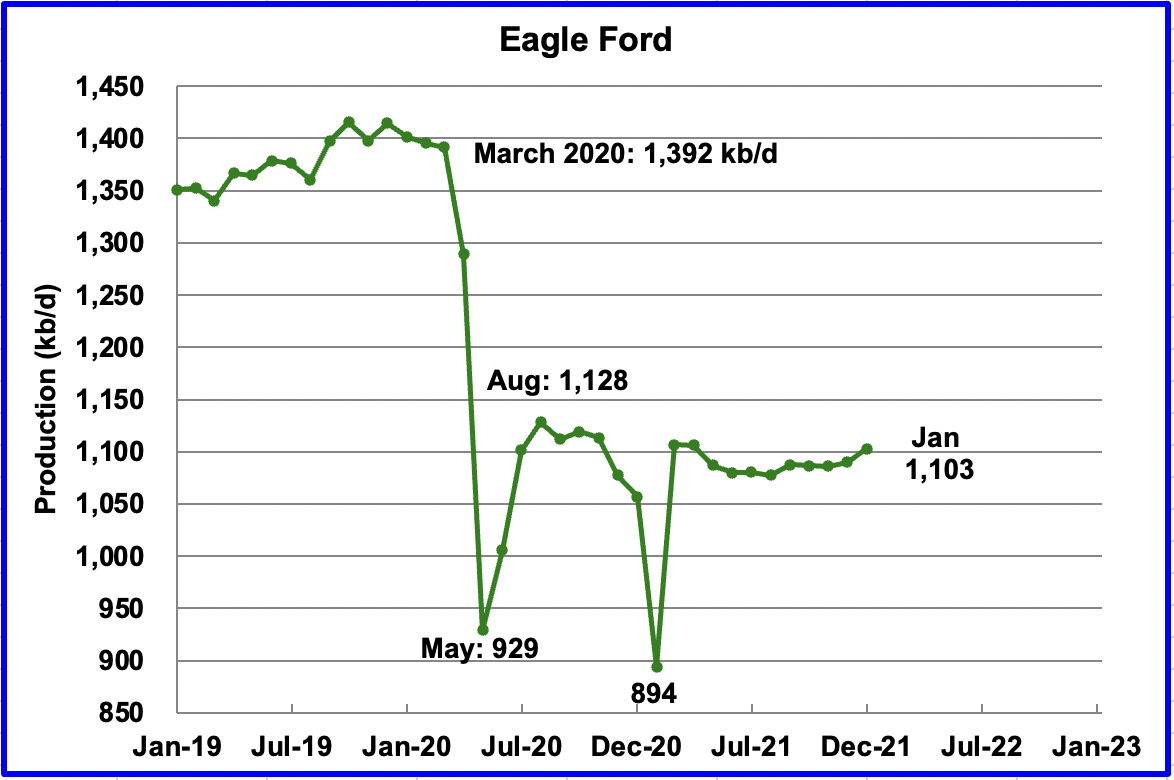
Output in the Eagle Ford basin has been showing an increasing trend since September 2021. For January, output is expected to increase by 13 kb/d to 1,103 kb/d.
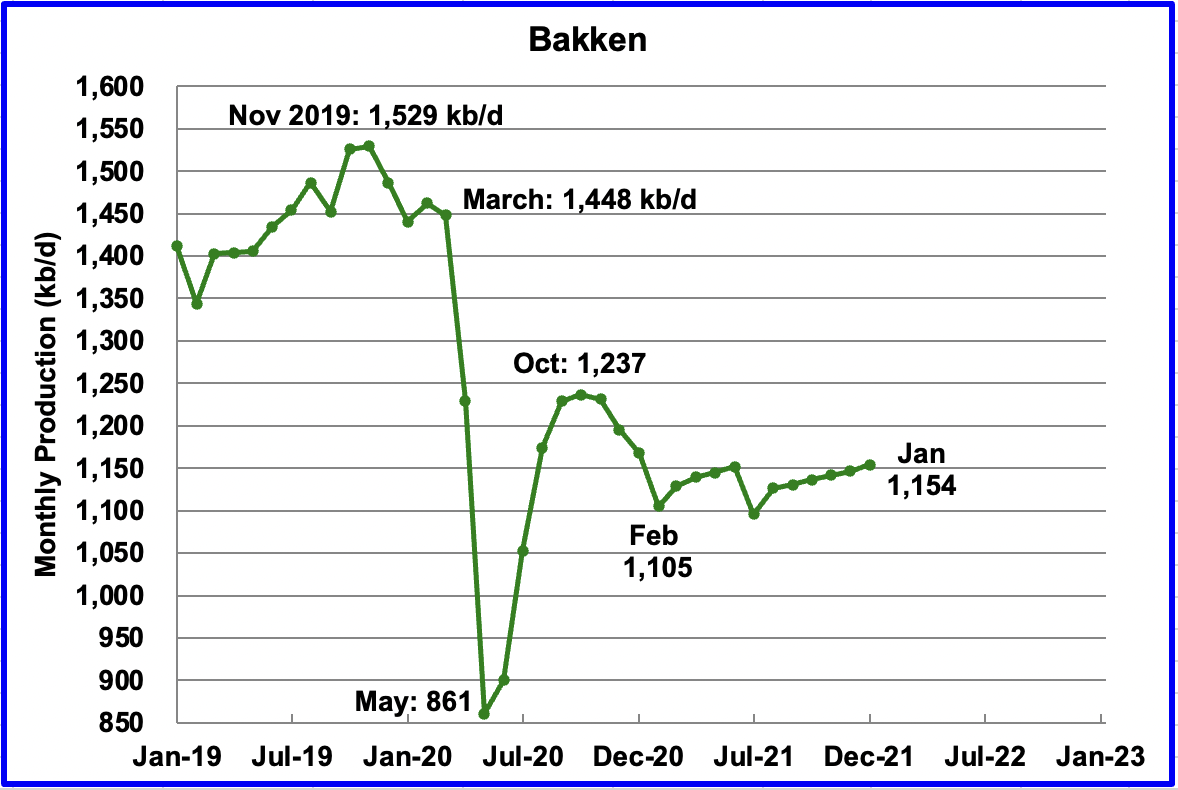
The DPR forecasts Bakken output in January to be 1,154 kb/d an increase of 8 kb/d from December.
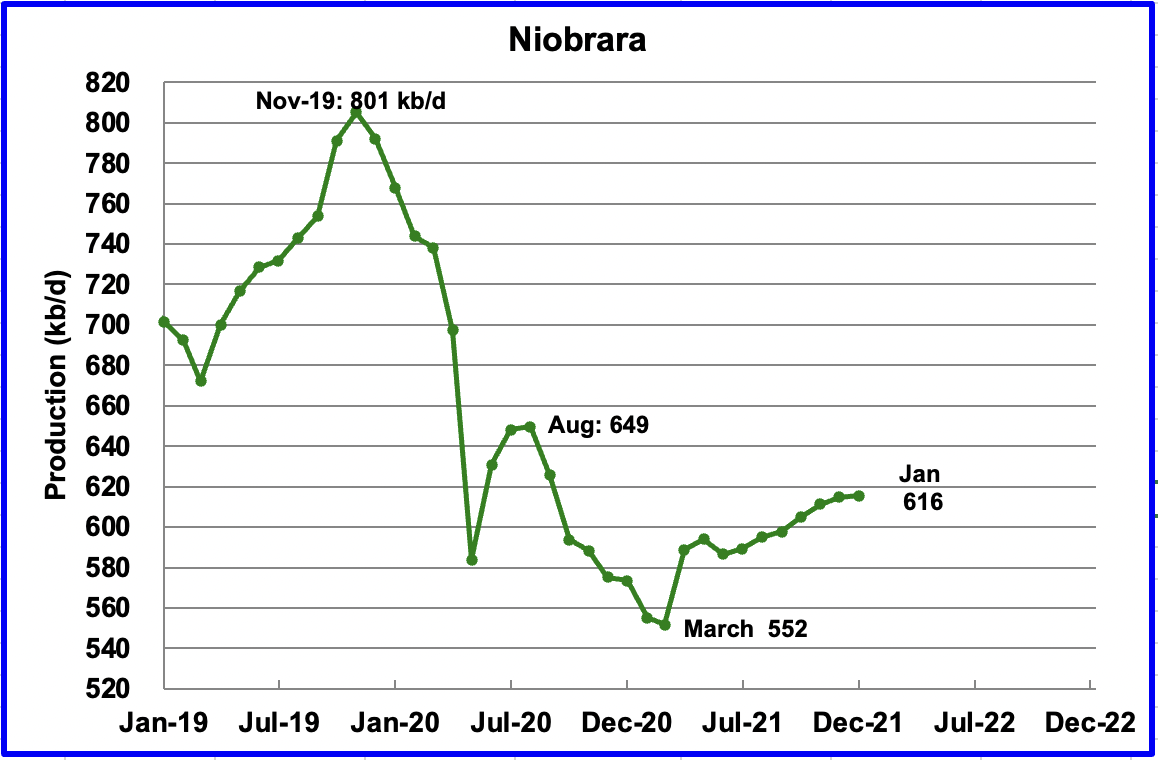
Output in the Niobrara has been rising since July but is now showing signs of starting to plateau.
DUCs and Drilled Wells
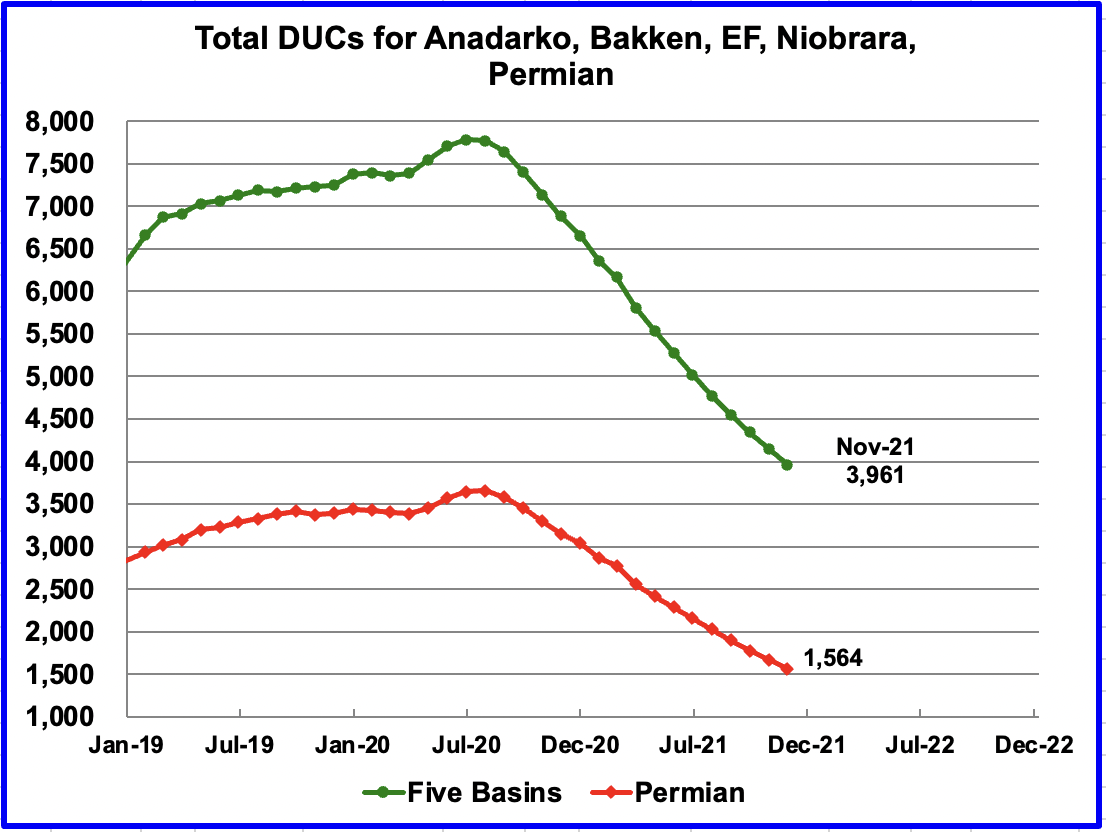
In these five primarily oil basins, the utilization/completion rate of DUCs has started to slow. For example, in March 2021, 359 wells were completed. In October and November, the utilization rate, i.e. completion rate was down to 191.
In the Permian, 105 DUCs were completed in November, down from 130 in July and August. If Permian DUCs were to be completed at the latest rate of 105/mth, that translates into a 15 month supply, assuming the remaining 1,564 are all commercially viable.
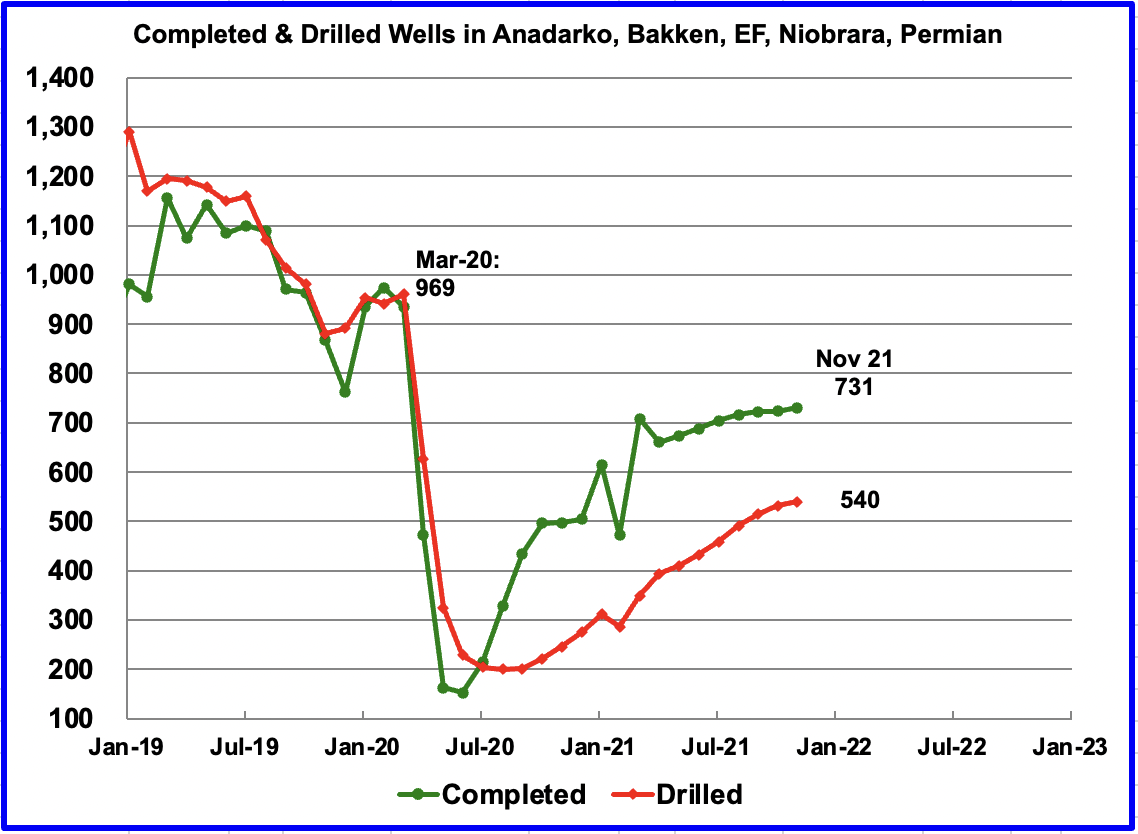
While the completion of DUCs has slowed, the overall completion of Wells has also slowed in these five oil basins. To compensate, there were earlier indications from a few months ago that drilling was also increasing. However for October, completions increased by 8 to 731 while drilled wells also increased by 8 to 540.
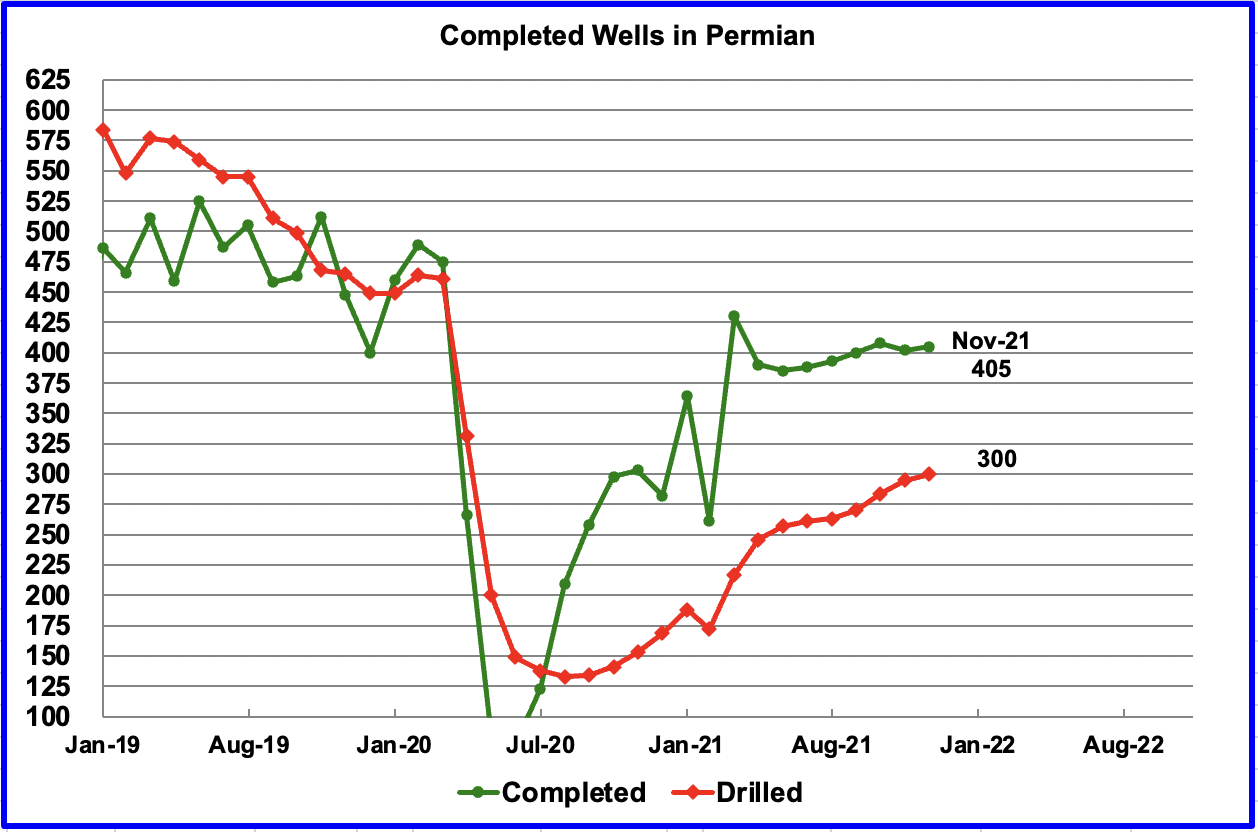
In the Permian, a similar trend in slowing completions is developing. In November 405 wells were completed, 3 more than in October and 300 new wells were drilled.
As can be seen in this chart, in the August to October period, the number of drilled wells increased at a higher rate than in the May/July period and appears to be slowing after September.
3) LIGHT TIGHT OIL (LTO) REPORT
The LTO database provides information on LTO production from seven tight oil basins and a few smaller ones. The December report projects the tight oil production to November 2021.
The December LTO report revised down the November LTO projections by more than 100 kb/d from July 2021 to October 2021. For instance, October was revised down by 111 kb/d. The four point red graph shows the previous November LTO forecast. The other change from the November chart is the flat output from March to July.
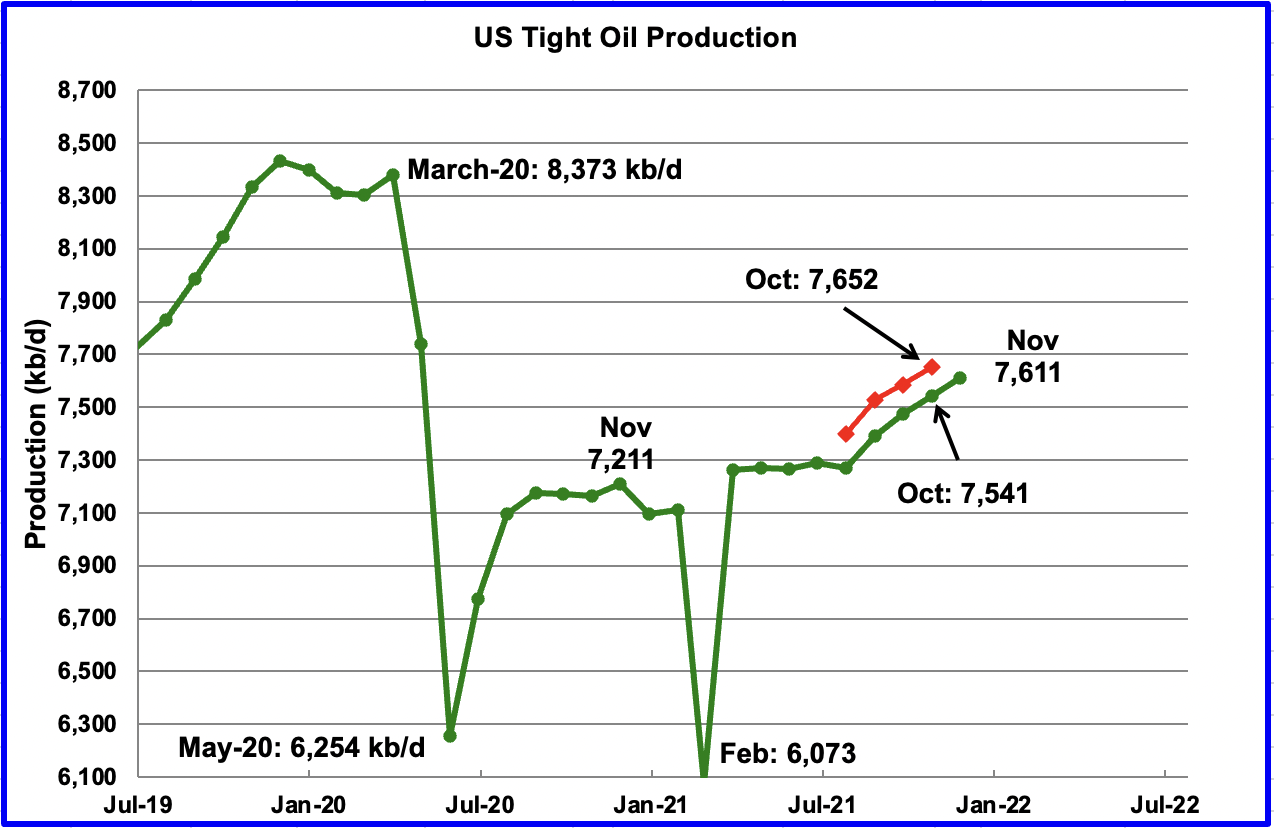
November’s LTO output is expected to increase by 71 kb/d to 7,611 kb/d.
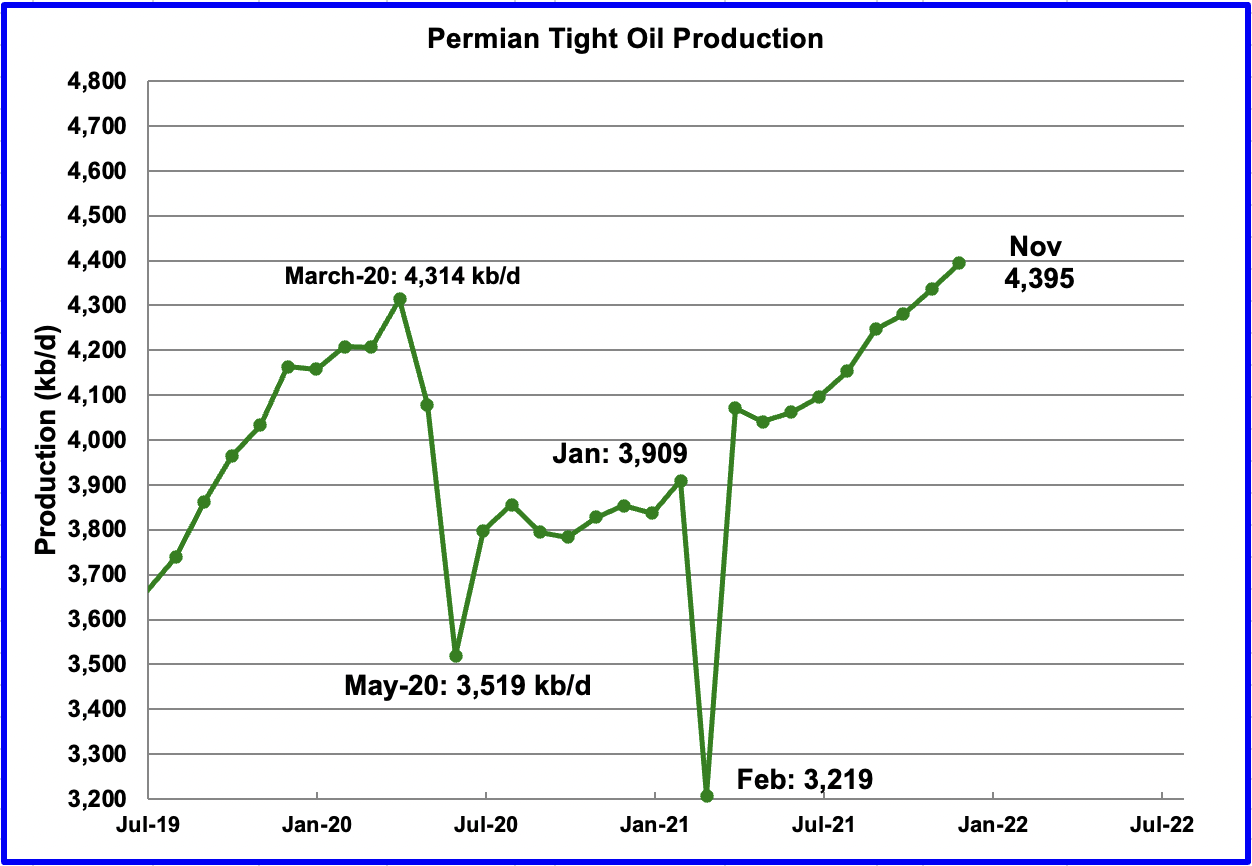
Permian LTO output reached a new high in November of 4,395 kb/d, an increase of 59 kb/d. From July to November 2021 Permian output grew at an average rate of 60 kb/d/mth.
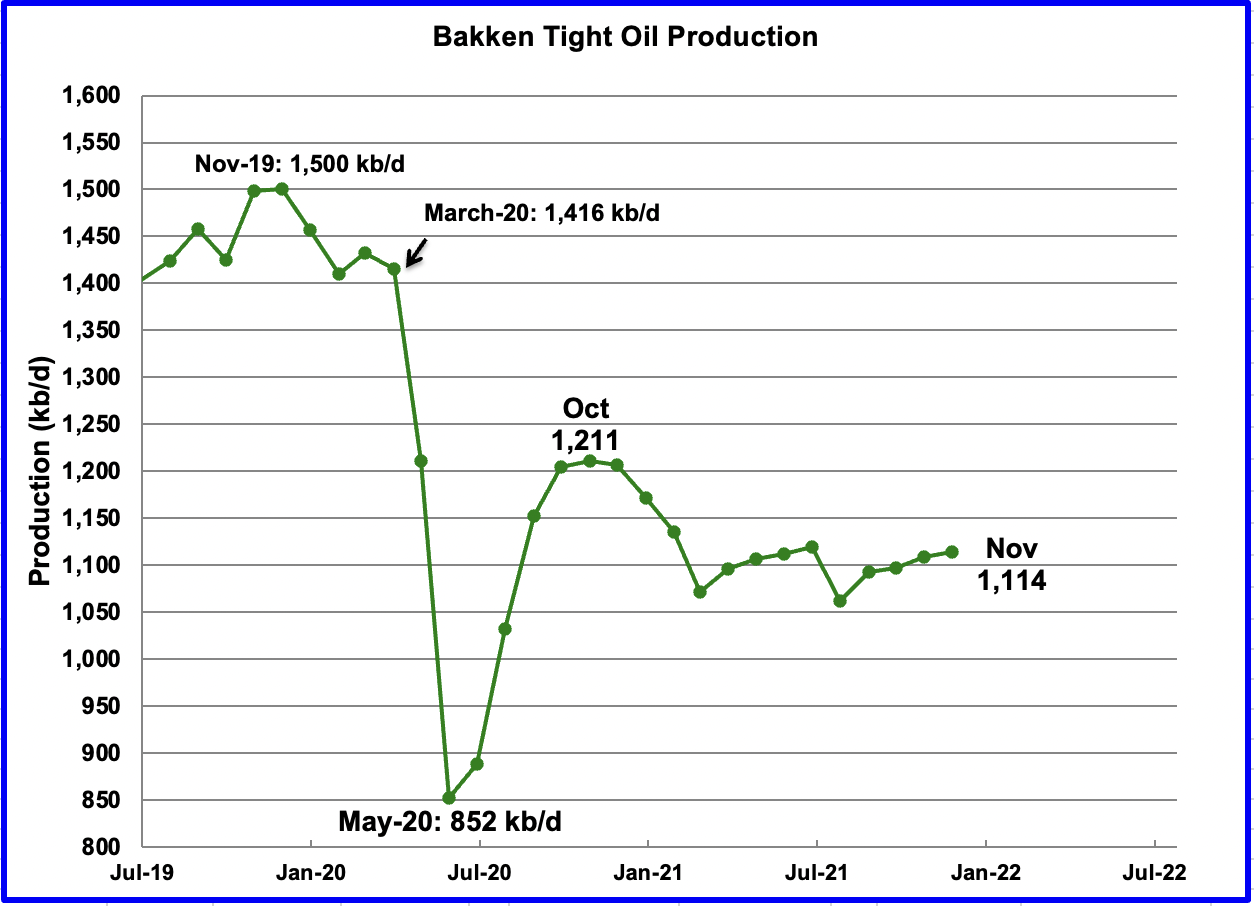
The Bakken’s November output increased by 5 kb/d to 1,114kb/d.
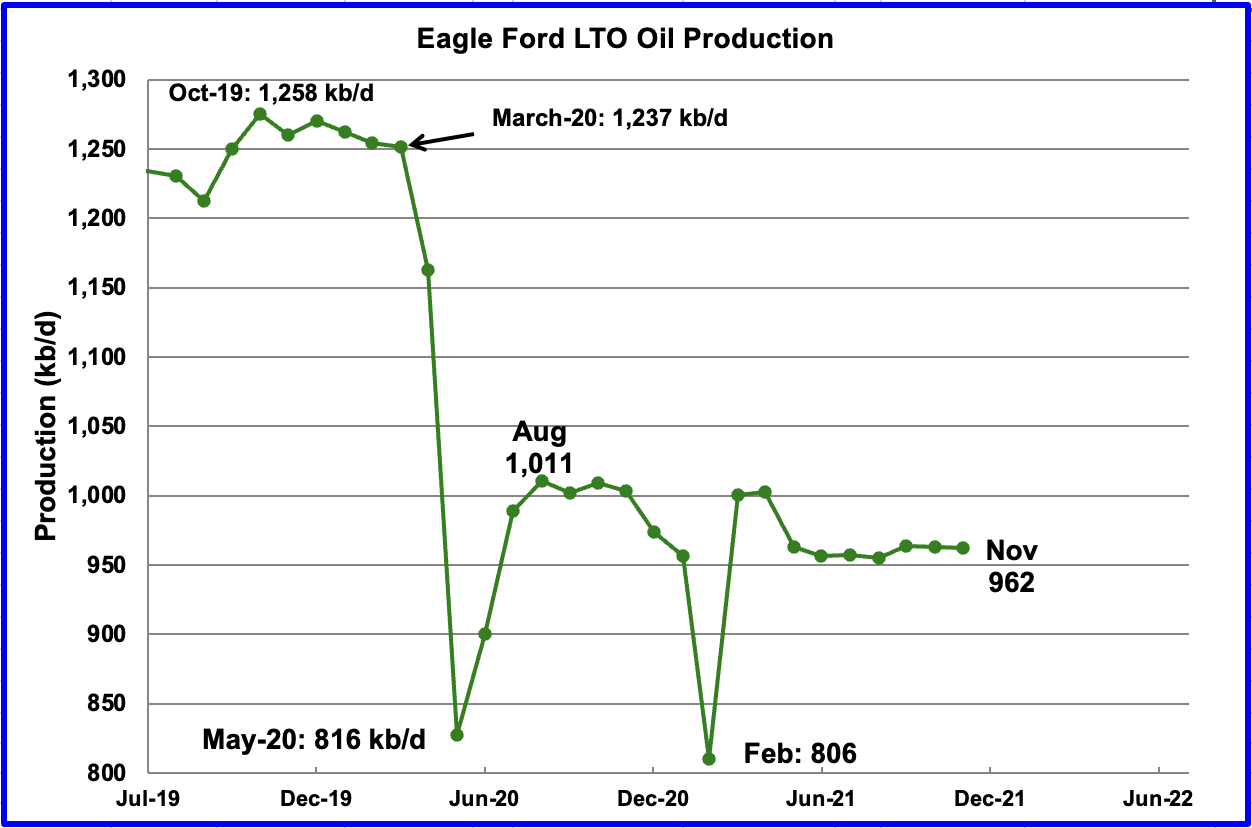
The Eagle Ford basin is expected to produce 962 kb/d in November, essentially flat from October which came in at 963 kb/d.
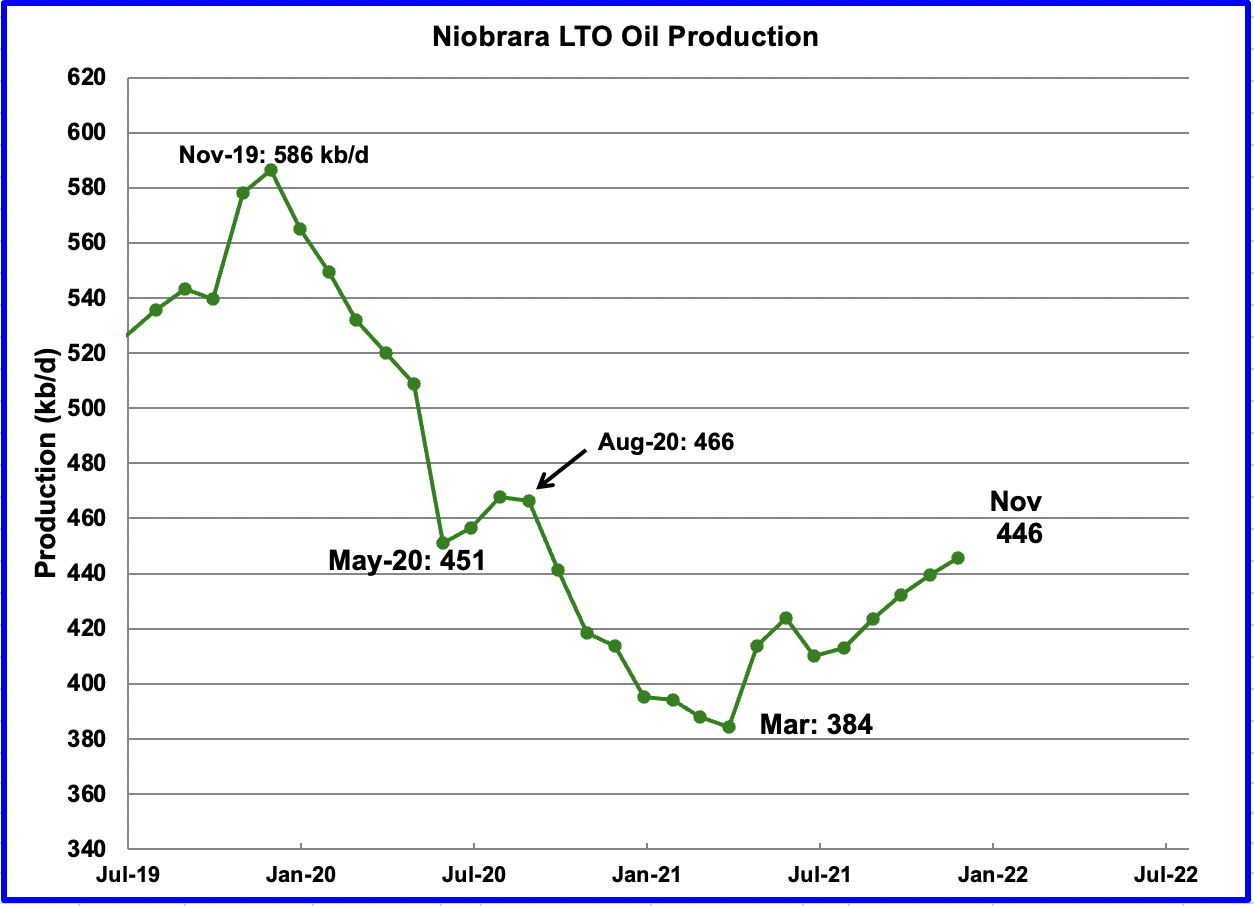
Output in the Niobrara in the latest LTO report in showing steadily increasing production since July. November output is expected to be 446 kb/d, an increase of 7 kb/d.
The rising output can be attributed to the increase in rigs from 7 in June to 11 in November.
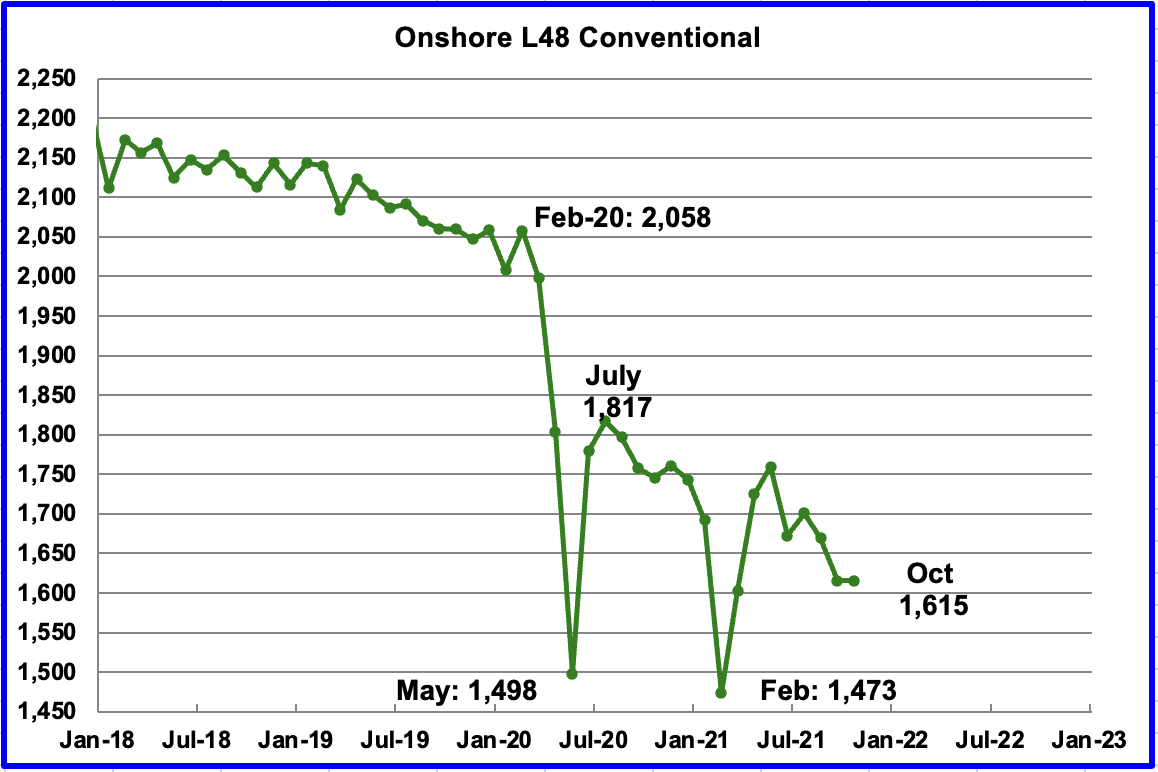
Onshore L48 chart from November STEO and LTO reports.
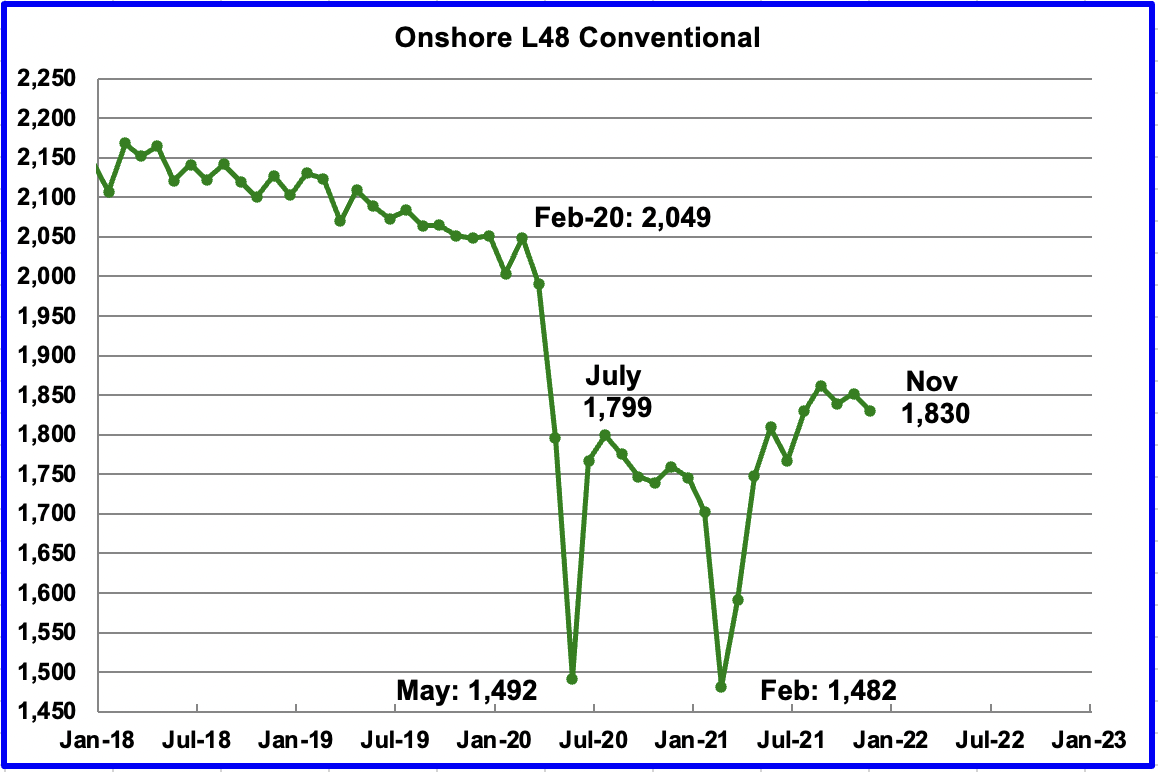
Conventional oil output in the Onshore L48 declined by 22 kb/d in December to 1,830 kb/d. This estimate is based on a combination of the expected November LTO output and the December STEO report that has a forecast for the US On-shore L48 output for November 2021.
In the December LTO report, LTO output was revised down as noted above. This downward revised output has resulted in an increase in conventional oil output in the Onshore L48 after May 2021.
The other characteristic that has changed in the December report is the essentially flat to slightly declining output of conventional crude from July to November, which showed a declining trend in the November report. See previous chart.
However, a note of caution is in order to explain such a big change. Since conventional output is the difference between two large numbers, both subject to monthly revisions in the later months, conventional output can show big variations from month to month for the most recent months.
The chart that appeared in the November US update has been reposted above to show/compare how the last six months can change. As can be seen, the November report shows a drop in conventional output over the last six months while the current chart just shows a hint of decline.
Monthly Energy Review (MER)
The Monthly Energy Review (MER) forecasts US output two months past the official US monthly production numbers, for this report that will be October and November.
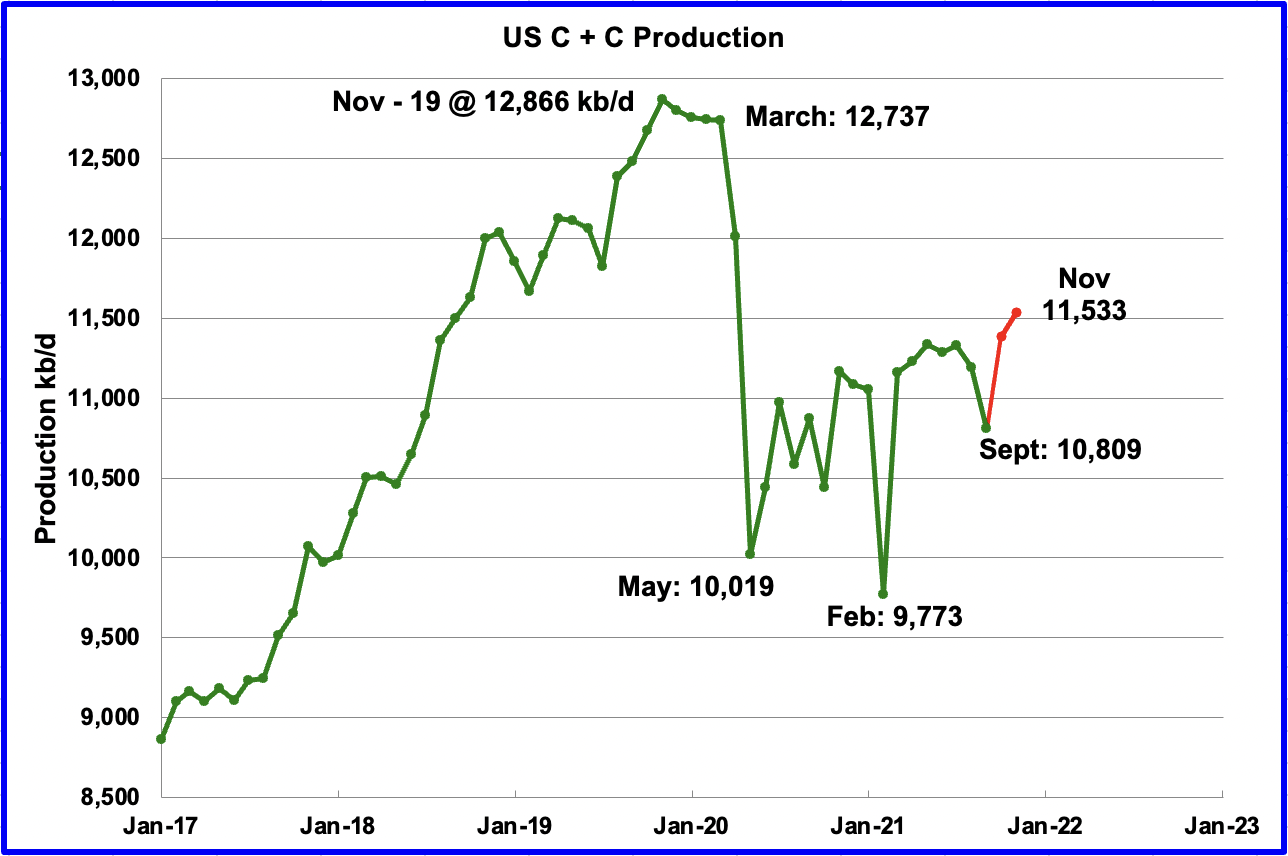
US output in October is expected to recover from the loss due to hurricane Ida to 11,387 kb/d. November adds 146 kb/d to October to produce 11,533 kb/d. Red markers.
5) Rigs and Fracs
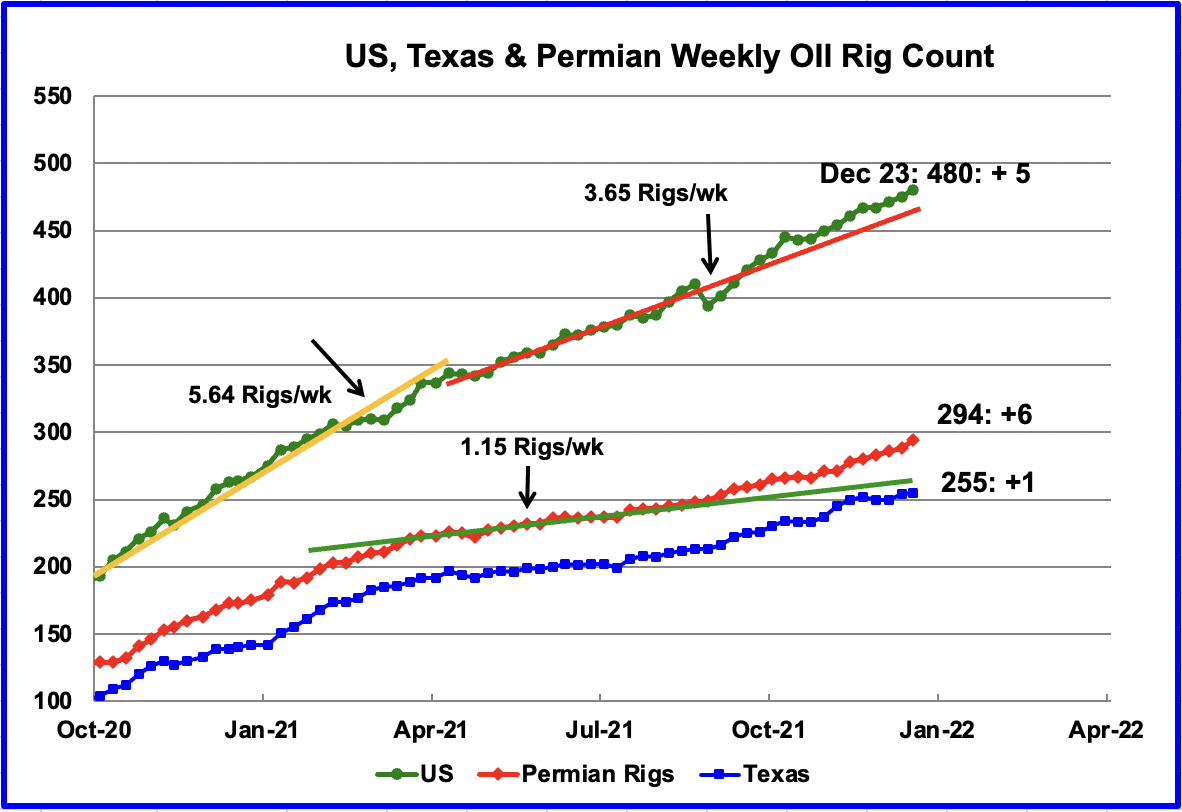
Since the beginning of April, the US has been adding oil rigs at a rate of close to 3.65 rigs/wk. Of these, the Permian has been adding 1.15 rigs/wk over the period April to early September. This means that more rigs were being added in other basins and states.
Since the end of September, it appears that the addition of rigs in the Permian basin has accelerated over the average rate as the red graph breaks away to the upside from the green trend line. On November 12 there were 271 rigs operating in the Permian. In the week of December 23, they increased to 294. Over this period, rigs were being added at an average rate of 4/wk. This seems to confirm that drilling in the Permian continues to be attractive to the drillers.
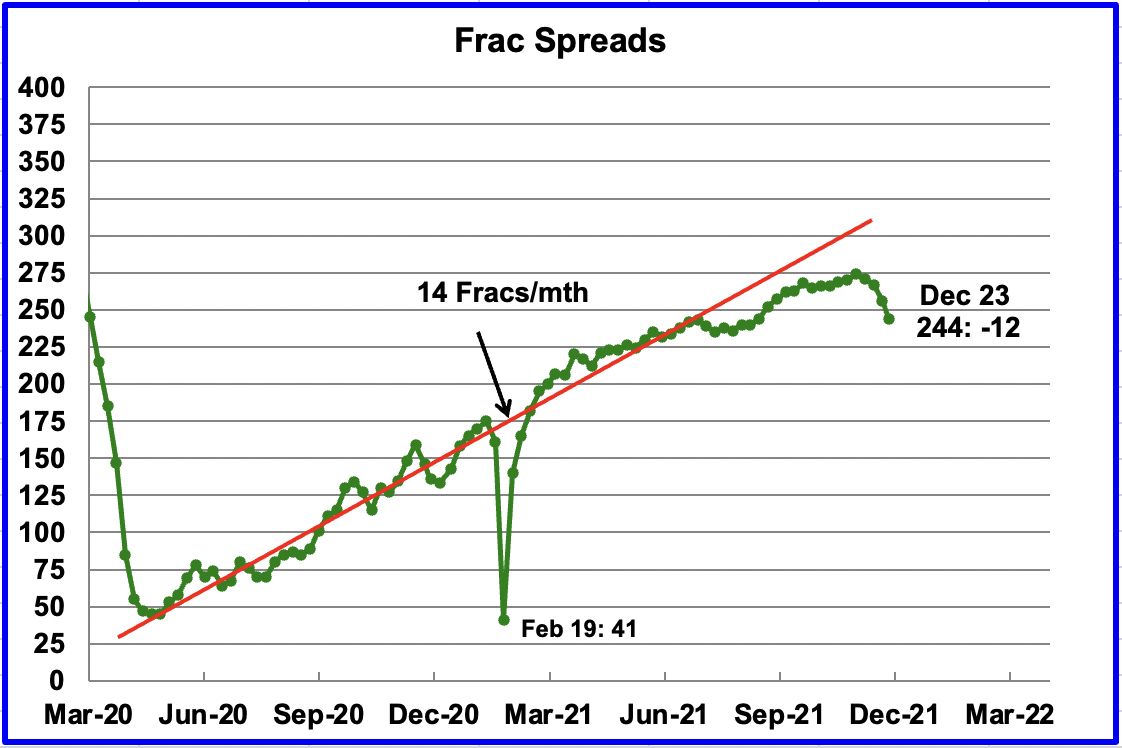
Starting in mid September, there were indications that frac spreads were being added at a slower rate than the 14/mth shown in the previous months. For all of the weeks in December, the frac spread count has been declining. For the week of December 23, 12 frac spreads were decommissioned. The decline in frac spreads in December is strictly a seasonal occurrence.
Note that these 244 frac spreads include both gas and oil spreads, whereas the rigs information is strictly for oil rigs.
Updated Oil Production from a Few Non-OPEC Countries
The following charts are updated to November using data provided by the country’s official web site.
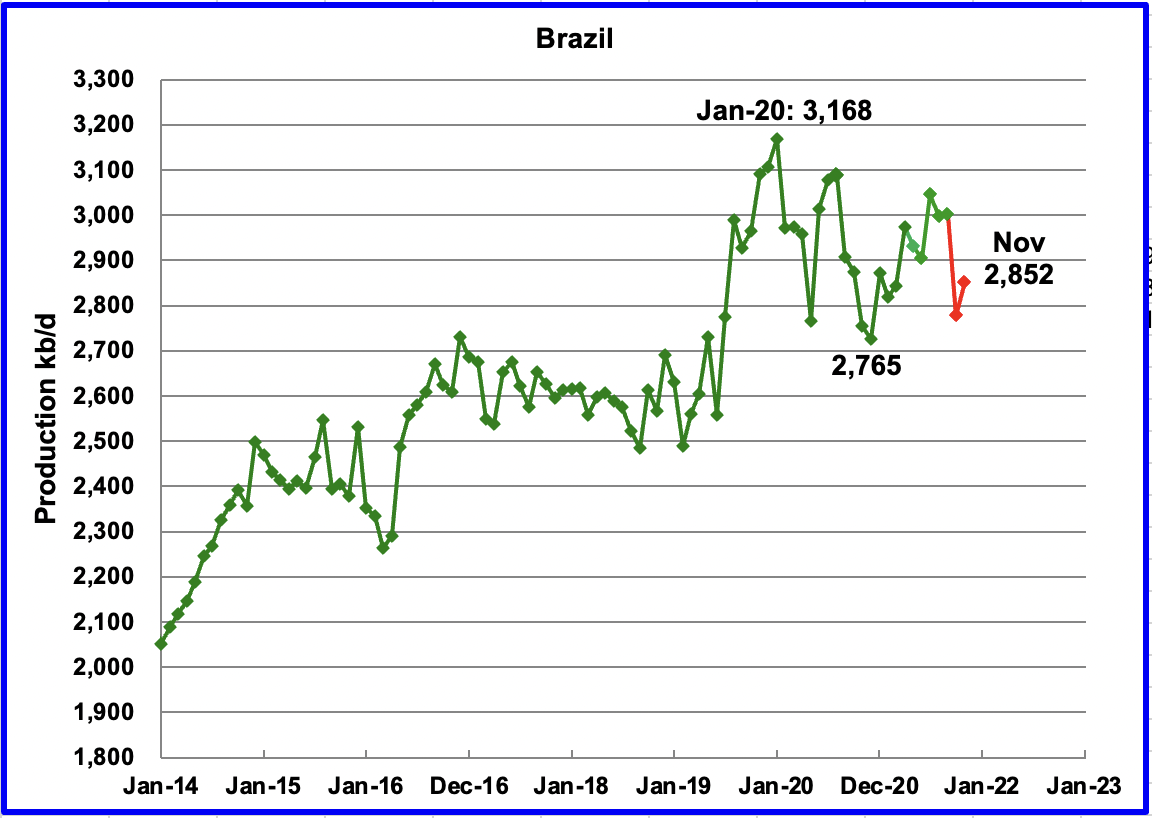
Brazil’s November production increased by 74 kb/d to 2,852 kb/d according to this source (Red Markers). The October drop was due to continuing maintenance issues.
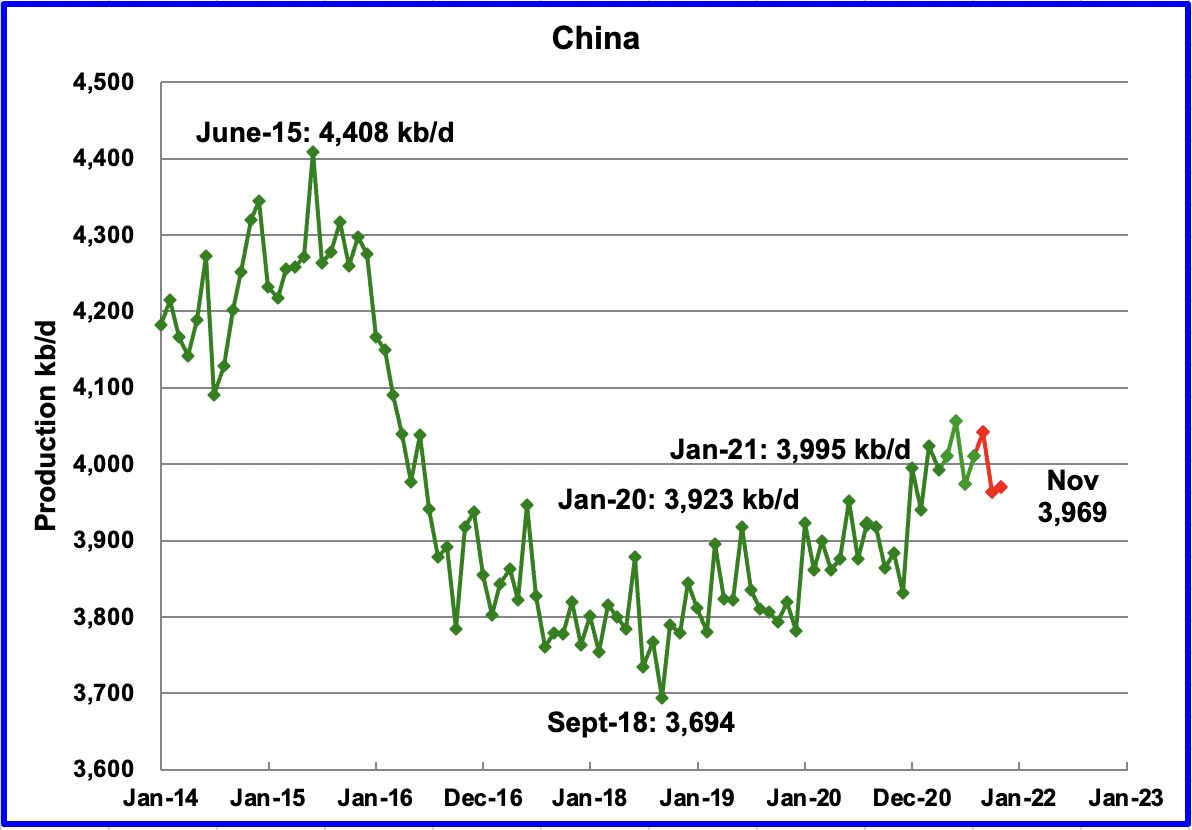
Output in China increased by 6 kb/d in November to 3,969 kb/d. Note that November 2021 production is only 46 kb/d higher than January 2020.
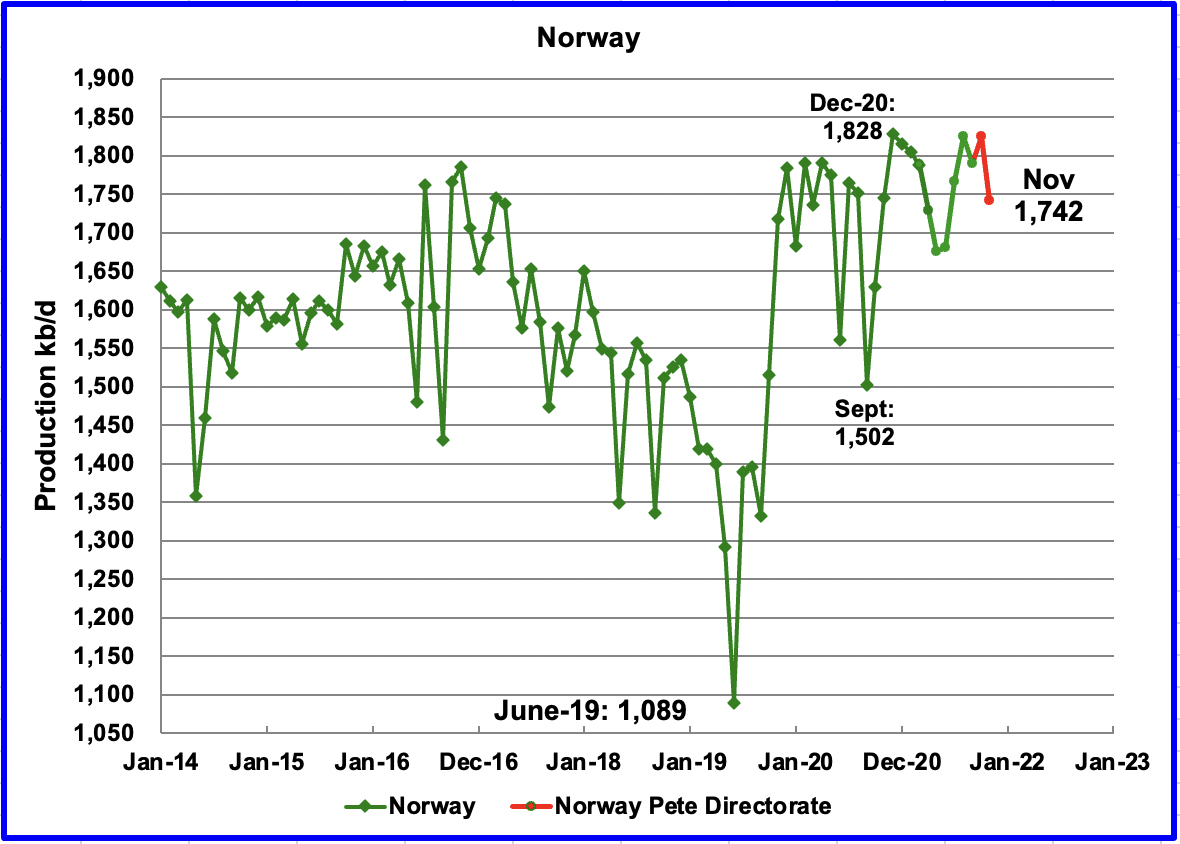
The Norway Petroleum Directorate reported that crude production dropped by 83 kb/d to 1,742 kb/d in November due to technical problems. The production level was 5% lower than the Directorate had forecast.
Non-OPEC W/O US
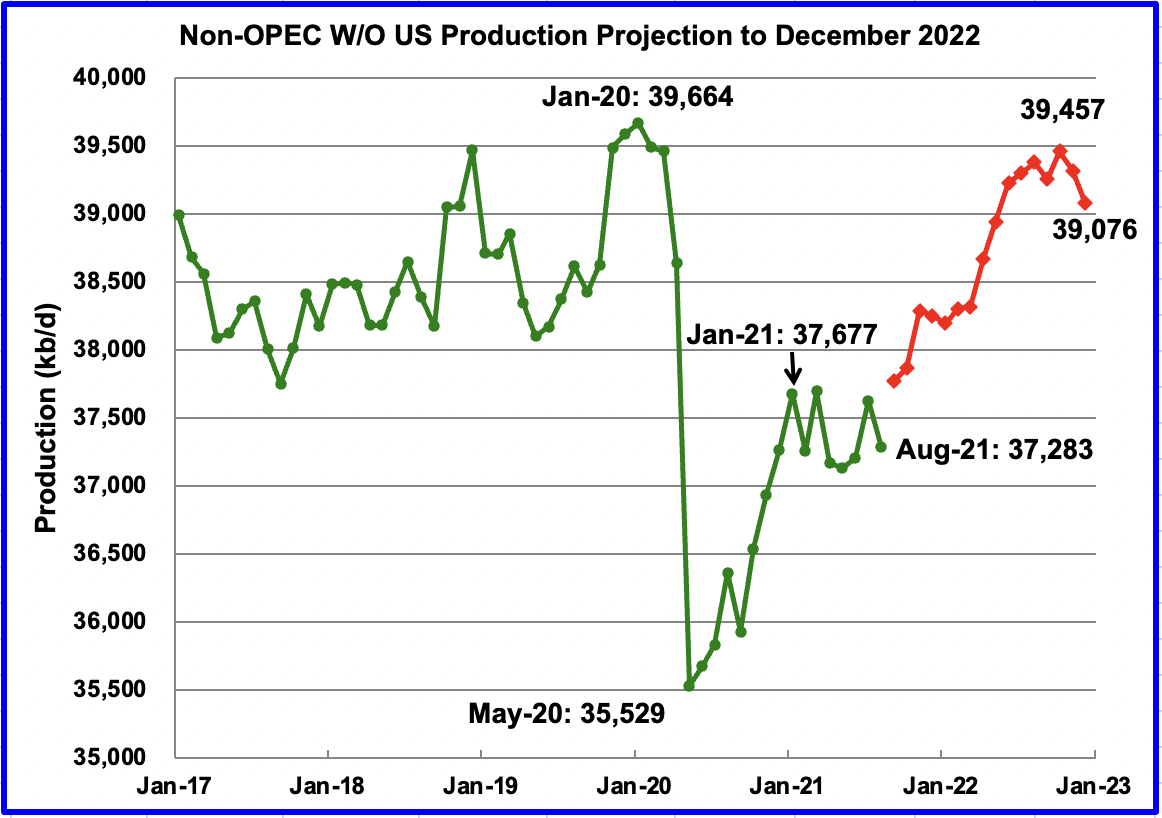
Non-Opec oil production W/O the US in August decreased by 339 kb/d to 37,283 kb/d according to the EIA. Of the 339 kb/d decrease, the two biggest contributors to the decrease were Kazakhstan, 251 kb/d and Canada 70 kb/d, for a total of 321 kb/d. Russian output dropped by 35 kb/d.
This chart also projects Non-OPEC W/O US crude (C + C) production out to December 2022. It uses the December STEO report along with the International Energy Statistics to make the projection. (Red markers) It projects that Non-OPEC W/O US crude production in December 2022 will be 39,076 kb/d, 588 kb/d lower than the January 2020 peak of 39,664 kb/d.
Crude Imports from Russia
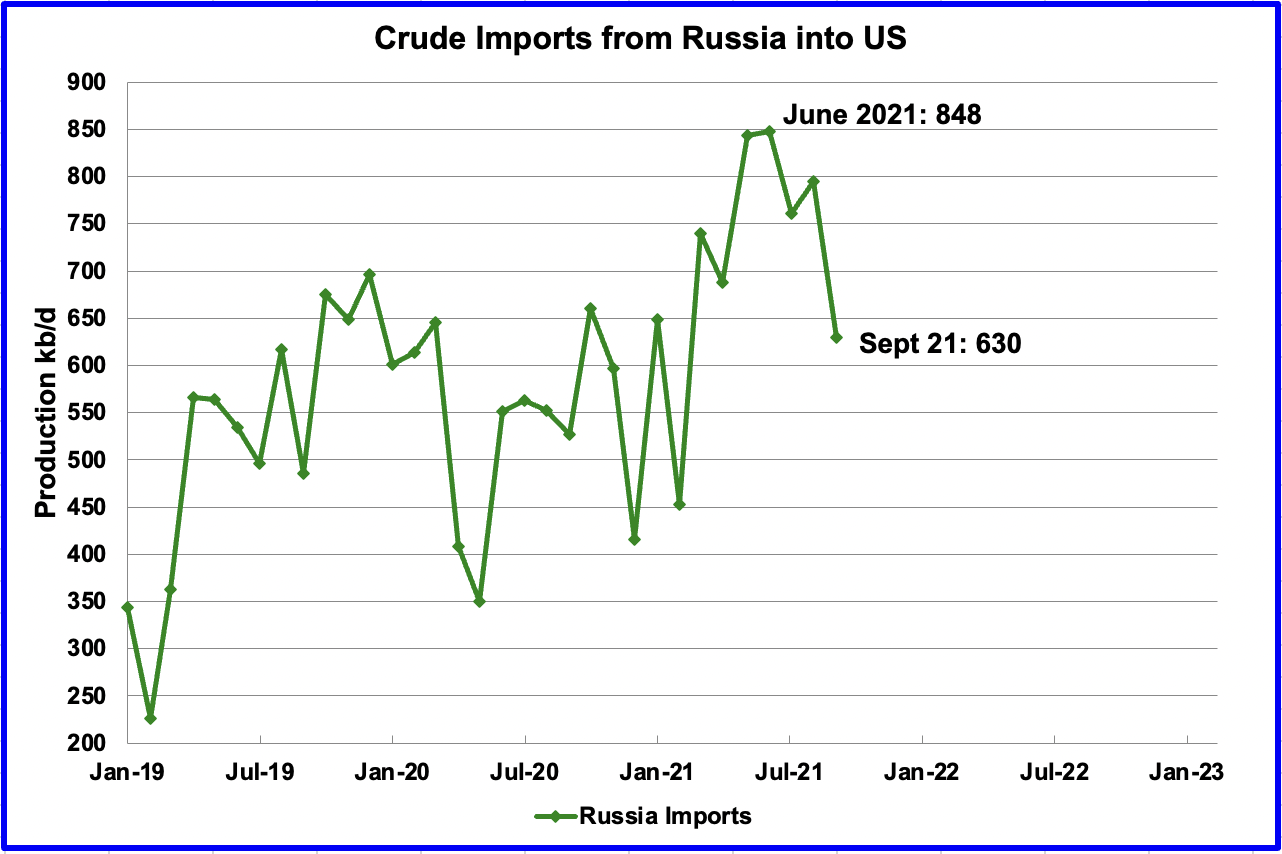
Imports of crude oil from Russia have increased since 2019. Imports of over 100 kb/d into the US started in 2005. In September 2021, imports were 630 kb/d.
Who has more leverage in the upcoming US/Russia negotiations?
Seasons Greetings to One and All. Also all of the best for the upcoming New Year.

278 responses to “EIA’s December Oil Production Outlooks”
The EIA has just released the October US production numbers, one day early. I will try to post the full US update sometime within the next 48 hrs. New Year celebrations permitting.
Output was up by 651 kb/d to 11,473 kb/d from the Hurricane Ida low of 10,822 kb/d. The STEO had forecast a rebound to 11,387 kb/d, low by 86 kb/d. The red dot in the chart is the MER November estimate from their December report.
I wish all of our participants a Happy, Healthy and Prosperous New Year
Thanks for the post Ovi!
Merry Christmas to all the writers, readers and commenters here; on the most highly esteemed and intellectually rigorous collapse blog on the net.
Tks Ovi for the Christmas gift . Conclusion Nov 2019 at 12,899 kbpd is the peak as per EIA at least till June 2022 . It cannot be surpassed post June 2022 because by then the “viable ” DUC’s will pass out . Their price projection ( always wrong) does not see $ 85 oil as is the hypothesis for the work done by Dennis .
Hole in head,
I use $75/b for Brent which would be about $72/bo for WTI in 2020 $. As far as viable DUCs running out, rig count can increase and more wells can be drilled, problem solved. Horizontal oil rig count in US has been increasing at an annual rate of 236 per year from August 14, 2020 to Dec 16, 2021. In August 2020 there were 207 horizontal rigs operating in the US and in December 2021 there were 521 horizontal rigs operating in the US.
If the trend of the past 16 months continues for another year the US horizontal rig count would increase to 757 rigs by Dec 2022.
In Jan 2018 the US horizontal rig count was about 805, this was a time when US tight oil output was increasing very rapidly.
Ron might say if, if, if, but he also uses past trends of historical production to anticipate the future.
Yep, Thanks!
I wish everyone on this site Happy Holidays, Merry Christmas and a healthy and happy new year.🎊🎄🎁
Ovi once again thank you for this excellent post.
Two things strike me as very ominous. One is the rapid decrease in DUCs. At the current rig count and if zero DUCs existed we would be in terminal decline which by the way will accelerate faster than most people think. The second observation is that as we drill more and more increased density wells, we will see the average boepd fall well below the current average of 770 boepd. Quality locations are diminishing quickly and with the lack of capital and service cost increase we will be trading water unless oil prices surpass $100 per barrel.
I believe the STEO actually does try hard to predict production and price but is too far removed from the industry to understand the micro tends in real time occurring inside of the industry which could foil their predictions. If oil is $62 per barrel by the end of 2022 then we will absolutely see a decline in the rig count and further decline of LTO oil and gas production. We have seen peak oil. No getting around it unless we see sky high prices which would even get the ESGers to jump back in because they can’t resist the temptation to “potentially” make lots of 💵💵💵💰💰💰
LTO Survivor
Thanks
Going forward the output in the US is all about the Permian, DUCs and additional rigs for the next 6 months. We will have more insight by then.
In the mean time here is the info that I find confusing. Rigs are being added in the Permian at a much higher rate than this summer. Is this because WTI is back over $70. Also other posters are saying pipe is in short supply and expensive. Somebody must have the pipe to drill all these wells.
Looking at the latest Permian info from Shale Profile, it shows that the 2021 wells have a peak rate of 894 b/d while the peak for the 2020 wells is 822 b/d. Permian wells are getting more oil out in the first year and therefore returning cash faster.
I am not clear of how to sort out the conflicting information of pressure loss, cross talk, denser drilling, poorer quality wells with rising rig counts and rising peak production for 2021 Permian wells.
I wish you a Merry Christmas and a Happy, Healthy and Prosperous New Year. Also thanks to you and all of our participants on the quality of the information provided.
Ovi,
Unfortunately we do not have information on how average lateral lengths have changed over time. It might be that lateral lengths have increased and the well productivity when normalized for lateral length has decreased. Note that I assume well productivity when normalized for lateral length started to decrease in Jan 2019 for the average Permian basin well, but that is a guess on my part, I don’t have enough information to make an accurate assessment.
Dennis
In the latest update for the Permian, Enno states “productivity per lateral foot has already slightly fallen since 2016.” This to me this implies that laterl length is a weak variable and that oil output continues to increase almost linearly with increasing length.
To me it sounds like friction is coming into play here. As the length increases there is an increase in the pressure drop as the oil from the extremities has to travel further and also increase the flow speed. This effect drops as the flow speed drops.
Ovi,
To me the cumulative output is of more interest and productivity per lateral foot is important because the productive acres are limited and longer laterals use up more acres.
Enno Peters data has shown productivity per 1000 lateral feet was at a maximum in 2019 and was relatively flat from 2016 to 2019.
See chart in post linked below.
https://shaleprofile.com/blog/permian/permian-update-through-september-2020/
direct link to image below
https://shaleprofile.com/wp-content/uploads/2020/12/Productivity.png
Ovi,
Note that Enno is looking at specific counties in Midland basin about 25% of all Permian output. For the entire Permian Enno has shown in the past that peak 6 month cumulative output normalized for lateral length was 2019.
I take 2018 as peak and assume decrease started in 2019 for new well EUR per thousand feet of lateral.
Ovi,
I have several observations regarding the data. Number one: are they counting barrel of oil equivalent (boe) which includes natural gas? If so, higher GORs could lead to a false positive reading of real oil production. Gas has been converted into a barrel oil by dividing 1,000 MCF by a factor of 6 for the past 40 years. For example, gas production of 42 million cubic feet per day divided by 6 equals an additional 7,000 boepd to the numbers. The higher the GOR, the more it skews the barrels of oil equivalent to the upside. Let’s say gas sells for a total netback to the producer at $4.00 per MCF. The revenue for on that day would be $160,000. If the 7,000 boepd was actually instead actually 7,000 barrels of oil per day (bopd) , the value would be $490,000 per day which would give the producer much more revenue and in turn become more profitable.
All of this is to say that if “boepd” is being used rather than bopd, companies are incentivized to produce these wells faster to make up for the lost revenue created by higher GORs and less actual bopd. This ultimately leads to faster pressure depletion and a quicker path to decline.
Secondly, why more rigs in the Permian? If this is truly a race to the bottom and CEOs understand what I saw plainly in front of me, they are incentivized to increase drilling rigs to increase production marginally and show growth to the investors. This is production growth in the short term but devastating to long term growth as the bottom hole pressure (bhp) will diminish more rapidly leaving far fewer available economic drilling locations available for development. Like the “Red Queen” in Alice in Wonderland, you have to pedal faster and faster just to stay in place.
The “dirty little secret” is that at some point in the near future, this production will fall off a cliff even in the Permian and all of the CEOs know this. Therefore because of the significant amount of debt still burdening these companies, while the price is higher, there is incentive to drill these wells faster to pay off debt, return money to investors, and pretend to show growth. This is actually mathematically impossible with $70 oil. In my opinion, all available cash should be used to reduce debt and then the shareholders will be paid.
At current prices, the shale business is only economic for those players investing 100% equity. Levered returns in a steeply declining asset base is folly and will only lead to more bankruptcies down the road. Every CEO knows this but he also believes that we have hit peak oil and believes that oil prices will be higher in the future to bail them out
Further to LTO’s comments: it is a misconception to believe Permian tight oil wells drop out of a vending machine all exactly the same; there is a human element to the oil industry that data hounds fail to recognize and/or chose to ignore (no disrespect to Ovi, at all).
Why does IP6MO (initial potential 6 months) appear to be higher than previous years? Its not because of better rock or better frac designs, its because of much higher prices and operational procedures designed to maximize cash flow. The exact same thing is happening in the APP Basin because of much higher gas prices and so those meatheads can export American LNG for more bucks. For shale oil, debt maturities are looming and interest rates are going up. D&C costs are going up in 2022, 20-25% is my guess. The panic is now, or about to be, fully underway.
Lateral lengths and proppant loading have stabilized in the Permian the past 2 years. Well productivity IS declining in the Permian; its masked by multi-well lease/unit reporting in Texas and by the human/operational component; artificial lift processes, for instance. Permian wells are being gutted for cash flow reasons; you’ll see after year 4 what that does to EUR’s. Nothing is getting better in the Permian, it is getting worse. High grading is now paramount to survival. THATS about over; the hearts of the watermelons are drilled up. DUC’s are all but gone. https://www.oilystuffblog.com/forum/forum-stuff/_duck
The BOE thing LTO brings up is relevant. 3-4 years ago when the shaleco’s were touting 1.5MM BOE EUR’s I suspected then it was because they were predicting rising GOR, at 6:1, and USED GOR to confuse the general public.
Most of the increase in rig count is small, non-public independents using equity, as LTO points out, not debt, and facing Federal income tax burdens in 2021 from higher prices. How do you avoid a lot of taxes? Reduce taxable income by putting rigs back to work before year end to take advantage of IDC deductions. Large public shalecos (PXD, DVN, FANG) don’t do that because they have NEVER paid Federal incomes taxes and because of tax loss carry forwards from 14 years of losses, won’t for the next 20 years.
What’s dumber than trying to predict oil prices? Predicting rig counts based on a linear trend. Good grief. History has NO precedent for that.
I am trying to help here. Folks like LTO should not be ignored; they, we, live this stuff every day. Its not a hobby for us.
What is the most relevant question facing the future of HZ tight oil in America? Where is the money going to come from to develop it? The resource play is still not profitable and it is still deeply in debt and dependent on other people’s money…on credit/debt.
“Energy (oil) has no solutions, only uncertain responses to change.” Art Berman
Mike,
Why are small independent producers increasing their number of operating rigs? Note that Permian horizontal rig count has been increasing for quite a while (about 18 months), perhaps that stops on Dec 31, 2021, we will soon see.
Do these guys not know what you know? Based on what you and LTO survivor are saying we should be seeing rigs decrease and output falling in the Permian basin.
The linear trend is not a prediction of where rig count will go, it is simply showing where it has been, I say simply that if the trend continues then rig count will reach some level in the future.
As I point out often, the number of possible future scenarios is infinite, the probability of choosing the “correct” scenario of the future is 1 divided by infinity, which is exactly zero.
I agree the future is unknown, I point this out often even though is is quite obvious to everyone here.
At a WTI oil price of $73/bo (2022 to 2028) and with Permian wells costing $10.5 million (full cycle cost, oil price and capital cost in 2020$), all debt can be paid back for Permian oil producers by the end of 2025 even with 25% of free cash flow paid out as dividends. This assumes natural gas price at $3.50/MCF in 2020$ from Oct 2021 to 2025.
The money for this development is from operating cash flow (GAAP), no new debt is needed.
One thing to consider is that peak demand for oil may arrive by the end of 2028, there is a narrow window where oil prices may be high from 2022 to 2028, after that oil prices may start to fall and tight oil will no longer be profitable to produce.
I have tried to include plug and abandon cost for horizontal tight oil wells in my scenarios and have guessed it might be 500k in 2020$ on average for Permian basin wells, can you give me a better guess?
I have a low completion rate scenario (31 Gb) and a high completion rate scenario(39 Gb) for Permian basin. The lower scenario has cumulative net revenue of one trillion dollars (in 2020$) by the end of 2050 (excess cash that is not needed to pay back debt after 2025 is assumed to be invested at a real annual rate of return of 5.5%). The higher completion rate scenario has cumulative net revenue of 1.239 trillion in 2020$ by the end of 2050 (as before excess cash flow is invested at annual real rate of return of 5.5%)
At no time in recent history has the US rig count been as low as it was 2H20; of course the rig count has been increasing the past 18 months. It had no where to go BUT up. You repeatedly hypothesize and plot rising rig counts/well completions to justify your models about the future. You’re good at googling, Dennis Coyne, google who is adding those rigs the past 2 quarters, and why.
I stand by my position (offered to Ovi, not you) on why IP180’s are increasing; its because of prices and operational methods designed to take advantage of prices. Wells in the Permian are NOT getting better.
Half your predictions you qualify with the world “if,” the other half with the word, “will.”
In looking for a possible answer for increasing rig counts this late in the year, when yearly budgets are typically exhausted, I suggested an effort to reduce taxable income thru IDC deductions. The tax paying part of my industry has done that very thing for the past 50 years. You, of course, would not know that. Following IRS procedures allows an operator to take IDC for months, and many wells, after the first of the next year. At no point did I suggest the rig count would stop increasing 31 December; that stupid reply was designed to embarrass me. As was the reply suggesting I must be wrong because I don’t follow the herd mentality. Shallow and LTO, both oily folks, don’t either, by the way.
“All Permian Basin debt WILL be paid back by 2024 and all future development in the basin WILL be from net revenue, NOT requiring additional debt.” A bold statement, that, with absolutely nothing at risk.
Every time I comment here, in a desire to help others understand the complexity of the oil business, that it’s more than a bunch of statistics, you fucking rag on me mercilessly with the express intent of discrediting me and controlling the content of your blog. I am a threat, I suppose, to your baseless predictions. Lets leave it at that. I will NOT comment anymore.
Thanks Mike,
Sorry to offend, I agree the Permian wells are not getting better, my assumption is that average new well EUR is likely decreasing in the Permian basin.
My question is why is rig count increasing? It would seem that tax credits are a bad reason to make a money losing investment from my perspective.
Both you and LTO survivor seem to be saying that we can expect a crash in Permian output any day now.
I am simply trying to reconcile what I see in the data and what both of you are saying.
Chart below takes Permian horizontal oil rig count from Baker Hughes and assumes (incorrectly no doubt) that rig efficiency is 1.3 wells drilled per rig to find horizontal oil wells drilled (potentially) in the Permian Basin, it then projects horizontal oil wells drilled in the Permian basin based on my medium scenario (where WTI remains at $72/bo in 2020$ or less in the future and natural gas sells fro $3.50/MCF and NGL sells at 35% of the price of crude.
This is what may happen, though of course low probability as there are many possibilities. Note that horizontal rig count would increase gradually from 276 on Dec 23, 2021 to 445 in August 2024 (just above previous peak of 443) and to a maximum of 510 horizontal oil rigs in August 2025, horizontal oil rig count falls starting in March 2027.
Note that I create scenarios based in part on what we have seen historically when oil prices were rising, I expect oil supply will be short in the future causing oil prices to rise. If I am wrong the scenarios will also be wrong.
Mike I ask questions to learn from you, I will refrain in the future.
The question of why rig counts have continued to increase I guess might be explained by tax credits, I just tend to assume the people running small independent oil companies are smart, it is their money on the line in most cases so I am assuming if they are using their capital to drill wells, they believe they will be successful. Just trying to understand what’s happening.
I am aware that there is wide variability in well productivity, I used to be able to see this at shaleprofile as in link below.
https://public.tableau.com/shared/9MY8QC538?:toolbar=n&:display_count=n&:origin=viz_share_link&:embed=y
It is now only available to subscribers so I no longer have access to this data.
Found a newsletter by Rystad at link below (April 2021)
https://www.rystadenergy.com/newsevents/news/newsletters/UsArchive/shale-newsletter-april-2021/
In 2019 they had D and C average cost at 900 per lateral foot ($9 million for a well with a 10 thousand foot lateral), in 2020 and 2021 they estimate that cost for drilling and completion dropped to 733 per lateral foot (7.33 million for a well with a 10 thousand foot lateral). If drilling and completion costs rise by 23% in 2022 that brings the cost of a well with a 10 thousand foot lateral back to the 2019 cost level.
I assume in my scenarios that drilling and completion cost remained at the 2019 level and never dropped in 2020 and 2021. Full cycle well cost is assumed to be 11 million in 2020 $ for the average Permian basin horizontal tight oil well.
Those remediation costs are just eye-popping! Insane!
What can’t be paid won’t be paid…so…’the Govt. will have to pony up the cash.
The Govt., of course, is the taxpayer.
In a potentially slip-sliding economy late 2022.
Wallets slamming shut. More oldies, fewer workers, increasing social security costs (bankrupt fund).
Top it with increasing costs of climate coping.
And airco demands more energy. With a rickety grid interconnection.
Oh my, oh my. There is potential for discontent.
And vast amounts of money spent on military rather than cleaning up many, many ‘consequences’, intended and unintended?
Hard decisions have to be made everywhere – but that don’t get you re-elected.
Thanks LOZ nice comments, and yes the colossal waste on our unneeded military budget (at least ten times too large) will be the Achille’s heel that brings us down – hands down the biggest waste of energy and resources in the history of the world.
Mike,
Don’t you dare stop commenting! You offer the real world comments that are needed to offset the other stuff!
LTO/Mike
Thanks for your detailed info.
Yes I look at a lot of data and take in a lot of information from both of you, which I appreciate very much. I also follow Enno’s Permian data and Dennis’ models. At this point it leaves me sitting on the fence. I will try to keep reporting all of the data as best as I can and hopefully at some point some piece of data will provide the clue that the Permian has peaked.
Six months from now, hopefully the outlook should be a little more clear.
Threads like the above are what keep me coming back here, even though I know next to nothing. Fascinating stuff, gentlemen.
LTO Survivor,
The EIA data is crude plus condensate production for tight oil, it does not include natural gas output.
The natural gas output is reported separately under shale gas output.
See link below for tight oil data under “tight oil production estimates by play”
https://www.eia.gov/petroleum/data.php#crude
See link below for shale gas production data under “dry shale gas production estimates by play”
https://www.eia.gov/naturalgas/data.php#production
The EIA does not report in boepd, also shale profile does not report in those terms.
Merry Christmas to everyone and to make the New Year a Happy one remember to take 4000 IU of Vitamin D3 daily.
Add k2 to the mix.
I take both everyday.
But the data on covid are mixed, and in late stages may possibly be harmful.
But many humans are deficient.
“take 4000 IU of Vitamin D3 daily.”
That is too high, between 1000 & 2000 IU is sufficient. Taking excessive amounts of D3 can cause health issues such as kidney stones.
That is not high at all.
Because synthesis of 1,25-dihydroxyvitamin D (the most active metabolite of vitamin D) is tightly regulated, vitamin D toxicity usually occurs only if excessive doses (prescription or megavitamin) are taken. Vitamin D 1000 mcg (40,000 units)/day causes toxicity within 1 to 4 months in infants. In adults, taking 1250 mcg (50,000 units)/day for several months can cause toxicity. Vitamin D toxicity can occur iatrogenically when hypoparathyroidism is treated too aggressively.
https://www.msdmanuals.com/en-au/professional/nutritional-disorders/vitamin-deficiency,-dependency,-and-toxicity/vitamin-d-toxicity
FWIW: I a person that was taking 50K IU per week had issues (Kidney Stones). I am trying to help you, not hurt you.
LTO Survivor,
I agree, if oil prices as predicted in the EIA STEO are correct, then the horizontal oil rig count will likely be flat to down. I doubt the EIA oil price scenario is correct, World oil supply is likely to be short of supply in the second half of 2022 and oil prices are likely to be $75/bo or higher for WTI in 2020 $.
Permian basin scenarios. low scenario with maximum completion rate of 525 new wells per month and high scenario with maximum completion rate of 800 new wells per month.
It occurs to me that the USGS undiscovered TRR for the Permian Basin is about 70 Gb with about 5 Gb of proved reserves plus cumulative production at the end of 2017 (3 assessments in 2016, 2017, and 2018) so TRR is about 75 Gb for Permian basin mean estimate by USGS.
For the Bakken Three Forks of North Dakota in 2013 the USGS mean TRR estimate was about 11 Gb.
So my middle scenario above for Permian has 35 Gb of a 75 Gb TRR being produced, about 47%.
For the Bakken my best guess scenario has 7.5 Gb for ERR of 11 Gb TRR or 68% and note that for the North Dakota Bakken/Three Forks cumulative production plus proved reserves at the end of 2019 was about 8.7 Gb or 79% of TRR.
The Permian scenarios I have created are quite conservative, if the North Dakota Bakken is any guide and it may be no guide at all. Only time will tell.
See this video of John Solomon ” The American Energy Crisis ” . Also addresses the stripper wells and the mom/pop operations and their problems . Long but interesting .
https://justthenews.com/tv
HIH
I would not classify JS as an unbiased reporter. He was fired by The Hill.
https://www.politico.com/news/2020/02/19/hill-john-solomon-failed-disclose-details-115976
He’s a Russian spy.
Bullseye . Comment by Norman Paigett , author of ” The end of more ” . This was on OFW .
“Putting aside the incessant noise about covid
our infinitely more critical problem can be summed up in 12 words:
We don’t have an energy problem
Our problem is paying for it . ”
Yes, if you can’t pay for it ,then you can’t have it . Energy poverty .
A question for HHH or anyone who has the answers . What happens if the Chinese devalue the Yuan ?
Depends on how fast the rate of devaluation they choose to do. Or are forced to do. And how far they have to take it. They can take it to the weak side of the trading band. Around 7.00000 as long as it’s slow moving it doesn’t mean much.
Technically that is about 6700 basis points or ticks from where it is now. Which is a large move but it doesn’t mean SHTF in China or elsewhere.
Now if we see a move above 7.00000 to say 8.00000 or higher particularly if it’s an uncontrolled move then there will be blood in the streets.
Hong Kong currency peg would likely break well before mainland China unless mainland China gave Hong Kong US dollars to defend it’s currency.
Hong Kong will look like Turkey before China. That is how you’ll know it’s on verge of happening in China.
China has a lot of dollar reserves to burn through before any type of uncontrollable devaluation would happen.
But then again when Japan’s bubble pop it was due to lack of US dollars. What would be the scenario that would lead to China lacking US dollars?
Well if every country decided to bring manufacturing base and supply chains home. Or just move them to India or Vietnam or elsewhere to lower cost would trigger this. And that is already happening.
Which is why China needs a cheaper currency to begin with to stay competitive. 7.0000 might not be enough to stay competitive.
How this will play out in oil demand? Maybe less demand in China but more demand elsewhere. Might just be awash.
SHTF when there is nowhere to produce cheap shit due to a lack of energy not necessarily just oil but total energy.
If Europe doesn’t figure out how to keep the power on this winter then industry will start to shut down. What will the trade data between all of Europe and China look like? China might have to go into lockdown if demand dries up in Europe.
But until we get an actual crisis. Wall Street and the pension funds are going to continue ramping stock valuations higher. So the rug under oil prices might not be pulled just yet.
HHH,
I read with interest you comment on “China might have to go into lockdown” because of energy shortage . I was wondering if this latest Omincron is being used as an excuse in the UK and Europe to do the same , Machiavellian of me but just maybe I’m reading to much into it .
Thanks
Forbin
Well it’s easier to lockdown a city of 13 million people over 250 cases of Omincron since your policy is zero tolerance. Than it is to say Europe is having and energy crisis and demand from Europe may never return to where it once was.
You can buy time to figure out a path forward to keep people employed and not rioting.
I don’t think the average Chinese citizen would complain too much at first though as their work week is 12 hrs a day 6 days a week. They could easily adopt a more western work week and be less productive. But that would mean less pay. So might not go over too well no matter what.
Part of China’s problem is wages have increased dramatically and labor is no longer cheap. Becoming poorer isn’t going to go over too well anywhere. Lockdowns are just a tool to manage people.
Another thing of note in regards to China. US stimulus checks that were used to buy shit at Walmart and Amazon aren’t coming in 2022. Which mean demand from US consumers will be down.
And the extra child tax credit. Without Biden’s BBB spending bill. That expires. Less money in pockets of US consumers to spend.
Doesn’t sound great for oil prices does it?
China is at a crossroads. Their zero tolerance for Covid policy is no longer sustainable with Omicron. Either route for them is potentially very damaging economically. A rock and a hard place…
“ Scientist who warned the world of Omicron variant says China’s ‘Zero Covid’ policy WON’T WORK against super-transmissible mutant strain as city of 13 million is locked down”
https://www.dailymail.co.uk/news/article-10344169/amp/Scientist-warned-world-Omicron-warns-China-Zero-Covid-policy-WONT-WORK.html
HHH Wrote:
“I don’t think the average Chinese citizen would complain too much at first though as their work week is 12 hrs a day 6 days a week”
China does not impose rent mortatoriums on those under lockdowns. The majority of chinese work long hours is to stay afloat and not end up homeless.
“China’s problem is wages have increased dramatically and labor is no longer cheap. ”
Only matching the decline of the Yuan, as inflation is running rampant. Food and energy prices are up over 30% in 2021.
Forbin and UK based followers . Are you prepared ?
https://consciousnessofsheep.co.uk/2021/12/20/the-uk-energy-rationing-plan/
Reminder from 1st January many new conditions as per the Brexit agreement come into play .
Be Well .
BOE raised interest rates a laughable 0.15% at their last meeting. I have to believe just about everyone there has their hands on the sell button.
There are some who buy when everyone is selling. But that is under the pretense that there is not much further to fall and there will be a rebound as things get worked out.
Wonder what happens when there is a permanent shock that is never recovered from. You can’t really buy the dip. The pound could easily go to 0.75cent or as low as 0.50 cents to the dollar. And stay there. Their currency could easily lose 2/3 of its value in a relatively short amount of time if energy crisis plays out in worse case scenario.
Only thing they can do to prevent worse case scenario from playing out is to make sure at all cost there is enough damn energy.
Kinda feel like we are all just waiting around to see which domino falls first. The idea that everything everywhere will somehow fall into place and allow high enough prices to allow a new peak in oil production is laughable.
HHH, my POV which agrees for most of your conclusions . Let us asses the situation worldwide . There are 6 continents and let us take one at a time .
1. Africa and South , Central America : Dead . No reprieve . Expect the situation to go from bad to worse .
2 . Australia & NZ ; One trick ponies depending on China . Who advised them to do such to do such drastic shutdowns ? Who told Australia to punch its biggest customer in the nose ? Stupid acts that will have consequences . To top it all Australia shutdown it’s last refinery and now must import all its finished fuels . How good ?
3. Europe : Another stupid move punching Mr Putin in the nose . The industry has put in its papers and if the situation does not improve they will mail in the keys . UK I have already posted the energy rationing plan link earlier .
https://www.wsj.com/articles/europes-industrial-firms-flash-warning-on-energy-costs-11640345803
Asia : Only two countries matter . China and India the rest are important but not critical .
India : Disaster in the pipeline . 50% youth unemployment . 15% WPI in Nov so wait until March when the CPI will be 15% . Politically the right wing is stoking fires for a caste war . A very undercurrent of intercommunity violence is being constructed . No reprieve .
China : Agree with all you have written except that the Chinese dollar crisis is already here . They lowered their RRR rate by 0.5% to release $ 188 billion into the Fx market to ease liquidity . The CCP is going to need all the USD reserves to cover its energy imports ( coal imports up by 200%) and also to backup the unwinding of the housing bubble now under progress . Under severe stress . Thanks for putting the spotlight on the HKD peg . It’s vulnerability flies below the radar .
North America : Cannot improve on what you have said except the addition of the risks posed by the Canadian housing and private debt bubbles .
MIddle East will continue with its wars and instability .
The conclusion is that 2022 will be as bad ( if not worse ) than 2021 . Don’t see how high prices can come except for some supply shocks . Entering into a period what is called “the age of consequences ” where we will pay for all our actions financial , political, environmental ,social etc is the creation of the ” perfect storm ” .
There is a big take home message regarding energy in UK, and every other country-
Better learn to change the pattern of behavior
and begin to rapidly rely only on domestic energy sources.
Use this current time (it is two-three decades late but better to use these few years of grace-relative low price for oil and gas*)
to build as much domestic generation capacity as you can afford to.
Because importation of oil, and gas, and electricity produced by other countries,
is going to prove either very very expensive, or
simply unavailable.
You can’t rely on tankers from the Middle East, or from the USA, etc
or pipelines from Russia. These sources are prone to disruption, or
to being purchased by other higher bidders.
Whether its nuclear, wind, coal, geothermal, or solar better build out capacity while resources are affordable.
in addition to cost/GWhr for these various options, we all must consider years/GWhr-
by that I refer to
how many years does it take from 1st day of planning to 1st day of production of a new generating facility or project.
*-yes, oil and gas are still cheap now, compared to the future
Hi Ovi, Merry Christmas and thanks for this very interesting and informative update.
The EIA report seems very optimistic related to US shale shall save the world from an emerging energy cryzis.
Last week the L48 production decrease with 100k bpd, many off thoose remaining ducs are dead ducs as they are drilled to close, it might something will happen Q1 2022 that will make the oilprice forcast off EIA to more look like a joke. What if US oil priduction declines, Opec + spare production are used and the world demand increased related to less impact from covid? Than oil price might be 125 usd instead off 70 as EIA predict.
Global growth is decelerating. And will continue to decelerating through 2022. As central banks continue to tighten monetary policy. Oil had it’s run up. While it might not sell off immediately. Top is likely in.
We’d need to see accelerating growth. Rising bond yields. Every downturn in the economy since 1986. The yield curve recovery has been less and less. Economy is already started to decelerate and we still haven’t made it back to 2% on the 10 year.
The reflations just keep getting weaker and weaker each time we get a crisis.
$125 or $150 oil is like a gold bug calling for $5000 gold.
Oil price is a proxy for future growth and inflation expectations. Just like low bond yields low oil prices tell you that the future growth and inflation prospects aren’t good. Manufacturing data is already decelerating not in contraction but decelerating month over month in most places.
Maybe we somehow avoid a recession in 2022. But the idea that Covid is main driver of growth or not so much growth in 2022 ignores everything else the matters.
We already know loans, and or credit creation by commercial banks aren’t happening at the rate needed to sustain growth. Our fractional reserve banking system that can loan out $10 for every $1 of deposits is only loaning out $2 for every $1 of deposits.
With no added government spending and less monetary stimulus from FED and other central banks. How exactly is growth going to not only continue but accelerate?
Show me where the money creation is going to come from and I’ll get onboard with the $125,$150 or even higher oil prices.
“LONDON (Reuters) – The world’s economic output will exceed $100 trillion for the first time next year”
and oil price will be higher.
January historically is best month of the year for stocks. I can see us having a risk on move that carries oil prices up. Not sure that equals new highs for oil. I’m more bearish medium to long term oil price than I am short term. There are just too many bad situations that can get a whole lot worse to put any long term bets on higher oil prices.
Most of the things I talk about don’t play out over a short term period of time. I make trades that are complete opposite of my medium to long term views all the time if all the technical chart information lines up to indicate price direction. I’m in a risk on position right now.
After Thanksgiving 12% drop in oil prices and pullback in stocks look to have been a bought the dip opportunity. All the Yen currency pairs are pointing up. Until crisis strikes again it’s likely going to be risk on for awhile.
But there are some big potential crisis brewing almost everywhere you look. So while I am long risk again. That can change in a hurry.
If things are great as some media outlets say they are then 10 year bond yields will get back over 2% We will see steepening yield curve in 2022. Not flattening of yield curve.
Money creation isn’t there to support these higher prices. FED knows this and which is why they stuck to the transitory narrative for so long. Supply chains just aren’t normalizing like they thought.
As bearish as I am on the overall outlook. I understand the mechanism that drives stock valuations. And why only pro’s can short it successfully. The bid under stocks comes from pension funds having to have 7% return on capital. Pension funds buy the corporate debt that allows CEO’s that want to get paid the capital to do stock buybacks.
Unless crisis is acute direction is up for stocks. Which in theory should be good for oil price.
Freddy
I think I will keep watching what is happening with well quality at Shaleprofile. When it starts reporting that peak output in Permian well has started to decline, that will be the clue that US production from LTO will be plateauing and the starting to drop.
Ovi, there are several factors that should be followed closely in the year to come. As many here in this forum have written capex will increase as result off inflation is high, lack off pepole, items like pipes, flanges and other parts are difficult to get. As I see all this depleation from tight oil need to be replaced every month in additional to new production as total US production can increase. There must be lots off wells both new and old that need maintenance, spare parts and if there is capacity problems in both labor and equipment this will add a growing downward pressure on the production. Signs might already come to the surface. As I remember they was in 2019 manage to increase lateral lenght above 20 000 feet, but with this also came some new challanges and increase cost as they need more power, the risk drilling equipment get stuck or break increase. The benefits is they get more oil from the well at least to start with and I believe thoose wells have higher depleation rates as more fracking stages adds child wells challanges and interferences to hit fractions from other wells that cause pressure dropps and other.
I know from oilreservoirs off sandstone where they inject water and chemicals to wash out more oil from the pores thoose structures getting more fragile as time goes by. In permian
that I guess have same problens it means the more holes, laterals, is drilled the more problem you might have to controll the fraction after fracking and this again might force them to reduce power as to much interference with old wells. Such issue will increase break even price for a well that I believe today is above 70 usd wti and it is increasing aldso in Permian. I can understand the banks and investors want to have back most off the money they have borrowed before it is to late. I know many Company went bankrupt and loans where transfered to cheap stocked with huge losses as result for the creditors but think still there is huge amounts that shall be payed back and it will be interesting to see if shale oil ever will be profittable adding the cost it took to developing it.
Thanks Freddy , very well explained for a layman to grasp the complexity and head winds .
Thanks Freddy
Your insights are much appreciated
Ovi, think this might have some info you can use in your midell.
https://www.spglobal.com/platts/en/market-insights/latest-news/oil/052121-us-upstream-industry-relying-on-longer-lateral-drilling-to-boost-cash-flows
As you can see you get less oil produced each foot if the latheral is long 10 000 – 15 000 foot.
Than it seems to me it this will have the impact you get more oil produced from a long lateral at least to start with but less barrels it will be tecnical possible to produce from the field.
Freddy Gulesto,
Good article thanks. From an economics perspective, the longer laterals may make sense, but from the resource perspective we may extract less oil per acre as productivity per lateral foot seems to decrease beyond 10 thousand feet. Even if it does not, we do not get any more oil per acre with longer laterals, just lower costs and higher profits.
Freddy,
Not many tight oil wells have laterals that are 20000 feet (though there are shale gas wells with 20000 foot lateral, 10000 feet is more typical for tight oil wells), costs may increase and prices may increase as well, if they do not output may stagnate, but $75/bo for WTI is high enough for profits in 2020$ at 2019 level of costs. Debt can be paid back out of operating cash flow as long as oil prices rise as much as costs.
Of course future costs and future prices are unknown, both are likely to be higher, how much higher each will be we just don’t know.
Coyne, it might be it was gaz wells.
At least I see from this article some in permian should now be 15 000.
https://www.hellenicshippingnews.com/drilling-and-completion-improvements-support-permian-basin-hydrocarbon-production-average-lateral-length-per-well-in-the-delaware-and-midland-basin-2/
Freddy,
Thanks. I focus on average lateral lengths which are around 9000 to 10000 foot range in the Permain, it is not clear much is gained by going longer in a tight oil well, but I will leave that to professionals who know more than me.
Ecuador’s oil production down ~400,000 b/d:
https://twitter.com/staunovo/status/1474388741183741975
Libya’s NOC says 300,000 b/d crude shut in: Update
Libya’s state-owned NOC said more than 300,000 b/d of crude production is shut in at fields in the western part of the country.
Nigeria’s Oil Woes Persist as Shell Halts Flows From Forcados
More than 200,000 barrels a day of Nigerian crude normally pass through the terminal.
Russia plans lower oil exports for Q1 2022 despite OPEC+ plan to raise output
Exports and transit of oil from Russia are planned at 56.05 million tonnes in the first quarter of 2022 versus 58.3 million tonnes in the fourth quarter of 2021…
https://twitter.com/xglobalmarkets/status/1475764105260810240
#RUSSIA’S OIL AND GAS CONDENSATE OUTPUT WAS 10.90 MILLION BPD BETWEEN DECEMBER 1 AND 27, FROM AN AVERAGE OF 10.89 MILLION BPD IN NOVEMBER.
RON PATTERSON
IGNORED
12/28/2021 at 9:27 am
A very interesting article on Russian future oil production. Bold mine:
Analysis: Russia seen missing its May target for pre-pandemic oil output
MOSCOW, Dec 28 (Reuters) – Russia is unlikely to hit its May target of pre-pandemic oil output levels due to a lack of spare production capacity but could do so later in the year, analysts and company sources said on Tuesday.
Deputy Prime Minister Alexander Novak, in charge of Moscow’s ties with the OPEC+ group of oil producers, has said output by May is expected to hit pre-pandemic levels, or about 11.33 million barrels per day (bpd) of oil and gas condensate, as seen in April 2020 .
However, many oil producers have reported they are almost out of spare production capacity having reduced output in tandem with other OPEC+ producers.
Part of the problem is old wells, mostly in Siberia, that are struggling to increase output, industry sources say.
Production of oil and gas condensate in December stayed at around 10.9 million bpd, in line with November, despite Russia’s OPEC+ quota rising by 100,000 bpd.
“It’s possible that Russia will be behind the output increase schedule in the first half of 2022 and not reach its pre-crisis level until the end of summer,” said Dmitry Marinchenko of Fitch Ratings.
Marinchenko said it would be hard for Russian companies to increase monthly output by 100,000 bpd and that they would need to intensify drilling.
“That would take some time,” he said.
A source at one Russian oil major said efforts to boost oil production have also been hampered by a lack of new wells at oilfields with high levels of water, as well as declining oil well production rates at hard-to-recover fields.
He said Russia would not likely hit pre-pandemic output levels before August.
Obviously Russia is struggling to increase oil production but finding that more and more difficult due to their very old brownfields with high water cut. They have been infill drilling those old fields and now find that there are no more places to drill. They try but just get mostly water.
Those who think Russia will be a major player in helping world oil production to reach new highs are dreaming. Russia will soon be in decline and part of the problem, not part of the solution.
Ron , put this on the old post . Just copy paste to the correct place .
When it comes to Russian Oil Reserves, we wonder if they may be just as Fictitious as the Middle East. With the oil industry transitioning to the VUNDERCHILD of the Oil Geologist and away from the Petroleum Oil Reservoir Engineer in the late 1990s, it’s anyone’s guess now of how much of the current reserves… are completely “BOLLOCKS?”
steve
Steve,
time will tell of course. Books are also written to make money.
From the year 2005 there is the book “Twilight in the desert” from Matt Simmons.
He raised the possibility that in the not too distant future, Saudi oil production will suddenly decline. He summarized what he learned about Saudi Arabian oil production by reading 200 academic papers.
Techniques (EOR) have improved a lot, but that also extracts crude oil a lot faster. A dangerous concurrence of circumstances. More than 15 (!) years have passed since 2005, so the ‘oil shock’ might well be about 5-10 years, or less, away.
Same could be the fact for Russia.
Han,
You bring up a valid point. However, Matt Simmons wasn’t an Oil Reservoir Engineer, who understood Fluid Dynamics, like Robert Dietrich. Rather, Simmons was a trained Investment Banker.
BIG DIFFERENCE in Analysis…
The DEVIL is in the DETAILS. And, I can assure you, Dietrich’s goal wasn’t to make MONEY if you read his book. But, to warn the world of the mistake by the Oil Industry switching from the science of Reservoir Oil & Fluid Dynamics to the study of “Oil In Place” Geology.
steve
Nowhere in the preface provided by Amazon does it say anything about the oil industry switching from reservoir dynamics to “oil in place” geology? I put quotes around it as well, as this reservoir engineer has never even heard of such a thing. Can you elaborate?
steve,
Thanks for clarifying.
I can imagine that fluid dynamics should be at least as important as “Oil in place” geology. Taking that into account, reading those 200 academic papers, the conclusion of Simmons could have been even more unfavourable. On the other hand, the advanced EOR techniques delay Peakoil or/and make the plateau last longer. The consequence for individual oilfields: the decline thereafter will be more steep.
Sorry to repeat myself, but I didn’t see a Steve clarification? I was just interested in where SRSRocco got the idea that this claimed change is happening. And what in the world is the the study of “oil in place geology”? In-place estimates are certainly part of reservoir engineering studies and calculations, did someone invent a new sub-specialty somewhere?
Simmons was an accountant, Lynch once famously said that you don’t ask an accountant reservoir engineering questions. Always struck me as more apropos than whatever Simmons thought on the topic. Simmons apparently also didn’t know production engineers operating within discretely reservoired fields (as opposed to continuous accumulations) consider themselves to be as expert in water handling as they are producing oil. Because if you can’t do the former, the latter doesn’t matter much.
Sorry to repeat myself, but I didn’t see a Steve clarification? I was just interested in where SRSRocco got the idea that this claimed change is happening.
Only a blooming fucking idiot would ever ask such a question. Any further comments from this idiot should be ignored.
Sorry for the rant but I am on my third toddy right now. And when I get just half snockered, I do not suffer fools lightly.
Bye now,
Ron
Ron,
Reservegrowthrulz is far from an idiot, he knows a lot about petroleum engineering and we could all learn much from him.
Dennis, I am sure ReserveGrowthRulz knows about oil production or something about it at least. However, anyone who makes this statement: I was just interested in where SRSRocco got the idea that this claimed change is happening., knows diddley squat about climate change.
Think about it. Just where did you get the idea that climate change is happening? Do you think that is a sensible question? How would you answer? Perhaps: From about 40 years of study by climate scientists? Would that be a sensible answer? But why give a sensible answer to a totally nonsensual question?
What is your opinion, Dennis? Or do you agree with the climate change deniers like ReserveGrowthRulz?
Ron, RESERVEGROWTHRULZ isn’t talking about climate change.
My mistake. I apologize. I misread his statment. I saw “claimed” and read “climate”.
Okay, I really screwed up. ReserveGrowthRulz, please accept my apology. I will try to do better next time.
Ron Patterson
Mr. Patterson,
Your last comment (posted 12:57 local time) is another display of the nobleness of your character.
For that (increasingly uncommon, sadly) public acknowledgement of a sincere albeit somewhat trivial misstep, you have once again shown your innate integrity.
While you and I probably disagree on about 90% of what is posted on this site, you have consistently put forth an unswerving drive to both seek out and convey Truth as best you can ascertain.
The fact that this site continues on in a (mostly) high level of discourse is due in no small part to the foundations which you have established.
For that, I offer you both my appreciation and congratulations.
Gerard
Thanks, Coffeeguyzz. I seem to be screwing up a lot since I reached this dotting old age. And when I get a bit tipsy like I was last night, it gets a lot worse. 😫 However, I really enjoy the dialogue here. I think it is a lot of fun. We can learn a lot about people just from the opinions they hold. But whatever that means, if anything, I am yet to figure that out.
Thanks again for the very kind words.
Ron
Oil Inventory update by Tracy Shuchart
Seppo,
What is the vertical scale on those charts?
Compare the lowest line to this, and it is 2900 MMB, so the tic marks are 50 MMB apart. It appears that the data has been corrected some.
Thanks Seppo.
Seppo,
This is stocks of crude? Or is it crude plus petroleum products? Does it include SPR stocks? Oil on water? For the globe this would be roughly 30 days of forward global consumption. It is unclear what is being measured in this chart.
Can European industry afford these prices .
Are those spot market prices in Europe, or do those big price spikes get passed on to residential customers as well?
In USA we have longterm stable regulated residential and commercial electrical pricing without short term fluctuations (I’m not sure if this applies to Texas where they have a separate system). For example, in our area we pay 11 cents/kwhr regardless of spot market pricing year after year.
For your curiosity, no.
Questions on the nuclear industry status in France-
Is there one plant design that has been settled on as the best, or are various designs still being deployed for new projects?
Roughly, what is the best case scenario for years of development of a new nuclear plant- from planning to completion? We have heard about projects that take over 20 years, but what is the best case.
Thank you
Hicks . Nothing is being done and nothing can be done . Too late to go in for projects that will take 10 years to come online . There is a project in Finland which EDF France ( Numero uno) in nuclear plants is working on since over 10 years and it is now a stone around their neck . Just some info which maybe outdated but the nuclear dome needs a special steel . A division of Nippon Steel , Japan is the only supplier . They can produce maximum for 2 or 3 domes per year . LTG prevails .
P.S : Laplander can add info on the project in Finland .
I was asking Jean-François Fleury, since he has some actual knowledge of the industry in his country.
And to your- ‘Nothing is being done and nothing can be done’…
Sorry to burst your bubble but the world will still exist in 10 years and 20 years.
With another billion people before too long.
So things will be done to change and adapt to the scenario.
And it will matter.
We may agree that it will be too little and too late, and too expensive.
Nonetheless things will get done. Choices will be made. Priorities will be set.
Winners and losers will be abundant, management will be poor,
wealth opportunity food and energy will be unequally distributed,
people will fight, and blame,
just as it has always been.
But things [energy projects] will get done.
Hicks , when did I say the world will cease to exist ? I only said no nuclear reactors will be built . Adapt to what ? Nett surplus energy is the key to all growth . We don’t have this . Our current financial system is based on continuous growth . The end of growth is the beginning of collapse , Money printing phase to disguise the energy cliff is over .The fish rots from the head down and collapse begins from the periphery to the centre . Energy projects will get done ??? How and why ?? Which country will build new pipelines and which shipping company will order new VLCC when their is no gas /oil to fill the pipelines and no oil to the VLCC .
Last tell me where is the steel going to come from for the nuclear domes ??? How about maybe Nippon Steel might not be able to deliver for 2-3 domes if they have to pay $25 per mcf for the LNG , not to mention other vulnerabilities . Special steels are not made on the kitchen stove .
In 2022 nothing will be done in France . The presidential elections are coming up and Mr Macron is fighting for his life while Mevrouw(Mrs) Macron has some other problems to tackle , like proving she is not a transgender . Read below . 🙂
https://www.bbc.com/news/world-europe-59753535
Hole- your opinions and rumors and media hype precede you by a mile.
It is a good thing that at least you value and enjoy them.
Olkiluoto 3 has got the U loaded and is estimated to start production in January, in full use next summer as they are increasing production slowly to make sure that systems work as they should.
To be more precise about your initial question ; yes and no, actually. There is effectively a regulated tarification for inhabitants and corporations. The tariffs are fixed by the CRE (Commission de Régulation de l’Énergie) which is in charge since the beginning of the 2000s of the proper functionning of the energies markets in France while the energies markets have been liberalized in Europe since the end of the 1990s. What is special is the fact that EDF is omnipotent for the production of electricity on the market. So, to create something that looks like a ”free market”, EDF is forced to sell a part of its electricity production at cost price to independent suppliers : they don’t produce energy most of the time and if so, it is negligible. They are just energy brokers. And they sell the electricity bought on the paper at the price they want. Thus, in order to allow these broker to exist on the market, the CRE has gradually increased the price of electricity and gas over the past ten years, in order to allow them to offer an electricity price inferior to the basic tarification of EDF. You have since the beginning of the 2000s the right to leave the regulated pricing to join another ”supplier”. And this done, you can not come back under regulated pricing. You can retake EDF as a provider, but it will be at the price of the ”market”. With the increase of the electricity prices on the market along the current energy crisis, some electricity brokers have given up as they were unable to honor the contracts made with customers. As a consequence, some idiots who thought they were doing good business by leaving the regulated pricing are forced to return to EDF at a higher price. The same is true for some industrial companies and due to the recent increase of electricity price, some will be forced to reduce their activities. About nuclear, the combustible load of the Flammanville EPR is forecast in 2022 (ouf!). For the rest, our Jupiter of non thought imagined to develop SMR (mini PWR) by 2030. And to launch the construction of supplementary EPR. For what is solid (the EPR), this will require the modification of the PPE (Programmation Pluriannuelle de l’Énergie) therefore a debate and a vote in the national assembly. Once this is done, there will be construction of a case for ”l’enquête d’intérêt public” which will last at least one year. And, once this is done, the construction work could be disturbed by the appeals to admnistrative justice. As EDF has gained experience with the construction of 4 EPR with two others still in construction, it can be assumed that they will take less time to build the next two EPR which are supposed to be less complicated to build. I don’t expect their commissioning before the beginning of the 2030s. On the front of Gen IV, as the project of natrium-cooled reactor (Astrid) has been abondoned to save all the euros they can, the CEA teams previously in charge of this project have decided to take charge of the development of a molten salt fast reactor, whose development, on ”paper”, was carried out by a team of the LPSC (Laboratoire de Physique Subatomique et Cosmologie). The CEA will do, on its own initiative, i.e. on its own basis, without state aid, a feasibility study of a small demonstrator located at the Hague to profit of the retreatment capacity of the Hague and the supply in uranium, plutonium and minor actinides coming from the retreatment of the fuel wastes. To begin with, they have done a weird choice of salt to dissolve the fuel but at this stage, that can be corrected.
Thank you for the reply.
Sounds like EDF needs real competition, but I suppose that would take a few decades to agree upon- decision making being what it is.
I am thankful the French nuclear program has been safe to date.
I wonder if energy shortage in these coming decades will incentivize some countries to cut corners on building nuclear facilities.
In the US we are no closer to developing a high level nuclear waste repository than we were ever before. But we do have a SmallModularReactor design approved, permitted and in the early stage of 1 st unit deployment for later in the decade.
https://www.nuscalepower.com/
No worries about cutting corners, just hire some blokes from Bulgaria, Romainia etc. and get the work done!
https://yle.fi/news/3-6323719
I guess the quality will be top notch!
Edit, this was long before things got interesting, and expensive…
“In the US we are no closer to developing a high level nuclear waste repository than we were ever before. ”
No worries- in 24000 years it will only be half the issue.
How were things 24000 years ago?
About small modular reactor business, I have no faith in that, especially with PWR. On the other side, US government is funding the development of a molten chlorides fast reactor with Terrapower. First a little demonstrator, which will be built on the Idaho National Laboratory site, and around 2030, a full-scale demonstrator of 1 GWe. With the development of this kind of reactors, the volume of the nuclear wastes could be reduced by the consumption, in these reactors, of the minor actinides coming from the PWR. About competition with EDF, I don’t feel the need for competition in the field of energy. For me, it is a common good and it has to be managed by the state, especially with a capital intensive sector like nuclear energy. Futhermore, the coming years are going to be highly challenging to cope simulateneously with the need to reduce our consumption of oil to avoid a climate disaster and the need to change our way of energy consumption with the reduction of oil supply. In my opinion, the states have their place to impose quickly a change of course while the market is unable to do anything without incentives of the states.
“the field of energy. For me, it is a common good and it has to be managed by the state,”
Interesting point of view.
For that to be successful you need to have a wise, coherent. proactive and functional government. In most countries, and certainly in the USA, we don’t have have those elements.
Therefore we have problems such as
-no nuclear waste program
-poor regional electric grid systems
-boom and bust cycles of oil production
-haphazard programs of energy innovation incentives,
for example.
We drift, and only remain functional because of the bounty we have stumbled upon.
Somethings on the French nuclear industry . From another Blog .
1. In France, it seems that the nuclear industrial complex is facing a bright future. Macron has taken a turn, investing three billion in the experimental SMR and EDF has launched an optimistic plan for 46 billion and the construction of 6 EPR reactors.
2. Well they are ‘dyed in the wool’ in France after 60 years of nuclear practice. So this week the French Court of Auditors has calculated the cost of nuclear energy taking into account some ‘uncertainties’ about the EPRs, the expansion and renewal of the reprocessing plant at La Hague and the expansion of the storage industry of Cigeo in Bure. All chain costs that have to be passed on because ultimately the ‘citizen’ has to pay for them.
3.The Court of Auditors has therefore called for the uncertainties surrounding the costs of future EPR2 nuclear reactors to be taken into account, and for the implications for waste management to be anticipated. “As regards the costs of future EPR2 reactors, the margins of uncertainty concerning the construction costs should be systematically tested, given the lack of maturity of this new reactor,” the Court notes in its conclusions. In its new report, it “provisionally” calculates a “cost range between 85 and 100 euros/MWh” for the electricity that would be produced. This is an estimate of their average discounted cost (LCOE) based on a number of assumptions.
“These cost elements are preliminary data. Work continues to strengthen the cost analysis of a possible EPR2 program, to prepare the elements for a future decision on fleet development beyond 2035,” the Court notes. Those calculations will come this spring, and count on them to be quite a bit higher.
That comes pretty close to the 110 euro/Mwh that is already being used for Hinkley.
4. One of the recommendations is that “for electricity mix scenarios that include a nuclear fleet renewal assumption, the investments related to the end of the nuclear fuel cycle” – i.e. waste management, some of which is very long-term – should be taken into account and made explicit. Indeed, new reactors could require additional investments, both for the renewal of the facilities of the La Hague (Manche) reprocessing center and for the expansion of the future Cigeo radioactive waste repository in Bure (Meuse), or even for the construction of another such site. “The investment assumptions related to the renewal of La Hague or the costing of a second Cigeo are not explained in any document to support the assumptions on the production costs of future EPRs,” the Court states.
5. Ai ai ai 100 euros/Mwh that’s a drama!!! Because when electricity prices rose to that amount in September due to all sorts of geo-political issues, the French government immediately had to come to the aid of its citizens with ‘extra energy vouchers’
All at once 12 billion was allocated to somewhat meet the ‘rising energy costs’ for the estimated 7 million households who really can’t pay their energy bills.
Imagine that 100euro MWh amount becoming ‘chronic and endemic’ to a population and an industry…. It’s not going to! That will lead to widespread ‘energy poverty’ and economic collapse.
6. Even more annoying, by the way, that exactly this week four reactors had to be shut down. Even more annoying because these are the last power plants to be built in Chooz and Civaux, which were shut down as a precaution due to ‘corrosion’. In one go 4.5GW of the market. Very painful because these are the two most recent power plants in France (2000/2001).
Still about 8% of the total electricity production. That is less appreciated by the shareholders and so the EDF share closed this week with a loss of 11%. Fortunately it is a semi-state company, but in the end everyone understands who has to pay for the losses…recapitalize a bit and make savings elsewhere…on the already out-of-control government debt of 116.8%.
Enjoy .
I know it is zero hedge but then the MSM has it’s hands full with Covid, Trump and BLM .
https://www.zerohedge.com/commodities/france-faces-power-blackouts-next-cold-snap-grid-operator-warns
Push comes to shove . High electricity and gas prices are pinching the European heavy industry .
https://mobile.twitter.com/JavierBlas/status/1473771306739019788
Dennis , making a post with a 182kb JPG image . I get the message “Oops this page does not exist ” . Request assistance .
Post it as a gif. That’s the only I can get anything to post. I have never been able to post a jpg. I don’t understand why others can do it but I cannot.
Hole in head,
Any image has to be less than 50 kilobytes, I have not been able to fugure out how to correct this, sorry.
Sometimes you just have to post the link to the image and tell people it is too large to post, sometimes you can find a way to reduce the file size of the image.
HIH,Ron, Dennis
When I do a JPG compress, I have a slider that appears that lets me drop the file down to 60k. That is the limit. The attached file is 59k.
What program is that Ovi?
Hickory
I just open the picture and select the “Export” option under file. I then select the jpg option and I get the picture shown above with the slider bar.
I have an iMac desktop.
Given the less than impressive discovery rate for 2021 I am now watching three wells currently being drilled with great interest. The Venus-1 well offshore Namibia.
https://energycapitalpower.com/totalenergies-spuds-deepwater-venus-prospect-offshore-namibia/
The Graff-1 well also offshore Namibia.
https://www.offshore-energy.biz/shell-spuds-namibian-wildcat/
Finally the Anchois-2 gas well offshore Morocco it is already a discovery but is development drilling and testing lower horizons which could be significantly large.
https://www.oedigital.com/news/492844-chariot-set-to-spud-anchois-well-as-offshore-drilling-rig-reaches-morocco
Lightsout . Nothing new offshore will be devolped and brought online . That includes both near offshore and far offshore . Reason ? Current prices will not justify FID ( First Investment Decision ) . Heck at current prices even onshore old discoveries will not be devolped .
Hole in Head,
I disagree. If sizable enough discoveries are made, I think they will be developed and brought online. Shell and Total aren’t in the business of drilling for the fun of it.
Bob,
The BIG “IF” is the first word in your sentence… “IF” sizeable enough discoveries are made… LOL.
Yeah, that’s the BIG IF. In looking at the data since 2015, the world has “Discovered” about 39 billion barrels of oil while consuming 208 billion.
So… we are going to need a lot more of those “IF” Oil Discoveries to make a difference.
I won’t hold my breath… “IF you don’t mind. 🙂
steve
$100 or more and those offshore rigs will go back to work. How much they produce will be the question, but not nothing.
If we get back to $80-$85 Biden will crap in his pants about inflation.
All jokes aside. Anything above $85 would be so politically damaging. They would manufacture a way to knock prices down 15%-20%
Most of the oil that needs $100 price is likely never going to be drilled and produce.
The tar sand oil in Canada. If the price of natural gas spikes and stays high. Which it more than likely will at some point. That oil will be too expensive to produce. And can be totally removed from the equation.
How many trucks does it take to frack an average shale oil or gas well? Well if price of diesel goes up a dollar or two per gallon what does that add to the cost of a well?
Venezuela even if they could figure out stability the still have to import energy to produce that extra heavy oil they got. Import what energy from where and at what cost?
Most of the shale oil that lies outside of the sweet spots will never get produce.
HHH
NG in Canada is relatively cheap and not subject to world prices. One of the major producers is Canadian Natural Resources and they also produce NG. I don’t know if they cover all of their needs. The mining operations do not use as much NG as the SAGD.
I’m pretty sure there was a study done on the amount of natural gas in place in Canada that showed there was only enough natural gas in place to produce about a 3rd of the oil in place.
Which means nature gas will have to be imported or more likely scenario is natural gas becomes expensive soon and oil stays in ground.
Steve,
You’re right, and that has always been the case.
Greenbub,
In the Gulf of Mexico, those rigs are back at work, and most of them are involved in development well activity. The latest rig report showed around 34 rigs active in the deepwater GOM.
Thanks Bob for injecting some knowledge into the discussion.
Dennis,
“Thanks Bob for injecting some knowledge into the discussion?”
Really?
So, you don’t think Rystad’s “FACTS” that the world has discovered 39 billion barrels while consuming 208 billion, isn’t knowledge?
Even if we go back to the years when oil was $100, the world oil discoveries were still between 28%-45% of what was consumed during those years.
So, do you think we can do even better with $100 oil this time around?
Steve
Steve, you are forgetting about reserve growth. Those 39 billion barrels will grow and grow until they grow to well beyond 208 billion barrels. 🤣
Steve,
So I think Dennis’s comment was to my comment about Hole in Head’s comment, not your comment, got that!!
It would be interesting to see how many of the projects that found that 39 billion barrels have actually been sanctioned. I’m sure some have, but I know of a number of GOM examples where discoveries were made followed by press releases, and then, usually after mediocre appraisal results, nothing more happens.
Steve,
When I made my comment it was in response to Bob Meltz before I had seen the other comments.
I agree the lack of discoveries suggests reserve replacement will be difficult, but remember that there are a lot of probable and possible reserves in the World as well as contingent resources, and historically there has been reserve growth, though it is possible that the future will be very different than the past, how much different we do not know.
Bob Meltz,
Absolutely true that many discoveries never reach FID, you know the details of this much better than most of us.
I attached the last chart in the Post, “US imports of Russian crude”, in hopes of getting a reaction from some of our European participants on their thoughts on this Ukrainian push by Russia. What has made Putin do this at this time?
Ovi, Putin has taken a hard stance because he is peak oil and peak gas . This means he doesn’t have to go looking for any new customers . During the last few years actually he over committed his ability to supply to China , India etc . Today he holds the cards because he will be forced to ration supplies . In such a situation why kow tow to EU or USA who have been constantly poking the bear ? Some are going to get pissed off but Europe ” Be nice to Mr Putin ” . All ” Hail , Don Putin ” . 🙂 . Alternative is shutdown of industry because of high electricity prices .Occam’s
razor . The simplest explanation is the best explanation .
HIH
How long can Europe and the US Cow Tow to Putin. He invaded Georgia and they did nothing. He invaded Ukraine and they did nothing. How far do you let a bully push you.
I am not saying I have an answer. Maybe when Putin was adding soldiers and troops along the Russian border, Nato/U.S. should have been holding maneuvers with the Ukraine.
Ovi . First some clarifications . Russia has not invaded Ukraine . Ukraine has an elected President named Mr Zelensky ( a former comedian ) who has also visited Washington several times . Victoria Nuland and the state department initiated a coup de etat via their colored revolutions in Ukraine . Putin did not invade Georgia . Georgians along with cheerleaders from Israel and CIA overran a UN peacekeepers force between Georgia and South Ossetia which is a breakaway region of Georgia and Moscow aligned . The Russians went in and restored status quo . It took them 4 days and they withdrew to their earlier positions . They returned right before the gates of Tbilisi the capital of Georgia and did not enter Tbilisi . Georgia has its own independent elected president .
Mr Putin is not bullying anybody . He did not leave START or ” open skies ” and other mutual agreements that were signed to prevent war . I guess all nations have a right to their security . US and EU put sanctions for dumb reasons and now the US is threatening to remove from SWIFT . To expect Mr Putin ( ex KGB) that he will twiddle his thumbs is unrealistic . He is using the soft weapon he has . So how long will Europe and US kow tow to Putin ? Answer ? Till they fall in line . Not only gas and oil are the choke points . Russia is also the sole supplier of titanium forgings to Boeing and space craft engines to NASA plus nickel plus etc etc . Don’t mess with Mr Putin . 🙂
The US media loves to play the drums of war . I assure you that ” Russiagate ” did not happen and Jeffery Epstein did not kill himself . 🙂
Ovi , an interesting read .
https://www.reuters.com/markets/commodities/russian-gas-flows-via-yamal-europe-pipeline-reversed-3rd-day-2021-12-23/
More events are happening behind the curtains .
Crimea?
Lightsout, Crimea was always Russian. Or at least, has been since the last 300 years. The people are Russian. Crimea was transferred from Russia proper to Ukraine for administrative reasons within the Soviet Union in the 1960s by Khrushchev, who incidentally was Ukrainian.
The Crimeans tried twice to get back to Russia – first when the Soviet Union broke down and 10 years later. There was a plebiscite held in Crimea after the Russians took over and they voted, I think 95% voted to join Russia. And why not – they get so many freebies. They just had a brand new bridge constructed connecting them to Russia. Gas and petrol are both significantly cheaper than in Ukraine. Electricity is cheaper too. Law and order situation is significantly better than in the Ukraine. Taxes are lower. They don’t suffer second class citizen status because of their language – Crimeans speak Russian. More tourist revenues – tourists come from Russia. Support for industries. What’s not to like!
Not great to type this on an oil blog, but try to feed less on the MSM propaganda villainising Putin. The guy has a 70% approval rating in Russia after more than 20 years in power, show me one leader in the West who commands such respect from the populace.
Crimea has been part of Russia about as long as the USA has been a country.
90% of the country is Russian, with Russian the main spoken language.
The country could be given back to the 10% of the original residents, and the USA could be given back to the original residences—
So, you in the USA, start packing.
All countries are the sovereign territory of whoever has conquered them last.
Or surrendered under terms favorable to the local power/empire.
True whether we are talking about Poland, USA, or Korea.
And everywhere else.
I want to add about Ukraine. The fact is that the south and east of this country was not inhabited until 250 years ago. There lived nomads whose source of income was the trade of Slavic captives, slaves. After the victory over the Crimean Khanate, these lands were populated mainly by peasants from Russia. Russian is still spoken there. Violent restrictions on the use of Russian were among the reasons for separatist movements. In some large regions (for example, in Kharkov) pro-Russian uprisings in 2014, the Ukrainian government was able to suppress. Still the main language in the Ukrainian army. is Russian. It happened so.
Ancientarcher,
If Putin were serious about maintaining old borders, he would give East Prussia back to Germany. Unless of course his arguments only apply when they expand his glorious empire.
So, Hole in Head, who hired the sniper of Maidan Square? Victoria Nuland was handing out donuts in the square but it probably wasn’t moving fast enough for her. The US State Department actually thought they could do a color revolution in Russia. Some people I know make the sign of the cross when Victoria Nuland’s name in mentioned.
apologies again for posting it in this forum, but some things ought to be said.
Read the writeup by Jack Matlock, the former US ambassador to Soviet Union.
https://www.krasnoevents.com/uploads/1/1/6/6/116679777/krasno_analysis_-_matlock_ukraine_-_dec._2021.pdf
Who shot the protestors? well, the snipers’ shots came from the buildings controlled by the rebels. https://jordanrussiacenter.org/news/the-maidan-massacre-in-ukraine-revelations-from-trials-and-investigation/#.Ycw6EVmnzRZ
It was a set-up and coup by the US to get rid of the democratically elected president of Ukraine in 2014 and it is them who are pushing the country towards confrontation with Russia. A confrontation which the state of Ukraine won’t survive in its present form.
People are talking as if Europe can shut off Russian gas supplies and fulfil its energy needs from elsewhere. That is impossible. There is only so much gas in the world. The total LNG production/capacity in the world is not enough to satisfy current demand as well as any deficits in Europe from the non-approval of NS2. If they don’t approve NS2, they will freeze this winter or their industries will go out of business on account of high energy prices. Unfortunately, I happen to live in the continent ruled by this group of idiotic dumbf*cks and am taking the hit on energy costs. If push comes to shove, Russia can link all gas supplies (not just NS2) to the approval of NS2. Will Europe survive that scenario? The idiotic politicians that are in power in Europe should just say thank you to Russia, approve NS2 and get on with life as usual.
It’s not that the US doesn’t have brilliant diplomats like Matlock who understand Russia and Ukraine, but their foreign policy establishment has been captured by Eastern European emigres with ancient prejudices like Nuland and previously Brzezinski who are continuously driving the US towards a confrontation with Russia, a confrontation which if it turns nuclear will kill us all.
Ancient Archer and Alexander , thanks for your posts that counter the MSM propaganda regarding Russia and Ukraine . Some one even said in a response to my post ” we know from where your paycheck is coming ” To those who still believe MSM my question is ” why were there no shots fired or deaths in the invasion of Crimea ??. Answer ? Because it was not an invasion . The Crimean parliament passed a resolution to join the Russian federation followed by a referendum . Second fact . The Ukie soldiers in Crimea were given an option : remain and join the Russian armed forces or leave . Those who chose to remain were given Russian nationality and positions , those who chose to leave were put on a truck and escorted over the border . Fair .
Talking of referendums . There was a referendum held in Kosovo in which the Serbs were intimidated into not voting . Result was Kosovo became an independent nation . It’s first President installed by NATO and EU was sentenced by ICJ in Hague for organ trafficking . Today most of the drug traffic in West Europe is run by all NATO, EU formed countries during the Yugoslav war which are Kosovo, Albania, Montenegro , Bosnia and Macedonia . Calling the kettle black .
Careful.
In the 1930’s people said similar things about much of Poland really being part of Germany.
HIH
Is this fake news?
“In April, pro-Russia separatist rebels began seizing territory in eastern Ukraine. The rebels shot down Malaysian Airlines flight 17 on July 17, killing 298 people, probably accidentally. Fighting between the rebels and the Ukrainian military intensified, the rebels started losing, and, in August, the Russian army overtly invaded eastern Ukraine to support the rebels. This has all brought the relationship between Russia and the West to its lowest point since the Cold War. Sanctions are pushing the Russian economy to the brink of recession, and more than 2,500 Ukrainians have been killed.”
https://www.vox.com/2014/9/3/18088560/ukraine-everything-you-need-to-know
Ovi , first Vox news is MSM and hostile to Russia . Supported Russiagate ,so lesser said better .
To the second part what happened ? Fact is nobody knows all . The only established fact is that it was a BUK missile which is made in Russia . The problem is that the Ukie army and the rebels have access to these missiles also . The question is whose finger at the trigger ? That is where it is murky . The JIT was NL, Australia, Belgium and Ukraine and Malaysia . NL, Australia and Ukraine concluded Russia (understandable) . Belgium said nothing and Malaysia accused the three of making a scapegoat out of Russia in the investigation . So that is that . The problem with the investigation was that Ukraine refused to provide air controller traffic info and Washington the satellite photos for the incident . Russian investigators were not allowed to the crash site . On ground search was done by NL only as the majority who died were Dutch nationals . Reach your own conclusion . Conspiracy theory ?? Maybe ?? I know my limitation .
Re Hole in Head on the shootdown. The idiot Malaysian Airliness were flying over a war zone. For a few thousand more dollars of fuel they could have avoided it. They chose to fly over a war zone. The separatists thought they had shot down a Ukrainian transport aircraft.
Archibald, I´ve read that the pilots were reluctant to go that route but were instructed to do so by Kiev air control, unfortunately the tapes from atc gone missing somehow…
Attached is a chart that looks at Permian wells as reported at ShaleProfile
The Green line looks at the average IP2mth peak reported at ShaleProfile for the months February to September.
Using the average monthly data, I then back calculated the IP2mth for each month separately. That monthly rate is shown in the red graph. You can see what happened in September. 455 wells were added, more than in August and the extra output of 9 M bbls was less than August,
Overall Number Total
Average Wells New Wells Barrels Mthly New Bbls New Well Rate
Aug-21 909.9 2286 415 64,480,973 12,796,282 995
Sep-21 894.2 2741 455 73,530,066 9,049,093 642
Ovi,
Shaleprofile uses data from state agencies and often this data gets revised, you can check back about 12 months ago at shaleprofile and compare current data with older data (the old blog posts are archived. You will find that the most recent 6 to 12 months of data gets revised significantly over future months. Only data older than 12 months is reliable. Also your “new wells” may simply be inactive wells that have been brought back online.
If you look at well status tab at shaleprofile and click only “first flow” wells (this is what Enno uses to distinguish wells that have just started producing in any given month) you will find that in Aug 2021 there were 379 first flow wells and in Sept 2021 there were 269 first flow wells. These numbers will likely be revised in the future.
You may be using the total well count under the total production tab which includes plugged wells, inactive wells, producing wells, and first flow wells. Note that the inactive well count was 2329 in August 2021 and increased to 2699 in Sept 2021 according to shaleprofile, Plugged wells increased from 416 to 419 from August to Sept 2021.
See chart at link below for plugged and inactive wells
https://public.tableau.com/shared/X9W2C5YDG?:toolbar=n&:display_count=n&:origin=viz_share_link&:embed=y
Chart at link below has “first flow wells”
https://public.tableau.com/shared/BCXZX3TJ9?:toolbar=n&:display_count=n&:origin=viz_share_link&:embed=y
It is not clear where you are getting your data as I get very different results see also link below.
https://public.tableau.com/shared/2RBZR2ZHJ?:toolbar=n&:display_count=n&:origin=viz_share_link&:embed=y
I get the following for Permian IP2month peak output from Feb 2021 to August 2021, there is no data for 2nd month of Sept 2021 first flow wells published by shaleprofile at this time. Data from shaleprofile at link below
https://shaleprofile.com/blog/permian/permian-update-through-september-2021/
Note that I do not think based on this data that Permian wells are getting better, there is high grading, longer laterals, different well configurations and how the producer decides to produce the well along with lots of other factors I no doubt am missing. Every well is different and output of any group of wells that start producing in any given month will vary based upon a large number of factors.
My models assume average output of first flow wells in the Permian basin has been decreasing since Jan 2019, this is based on overall expected EUR for the wells.
Dennis
You seem to have a number of ways of getting at IP2mth that I am not familiar with. The info I got came from the Well Quality tab. It is from the September update and so I think it must be September data. September chart attached.
So before we can continue this discussion, we need to agree on what is the best way to assess the Permian wells using Enno’s data.
I went back to the May Permian update to get the February data. Chart attached. I also select “Normal” to make sure I get the right data. I went through every month from May to September to get well data for each month.
Looking at the middle part of your chart it looks similar to mine. I am going to send you my spreadsheet so you can compare the data. Hopefully we can find some common ground,
February data from May Permian update from Well quality tab
Ovi,
Use well quality tab and choose only 2021 for first production year. Then group wells by month of first flow. Link to chart below from Sept 2021 Permian Update.
https://public.tableau.com/shared/87J93ZXHF?:toolbar=n&:display_count=n&:origin=viz_share_link&:embed=y
If you click on a specific month on legend it highlights that month making it easier to pick out output for peak month. There is only the first month of output available for wells that started producing in Sept 2021, the second month for wells that started flowing in Sept 2021 will be available in the Oct 2021 Permian update.
Note that for Wells that started flowing in Jan 2019 the peak month is month 3 rather than the normal month 2, this is likely due to wells being shut in during the power crisis in February 2021 in Texas.
I think using the latest Permian update gives the best data because there are often data revisions over time.
Permian peak IP data from Jan 2019 to Aug 2021 below in bpd
705
845
748
757
748
761
807
824
879
826
792
819
825
850
705
641
759
763
739
847
981
849
974
918
773
850
875
903
1037
893
903
953
Permian 6 month cumulative data below, starts Jan 2019 (in kb)
87.15
104.92
94.99
96.32
97.22
94.38
106.21
103.12
109.35
104.26
105.56
102.01
100.45
104.04
97.40
98.86
105.98
107.07
108.07
111.55
115.30
110.44
126.92
113.39
110.41
107.63
119.21
115.86
Anybody can just copy and paste this into a spreadsheet if they wish. Reduce page size in browser to 80% to make copying easier.
To get the data in the comment above I use the shaleprofile post at link below
https://shaleprofile.com/blog/permian/permian-update-through-september-2021/
Then I click on well quality tab and change ” First production year” in bottom right side of chart to 2019 only (no other years checked). Then at top left of chart I change “Show wells by” to “month of first flow”. Then click on individual months on legend at right to highlight each month. IP for each month can be read off chart (most months this is month 2, occasionally it is month 3), also cumulative production at 6 months can be found on bottom chart.
I did this for 2019, 2020, and 2021 to get the data.
2019 at link below
https://public.tableau.com/shared/YN49K44C3?:showVizHome=no
2020 at link below
https://public.tableau.com/shared/9JHDHYR22?:showVizHome=no
2021 at link below
https://public.tableau.com/shared/P82WPMMKY?:showVizHome=no
just click on each month at right side of chart under “Select” to highlight each month to more easily determine monthly data.
Longer term data for IP peak (mostly month 2, but sometimes month 3 from first flow) from shale profile from Jan 2019 to August 2021, blog post linked below.
https://shaleprofile.com/blog/permian/permian-update-through-september-2021/
I wondered what 6 month cumulative would show us so I pulled that data for Permian basin from shale profile post linked below
https://shaleprofile.com/blog/permian/permian-update-through-september-2021/
Data in chart below is in kilobarrels of cumulative output at 6 months from first flow for Jan 2019 to April 2021 (last month reported at shaleprofile with 6 months of output data reported). Note that this does not account for increasing lateral length, I do not have access to that data.
GOR the Achilles heel along with depressurization in the shale plays . From Mr Shellman .
https://www.oilystuffblog.com/news-stuff
Hole in head,
Yes that is in the Permian September 2021 update I have referenced at shaleprofile. Note that in Enno Peters opinion the increasing GOR from 2020 wells compared to earlier wells is marginal.
Here is a link to the chart (larger version)
https://shaleprofile.com/wp-content/uploads/2021/12/GORs.png
The 2016 wells look better than 2014 wells as far as GOR and 2018 looks better than 2016. For 2019 wells they seem to be running similar to 2016 wells (slightly better up to 200k) and the 2020 wells are slightly worse than 2019, but again about the same as 2016. Basically what I see in this data is very little change since 2016 and that GOR got better from 2014 to 2016, though if the chart had been normalized for lateral length the story would be different.
Mike Shellman has access to that data and could post it at his blog, I do not have that option available to me.
Maybe a useless stat, but I noticed while looking at the most recent month reported for ND that there are many wells that do not produce every day of the month.
I wonder if anyone has analyzed this to see if it has any meaning? For example, correlation between decreasing production days and decreasing production.
Also, I note for no production ND has three possibilities. SI, 0 and TA. I assume TA is a status accomplished through the state. Anyone have any idea of the difference between SI and 0?
I also notice many wells that might only produce 1-5 days per month, with little production. What would be explanations for this? I have ideas, but would like input from people on the ground.
Maybe dumb questions by me, but seems there are a lot of these wells that make nothing or almost nothing. Many more than I’d expect from a relatively new field.
One thought, maybe they have a rig shortage like we are experiencing? Maybe a lot of these wells need down hole repairs and are waiting on a rig?
I do like the format of ND’s monthly reporting well by well.
I would sure welcome input on what is going on in ND. It seems it isn’t favored anymore.
SS , no , it is not a useless stat . The next logical question should be how many similar status wells exist in the Permian ?? A study will throw cold water on all forecasts and show who is swimming without underwear . Tks .
Shallow sand,
Enno Peters might have some idea about the data, he usually anwers questions at his blog, or you can email him.
Shallow
I thought this might explain the problem with the Bakken.
https://twitter.com/WhiteTundraSG/status/1476072627210833920?t=myqniDYVhfOZF3YXiS78cw&s=19
Lightsout.
Thinking maybe they shut in some wells because they were drilled on too tight of spacing, and therefore can get the same or better economics from running just a few of them in the unit?
And then maybe turn the SI ones on a day or so a month to keep the state off of them for having inactive wells?
Shallow sand,
Perhaps on the low flow wells they turn off the pumps for a few days and let the oil collect in the lateral and then turn the pumps on for a few hours to drain the pipe? No doubt it is much more complex than this, but I think you have said that on low flow wells the pumps are not run 24/7.
Brent near $80 as market shrugs off Omicron
LONDON (Reuters) -Oil prices extended gains on Tuesday, with Brent crude trading near $80 a barrel despite the rapid spread of the Omicron coronavirus variant, supported by supply outages and expectations that U.S. inventories fell last week.
Brent crude rose by $1.04, or 1.3%, to $79.64 a barrel by 1119 GMT. U.S. West Texas Intermediate (WTI) crude rose $1.15, or 1.5%, to $76.72.
Both contracts traded at their highest in a month.
“Support comes as well from high aggregated production disruptions in Ecuador, Libya and Nigeria and the expectation of another large drop in U.S. crude inventories,” said UBS oil analyst Giovanni Staunovo.
I’d say support is just coming from overall risk on sentiment. As long as US stocks are heading higher it’s easier to bid oil as well. If S&p 500 was down big this week say 1000 points oil would also be down regardless of what else is taking place.
4.5 earthquake near Midland yesterday.
Apparently Texas RRC has been shutting down some water disposal wells due to seismic activity.
This could limit Permian Basin growth.
Shallow sand,
Thanks. I agree there may be a need to recycle more of the flowback water. I am sure there are a lot of smart folks in Texas who will figure how best to solve this problem.
On them earthquakes and waste water disposal . Mr Shellman please .
https://www.oilystuffblog.com/single-post/lenorah-27-dec-2021?postId=ce4508a8-ea19-4dc5-8639-84f1003dc3cf
Hole in head,
Thanks. As usual, great stuff from Mike Shellman.
A very interesting article on Russian future oil production. Bold mine:
Analysis: Russia seen missing its May target for pre-pandemic oil output
MOSCOW, Dec 28 (Reuters) – Russia is unlikely to hit its May target of pre-pandemic oil output levels due to a lack of spare production capacity but could do so later in the year, analysts and company sources said on Tuesday.
Deputy Prime Minister Alexander Novak, in charge of Moscow’s ties with the OPEC+ group of oil producers, has said output by May is expected to hit pre-pandemic levels, or about 11.33 million barrels per day (bpd) of oil and gas condensate, as seen in April 2020 .
However, many oil producers have reported they are almost out of spare production capacity having reduced output in tandem with other OPEC+ producers.
Part of the problem is old wells, mostly in Siberia, that are struggling to increase output, industry sources say.
Production of oil and gas condensate in December stayed at around 10.9 million bpd, in line with November, despite Russia’s OPEC+ quota rising by 100,000 bpd.
“It’s possible that Russia will be behind the output increase schedule in the first half of 2022 and not reach its pre-crisis level until the end of summer,” said Dmitry Marinchenko of Fitch Ratings.
Marinchenko said it would be hard for Russian companies to increase monthly output by 100,000 bpd and that they would need to intensify drilling.
“That would take some time,” he said.
A source at one Russian oil major said efforts to boost oil production have also been hampered by a lack of new wells at oilfields with high levels of water, as well as declining oil well production rates at hard-to-recover fields.
He said Russia would not likely hit pre-pandemic output levels before August.
Obviously Russia is struggling to increase oil production but finding that more and more difficult due to their very old brownfields with high water cut. They have been infill drilling those old fields and now find that there are no more places to drill. They try but just get mostly water.
Those who think Russia will be a major player in helping world oil production to reach new highs are dreaming. Russia will soon be in decline and part of the problem, not part of the solution.
The chart below shows Russian oil production thru December 2021 as per my post above where Reuters stated that December output would be the same as November. The below link gives a very confusing prediction for 2022 Russian oil production:
Russia expects 2022 oil output to beat pre-pandemic level at 11.045 mil b/d
However as you can see, the chart below puts Russian pre pandemic level at 11,250 million b/d with the last four months pre covid averaging 11.314 million b/d. Then the article goes on to say:
Russia’s production of crude and condensate in 2022 is expected to rise by 5% on the year to about 540 million-550 million mt, or up to 11.045 million b/d, deputy prime minister Alexander Novak said Dec. 24.
I did the math:
540 million tons = 10.844 million b/d
545 million tons = 10.944 million b/d
550 million tons = 11.045 million b/d
I think they are trying to move the goal posts here. 11.045 million barrels is over a quarter million b/d below their pre covid oil production. And they stress that their production could beup to 11.045 b/d. Meaning their production could possibly reach that level but not likely.
Ron,
I agree the article is confusing, sometimes they might be talking about crude only, not sure. If we take the average of the EIA estimate for Russian C plus C and the Russian Ministry of Energy estimate and then calculate the 12 month centered moving average of output for Russia, we get the chart below. My expectation is that Russia will return to 11 Mbpd and then remain at that level for 5 to 7 years and then start declining.
The most recent month reported has output at about 10663 kb/d, so another 337 kb/d increase to get to 11000 kb/d. That would require an average monthly increase of only 48 kb/d to reach that level by June 2022. Note that the estimate for Russian C plus C output in Nov 2021 was done by assuming the difference between EIA and Russian estimates for Russia’s output remains 360 kb/d for Sept to Nov 2021.
I agree the article is confusing, sometimes they might be talking about crude only,
No, they never, ever, talk about crude only. It is impossible to get crude only numbers out of Russia. What everyone does is just assume condensate is 8% of total production.
My expectation is that Russia will return to 11 Mbpd and then remain at that level for 5 to 7 years and then start declining.
The most recent month reported has output at about 10663 kb/d, so another 337 kb/d increase to get to 11000 kb/d.
Dennis, you appear to be using the EIA’s estimate of Russian production. All reports out of Russia always use the Russian Ministery Oil data. That is what they use, and convert tons to barrels at 7.33 barrels per ton. So that is what I use. None of the wire services or reporting agencies use the EIA data.
However, your prediction level is a quarter of a million barrels per day below their pre-covid average and 300K below their peak 12 month average. I am glad that you now have a more resonable estimate of Russias production limits in the next few months. And I find your estimate very resonable as well. However your estimate that that they will remain there for 5 to 7 years is beyond the pale.
Shocking! You get resonable then you go off the deep end.
Ron,
I think they might get to 11 Mbpd, the plateau idea is based on the publication linked below published in September 2019.
https://www.oxfordenergy.org/publications/the-future-of-russian-oil-production-in-the-short-medium-and-long-term/
See figure 18 on page 22 of that report, which shows Russian output remaining at 11 Mbpd out to 2030. That is what these experts conclude, I am simply deferring to their expertise, this is their area of study. Can you find an authoritative source in support of your view?
From their conclusion:
Overall, then, it would seem that Russia does have the opportunity to meet the Russian Energy Minister’s target to keep oil output over 11 mb/d for the next decade. Indeed, if the country’s import substitution strategy is a success then it could even exceed the target, as there is little doubt that the resources are in place. A combination of performance enhancement at existing fields, exploitation of EOR techniques and hard-to-recover reserves, plus some efforts to maintain offshore oil output should be enough to meet the overall goal. Perhaps the more interesting question, though, is what could happen if sanctions are lifted. At that point, the potential of all these resources could be released rapidly, leading to a surge in output towards 12 mb/d or above.
Based on this the 11 Mbpd estimate that I make is actually conservative, potentially output might be higher if sanctions on Russia are ever lifted.
Can you find an authoritative source in support of your view?
Why yes I can Dennis. The page and chart just above your page and chart, figure 17 on page 21. Also there its figure 10 on page 11. Also just for Russia’s offshore fields, figure 16 on page 20. What you show is the Russian Minister’s target. And the author of the piece says that they do have the opportunity to meet that target. Eveything else in that PDF has Russia starting to decline in 2023.
Notice the yellow dotted line in the chart below. That is the Minister’s target, (which you posted). However, the rest of the chart shows what they really expect. And that chart shows the decline beginning in 2023 and dropping every year thereafter.
Thanks for the link. It furthers my confidence that Russia is on the verge of declline. And it should have the same effect on you.
Ron,
Read the paper. There is a long discussion leading up to the conclusion on page 21 and 22, if you simply read thse two pages, it is clear the authors believe the forecast in Figure 18 is the correct one.
I would like to post Dennis’ link again, in hopes more people will look at it.
The Future of Russian Oil Production
in the Short, Medium, and Long Term
It confirms all my suspecisions about Russias oil production future. The article is spot on in spite of it giving credence to the Russian Oil Minister’s target for Russian oil production. Which is rather humorious if you ask me. 😁
The article was written in 2019, before the covid demand collapse. Therefore it does not show the decline in 2020 or the partial recovery in 2021.
Notice in the chart below that the major declines are in the Volga-Ural and the West Siberia area. That is where all the very old Russian brownfields are. They are either all in decline or about to go into decline.
The forecast Ron posted above ignores many opportunities from offshore, hard to recover, and EOR, the authors conclude with figure 18 when taking all resources into account. Read pages 21 and 22 of the paper to see their full conclusion.
Dennis, their old fields in the Volga-Ural and Western Siberia are in decline and your chart shows that. They are depending entirely on an increase in condensate, hard to recover and EOR. There is no reason to believe that the condensate percentage will increase. And there is even a lesser reason to believe that hard to recover will increase by such a dramatic amount. As to EOR, they have been trying that for years with only moderate success. There is no reason to believe that their success will suddenly double as shown in the chart.
It’s just common sense Dennis. The Minister’s target is just hopum and nothing more.
Ron,
I will defer to the conclusion of the experts who wrote the paper. They believe the Russian Energy Minister’s target is reasonable, I agree.
Dennis, there is little doubt that your “experts” have an ax to grind. Their funding very likely comes from the Russian Government. The “experts” are:
James Henderson, Director, Natural Gas Research Programme, OIES &
Ekaterina Grushevenko, Research Fellow, Skolkovo Energy Centre, Moscow,
And they know what to say to please those who fund them. Also, don’t say anything in Russia that Putin does not wish to hear. However, the publisher of the paper knows this and denies any responsibility if it this Russian prediction turns out to be bullshit.
The contents of this paper are the authors’ sole responsibility. They do not necessarily represent the views of the Oxford Institute for Energy Studies or any of its Members.
Ron everyone gets funding from somewhere, so you do not agree with the authors so you discredit them. Still waiting for a credible source supporting your point of view.
Also note that OIES stands for Oxford Institute for Energy Studies, so the lead author is the director of the Natural Gas Research Program at the the Oxford Institute of Energy Studies.
Link below to several other papers on Russian Oil at OIES
https://www.oxfordenergy.org/?s=Russian Oil&post_type=publications
Link below to search on Russian Oil Production in Google Scholar, note the top author.
https://scholar.google.com/scholar?hl=en&as_sdt=0,20&q=russian oil production&oq=Russian oil
Another paper form 2019 on Russian Oil production potential
https://ogst.ifpenergiesnouvelles.fr/articles/ogst/pdf/2019/01/ogst190118.pdf
The forecast for these researchers has Russian output at 10 Mb/d from 2025 to 2040 with development of existing technology (no technological breakthroughs are assumed) see Figure 6 on page 7 of the paper.
Still waiting for a credible source supporting your point of view.
A long-term outlook on Russian oil industry facing internal and external challenges
And I have posted many others in the past, Dennis. I am sure you know that.
Ron,
Yes you post stuff from news pieces and such, note that your chart shows conventional resources only. Link below shows what the authors expect for future output, the technological case seems more reasonable to me, the baseline case assumes no further technological improvements in Russia. Output remains at about 10 Mbpd from 2025 to 2040.
https://peakoilbarrel.com/eias-december-oil-production-outlooks/#comment-732498
From the conclusion (Section 5 of Html doc and page 8 of pdf):
First and foremost, depletion of the resource base is the most serious challenge for the sustainability of oil industry. As indicated by our assessment, Russia may experience production decline as early as 2025, which means that preventive measures should be taken urgently. There are two courses of action that should be undertaken by oil companies simultaneously. Firstly, much of the vast Russian territory remains scarcely explored, even some of the well-developed oil basins still yield substantial discoveries. Thus, large-scale implementation of state-of-the-art geological surveillance has very good prospects of expanding the resource base. Secondly, as demonstrated by US shale revolution and, previously, Canadian heavy oil boom, the introduction of new extraction technologies can skyrocket production from reserves previously deemed uneconomical or unobtainable. Russia, being among the world’s leaders in estimated unconventional oil resources (Kapustin and Grushevenko, 2018b), needs to utilize this potential by developing the relevant approaches in the shortest time possible. The sanctions became a major setback for this, however. So much so, that we did not account for most of the stranded shelf projects and were very conservative in regards to Bazhen oil in our calculations. This, however, leaves some room for optimism, as if the sanctions are eased or domestic solutions are developed, the actual production potential may actually eclipse our best estimates.
Note the last two sentences, where they imply their estimates may be too conservative.
Yes you post stuff from news pieces and such, note that your chart shows conventional resources only.
Of course I do. And so do you and everyone else on this blog. I also post think tank in depth studies like the link I just posted. The authors of that study are:
Nikita O. Kapustin1* and Dmitry A. Grushevenko1,2
1 The Department of Research of Energy Complex of Russia and the World, The Energy Research Institute of the Russian Academy of Sciences, Nagornaya St., 31, k.2, 117186 Moscow, Russia
2 Center for Energy Markets Studies, The Energy Institute of the Higher School of Economics, Miasnickaya St., 20, 101000 Moscow, Russia
Dennis, that is an in depth study, not a news article. I rest my case.
That being said, we will both find out and I predict we will find out a lot sooner than you think, like in the second half of 2022.
Ron,
I agree that paper is good I also found it at google scholar.
The paper predicts 10 Mbpd from 2025 to 2040. Not a whole lot of decline predicted and they think their estimates may be very conservative.
Dennis, something your 2019 paper never foresaw. This paper was published in June 2021. Bold mine.
World Oil: Regional Report: Russia
Like the rest of us, Russia’s oil and gas industry has been hammered by Covid and the price collapse. But the Bear’s pain, and recovery, is compounded by a pack of uniquely ursine issues.
SNIP
Rosneft may be particularly vulnerable, said Shagina. The company incurred a $2.1-billion loss during first-quarter 2020 and expected a 10% decline in oil output. “Oil cuts and well conservation will be particularly painful for Rosneft, bound by long-term supply obligations under prepayment contracts with China,” she wrote. “Many Russian brownfields are overflooded and after their shutdown, 50% may never resume production, making the decision about which wells to close especially challenging.”
So Rosneft has declining production + long-term supply obligations under prepayment contracts + obligation to supply crude to their Indian Subsidiary ( Essar oil ) and they go and sign a new agreement with IOC ( Indian Oil Corp) for 2million tons per year . What is this ? A swindle ?
https://www.reuters.com/business/energy/russias-rosneft-indian-oil-sign-2022-supply-deal-2021-12-06/
Not really. Russia is a net oil exporter. 2 million tons per year is a pittance. That comes out to be only a little over 40,000 barrels per day. Russia produces almost 11 million barrels per day and consumes less than 3 million barrels per day.
Ron.
There has been discussion here before about shutting down waterfloods.
We operate waterfloods. We unfortunately shut in for about one month when oil went negative.
Now that we have had a year and a half to examine the damage, we feel lost about 2% of our production as a result of shutting in that month. That is not uniform. Some leases we saw no discernible drop. Others were worse. Overall we think we lost about 2%. This is on top of our “normal” decline, which isn’t uniform either.
We have also discussed before why Russia, in the past, has been so reluctant to cut production. One reason being permanent damage to waterflood operations.
I’m speculating, but my guess is Russia stranded someone oil when they shut in waterfloods, similar to USA lower 48 conventional, which hasn’t recovered close to pre-pandemic levels. Some of the lost USA production is likely shortage of labor to return everything that was shut in back into production. Some I suspect is permanent damage to secondary and tertiary production.
Ron,
That is a magazine article, not a peer reviewed paper.
Also from that magazine article
Bazhenov shale oil production is benefiting from new all-Russian technologies that cut 2020 production costs by 20% and increased production by 78% to 100,000 tonnes, says GazpromNeft. The high-profile project, to be completed this year, is examining a range of solutions for producing the Bazhenov formation. Note output is small at 2 kb/d for 2020, but as we saw in the US (circa 2012) tight oil is often underestimated.
In 2010 the Eagle Ford was producing about 25 kb/d and in 2015 it was producing 1500 kb/d, Permian was at 200 kb/d for tight oil in 2010 and was at about 4000 kb/d in 2019.
I doubt Russia can ramp at a similar rate, but I have read the tight oil resource is very large and it is in an oil producing region where the infrastructure may be in place (much like Texas).
Ron,
That is a magazine article, not a peer reviewed paper.
That’s it? That’s how you deny the conclusions from all oil field analyzers? You, of course, never post any link to any article unless it is peer reviewed? I think not.
I have no further reply to that statement Dennis.
If there is future success with oil extraction from the Bazhenov shale, the implications will be huge, since the geologic feature is massive-
from Reuters-
“Bazhenov is estimated to hold more than 1.2 trillion barrels of oil, of which about 75 billion might be recoverable with current technology, making it the biggest potential shale play in the world, according to the U.S. Energy Information Administration (“Technically Recoverable Shale Oil and Shale Gas Resources”, 2013).
To put that in context, Bazhenov contains an estimated 10 times more recoverable oil than the Bakken formation in North Dakota and Montana.
Bazhenov could produce more oil than has so far been extracted from Ghawar – the super-giant field in Saudi Arabia that made the 20th century the age of petroleum.”
to be determined…
Nothing big will happen in Bazhenov . Shale was and is an exclusive US game . Shale got a free piggy back ride on the legacy infrastructure built for conventional oil Bazhenov has to start from square one . Too costly . What is the weather there like ? Will they have to rebuild roads every month ? Manpower ?? Sand ??? From where .
Forget all the above . Shale was / is a ponzi . It is ” burning paper dollars to get access to a low EROEI resource ” basically scrapping the bottom of the barrel . Shale has lost about $ 500 billion . US could do it , it is the reserve currency . If Putin was to attempt the same he will go bankrupt since his Fx reserves are about the same figure .
Overestimated and overhyped resource . Are they planning an IPO on Wall Street ??
🙂
Hole in head,
The weather is quite severe in North Dakota in winter, the Russians know how to handle cold weather.
HinH-
On the Russian Shale, your opinions precede your expertise by a hundred miles, once again.
Nobody here knows how that will play out.
That shale extends south to almost Kazakhstan, btw.
If the world is hungry for oil over the next decades, the money and expertise will be available to make a hard push for recovery of that big resource.
Dennis , having conquered the weather etc the next logical step would be to ask Mr Powell and associates to defekt to Moscow and bring the magical printing machine with him . Success . 🙂
Hicks, I don’t care if the shale formation was from Vladivostok to Calais . What matters is not the size of the tank but the size of the tap . All you can come up is (1) throw money at a problem and it will be solved (2) by a technology somewhere in the future, that is not even on the drawing boards . The IF is getting a bit tired and boring . Borrowing from Mr Steve D’ Angelo’s earlier post :
So… we are going to need a lot more of those “IF” Oil Discoveries to make a difference.
I won’t hold my breath… “IF you don’t mind. 🙂
Some of the comments in this thread are downright comical.
Some data points easily ‘fact checked’ …
Vaca Muerta is arising once again. Government support is ramping up via pipeline build out and ongoing marketing assistance. The frantic importing of LNG this winter has highlighted the absurdity of having some of the biggest shale hydrocarbon resources on the planet and still needing to import same. This is proving to be both financially and politically unsustainable. The production profiles of many Dead Cow gas wells are exceptionally prodigious.
As per Gazprom Neft, the introduction of Russian-made RSS hardware (Rotary Steering Systes) has enabled a huge jump in Bazhenov productivity. Several other American/Canadian innovations are lacking in Russian unconventional development (diversion technology, Extreme Limited Perforation, High Viscosity Friction Reducers are just a few areas where sanctions are impeding Russian progress).
As productivity continues to improve, self reinforcing factors will continue to emerge and enhance the viability of that massive resource.
Although South Australia just okayed the establishment of an FSRU LNG terminal near Adelaide, the output from the Beetaloo Basin may either be liquified and exported out of Darwin or shipped through a yet to be built pipe to south eastern Oz. Whatever marketing approach evolves, the success of Beetaloo development is highly probable at the moment. (Surprisingly, perhaps, American LNG looks to be the cheapest to get to Adelaide and Port Kembla, especially if originating from Energia Costa Azul or Puerto Libertad).
Depending upon the severity of this winter’s travails in the UK, a revisiting of the Bowland and Weald Basins may yet appear. There are several decades of highly recoverable natgas sitting ~8,000 feet beneath the ground there.
None of this even touches upon the other existing and/or nascent ‘shale’ plays in the US like the PRB, the Uinta, the TMS, the Rogersville, and others.
The political and financial dramas will continue to hold sway in these matters … until they don’t.
Hickory wrote:
If the world is hungry for oil over the next decades, the money and expertise will be available to make a hard push for recovery of that big resource.
This could make the situation worse, not better (apart from the disaster for climate change).
Imagine that in a few years Bazhenov produces 5 mbd of crude oil. This will mask the depletion and decline of world conventional oilfields, Just like U.S shale-oil production did (does).
It is one minute before twelve o’clock to get serious about energy transition. Apart from the depletion of conventional oilfields the world is on fire and battered by floods and droughs more than ever before
Han Neumann, the most optimistic forecast for the Bazhenov formation that I have come across is 200,000 barrels per day by 2030. And few people believe in him. The fact is that it is located in a hard-to-reach area. There are no roads, many swamps. You can only drive through in winter. The area of the suite is about 1 million square kilometers. The depth of occurrence is also worse than, say, in Bakene – 2-3 km. The thickness is small, no more than 20-30 meters, and usually less. It will not work to get a lot of taxes from the Russian government from oil production, which means that the topic will develop slowly.
Hole in head,
The exact same thing was said about US tight oil back in 2010. It will make no difference to World output was the claim, which was incorrect.
Perhaps you are making the same mistake with Russian tight oil.
Dennis ,Mr Opritov has given the ground reality of the topography and situation in the Bazhenov and as he points out 200000 bpd by 2030 best estimate . That is a piddle not even enough to wet the beak of an eagle . As I pointed out it is an uneconomically viable project and will bankrupt the Russian Federation . However of course if you are able to persuade Mr Powell and his printing machine to join the party —— 🙂 .
Hole in head,
Often best estimates are incorrect, perhaps the resource will never be developed, it will depend on Russian tax policy and World oil prices, you believe prices will be low ($25/b on 2025 last I heard). This affects your point of view. I believe oil prices are likely to be about 4 times higher than your estimate in 2025, if I am correct it may make development of Russian tight oil profitable.
Dennis,
Regarding your prediction of high (about $ 100/b) oilprices in 2025 it is interesting to see what Mr. Opritov wrote about Bazhenov:
e.g.
The fact is that it is located in a hard-to-reach area. There are no roads, many swamps. You can only drive through in winter. The area of the suite is about 1 million square kilometers.
Not all the facts will change with high oilprices.
While the climate change disasters are worsening I would say: leave the goddamned tight oil where it is and use the billions of dollars needed for this project to develop renewable energy sources. Same for U.S. shale oil. Stop the debt machine
Cheers and Happy New Year to all !
Dennis , this is Tass the Russian state owned media . Only now “hard to recover ” is left . Not my words but of their minister .
https://tass.com/economy/1365623
Hole in head,
I think the deputy energy minister said that in 10 years most of the produced oil will be hard to recover oil.
Almost 100% of our production will be hard to recover over the term of ten years,” the official said.
Denis, I congratulate you and all the authors of pikeoilbarrel Happy New Year! And I wish that all your calculations regarding the forecasts are correct.
Regarding the Bazhenov suite: The Russian government cannot print dollars. Government spending is based on natural rent. Tax revenues serve as a multiplier for other industries. The government is reluctant to distribute tax incentives and for a short period of time with the expectation to start the process, to stimulate investment in the industry. Like cheese in a mousetrap. In the United States, the situation is different, taxes are lower, the infrastructure is developed, technology and skilled labor are more available. The situation is very different. It is expensive to build roads, infrastructure in an area where there are no people and there are no people. But we’ll see.
There are rumors about problems with Vostok Oil, production in Vankor is falling stronger than expected. You shouldn’t trust yet …
Also note that potentially the oil not produced in 2020 and 2021, as forecast in Figure 10 and in figure 17 posted by Ron might be produced later in 2023 to 2027, the resources are there, when they get produced has obviously not followed the Sept 2019 forecast as the pandemic intervened.
Woah, note my post of a few minutes ago where I quoted:
“Many Russian brownfields are overflooded and after their shutdown, 50% may never resume production, making the decision about which wells to close especially challenging.”
A large percentage of the oil not produced during the shutdown will never be produced. And no oil will flow faster just because a well was shut down in the past. Meaning that Russia will likely never reach its pre-covid shutdown.
There seems to be lots of discussion on Russia. I’ve posted this before, but it might be add something:
https://ogst.ifpenergiesnouvelles.fr/articles/ogst/full_html/2019/01/ogst190118/ogst190118.html
The Shift recent report had an estimate of future production based on Rystad data that is lower than either the OIES report or that above (the dotted line is labelled crude, I think that excludes condensate).
I think you are right that the dotted line is crude only because the green area matches exactly what the Minister of Energy says they produced, C+C, in 2019.
The Rustad chart you posted agrees pretty much with the charts on the link you posted because all those are MTOE, Million Tons Oil Equivalent. If you remove NGLs from the chart below it would pretty much agree with your chart out to 2030, but yours falls off much faster after that.
Thanks George,
I had posted that above, the linked article has output at about 10 Mb/d out to 2040 (or about 3650 million barrels per year see figure 6 on page 7, technological case (assumes technology progresses with no breakthrough developments assumed).
Could you check your email ehwn you have a chance? Thanks.
From your link above:
The Russian oil industry has been very successful at managing the natural decline of existing fields using increasingly complex recovery techniques, and the further opportunities to exploit these skills will be discussed in more detail below. However, the success to date can be seen in the performance of six of the country’s largest production companies, all of which are subsidiaries of the Russian oil
majors. Yuganskneftegas, Purneftegas (both Rosneft), Surgutneftegas, Lukoil West Siberia, Noyabrskneftegas (GazpromNeft) and Megionneftegas have demonstrated a combined average rate of decline of 2 per cent per annum over the past decade, compared to a natural decline rate for fields in West Siberia of around 10-15 per cent per annum.
This seems in line with what’s happening in Saudi Arabia.
Yes, that is exactly what is happening in Saudi Arabia. But what most people do not realize is that they are not cheating the natural decline rate. They are only creaming the tops of the reservoirs with horizontal wells. That keeps the decline down to about 2 percent. But when the water hits those horizontal wells it’s all over.
In other words, artificially keeping the decline rate below the natural decline rate ensures that at some point in the future the decline rate will be greater than the natural decline rate. In the end you can’t cheat nature.
What is shocking Frugal, is that some people have problems with such a simple concept.
An excerpt from A. Shpilman’s interview, let me remind you that more than 250 million tons per year were mined in the Khanty-Mansi Autonomous Okrug:
Alexander Shpilman: Khanty-Mansi Autonomous Okrug will be able to maintain daily production at about 600 thousand tons per day for several more years
December 24 / 16:50
Tyumen. The reasons why decarbonization policies around the world are gaining popularity are not based on deep scientific analysis. This conclusion was reached by an expert from the State Reserves Committee and the Oil and Gas Information Agency, director of Shpilman Brothers LLC, Ph.D. D., Honored Geologist of Ugra Alexander Shpilman.
In a conversation with the correspondent of the Oil and Gas Information Agency, Alexander Vladimirovich told what events he will remember the outgoing year:
– There have been many events this year, and first of all they are associated with a pandemic that has swept the whole world. It turned out that everything in this world is interconnected and the new coronavirus infection has affected all areas of our life, all industries, and caused a significant decrease in oil consumption. But OPEC made decisions on time to cut production in many countries. Russia also assumed these obligations and throughout the year complies with the agreements of the countries participating in the cartel. These decisions have stabilized the oil price.
There was a lot of controversy and discussion about how it will be possible to recover, how dangerous it is to reduce production. But further events showed that as the pandemic eased, economies around the world began to recover and oil consumption increased. Smooth and steady growth of oil production started. For example, in the Khanty-Mansi Autonomous Okrug, it rose from 508 to 616 thousand tons per day. On an annualized basis, this is 225 million tons, an almost pre-pandemic level. I think this is the level that the district will be able to keep for several more years. Perhaps, other OPEC decisions will be made and production will grow even more. Or it may happen that it will have to be reduced. It will have to be, the point is not that the resource base has dried up in Ugra and enterprises can no longer extract. This year we produced not as much as we want, but a certain amount, observing the terms of the agreements with OPEC.
The data on oil production of the Bazhenov formation in the Khanty-Mansi Autonomous Okrug became a gratifying event in the industry. She’s growing! In November, at a conference in Khanty-Mansiysk, it was reported that the production of Bazhenov oil in 2020 left more than 800 thousand tons. In the near future we will reach one million tons of Bazhenov oil production. If we manage to grow to 10 million tonnes per year by 2030, that will be a great achievement!
This year, decarbonization, reducing carbon dioxide emissions and reducing the use of hydrocarbon raw materials were widely discussed in the world and in Russia. It seems to me that these issues are largely politicized and there is no deep scientific analysis behind them. Is the temperature on earth really increasing due to the release of CO2 or temperature changes are these natural processes that we, geologists, knew about from the institute? The temperature on earth changes all the time: from tropical heat to ice age at the same point. At the same time, in the geological past, there was no industry on earth, and the temperature changed significantly. Perhaps now is just a period when the earth is getting warmer and this is a natural anomaly, and not an industrial impact. Since there are no exact scientific calculations, I believe that all these talks about decarbonization are politicized issues with the aim of refusing developed Western countries from hydrocarbon raw materials. I understand this desire to switch to electric cars, the cities are really heavily polluted. But how to implement this on long-distance routes of freight transport, sea vessels, how to ensure the safety of nature for a huge number of batteries? There is also a big question with the possibility of replacing natural gas when generating electricity. So far, solar panels and wind energy do not cover even 10% of the volumes that are produced by burning gas. And biofuels are firewood and alcohol. It is strange that humanity wants to return to this. I think that in the near future natural gas will be in demand in the same volume as today, and maybe even more. This should be counted on when forecasting the development of the oil and gas industry.
Wow.
Is climate denial a widespread thing in Russia?
Nick G A little bit wrong. I didn’t notice that anyone would deny warming, it is objectively present. Only idiots can deny. But I noticed that in Russia there is a consolidated opinion that it is impossible to influence warming. And also that warming is replaced by a cold snap. And of course I believe that the anthropogenic factor strongly influences the warming.
I’m glad to hear that you believe that the anthropogenic factor is primary. I’m sad to hear that in Russia there is a consolidated opinion that it is not.
By the way, when I (and many people) refer to climate denial, they’re referring to the idea that the anthropogenic factor is not primary. The idea that warming exists but that it’s not due to human activity is simply the latest version of the general idea that we can keep on burning fossil fuels with no basic changes.
“The idea that warming exists but that it’s not due to human activity is simply the latest version of the general idea that we can keep on burning fossil fuels with no basic changes.”
—-
Nick G. Unfortunately, in our world, if any country refuses to burn hydrocarbons, it will lose its competitive advantage. And if everyone refuses to burn the world GDP, the consumption of everything will decrease greatly, there will be a lot of hunger. Because of this, I do not hope for a voluntary refusal. .But I think we have already burned about half of the available resources. The life of our children and grandchildren will be worse than we saw.
Alexander,
These are two variations on climate denial. They are not realistic.
Unfortunately, in our world, if any country refuses to burn hydrocarbons, it will lose its competitive advantage.
Wind and solar are rapidly have become cheaper than fossil fuels or nuclear in most countries, and they are continuing to become cheaper still. Countries that do not invest in them will be left behind.
if everyone refuses to burn the world GDP, the consumption of everything will decrease greatly, there will be a lot of hunger.
The idea here is that only fossil fuels can support a modern civilization and lifestyle. This is completely unrealistic. Renewables, of course, have difficulties that must and can be solved. But so do fossil fuels, and those difficulties are far more expensive to solve, and in the end depletion cannot be cured.
This can, of course, be the start of a very long and involved discussion, which we may want to take over to the non-oil side of the blog. But I thought it was important to start the discussion.
Putin controls the press and makes his money selling fossil fuel.
”Perhaps now is just a period when the earth is getting warmer and this is a natural anomaly, and not an industrial impact.” You are like a child who wants to continue believing in Santa Claus. By now insolation is decreasing at high northern latitude due to a decrease of obliquity and shifting of the Earth orbit position at which the winter is occuring in northern hemisphere from perihelion to aphelion. This is reflected in both polar areas by a decrease of temperatures in these areas since 2000 years, not taking into account the recent and anomalous temperature rise. Second, you are mentionning the fact that temperatures changed in past. That’s true. For example, between the last glaciation and the Holocene, there are 7°C of difference. This temperature rise occured during 10000 years, which makes 0,07°C/century. Now we are at 1°C/50 years : this changement has nothing to do with a natural variation but has to do with the increase of carbon dioxide concentrations in the atmosphere even if it is not the only game changer in the equation. About scientific calculations I suggest you to check this post of realclimate : they confront old projections of global temperature with observations. What scientists calculated with relatively simple models during the 1970s is perfectly consistent with the observations. Third, I don’t know if you noticed it on this blog, but there are now oil production difficulties all over the planet. Given the omnipresence of oil in our societies, this translates into increasing difficulties in producing, transporting, getting around, etc. And the corollary is that we have to quickly learn to live without oil. Put simply, if not for the climate, Mad Max is in the broom wagon. https://www.realclimate.org/index.php/archives/2021/10/a-nobel-pursuit/
Jean-François FleuryI am not an expert in this area and I quoted A. Shpilman’s opinion in my interview, although I am interested in the topic.
“For example, there is a 7 ° C difference between the last glaciation and the Holocene. This increase in temperature took place over 10,000 years, which is 0.07 ° C / century.”
—-
Probably you are mistaken. I read that large changes in temperature occurred over 1-3 centuries. For a more weighty argument, you could give a longer segment, for example, 100,000 years, then the temperature would change, not by 0.07 ° C, but by 0.007 Even 8000 years ago there was a glacier in Europe, and 5000 years ago mammoths lived on Wrangel Island.
Yes, I agree with you that the anthropogenic factor influences the warming. But after the oil and coal run out, this factor will weaken. I believe that humanity will burn and extract all the hydrocarbons that it can. Thus, today’s consumption restriction will only prolong that period. which we will extract them for several decades …
Yes, I noticed. And I welcome this movement. At the same time, in addition to running out of oil, other important resources are also running out, for example, coking coal, on the extraction of which steel production depends. In general, high-energy coal, including coking coal, is less Legnite and it is mined already from depths of 500 meters.
I am not mistaken. I am speaking of the transition between Last Glacial Maximum and present interglacial climate. I am not talking about the transitions between stadials and interstadials occurring during ice ages which are due to the crossing of thresholds in the operating regime of thermohaline in the North Atlantic along surface salinity changes. This figure is extracted from M. B. Osman et al. Nature 2021, 599, 239.
coking coal, on the extraction of which steel production depends.
Coal isn’t necessary for steel production. It seems convenient and cheap, until you account for its pollution.
To oversimplify things, iron smelting is basically taking iron oxide and stripping off the oxygen. This is called “reduction”. It can be done with charcoal, or coal. In theory it could be done electrolytically, like aluminium. When coal is phased out It probably will be done with hydrogen produced from renewable power sources. Here’s an example:
A pioneering pilot project in Lulea, Sweden, designed to produce “fossil-free” steel has successfully completed test production of sponge iron, demonstrating it is possible to use hydrogen made with fossil-free power to reduce iron ore, instead of coal and coke.
Swedish energy company Vattenfall, mining company LKAB, and steel manufacturer SSAB—companies that are collaborating under the joint initiative, dubbed “HYBRIT”—hailed the achievement as a technological breakthrough that “is a decisive step on the road to fossil-free steel.”
“Production has been continuous and of good quality,” the companies announced on June 21. “Around 100 tonnes have been made so far.”
HYBRIT’s process emulates another already existing, though less common, process called “direct reduction.” Most direct reduction processes use natural gas to replace coke as the main reductant to produce a solid “sponge” iron. HYBRIT’s process essentially uses hydrogen gas as the main reductant instead of natural gas.
However, HYBRIT’s partners say their pilot plant’s principal goal is to eliminate carbon dioxide emissions from the steelmaking process by using only fossil-free feedstock and fossil-free energy in all parts of the value chain. Steelmaking, the companies noted, currently generates about 7% of total global carbon dioxide emissions. Through HYBRIT—and with backing from the Swedish Energy Agency—SSAB, LKAB, and Vattenfall intend to create “the most efficient value chain from the mine to steel, with the aim of being first to market, in 2026, with fossil-free steel at an industrial scale,” they said.
The companies said the first industrial-scale production demonstration facility is already in planning in Gällivare, Sweden. At that facility, LKAB will explore converting its entire production to sponge iron. SSAB, which said it will be ready to deliver “minor quantities of steel made using hydrogen-based reduction to customers,” as early as this year, expects that in 2026, it will “deliver fossil-free steel at a large scale.”
https://www.powermag.com/world-first-test-production-of-fossil-free-hydrogen-reduced-sponge-iron-completed/
Nick G ” In theory it could be done electrolytically, like aluminium. ”
Well , in theory my bank balance is bigger than Musk, Bezos and Gates combined . Also in theory it is possible to do deep sea mining for precious metals , don’t see anyone in a rush to charter ships . Having put the BS theory in the toilet . My next question ? At what price ? $ 1million per tonne ? No one ever talks about price ?? Tks .
Nick G, we lost a good manager to Hybrit a while ago, I hope he will get the job done. We´ve been looking into many H2 projects recently, I hope some will work out.
HiH,
A simple direct electrolytic process appears to be not quite as convenient as using an intermediate like H2. H2 produced electrolytically from surplus renewable power is likely to be cheap, as wind and solar will be substantially overbuilt (just like fossil fuel power is overbuilt now), so the surplus power will be cheap.
So cheap iron doesn’t need coal.
———————————-
It’s worth mentioning that in a mature steel industry, like in the US, there’s not much iron smelting: almost all steel is recycled using electrical furnaces.
HiH, direct reduction with H2 works quite well, so it´s just a matter of scale, The plentiful sources of green energy in the far north of sweden has attracted quite a lot of investments from central europe and beyond, but we are not paid nearely enough for it.
So we might just cut it off : )
Jean-François Fleury, Sorry that I cannot answer you on the post. A lot of work, I cannot find material now that large temperature changes (both warming and cooling) occurred in the interval up to 300 years, and not 10,000. Throughout my life (63 years), I noticed a very strong warming in my area, the city of Volgorad (Stalingrad).
Nick G, you are mistaken about the prospects for green energy. The extraction of hydrocarbons in many cases is highly marginal. Electricity produced from hydrocarbons, I think, is much cheaper.
Because:
in fact, as of today (tomorrow everything will change), say the price of gas includes taxes, excess profits of owners and speculators, without these components the price would be much lower.
In addition, the electricity produced by gas power plants is often used as a flexible one, that is, they are switched on during peak loads, and the stations are always in a “hot standby” state. This additionally increases the price. Because electricity consumption is highly variable depending on the time of day and time of year.
As for the production of iron, it is produced in the cheapest way. How can this be seen from the iron manufacturers.
Nick G , Laplander . So first ratchet your green technology to commercial scale and then we will talk . After 30 years the world is still waiting for fusion to become reality . On to what I said in my post “My next question ? At what price ? $ 1million per tonne ? No one ever talks about price ?? Tks .
Both of you side stepped this . No answer.
Nick G —
It’s true that a lot less coal is needed that currently used to make steel out of iron ore, but keep in mind that steel isn’t just iron, it contains about a half percent carbon by weight, depending on the type of steel.
The Export Land Model has arrived in Mexico. It will very likely soon spread around the world.
Mexico plans to end oil exports in 2023 to reach self-sufficiency
Mexico plans to end crude oil exports in 2023 as part of a strategy by the nationalist government of Andres Manuel Lopez Obrador to reach self-sufficiency in the domestic fuels market.
Petroleos Mexicanos, the Mexican state-owned producer known as Pemex, will reduce crude oil exports to 435,000 barrels a day in 2022 before phasing out sales to clients abroad the following year, Chief Executive Officer Octavio Romero said during a press conference in Mexico City on Tuesday.
The move is part of a drive by Lopez Obrador to expand Mexico’s domestic production of fuels instead of sending its oil abroad while it imports costly refined products, like gasoline and diesel. Mexico currently buys the bulk of the fuels it consumes from U.S. refineries.
If fulfilled, Pemex’s pledge will mark the withdrawal from the international oil market by one of its most prominent players of the past decades. At its peak in 2004, Pemex exported almost 1.9 million barrels a day to refineries from the Japan to India, and was a participant in meetings by the Organization of Petroleum Exporting Countries as observer.
Last month, the Mexican company sold abroad slightly more than one million daily barrels, according to Pemex data.
To the best of my knowledge, Pemex exports heavy oil and mostly to the US. The US is going to face a heavy oil import shortage soon. They imported heavy oil primarily from Venezuela, Canada and Mexico. Now Venezuela is not producing much because of sanctions. Canada – the pipeline wasn’t approved by the democrats. And now Mexico, will stop exporting crude.
The Americans need to find more sources of heavy oil to import otherwise they will have to export an even larger proportion of the shale oil they are producing because their ability to refine it will go down on account of a lack of heavy oil to blend it with. I still think shale oil will increase as a % of American production over the next 2-3 years. It will be interesting to see the impact on shale oil prices (differential vs wti) as well as the wti-brent differential.
Ancient Archer
There is plenty of pipeline capacity to ship Canadian crude to the US.
On October 1, 2021, the updated Enbridge Line 3 pipeline began operating to deliver crude to Superior Wisconsin. The new line delivers more crude and is safer since it replaces a 50 year old pipeline.
While line 3 has gained much of the current attention in the press, Marathon has been quietly reversing the Capline pipeline. This can almost be considered to be a Keystone XL replacement.
According to this source (link below), Capline was the largest south-to-north flowing pipeline in the United States with a capacity of 1.2 million barrels of oil per day, but owner Marathon Petroleum has been working to reverse the flow since 2017, which would allow both heavy and light oil to flow from a storage hub in the U.S. Midwest to a major refining centre on the Gulf Coast. The company website notes that the reversal will be completed this year.
To use the Capline, Canadian oil producers will need to ship their crude on Enbridge Inc.’s Mainline pipeline system to the U.S. Midwest, and then switch to the Enbridge’s Southern Access pipeline connected to the Patoka oil storage hub, which provides direct access to the Capline and a straight shot to the refineries of the U.S. Gulf Coast.
“Jeff: That piece is something that people ask about all the time. Why is it that a 1+mn b/d line going north is only gonna run about 100,000 b/d going south?
Chris: Yeah. Yeah, well, it’s a good question, and it is a pretty staggering statistic there, kind of one-tenth of the capacity, but it really has to do with the number of operational pump stations that Capline’s operators have decided to put in place to support demand, contracted demand on that line. So when Capline was operating in its original northbound mode, it had 16 pump stations running. At the moment, only 3 of those 16 pump stations had been configured to support the southbound service. Capline said that it wasn’t feasible to reconfigure more of those pump stations based on shipper commitments that it got during an open season that it held for a reverse Capline capacity as well as the costs needed to do that work.” From second look below.
https://financialpost.com/commodities/energy/oil-gas/canadian-oil-producers-eye-new-pipeline-route-to-gulf-coast-as-marathon-reverses-capline-conduit
https://www.argusmedia.com/en/blog/2021/december/1/podcast-the-crude-report-pipeline-capacity-goes-from-famine-to-feast
Ron Thanks.
Some of the oil will still go to Mexican owned refineries recently purchased near Houston. Excerpt from the article you linked:
The export reduction will come as Pemex increases its domestic crude processing, which will reach 1.51 million barrels a day in 2022 and 2 million daily barrels in 2023, Romero said. The Mexican driller will plow all of its production into its six refineries, including a facility under construction in the southeastern state of Tabasco and another one being bought near Houston, Texas. This plant is considered part of Mexico’s refining system even if located across the U.S. border.
“to reach self-sufficiency”…
That is a creative and palatable way to present the idea that the country no longer has enough production to allow for exportation.
This is a non-event. Mexican net oil exports have been near zero lately, and when you account for the dollar value of crude vs oil products it’s been zero.
This is simply a statement that they want to stop importing oil products, and refine things themselves.
Gas prices could reach $4/gallon by Memorial Day: GasBuddy
We’ll see if this prediction comes true. Americans really don’t like $4.00/gallon gas.
that was true in 2012 which was the last time gas was $4/gal
In the 10 years since then (since we are talking about 2022 Memorial Day) reported CPI has averaged 2%. That itself, takes the $4 per gallon to $5 per gallon.
I am paying £1.50/litre for petrol in the UK which is $2/litre i.e. $7.5 per gallon. The average income in the US is much more than in the UK. I don’t see why the Americans can’t pay $10 per gallon for gas if needed.
“I don’t see why the Americans can’t pay $10 per gallon for gas if needed”
I speak as one, and believe that the US would get use to living with that pricing if it had too.
Not as if other choices will be offered in the event of oil depletion.
But big prices are much easier to digest if they happen slowly.
Americans have lots of optional or discretionary petrol consumption that would be scaled back heavily.
And there would be a strong push towards more energy efficient vehicles, etc, [even among the voting block that has had severe disdain for the EV sector up to now].
Of course all of this will be much harder on poor workers, like everything else.
It will take a long time for the ripple effects to pass through the economy as certain sectors undergo severe contraction.
One way or another, people will be learning all about kilowatt hours.
note- i am not predicting $10 gas. These effects i mention will be well underway at pricing above $5/gallon. We are close to that in Calif and Hawai’i now.
all of this will be much harder on poor workers, like everything else.
It’s worth keeping in mind that most fuel consumption is by the affluent. The bottom 20% by income mostly can’t afford cars, and use urban mass transit. The next 20% drive smaller cars, on average. There are certainly a lot of rural working poor and middle income who drive stupidly big and inefficient pickups and SUVs. If gas prices rise they’ll probably refuse to buy efficient and reasonably priced vehicles like the Corolla, Prius-C or Chevy Bolt and instead wait for electric Mustangs or Hummers…
An even bigger problem in America is the poorly designed transportation system and city planning that requires you to drive long distances to perform even simple functions like buying a loaf of bread.
Hickory —
Of course all of this will be much harder on poor workers
Cheap energy is a piss poor form of welfare that mostly just encourages waste. Is is practiced in some of the world’s most mismanaged countries, but has no place in a developed country.
If you are worried about the poor, focus on health care, food stamps and the minimum wage. If you want to fix transportation, public transportation biking and better zoning are the solution.
For example, it is a common practice in American cities to build strip malls for businesses that expect to pay minimum wages without providing sidewalks or bike lanes for employees to access those businesses without wasting money on cars and gas. This should be banned at the federal level.
But at least there will be a gas station nearby, owned by somebody, for their conveniance…
Long term bonds are getting near 2%. So money for shale will get more expensive and limited, as do stock buybacks on credit. Let’s see if this continues.
10 year has a ways to go to get to 2%. If yields rise some in high yield corporate credit there will be no shortage of buyers of that debt. There will actually more demand.
As long as corporate USA can make the payment. Money will absolutely be available to them. Shale may be the exception if pension funds aren’t investing in fossil fuels.
Shale Drillers Face Record Cost Pressures as Banks Shun Sector
Bloomberg: Oil drillers in the biggest U.S. fields are shouldering record costs at the same time that some banks are increasingly reluctant to loan money to the sector, according to the Federal Reserve Bank of Dallas.
Equipment, leasing and other input costs for oil explorers and the contractors they hire surged to an all-time high during the current quarter, the Dallas Fed said in a report released on Wednesday. Drillers also are seeing the universe of willing lenders shrink in the Eleventh Federal Reserve District that includes Texas and parts of Louisiana and New Mexico.
https://www.bloomberg.com/news/articles/2021-12-29/shale-drillers-facing-record-cost-pressure-as-banks-shun-sector
Well, by GOSH… this is most certainly a SHOCKER out from LEFT FIELD because who would have THUNK?? Can you imagine a rising oil price has impacted the Costs to produce Shale Oil? What does that mean for the MEGA FUTURE PROFITS??
Again… this news must have blindsided the market because no one ever considered RISING COSTS BEFORE. 🙂
steve
Steve,
Costs only a bit above 2018 costs, and if we adjust for inflation possibly no change.
“Alexander Gavrilyuk: Gas production in Yamal in 2021 is expected to reach 610 billion cubic meters.
December 29 / 09:35
Salekhard. The general situation in the Yamal oil and gas industry in 2021 is assessed as stable. The Oil and Gas Information Agency was informed about this by Alexander Gavrilyuk, First Deputy Director of the Department of Natural Resources Regulation, Forest Relations and Development of the Oil and Gas Complex of the Yamalo-Nenets Autonomous Okrug.
As of November 1, gas production in the Okrug increased by 12.6% compared to 10 months of 2020 and amounted to 558.8 billion cubic meters. m. The volume of condensate extraction increased by 16.2% – up to 25.1 million tons. The level of oil production by Yamal enterprises grew by 0.7% – up to 33.1 million tons.
The expected production in 2021 according to the current plans of subsoil users will be: gas – 610 billion cubic meters. m, condensate – 27 million tons, oil – 36 million tons.
“Taking into account the general tendency for outstripping gas and condensate production, the overall situation in the fuel and energy complex is assessed as stable. At the same time, the results of production in 2021 by fuel and energy companies will be assessed in the next 2022, ”explained Alexander Gavrilyuk.
In 2022, hydrocarbon production in Yamal will grow slightly. Thus, oil production is expected to grow by two million tons – up to 38 million tons, by four million tons in condensate – up to 31 million tons. Gas production will remain at the 2021 level – 610 billion cubic meters. m. ”
—
I would like to note that the total natural gas production in Russia in 2021 will amount to 740 billion m3. The increase compared to last year is 6.1%, from 2019 – 0.3%. 205 billion m3 will be exported. Thus, more than 82% of all gas is produced in Yamal. It is believed that it will be possible to maintain the same level of gas production in Yamal for about 10 years.
More:
-Production of Russian oil in 2021 is expected to be 517 million tons, 2.25% more than last year, but 7.7% less than in 2019.
-The first stage of the Vostok Oil project provides for the construction of a main oil pipeline (770 km), a loading terminal, power generation facilities, and shift camps. Oil transportation is planned along the Northern Sea Route in both directions, west and east. The capacity of the first stage of oil production is 30 million tons / year, it is planned to increase it up to 100 million tons / year by 2030. (I doubt the figure of 100, only the state of reserves assessment worries me. Oil resources are declared in the amount of 5-6 billion tons, however, the proven reserves are an order of magnitude less, however, intensive exploration continues there, the situation should clear up within 1-2 years.
Since russian gas is so unapreciated and lambasted in europe I would suggest a shut down of all exports, at least westward, for a year or so, that would be really interesting to see from several viewpoints. And sell the oil to the highest bidder, e.g. china or other emerging/expanding countries, with real value “currency” or preferably goods in return
Edit, to clarify, there are several parallells to Russia, as regarded by some western parts of the world, and northern sweden, as regarded by Stockholm et al.
In essence, in their view, a source of commodities inhabited by people of less value.
For every complex problem there is an answer that is clear, simple, and wrong.
— H L Mencken
“Since russian gas is so unapreciated and lambasted in europe I would suggest a shut down of all exports, at least westward, for a year or so, that would be really interesting to see from several viewpoints.”
—
The level of consumption in Russia does not correspond to the level of development of the economy. In fact, it is parasitic on the extraction of minerals. It happened. The gap appeared after the collapse of the USSR, many technologies were lost (albeit outdated), supply chains were broken, access of Russian goods to world markets and Western technologies were limited. sanctions …
The closure of Western markets for Russian energy resources will lead to unpredictable consequences, but I believe the existing elite group will remain in power, consumption will certainly fall. The propaganda will explain this by “intrigues of the West.”
Cost pressure . Shale needs much , much higher prices .
https://www.bnnbloomberg.ca/shale-drillers-face-record-cost-pressures-as-banks-shun-sector-1.1701248
“Shale needs much , much higher prices ”
If the market (global demand) wants the product, they will bring the money.
There is plenty of money in the world.
People will pay very high prices for energy,
since the alternative is a threat to existence.
Not complicated.
The percent of global GDP spent on oil and gas production/consumption is low, with plenty of room for growth. Shortage will change spending priorities.
As I’ve pointed out before, we are entering a phase where much more money (in real terms) will be devoted to energy production- of all sorts. And on more efficient mechanisms of energy use.
The shift to higher spending will not happen smoothly or in a timely manner.
But it will happen.
We will see what money can buy.
A repeat from my earlier post . Money (currency) is not the problem . Value and affordability is .
“our infinitely more critical problem can be summed up in 12 words:
We don’t have an energy problem
Our problem is paying for it . ”
Yes, if you can’t pay for it ,then you can’t have it . Energy poverty .
Speak for yourself
The global middle class, for example, has grown from about 500 million in year 2000
to over 1.7 Billion in twenty years.
Even in a very poor country like India, the purchase and consumption of energy has more than doubled in the past 20 years.
There is more cumulative money/purchasing power available to go after energy production than ever before.
The problem will not be demand- it will be supply limitation.
Hicks , POD is in play . The former rich are the new middle class , the middle class is the poor class and the poor class is now the destitute class . 850 million living on a free handout of 5 Kg of wheat /rice per month . Wake up . The facts .
https://www.reuters.com/article/health-coronavirus-india-survey-idUSKBN2BA1UI
https://economictimes.indiatimes.com/news/economy/indicators/one-year-of-covid-pushed-230-million-indians-into-poverty-azim-premji-university/articleshow/82408369.cms
I agree with you on “The problem will not be demand- it will be supply limitation. ”
The suppliers will be bankrupt because of low prices ,natural decline , natural depletion , geology and physics . All in one .
Hicks , this is for your attention . The video is of poor women breaking down the wooden poles used for hoardings at a recent ruling party election rally . They say they will use the wood for cooking since they cannot now afford to buy the LPG gas cylinder priced at $13.50 . This is POD . Energy poverty = real poverty .If you can’t pay for it , you can’t have it .
https://www.youtube.com/watch?v=sUwS4BgLvzE&ab_channel=TheFreePressJournal
Is it DUC’S or is it ducks ? Houston , we have a problem .
https://www.oilystuffblog.com/forum/forum-stuff/_duck
Hole in head,
Thanks, another great article by Mr Shellman.
We get an estimate for plug and abandon costs of $212 thousand per well from his 25 billion cost for 118000 wells, that is a figure I have been looking for. In my scenarios, I use $500 thousand per well for plug and abandon cost in the Permian basin which is more than 2 times that estimate.
The low DUC count will simply mean that the rig count will need to increase enough to keep the DUC inventory stable or completion rate would need to decrease.
As to prices going down next year, there are many different opinions on this, I think oil prices are likely to increase, but I never get oil prices right.
Russian deputy prime minister Alexander Novak has already started making excuses as to why Russia will not increase production in the near future.
Russia: Oil cartel will resist pressure to boost production
Russian deputy prime minister Alexander Novak said on Wednesday (29 December) OPEC+ would not comply with requests from China and the United States to increase the production of oil.
In an interview with the sate-owned RBC media, Novak said the request did not fit in his long-term vision, pointing out that mining companies “need to understand in advance what investments to plan in order to ensure production increases.”
“We cannot constantly provide fluctuations in production,” he said.
Translation: We can’t increase production so we won’t. 😁
Russian oil production failing to meet quotas
Per the OPEC+ oil production agreement, Russia’s oil quota for December stands at 10,018kb/d, up ~100kb/d from the November quota of 9,913kb/d.
However, per Reuters sources, Russian production is likely to remain flat MoM in December, suggesting the oil powerhouse is unable to increase production from existing spare capacity.
Mike’s article was excellent and spot on. We would not have had production growth in the Permian without the “Duck” completions and every other Shale basin in the U.S. is in decline. Daniel Yergin just came out and predicted growth of US production will be 1,000,000 barrels of oil per day in 2022 because of the higher prices and massive profits being made in the Shale Industry. While he and other experts continue to believe it is “business as usual” in the oil & gas industry, we are experiencing delays due to lack of equipment and qualified personnel and services. The costs on our last two wells were 26.2% over AFE all due to increased costs across the Board. Additionally, there are fewer lenders willing to lend to the sector due to ESG concerns.
I have no clue about product prices and my predictions have been wrong over the past 7 years. However, the price of oil in 2014 was over $100 per barrel and companies were relatively healthy. If you take into account inflation over that period of time, product prices are still very low compared to 2014. This industry is still not economically healthy domestically speaking (GOM not included) and quality locations are diminishing. I don’t see an uptick in drilling rigs mainly because we do not have that many well capitalized companies left in the drilling sector and money is not flowing back in…..yet.
If the drilling rig count doesn’t rise substantially, I do not anticipate the growth rate of production to mimic 2021.
it will be interesting to see what our discussion will look like at the end of 2022. With that segue, I wish all of you a very Healthy, Happy and Prosperous 2022.
Thanks LTO Survivor.
Enno Peters estimates about 1.3 wells can be drilled per horizontal oil rig operating each month in the Permian basin on average. For week ending Dec 23, 2021 there were 276 horizontal oil rigs turning in the Permian basin (Baker Hughes data). Multiply by 1.3 and we get 359 horizontal wells per month if the rig count does not increase or decrease in the future. In my Permian scenarios I assume about 400 wells per month are completed until June 2022, so the horizontal oil rig count would need to increase by 31 to allow this many wells to be completed and keep DUC inventory stable. In the past 3 months (Sept 24, 2021 to Dec 23. 2021) the horizontal oil rig count in the Permian basin has increased by 36 rigs from 240 to 276, if that continues then producers may be able to increase Permian output by 300 kb/d in 2022.
In Mike’s blog post it states that there are about 254 DUCs that are not already WIP in the Permian. If horizontal oil rigs remained at 276 the DUCs would run out in 6 months time. Alternatively if the horizontal oil rig count increased at half the monthly rate of the past 3 months (6 rigs per month) until June. In that case the DUC count stabilizes at about 110, if rig count and completion rate remain constant from June 2022 to Dec 2022.
I too wish everyone a happy new year, I kind of hope Dennis is right, but I´m afraid he might not be…(btw, blended scotch is not the same as Islay single malts, but quite OK, in my view)
Be well!
Edit, and as Totoneila said, ages ago, hug your bag of NPK!
Happy New Year
The EIA posted US October production one day early. Production has rebounded by 651 kb/d from the effects of Hurricane Ida to 11,473 kb/d. Of the 651 kb/d, 680 kb/d came from the GOM. What does that tell you? The red marker is the MER expectation for November.
The STEO had expected output in October to rebound to 11,387 kb/d, short by 86 kb/d.
I expect to post the full US report in about 48 hrs, New Year celebrations permitting.
I wish all of our participants a Happy, Healthy and Prosperous New Year
Ovi,
I do not know if you visit the monthly ‘914’ report from the EIA. (October’s report was released a few hours ago).
I was prompted to review the output from specific formations, particularly the Wolfcamp and Niobrara-Codell.
That site might provide more granular data for those of you who crunch the numbers.
Coffeeguyzz
Thanks
I do go there to get the LTO report around the 20th of the month and is what is published above in the LTO report. The info for the US update comes from
https://www.eia.gov/dnav/pet/pet_crd_crpdn_adc_mbblpd_m.htm
That site back corrects the US data for three months.
Dear Ovi, also for you a Happy, Healthy and Prosperous New Year from this quite long time reader.
Are our glasses half full (Dennis) or half empty (Ron)? We’ll probably know better in the coming months and years. Meanwhile, I wish you all plenty of beer, Whisky and Champaign, the health to stomach it and the friends to share it and all the other good things I can imagine!
Westexasfanclub
Thanks for your wishes.
Hopefully in six moths the air will clear and we will be able to see further into the future oil world. This month’s numbers look ominous.
Ovi,
What the future will bring is never clear except to the clairvoyent. In 6 months we will likely say that things will be clearer 6 months in the future.
Dennis
Agreed. However, on this blog I think we have a few Oil Clairvoyants.
Ovi,
Happy new year and thanks for all you do for us at peakoilbarrel. I misused clairvoyant, thinking it meant someone who could see the future, it is sometimes used in this sense, but is a misuse of the term. In any case, I do not think anyone can foretell future events, but am sure I cannot.
Dennis
Clairvoyant: a person who claims to have a supernatural ability to perceive events in the future or beyond normal sensory contact.
Sounds about right to me that we have a few of them on this site.
I knew a Claire Voyant as a young man,, tried to hit on her and she said “fat chance”. She was right!
Happy New Year!!
From another blog . Interesting .
I work in the oil fields of northern Alberta for one of the companies. I have a sniffle and a cough so work demanded I don’t show up until that goes away.
I am sitting at home working remotely and the email comes through that we have to shave over 25% off of our maintenance budget. No concern about what the maintenance deficit is currently, what is getting passed over and run on hope instead of strategy… nope. Shave 25% off. This is at $77.00 a barrel WTI.
Regardless of what the proclaimed costs are to extract heavy bitumen from sand and the affirmation that it is profitable it is being cut to the bone like a resource with no future. You can’t run the nuts off of everything and expect it to perform in the future. This whole thing makes no sense unless you know that the adventure is not actually profitable.
Horizontal oil rig count count for Permian basin for week ending Dec 31, 2021 was 276 the same as week ending Dec 2, 2021.
At 1.3 wells per rig this level of rigs would allow 359 horizontal oil wells to be drilled in January, if this level of operating rigs is maintained over the next 4 weeks. My Permian scenarios have 403 wells completed each month from Dec 2021 to June 2022, so if the rig count remains stable and my scenario is correct (low probability) we would see the DUC count decrease by 44 each month from Jan to June 2022, a total decrease of 264 over 6 months.
“Brussels wants to recognize nuclear power and forms of natural gas as “green” activity as part of a landmark EU classification scheme to help financial markets decide what counts as a sustainable investment.
In long-awaited plans, the European Commission has paved the way for investment in new nuclear power plants for at least the next two decades and natural gas for at least a decade, under a green labeling system known as the “taxonomy for sustainable finance”.
Oh good, that solves a lot of problems.
I guess Hole in Head standing out on the sidewalk with a sign in the rain made a big impact.
Thanks Hicks for recognizing my contribution . 😉 . The dumbkoffs in Brussels are busy shuffling the chairs while the Titanic sinks . Beyond redemption .
A new US oil production thread has been posted.
https://peakoilbarrel.com/us-october-oil-production-rebounds-after-hurricane-ida/
A new Open Thread Non-Petroleum has been posted.
https://peakoilbarrel.com/open-thread-non-petroleum-12/