By Ovi
The focus of this post is an overview of World oil production along with a more detailed review of the top 11 Non-OPEC oil producing countries. OPEC production is covered in a separate post.
Below are a number of Crude plus Condensate (C + C) production charts, usually shortened to “oil”, for the oil producing countries. The charts are created from data provided by the EIA’s International Energy Statistics and are updated to May 2025. This is the latest and most detailed/complete World oil production information available. Information from other sources such as OPEC, the STEO and country specific sites such as Brazil, Norway, Mexico, Argentina and China is used to provide a short term outlook.

The World’s May oil production decreased by 6 kb/d to 83,305 kb/d, green graph.
This chart also projects World C + C production out to December 2026. It uses the September 2025 STEO report along with the International Energy Statistics to make the projection. Production in June is projected to increase by 812 kb/d to 84,117 kb/d.
For December 2026, production is projected to be 84,685 b/d, slightly higher than November 2018. Also in November 2025, production is expected to exceed 85,000 kb/d. Will November 2025 be the World’s New Peak Oil date?

May’s World oil output without the US increased by 12 kb/d to 69,858 kb/d. June’s production is expected to increase by 679 kb/d to 70,537 kb/d.
The STEO is forecasting that December 2026 crude output will be 71,496 kb/d, 62 kb/d higher than projected last month. Note that the December 2026 output is 1,190 kb/d lower than the November 2018 peak of 72,686 kb/d. In other words the world W/O the US will continue to produce less oil in late 2026 than in November 2018.
World oil production W/O the U.S. from June 2025 to December 2026 is forecast to increase by a total of 959 kb/d.
A Different Perspective on World Oil Production

May’s Big 3 oil production increased by 139 kb/d to 32,576 kb/d. Production in May was 1,434 kb/d lower than the September 2022 post pandemic high of 34,010 kb/d. OPEC started increasing production in April 2025 and will continue doing so up to December 2026 so the 1,434 kb/d drop should get smaller.

Production in the Remaining countries had been slowly increasing since the September 2020 low of 42,970 kb/d to December 2023. Production began increasing again in October 2025 but dropped in April and May to 50,729 kb/d, a drop of 489 kb/d.
Countries Expected to Grow Oil Production

This chart was first posted a number of months back and shows the combined oil production from five Non-OPEC countries, Argentina, Brazil, Canada, Guyana and the U.S., whose oil production is expected to grow. These five countries are often cited by OPEC and the IEA for being capable of meeting the increasing World oil demand for next year. For these five countries, production from April 2020 to August 2024 rose at an average rate of 1,199 kb/d/year as shown by the orange OLS line.
To show the impact of US growth over the past 5 years, U.S. production was removed from the five countries and that graph is shown in red. The production growth slope for the remaining four countries has been reduced by 687 kb/d/yr to 512 kb/d/yr.
May production has been added to the five growers chart, down by 307 kb/d to 23,000 kb/d. For the Five growers W/O U.S., April production dropped to 9,512 kb/d, down 331 kb/d from April.
The OLS lines have not been updated and will not be updated going forward unless additional production data provides a strong indication that production is rising/changing significantly. However looking out to July, production from Brazil will rise by 200 kb/d (See Brazil chart below). Combining this with an expected rebound from Canada and rising production from Argentina, new highs from these five can be expected.
World Oil Countries Ranked by Production

Above are listed the World’s 13th largest oil producing countries. In May 2025 these 13 countries produced 78.6% of the World’s oil. On a MoM basis, production decreased by 108 kb/d in these 13 countries while on a YOY basis production rose by 998 kb/d.
April Non-OPEC Oil Production Charts

May’s Non-OPEC oil production decreased by 429 kb/d to 53,447 kb/d. June is expected to add an additional 235 kb/d to 53,682 kb/d.
Using data from the September 2025 STEO, a projection for Non-OPEC oil output was made for the period June 2025 to December 2026. (Red graph). Output is expected to reach 54,848 kb/d in December 2026.
From June 2025 to December 2026, oil production in Non-OPEC countries is expected to increase by 1,166 kb/d.

May’s Non-OPEC W/O US oil production decreased by 411 kb/d to 40,001 kb/d. June’s production is projected to add 101 kb/d to 40,102 kb/d.
From June 2025 to December 2026, production in Non-OPEC countries W/O the U.S. is expected to increase by 1,556 to 41,658 kb/d kb/d.
The STEO also projects production from Non-OPEC countries will rise by 1,513 kb/d between June and November 2025. Contributors are expected to be Canada, Guyana, Norway, Russia and Angola. I think the Russia and Angola estimates are optimistic.
Non-OPEC Oil Countries Ranked by Production

Listed above are the World’s 11 largest Non-OPEC producers. The original criteria for inclusion in the table was that all of the countries produced more than 1,000 kb/d. Oman has recently fallen below 1,000 kb/d.
May’s MoM production decreased by 473 kb/d to 44,616 kb/d for these eleven Non-OPEC countries while as a whole the Non-OPEC countries saw a yearly production increase of 1,049 kb/d to 53,447 kb/d.
In May 2025, these 11 countries produced 83.5% of all Non-OPEC oil.
Non-OPEC Country’s Oil Production Charts

Angola’s May production dropped 40 kb/d to 1,005 kb/d. Since early 2022 Angola’s production settled into a plateau phase between 1,100 kb/d and 1,200 kb/d. However December to May production brought a drop below the lower plateau.
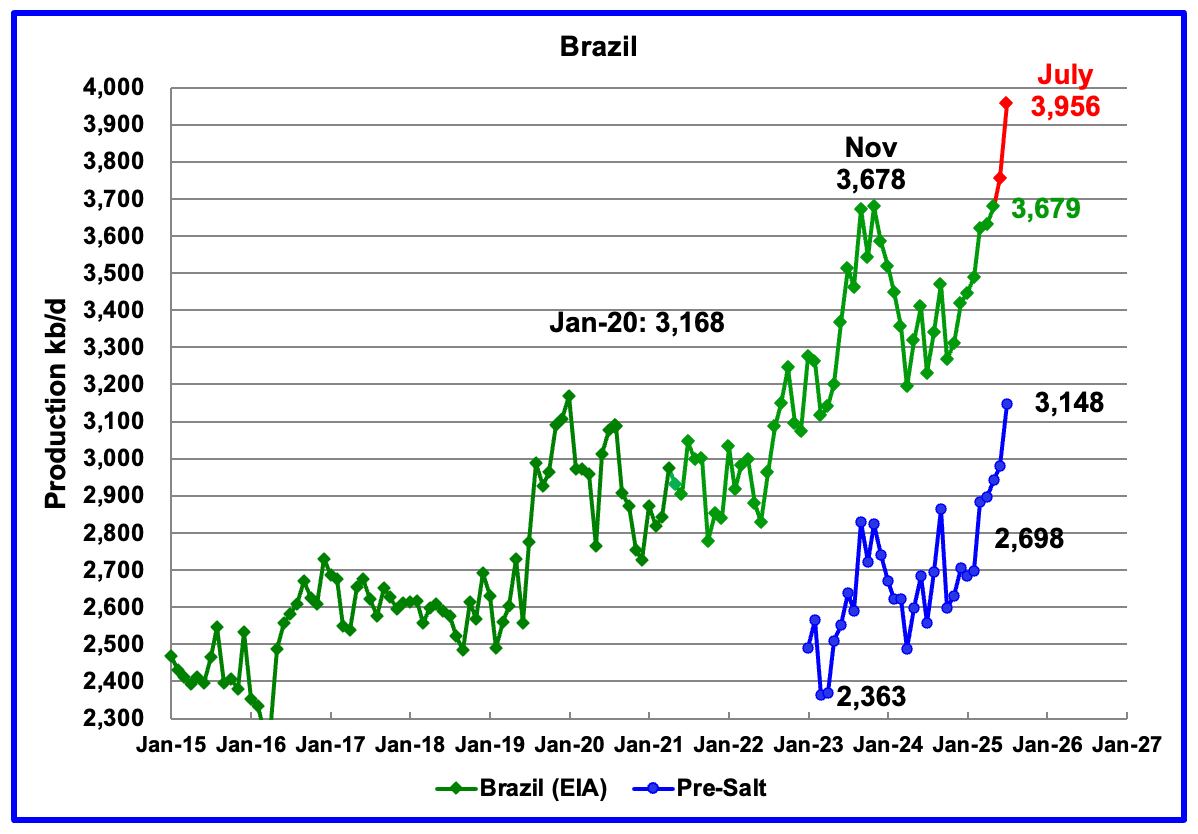
The EIA reported that Brazil’s May production increased by 47 kb/d to 3,679 kb/d.
Brazil’s National Petroleum Association (BNPA) reported that production increased by a combined 277 kb/d in May and June to 3,956 kb/d, a new high. The pre-salt graph tracks Brazil’s trend in the blue graph. Pre-salt production increased by 167 kb/d in July to 3,148 kb/d, also a new high.
The new highs can be related to the addition of the two new floating platforms. The September 2025 OPEC report states 2025 pil project start-ups are expected at the Buzios, Bacalhau (x-Carcara), Wahoo and Lapa (Carioca) fields. It should be noted, however, that production timelines may be affected by operational challenges, risk management supervisions and unexpected disruptions in some platforms.
The September OPEC report states July crude production was driven by strong production from recently started projects.

Canada’s production decreased by 419 kb/d in May to 4,420 kb/d. The production drop in April and May was affected by coker turnarounds at two of Canada’s biggest oil sands producers.

The EIA reported China’s May oil output rose by 40 kb/d to 4,350 kb/d.
The China National Bureau of Statistics reported June production rose to 4,428 kb/d and then dropped in July to 4,268 kb/d.
On a YoY basis, China’s May production increased by 76 kb/d from 4,274 kb/d.

According to the EIA, Kazakhstan’s oil output decreased by 58 kb/d in May to 2,021 kb/d.
Kazakhstan’s recent pre-salt crude oil production, as reported by Argus, was added to the chart. In October 2024 pre-salt crude production dropped by 120 kb/d to a low 1,340 kb/d. Since then production to June 2025 has risen by 464 kb/d. The production ramp up starting in January 2025 is due to a New Field coming online. Note this is crude production whereas the EIA’s numbers are C + C. S & P Global Platts reports that July production was essentially flat.

According to the EIA, Mexico’s May output rose by 8 kb/d to 1,726 kb/d.
In June 2024, Pemex issued a new and modified oil production report for Heavy, Light and Extra Light oil. It is shown in blue in the chart and it appears that Mexico is not reporting condensate production when compared to the EIA report.
In earlier EIA reports, they would add close to 55 kb/d of condensate to the Pemex’s “Total Liquids” report. More recently, the EIA has been adding 90 kb/d of condensate to Mexican production. For June and July production, 90 kb/d have been added to estimate Mexico’s June and July C + C production, red markers. July production is estimated to be close to 1,738 kb/d. Note that Mexico’s production for the last five months has stopped dropping and has stabilized at slightly more than 1,600 kb/d according to Pemex.
According to this Article, Mexico pivots towards fracking to lift Pemex oil and gas production.
“MEXICO CITY, Aug 7 (Reuters) – Mexico is planning to increase the use of hydraulic fracturing to tap unconventional hydrocarbon deposits and boost oil and gas production after years of declining output, marking a shift in its stance on what some say is a highly polluting practice.

The EIA reported Norway’s May’s production dropped by 45 kb/d to 1,795 kb/d.
Separately, the Norway Petroleum Directorate (NPD) reported that June’s production dropped by 115 kb/d and July rebounded by 286 kb/d to 1,966 kb/d, a post pandemic new high, red markers.
The Norway Petroleum Directorship reported that June’s oil production was 8.2 % above forecast.
According to the July OPEC MOMR: “Production at the Johan Castberg FPSO, the main driver of crude oil production growth this year, reached peak capacity of 220 tb/d in late June, according to operator Equinor. This ramp-up took less than three months from project start-up.”

Oman’s production rose very consistently since the low of May 2020. However production began to drop in November 2022. According to the EIA, May’s output rose by 5 kb/d to 991 kb/d and appears to be stabilizing in the 980 kb/d to 1,000 kb/d range.

The EIA had been reporting flat output of 1,322 kb/d for Qatar since early 2022. However the EIA revised down all of the previous production data up to April 2024. Qatar’s May output was again reported to be 1,322 kb/d.

The EIA reported Russia’s May 2025 C + C production decreased by 35 kb/d to 9,818 kb/d and was down 88 kb/d from May 2024.
Using data from Argus Media reports, Russian crude production is shown in the blue graph. For June 2025, Argus reported Russian crude production was 9,020 kb/d. Adding 8% to Argus’ June crude production provides a C + C production estimate of 9,742 kb/d for Russia, which is a proxy for the Pre-War Russian Ministry estimate, red markers.
According to the Argus report, Russia’s June target production as stated by OPEC + was 9,160 kb/d, which is 140 kb/d higher than the actual production of 9,020 kb/d.
According to this Article, Russia’s Crude Output Was below OPEC+ target in August.
The nation pumped 9.175 million barrels a day last month, according to people who saw the data and asked for anonymity as the information isn’t public. That’s an increase from July, but about 84,000 barrels a day below the country’s quota for August including compensation cuts, Bloomberg calculations show.
OPEC published an updated compensation schedule on Monday, with Russia pledging to reduce its output in August by 85,000 barrels a day below its target of 9.344 million barrels a day. That brings required production to 9.259 million barrels a day. This required production is 239 kb/d higher than June 2025 production of 9,020 kb/d.

This US production chart up to June 2025 is the same as the one published last week in the US update post. However the STEO portions of the two graphs have been updated using the September 2025 STEO.
July production has been increased by close to 100 kb/d for both the US total along with the Onshore L48.
Production in December 2026 is expected to be 13,190 kb/d, 32 kb/d higher than shown in last week’s US update. Production peaks in December 2025 and then begins a slow decline. Note production in the Onshore L48 drops steadily after August 2025.
79 responses to “May World and Non-OPEC Oil Production”
Ovi
One or two months of production is not that important as various factors in many countries can coincide to increase or drop production.
What is more important is a 12 month moving average which gives a better broader view of what is going on. This last 12 months has seen the global refinery throughput at its highest ever exceeding 2018 by a fraction.
Global inventories are also increasing at 1.7 million barrels per day, while in 2018 they declined significantly.
https://www.eia.gov/outlooks/steo/report/global_oil.php
All in all we already are at a new peak of global oil production
Iver
I agree that the 12 month average is a more meaningful measure/way to assess when peak oil occurred. Regardless it is still interesting to know when it occurred within those twelve months. Also look at all of the good discussion we have had since November 2018.
Looking back to a June 2020 MOMR, it shows World refinery crude throughput of 82.92 Mb/d in 3Q-19. The current September MOMR shows throughput of 82.51 Mb/d in 3Q-25. Very close.
This has to be earth shaking news. I haven’t been following this list for about a week, so if this is old news I apologize. Bold mine
Toyota just unveiled an aluminum-ion battery that could change everything. A 1,000-mile range. Full recharge in 5 minutes. Fireproof, non-toxic, and built without lithium or cobalt. At a quiet event in Tokyo, Toyota revealed a breakthrough that stunned Tesla, BYD, and the entire EV industry. This new chemistry isn’t just faster and safer—it could reshape global energy, collapse lithium markets, and threaten oil itself. From affordable EVs to home storage and even aviation, aluminum-ion may be the future no one expected. Watch as we explore how this silent announcement became the spark of an energy revolution already underway.
This is a 13.5 minute video.
Toyota’s 1,000-Mile Battery Just Ended Lithium.
Ron, big picture, I will believe it when I see it commercially.
0. I think you are in the wrong thread…this is the oil and gas room.
1. Any new sizzle-y announcement on alternate chemistries for fuel cells, batteries, or solar cells should be met with skepticism. I’ve been seeing these flashy announcements from university PR departments for years since the late 90s. And changes in chemistry have been very minimal.
Look at solar cells…the base material is still polycrystalline Si, despite all the hype about complex chalcogenides. The same is true for nuclear fission…I have been hearing gush since the 1970s and Jerry Pournelle pop science articles about the promise of pebble-bed or thorium or the like. And there has been no commercial uptake. Read Hyman Rickover’s criticism of “Paper Reactors” from the early 1950s for some perspective on the incessant hype of new fission plant designs. (Fusion is of course even worse silliness.)
Just keep your hand on your wallet and don’t kick Lucy’s football. It’s wonderful for research on new materials and devices to be done…but you should be ultra ultra ultra skeptical. Not come rushing in, like a sucker, with a gee whiz announcement. Show me, show me, show me!
2. That video is cringe in terms of the hype versus analysis. I would be skeptical of even a more sober/analytical video. But when you add on the rah rah silliness from the video, it ups my already skepticism even higher. Very clickbait, low analysis video.
3. Al3+ charge carrier batteries have been an idea for at least 15 years (probably much longer). See the (quite old) Wikipedia article on them. This is not a completely new idea in any way. If Toyota has gotten them to finally work commercially (not a concept, not a one-off short lifespan lab curiosity), than we need to see that. But not some gushy silliness about how “people were amazed in the room”.
0. I think you are in the wrong thread…this is the oil and gas room.
Anon, I thought about that but then the article says “It could reshape global energy, collapse lithium markets, and threaten oil itself. ”
I would say this has one hell of a lot to do with oil and this is the right thread. I have been pessimistic about EVs from day one. But this changes everything. ” And you should not be so quick as to dismiss it. There are at least a dozen YouTube videos now on the subject. Many calling it an end To Tesla.
I am going out on a limb and saying this is the rea thingl. Again: This changes everything.
Hi Ron,
The video sounds like hype. Type in “Toyota Aluminum Solid state battery” at link below
https://chatgpt.com/
Toyota is working on Lithium solid state batteries, but there is no reliable source stating they are working on Aluminum solid state batteries. (You tube videos are looking for clicks, much of what you find there is a waste of time).
Dennis, you may be correct. I got this from Google AI:
Toyota is developing both solid-state and aluminum-ion batteries, but the recent announcements about 1,000-mile range and 5-minute charging times primarily refer to the solid-state battery technology, not aluminum-ion. The solid-state battery uses a solid electrolyte for increased safety and faster charging, potentially leading to greater range and faster charging times than current lithium-ion batteries, with mass production targeted around 2027-2028.
What the hell do they mean by “solid state”. I thought the lirhium-ion was solid state.
Ron, to be concise-
“A solid-state battery uses a solid electrolyte, unlike the liquid or gel electrolyte found in a standard lithium-ion battery. This fundamental difference means that solid-state batteries can offer significant advantages in terms of safety, energy density, and longevity, but they also face serious challenges with cost and manufacturing”
As of now there are no cars for sale that have solid state batteries, yet.
When it comes to batteries and nuc fission SMR’s/fusion, etc. as Anonym…says its a good rule to thumb to ‘believe it when you see it’ deployed on the market.
Ron,
Many batteries have a liquid electrolyte for moving ions from one pole to another. Solid state electrolyte is a “Holy Grail” in battery development. It also decreases the cost of batteries significantly.
Ron
Somewhere back in the late 80s I cooperated with the research department of an Aluminum company to develop an aluminum air battery. Don’t recall all of the details but the Aluminum essentially rusted and in the process produced electricity. When it was rusted out, the block of aluminum was replaced.
The hearing aid batteries I use today use the same idea except they are zinc air batteries and produce 1.45 volts.
I think the biggest recent news is CATL’s announcement that they are beginning mass production of sodium ion batteries. They are less energy dense than lithium batteries, maybe half as energy dense, but they can be used in small short range vehicles. This is the kind of vehicle that dominates the huge population dense cities of Asia. Also energy density matters much less for grid storage.
The story is that CATL is saying they can cut prices by 90% compared to current lithium batteries, bringing the storage price down to about $10 per KWh.
https://carnewschina.com/2025/09/08/catls-naxtra-sodium-ion-passes-new-national-safety-standards-ready-for-mass-production/
CATL is by far the world’s largest producer of batteries.
World C plus C centered 12 month average (CTMA) with projection using EIA data and EIA STEO which starts in Jan 2025. The old peak in 2018 is shown on chart (82962 kb/d) and the month it is surpassed (March 2025@83046 kb/d) and peak month (for projection through July 2026) in Feb 2026 at 84994 kb/d. I use a different methodology than Ovi, my scenario has a peak monthly rate in Nov 2025 at 85374 kb/d (not shown on chart).
Chart can be clicked for larger view.
world cplusc 2509
Wait…when did this happen? Ron/Darwin is already wrong about the 2018 peak call? (Like he was about the 2015 peak call?)
It’s probably your fault, Dennis, for being too lukewarm about peak oil. If you had been more of a doomer, we might have kept the 2018 peak.
DC
Thanks nice to see a chart of the data.
Do you think C and C will reach 85
Dennis
The graph was about 3-4 times larger than I expected without me doing anything. Nowadays I actually turn up my browser to 150-200% due to my 50+ age bracket. Still, it was too big in that post.
Iver,
It might if there is enough demand, I am a bit skeptical of the EIA’s scenario from the most recent (September 11) STEO, I am just reporting on my estimate based on an assumption that the scenario is correct. My confidence in the correctness of that assumption is about 1 in 4 and when we add in my confidence in another assumption made to estimate World C+C (based on crude only scenario and the assumption that condensate output increases at the rate of the past 60 months over the next 19 months) the confidence falls to 1 in 10. My best guess (maybe 1 in 2 odds) is a peak of around 84 Mb/d in 2027 or 2028.
Also the STEO scenario does not make sense at the Oil prices they are forecasting ($68/b in 2025 and $51/b in 2026 for average annual Brent oil prices). For both of these scenarios (C plus C output and oil price) to be correct the odds go way down to 1 in 100.
Kolbeinth,
Do you mean the chart in the comments? Try refreshing your page perhaps.
84593 Mb/d for November 2018 according to EIA. This is actual and not a moving average.
Dennis
Yes, the chart in the comments. The graph is actually about 4 times larger than I would expect. So when you said you could expand the graph if you wanted… Something is wrong. I will inform you if everything is ok.
I always see your charts too big also. If you click on it, it gets normal sized.
Action is the same (click). But it’s to correct too bigness, not too smallness.
Kolbeinth,
Sorry, I just checked in Chrome and I see what you mean, will try to address. I use firefox and it is working ok there. Same problem in Microsoft Edge.
Problem fixed sort of, now only link to images.
Here is the EIA STEO scenaro for monthly data which was used for the CTMA chart presented earlier. Output was 83305 kb/d in May 2025, the 19 points to the right are the forecast using EIA data and the Sept STEO.
worldccmonthly2509
Actually, being fair to Ron, just noticed you are using centered average and including projected volumes. My bad, I just missed that. Doh.
What does the trailing 12 months average look like? Ron still safe on that?
Trailing 12 month average for World C plus C, with peak and current level shown on chart.
worldccTTM
Dennis
My November 2025 peak is 85,381 kb/d, 7 kb/d higher than yours. Somehow my method can squeeze more oil out of the ground than yours. 🤣🤣🤣
Hi Ovi,
Your method may be better, but it is interesting to compare different approaches.
I subtract US from the World total and find the condensate produced by subtracting crude estimate in STEO from C plus C in EIA international data. Then I extrapolate the trend from June 2020 to May 2025 (60 months) and then add this to the crude forecast in the STEO for World minus US, then US output and forecast are added back to get a World total. It is interesting that they match so well, what is the 2026 annual average for World C plus C using your method?
Dennis
I was not saying my method was better than yours. I just said that my model can squeeze more oil out of the ground than yours as if our models can do anything about squeezing more oil out of the ground, followed by laughing emojis.
Attached is a moving 12 mth CMA. The numbers are the same but plotted at a different time.
For my forward projection I just use a trailing 6 mth average in the charts posted at the top.
Also I do not believe we will get to the November high as I noted in the post.
A World
Ovi can you check your last chart, it seems there may be a typo, did you mean 82367 for the CTMA for Dec 2024?
Thanks Ovi. I wasn’t familiar with ‘Coker Turnaround’-
“A coker turnaround is a planned, scheduled shutdown of a petroleum refinery’s delayed coker unit for extensive maintenance, inspections, repairs, and upgrades to ensure continued safe and efficient operation. These turnarounds are essential for maintaining equipment, addressing wear and tear, and often involve replacing major components like coke drums, occurring roughly every two to five years. The process is complex, requiring specialized contractors and significant logistical planning, with durations ranging from weeks to several months”
Hickory
Coker represents a very energy intensive crack down of hydrocarbons for heavier oils to be useful. It leads to more diesel and more common fuels. Unfortunately, a lot of this crack down leads to a lot more in comparison of gas at the pump, and natural gas in all its forms – since it cracks down the hydrocarbon chain lenght (mabye a bit too much if you like diesel).
This kind of energy at work (coker) would require a lot of maintenance – more than your car.
All in the ballpark crude oil (25-40 api) new plays, without too much deficiencies in content, will be fast tracked if large enough due to refinery economcis.
The coker puts out a fair amount of coke, mostly liquids, and a small amount of gases. The liquids are mostly in the diesel/kerosene (gasoils) range. Not that much in the gasoline (naphtha range).
Overall, it’s a mix. But on average, you are taking low value resids (bottom of the barrel from distillation, super long chain, used to be sold for bunker fuel, but too dirty now) and breaking it down to increase your sales of middle distillates (mostly diesel/kerosene, some gasoline). It’s a mix of course. But still worth it (otherwise people wouldn’t build cokers). Note that the output of coker still needs further processing in the rest of the plant. (Just like the cuts from the distillation tower need further processing and/or mixing.
AI view on percentage yields:
The typical product breakdown from a delayed coker, based on the residual oil feedstock, is approximately:
*Petroleum coke: 20–30% by weight. The exact yield depends on the feedstock’s properties, with a higher Conradson Carbon Residue (CCR) resulting in more coke.
*Total liquid products: 50–70% by weight. This category includes naphtha, light gas oil, and heavy gas oil.
*Gas: 7–9% by weight.
Detailed breakdown of products:
Solids: Petroleum coke:
This is the main solid product, a porous, carbon-rich material. Its exact composition varies, but a typical breakdown for green (raw) coke is:
Fixed carbon: 80–95%
Volatile matter: 5–15%
Moisture: 0.5–10%
Metals: Trace amounts of metals like nickel and vanadium
Liquids: Naphtha and gas oils
The gaseous product vapors that boil out of the coking drums are separated and condensed in a fractionator. The breakdown of these liquids can vary depending on operating conditions, but an example is:
*Coker naphtha: ~11–15%
*Light gas oil (LGO): ~23–28% (boiling range of ~360–650°F)
*Heavy gas oil (HGO): ~21–38% (boiling above 650°F) [needs further cracking]
Gases:
This is the lightest product stream, containing the lowest-molecular-weight hydrocarbon gases, such as propane and butane.
Nony
You are mostly right when it comes to the gas contents coming out of heavy oils. It is all about the crude oil assays and what they can provide. And in the end profitabiliy foremost.
I actually am a proponent of AI usage in the oil/gas industry, because I see the results as of now. What is next – nobody knows; I would rather have shot at AI keeping up oil supply than relying on Artic oil/gas as the next frontier.
Hickory
In 2015 a company known as Canadian Oil Sands, subsequently bought by Suncor, used to report the volume of bitumen it mined and the Synthetic Crude oil (SCO) it produced. In the first six months of 2015 it mined 299 kb/d of bitumen and produced 250 kb/d of SCO. They had piles of coke around their plant. At one point a company tried to process some of the coke to extract either tungsten or titanium. I recall it started with a T.
Here is a link to the Coker replacement at Suncor. Coker 3 cost $8.3 B to build in early 2000.
https://www.suncor.com/en-ca/news-and-stories/our-stories/upgraded-upgrader-suncor-successfully-completes-replacement-of-eight-coke-drums-at-base-plant
Continental Resources doing exploration drilling in the deeper Williston basin:
https://archive.is/pOk3e
This is not a rah rah post to say it will ever amount to anything. It’s exploration…very low success rate. Still interesting to keep track of.
This is a known formation from at least the 80s. Not like found something new in the ground. But just seeing if all the learning from drilling the Bakken might convey over to a new formation. Probably a lot of the old exploration was vertical wells.
Only gas 151MCF/day reported, as it is marine shale sourced, maturity too high probably.
They should try just drilling the upper and lower Bakken shale which was not targeted before because of the high TOC means no production following preshale convention — like shale can not produce.
In the Petro mainstream, the coventional wisdom or sacred rule is still there — you can not produce from real shale, i.e. thick (>5ft) 100% shale with high TOC (>5%) . Yet, in WV/OHIO limited laterals landing in the 25ft thick all shale with TOC>10% are great super rich wet gas and condensate laterals — better off Eagle Ford and Delaware.
Before, there is a covention that shale oil has to be light, i.e. API>35,GOR>500scf/bbl to produce. This is now broken, with Vaca Muerta topping API25 and GOR<200scf/bbl being the best off Delaware. Lots of the operators were scared to even let public know their low API&GOR number, it is like being ridiculous like Nick Steinsberg who did watre fracking in shale.
Surprised that when I mentioned US GOM deep water Wilcox could have hypersaline — it actually got easier responses. Rules are there to be broken.
Blog post at Novi at link below
https://novilabs.com/blog/is-us-shale-really-running-out-of-steam/
They predict a plateau in tight oil output at current price level. Their analysis seems a bit on the optimistic side. If the STEO forecast for oil and natural gas prices is correct, I think we will see a lower completion rate and gradually falling tight oil output in the US.
EIA may be a bit influenced low, from using their own price deck. Which is much lower than the futures strip. So, maybe they’d be more similar to Novi, if you used the market price expectations.
Also, Novi has been pretty reasonable in terms of talking about how (slow) geology worsening is winning out against the (even slower) technology improvement. There was a nice podcast they did talking about it.
They see a plateau, with a slow (very slow) decline. Probably right. Even if it makes the “hoping, dreaming it drops off a cliff” peak oilers disappointed.
You all know you loved those Ace predictions at TOD. Loved the Verwimp model. Hate Dennis for being “not peak oiler enough”, even though his history would show he was too peak oiler, rather than not enough.,
Nony,
My very early forecast from July 2012 used a URR of 2800 Gb, but the high scenario was not bad.
I now use a model with URR of about 3000 Gb which is similar to Rystad resource estimates.
see link below and tab with oilshknewsm4
https://docs.google.com/spreadsheets/d/1BsDCkGQyCnCYbVNCPaEDu-OMngosda3U/edit?usp=sharing&ouid=105320434049434900507&rtpof=true&sd=true
Peak for the 2800 Gb high case was 2021 at 86 Mb/d. Chart with EIA data up to 2024 (at the time I did the model I had data only through 2010.)
old shock2012
Another scenario for Permian from Dec 2018 with current data for the Permian added from EIA. At the time the medium scenario was my best guess, though I did not foresee at that time the pandemic from 2020 to 2021. I also believed that oil prices might rebound to over $80/b which mostly has not occurred except with the invasion of Ukraine in 2022.
permian1812c
Actually read the head post itself.
1. I think the increase in STEO is expected, based on just history. Point I made on previous thread validated.
2. (Not criticism, gentle reaction) I would prefer to see the 11 countries or whatever, in “size order” vice alphabetical order.
Understand your point of view,
But don’t be surprised about the frenzy about producer countries currently from 12 to 150+ worldwide in the future. A lot of oil stranded in Africa and landlocked Asia for example.
Look at OPEC data
Nony
The two tables are listed by volume production. Note the huge gap between #3 SA and Canada.
Rig Report for the Week Ending September 12
The rig count drop that started in early April when 450 rigs were operating was unchanged this week.
– US Hz oil rigs were unchanged at 367, down 83 since April 2025 when it was 450. The rig count is down 18.5% since April.
– New Mexico rigs dropped by 1 to 79 while Texas added 2 to 189.
– Texas Permian dropped 1 to 150. Midland and Martin were unchanged at 20 and 17 respectively. Ward dropped 1 to 4.
– In New Mexico Eddy added 1 to 34 while Lea dropped 2 to 45.
– Eagle Ford added 4 to 33. Dimmit added 3 to 5 and Karnes added 2 to 5. Atascosa dropped 3 to 3. Since Karnes and Atascosa are adjacent, maybe their rigs were moved to Karnes.
– NG Hz rigs rose by 1 to 104.
A Rig
Frac Spread Report for the Week Ending September 12
“Things are getting curiouser and curiouser”: Lewis Carroll, Alice in Wonderland.
“Frac count is getting curiouser and curiouser”: Unknown
The frac spread count rose by 5 to 169. It is also down 61 from one year ago and down by 46 spreads since March 28.
A Frac
Ovi,
The chart has 164 so I double checked at
https://www.aogr.com/web-exclusives/us-frac-spread-count/2025
your numbers in the text are correct, you may want to update the chart. Perhaps rename most recent chart to frac250911 or something.
Dennis
Thanks. Corrected Chart
At one point I realized it was not updated. Not sure what happened after that.
A frac
Refinery throughput for 2018 was 81mb/d
https://www.opec.org/assets/assetdb/momr-february-2019.pdf
According to The IEA refinery throughput for August 2025 was 85.1 mb/d. A record.
https://www.iea.org/reports/oil-market-report-september-2025
The highest rate of throughput is coupled with increasing inventories.
When I predicted a couple of years ago that 2018 would be exceeded by 2025 Ron said, “No F***king way.”
Iver,
Different agencies often count things differently, so comparing OPEC to IEA refinery throughput tells us little. Also the numbers from OPEC are often revised so you want to look at Feb 2021, not Feb 2019 for the latest revision for 2018 refinery throughput which was 81.56 Mbpd. In Feb 2022 the World refinery throughput for 2019 was also revised to 81.56 Mb/d. The September 2025 MOMR has the most recent 4 quarters at an average of 81.52 Mb/d so not quite reaching the previous peak, but very close on the demand side. On the supply side we remain less than the previous peak in 2018/2019 for 12 month average C plus C output, based on EIA data. I expect we will see a new output peak by the end of 2027.
DC
Count things differently?
In what way?
Is this not correct
https://iea.blob.core.windows.net/assets/73f2c636-5dab-4a15-a165-5990939fa561/November_2018_OMR.pdf
Iver,
The numbers are often revised, in Sept 2019 the IEA estimated 2018 global refinery throughput at 82.2 Mb/d, see page 28 at link below
https://iea.blob.core.windows.net/assets/5ddad21a-84ca-4ffe-9fa3-9de7a0e9e99f/September_2019_OMR.pdf
For October 2020 Oil Market Report from IEA global refinery throughput in 2019 was 81.7 Mbpd.
https://www.iea.org/reports/oil-market-report-october-2020
Some agencies may include NGL, others crude only and others perhaps C+C as the input to the refinery. so numbers reported by IEA may be different than the OPEC or EIA estimates.
EIA data is several months behind perhaps that makes it more accurate.
I am sure once they have all this year data it will show a new global high.
Iver,
Possible, especially if OPEC increases output as much as they claim. If prices continue to fall due to increasing stock levels, OPEC might change plans and a new peak might not be reached for the 2025 Global average for C plus C output.
A bit off topic but responding to a thread in last week’s update:
As was stated, coal has traditionally been used for baseload electricity generation — running at a constant output 24/7. However modern plants have been made much more flexible (and efficient).
The trick is to prepare the fuel in advance. Modern plants use waste heat from electricity generation to dry the coal. This little trick turns out to provide a significant efficiency boost. Then they grind it into a fine powder. This powder is stored in silos on site. In this form it can be mixed with air and blown into the boiler to allow a quick ramp up of power output.
The technology was developed in Germany around the year 2000. For example the Datteln 4 unit can react quickly to increased demand, increasing output by 55 MW per minute. The system is now heavily used in new Chinese coal fired power plants, which are often being used as peaker plants.
Thanks. Cool to learn. I would assume that you have to run the plant at less than 100 and just ramp up/down. I.e. not on/off. (I) think there’s a fair amount of startup/shutdown, associated with a steam plant. Gas turbines and diesel generators can be very fast on/off (even air started, emergency generators).
P.s. I live in the past. Still driving a stick. (It’s getting harder and harder to find pay phones, though!) Damn these kids…get off my lawn!
Possibly of interest:
Tomorrow, there’s a Novi Labs webinar on Permian outlook (exhaustion of Tier 1, price points required to grow, etc.) I think you have to pre-register. You might need a corporate email, but give it a shot either way.
https://novilabs.com/events/webinar-permian-staying-power-inventory-now-and-through-the-2040s/
More information on the petrol demand side of the ledger-
It looks like global ICE car sales peaked in 2018.
Of course it will be a slow decline in the ICE global fleet on the road.
Hopefully the petrol availability for ICE vehicles can be extended successfully without a severe shortfall as more and more electric vehicles are deployed.
Electric-car-sales-growing-fossil-fuel-car-sales-declining-chart-scaled
https://iea.blob.core.windows.net/assets/0edbecab-acf7-4701-bcb4-3fa9927787fa/TheImplicationsofOilandGasFieldDeclineRates.pdf
IEA on oil and gas depletion and decline rates
This is a sobering report and most people who read these pages are well aware of what the numbers are. Interestingly US secretary energy threatened to pull USA out of IEA if they keep concentrating on the green transition and not on fossil fuels, as they remain the primary energy source in the world
Thanks for the report. Very interesting.
This report is very similar to the one published by HSBC Bank in September 2016, with similar decline rates for post-peak fields. Interestingly nearly 90% of investments go to existing fields, with extensions, tie-backs, in-fill drilling and such. The report mistakenly states that
“Filling the remaining supply gap to maintain today’s production through to 2050 would require annual discoveries of 10 billion barrels of oil and around 1 000 bcm of natural gas. These amounts are just above what has been discovered annually in recent years.”
Well, the actual numbers over the last two years have been 5 billion barrels for discovery, or two months consumption. This is not just above, but much lower.
Nine years have passed and the industry has been able to keep up with this kind of investment, but I at least think that we have come to the end of the road here. I am sure many on this site thinks similarly, as the data posted by Ovi and DC shows.
Thanks Seppo, an excellent report.
Dr Korpela,
I agree with your assessment.
Seppo,
Thank you for the link, very interesting analysis.
Regarding supergiant fields like Ghawar, you’d assume at least some people in Aramco would know whether the end of road is near.
My 2 cents is, when the supergiant fields start their terminal decline, regardless of the lower decline rate, it will pose a tremendous challenge to the global economy.
Here is what copilot ai says about peak oil supply.
What the latest forecasts say
IEA (Oil 2025 report) — Projects global oil supply will keep growing into the late 2020s, driven by U.S. shale, Brazil’s deepwater, and Middle East capacity expansions. However, growth slows sharply after 2030 as mature fields decline and new project pipelines thin out
EIA (U.S. outlook) — Sees supply still outpacing demand in the mid‑2020s, with inventories building, but warns that maintaining growth will require sustained high investment
Long‑term risk — The IEA notes that 90% of upstream spending now goes to offsetting declines, not adding new capacity. Once U.S. shale peaks (likely mid‑2030s) and giant conventional fields enter steeper decline, global supply could plateau or fall unless major new resources are developed.
Why “peak” could arrive sooner than expected
Shale’s treadmill effect — Post‑peak decline could be much steeper than conventional fields, making it harder to sustain global output.
Aging supergiants — Fields like Ghawar, Burgan, and Cantarell are already past peak and in managed decline.
Project lead times — Large offshore or frontier projects take 5–10 years from discovery to first oil, so the 2030s supply picture is largely “baked in” by what’s being sanctioned now.
Bottom line
We’re still in a growth phase, but the rate of growth is slowing, and the structural factors that will bring about peak supply are already in motion. Most credible scenarios now place the peak somewhere between the early 2030s and early 2040s, depending on demand trends, investment levels, and technology.
I think the trailing 12 peak ending in early 2019 still has a chance.
Ukraine has been chipping away at Russia’s refining and transport of crude oil and oil products for most of the war. Since August 2, 2025, they have been on a tear. At least 17 refinery attacks with explosions, some of them appear very destructive. Now they seem to turning more to pipelines and export facilities, with Russia’s major Baltic ports hit.
Russia started the war with a large cushion of unused refining capacity. Now large regions have gas shortages. Russia’s air defense seems to be missing, and is mocked.
Should Ukraine continue to press this attack, they seem very capable of rapidly reducing Russia’s net exports.
Dclonghorn
They need to focus on bombing the Gas Oil Separation Plants or their equivalents. I saw a video which said that the pumps that pump the crude into the ship were taken out at a sea port near St Petersburg.
Dated overview map on targeted Russian complexes.
https://cybershafarat.com/2025/09/15/map-of-ukrainian-drone-strikes-on-the-oil-refineries/
Ceasefire on energy infrastructure is history. Search drone attacks on oil/infrastructure on X or Telegram. Russia was (?) reluctant to freeze their brothers, but focus is expanding and gloves are now coming off. US “protected” flow also hit in places like Iraq and Syria. Blowback time? Can you say global realignment of trade / energy flows.
Russia has 2.5 times the refining capacity that it needs. So Ukraine will have to do much more to damage Russian economy and war machine.
https://united24media.com/war-in-ukraine/how-many-russian-oil-refineries-has-ukraine-damaged-so-far-and-where-2123
My Russian geography sucks. But, they have hit two export terminals in that area, and set two afromax (600,000 bbl) oil tankers afire, as well as successful rail attacks in the area. They seem to have the cards that Trump wouldn’t credit them with.
https://www.youtube.com/watch?v=Dk0HCJvCgrI
5 minutes
Ukraine hammers Russian Oil Infrastructure.
Now has weapons that can target pipeline infrastructure
It’s interesting how little influence Ukraine’s attacks on Russian oil has had on oil prices.
Ahhh I just love Western propaganda. It can take a piss ant nation that is being overrun and has lost most of it’s manpower and infrastructure and turn it into a champion super power destroyer. At least the Western Europeans will have no illusions of them ever getting that cheap Russian oil and Gas back. Not that they need it hey, they can do just fine on solar and windmills and Bio-whatever. Their transport covered by cheap Chinese EVs
Is J David Hughes in poor health?
Haven’t seen any new analyses at Post Carbon, since 2021. I can’t find any recent videos/speeches by him either.
I also looked up the “where are they now” list of The Oil Drum regulars, from 2013 (with links)…and almost every one had stopped writing. While many were older and time has its way, it’s still interesting how the ones still alive, have stopped writing about peak oil also. Many stopped writing entirely. If they still are (Hagens), it seems like they’ve pivoted to general greenie/eco writing, which was maybe what drew them to peak oil anyhow (wanting it to happen, vice analyzing that it would happen….hopium).
It definitely seems like peak Peak Oil (as a community of amateur analysts) was somewhere in 2010 or shortly before. Looking more and more like shale killed Peak Oil, at least in terms of “buzz”. TOD died in 2013 and so did ASPO. This site and PO.com are fine for what they do. (I like having options, like having small sites for every flavor of content, including things/people I disagree with.) But these are not the same gravitas or reach, organizationally. When was the last peak oil conference? Hmm?
For a while peak oilers seemed to pivot to downplaying shale. First saying the gas would not do much, then downplaying the oil. But their “shale is overhyped” writings from 2010-2015 did not age well. (Look at the 2010 Berman TOD article saying the Marcellus was overhyped…or David Hughes 2011 skepticism about EIA growth predictions-which were too modest, not too high.) NA gas exploded and caused cheap (versus 2010, real) prices. And the US set a new peak for oil production…and is currently at 13+ MM bopd.
Note: It’s probably fair to say NA tight oil is mature (ish) now, and can’t grow (will slowly decline) in current price regime. But that’s not that exciting a peak oil stance, when we’re talking about 13+ MM bopd and a slow plateau-ish decline, at prices that are like ~$40 (!) in 2010 dollars. And given that that’s really similar to what industry and EIA/IEA are saying also. Doesn’t quite have the flash of an Ace TOD peak prediction article/chart. Can’t really “stick it to the man”, with such a gentle supply/demand situation. Sure ain’t Olduvai Gorge!
Anon
If you read the IEA decline rates of various fields posted by Seppo, earlier on.
Do you think there will be a geological Peak Oil?
If so when and at what production level?
New post is up
https://peakoilbarrel.com/opec-update-september-2025/
‘
“Gun chumps dump Thump.”
Not bad
The ACLU dares to create a more perfect union — beyond one person, party, or side. Our mission is to realize this promise of the United States Constitution for all and expand the reach of its guarantees.