A guest post by Ovi
Below are a number of crude oil plus condensate (C + C ) production charts for Non-OPEC countries created from data provided by the EIA’s International Energy Statistics and updated to March 2022. This is the latest and most detailed world oil production information available. Information from other sources such as OPEC, the STEO and country specific sites such as Russia, Brazil, Norway and China is used to provide a short term outlook for future output and direction for a few countries and the world.
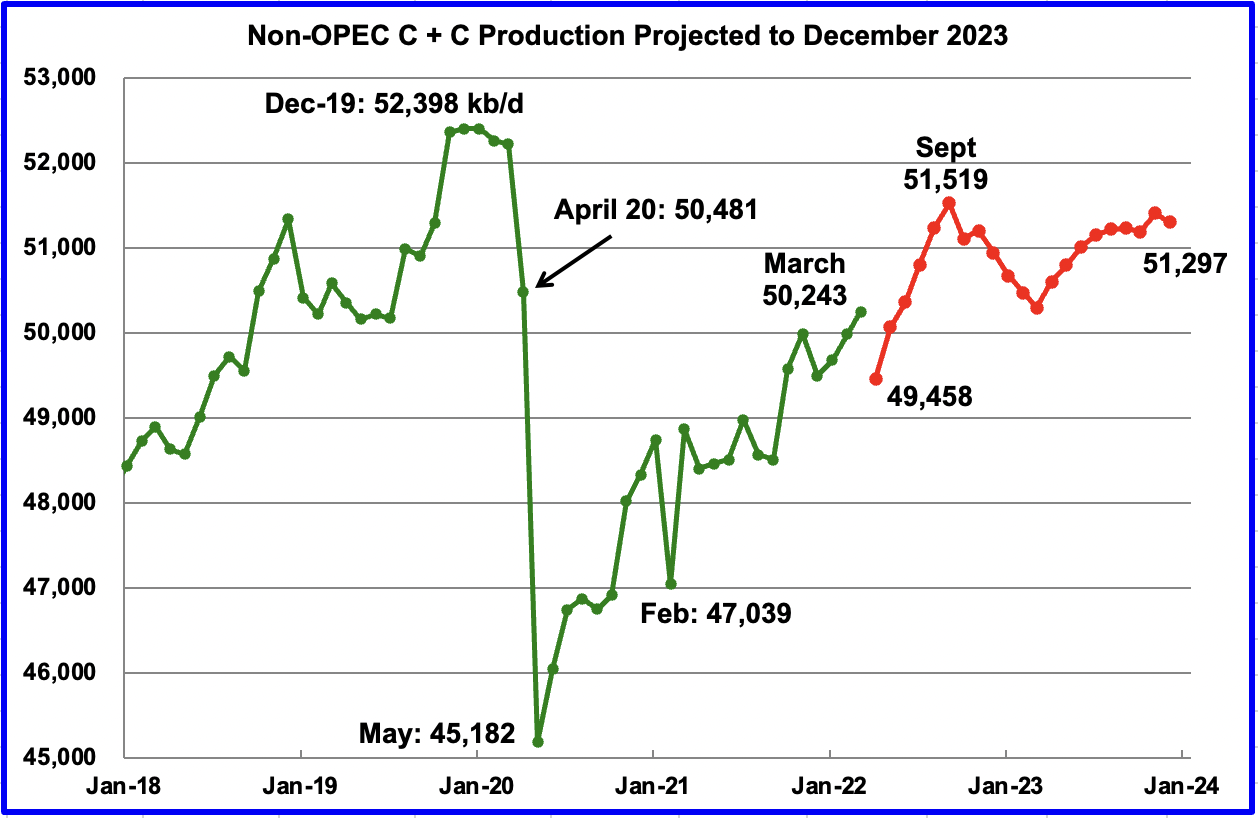
March Non-OPEC production increased by 264 kb/d to 50,243 kb/d. Of the 264 kb/d increase, the biggest increases came from the U.S., 349 kb/d and China, 78 kb/d. Offsetting the increases were decreases from Kazakhstan, Russia and Norway. The March 2022 output of 50,243 kb/d is 1,975 kb/d lower than the March pre-covid rate of 52,218 kb/d.
Using data from the July 2022 STEO, a projection for Non-OPEC oil output was made for the time period April 2022 to December 2023. (Red graph). Output is expected to reach 51,297 kb/d in December 2023. Note the April production drop of 785 kb/d to 49,458 kb/d in the red graph is associated with a projected output drop in Russia. The production rise to 51,519 kb/d by September is related to projected increases by OPEC + and the U.S.
The April 785 kb/d production drop may be realistic since according to this source, April Non-OPEC all liquids production dropped: “Non-OPEC production saw a decrease of 810,000 bpd to 64.92 million bpd in April”.
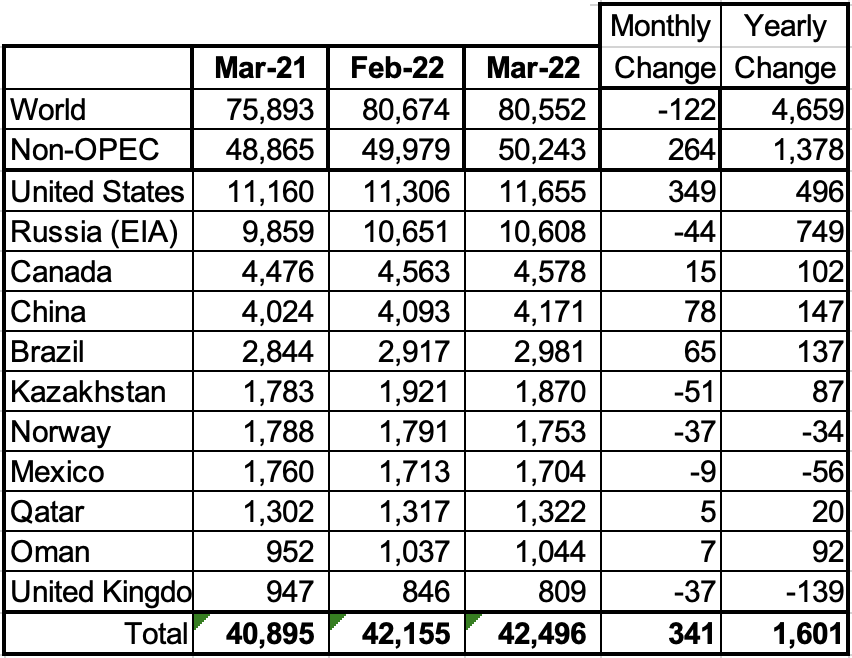
Above are listed the world’s 11th largest Non-OPEC producers. The original criteria for inclusion in the table was that all of the countries produced more than 1,000 kb/d. The UK has been below 1,000 kb/d since January 2021.
In March 2022, these 11 countries produced 84.6% of the Non-OPEC oil. On a YoY basis, Non-OPEC production increased by 1,378 kb/d while on a MoM basis production, it increased by 264 kb/d. World YoY March output increased by 4,659 kb/d.
Production by Country
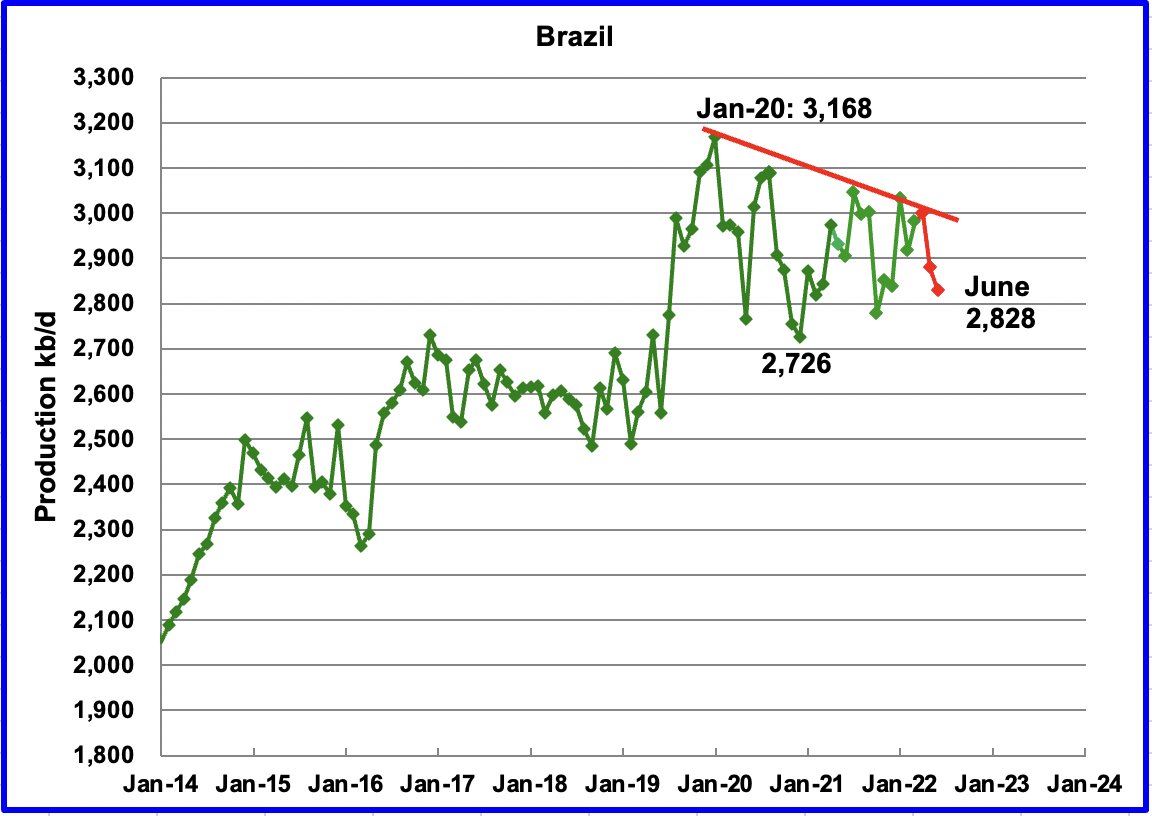
The EIA reported Brazil’s March production increased by 65 kb/d to 2,981 kb/d.
Brazil’s National Petroleum Association (BNPA) reported that May’s output decreased by 123 kb/d to 2,879 kb/d, reversing April’s increase of 18 kb/d. (Red Markers). On a YoY basis, May production is down 53 kb/d. May’s output drop was mainly due to interruptions in offshore maintenance at the Tupi field, according to OPEC.
On July 20, 2022, the BNPA reported that June production dropped again. No information on the June drop to 2,828 kb/d is available. However, a new field came on line on May 1, 2022 and it is surprising that no production increase was reported for June.
Petrobras did announce that “Second quarter production was also affected by an increase in maintenance stoppages”. Are pre-salt fields proving to be more difficult to produce than anticipated?
On May 1, MODEC’s FPSO Guanabara MV31 for Brazilian presalt achieved first oil.
TOKYO, Japan — MODEC Inc.’s FPSO Guanabara MV31 deployed for operations at the Mero Field in the giant presalt region of the Santos Basin off the coast of Brazil, achieved first oil production and started charter services on May 1. It is the largest FPSO built by the company to date.
Moored some 180 km off the coast of Rio de Janeiro at a water depth of approximately 2,100 m, the FPSO is capable of processing 180,000 bbl of crude oil, 424 MMscf of gas and 225,000 bbl of water injection per day, and it has storage capacity of 1.4 MMbbl of crude oil.
Is water injection becoming standard practise for Deep Water wells/basins?
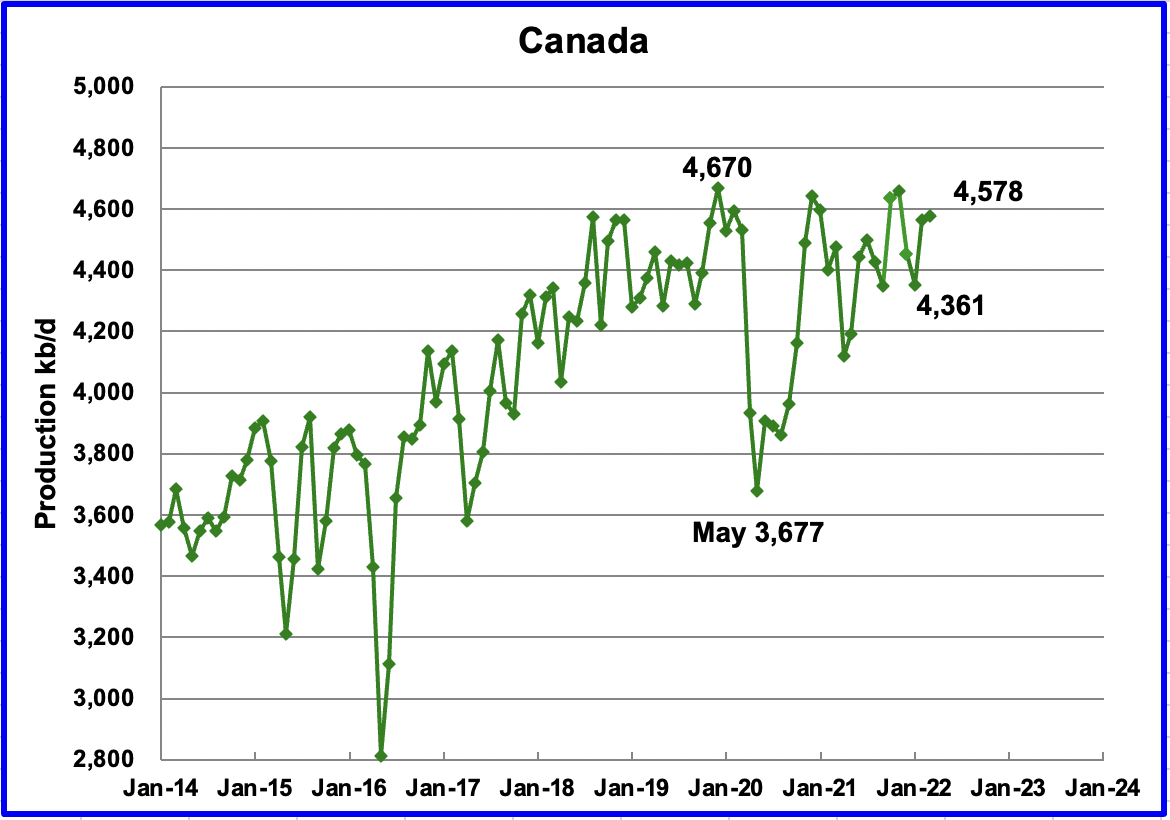
According to the EIA, Canada’s March output increased by 15 kb/d to 4,578 kb/d. Preliminary data from the Canadian Energy Regulator indicates that synthetic crude production was down by 100 kb/d in April.
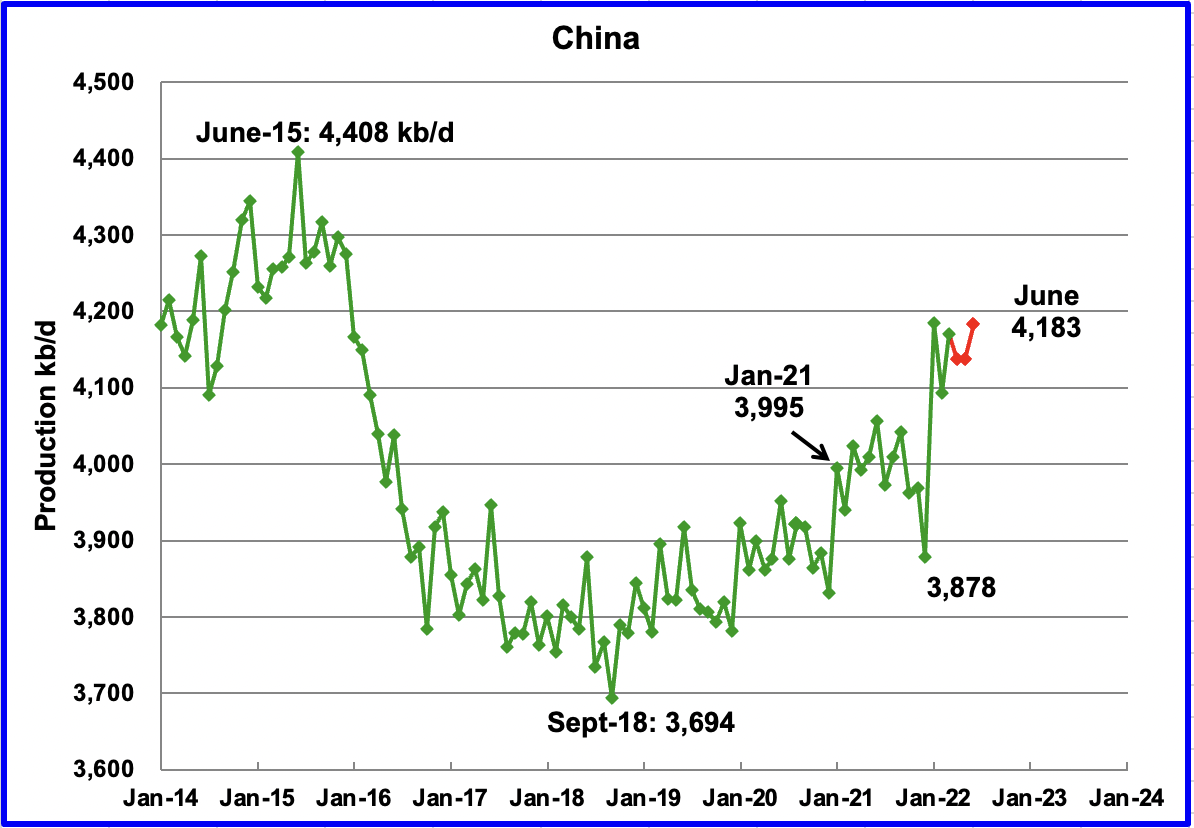
The EIA reported China’s output increased by 78 kb/d to 4,171 kb/d in March. China reported that its output dropped in April and May and increased in June by 46 kb/d to 4,183 kb/d. (Red markers).
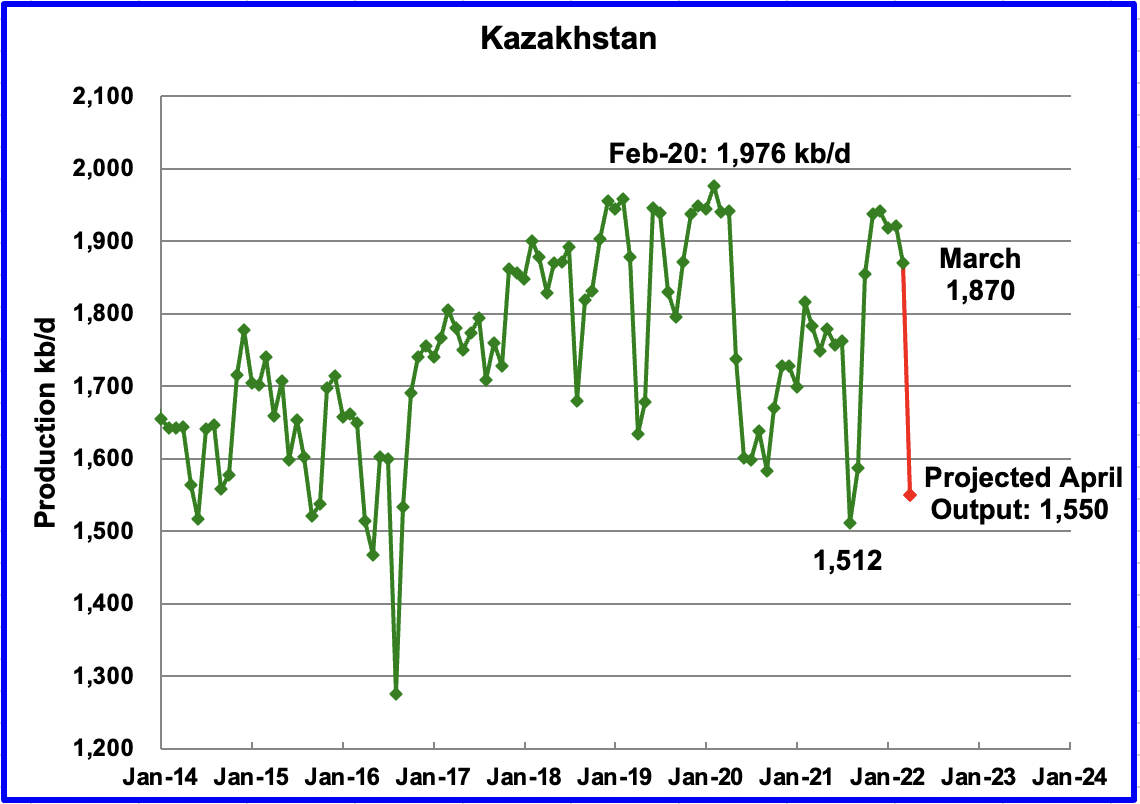
Kazakhstan’s output decreased by 51 kb/d in March to 1,870 kb/d. April output is projected to drop further due to required repairs at a damaged loading terminal in a Black Sea port in Russia, according to this source. The projected drop is 320 kb/d.
“Although energy market observers are bound to link the cutback to the loading terminal incident, Kazakh officials are selling this development as a planned measure to bring the country in compliance with OPEC commitments.”
OPEC reported that Kazakhstan crude production dropped to 1,400 kb/d in April. According to this source: “The data shows output running between 1.5 million and 1.57 million barrels per day on April 4 and 5.”
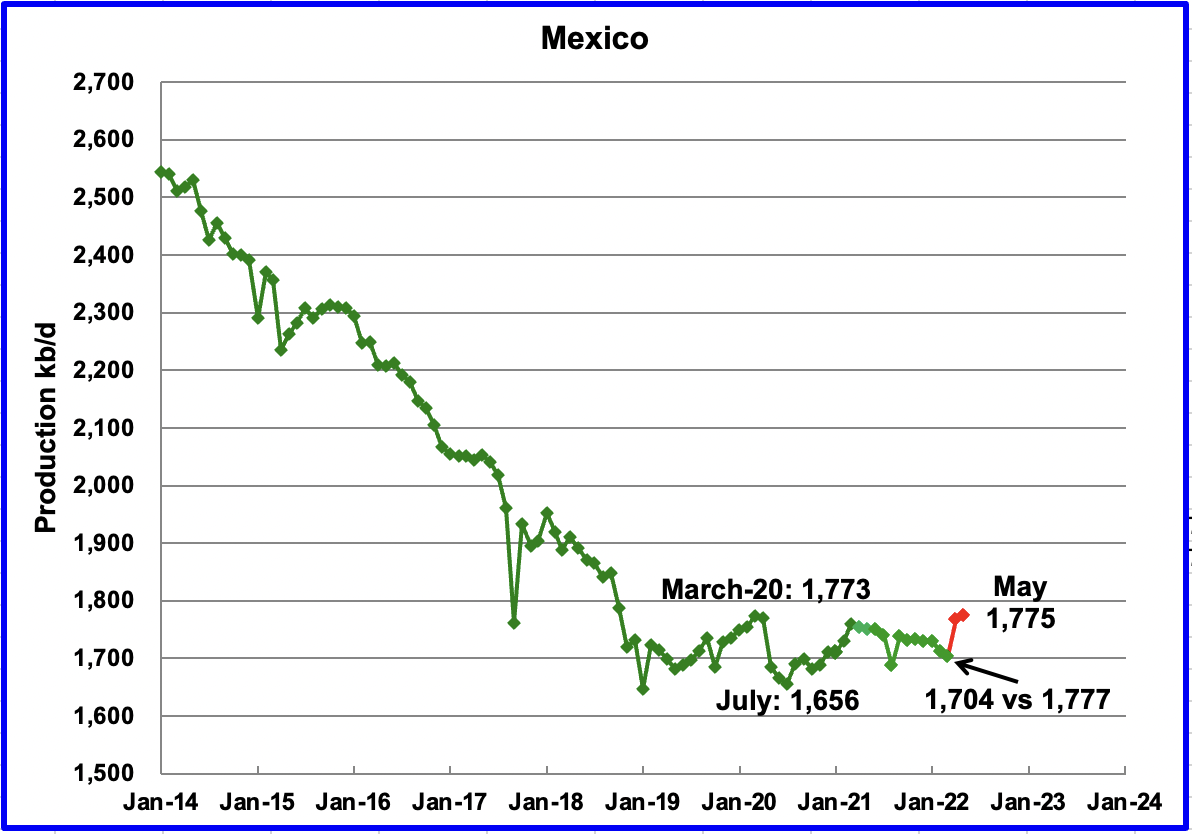
Mexico’s production as reported by the EIA for March dropped by 9 kb/d to 1,704 kb/d.
Data from Pemex showed that May’s output was 1,775 kb/d. However, the EIA reduces Mexico’s official oil production by close to 70 kb/d each month. Note that March was revised down from 1,777 kb/d to 1,701 kb/d. A possible explanation is that Mexico’s definition of condensate may be different than the EIA’s.
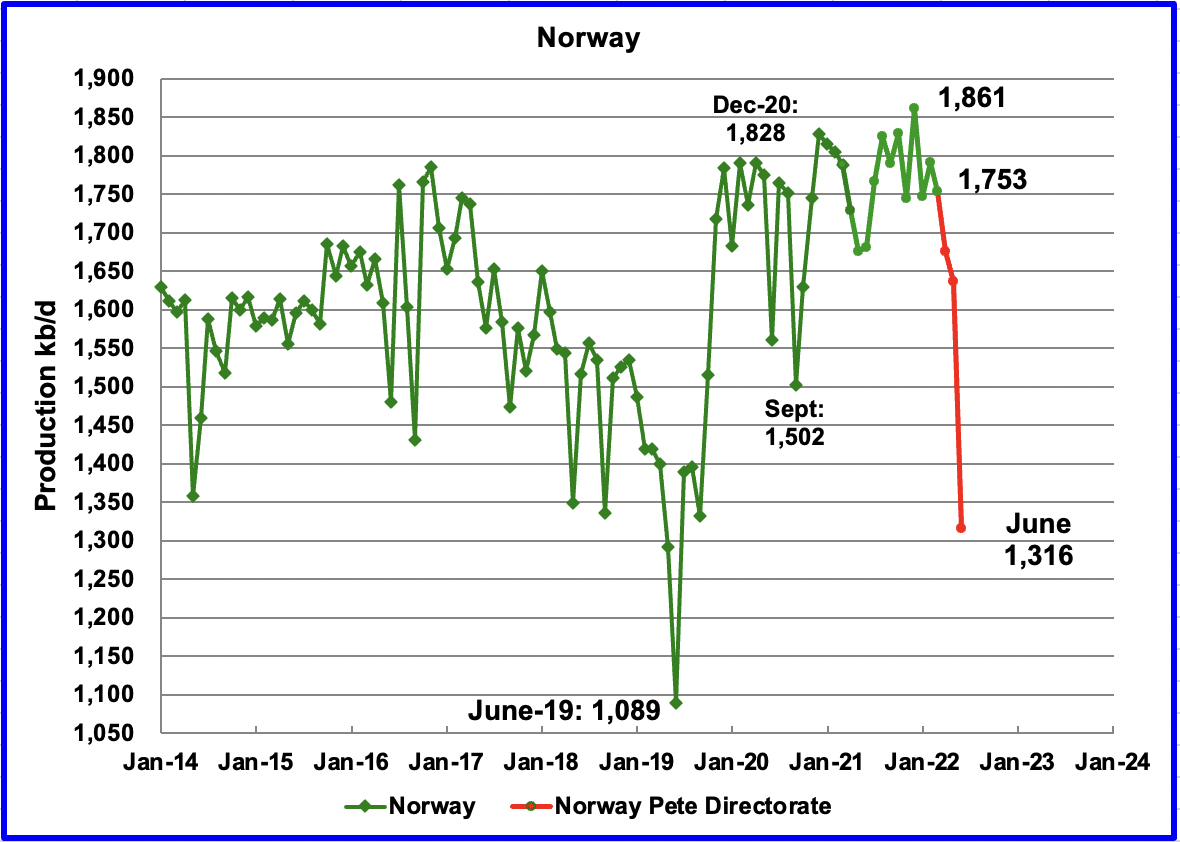
The EIA reported that Norway’s March production decreased by 37 kb/d to 1,753 kb/d.
The Norway Petroleum Directorate (NPD) reported that production decreased from April to June to 1,316 kb/d. (Red markers.). According to the NPD: “: Oil production in June is 0.2 percent lower than the NPD’s forecast and 4.2 percent lower than the forecast so far this year.
According to OPEC, the continuing drop was due to summer maintenance in offshore platforms and some operators prioritizing gas production.
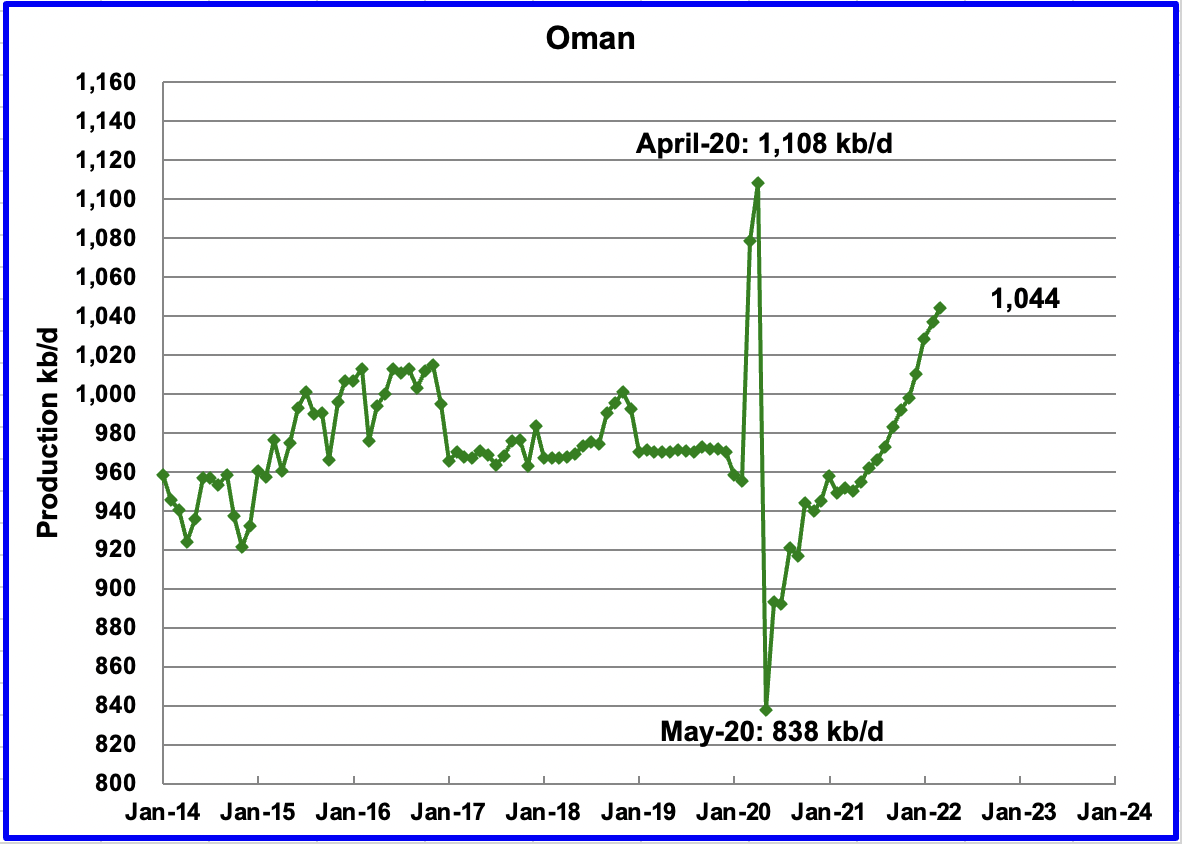
Oman’s March production increased by 7 kb/d to 1,044 kb/d.
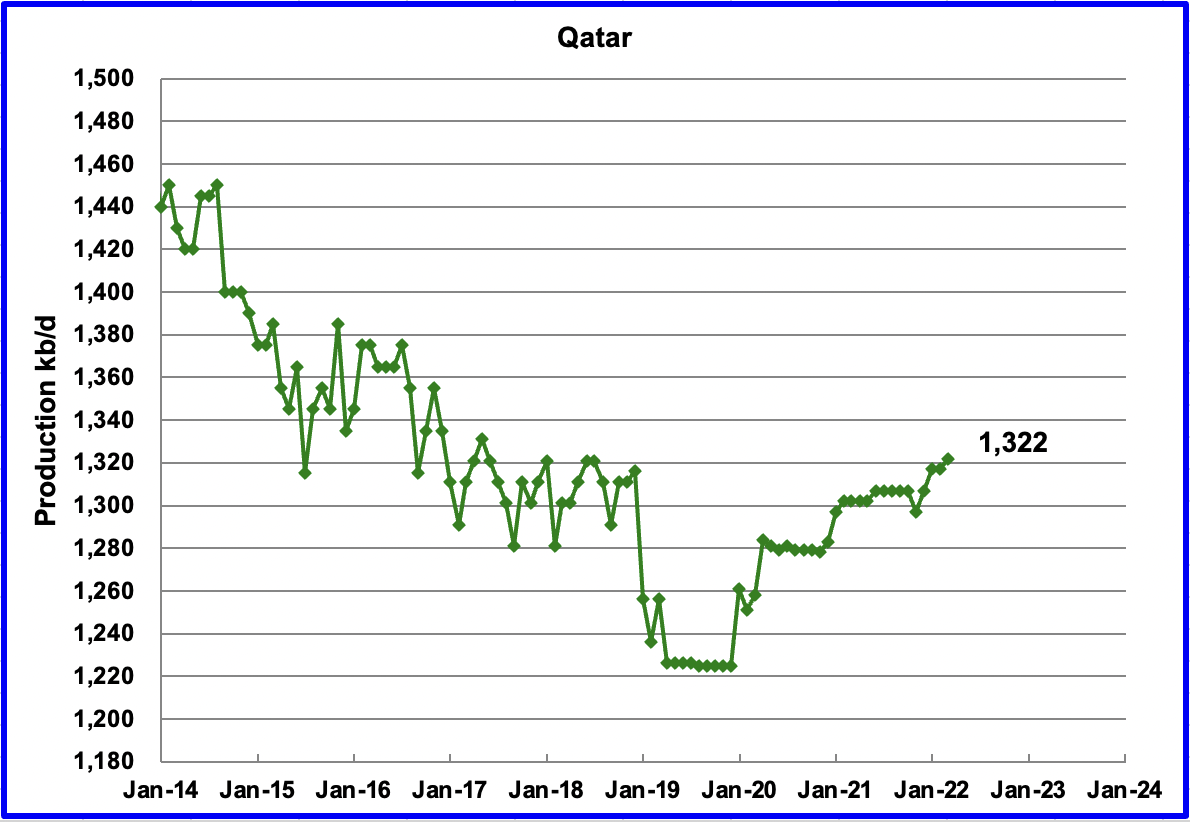
March’s output increased by 5 kb/d to 1,322 kb/d.
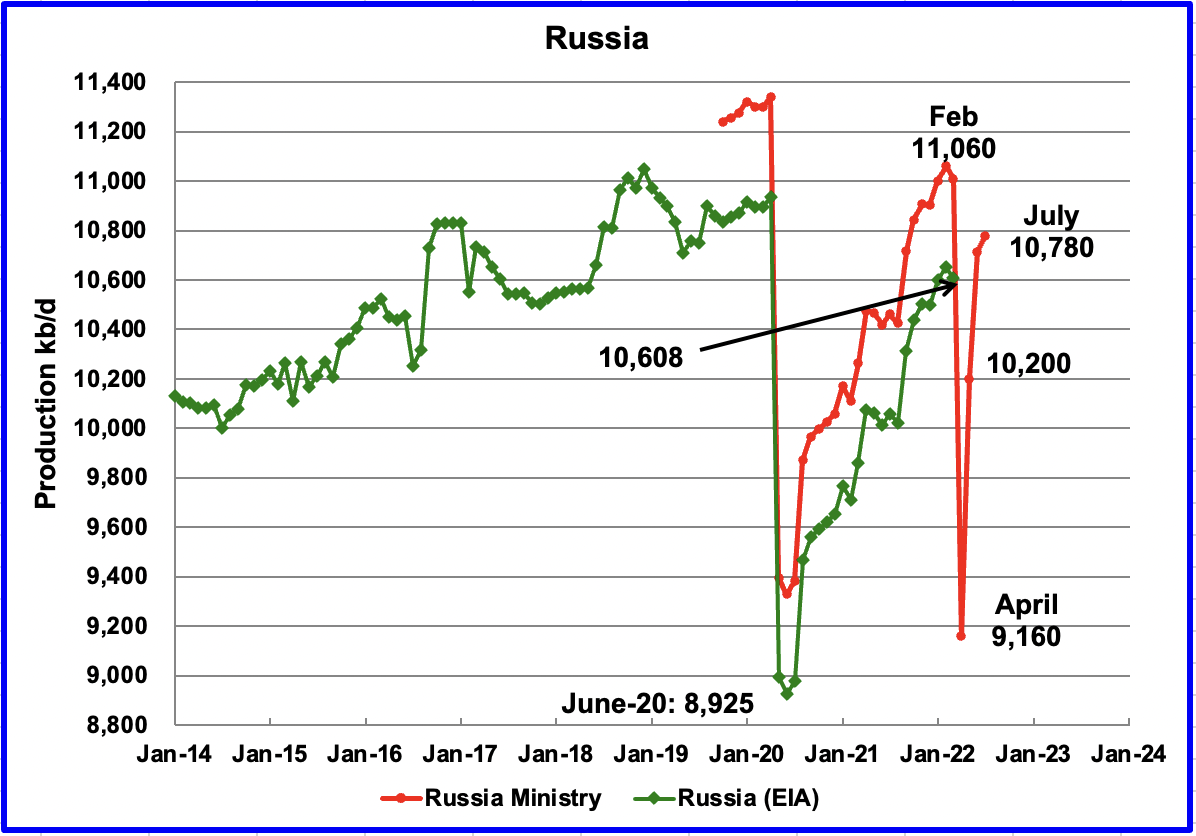
The EIA reported that Russian output decreased by 44 kb/d in March to 10,608 kb/d. According to this source July’s (initial 1/2 month estimate) production increased by 65 lb/d to 10,780 kb/d.
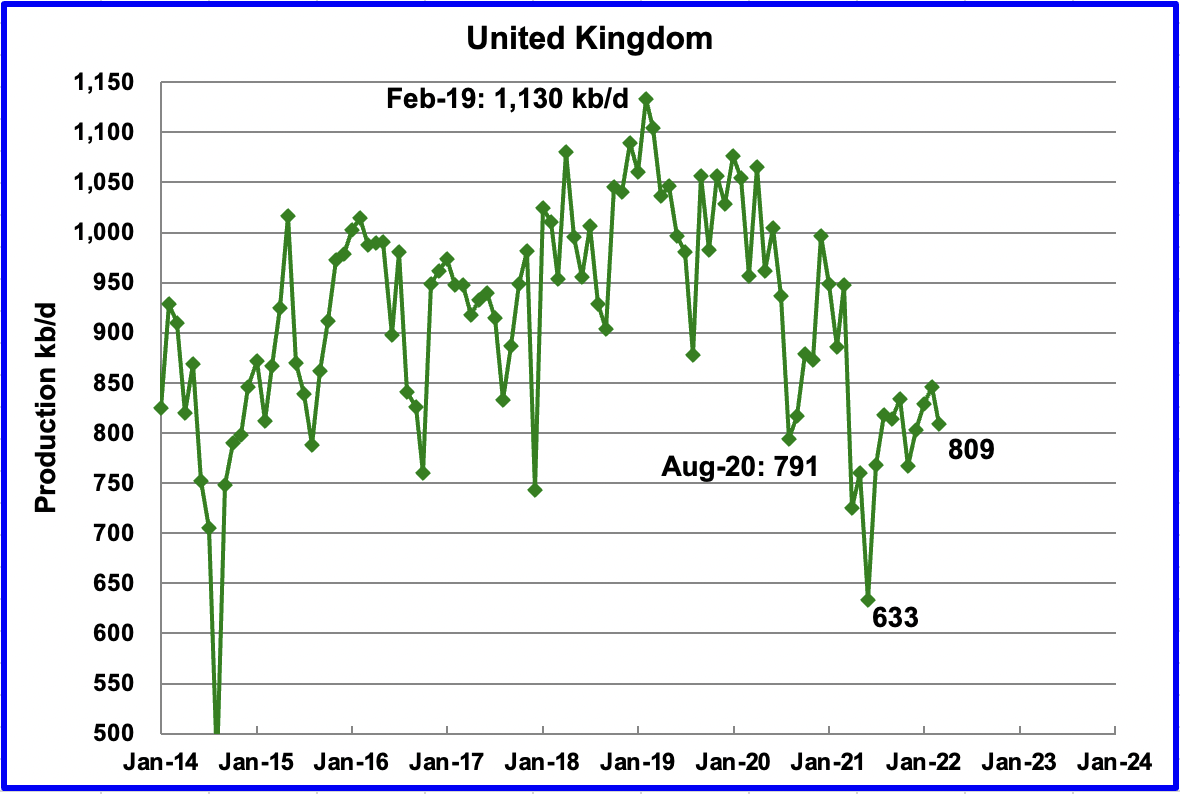
UK’s production decreased by 37 kb/d in March to 809 kb/d. The chart indicates that UK oil production entered a steep decline phase starting in February 2019. On a YoY basis production is down 138 kb/d. April output is expected to increase by close to 80 kb/d according to OPEC.
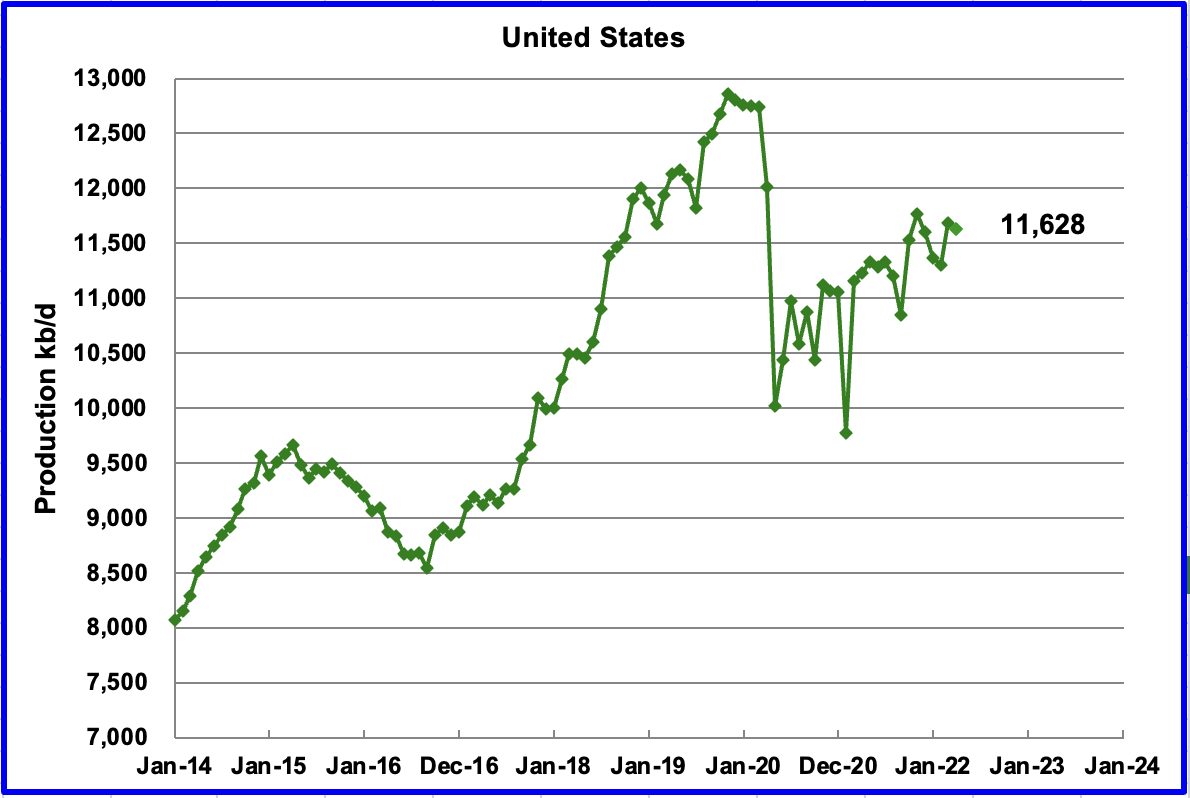
U.S. April production decreased by 60 kb/d to 11,628 kb/d. The largest production increase came from the GOM but North Dakota’s drop of 214 kb/d overcame the GOM increase.
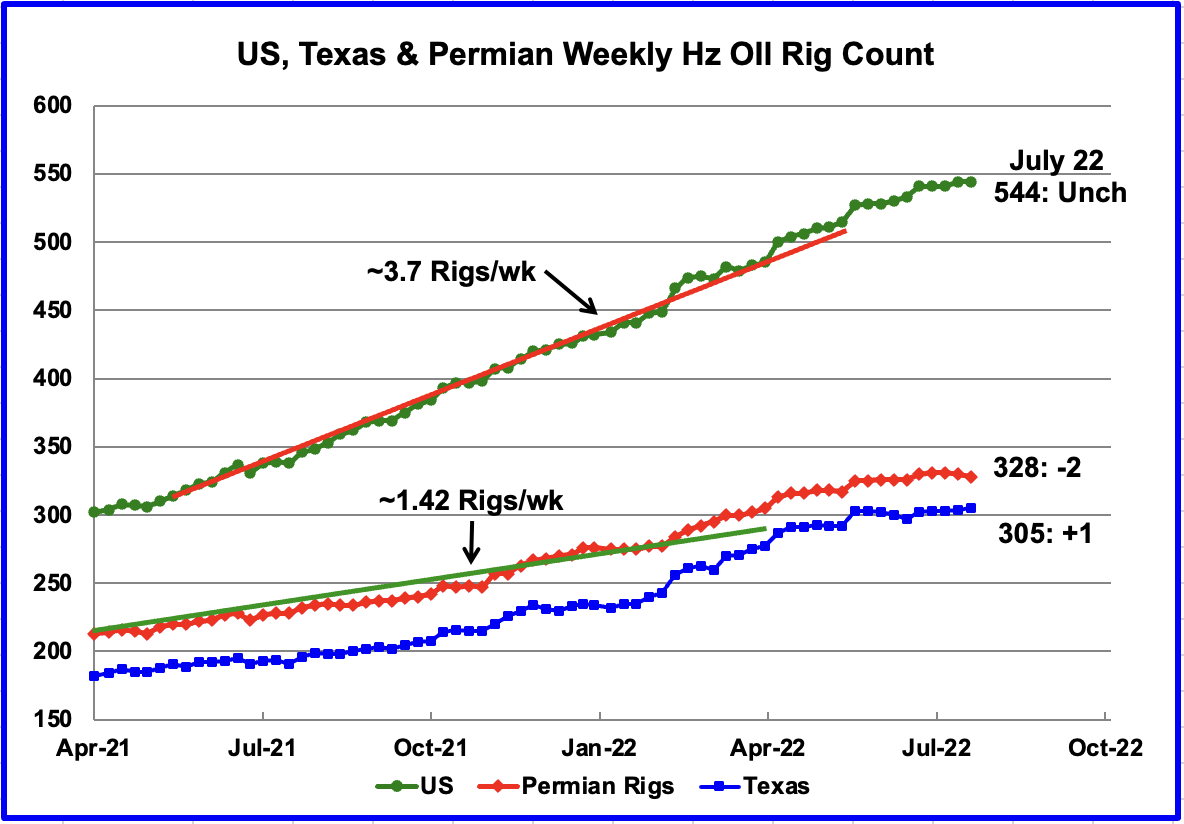
From the beginning of May 2021 to the end of April 2022, the US has been adding horizontal oil rigs at an average rate of close to 3.7 rigs/wk. The primary destination for rig additions appears to have been the Permian and Texas. However recent data for the last 10 weeks indicates that the rig counts in the Permian and Texas has been essentially unchanged.
For the week ending July 22, the US horizontal oil rig count was unchanged at 544. The Permian dropped 2 while Texas added 1.
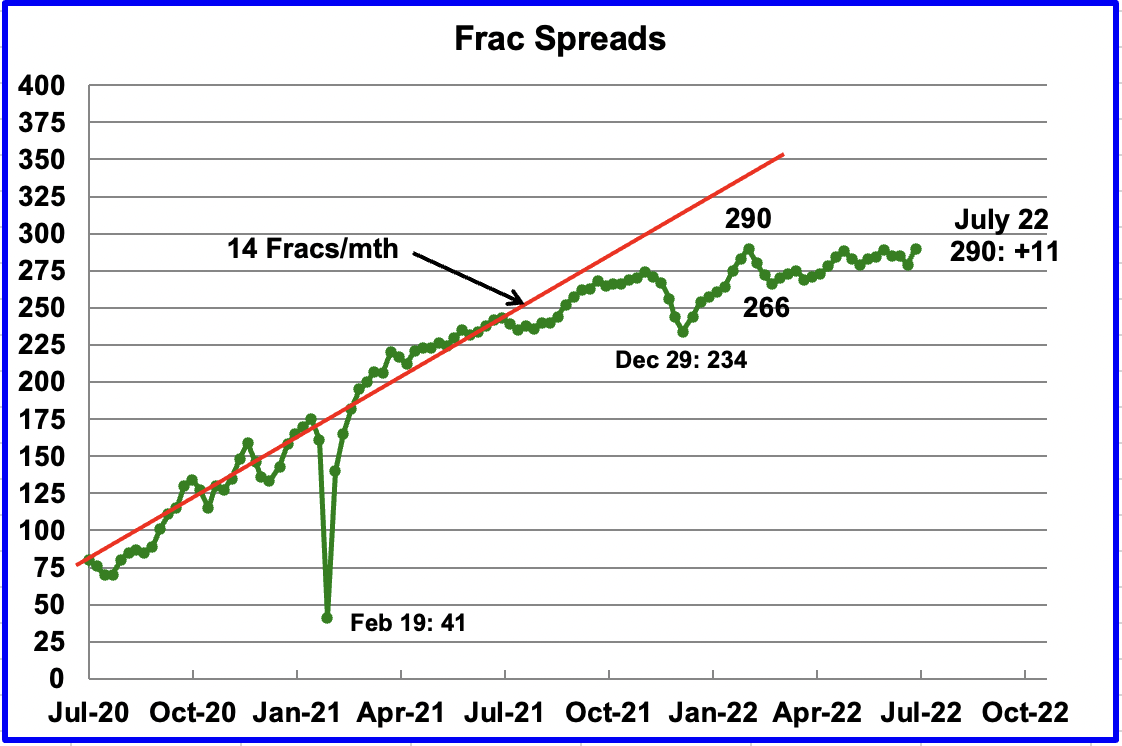
For the past few months, the growth in frac spreads has not been keeping up with the growth in rigs. In the week ending July 22, 11 Frac Spreads were added for a total of 290. The 290 matches the number of Frac Spreads operating in the week of February 25. It is not clear if last week’s increase of 11 Frac Spreads reflects a return to work of personnel after the Independence day holiday or just a correction of an incorrect count for the previous week.
Note that these 290 Frac Spreads include both gas and oil spreads, whereas the rig information is strictly for horizontal oil rigs.
One of the reasons for the slow growth of Frac Spreads is consolidation within the fracking industry according to this source. The effect of slowing growth in Frac Spreads is shown in the next chart.
“Nearly 360 spreads were active in early 2020 but the oil service industry has since consolidated, cutting capacity. “Two years of supply attrition and cannibalisation, plus limitations from labour shortages and a secular shift toward next-generation frac fleet technologies, have led to tightening in the frac space,” Liberty Oilfield Services chief executive Chris Wright says”.
“Rising costs, supply chain bottlenecks and a lack of investor capital are impeding a faster recovery in US tight oil production despite very high oil prices and government pleas for firms to boost supply. “I understand the desire to find a quick fix for the recent spike in gasoline prices,” Pioneer Natural Resources chief executive Scott Sheffield told the House of Representatives Energy and Commerce Committee on 6 April. “But neither Pioneer nor any other US producer can increase production overnight by turning on a tap.”
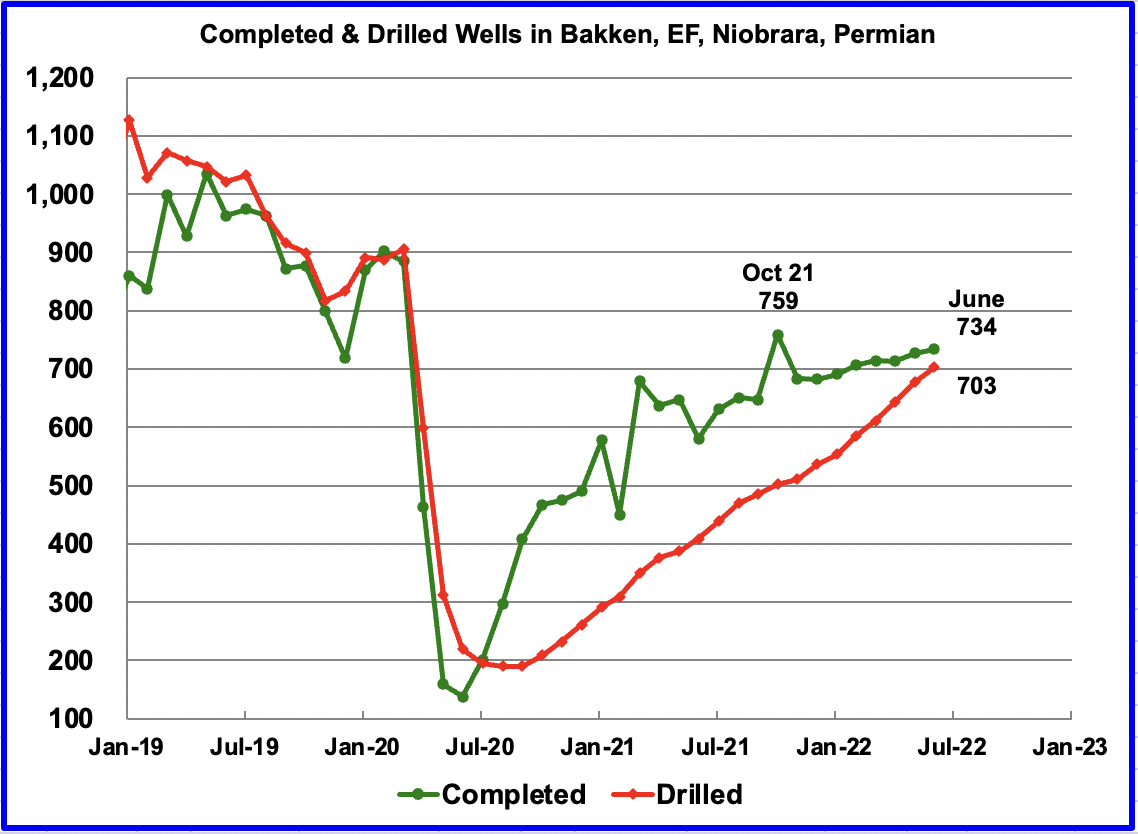
The impact of the slowing growth in Frac Spreads since last November can be seen in this chart. From November 2021 to June 2022, the monthly completion rate of wells/DUCs has slowed relative the rate in 2021. More wells were completed in October 2021 than in June 2022, 759 vs 734.
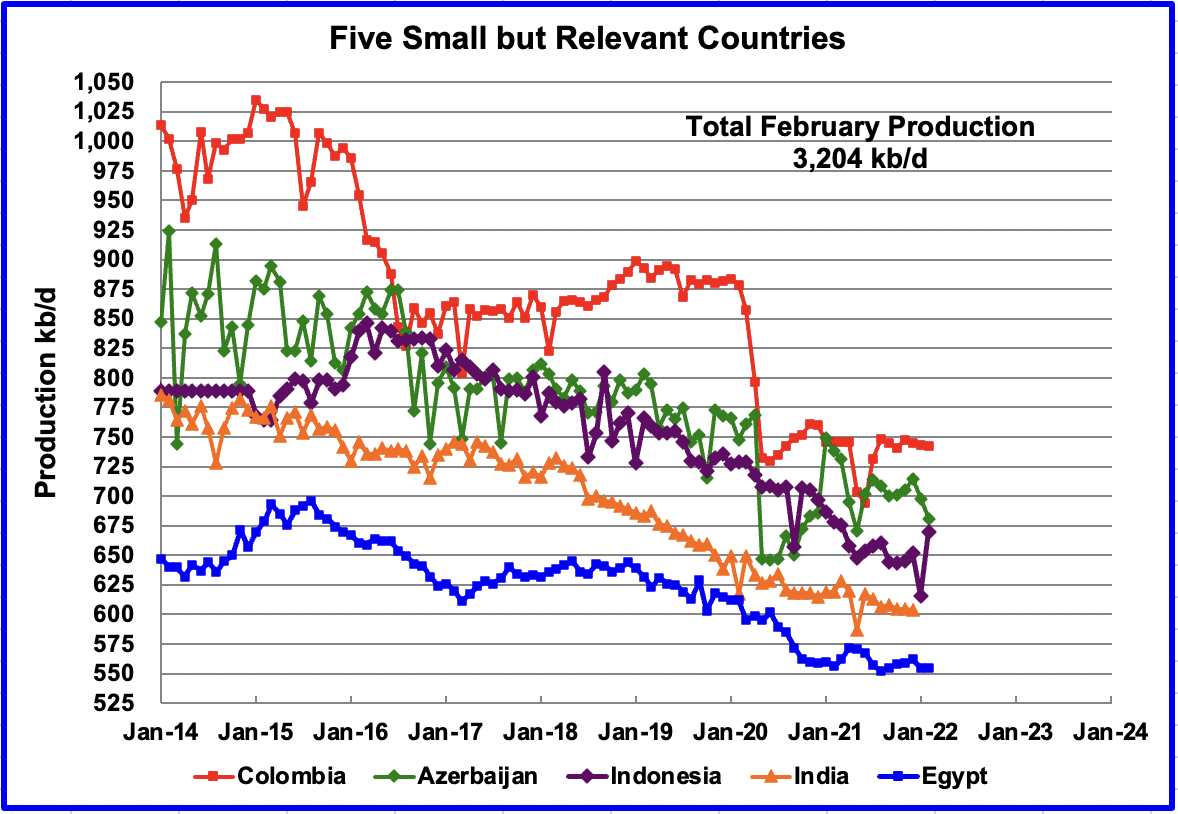
These five countries complete the list of Non-OPEC countries with annual production between 500 kb/d and 1,000 kb/d. Their combined March production was 3,204 kb/d, down 49 kb/d from February’s 3,253 kb/d.
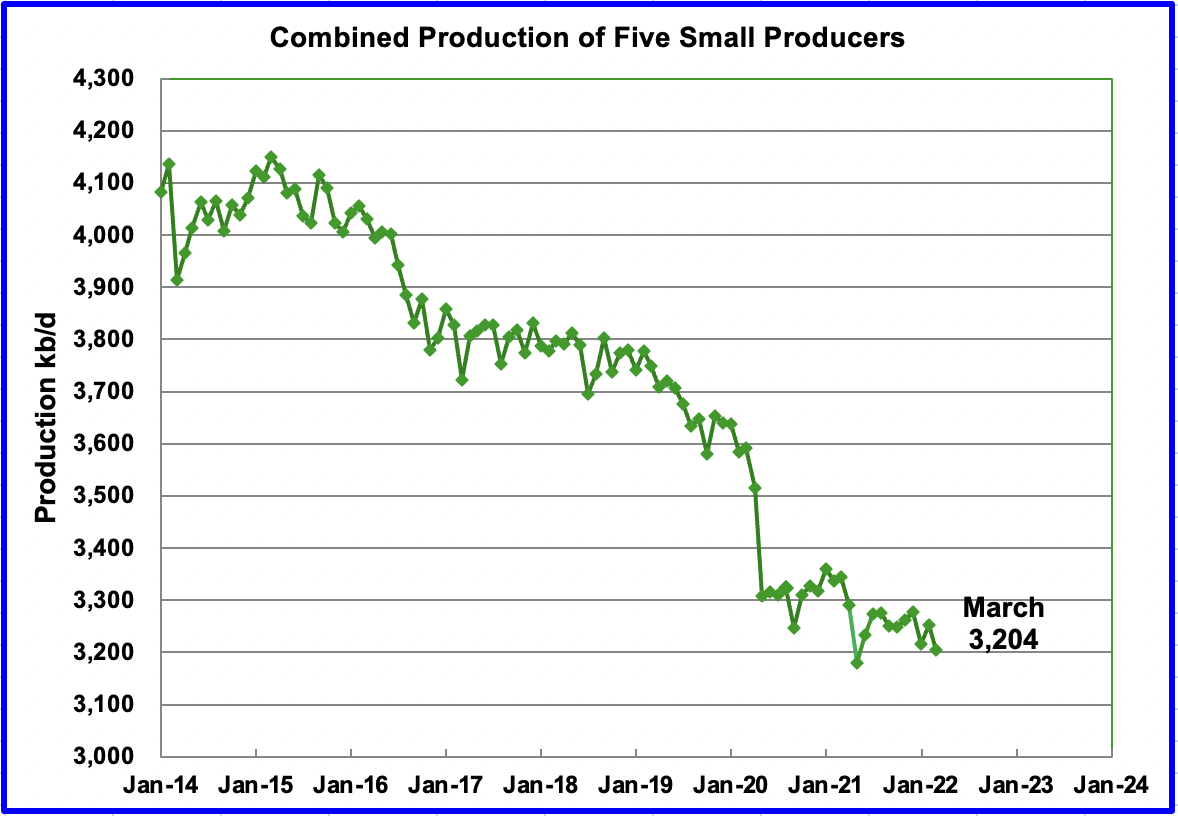
The overall output from the above five countries has been in a slow steady decline since 2015.
OPEC 10 + Production vs Commitment
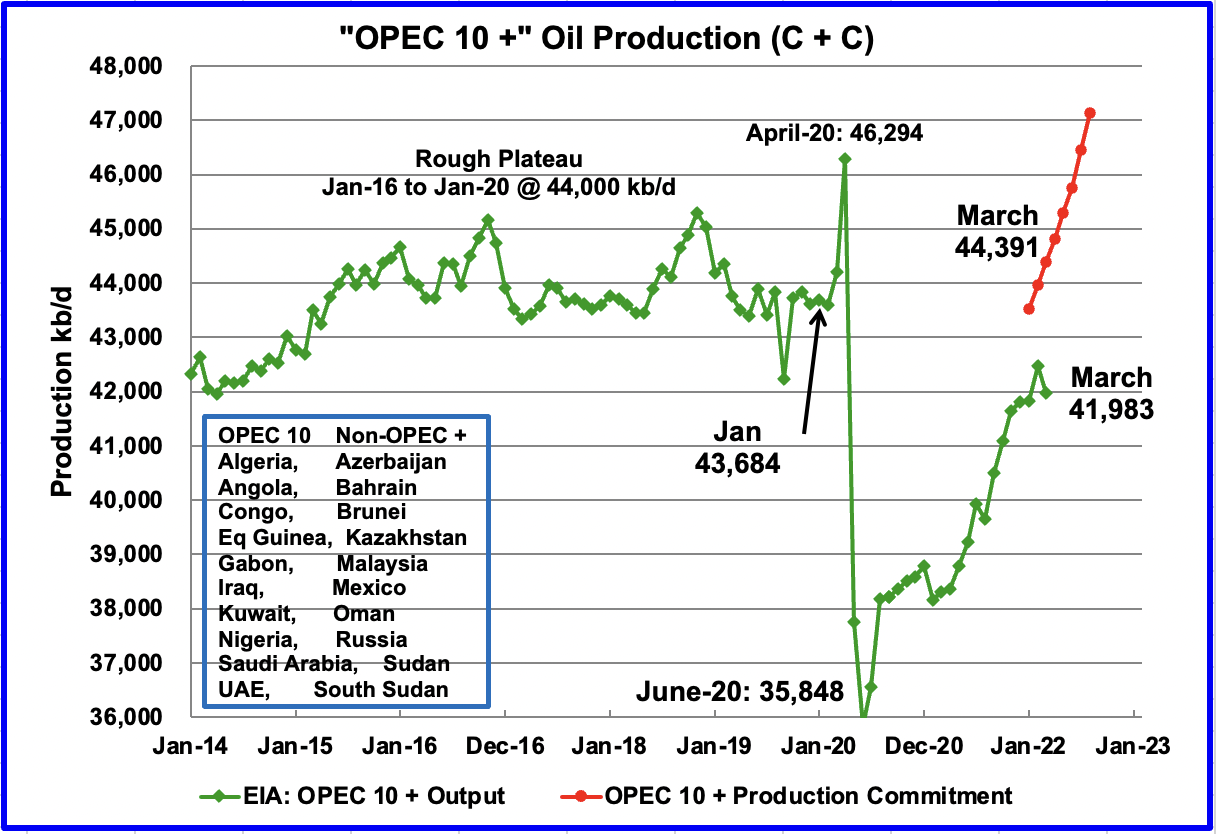
This chart compares OPEC 10 + production with their commitment. For March, the gap between production and commitments is approximately 2,408 kb/d of C + C.
To develop this chart some assumptions had to be made. The OPEC 10 + commitments are for only crude oil production, no condensate. While that information is available for the OPEC countries from the OPEC report, it is not readily available for the Non-OPEC participants. On the other hand, the EIA monthly production information is available for those countries for both crude plus condensate. To get an estimate for the OPEC 10 + commitments in terms of C + C, OPEC crude production was compared with EIA’s C + C production for the OPEC countries.
For the last six months, October 2021 to March 2022, the ratio of EIA C + C OPEC production data to the OPEC crude data was calculated. Over that period, the EIA C+C production was close to 7.5% higher on average than the OPEC crude values. The OPEC 10 + commitments have been increased by 7.5%.
World Oil Production
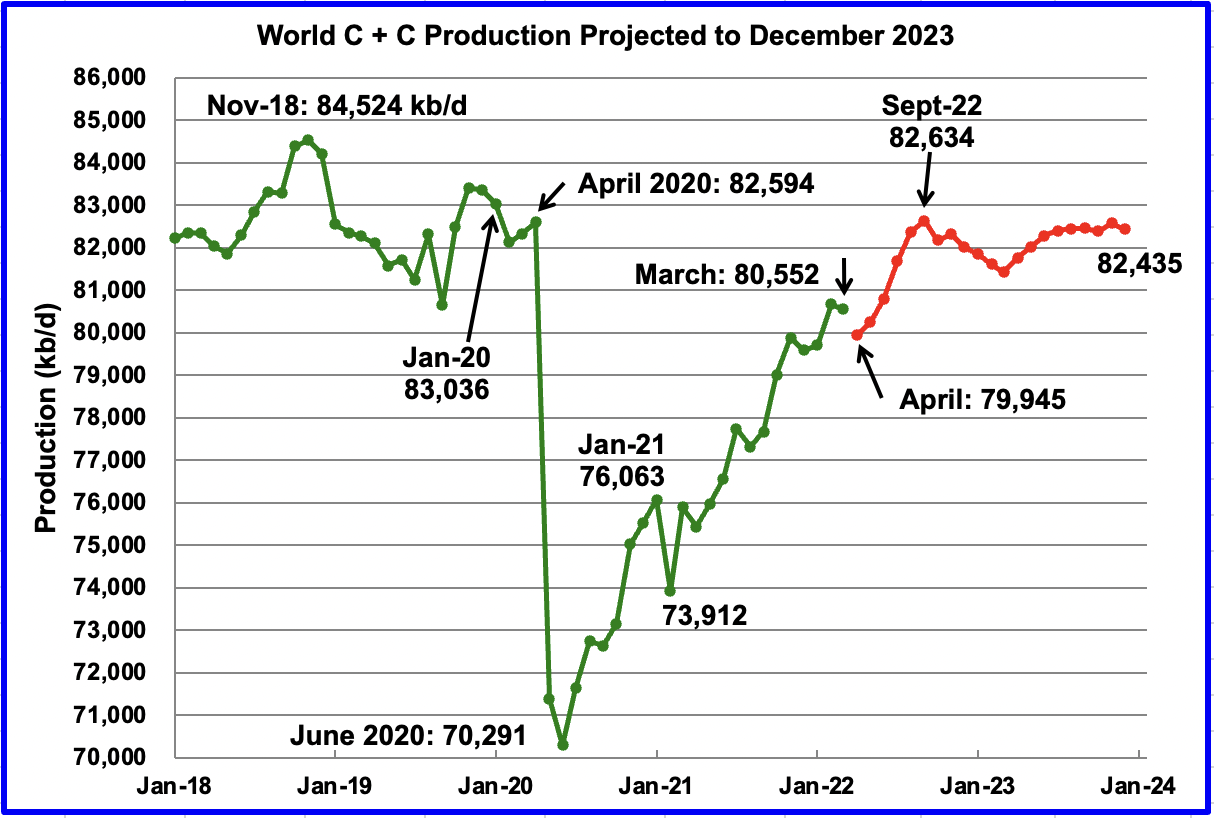
March’s world oil production decreased by 122 kb/d to 80,552 kb/d according to the EIA (Green graph).
This chart also projects world C + C production out to December 2023. It uses the July 2022 STEO report along with the International Energy Statistics to make the projection. (Red markers).
It projects that world crude production in December 2023 will be 82,435 kb/d, 164 kb/d higher than projected in the June report. The rise of close to 2,700 kb/d from April to September seems aggressive but is related to US and OPEC + forecast production increases.
Considering the upcoming production losses shown above in Brazil, Kazakhstan and Norway, the smooth production increase from April to September appears to be optimistic.
240 responses to “March Non-OPEC Oil Production at Post Pandemic high”
Thanks Ovi,
Note that the OPEC plus data for Russia is crude oil and does not include condensate. I cannot find an estimate for April 2022, but source below
https://oilprice.com/Latest-Energy-News/World-News/Russias-Oil-Production-Jumps-By-5-In-June.html
Has June C plus C for Russia at 10.7 Mb/d about 5% higher than May which suggests 10.2 Mb/d for May 2022 (10.7 divided by 1.05). I have Russian output at 10 Mb/d in April 2022 for C plus C, but I cannot find my source.
Russian crude oil production was up 5% according to Russian daily Kommersant. However Russian exports were down 3.3% over the same period. That sounds a little strange.
Ron
Thanks. I found a more updated link with partial July production. I have updated the Russian chart and the link is there.
Dennis
Thanks for the info. I have found an updated July number for Russia and updated the chart and comments in the original post.
I have June production at 10,715 kb/d since the source says that July is 0.6% higher than June.
I have increased the OPEC 10 commitments by 7.5% to account for the missing condensate in the OPEC 10 list that OPEC publishes.
I got the April production estimate, 9,160 kb/d, from this source.
https://www.reuters.com/business/energy/russian-crude-production-plunges-by-nearly-9-april-opec-data-shows-2022-05-17/
Thanks Ovi,
Yes I looked t that source (linked in the post). I could not find any better estimate, but note that the source says the estimate is from OPEC and it specifically says crude oil rather than crude plus condensate.
Unfortunately in some places crude only is reported, in some crude plus condensate, in others it is C plus C plus NGL and in others it is all liquids (including refinery gain, CT, GTL, and biofuel.) We use to be able to get C pluc C output from the Russian Ministry of Energy, but that is no longer possible since the invasion of Ukraine.
See
https://www.reuters.com/business/energy/russia-delays-publication-monthly-oil-gas-output-data-sources-2022-04-04/
Ovi,
I found this other source for April data for Russia, in April output fell by 900 kb/d from the March level for crude only from 10.04 Mb/d to 9.14 Mb/d.
https://www.spglobal.com/commodityinsights/en/market-insights/latest-news/oil/050922-opec-april-crude-oil-output-tumbles-as-sanctions-hit-russian-output-platts-survey
Your chart (and several sources) shows March Russian output at about 11 Mb/d which suggests condensate output is about 900 kb/d. This suggests at least 9.9 Mb/d for Russian crude plus condensate in April 2022 (this assumes 750 kb/d of condensate output).
Ovi,
Excellent update. While the world was able to increase production by 12 mbd since 2008, it is having difficulty getting back up to the same level just three years ago. Without oil production growth, there is no GDP growth. Soon, the world will realize this critical relationship.
Here is an interesting chart showing the lack of interest in the Oil Industry, even with much higher oil prices. The market cap of the top 48 U.S. E & P companies was higher in Q3 2018, even though the oil price was 27% lower.
Thus, the FALLING EROI is wreaking havoc throughout the oil industry, and investors subconsciously realize this by their lack of interest in the oil stocks.
Also, both Halliburton and Schlumberger came out with ROSY financials reporting much higher net incomes in Q2 2022. However, even with Schlumberger reporting a whopping $1.5 billion net income profit 1H 2022, the company is still paying a LOUSY 13 cents per share dividend vs 50 cents a share a few years ago.
Lastly, why has Schlumberger’s outstanding shares increased from 1.2 billion to 1.4 billion from 2009 to 2021, while long term debt has also increased from $4 billion to $13 billion over the same period with lots of positive FREE CASH FLOW??
steve
Steve
“Without oil production growth, there is no GDP growth. Soon, the world will realize this critical relationship.”
So true. The ESG groups and the environmental NGOs don’t realize this. Until the world realizes that the transition to Green has to be planned, the oil producers and Enviro groups will be talking at cross purposes.
Nothing like a crisis to wake people up. Gas crisis spurs Germany to mull extending life of nuclear plants.
https://www.reuters.com/business/energy/gas-crisis-prompts-germany-consider-extending-life-three-remaining-nuclear-2022-07-18/
In Canada we have a Prime Minister and Environmental Minister that are bent and bound on shutting down the oil sands. The US SEC is on a similar track to cut oil production by making oil refiners account for downstream emissions.
https://www.cbc.ca/news/canada/calgary/oil-carbon-emission-disclosure-1.6470117
It is pretty clear that most advisors these days will not recommend oil stocks or natural resources. While oil stocks are holding up, but down 10% to 15%, copper stocks have fallen more. Surprising with EV demand increasing.
I wonder what Buffet’s experts have figured out. He continues to buy OXY.
https://finance.yahoo.com/news/warren-buffett-morning-brief-july-23-110012203.html
Ovi,
Agreed… 100%. However, while the ESG and Anti-Oil & Gas policies have been a bit of a BUMMER for Global Upstream Investment, the data suggests problems were already beginning to occur before ESG became much of an issue.
In looking at the Rystad & BP Statistical data for these two periods:
2010-2014 Global Oil Investment = $3.6 trillion
2010-2014 Global Oil Discoveries = 51 billion barrels
2010-2014 Global Oil Demand = 140 billion barrels
2010-2014 Demand vs Discoveries = 2.7 to 1 (barrels)
2015-2021 Global Oil Investment = $3.4 trillion
2015-2021 Global Oil Discoveries = 38 billion barrels
2015-2021 Global Oil Demand = 207 billion barrels.
2015-2021 Demand vs Discoveries = 5.4 to 1 (barrels)
The takeaway from this data set shows that even with significant global oil investment, we aren’t finding that much oil. Sure, the global oil investment from 2015-2021 was less than 2010-2014, but oil companies aren’t too stupid to realize they’re just isn’t that much good quality out there remaining.
For example, Offshore oil exploration has been a complete mess in the past 5-10 years with DRY HOLE percentages surging. The only Outlier has been Offshore Guyana. But, that Sweet spot won’t last forever and will not offset the declines coming.
Furthermore, the Demand for oil versus Discoveries has doubled from 2.7 barrels during 2010-2014, to 5.4 barrels from 2015-2021. Thus, the issue isn’t that we aren’t spending enough money on finding new oil… THE LORD GOD & MOTHER NATURE only provided us with a certain amount of high-quality oil, and we had a great deal of fun burning most of it in the past 100 years.
Lastly, with the Coming Collapse of the Global Debt Market, that will also pop the Global Assets. The collapse of the Global Asset Market will destroy the ability to produce oil in the future.
Thus, we have the ENERGY CLIFF.
steve
That pesky shark again!
Steve
You and I have discussed the declining discovery trend as presented by Rystad. 2021 was pretty bad year.
Could you please explain “the Coming Collapse of the Global Debt Market,”
Ovi,
With global debt increasing from $97 trillion in 1997 to over $300 trillion currently (International Institute of Finance data), the world has to service this debt. Servicing debt becomes increasingly difficult when interest rates rise, either the Fed Funds rate, or the Real market rates.
Increasing debt only works in an environment of rising oil production. The Fed & Central banks have lowered interest rates to offset the Falling EROI of Oil (Energy), which has been propped up by the massive debt. Thus, the massive increase in global debt, as well as lowering interest rates, were used to OFFSET the Falling EROI of oil.
But, again… that only works in a rising oil supply environment. When global oil production peaks and begins to decline, it becomes increasingly impossible to service this debt or to roll it over. Thus, the Global Debt Bubble begins to burst.
However, someone’s DEBT is another POOR SLOB’S ASSET. Thus, the collapse of debt means the collapse of assets, especially, pension plans, 401ks, retirement plans, insurance funds, and so on and so forth. This leads to the collapse of BUYING POWER as assets collapse.
Hence, the collapse in the ability to fund and produce future oil production.
steve
Decade of Deficit: https://reason.com/2020/01/10/in-the-2020s-dealing-with-the-national-debt-will-no-longer-be-optional/
Defaults affecting >1 billion people coming (or already here for Russia and Sri Lanka…): https://www.bloomberg.com/news/articles/2022-07-07/why-developing-countries-are-facing-a-debt-default-crisis
Next up:
Argentina, Egypt, El Salvador, Ghana, Kenya, Pakistan, Tunisia…
The number of countries doubled in past 6 months…no doubt the 2022 oil-shock played a major role…
You can also look at this issue from another standpoint- demographics.
A growing population is related to growing gdp, growing worker pool, and ability to service debt.
Some countries are rounding the top on population such as Italy and Japan, with many others on their heels.
Even China soon- with a new internal report suggesting peak population for China in 2023.
This population peak and then decline is necessary since the population has grown to far exceed the longterm carrying capacity in every country on earth.
But a consequence is that for most countries the ability to service the debt will become more difficult as the population ages- less workers.
Just as with global warming, this population quandary is a very inconvenient truth.
Why will there be no access to debt? This seems a rather far fetched scenario.
I think that the easy/cheap credit might indeed have “deformed” a more traditionally expected shape of extraction levels, since it has enabled drilling of more expensive sources, e.g. shale, before the oilprice, regulating supply/demand, has reached a high enough price to motivate it, so to say. Thereby pulling forward extraction that otherwise would have been done later, smoothening the curve.
(Haven´t studied Steves work in detail, will do. Seems to be a slightly different angle, but same result)
Edit: come to think of it, cheap credit has also heavily affected the demand side.
The diagram says no debt vs access to debt, that seems farfetched. Perhaps more debt and less debt would be believable, but I doubt the curve is affected very much, unless there is a severe economic crisis, which I think is only about one in 5 probability over the next 8 years or so (I am talking about a Depression level event, with Worldwide GDP dropping by more than 15% in real terms.)
A 20% chance of a Depression level event with Worldwide GDP dropping by more than 15% in real terms seems kinda like a potential shit storm to me; perhaps a risk worth preparing for. A Depression level event on the back of a climate induced global harvest disruption, is sure to break a lot of porcelain.
A 20% probability of an event occurring that would cause catastrophic losses, injury or death is considered extremely high risk.
Those that lend all the real money into the economy are saying the probability is more like 95% instead of 20%
Okay, this video is just hours old. It covers Middle East oil, Russian oil, Former Soviet Union oil, Mexican oil, Canadian oil, and US oil including the shale revolution. It will cover a lot of stuff you already know but also a lot of stuff about which you had no idea. You will not regret watching it. It is just a tad over 18 minutes in length.
The Real Map of Oil – Peter Zeihan Oil Update
Ron – Great video, I also found this one really informative WRT to the EV/renewables debate…
https://youtu.be/CNn5T0rNzOw
Thanks Ron, PZ is just so lucid, he knows how to connect the dots.
Most of Zeihan’s videos are worth watching. Although I don’t agree with all of his conclusions because some of his conclusions are based on the abundance of shale oil and gas.
But for those who think a global transition to renewables is in the cards I’d recommend watching his video on solar and wind energy and look at his breakdown global map where there is enough solar intensity where solar makes sense and where wind makes sense.
Majority of EV will be powered by burning fossil fuels and nuclear.
He believes higher prices are coming. Which I don’t agree with.
I really like Zeihan. I don’t agree with him however, that China is going to go away quietly in the night.
They are likely to have hundreds of millions of starving lunatics running around and they are well armed.
Nuclear ICBMs and Submarines.
He believes higher prices are coming. Which I don’t agree with.
I do agree with him on that….. in spades!
His line of thought on price is Russian oil being shut in. Which hasn’t happened. And prices going high enough that the US also stops exports to contain domestic prices.
Sanctions more or less have no teeth and are or have been for more or less media consumption so it looks like the west is doing something.
Eurodollar market didn’t cut Russia off of dollar funding. Banks don’t give a shit. And will gladly fund for a profit oil coming out of Russia.
It’s pretty clear by the exchange rate USD/RUB that banks have no problem with this.
As oil prices fall though it will be less attractive for those banks to engage in lending dollars to move oil out of Russia.
I think the bigger problem though is Japanese banks that lend dollar funding into China are in trouble. Without explaining in detail why this is other than it being a collateral issue. Just watch the USD/CNY exchange rate. As dollar funding becomes scarce.
USD/RUB is strong because Russia is receiving rubles but the sanctions make it very hard for them to actually spend them so they are accumulating. In a way they are running their balance sheet through their income (and cashflow) statement.
rgds
WP
Banks know how to swap dollars for rubles. That is why USD/RUB is where it is. Without the actual swaps RUB doesn’t have a bid.
Eurodollar system doing exactly what it is suppose to do. In this regard.
US banks are not trading Rubles. Bloomberg doesn’t even quote it anymore – it has been frozen. EU banks are trading RUB in limited quantities to pay for gas purchases. The quotes you’re seeing are largely indicative but it is unlikely that you can trade in any meaningful quantity.
Rgds
WP
Nobody said anything about US banks. Banks outside US can swap Dollars for Rubles or whatever currency they want to swap for.
And we aren’t talking trading USD/RUB in spot market. We are talking large mega banks outside US swapping large amounts of dollars for Rubles with other large mega banks that have access to rubles.
We are talking the actual purchasing of oil not paper trading currencies.
Using US dollars to buy rubles to buy oil. It’s happening and on a rather large scale judging by the move in the value of the RUB against the USD.
Banks on behalf of their clients take US dollars swap with other banks at a fee of course for rubles or whatever they need. These swaps do require collateral. But the client gets what is needed to buy the oil from Russia.
Russia gets paid in rubles. Client can turn around sell the oil for a profit and in dollars. Bank gets paid back in dollars.
Since Russian oil is discounted at the moment this is working well making money hand over fist.
But when price oil collapses as we head into recession this won’t be so profitable and USD/RUB will head the other direction.
I’ve heard various rumors that the Ruble has been pegged to the price of gold since May. Can anybody confirm or debunk this?
It appears to have been a temporary move:
https://theconversation.com/why-russia-has-put-the-rouble-on-a-gold-standard-but-its-unlikely-to-last-180632
Rgds
WP
The Western service companies leaving Russia will have a far greater effect than any economic sanctions. The production problems will become apparent gradually then all at once.
the higher prices are here for me atleast
gas + leccy , from £1170 to £2800 in one year . predicted further 20-40% on top in October.
there is no consumer society when there’s no money to spend on goods and services.
Forbin
I looked it up for those like me unfamiliar-
‘Leccy’ is short for electricity
Hickory, it’s a Brit thing 🙂
British pound is down about 13% from its peak on Jan 13 (vs the USD I imagine, but we’ll let HHH elaborate). So everything is getting more expensive if you are in England. And Nat Gas is one of the few commodities left in the world trading bullish. So its a double whammy.
This is read almost verbatim from his new book, “The End if the World is Just the Beginning.”
The section on energy is pretty good, but he is under the opinion that the shale oil and gas is in such abundance that it will forever shape geopolitical hegemony.
exchange Coal-to-Liquids for shale oil and adding in other resources from Canada ( Tar Sands )
and Australia ( Coal, Rare Earths, Gas, others).
And Zeihan is on to something IMO.
America can largely detach from the Gobal World and have a future to look forward to relative to others.
Only if they also build their own dome to separate themselves from the fallout from that move. Climate change knows no borders, even if you can power your A/C in summer and boilers in winter, you’ll be having to deal with everything that scenario throws your way.
There’s no getting away from consequences. Just alternative paths.
I think Zeihan often overplays the US’ cohesion and resilience to the same extent he downplays China’s.
“relative to others”
I prefer my collapses slow and drawn out vs ABRUPT
Yeah, but that’s boring. You’re boring.
Beat the rush, collapse now.
Further to your comment below, I wrote that up: https://www.spectator.com.au/2022/07/we-will-win-chinas-war/
Zeihan’s rants can all be reduced to “People I hate will fail”. It’s an exercise in wishful thinking gone wild.
I agree, Zeihan finds interesting facts and figures & brings interesting points to the discussion, often ones I like to look into further, but his conclusions are very America-centric, likely because his analysis is very ethnocentric, and lacks balance. He is “objective” in that his analysis is devoid of Democrat & Republican talking points.
Yes, he has an extremely strong view on China…is he correct? If I had to guess, I’d say prob. so…
https://www.barrons.com/amp/articles/china-xi-jinping-economics-rise-51655929850
My biggest issue with him is he thinks US has >100 years of oil/energy…
@KenGeo
Australia and the US have 40% of the worlds coal reserves. Throw in the Canadian Tar Sands that is a lot of energy.
No one is going to sit on an energy abundance of that nature hoping to get to Net Zero carbon emissions.
Without the American Military (or the British? French?) Australia will be turned into dog food by the Chinese.
Resources for Military.
And it is a win-win for both parties.
Americans and Aussies like to have sex with each other.
And the military relationship has been there for decades…….
Peak avocado,
The coal and oil sands are expensive sources of energy relative to alternatives, perhaps if my guess that $15/MMBtu gas becomes the norm in North America and Australia those resources will make a comeback, but wind and solar are far cheaper and are likely to replace most coal fired power as well as natural gas. By 2042 at the latest and perhaps 2028 at the earliest oil prices will start to fall due to lack of demand as EVs replace ICEVs over time.
@Dennis
They are expensive to produce, yet are being produced today.
100 dollars a barrel vs 150 – 200 barrel…is Granny knitting you a sweater instead of getting you the latest “fashion du jour”.
When we get to 500 a barrel, then I’m listening.
I want meat, taters and water where I live.
Peak Avocado,
Yes they are being produced (coal and oil sands) and will continue to be produced, but less and less over time as they are expensive relative to alternatives. I expect coal will be replaced first and oil sands will no longer be developed after 2042 as conventional oil resources will be the only profitable oil resources as oil prices start to fall (2030-2040 for start date depending upon the speed of the transition to electric transport). By 2050 there will be far less oil sands development an coal production is likely to be far lower.
@Dennis
Good ideas.
If I am investor, and have to make an investment over a multi-decadal timescale.
I want something that works.
Liquid fuels work. CTL works.
South Aftirca immediately went to CTL when they got oil embargoed.
That is the blueprint for what countries with coal reserves will do.
The political roadblocks to using it (environmental – climate change) will end abrubtly when gas rationing and long waits in line to get fuel start happening.
“The key to a successful invasion, is an invitation from the country you want to invade”
Peak Avocado
Australia has a population smaller than Florida and a hydrocarbon resource that would make Texans blush. Rare Earths, Farmland, etc, etc ,etc
Australians do not want to become communists or give up the fun loving culture of the “Lucky Country”.
Military is the only way to sustain it.
I often pointed to China as a case study in how fast one can lose approx 14%, ish, of your oil production rather quickly; see 2016 to 2018, ish.
Now they seem to be a little bit on the upswing; any thoughts about the details of that here; how, at what cost?
Survivalist, here is a partial answer.
China’s Big Oil to pour cash into boosting domestic output
China’s big three state-owned oil and gas companies are raising their capital investment budgets this year to the highest level seen since 2014 amid an energy security push from Beijing to boost domestic production.
In his annual address to the National People’s Congress last month, Premier Li Keqiang put “enhancing domestic resource production capabilities and expediting exploration and production of oil, gas, and minerals” as a key element of the government’s “stability” agenda for the year. He barely mentioned the sector in his 2021 speech.
The agency set a domestic production target for the year of at least 200 million tons of crude oil. This would be the highest output since 2015 and compares with last year’s 198.98 million tons. (200 MT/yr is 4,000 kb/d which is lower than June production of 4,183 kb/d)
Big Oil quickly showed it had gotten the message from Beijing.
JUMP. HOW HIGH.
Maybe Biden should try the same message. 🤣🤣🤣🤣
https://asia.nikkei.com/Business/Energy/China-s-Big-Oil-to-pour-cash-into-boosting-domestic-output
Ovi, thanks so much for your time. China seems quite opaque. I appreciate all the work you and others do here.
Energy rationing.
Coming soon to countries you may be familiar with-
https://www.ft.com/content/619946ac-94b9-4d93-bc7f-d458dfc8b39a
https://www.iea.org/commentaries/coordinated-actions-across-europe-are-essential-to-prevent-a-major-gas-crunch-here-are-5-immediate-measures
https://foreignpolicy.com/2022/07/11/europe-energy-crisis-natural-gas-russia-nord-stream-1/
Currently, gas storage facilities in the European Union are 64% full. 0.4% daily up. At least last week. Poland and Portugal are almost 100% filled. The disaster is in Ukraine (22%). They will have a very hard winter. They also have problems with coal. Especially with anthracite. But this is not a surprise.
https://agsi.gie.eu/
The storages are not able to cover the full consumption – they are sized for the continous streaming of russian gas the whole winter long.
And most storages in Europe are small, only a buffer for a few days. The exception here is mostly Netherlands, Germany and Austria.
Yeah, the UK’s Rough facility before it got decommissioned held barely a week’s worth of gas, hence it closing wasn’t a case of the Tories fucking the nation with high prices: it would have changed nothing.
Europe’s storage being near full just means rationing will be less pronounced to start with. For the first month.
Opec+ compliance surges to 320pc in June: delegates
Several members of the coalition are struggling to meet their targets, hampered by years of underinvestment, infrastructure issues and sabotage. The compliance figures are also skewed by the impact of sanctions and custom boycotts on Russian production. Although Russia managed to raise its output by over 550,000 b/d last month, it was still 880,000 b/d below quota, according to Argus estimates. Moscow, the de facto leader of the non-Opec contingent, has not requested an exemption from its Opec+ commitments.
https://www.argusmedia.com/en/news/2354203-opec-compliance-surges-to-320pc-in-june-delegates
GUYANA POISED TO BREAK $1 BILLION IN OIL AND GAS REVENUE THIS YEAR
“Guyana is the global leader in total offshore discoveries since 2015, with 11.2 billion barrels of oil equivalent, amounting to 18% of discovered resources and 32% of discovered oil. Of the total, a whopping 9.6 billion barrels are oil, far outpacing the US in second place with a comparatively small 2.8 billion barrels. The Stabroek block accounts for all of these finds, but recent discoveries in other areas show the potential for growth elsewhere. “
https://oilprice.com/Energy/Crude-Oil/Guyana-Poised-To-Break-1-Billion-In-Oil-And-Gas-Revenue-This-Year.html
And, from today’s New York Times
CONGO TO AUCTION LAND TO OIL COMPANIES: ‘OUR PRIORITY IS NOT TO SAVE THE PLANET’
“The Democratic Republic of Congo, home to one of the largest old-growth rainforests on earth, is auctioning off vast amounts of land in a push to become “the new destination for oil investments,” part of a global shift as the world retreats on fighting climate change in a scramble for fossil fuels.
The oil and gas blocks, which will be auctioned in late July, extend into Virunga National Park, the world’s most important gorilla sanctuary, as well as tropical peatlands that store vast amounts of carbon, keeping it out of the atmosphere and from contributing to global warming.
“If oil exploitation takes place in these areas, we must expect a global climate catastrophe, and we will all just have to watch helplessly,” said Irene Wabiwa, who oversees the Congo Basin forest campaign for Greenpeace in Kinshasa.”
NB Not sure if this should be here or in non-oil thread (or both).
https://www.nytimes.com/2022/07/24/world/africa/congo-oil-gas-auction.html
we will all just have to watch helplessly
I thought we already were.
I’m well passed the “oh my god everything is fucked” phase of my life & long ago entering the “oh my god everything is fucked lol” phase. But hey, I’m cynical.
Pretty much.
Can’t change fate. Might as well grab popcorn.
Oil Flat as New Questions about SA Spare Capacity vie with Demand Worries.
WSJ report says Saudi Arabia can’t pump much more.
“People familiar with the operations say Riyadh would struggle to produce 11 million barrels a day for more than a few months at a stretch and 12 million barrels a day for more than a few weeks,” the report says.
They cite field maintenance requirements, declining production at some fields and technical issues involving pressure levels. During the pandemic, when oil demand fell, state oil company Aramco reduced drilling rates. Boosting them up again too quickly or injecting wells with fluids, a common practice to boost production rates, could cause longer-term damage.
Saudi Arabia hit 12 million barrels a day in April 2020, according to people familiar with its oil field operations, amid a pre-Covid-19 battle for market share with Russia. Engineers at Aramco, formally called the Saudi Arabian Oil Co., say the kingdom can’t sustain that level for longer than a few weeks.
This link references a WSJ report.
https://www.forexlive.com/news/oil-flat-as-new-questions-about-saudi-spare-capacity-vie-with-demand-worries-20220722/
Brazil offshore projects don’t appear to use predrilled subsea wells so it can take up to a year for the big FPSOs to ramp up to full production.
Nigeria will add some production now as a shallow field Total project has just started with 50kbpd capacity.
The big Mad Dog II (aka Argos) project start-up is delayed in the GoM because of equipment problems (so 120 to 140 maybe early next year – I think there have been a number of predrilled wells so a large chunk will come on quickly). The King’s Quay project is ramping up too through the remainder of the year.
Hi George – Wondering if you might be able to update your post from a little over a year ago:
“Annual Reserve Revisions Part IV: Shale Producers”
I think it might be a good time to revisit…
It’s a lot of work to go through all the annual reports. It was OK during various lockdowns and when the information was new to me but at the moment I have other things I’d rather be doing. I might look at something when winter comes especially if, as seems likely, the UK economy continues to deteriorate and society starts to unravel, but it would probably be something simpler like GoM reserves or Brazil production.
I don’t kid myself that these posts make much difference; if the presented data agrees with a readers preset ideas they’ll skim through it and maybe give you a “nice post”, if not it will be either dismissed or, at best, a couple of straw men picked out. So mostly I just do posts for my own interest. Getting the data originally showed up some interesting things, incrementing it gets a bit tedious.
No problem, just found the info particularly interesting and wanted to point out that it’d be great to see another post that does a “deep dive”. Understand that it takes a lot of time to compile and present the info…thanks for all the hard work!
From Oil & Gas Journal
ExxonMobil has made two new discoveries offshore Guyana to the southeast of the Liza and Payara developments in the Stabroek block. Discoveries at Seabob and Kiru-Kiru are the sixth and seventh in Guyana this year, with the total number of discoveries in Guyana at more than 25, the operator said in a July 26 release.
The Seabob-1 well encountered about 131 ft (40 m) of high-quality hydrocarbon-bearing sandstone and was drilled in 4,660 ft (1,421 m) of water by the Stena Carron drillship. The Kiru-Kiru-1 well encountered about 98 ft (30 m) of high-quality hydrocarbon-bearing sandstone and was drilled by the Stena DrillMAX in 5,760 ft (1,756 m) of water. Drilling operations at Kiru-Kiru are ongoing.
ExxonMobil’s 2022 investment plans include further exploration drilling and resource development in Guyana, where it is already increasing production at an accelerated pace, the company said in the release.
Two floating production storage and offloading (FPSO) vessels operating offshore Guyana—Liza Destiny and Liza Unity—have exceeded their initial combined production target of 340,000 boe/d, the company said.
A third project, Payara, is expected to produce 220,000 b/d. Construction on its production vessel, the Prosperity FPSO, is about 5 months ahead of schedule with start-up likely before yearend 2023. The fourth project, Yellowtail, is expected to produce 250,000 b/d when the ONE GUYANA FPSO comes online in 2025.
Guyana’s Stabroek block is 6.6 million acres (26,800 sq km). ExxonMobil affiliate Esso Exploration and Production Guyana Ltd. is operator with 45% interest. Hess Guyana Exploration Ltd. holds 30% interest, and CNOOC Petroleum Guyana Ltd. holds 25% interest.
ESG concerns and the resultant restriction of the fast burn (quick peak, then rapid decline) of fossil fuels.
Examples of imposed restrictions on fossil fuel sales-
Venezuela- Governance and Social [G/S] concern. This is by and large not a partisan issue in the US.
Iran- Governance and Social [G/S] concern. This is by and large not a partisan issue in the US.
Russia- Governance and Social [G/S] concern. This is by and large not a partisan issue in the US.
Whatever the reason (including concerns over global warming [E]), its only a matter time that fossil fuel production is less than demand.
We have terms describing the problem- finite resource, resource depletion, population overshoot.
Might as well get on with the adjustments now even if
a little late considering the graffiti has been on the wall front and center for the past 50 years.
The upside of Covid – knocked a couple years off demand increases. Just need a few more of those in the next ten years and… oh wait, did I say that out loud?
Cheeky monkey….pox
CAPEX in energy
Article on global energy sector capex here, with some detailed chart projections by sector
from IHS Markit-
“Fossil fuel capex took the largest hit in 2020 and upstream capex is unlikely to reach 2019 levels until 2023.”
“Global energy sector capex was over $1.5 trillion in 2021 as economic activity increased following the global downturn in 2020. Energy spend was directed mostly toward transmission and distribution at $363 billion, upstream oil and gas at $341 billion, and renewable energy at $315 billion. Over the five-year period from 2021-2025, cumulative global energy sector capex is projected to increase by 18% compared to the 2016-2020 period. In 2021-2025, transmission and distribution spending is projected to increase by $433 billion, followed by renewables at $367 billion and oil and gas spending at $209 billion.”
https://ihsmarkit.com/research-analysis/global-energy-sector-capex-strong-rebound.html
note- no comment in the article about whether the current data and projections take into account the new global energy situation after Putins withdrawal from the ‘western’ economic sphere.
This article was posted March 4,2022 and therefore likely does not reflect the new scenario.
I suspect that global energy sector capex will be much higher than they projected over the 2021-2025 period, as a result of the new landscape which highlights the great energy vulnerability to a wide swath of the population who had been sleepwalking in perceived energy bliss state.
Maybe this will lead to less oil extraction going forward…?
Cash flow would otherwise be quite good currently, with these prices, nést pas?
Natural gas prices are back over $9 this morning, with Europe almost certain to have shortages this winter. Once the Freeport LNG terminal opens back up in September or October expect major increases from this level for US this winter, possibly 50-100%.
I finally got around to reading the entire peak oil report that has been discussed here for the last week or so:
How much oil remains for the world to produce?
I think the report is far more pessimistic than many realize. Less Canadian oil sands and Orinoco heavy oil, they say the peak is right now, or rather 2019.
By contrast, production of conventional oil including LTO (blue line) has been increasing, but even if we exploit this oil fully, it is forecast here to reach a peak roughly about now. If we assume in addition that we can rapidly and fully exploit the extra 500 Gb or so of heavy oil from Canada and Venezuela (green line), this delays the global peak to about 2030.
So, if we assume everything except heavy oil from Canada and Venezuela has peaked, and if we assume, as I do, that this oil has begun to decline, then the question is can Canadian and Venezuelan heavy oil be ramped up fast enough to stave off the peak until 2030? Really now? That is laughable!
But, if you wish to count natural gas liquids as oil, which it ain’t, then that delays the peak a bit longer. Obviously natural gas has a bit longer to before it peaks.
I mean, hey, I am not going to argue with Jean Laherrère, Charles A.S. Hall, and Roger Bentley. I think they have done their homework. If anyone else feels they are all full of crap, then that is your prerogative. 🤣
Hi Ron,
it would not suprise me if they classified coal as ” super heavy oil”…..
Hi Ron, it is a shocking report, with shocking implications. I wonder what the downslope will look like.
Peak Oil: Its Impact on Food Systems and Public Health
“The resultant escalation in both oil and food prices could have impacts from widespread food insecurity to famine. The level of crisis will be determined by the extent of preparedness and food system resilience, as well as the speed of price rises and other factors.”
https://clf.jhsph.edu/about-us/news/news-2011/peak-oil-its-impact-food-systems-and-public-health-0
Google search for “Peak oil (plus) public health”:
https://tinyurl.com/3hxnbhcc
Cue the famine
For those on this site still minimally open minded about ‘how stuff works’ regarding unconventional hydrocarbon development, news coming out regarding EOG’s re-engaging in Ohio’s Utica oil production offers several intriguing data points.
The Rose well – located in Carroll county (fringe of Utica oil) – produced ~700 bbld and ~3 million cfd gas its first 15 days online.
The fact that EOG is building a takeaway pipeline and – reportedly – accelerating land acquisition, indicates that EOG may have ‘cracked the code’ in optimally extracting liquid hydrocarbons in this area.
Ohio is sitting atop huge, huge amounts of OOIP. The biggest hurdle has been finding a way to economically accomplish the recovery of this resource.
$100/barrel pricing certainly helps.
This approach applies to numerous other under developed, hydrocarbon-rich basins as well as expanding viable acreage (Tier 1/2/3, etc.) in the more well known ‘shale’ formations.
Estimate of Utica recoverable percentage gas vs oil content?
Thanks for the updates.
Hickory,
I am not sure that I understand your question.
The Ohio Utica covers a big area with several varying characteristics.
The so called Deep(er) Utica in Belmont and Monroe counties is ~100% dry gas.
Extending west/north/northwest, the rock contains more liquids with ‘condensate’ (high api oil) making up a high percentage of produced hydrocarbons.
This Rose well is shallow (7,000 feet) and was frac’d with a relatively modest ~350,000 bbls of water and all sand proppant.
Essentially, a ‘cheap’ well to D&C.
If some online rumors prove accurate – that EOG is using high pressure gas lift for recovery purposes – the ramifications could be far ranging beyond Ohio.
I was wondering what the rough split between oil and gas potential is for the Utica shale zone.
Seems like an answer ‘to be determined’, considering all the various layers and evolving recovery techniques.
Coffeeguyzz,
EOG was once focused on the Eagle Ford. A new focus on the Utica may simply mean they have run out of good areas for further investment in the Eagle Ford, much of the “liquid” from the Utica may be ethane, propane, and butane and of little help with land transport, but useful in industry and for drying crops, heating. and cooking.
Dennis,
LOL.
Ohio reports all NGLs as Natural Gas.
No sense in engaging in idle speculation.
Next week EOG has their Quarterly Presentation.
If the attendant analysts are half way astute (constant crap shoot there), more pertinent info may emerge.
I will leave you with this. However …
EOG has been widely mocked for labelling their promising acreage as Super Duper, Double Premium, yada yada.
Essentially, for EOG to invest ANY substantive funding in projects, the company expects very high rate of returns.
Whatever the hydrocarbon composition mix may be with this new Utica venture, its economic viability is pretty much pre-ordained.
Much more important issues are just how ‘big’ EOG will push this, if other operators can mimic the process, and – of highest significance – if their procedures can be implemented in other areas of the country.
Coffeeguyzz,
Looking at Ohio’s C plus C output so far, it is not really a big deal for oil. Perhaps there will be a lot of natural gas, but I focus less on that because supply has been relatively ample in the US. As more and more LNG export capacity comes online this may be less the case because US prices will move closer to World natural gas prices (less costs to liquify, transport and convert back to gas). That is in part why we see Henry Hub futures at about $9/MMBtu. Currently the spread between European Natural Gas (TTF) and Henry Hub in the US is about $50/ MMBtu. The futures curve shows this spread falling to about $10/MMBtu by Dec 2025, with TTF falling to $15/MMBtu by Dec 2025 and Henry Hub falling to $5/MMBtu.
Note for comparison that the futures market expects WTI to fall to $70/bo by Dec 2025, so it seems to be very optimistic. This is likely too low by at least 50% imho. If we assume the futures spread for TTF and Henry Hub is correct, but the overall price level is too low by 50%, this would imply natural gas prices of about $15/MMBtu at Henry Hub and $25/ MMBtu at TTF in Dec 2025. This might make solar, wind, hydro, and nuclear power much more attractive going forward and we will see fewer new natural gas electric power facilities and their replacement with non-fossil fuel sources as these other sources will be far more profitable by comparison.
“That is in part why we see Henry Hub futures at about $9/MMBtu.”
That nat gas price level makes utility scale Photovoltaic Energy look cheap, except perhaps in the cloudiest parts of the country.
btw- in 2021 the US added the equivalent energy output from over (3) 1000MW nuclear power plants in the form of utility scale PV, and almost another one in smaller scale installations.
Hickory,
Yes the high natural gas prices may make new natural gas power plants a thing of the past and may lead to the shut down of many less efficient peaker natural gas power plants. Solar will take care of much of the daytime peaks, and wind, solar, hydro, geothermal, and nuclear power will handle 90% of electricity output over time, the balance may be handles by batteries, synthetic fuel, biofuel, waste burning, and maybe a bit of natural gas. We may see long term natural gas prices at $15/MMBtu in the US and other exporters and $25/MMBtu for importers of LNG, this will be a boon for solar and wind power througout the World.
reply below (so i can post a chart)
Lots of coal. Cheap and reliable. Texas is sorry they gave it up for windmills. Store it on site in piles.
Price predictions always seem to be based on short term thinking. When oil was at -$38 there was plenty of gloom and doom about how prices would never recover. In fact it was a short term event mostly caused by the pandemic. Now we have a spike caused by a war, and the herd can only imagine higher prices.
The cost of producing oil hasn’t changed much and its value to the economy (i.e. the price consumers are willing to pay in a pinch) is if anything slowly decreasing, as alternatives and efficiencies spread. Prices will continue to be volatile, but its hard to see why the there should be a long term trend in price.
Alimibiquated,
The long term trend in crude plus condensate demand has been an annual rate of increase of about 800 kb/d from 1983 to 2019 (37 years). It is possible this rate of growth will not continue beyond 2021 (with growth interrupted by the pandemic in 2020 and 2021). World oil supply will have difficulty keeping up with increased World demand as the World economy continues to recover from the pandemic. The fall in OECD oil stocks gives a clue as to the state of supply and demand, unfortunately we do not have very good non_OECD storage data so World stock levels are unknown.
My expectation is taht oil prices will remain in the $100 to $120/bo range for the next 2 to 3 years, what happens to supply and demand for crude plus condensate beyond 3 years is impossible to guess accurately, but my expectation is that until there is a severe World economic downturn (-2% annual real GDP or worse) that the World oil market will remain tight with real oil prices at $100/b or more in 2021 US$ until 2030 and perhaps until 2040 (with the later date due to a slow transition to electric land transport and the earlier date corresponding to a fast transition to EVs).
Hickory,
Yes, exactly.
Way back in 2008, Questerre brought online a handful of successful dry gas Utica wells 60 south of Montral, Canada.
It is a gigantic, discontinuos formation containing the entire spectrum of hydrocarbons.
In Ohio, specifically, the low realized price for oil has been a big impediment for vigorous drilling. (This, despite numerous refineries in the general vicinity).
Somewhat similar to the Eagle Ford, there are regions where dry gas, liquids rich, or primarily oil are predominate underground.
Ohio jumped from 47 BOPD in 2/22 to 61 BOPD in 4/22.
To really have an oil price impact that needs to get to what level, 500k BOPD?
Ohio C plus C output using EIA data.
Great article by Richard Heinberg. It discusses the recent research paper by Jean Laherrère, Charles Hall, and Roger Bentley. I only quote the first paragraph.
Will civilization collapse because it’s running out of oil?
Will civilization collapse because it’s running out of oil? That question was debated hotly almost 20 years ago; today, not so much. Judging by Google searches, interest in “peak oil” surged around 2003 (the year my book The Party’s Over was published), peaked around 2005, and drifted until around 2010 before dropping off dramatically.
And now that peak oil is upon up, no one seems to notice. Ironic! Anyway, read the article, it is great.
Yea, read it.
Heinberg is always insightful.
When living in Santa Rosa, frequently saw him on the trail.
Ron,
I agree, a well written article.
I went back and looked at the USGS World Oil Assessment from 2000 and an update in 2012. The USGS expects conventional oil to have a URR of 3000 Gb, rather than the estimate of 2500 Gb by Laherrere et al. Laherrere has about 1000 Gb for unconventional resources, my guess is about 200 Gb for unconventional crude plus condensate. So combining the USGS conventional estimate of 3000 Gb and my unconventional estimate of 200 Gb results in about 3200 Gb for C plus C vs the Laherrere et al estimate of 3500 Gb.
Currently there are 22 basis points between the 3 months T-bills and the 10 year treasuries.
FED will likely raise FED’s funds rate by 0.75% later today. We really aren’t that far from the entire treasury yield curve being inverted.
Not far from monetary plumbing breaking down.
And oil prices will head lower as a result.
I genuinely cannot wait for cheap oil I cannot buy with my increasingly worthless paycheque.
Nippon Steel inked an annual deal for thermal coal through March at $375/ton
https://www.bloomberg.com/news/articles/2022-07-27/glencore-strikes-one-of-japan-s-most-expensive-ever-coal-deals#xj4y7vzkg
Any news as to why the Brent/WTI spread has grown to over $10?
Is this due to US Admin discussion of reinstating the crude oil export ban?
Can’t think of any other reasons, given we are drawing 5 million plus per week BO from SPR and most weeks are commercial draws as well.
There was actually a negative WTI reaction to the EIA weekly despite over a 10 million BO combined crude draw from commercial and SPR.
Games on the paper market I think.
Some recession expections, big players going in or out of shorts.
They played dead the aluminium market at the moment – prices falling because of recession expectation, but you can’t fill your order sometimes because of disruption of russian deliveries and high energy prices forcing cutting production. These ends will connect soon again, most times one of the paper players sit’s on a huge pile of losses then. Wouldn’t be the last hedge fond going bust.
A fast export ban would be a disaster for US oil companies. LTO will get unsellable until they cut down production by round about 40% (full drilling stop for almost a year) – and on the world market prices will moonshot because of the 3 mbpd light oil are missing.
An adjustment need to be done slowly by giving deadlines and declining quantities, or regulation of drilling permits. Adjusting the reffineries will take time. Otherwise upstream and service companies will take huge damage.
Well, WTI reversed itself some, now back to $97.
Always lots of volatility in the crude market.
Shallow sand,
It is fairly clear that an exprt ban is not very likely. Such a move would ensure Democrats would lose both houses of Congress in the fall as the result would be higher World crude oil prices due to lower output in the US in response. As you know we don’t have refining capacity in the US for more than about 4600 kb/d of tight oil, so a ban on US exports of crude oil will take about 3000 kb/d off the World market. leading to a significant spike in oil prices. Any Democrat that thinks this is a good idea has never taken an introductory course in economics, or should have gotten an F if they did.
Hey maybe some Republicans will join with the Democrats as Biden would be blamed by voters and the Democrats will take the hit.
Export restriction will come later in the decade.
Swaps for refining mix optimization will be spared.
Dennis. I’m just speculating on the reason for the widening spread.
I don’t like that our hard to find 31-36 API light sweet and our heavier sweet 25-29 API gets priced off more abundant US shale.
We probably need to negotiate harder?
There is a 7/25 Reuters article that blames easing gasoline demand in the US for the increasing the WTI/Brent spread.
Not sure about this. US gasoline demand seems like a 20 year old metric in terms of importance. That demand peaked in 2006.
Yet we just drew 10.1 million BO last week from US inventories despite this weak demand.
Dennis, have you ever given thought to the idea that conversion to EV’s isn’t going to solve the crude oil supply problem? I’m sure we have discussed that?
So, by 2050, gasoline demand might be very low historically yet there will still be a crude oil shortage?
“have you ever given thought to the idea that conversion to EV’s isn’t going to solve the crude oil supply problem? I’m sure we have discussed that?”
“So, by 2050, gasoline demand might be very low historically yet there will still be a crude oil shortage?”
I know you directed this Dennis, but here is my two cents-
Until proven wrong, I assume that conversion of transport fleet from ICE to EV will serve to partially offset the depletion of crude oil derived transport fuels.
How much is partially?…that depends on how aggressively a transition is pursued.
And yes, crude oil will still also be needed for all the other things it is used for and will be in short supply, for just about all countries.
Hickory,
It may be in short supply until 2030 or so, but if the EV transition is quick, it will not be in short supply after that point. Oil prices will start to fall because supply will be higher than demand at $100/bo after 2030 (possibly as late as 2035 if the EV transition is slow).
Below is a slow EV transition scenario where the supply curve shows what is possible with no EV transition at all where oil prices remain very high (and we assume a severe recession is somehow avoided).
I sure you could be right Dennis, but I’m not confident of a few key components of that recipe working out in a timely manner, or at scale.
I am swayed by the magnitude of the transition required, and the lack of unified sense of purpose and urgency. Not to mention the blinding effect of partisanship.
It sounds good on paper. I share your reservations. There are currently close to 1.5 billion cars on the planet. So we need to crank out about a billion cars, pronto! That’s gonna take some oil, putting all that together, moving all that stuff around.
Then we’ll need more. Will technology make cars obsolete, or undesirable? Not looking good on that front. Pandemics don’t help, who wants to die from carpooling? I see oil demand sticking around.
Hickory,
The scenario below updates the supply scenario (the older chart was done before the pandemic). In this slow transition scenario demand falls below supply in 2042, upt to that point oil prices would be high in order to destroy some demand to balance the oil market. In this scenario the World Plugin light vehicle fleet grows to 624 million by 2038 (this does not include 2 or 3 wheeled light vehicles) and it is assumed that the World light vehicle fleet is about 1.3 billion and does not increase, it is also assumed that no autonomous vehicles get approved (or not on a widespread basis).
I appreciate your efforts at looking over the horizon, and doing an admirable job of it.
I admit that I just can’t see the future of these interrelated trends very clearly at all, and it is helpful to see your attempts.
It is always challenging to remain open to all sorts of various possibilities playing out.
Most of us take what we see in our neighborhood and we assume that this applies to whole world. Take electric vehicles for example- the story thus far is 90% China and Europe, with the US being a small sideshow.
Hickory,
I appreciate the pushback. It is possible that EVs will not help much, but gasoline at 4 to 5 dollars per gallon might change the attitude in the US toward EVs, if they have little effect then oil prices will remain high for even longer than 2042 and eventually it might lead to a global depression. Possibly a 50/50 chance it would occur before/after 2054, based on last 3 major Worldwide economic crises in 1873, 1929, and 2008 with average time between crises of 67.5 years and using a maximum entropy probability distribution to evaluate probability of years to next major economic crisis with P50 at 46 years.
Shallow sand,
Clearly I do not know what the future will bring. The possibility exists that more and more EVs might be sold in the US and throughout the World, the growth rate in sales of EVs from 2015 to 2021 was about 40% per year on average. This growth rate will likely slow down over time, by how much I don’t know. Also supply chain bottle necks may ease and prices of EVs may come down while oil prices remain high which could lead to continued fast increases in EV sales growth.
In any case, if EV transition is slow, then oil prices will be higher and oil supply will also be higher, if oil supply is inadequate oil prices rise to a high enough level that demand is destroyed to a level that balances the market. There is plenty of oil to meet demand for other uses besides land transport (which currently is about 50 Mb/d for the World). Note that my expectation is that heavy duty trucking also gets replaced with a combination of EVs and electrified trains. I haven’t included any changes to farm use, air transport or water transport, but climate concerns will eventually lead to changes there as well (though I am not clear what those will be, nuclear or wind for ships perhaps and much less air transport or possibly synthetic fuel.)
I do not expect a crude oil shortage by 2050, by 2050 ICEVs will be like horses in 1950, rich folks may have them and perhaps some collectors and enthusiasts. Same will be true for heavy duty trucks, especially short haul, they may figure out ways to use BEVs for long haul trucking as well, or much of the freight may move to rail for long haul.
So the solution to oil supply is EVs and high oil prices, at least through about 2080, by then I think we will have figured out how to replace most of the other uses of oil where it is burned for fuel.
On the oil prices, I don’t know how that all works, a lot of it is just bets on paper barrels or so it seems.
Not sure if any of you pay attention to these forecasts, but they seem interesting:
https://glenlochenergy.com/resources/Forecasts/2022/OMFJul22/
“Oil Market Forecast – July 2022
Summary
There has been a notable deterioration in economic sentiment over the last month, with some commentators, Nomura for example, now putting the chance of US recession by year end at more than 50%. While this has certainly impacted oil prices, oil demand expectations for the year have held fairly steady and OPEC was the latest institution to come out with a surprisingly bullish 2023 demand forecast. The supply picture remains clouded by uncertainty over Russian production, and the growing gap between what OPEC+ says and what OPEC+ does. Meanwhile, in the US, rigs are steadily being put back to work.
A few key points:
The EIA and OPEC held their 2022 oil demand estimates steady, while the IEA downgraded their estimate by 200,000 bbl/day.
OPEC published its first estimate for 2023 demand, they expect it to rise by 3% year on year to 103 MMbbl/day.
We estimate oil supply reached 99.7 MMbbl/day in June.
Crude oil dipped below $100/bbl, both Brent and WTI futures dipped sharply and remain inverted.
The US land oil rig count continued to grow, hitting 577 on July 15th.”
Kangeo
In the post, under US, there is a chart for horizontal oil rig count for all of the US, Texas and the Permian, up to July 22. Also a Frac chart.
The chart just reports on Horizontal rigs because we think that is most relevant for tracking tight oil activity. Some of the vertical rigs are used to start a multi hole horizontal well.
Ovi,
I believe an oil pro commented that there is a single vertical section for each horizontal tight oil well the Multiple lateral wells are used in Saudi Arabia and perhaps in some deepwater offshore drilling, but not for tight oil wells. If you look at the number of vertical rigs vs horizontal rigs operating in the Permian basin and keep in mind that vertical rigs are used for most conventional oil wells, the logistics make it pretty clear that the horizontal rigs do pretty much all of the drilling for horizontal tight oil wells, or that was the impression the oil pro gave in his comment.
For Week ending July 22, 2022 in the Permian basin there were 328 horizontal rigs operating and 16 vertical rigs, does it not seem like a logistical nightmare for 1 vertical rig to be drilling holes for more than 20 horizontal rigs?
There may have been a time when vertical rigs drilled a starter hole and then a horizontal rig finished the job, but I doubt that is still the case for most horizontal tight oil wells currently drilled in the Permian basin.
Dennis
I guess I was thinking that one rig sitting at one location drilled all of the laterals associated with the main well and that the laterals were counted as wells.
I understood it took roughly 20 days to drill a 2 to 3 mile well. I find it difficult to believe that would also include possibly 6 laterals.
Maybe I just have it all wrong.
Ovi,
It may be me that has it wrong, I will let any oil men correct us that cares to comment.
My understanding is that for tight oil wells each producing well has a single surface point where the oil and gas are collected,a single well bore starts out roughly vertically then there is a radius (or bendm I do not know the typical radius, maybe 800 feet plus or minus 200 feet, but maybe an oil pro can correct this guess) and then a long horizontal lateral (7000 to 10,000 feet typically in Permian Basin in 2021). It is often correctly pointed out that I am not an oil man, so I will leave it to those who know to explain how it works if they care to share their knowledge.
Regarding deepwater wells using a single vertical wellbore for multiple laterals : What is common is to perform alot of sidetracks out of a single wellbore. A well may have 2 or 3 sidetracks over the course of its life, but at any time, production is only coming from the most recent sidetrack. If a producing sidetrack develops mechanical problems, or the well waters out, or depletes, the operator will plug that off and sidetrack out of the mother well.
Thanks Bob.
Bob
Does your comment “but at any time, production is only coming from the most recent sidetrack” also apply to the laterals in the LTO basins. In other words, is only one lateral producing at a time?
Ovi,
See my question to El Dano in an earlier post and his answer. He seems to be a person knowledgeable about tight oil wells, if someone knows more I would love to hear it.
https://peakoilbarrel.com/north-dakota-sinks-us-april-oil-production/#comment-742650
I interpret his answer as the horizontal drilling rig does the whole job except the top 100 feet which is done by a separate “tool” (I am unsure of the distinction between a tool and a rig) and he also says the multi lateral design is not used in tight oil plays, these are used offshore and in some of the giant reservoirs in the Middle East.
Ovi.
The vertical rig count isn’t accurate anyway. There are more rigs running in Kansas than reported by Baker Hughes. Same for Illinois and Indiana.
SS
OK. So the vertical rig count is too low.
Ovi. Not trying to be a pain by posting that.
Those vertical rigs aren’t a huge deal in terms of adding US oil production, as they are merely maintaining production in states that don’t produce a lot of oil.
Probably more to the point, I’m not sure how accurate Baker’s rig count stats are generally. Seems North Dakota state data differs from Baker’s at times, for example.
A likely source for differences is that BH just reports rigs actively drilling on the Friday whereas most jurisdiction reports give rigs on station.
Shallow sand,
That is an interesting fact. Do the states you mention divide up the rigs into oil, gas, and other categories? For Kansas the last date reported is May 6, 2022 and only one vertical rig was reported as active. For Illinois the vertical rigs are reported as 1 (all types)for week ending 7/22/22, and for Indiana for week ending 6/4/22 (last week reported) also one vertical rig was reported.
For North Dakota Baker Hughes reports 34 active horizontal rigs and 2 active vertical rigs. If we exclude the one rig MIRU the count on 7/22 was 42 rigs according to NDIC.
What was the rig active rig count in Illinois for April 29 ? Baker Hughes shows one active rig for all weeks from 10/20/2017 to 7/22/2022 for Illinois (all types of rigs, oil, gas, or other) Since Oct 20, 2017 the one rig has been a vertical rig, but back in 2017 there were horizontal and directional rigs active (only 1 or 2) this is based on Baker Hughes data.
Dennis.
I am just going by the recent quarterly Illinois Oil & Gas Association newsletter, which said 10-12 rigs were drilling in the Illinois Basin; which includes Indiana and Western Kentucky. I know most rigs are in White County, Illinois and across the Wabash River in Posey County, Indiana, near Griffin.
I will also note most of the Illinois Basin wells are horizontal wells, but TVD is under 5,000’. There is one rig running in our shallow field, hasn’t drilled many wells, maybe a dozen or so this summer. Can drill one in 1-3 days depending on if things go smooth and have enough hands.
As for Kansas, that data quoted earlier came from the Independent Oil & Gas Service, Inc. Go to iogsi.com
Thanks Shallow sand,
I hadn’t realized the Baker Hughes data was inaccurate, good to know. Perhaps the way an active rig is defined is different in different places and if so that might explain some of the difference. In the case of Kansas the difference seems too large to explain in this way, strange that Baker Hughes would be off by so much, but good to know. Good data is hard to find.
The most recent Kentucky data at Baker Hughes is from February 2018.
So right now bond yields are crashing lower.
FED’s funds rate which is the overnight lending rate is at 2.50% while 10 year is at 2.65%
Just 15 basis points.
There likely won’t be another rate hike. Not that it really matters what they do at this point.
Ship is going to sink regardless of what they do.
Bonds are collapsing—-
When reading financial news they expect the FED has to turn back to negative interest rates and lot’s of new QE soon to fight recession.
So stocks are already soaring and interrest rates crashing to the lows.
Oil is still undecided – is the recession stronger or the hope of enough FED support for cheap credit.
Good summary of Powell’s speech. If Wall Street thinks the Fed is lowering rates before mid 2023 they are not paying attention to what they are being told. CPI at 9% and fed rate at less than 3% right now, so real interest rate is about negative six.
https://wolfstreet.com/2022/07/27/powell-puts-75-basis-point-hike-on-table-for-sept-fed-determined-to-get-inflation-down-come-heck-or-high-water-most-hawkish-fomc-press-conference-i-ever-watched/
QE is a big part of the problem. If you put collateral onto FED’s balance sheet it leaves little collateral for market to function properly.
Not enough collateral to meet everyone’s needs in REPO market. Which is why we are see a spike in REPO fails to tune of a 1/2 trillion dollars.
T-bills yielding less than the FED’s fund rate is a sign of collateral shortage.
We are experiencing a dollar shortage due to collateral shortage. Only treasury can fix this by issuing more T-bills and make damn sure the FED doesn’t put them on its balance sheet.
What can be done?
The FED can fasten QT and dumping a few trillion hoarded bills on the market to provide collateral.
Problem: Buyers need the have the bank reserves to buy them, since these bank reserves will be destroyed in the move. The monetary base will shrink fast – these dumped bills have to create new money fast or we get a severe recession.
As you suggested, the government can start a spending binge and finance it with T-Bills while spending the money on their favourite political projects. Free health care for everyone, social security for everyone free, free education and so on, no problem to dump a few trillion into the market while creating new economic impulses.
Without QE, long term interrest rates will soar then due to the rising indebtness. Even when the rating stays – when the debt of the US government nears 200%, it’s more an Italy or Greece situation. And Greece is only stable at the moment because everyone knows the ECB has it’s fingers 2 mm over the “buy a lot” button.
So, for solving the just now problems, new longer term problems will be created. There is a crossroad now, all actions now will have much future impact.
Did you see that he reconciliation bill that was put forward?
Things have to breakdown vastly further for us to see any meaningful government spending.
Heck the bill that was put forward even talked about paying down some of the debt which is the most laughable thing I’ve heard in a really long time.
As you know in a fiat monetary system paying down debt is a no no.
Yes, I forgot they are blocked. So no new bills from that side, leaving only the FED.
They could speed QT – but the more propable scenario is they 180 degree turn and start a 0 interrest rate multi trillion QE again to moonshot stocks and “rescue” the economy.
European governments can dish out the money with full hands and do this.
On the other hand, our government now tries to shoot down the construction industry. Lot’s of additional rules for energy saving in new and used houses – and they want to axe the subsidies. It will be unpayable for most people then. Insulaititing here, heat pump there, new triple glas windows, new inspections… can’t work, not everyone has 100.000€+ for free spending laying around.
Again massive QE drains collateral from the system. Same collateral that is used to borrow money to ramp stocks.
Not saying that they won’t do it but might not ramp stocks.
Bank reserves created at FED never leave the banking system. Can’t use bank reserves to buy stocks. Bank reserves are interbank money use in interbank transactions. They never make it into real economy despite what we are told about central banks flooding economy with money.
You have to have collateral to borrow money to bid up stocks.
QE is more psychological than anything else. If you think the FED is flooding the economy with money then you act accordingly.
Eulen, I think you (Edit, and many, many others, of course : ) could surely spend some Es on improvements incrementally, either some upfront cost now or larger running bills later, your/their choice. (maybe that Malaga trip wasn`t that necessary). But as I´ve said earlier, southerners freezing in the dark can mostly blame themselves, since it´s been coming for quite some time.
What will happen HHH? Please connect the dots.
Thank you!
Saludos
el mar
Falling long term treasury bond yields reflect growth and inflation expectations.
Falling bond yields are pricing in economic contraction right now. Rising bond yields would indicate growth and expansion of money supply.
The yield curve in both US treasuries and Eurodollars are deeply inverted and are progressively getting worse.
Eurodollar curve on par with 2008.
What we are heading into will be deeper and more prolonged than all the talking heads are counting on.
I’m very confident in my $25 oil call even in the face of all the supply side issues.
When the primary dealer banks step back due to collateral issues I’ve been talking about. Price of everything besides treasury bonds and the dollar itself are going to crash.
And just as a disclosure. I’m long long term treasury bonds and the dollar. Not short oil.
Even though in a sense it’s the same trade.
Thank you for answering.
The contraction here in Germany is already starting, because of our sillyness.
EL MAR, thanks for asking HHH to connect the dots. I love to read his comments, but must admit I understand very little of it. I read them every time he posts and google some of the key words.
HHH- can you point us to a resource that might help us… something like ” What HHH Knows for Dummies” ? Thank you for posting.
Try this for an explanation.
https://www.youtube.com/watch?v=KNa-fewraJA
If the explanation is “crypto is a massive scam”, then maybe. I was getting ready to listen to this, when I realised the channel is shilling crypto bro idiocy, so I checked out.
I would say the Ray Dalio videos where he goes on about economies and power are worth time, or Mark Blythe lectures.
Also, on crypto: https://www.youtube.com/watch?v=YQ_xWvX1n9g
Pop quiz –
The US imports more oil from which of the 3 countries/localities:
– South America
– Mexico
– Saudi Arabia
Extra credit if you can rank them in order (hi to low)…
Oil storage in the USA
“Yes the high natural gas prices may make new natural gas power plants a thing of the past and may lead to the shut down of many less efficient peaker natural gas power plants… and maybe a bit of natural gas.”
I don’t see nat gas fading for a long time, along the lines of what the EIA projects in these various scenarios
Hickory,
The EIA predicts low future natural gas prices in their reference case (see chart below). I expect natural gas prices will rise to at least $10/MMBtu as more LNG is exported and US prices move toward international natural gas prices (which will likely be $25/MMBtu with US prices around $10/MMBtu less to account for cost of creating LNG, shipping and then converting back to gas.
Hickory,
This is what natural gas supply looks like for the two cases. Keep in mind that natural gas prices may be much higher than this “low oil and gas supply case”, I will make an estimate of that based on the rise in prices from 2022 to 2035 and the EIA’s expected supply response to those prices over that period, extended to 2050.
Hickory,
Using a very conservative oil price scenario, extending the 2025 to 2035 AEO low oil and gas supply case for natural gas prices and the supply response to those prices, I get the following with US Natural gas supply falling to 25 TCF per year by 2050. The natural gas price only rises to $8.73 per MMBtu in 2050 for this scenario so it is likely too conservative.
A Very High natural gas price scenario with US Natural gas prices rising from $8/MMBtu in 2022 to $15/ MMBtu in 2050, the “Supply of natural gas” is for US domestic market and is dry gas, in 2021 this was about 30 TCF supplied to domestic market with net exports of about 3.8 TCF.
So, you project rapidly diminishing US nat gas supply in a high price scenario??
I don’t understand the rationale on that. Rapid depletion or rapid escalation of exportation?
I suspect the reference case plots for US nat gas output will be closer to what happens, out to 2040 anyway. There is a very large supply, and there will be continued huge and growing demand- both domestic and foreign.
Hickory,
I am considering domestic consuption of natural gas in the US.
At $15/ MMBtu there will be less demand for natural gas.
Perhaps the output projection by the EIA will be correct, but the price projection is likely incorrect and much of the output will be exported and this will drive US natural gas prices higher.
Does anyone have an explanation for this Blowout gap between WTI and Brent?
Ovi,
This may simply be end of month futures contract expiration and people covering their shorts or longs. Just paper shuffling.
Dennis
This gap has been around for close to five days. Too big a gap for paper shuffling.
I wonder if the gap explains the large export of US crude. Last week, the US exported 2,000 kb/d more than last year, according to this weeks EIA inventory update.
Also, the price of OPEC basket of thirteen crudes stood at $110.84 a barrel on Thursday, compared with $108.11 the previous day, according to OPEC Secretariat calculations. Typically there is a $1/b to $2/b gap between the OPEC basket and Brent.
http://wam.ae/en/details/1395303070474
Maybe Biden’s SPR draw down is REALLY working. That raises the question: What happens to gasoline prices when the draw down stops?
Ovi,
I misread/miscalculated and thought the gap had jumped from previously, my mistake sorry. May simply be that Europe is more concerned with a shortage of oil than in the US, they are on edge in Europe with high oil and natural gas prices (note that with the strong dollar, prices are even higher in terms of Euros, etc in Europe) so this may be affecting the spread. Just a guess, markets are difficult to figure sometimes, perhaps a European can comment on whether there is panic in Europe. On this side of the pond we are less worried, at least in the US, not sure of the Canadian perspective and if people there are worried about energy availability.
Dennis
Energy supply is not a worry for Canadians. We are more worried about the govt plans to try to shut down the oil sands.
The govt has just published an options paper.
https://www.canada.ca/en/services/environment/weather/climatechange/climate-plan/oil-gas-emissions-cap/options-discussion-paper.html
“We are more worried about the govt plans to try to shut down the oil sands.”
Unfortunately there is no solution to this conflict of forces- the need for energy and the stability of the climate.
The choices made, or lack of choices made, will be very painful to billions.
We know who wins- those going for energy…just as they (we) have ever since we got control of fire.
I’ll be highly surprised if economics/energy comes in 2nd to Climate.
In my opinion governments will always choose energy and economic prosperity in favour of climate or anything else really.
Hickory
Shutting down the oil sands will kill millions in the developing world. Oil prices will stay extreme high for longer.
And no Diesel no food.
Eulen…
The oil sands are not about to be shut down, simply because energy is far more valuable to those with purchasing power than is climate stability.
“Oil prices will stay extreme high for longer.”
That is going to happen regardless, baring economic collapse. And that price decline would be temporary, even if collapse is long sustained.
Sometimes what people miss in these conversations is that fossil fuels are no longer the cheapest option, even if we ignore the health and environmental damage due to burning of fossil fuel. So bottom line, continuing to burn fossil fuel rather than developing alternatives leads to less prosperity rather than more. The sooner that governments start to recognize this fact (and Europe is far ahead of North America in this regard), the better off we will be because proper policy measures such as a carbon tax will be taken to speed the transition to non-fossil fuel sources of energy.
So while it may be true that governments will choose economic prosperity over climate concerns, choosing economic prosperity means facilitating development of the cheapest types of energy. At current fossil fuel prices, which are likely to rise over the next 3 to 5 years, a path to economic prosperity is a path that develops alternatives to fossil fuel energy as quickly as is feasible. It might even slow the rise in fossil fuel prices by reducing demand for fossil fuel.
Dennis,
We’ll agree to disagree here, but you have far too much hopium in mankind from my perspective. I have a far more pessimistic bias than you.
D Coyne – – “fossil fuels are no longer the cheapest option.”
Great!! How much is the current estimated cost to construct a large cement plant not fueled in any way by fossil fuels? And a steel mill for the rebar; aluminum plants, etc.?
By implication, magnitudes of demand increases for non-fossil fuel will not increase the current prices of non-fossil fuel inputs. I see a Nobel Prize for economics in the future for someone. PS – Be sure to convince the environmentalists that it is no longer environmentally necessary to protest all new copper mines, lithium mines, rare earth elements mines, etc.
I like how when fossil fuels went up in price, European wind turbine manufacturers started shutting up shop and Chinese solar production hit snags.
But yeah, cheapest energy option or something.
Kleiber, maybe they should call Areva for pricing and timeschedule advice? /s^2
Edit: electricity prices in my area, in the far north of Sweden, has been ridicuolasly low at times lately due to windpower, so I´m likely a bit biased. (but we exported most, if not all of it…)
And also, as a tip to everyone really, get some f…ing insulation.
https://www.nordpoolgroup.com/en/Market-data1/#/nordic/table
@Laplander
LBC radio today had a caller talking about Norway and how he doesn’t understand why the UK can’t basically be at their level now. The fact that said Norwegian miracle comes from having a total population less than half that of Greater London and masses of hydro AND oil and gas, didn’t come up once.
Of course we can’t do the hydro, but we could have put our North Sea spoils towards useful things like the Norwegians did, such as a trust fund and investing in infrastructure.
But no. Far too sensible, that.
Iron Mike,
That’s fine, no hopium needed. Start with electric power where about 70 % of World coal consumption was in electric power plants in 2021, and 30% of natural gas consumption was in power plants, over time this use is likely to be replaced with alternatives because they are cheaper, a lot of natural gas is also used to heat space and water.
Kleiber,
Europe’s energy prices are very high because European governments were duped by Putin and became very dependent in Russian oil and natural gas. Don’t blame wind and solar for that mistake, or you can if it makes you feel better, but more alternatives to fossil fuel is not the problem it is the answer.
Dennis,
Europe’s energy prices are very high because European governments were duped by Putin and became very dependent in Russian oil and natural gas.
That is hilarious. It takes two to tango, Putin didn’t put a gun to their heads to use their hydrocarbon. Where ever there is a duper, there is a dupee…
Dennis,
Solar and wind don’t really work in Germany.
Because it neither sunny or windy there. Doesn’t matter how many trillions of Euro’s they throw at it or how much capacity they buildout. It’s never going to preform as needed.
@Dennis
The EU decided to ignore Putin’s true nature and rely on him, but the US also worked to basically get the EU onboard with sanctions that achieve very little in stopping the war. They do, however, massively devastate the European economy.
And to build out renewables would require FAR more fossil fuel energy be deployed solely to installing replacement infrastructure. That leads to higher prices for FFs, feeding into higher costs of manufacturing everything else, along with the already insufficient available flows of material needed for such an endeavour.
There is nothing cheap about renewables when looked at holistically. And this is also not an argument against their implementation, but neither is this a solution to the problem which is simply people being too profligate with energy and other non-renewable resources.
Kleiber,
Alternatives are cheaper holistically, fossil fuels wil deplete and become more expensive, the longer we wait to act the more expensive the process will be. We have put off the transition long enough, waiting for some magic to solve the problem justs digs a deeper hole.
I agree using less energy and using energy more efficiently is an important piece to the puzzle, but it will not solve the problem by itself. Improved technology and utilizing new forms of energy will be an important part of the solution.
Oil Set for Weekly Gain as Tight Markets Offset Slowdown Fears
The spread between WTI and Brent has widened as a reduction in Russian crude flows tightened markets in Europe. The global benchmark was at a premium of around $10 to US crude, compared with about $6 at the start of the month. The move is exacerbated by Brent crude’s September contract expiry but the October spread is also wide at about $7 a barrel.
US Oil Production Down for May
Drops in Texas, NM and GOM offset by ND rebound. Output still 174 kb/d lower then Nov 2021.
Full update late Saturday or Sunday.
Thanks Ovi,
US output dropped by 57 kb/d, GOM output dropped by 157 kb/d, US L48 minus GOM was up by 95 kb/d in May 2022 from revised April 2022 level. Strange that Texas and New Mexico output is down in May with the tight oil estimate for Eagle Ford and Permian being up by 75 Kb/d in May, but perhaps conventional output is down or the tight oil estimates are incorrect.
Horizontal Oil rigs increased by 7 to 551 in the US for week ending 7/29/22. Permian horizontal oil rig count increased by 2 for week ending July 29, 2022 to 330 rigs. Williston Basin rigs held steady at 36, Eagle Ford rigs increased by 2 to 63 horizontal oil rigs, and Niobrara was flat at 16 horizontal oil rigs. Other tight oil basins saw an increase of 3 rigs to 106 horizontal oil rigs for week ending July 29, 2022.
There are a significant number of horizontal oil rigs operating outside the Permian, Bakken, Eagle Ford, and Niobrara. In fact almost as many rigs are operating in those other basins as are operating in Eagle Ford, Bakken, and Niobrara combined (115 horizontal oil rigs vs 106 in “other tight oil basins”.)
Permian being up by 75 Kb/d in May
Does that include New Mexico?
High trekker,
Yes Permian includes Texas and New Mexico.
The original comment was:
the tight oil estimate for Eagle Ford and Permian being up by 75 Kb/d in May, …
When you leave off the first 8 words of the clause you change the meaning. Permian Basin plus Eagle Ford tight oil output was 75 kb/d higher in May than it was in April.
Ovi, the EIA often revises previous data. I think you are missing those updates. November 2021 US C+C production was 11,790,000 bp/d, which was a post-pandemic high and 195,000 bp/d above May 2022 production.
Ron
Thanks
The EIA site I use just tracks the 3 month update. I forgot to do the longer update.
“November 2021 …………………was a pre-pandemic high” ??? Maybe, post-pandemic?
Fixed it. Thanks
I’m sure Dennis will heartily disagree, but the Permian is looking completely tapped out.
“Texas, meanwhile, saw drops in production from 5.017 million bpd to 4.965 million bpd—a level that is even under those seen in December of last year, showing no production growth in Texas at all across those five months…
New Mexico’s production dropped in May too, from 1.508 million bpd to 1.497 million bpd.”
Average WTI in May about $110.
Nothing to see here folks.
https://oilprice.com/Energy/Crude-Oil/US-Crude-Production-Sinks-In-May.html
They are just waiting for $200, that’s all, endless supply of oil, didn’t ya know?!?
Hahahaha. We are now seeing what I was seeing for the past several years in the Permian. We became so efficient with our fracks that we drained off much of the pressure and now there is plenty of oil in place ( as Dennis suggests) but no way to get it out. Now maybe with $200 oil we can afford to drill some really crummy wells but even at $200 the returns will be so so.
Stephen,
US L48 onshore output was up in May, the decrease in output was mostly from the Gulf of Mexico. The decreases in Texas and New Mexico were from conventional output, if the tight oil output estimates by the EIA are accurate.
Oh, you gotta read this one.
World Oil Production Is Rising, With No End in Sight
Okay, I have skipped to the best part of the article. Sorry, this paragraph is just too good to be true. But only if it were true. Anyway here it is, that is, the future of world oil production in one short paragraph.
Now, compare those hopeful scenarios to the latest data from the U.S. Energy Information Administration (EIA). At the moment, world oil production is hovering at around 100 million barrels daily and is projected to reach 109 million barrels by 2030, 117 million by 2040, and a jaw-dropping 126 million by 2050. So much, in other words, for “peak oil” and a swift transition to green energy.
I haven’t read that projection from the EIA. If anyone has, could they please post that link.
“See, if I just extrapolate this line going up into the future, you notice that we have limitless upside potential in production output.”
I can’t believe that Michael Klare is a professor of anything. Zero geological or engineering knowledge but willing to speak confidently about something he knows very little about. Widespread adoption of EVs means the end of fossil fuel. I guess that’s because “ electricity comes straight from a plug”. And parents pay 💰 good money to send their kids to colleges like these….that’s scarier than peak oil.
Isn’t he quoting the EIA report incredulously? Like, “Get a load of this!”?
I refuse to discuss politics on this forum but why on Earth does Nancy Pelosi feel the need to visit Taiwan at this exact moment? I just don’t get it.
They are drilling like hell USA lower 48 everywhere they can find a rig, steel and hands.
Good luck with the 1 million BOPD annual additional. That gets tough when you cross the 11 million threshold in USA.
Look at how many rigs are running trying to keep Kansas at 75K BOPD.
Same with what the IB is running trying to keep in the high 20’s
Shale is a miracle but it isn’t going to give forever.
You all need to keep listening to Mike and LTO.
Thank you, Shallow; you are kind, sir.
What’s left of the Permian Basin is now being drained so quickly crude oil exports from West Texas are set to exceed 4.5MM BOPD by August, going to 5.5 by year end. To get rid of that light crap it now has to be sold at a significant discount to Brent. Permian well quality is going down, decline rates are accelerating, stories of vertical communication between Delaware benches abound; nobody wants to work in the Permian because there will not be anything left of it in three to five years. Lots of Texas is on fire and actually spontaneously combusting because of extreme heat (not kidding on that !), groundwater in West Texas in vanishing like grass while 3.0 earthquakes from increasing WOR are going up in severity and frequency. Go to Sky Truth Flaring Map and you’ll see, clearly, flaring in the Permian is where it was in 2017-2018.
Why is all this happening?
For crude oil exports. To Drain America…First.
Because she can be paid off not to go. If she doesn’t go it can be assumed it was because she was paid off.
Hubris, rivalry, the kits working well in Ukraine; and perhaps to craft her persona for the pursuit of higher office. The last House Speaker to visit Taiwan was Newt Gingrich, who stopped through Taipei on his way back from a trip to China in 1997. This time around the stakes are a lot higher and the room for error is a lot smaller. Biden could mitigate the impact of her visit by not sending Pelosi on a military plane.
https://www.zerohedge.com/commodities/china-claims-first-offshore-shale-oil-and-gas-discovery
Visual Snapshot?
https://www.visualcapitalist.com/visualizing-the-worlds-largest-oil-producers/
“In the short term (cash from oil) goes to the balance sheet. There’s no nowhere else for it to go,” Chevron CFO Pierre Breber told Reuters.
Read between the lines on this one. Chevron accidentally made billions last quarter but rather than reinvest in oil production or refining facilities they just used it for share buybacks.
Loosely translated: “Ain’t no more oil out there folks.”
https://www.reuters.com/business/energy/us-oil-giants-exxon-chevron-post-blowout-earnings-ramp-up-buybacks-2022-07-29/
Still they want to blame ESG.
Its a more palatable thought process.
Bingo.
US Horizontal Oil Rig count with projection based on trend of last 12 months using Baker Hughes North American Rig Count data. Note that the average weekly US horizontal oil rig count from Dec 30, 2016 to March 27, 2020 was 667 rigs.
Just read a short article from July 20 quoting COP CEO Ryan Lance. He said USA adds just shy of 1 million BOPD in 2022, about the same amount in 2023 and then “kind of plateaus”.
Right now not looking like USA is adding, but does seem like in the past oil production in USA grows most in second half of the year.
COP is now a very large player in the Permian. The company has bought a lot of acreage through various acquisitions.
When CEO’s like Ryan, and other tight oil cheerleaders, talk about adding, or growing Permian production by 1 MM BOPD they conveniently leave out the replacement of annualized legacy decline in the Basin, before the growth can occur. I estimate that legacy decline is about 3.6MM BOPD in West Texas. In reality then the Permian has to “grow” 4.5 to 5.0MM BOPD each and every year.
How much longer do folks believe that can go on? Ten more years? Fifteen? Two hundred? Why, because the tight oil industry says your in good hands with Allstate? Do you trust them? Are you so absolutely sure in your guesses about the future of the Wolfcamp (it’s dark down there and hard to see) that you are willing to forgo hydrocarbon conservation practices completely? How about exporting 70 % of all Permian tight oil production to foreign countries, at discounted prices? You good with that? You good with no contingency plan B, no savings account, nothing to fall back on in the future except promises from the tight oil sector. How’s their track record on those promises?
Finally, if you happen to be good with 4.5MM BOPD of exports, and the SPR drained down to nothing, all in the name of “free trade,” you must also then be good with having no long term energy security in our nation. So I guess if we need to defend our country, our personal freedoms, by fueling a war effort we’ll just roll over like a fat dog wanting her belly rubbed, right?
“hydrocarbon conservation practices”
Now that is a downright unAmerican notion.
Seriously, I generally agree with your concerns. It is more than just the export issue however.
It also has to do with the extreme wasting of combustibles on frivolous and optional activities.
I’ll go out on limb and say that driving a personal vehicle around with an internal combustion engine falls into that category of extreme wasting of a precious resource, considering how lousy that mechanism is at utilizing the energy contained in the fuel. And considering that we now how a completely viable alternative that is dramatically more energy efficient.
I know this message may be unpalatable to many. Truth often is. It is just a matter of time, measured in years, not decades.
Mike,
I agree drawing down the SPR is not smart policy. We could stop exporting oil, but you won’t find many in the Texas congressional delegation or Republicans in general that would be on board, many Democrats are in support of that policy, especially the left wing of the party. My guess is that it is political suicide to advocate for such a measure as it will lead to higher gasoline, diesel, and Jet fuel prices due to higher cost of oil onthe World market (removing 3.5 Mb/d from the World market will reduce oil supply and raise oil prices).
Nobody is going to refit refineries to handle more LTO, so we can leave it in the ground in hopes that oil prices will remain high. It is likely that after 2035 any tight oil that has not been developed never will be and will remain in the ground forever. That is certainly good for the environment, but not necessarily good for the oil industry.
High oil prices are fine with me we can shut down crude oil exports if that makes sense to a majority of citizens, perhaps they will think this will reduce the price of oil even though it will not. They may be profoundly disappointed with politicians that make such a claim and are proven incorrect.
Any guess for a realistic URR for Permian basin? How about scenario below?
Exports are but a small part of hydrocarbon conservation, eliminating personal ICE vehicles because they all represent a “waste” of valuable resources is far-out extremism and divisive. Between the entitled left coast and the far left privileged coast, there is Middle America, where all the work gets done. We are decades away from economic, affordable use of renewables as transportation fuels. I try to find COMMON ground in which to save what’s left of our nations resources.
Mr. Coyne your broken record responses regarding US oil exports lack analytical wherewithal, imagination and long term vision for our country. You seem content to be just another sheep in the vast herd of sheep spray painted red or blue for proper sorting come shearing time. Energy security for our nation and what the price of gasoline WILL be in 5 years because of current export rates seems of little interest to you.
I do not have an estimate of Permian URR, no. The fact that you do, and I don’t, is irrelevant. I don’t agree with your analysis because most of it runs counter intuitive to my 65 years of actual experience in the oil business and because it is counterproductive to my message of coming scarcity, unaffordability and the need for reasonable, rational conservation methods, including significant reductions in oil and LNG exports. I have a full time job getting the nasty stuff out the ground, profitably; whatever happens, I’m ready; my family is ready. I want that for all Americans so I urge those fellow Americans to avoid abundance estimates.
Mike,
My guess is that EVs will prove to be cheaper than ICEVs, based on personal experience. I was asking if you had a reasonable URR in mind, perhaps you read somewhere that it will be 20 Gb or whatever.
I do have a long term vision for where the nation might go, it is different from yours. I am fine with ending crude oil exports which seems to be a focus of yours, I agree it would be a small part of any solution to dwindling fossile fuel resources, in fact my guess is that the tight oil resource is so limited it would not be a solution to anything.
You seem to believe strongly that it is a good idea, I am skeptical at best.
The transition to alternatives to ICEV transport will become increasingly real over the next 10 years, the oil industry would be silly to ignore this in my opinion. It is not my industry, so I will let oil companies figure out what demand is likely to look like in the future. Demand for oil will be far less than many seem to imagine in my opinion.
In 1920, I imagine there were lots of people in Texas, that thought that horses were transportation of the future. In 2020, many probably think the same about ICE vehicles. Just like in 1920, they will be wrong.
My view on crude oil exports may seem sheeplike to you, sometimes the majority opinion is the correct one. There are lots of alternative facts out there, most of them are wrong.
My abundance URR estimate is about 74 Gb for US tight oil rather than about 130 Gb for the EIA’s AEO reference case. I simply try to estimate based on the information I have available.
In any case thanks for the feedback, it is appreciated.
I respect your point of view, but do not agree with it.
Novi labs has 35829 horizontal wells completed in the Permian through March 2022, my scenario above has about 88000 total wells completed so 52000 or so left to complete after March 2022, at 450 wells per month that would be 115 months or about 10 years, my expection is that the Permian completion rate might gradually increase to about 650 new wells per month at the peak.
That scenario has a somewhat higher URR of 44 Gb (about the same as the USGS F95 TRR estimate (their guess is that there is a 95% probability that the TRR is larger than 44 GB). In my view this is a very conservative estimate of future Permian basin output.
“The transition to alternatives to ICEV transport will become increasingly real over the next 10 years”
Yes, but was it set back 3-6 years by investing in non-scaleable eChem? There is little scaleable about Ternary eChem.
https://www.junleepower.com/blogs/new/what-is-a-ternary-lithium-battery-1
After failures of Chevy Bolt, Mustange, etc It’s painful to drive by this building on I85 knowing of the malinvestment.
https://insideevs.com/news/419036/sk-innovation-2nd-battery-gigafactory-georgia/
The electric Viking is likely spot on when it comes to the winners of the EV race. https://www.youtube.com/channel/UCjzi56cxvmEDwjo1Bd2Yxpg
The average EV is $54k, yeah it is cheaper to run, after you spend to get a decent charging connection—but still range is limited. All reasons I’ll likely never have one and in fact about 20% of BEV buyers go back to gas for those and other reasons.
https://electrek.co/2021/04/29/study-why-some-electric-car-owners-gas-reasons-surprising
Compare that to say the difference between an oil lamp and an edison bulb, or between that proverbial horse and a Model A, or from nothing to broadcast radio, or a flip/landline phone and a smartphone.
Big fast transitions in the past were from old old tech (or nothing) to something amazingly new and beneficial for the consumer, this transition will be from something pretty good -if dirty- to something expensive, limited and not at all intuitive. Not to mention it will impact many billionaires who will not go quietly.
Not saying transition won’t happen, just that the typical consumer is not a spreadsheet on the hoof and the calculation is’n the same as say, buying mamma a new clothes washer so she could ditch the scrub-board. Because the actual benefits aren’t as cut and dried as transitions of the past – and an entire media ecosystem is out there is living off the wages of disinformation, I’m skeptical of a quick switch.
Two words-
Oil depletion
And a followup sentence-
From now on oil is too important to use it for light transportation, which is a notion that the country and world will need to hear and react to.
Agree Mike.
Just noting a cheerleader is trying to temper future expectations.
The US public hasn’t taken notice yet. Still think we just need to pump more, whatever the heck that means.
off topic, but you may find this interesting:
“1950’s Oklahoma Jack Rod Line Still In Commercial Operation”
https://www.youtube.com/watch?v=mbqQeooSVu4
Thanks for posting this video.
I live near some wells that are still produced with a power and rod lines.
That is a heck of a well, I think he said 1.7 BOPD and 2-3 BWPD. Just 458’ TD is also what I think I heard.
There is good reason why this well has been in that man’s family since 1959. LOE has to be minimal.
EIA USA C+C production projected through 2050.
They have US C+C peaking in 2034 at 13,612,000 barrels per day.
I had to convert quadrillion BTU to barrels per day. Took a bit of math but I think I got it right. However I don’t think the EIA is anywhere close to being right. I only posted this crap for grins and giggles.
Ron,
To me the scenario looks reasonable up to about 2030, after that I agree it is not realistic, US output is likely to fall dramatically after tight oil peaks around 2028 to 2032 (depending on ramp rate and oil price).
A recent tight oil projection from early July in chart below.
So tight oil production is lower now than in November 2021 even with near record high oil prices during that period, yet somehow it will increase to 13 million and plateau for a decade even with massive price volatility that has become the norm since about 2004. Wtf are y’all smoking. Cuz that shit ain’t never gonna happen.
Stephen wrote: Wtf are y’all smoking.
The term “y’all” covers just a whole bunch of people Stephen. Could you be a little more specific as to who is included in your “y’all”? Dennis and I usually, but not always, belong to two different sets of Yalls. 😂
“Y’all” is singular Ron. So he’s talking to Dennis. “All y’all” is plural.
Stephen Hren,
Takes time to ramp up production, completion rate will gradually increase as rig count increases. Note the rate of increase from 2017 to 2019 and compare with the scenario from 2022 to 2027, the rate of increase is far less steep. As far as high oil prices, it is 4 to 6 months minimum for the higher prices to feed through to higher output. So we will see what happens by December 2022. It is possible my best guess is wrong, but I think it will be within 1000 kb/d above or below my estimate over the 2022 to 2032 period if there is not a Great Depression during that period.
I finally found the EIA’s prediction for World C+C production through 2050. It is even more hilarious than their USA prediction. The data is in PowerPoint and they separate OPEC from Non-OPEC. But you can right-click on their PowerPoint chart and get the data in Excel. I just added their data for OPEC and Non-OPEC to get the world data.
Strange that they see 2023 production completely flat. No increase over 2022 production.
INTERNATIONAL ENERGY OUTLOOK 2021
Ron,
Again it looks ok to about 2030, then I agree not a realistic estimate.
Looks like the EIA is simply extrapolating into infinity.
And when Buck Rogers needs to fill his spaceship in the twenty fifth century world oil production will be 400 million barrels per day
Okay, here is Non-OPEC from the EIA’s International Energy outlook. It looks a little strange. they have 2023, 2025, and 2030 as flat for the year. But from 2025 to 2029 they have Non-OPEC declining by over one million barrels per day before then heading up again. I wonder how they arrived at that version. This projection was made last October so the Russian decline is obviously not figured in.
From the same EIA International Energy Outlook as above, we get their OPEC outlook. And believe it or not, the guys and gals who made this forecast actually went to college. Can you believe that? 🤣
It seems like a loosely written computer program did the projections. No human would deem that to be a reasonable estimation.
The OPEC one looks just like an extrapolation based on probably the aggregate of the mean growth rate at different time intervals.
It looks like depletion isn’t taken into account in these models. And nowadays everytbody goes to college, whether you have brains or not.
Iraq once again on the brink of civil war? It seems to always be teetering on the edge…
https://www.aljazeera.com/amp/news/2022/7/30/al-sadr-supporters-protest-in-iraq-capital-over-new-pm-nomination
The Americans thought that invading Afghanistan and Iraq and kicking out the dictator(s) would result in what happened to Germany and Japan after WW2. But it didn’t work out this way because Iraq and Afghanistan aren’t real countries — they’re tribal societies. The reason that democracy always fails in tribal societies is that the dominant tribe usually takes all, leaving nothing for the other tribes.
Actually, after WWII, the US has not won a war.
Korea was a split, the rest were losses.
Maybe if you count Grenada or Panama, but don’t hold you breath.
Does overthrowing democratically elected governments by assignation and sponsoring coups count?
Because we did pull off a number of those.
Old news to this group.
—————————————
https://oilprice.com/Energy/Crude-Oil/US-Crude-Production-Sinks-In-May.html
EIA: U.S. field production of crude oil fell in May to an average of 11.595 million barrels per day.
The figures vary significantly from what the EIA had originally estimated for May.
the EIA sees crude production average 12.77 million bpd next year.
A new thread reporting U.S. May oil production has been posted.
https://peakoilbarrel.com/us-may-oil-production-extends-dropping-trend/
A new Open Tread Non-Petroleum has been posted.
https://peakoilbarrel.com/open-thread-non-petroleum-july-31-2022/