A guest post by Ovi
All of the oil (C + C) production data for the US state charts comes from the EIAʼs Petroleum Supply monthly PSM. After the production charts, an analysis of three EIA monthly reports that project future production is provided. The charts below are updated to June 2021 for the 10 largest US oil producing states.
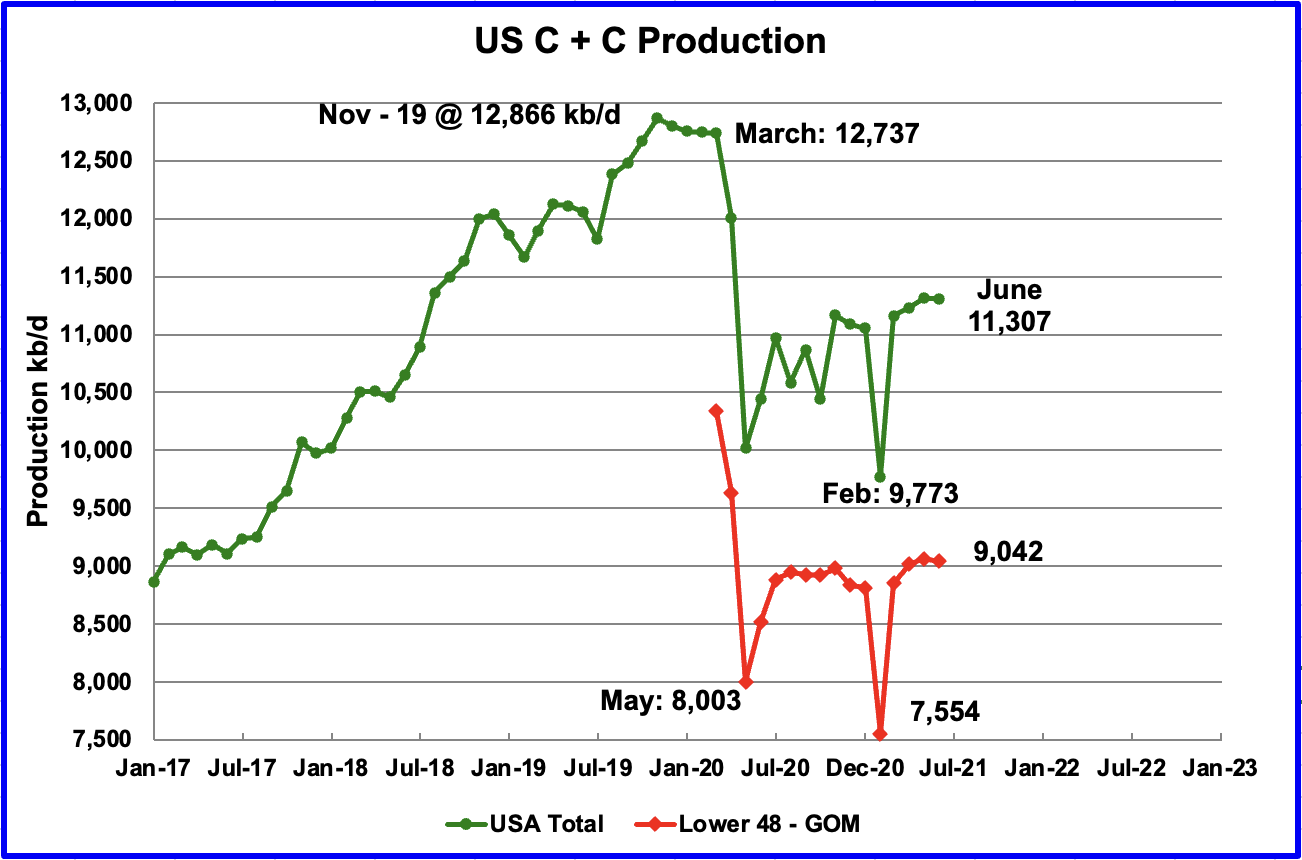
U.S. June production was essentially flat, only down by 5 kb/d from May. The revision to May was a surprise. May was revised up by 81 kb/d to 11,312 kb/d. From March to June, production increased by 147 kb/d or 49 kb/d/mth on average. June has now exceeded November’s previous high of 11,168 kb/d.
The August STEO report forecast US June output would be 11,270 kb/d, a reasonable forecast, low by just 37 kb/d.
In the onshore lower 48, June production decreased by 20 kb/d to 9,042 kb/d, red graph. Overall, production was little changed in the three US regions, US L48 onshore, GOM and Alaska.
Ranking Production from US States
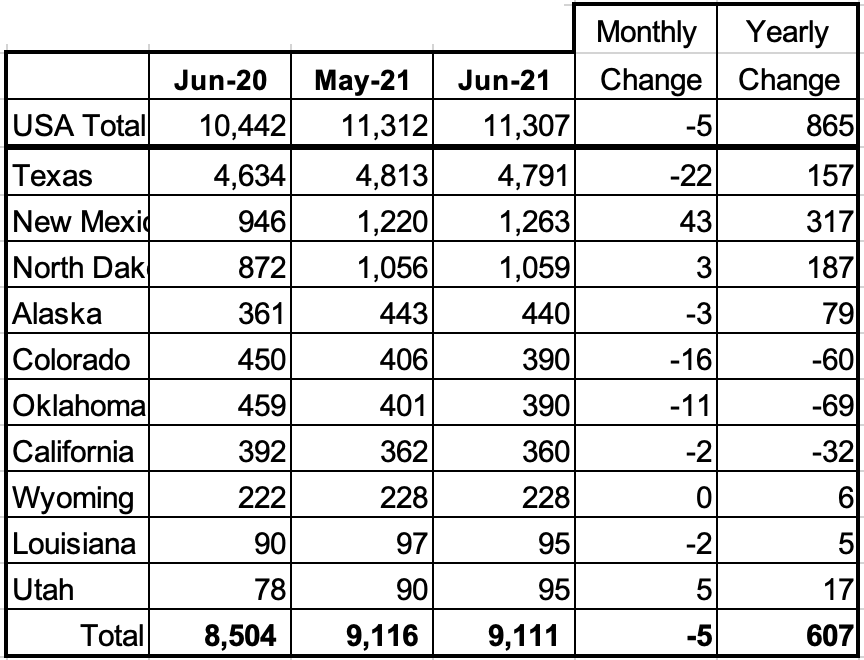
Listed above are the 10 states with the largest US production. These 10 accounted for 80.6% of US production out of a total production of 11,307 kb/d in June 2021.
On a MoM basis, again the largest increase came from New Mexico, 43 kb/d. Surprisingly, Texas dropped 22 kb/d in both May and June. On a MoM basis, only New Mexico, North Dakota and Utah were able to increase production.
Production by State
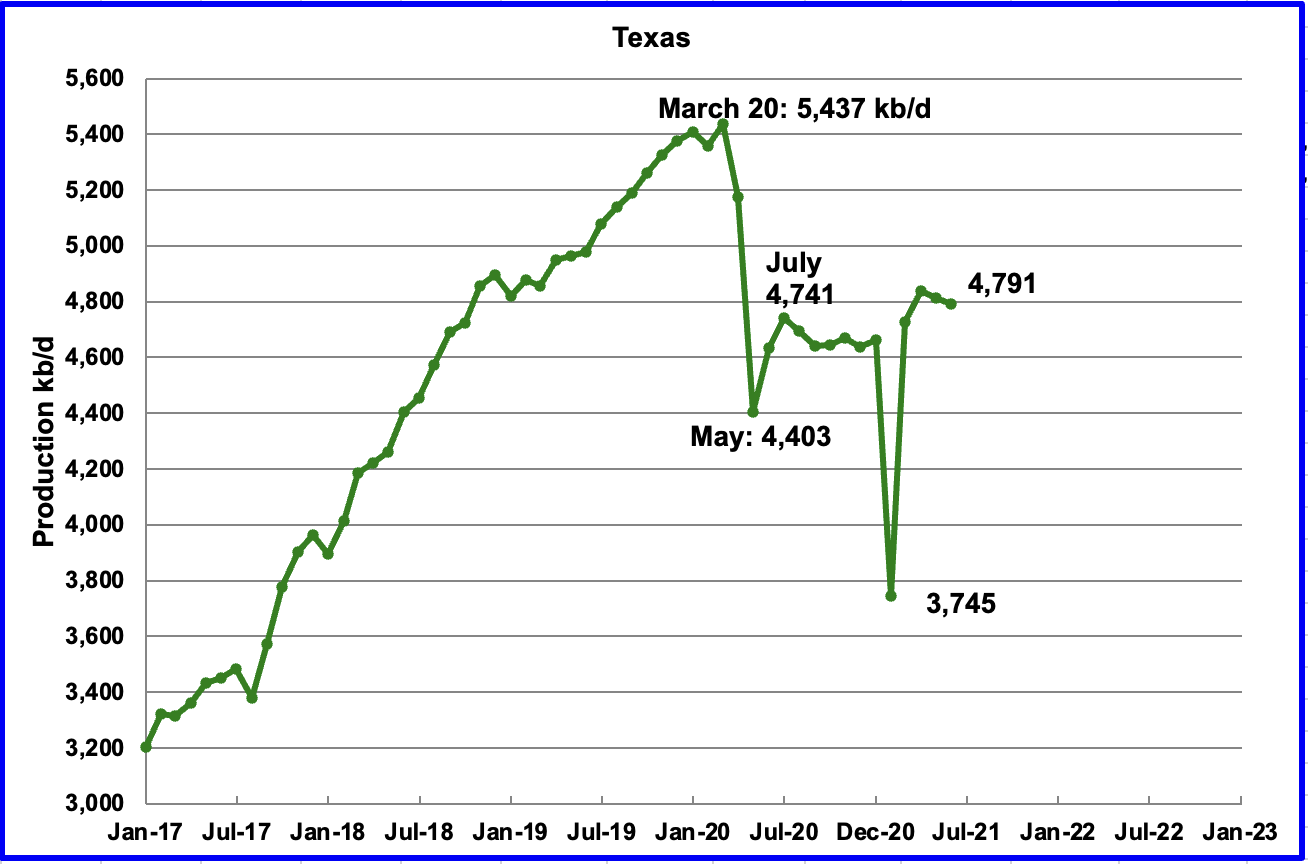
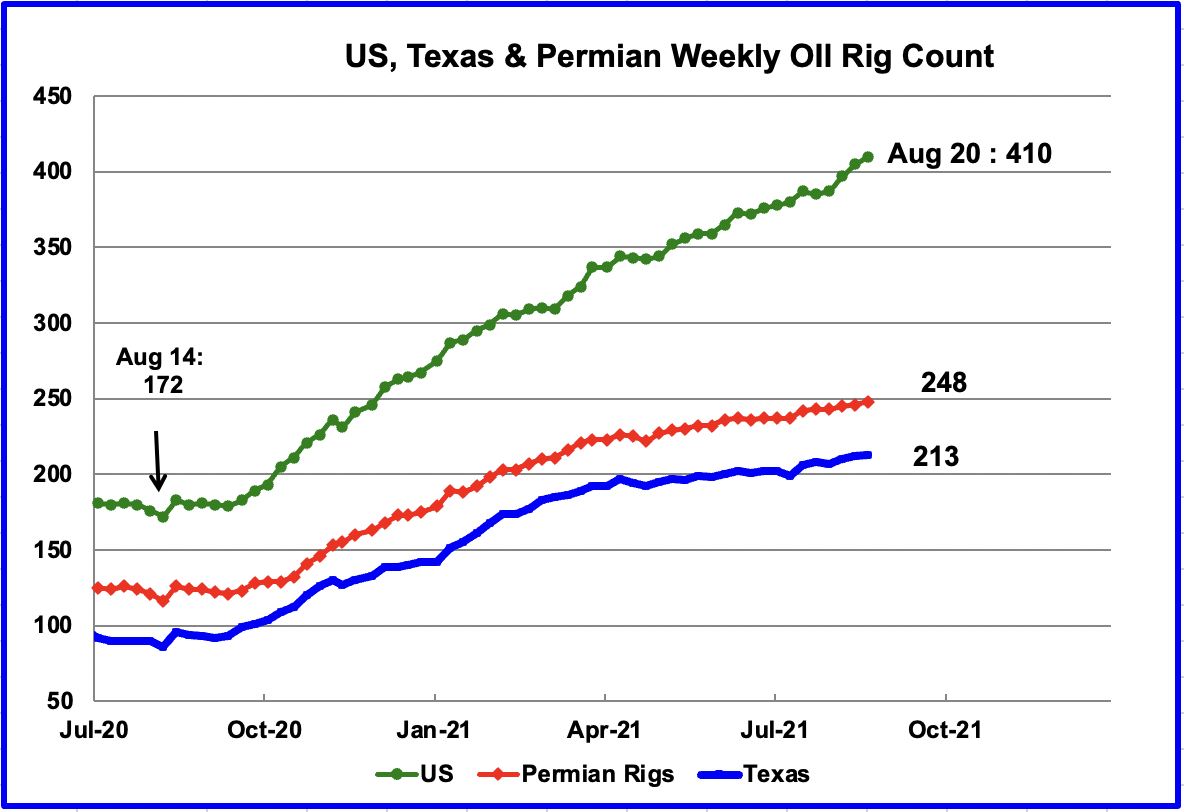
Texas production decreased by 22 kb/d in June to 4,791 kb/d. In the EIA’s August report, May’s output was revised up by 81 kb/d from 4,741 kb/d to 4,813 kb/d. Note that Texas production decreased for two consecutive months.
In June there were close to 200 oil rigs operation in Texas. By the week of August 27, 213 were operating.
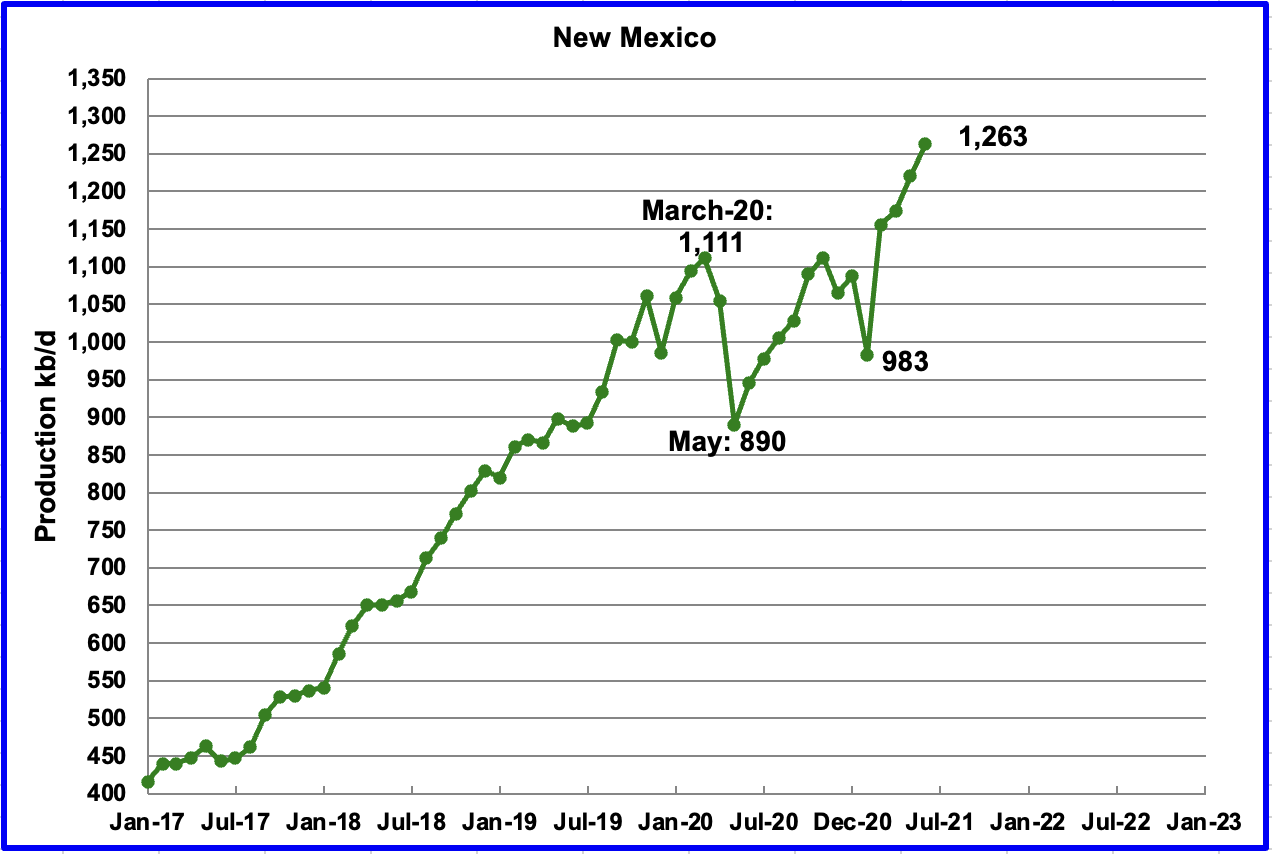
June’s New Mexico production increased by 43 kb/d to 1,263kb/d. June’s output is another new record. New Mexico had 75 rigs operating in the Permian in June and they increased to 78 in the week of August 27.
According to this source: “New Mexico’s rising status as a key supplier reflects its cost advantage. U.S. oil and gas companies have been judicious in raising output after many producers pledged to cap spending and focus on returning more capital to shareholders. To that end, the Permian’s New Mexico is being favored over North Dakota, where higher production costs have historically curbed profits.”
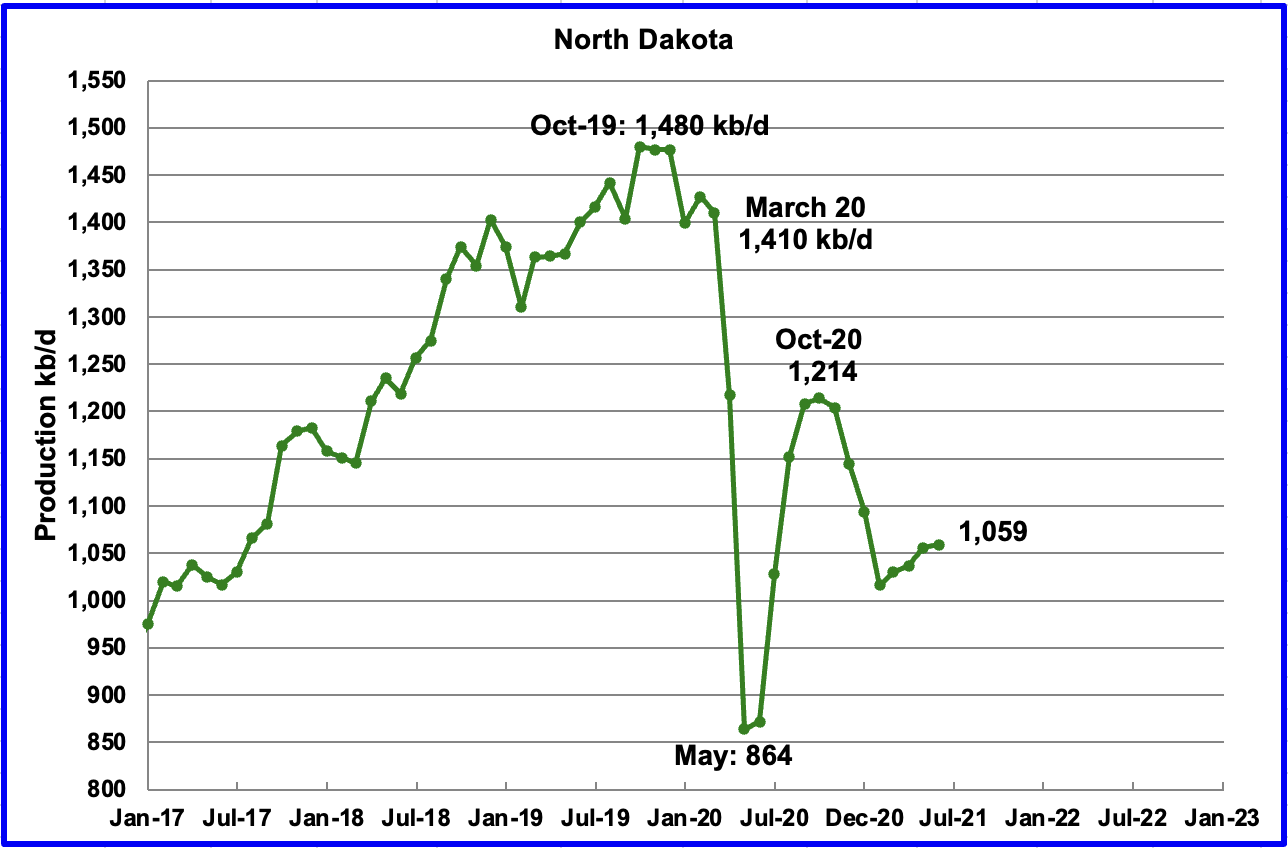
According to the EIA, June’s output was 1,059 kb/d, an increase of 3 kb/d over May. The June report revised up May’s output from 1,029 kb/d to 1,056 kb/d.
According to this source, fracking crews are hard to come by in North Dakota.
North Dakota’s Bakken Shale oil production under-performed in its most recent monthly statistics, reflecting a “serious shortage of hydraulic fracturing (fracking) crews,” the state’s chief oil/natural gas regulator Lynn Helms reported Tuesday.
Helms told a webinar with reporters that he expects to see improvement in the summer months, but the May statistics — 34.9 million bbls (1.127 million b/d) compared to 33.6 million bbls (1.123 million b/d in April) — come with eight fracking crews in the field compared to the usual 20-25 such crews at the current level of prices around $60/bbl.
“Operators are trying with all their resources to hire, but they are not finding employees who want to come back to the industry and come back to North Dakota, ” said Helms, director of the Department of Mineral Resources. “Pre-Covid-19 pandemic we had 25 frack crews, and during the deepest part of the pandemic we went down to one crew.”
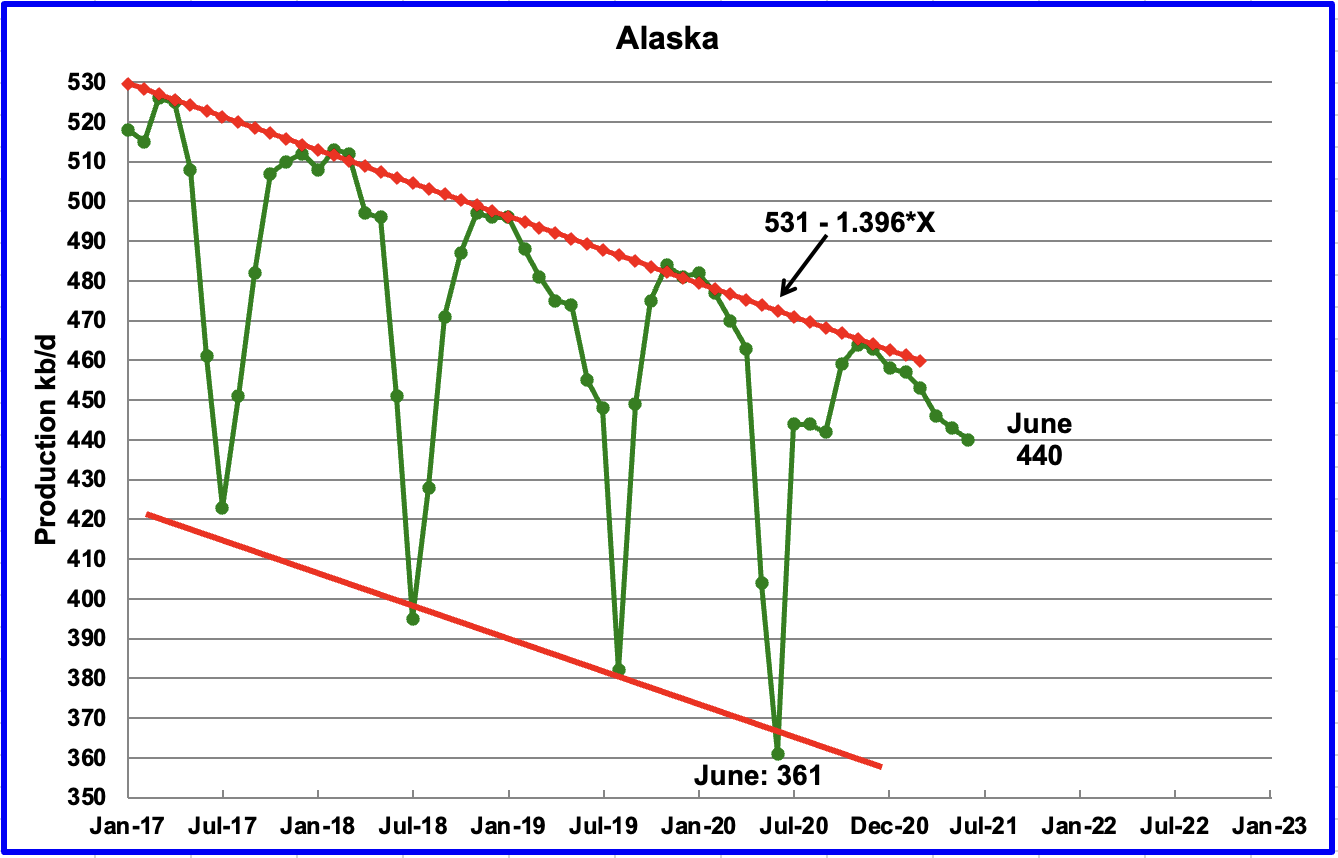
Alaskaʼs June output decreased by 3 kb/d to 440 kb/d.
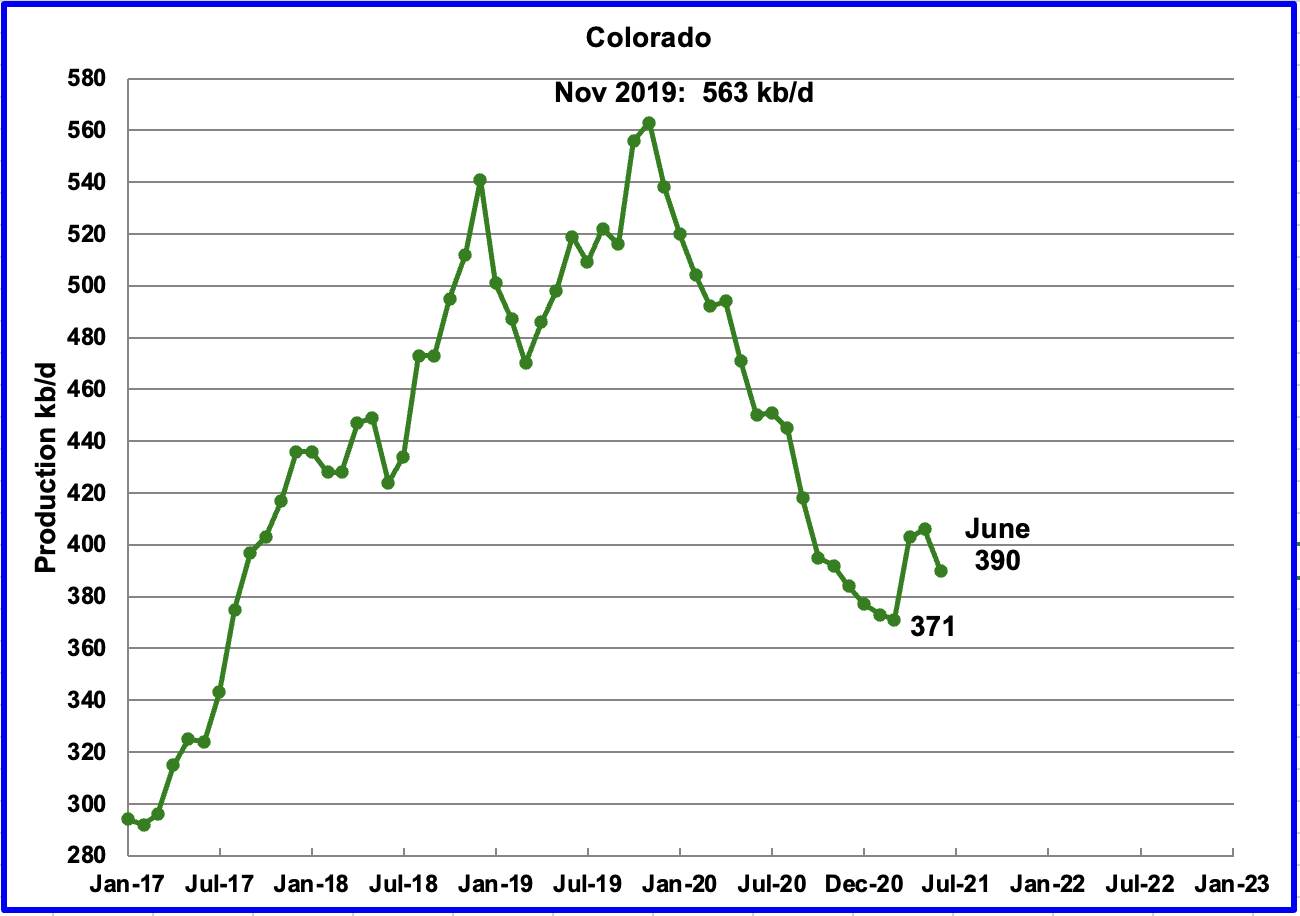
Coloradoʼs June output decreased by 16 kb/d to 390 kb/d.
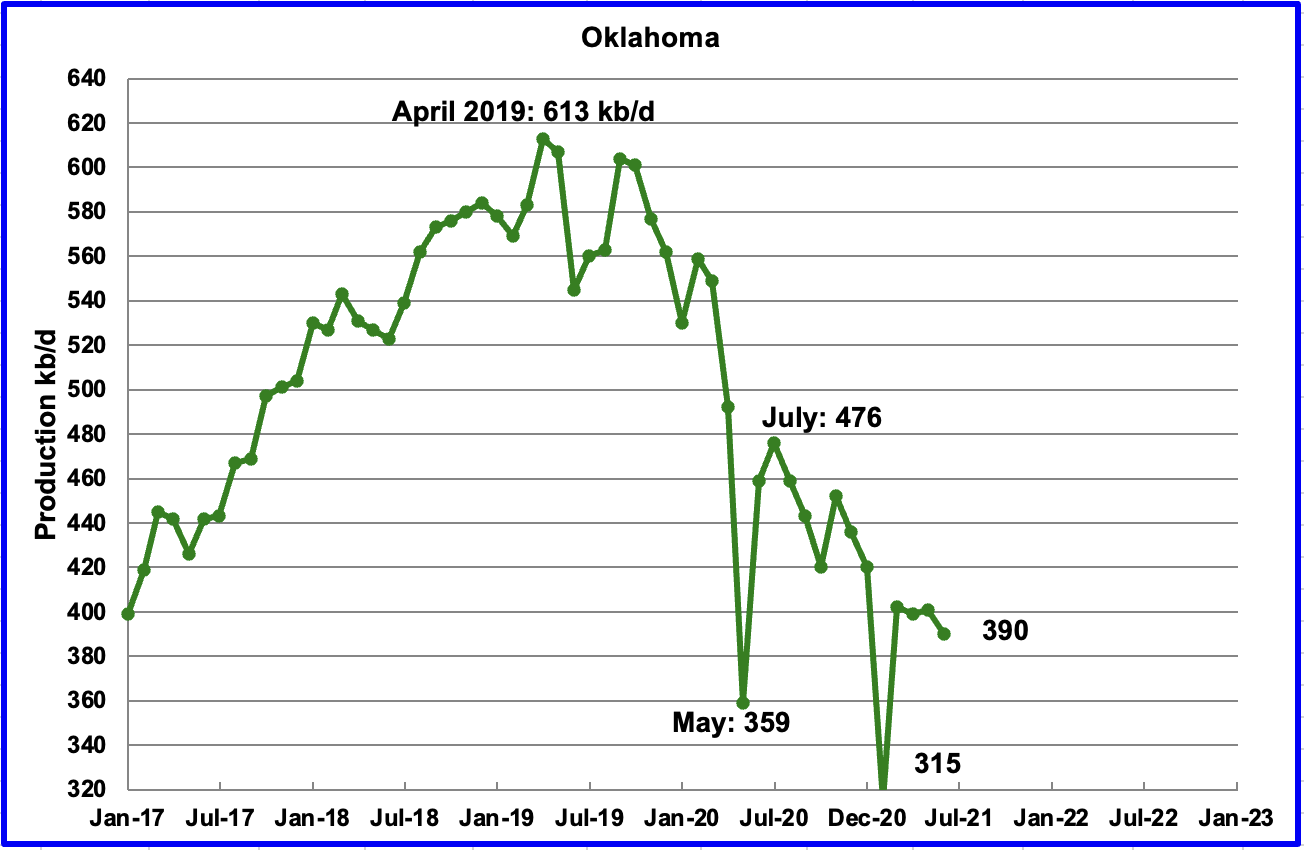
Oklahoma’s output in June declined by 11 kb/d to 390 kb/d. At the end of June, 27 rigs were operating. From the beginning of May to the end of June, the rig count increased from 21 to 27. Increasing rigs and decreasing production?
By the week of August 27 the rig count had increased to 31.
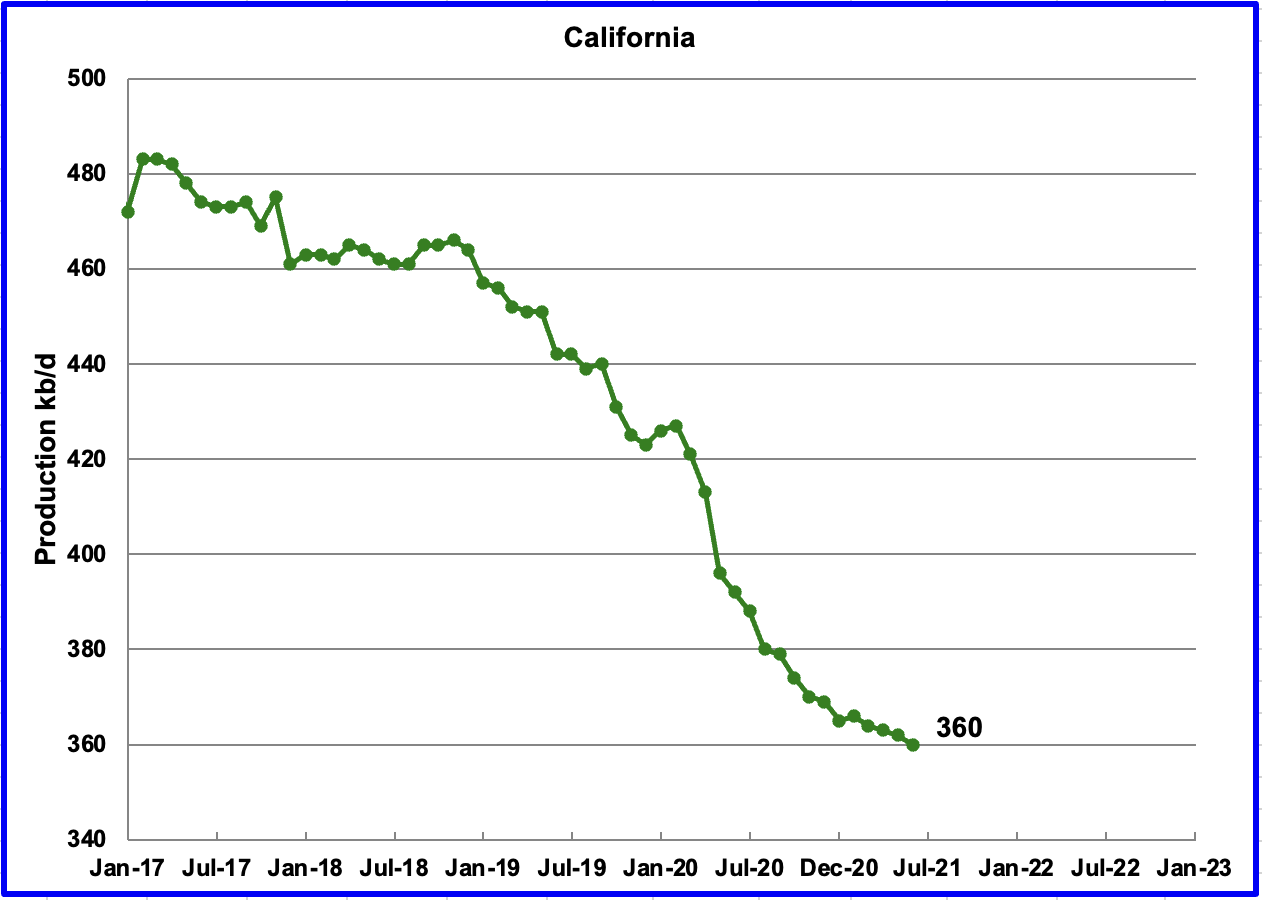
Californiaʼs slow output decline continued in June. Its production decreased by 2 kb/d to 360 kb/d.
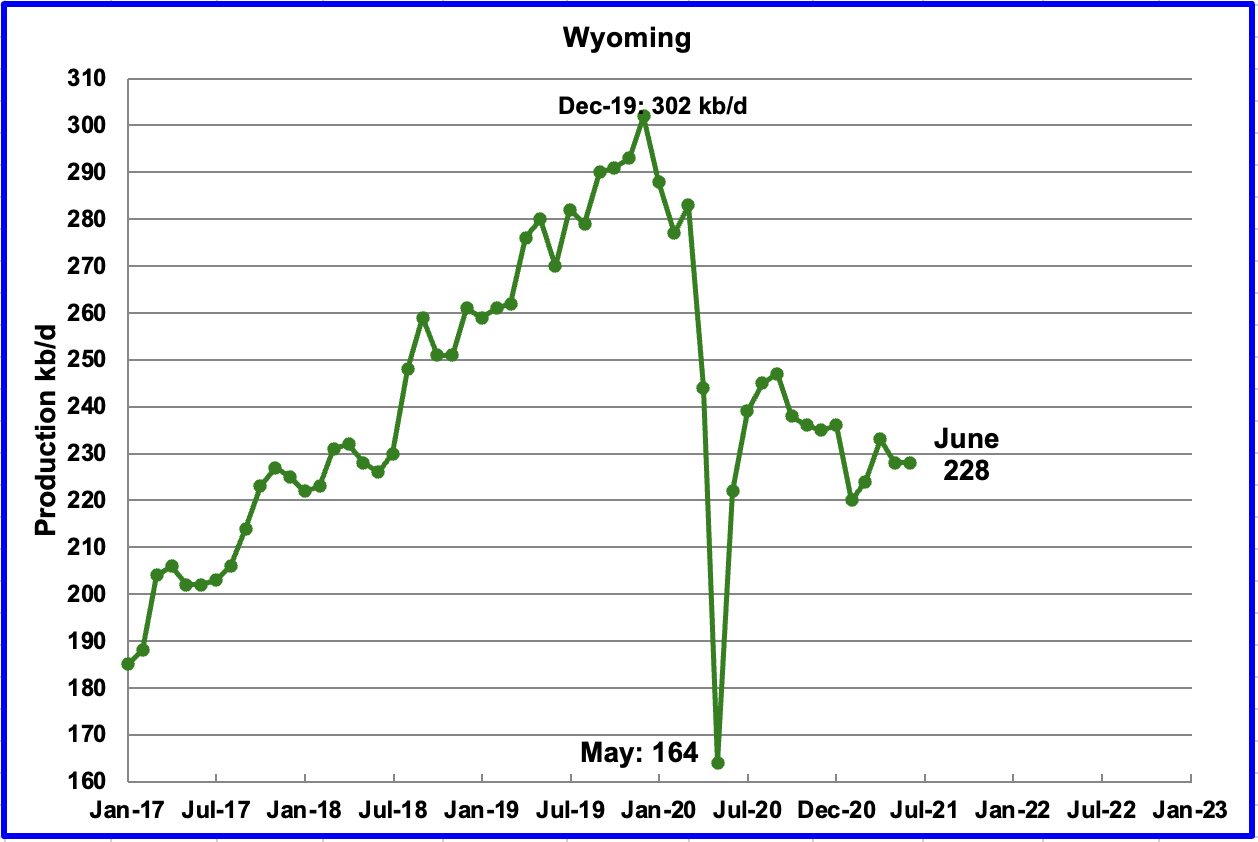
Wyomingʼs production in June was unchanged at 228kb/d. Wyoming had 3 oil rigs operating in May and they increased to 17 by late August.
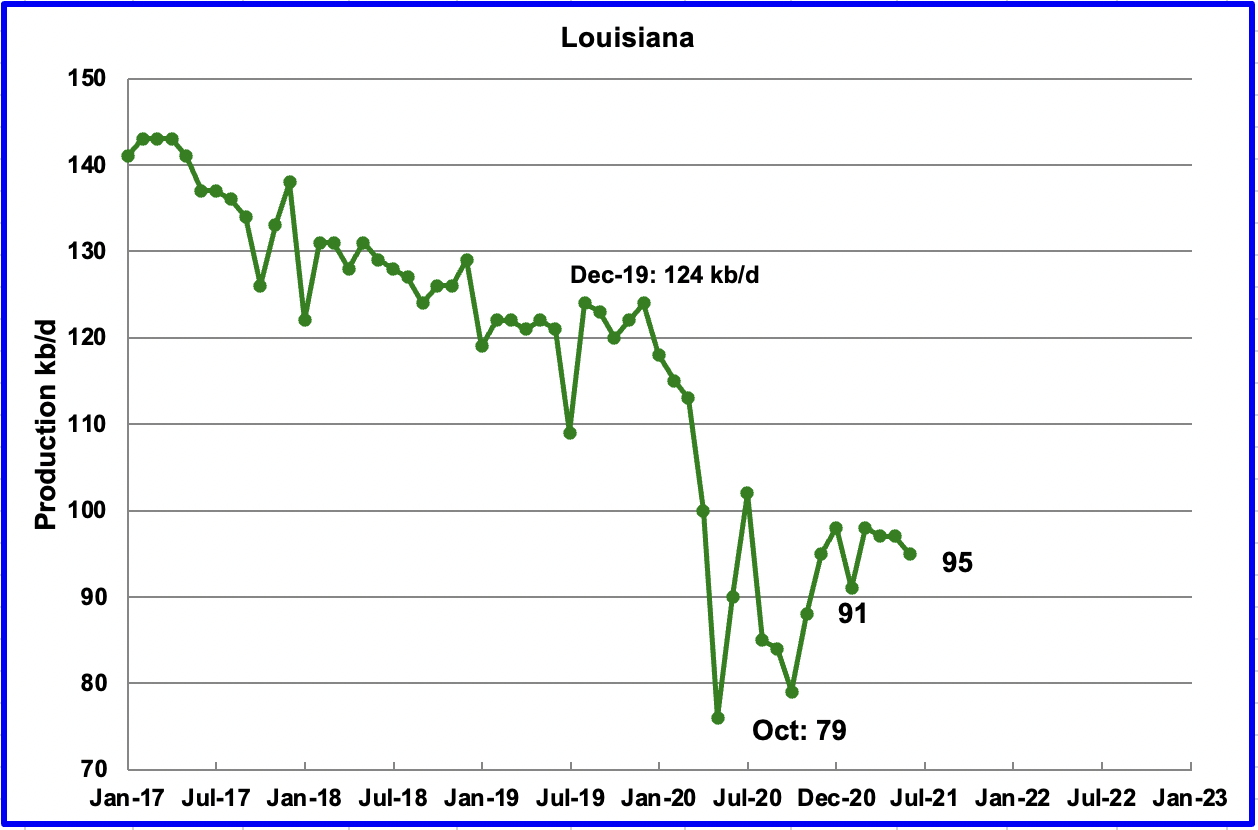
Louisianaʼs output was down 2 kb/d in June to 95 kb/d.
June’s production increased by 5 kb/d to 95 kb/d. Ten oil rigs were operational in June and were increased to 11 by the fourth week of August.
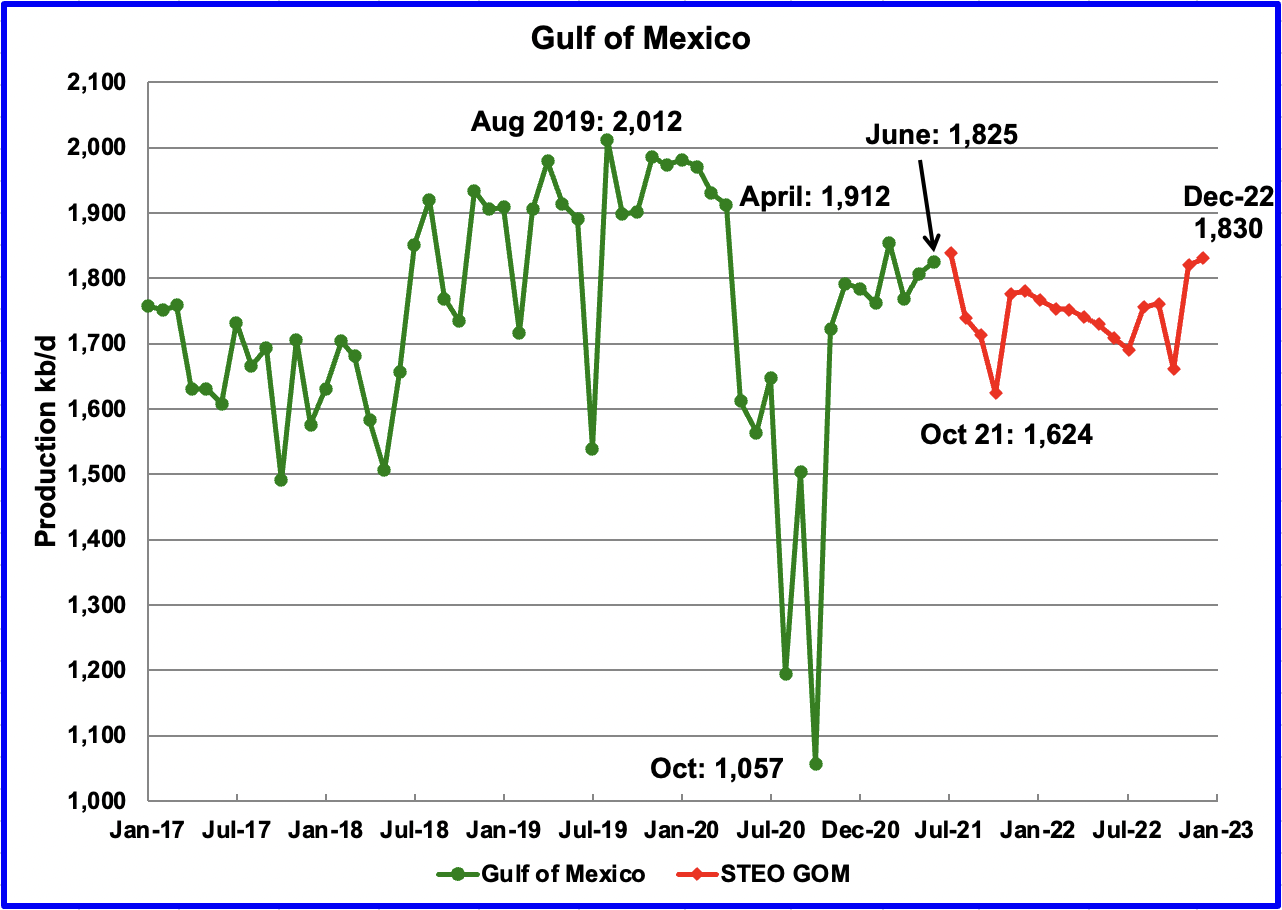
Production from the GOM increased in June by 18 kb/d to 1,825kb/d. If the GOM was a state, its production would rank second behind Texas.
The August STEO projection for the GOM output has been added to this chart and projects output to be 1,830 kb/d in December 2022, little changed from the current August output level.
From July 2021 to October 2021, production drops by over 200 kb/d. Is this due to maintenance or an expected high hurricane season? Ida just hit Louisiana hard in late August taking most of the Gulf platforms off line. Also, why does output drop from December 2021 to July 2022? Is this natural decline?
1) Short Term Energy Outlook
The STEO provides projections for the next 13 – 24 months for US C + C and NGPLs production. The August 2021 report presents EIAʼs updated oil output and price projections to December 2022.
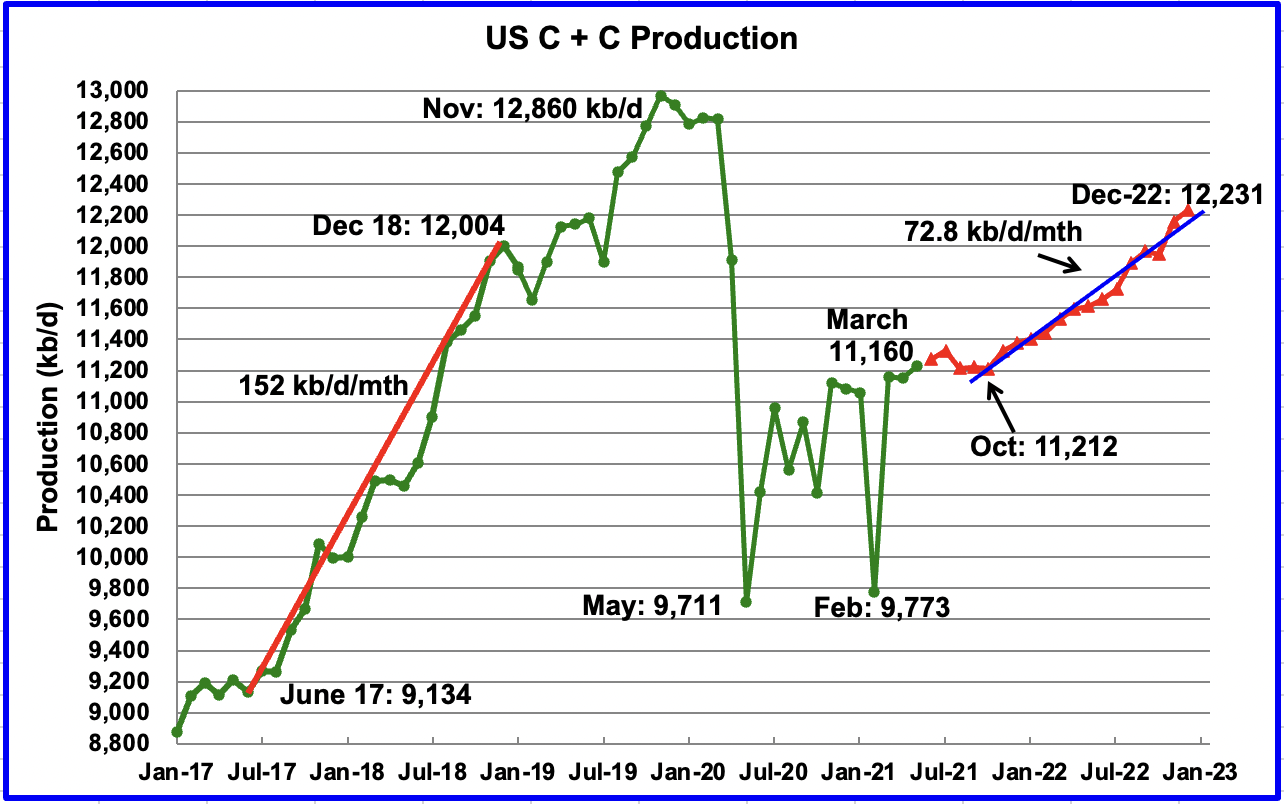
There has been a small revision in the August STEO outlook. The December 2022 output has been reduced by close to 80 kb/d and there is a small output increase in July before it drops back to 11,200 kb/d in August 2021. Production then begins to climb in an almost linear manner from November 2021 to December 2022 at an average rate of 72.8 kb/d/mth. It is not clear why output begins to climb almost linearly after November.
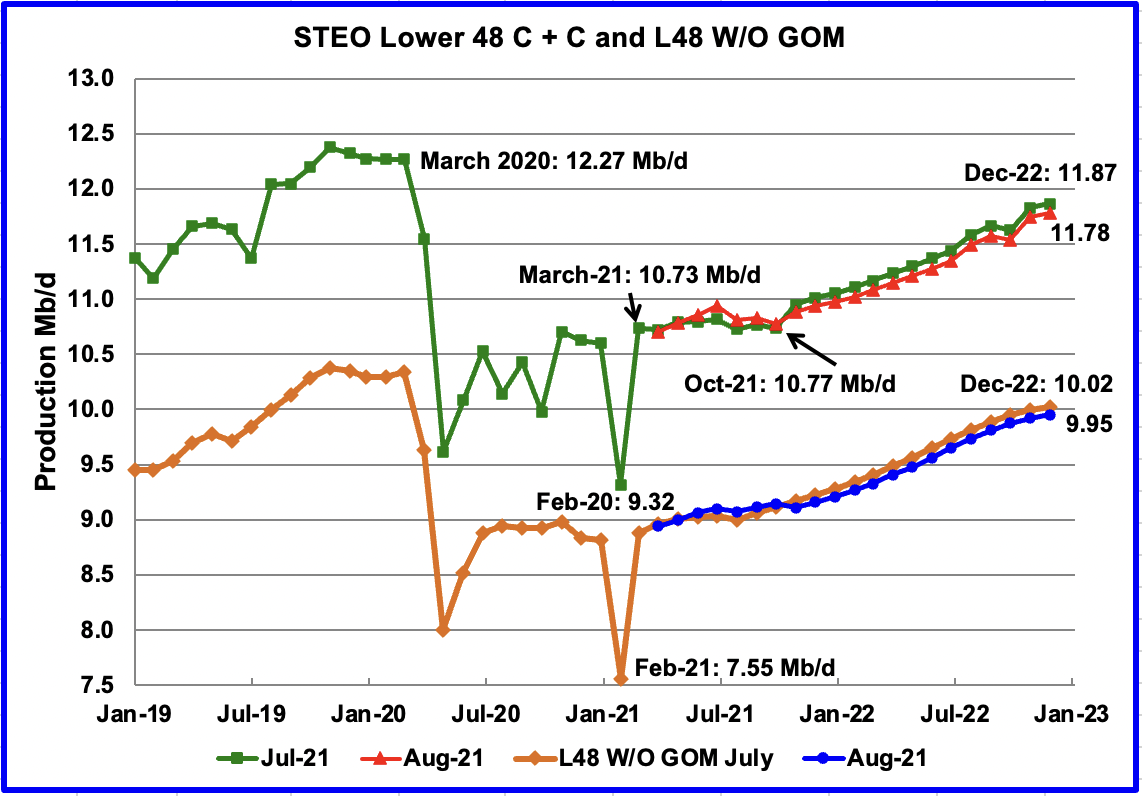
The August STEO output projection for the L48 states is very similar the one provided in the July report except for the output decrease of roughly 90 kb/d from late 2021 to 2022. Similarly for the lower 48, the August projection is close to 80 kb/d lower than the July estimate.
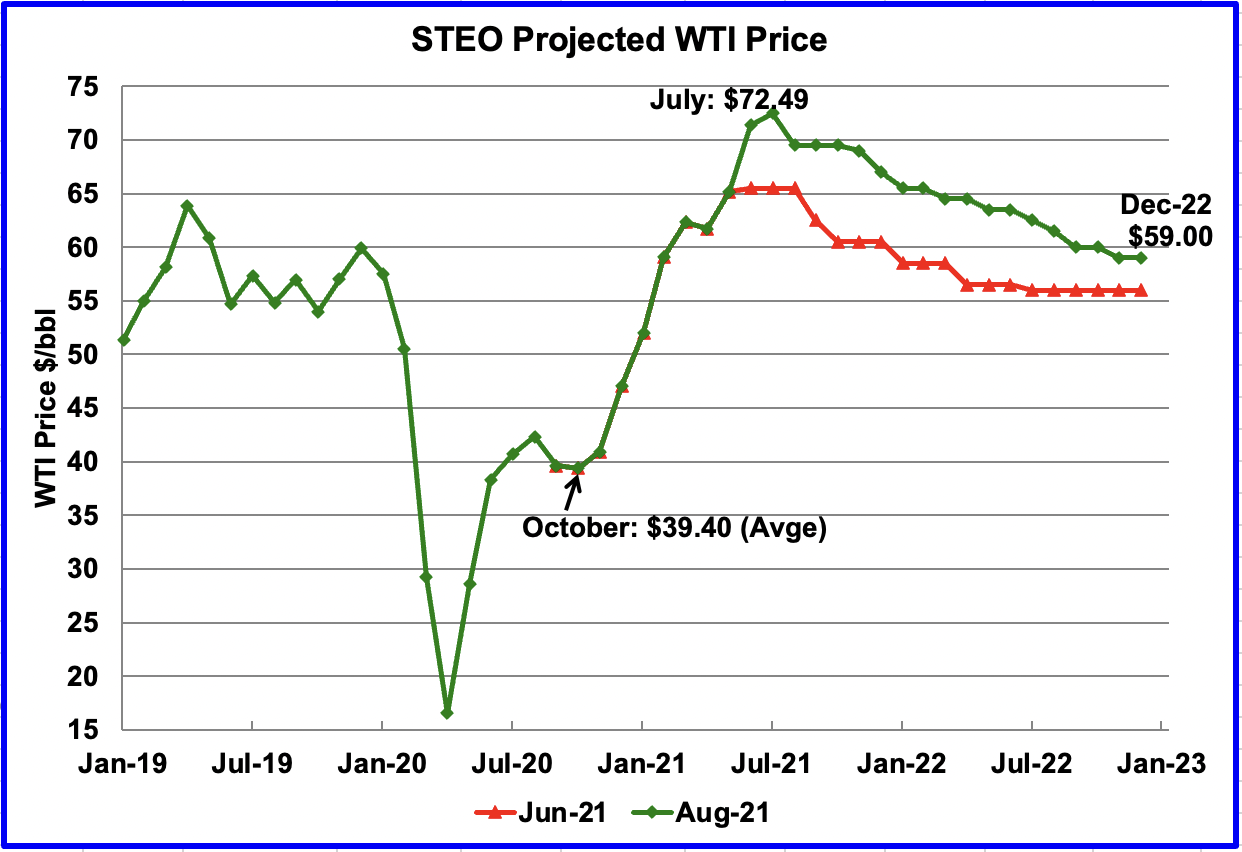
The August 2021 STEO oil price forecast shows a steady decline from the peak in July $72.49 to $59 in December 2022. The December 2022 price projection is down $2 from $61 in the July report
The October WTI contract settled at $68.50 on August 31, slightly lower and reasonably close to the EIA projection of $69.50.
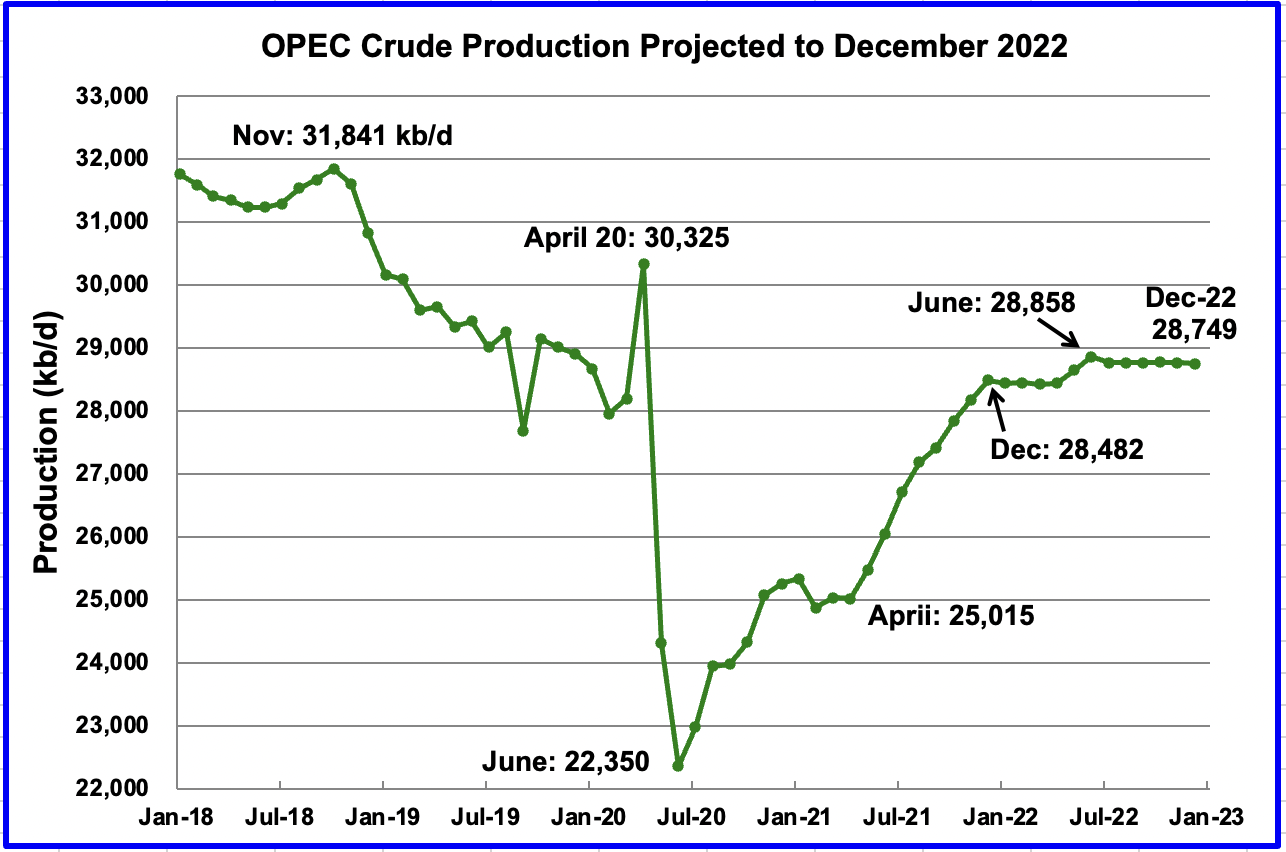
This chart shows the STEO’s August forecast for OPEC crude output to December 2022. OPEC’s output is projected to increase from April 2020 to December 2020 by close to 3,450 kb/d. For July 2020, EIA forecast production to be 26,710 kb/d. Actual production as reported by OPEC was 26,657 kb/d.
In July, OPEC + announced they will add 400 kb/d/mth from August to December for a total of 2,000 kb/d. Of the 2,000 kb/d, OPEC will add 1,772 kb/d, or 88.6%, according to the EIA. The EIA’s projected OPEC monthly increases for August to December are, 470, 230, 425, 329, and 319, respectively.
OPEC’s production for the second half of 2022 is projected to be flat and virtually the same as OPEC’s output on January 2020, just prior to the onset of the pandemic.
According to this preliminary report: The Organization of the Petroleum Exporting Countries has pumped 26.93 million barrels per day (bpd), the survey found, up 210,000 bpd from July’s estimate. Output has risen every month since June 2020, apart from in February.
The EIA August STEO report estimated that OPEC would produce 27,180 kb/d in August, 250 kb/d higher than the preliminary report.
2) Drilling Productivity Report
The Drilling Productivity Report (DPR) uses recent data on the total number of drilling rigs in operation along with estimates of drilling productivity and estimated changes in production from existing oil wells to provide estimated changes in oil production for the principal tight oil regions. The following charts are updated to September 2021.
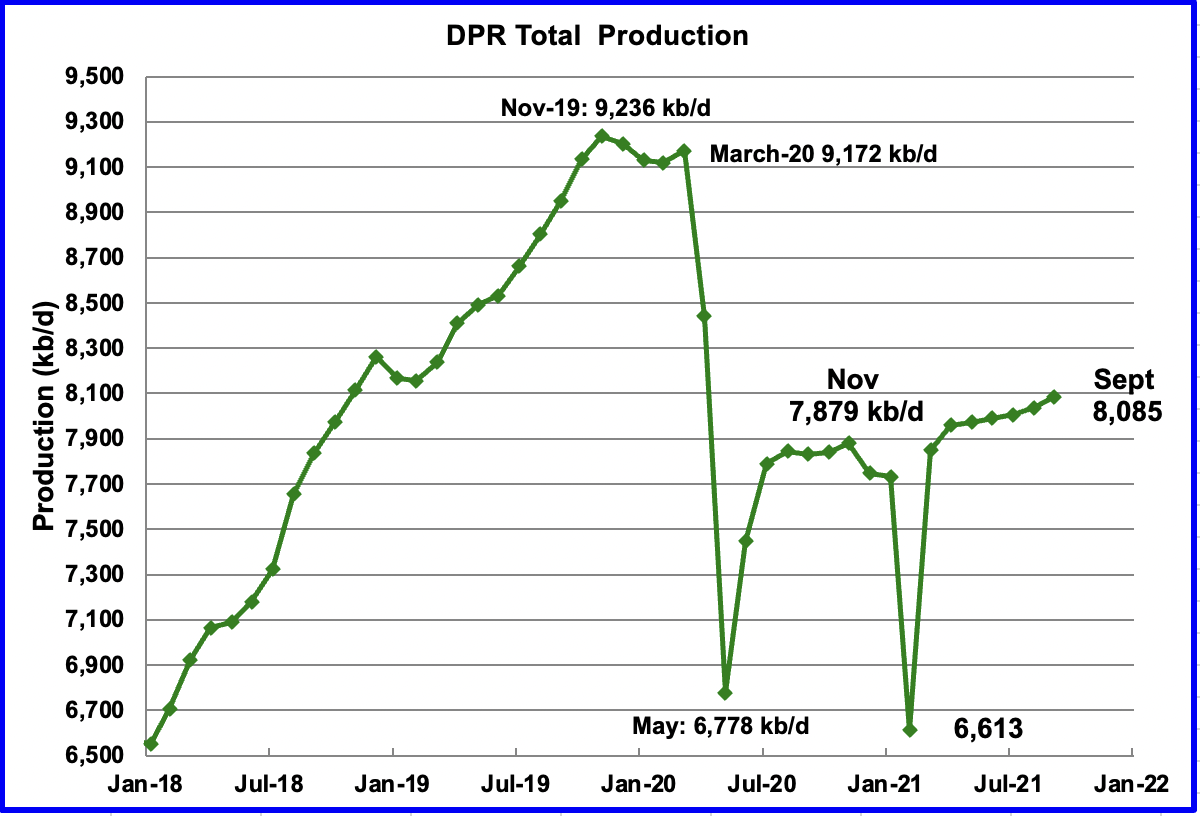
Above is the total oil production from the 7 DPR basins that the EIA tracks. Note that the DPR production includes both LTO oil and oil from conventional fields
The DPR is projecting output for September 2021 to increase by 48 kb/d over August to 8,085 kb/d. From March to September, output in the DPR is forecast to increase by 235 kb/d or close to 40 kb/d/mth and appears to be accelerating.
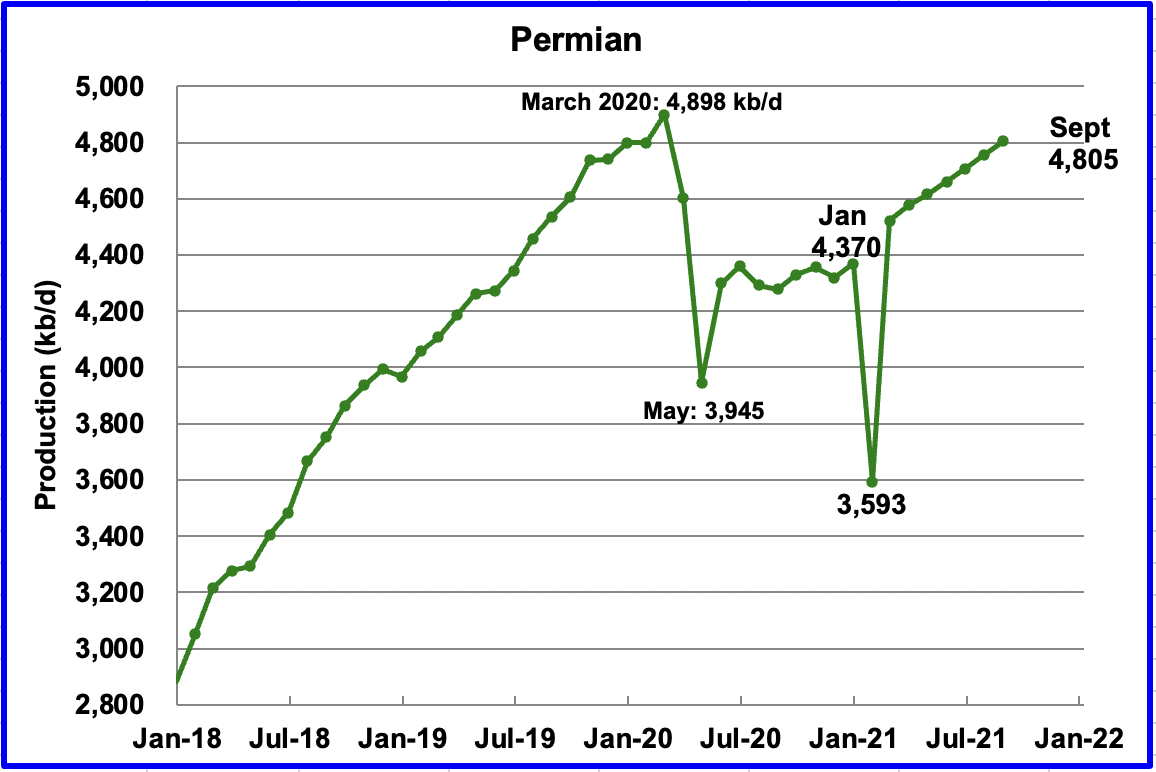
Permian output in September 2021 is projected to be 4,805 kb/d, up by 49 kb/d from August. From March to September production increased by 284 kb/d or approximately 47.3 kb/d/mth. At this rate, Permian production will exceed the March 2020 peak of 4,898 kb/d in November .
During July, close to 239 rigs were operating in the Permian, up from 100 in November. These were increased to 244 in August and are more than sufficient to increase production in the Permian.
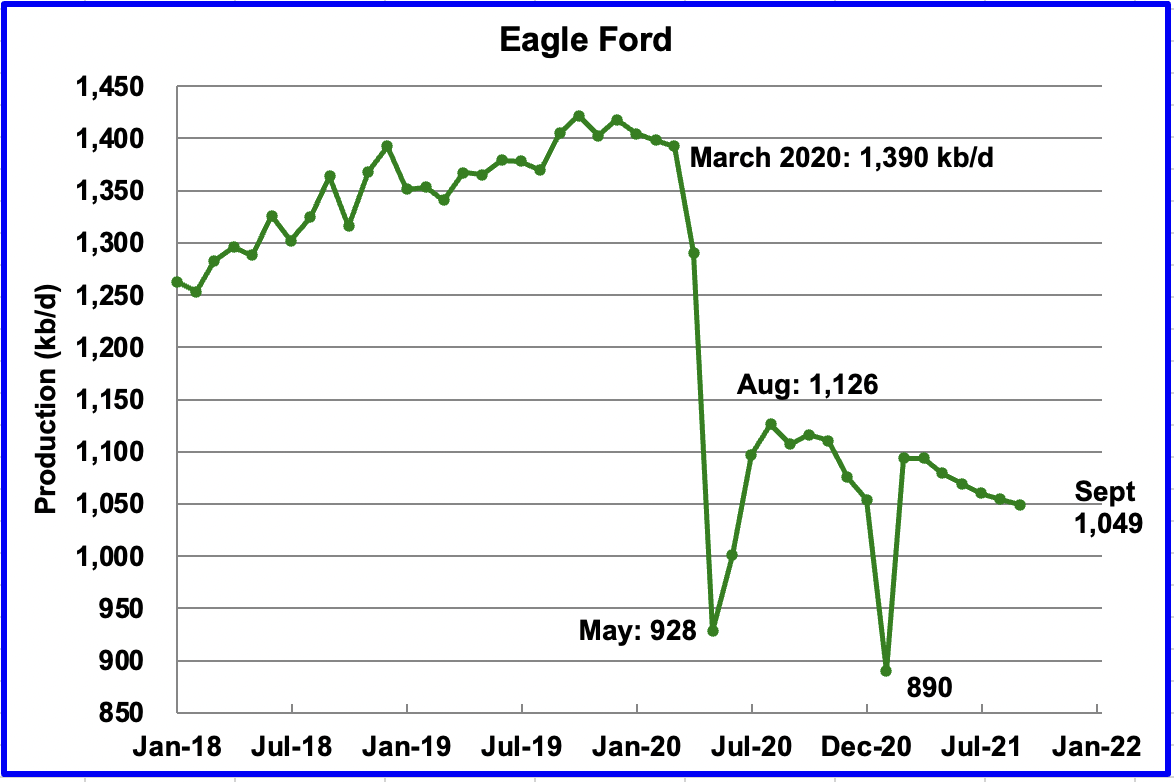
The forecast for the Eagle Ford basin has shown a dropping but slowing output for six consecutive months. Output is expected to drop by 5 kb/d in September to 1,049 kk/d.
It should be noted that the August update has revised last month’s August output from 1,039 kb/d to 1,054 kb/d. The DPR forecasts continue to under estimate production from the LTO basins.
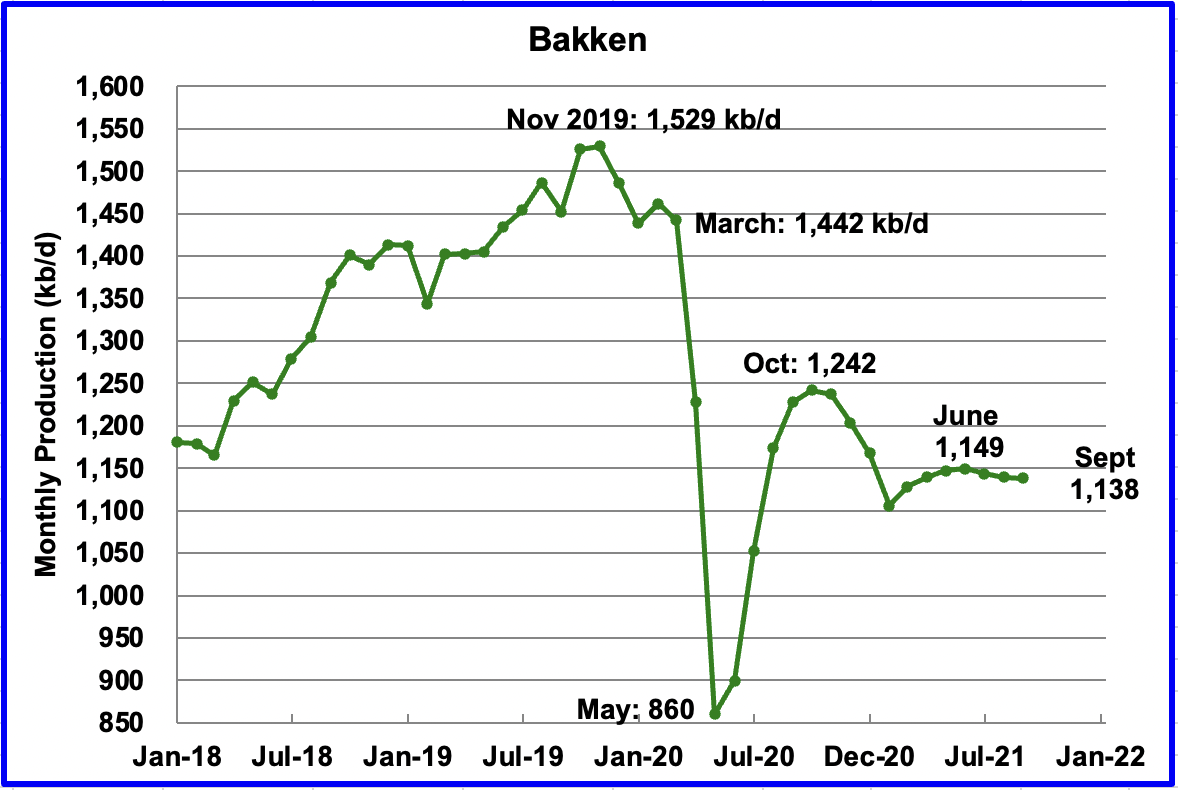
The DPR forecasts Bakken output in September to be 1,138 kb/d a decrease of 1 kb/d from August.
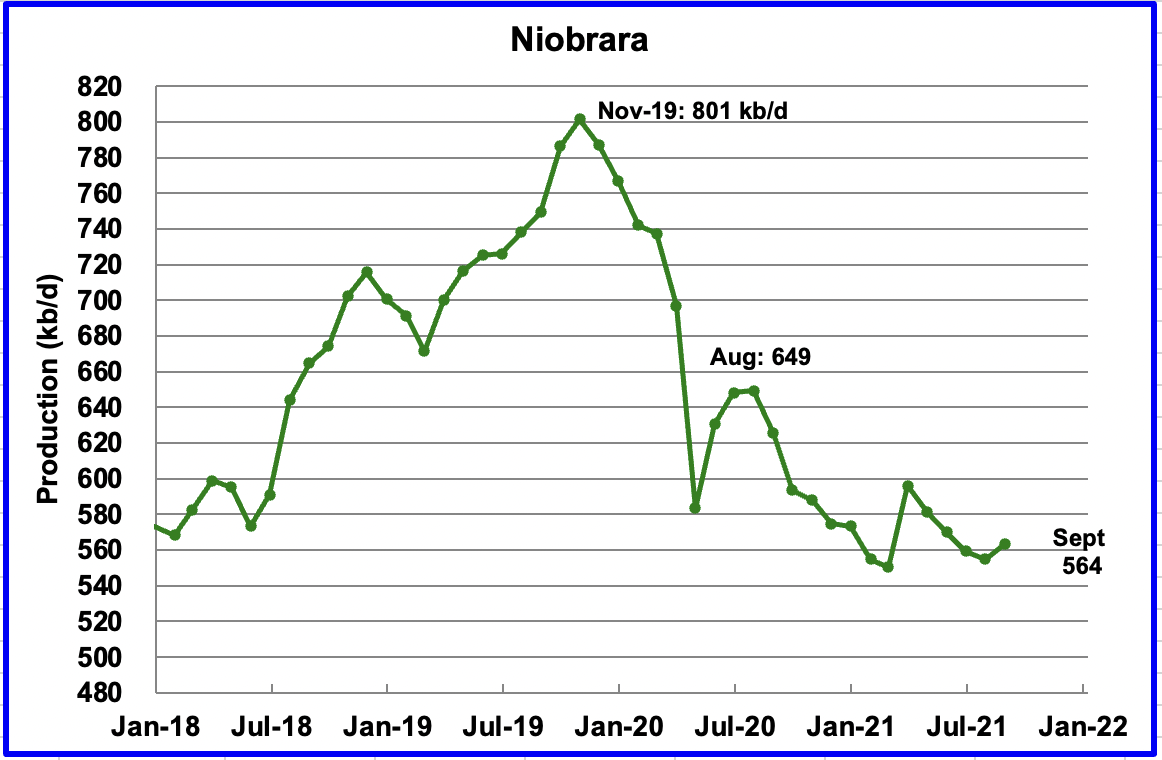
Output in the Niobrara reached a new low in August 2021, 555 kb/d. However, September is forecast to increase by 9 kb/d to 564 kb/d.
The Niobrara is spread over Wyoming and Colorado. In June 7 oil rigs were operating in the Niobrara. By August, they had increased to 12.
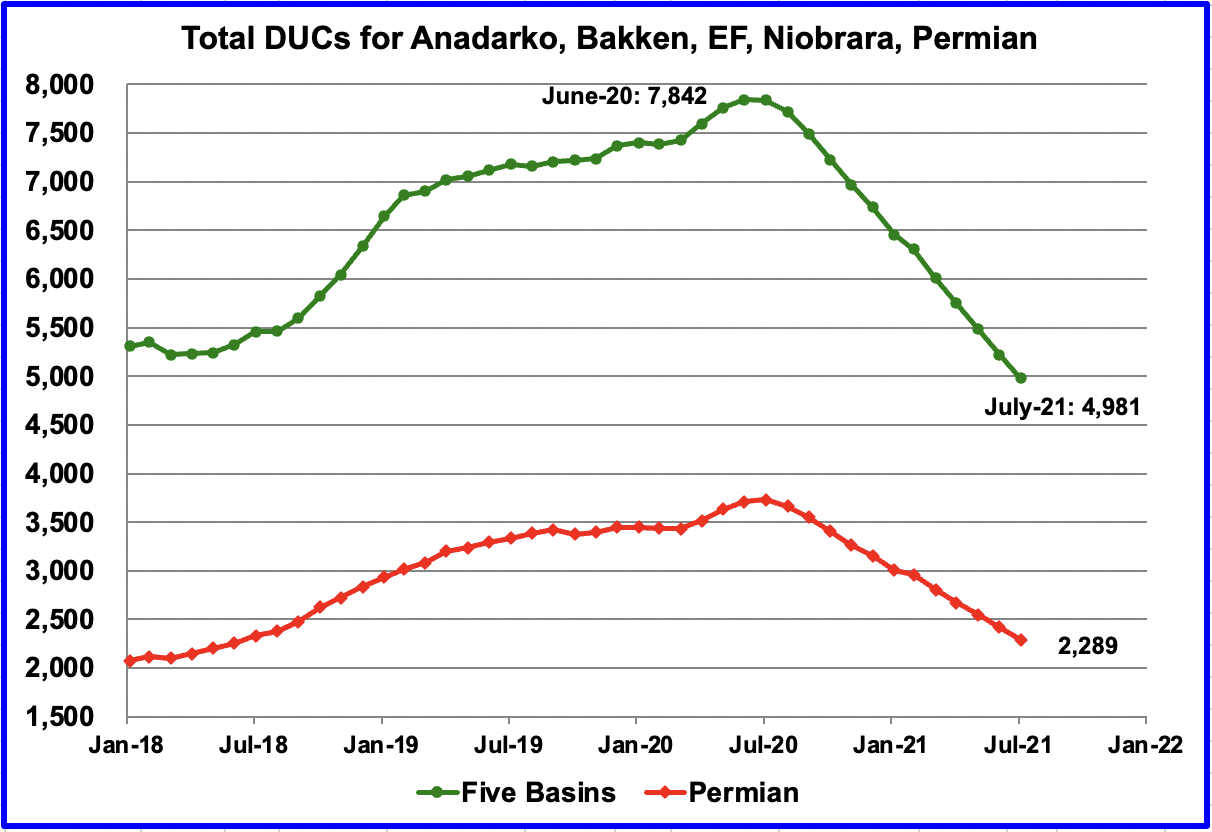
In these five primarily oil basins, DUCs are being completed at an average rate of close to 235 DUCs/mth. In total 258 were completed in July, according to the EIA. In the Permian, the completion rate is close to 125 DUCs per month. In July, 130 were completed in the Permian.
The monthly completion of DUCs accounts for the increase in production in the Permian.
3) LIGHT TIGHT OIL (LTO) REPORT
The LTO database provides information on LTO production from seven tight oil basins and a few smaller ones. The August report projects the tight oil production to July 2021.
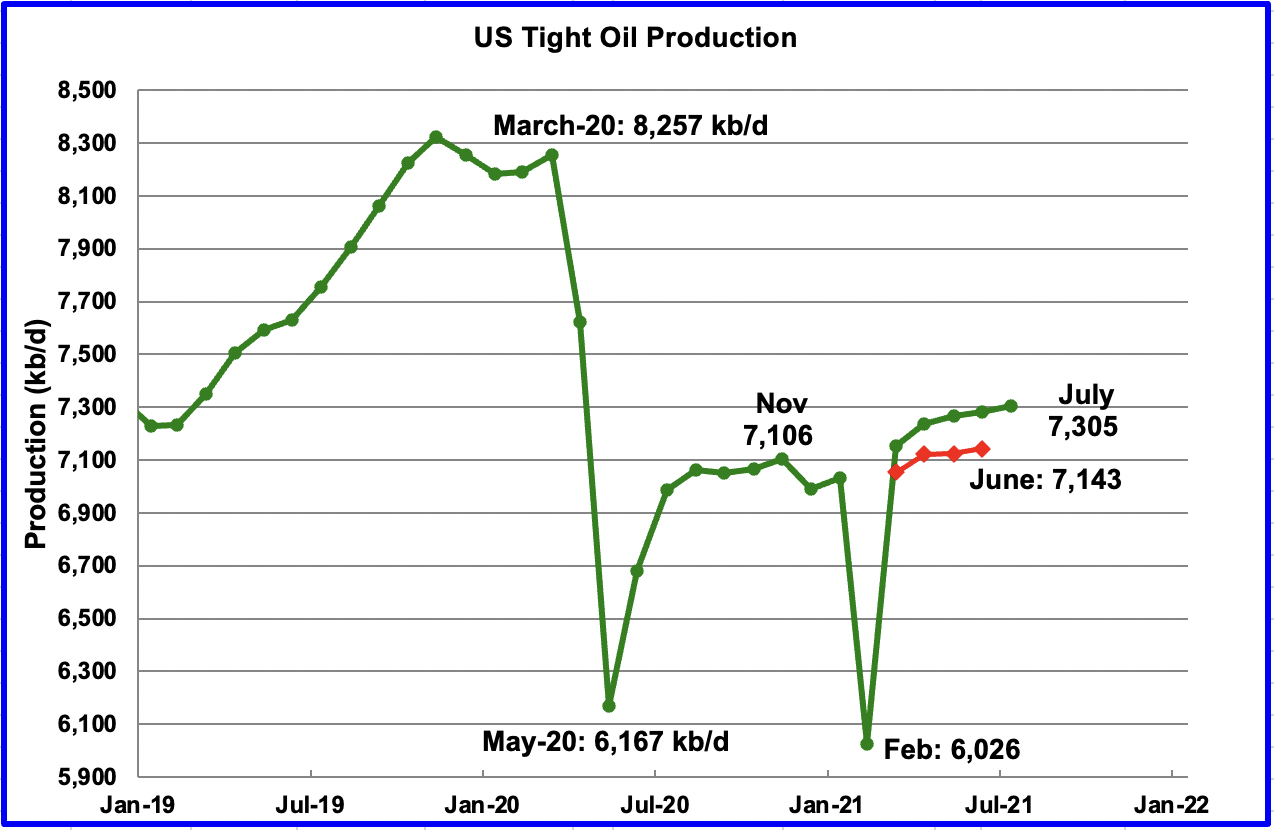
July’s LTO output is expected to increase by 21 kb/d to 7,305 kb/d.
In the August LTO report, July’s forecast output was increased from March to June by close to 120 kb/d to 150 kb/d. It appears that the early estimates are always on the low side. The red markers represent LTO output as reported in the July report.
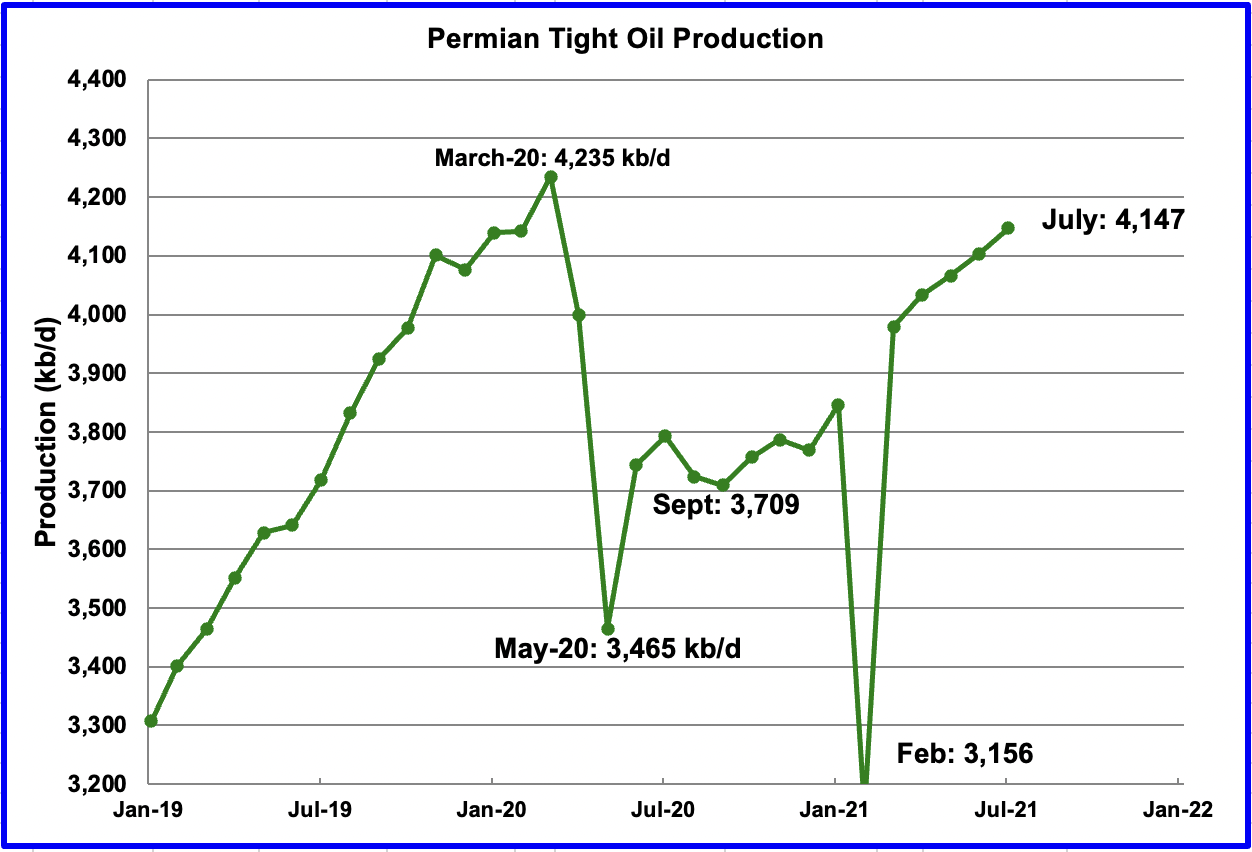
Permian LTO output in July is projected to increase to 4,147 kb/d, an increase of 43 kb/d. Production in the Permian continues to rise at an average rate of 42 kb/d/mth since April. At this rate, it could almost equal the March 20 high of 4,235 kb/d by September.
It should be noted that Permian DUCs are being completed at an average rate of close to 125 DUCs per month and contribute to the rising production.
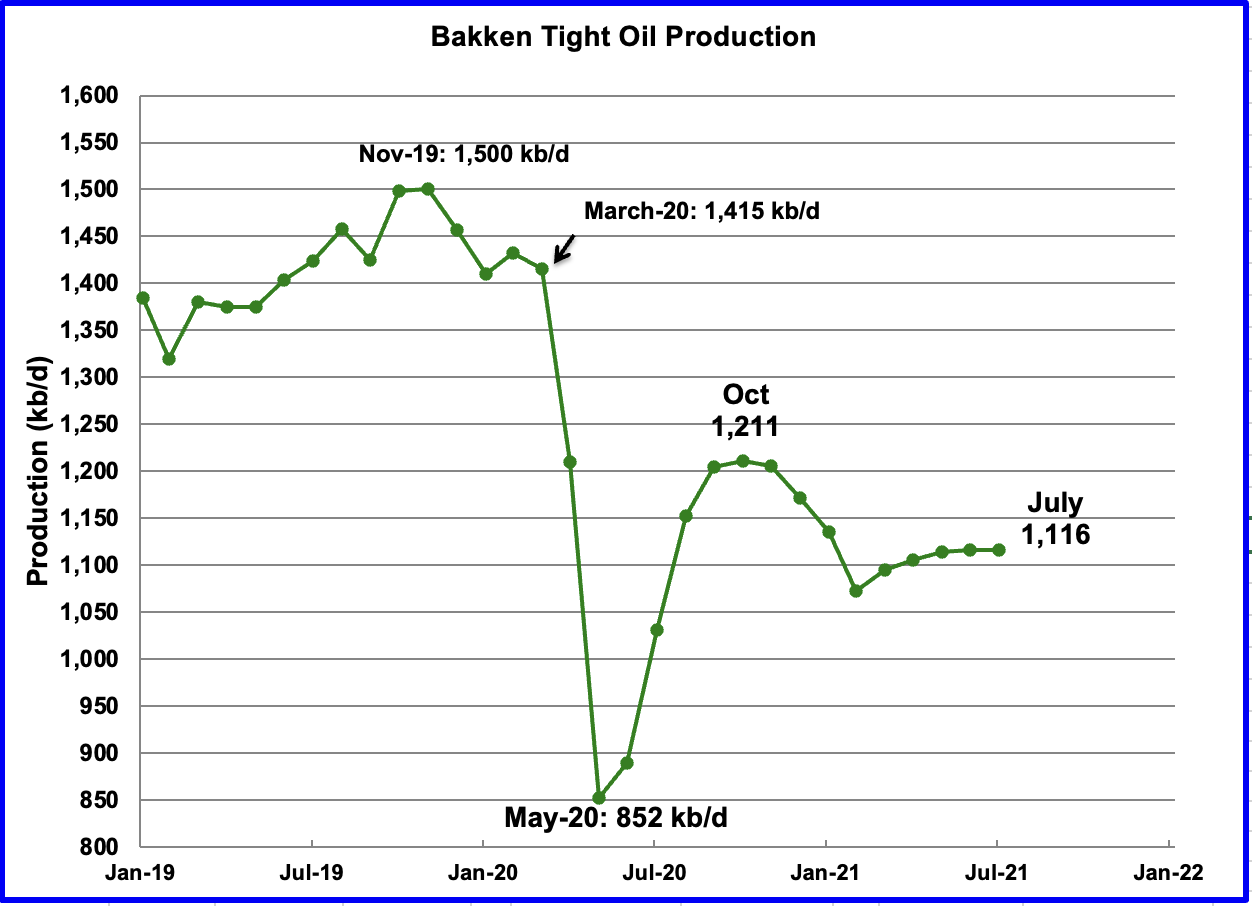
The Bakkenʼs July output is forecast to remain unchanged at 1,116 kb/d.
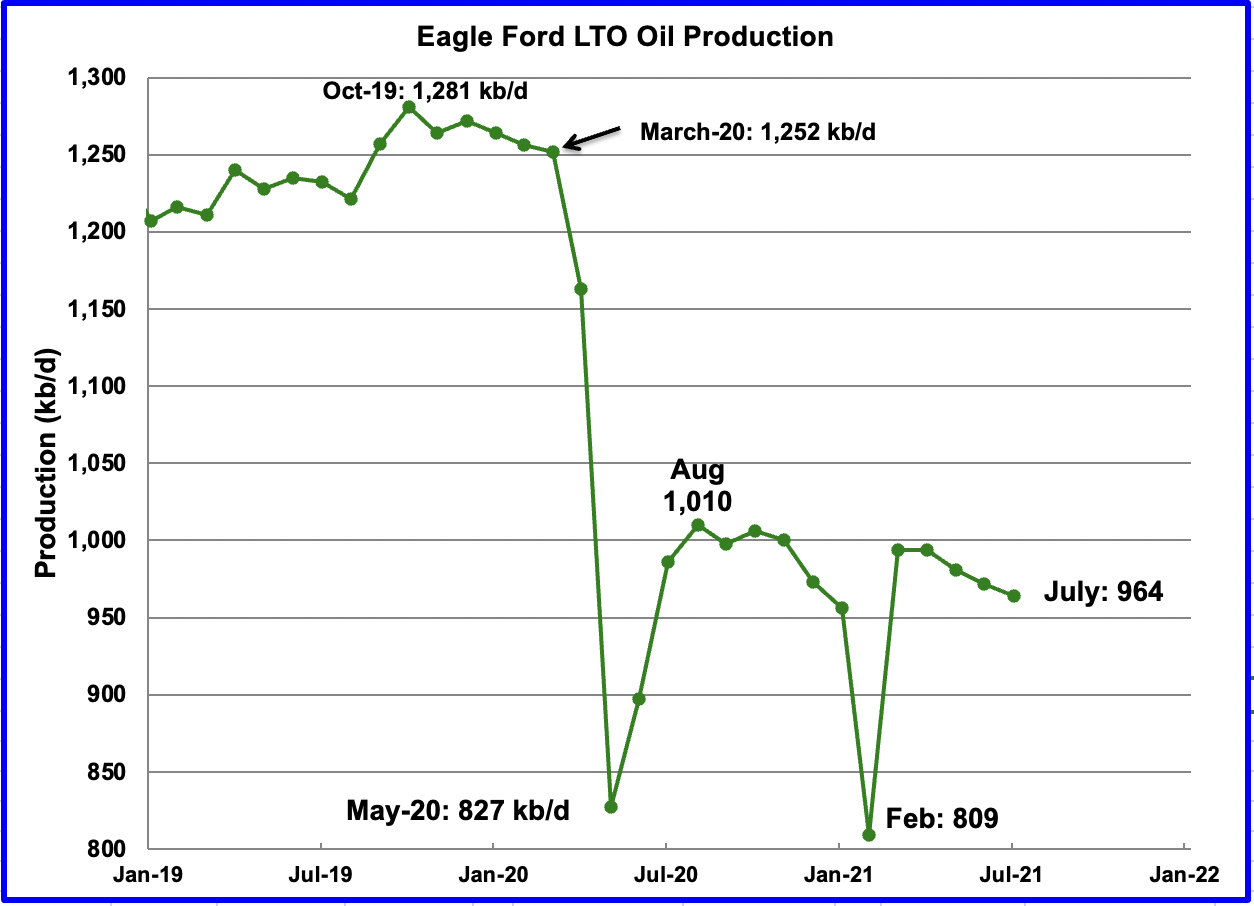
The Eagle Ford basin is expected to produce 964 kb/d in July, a decrease of 8 kb/d from June.
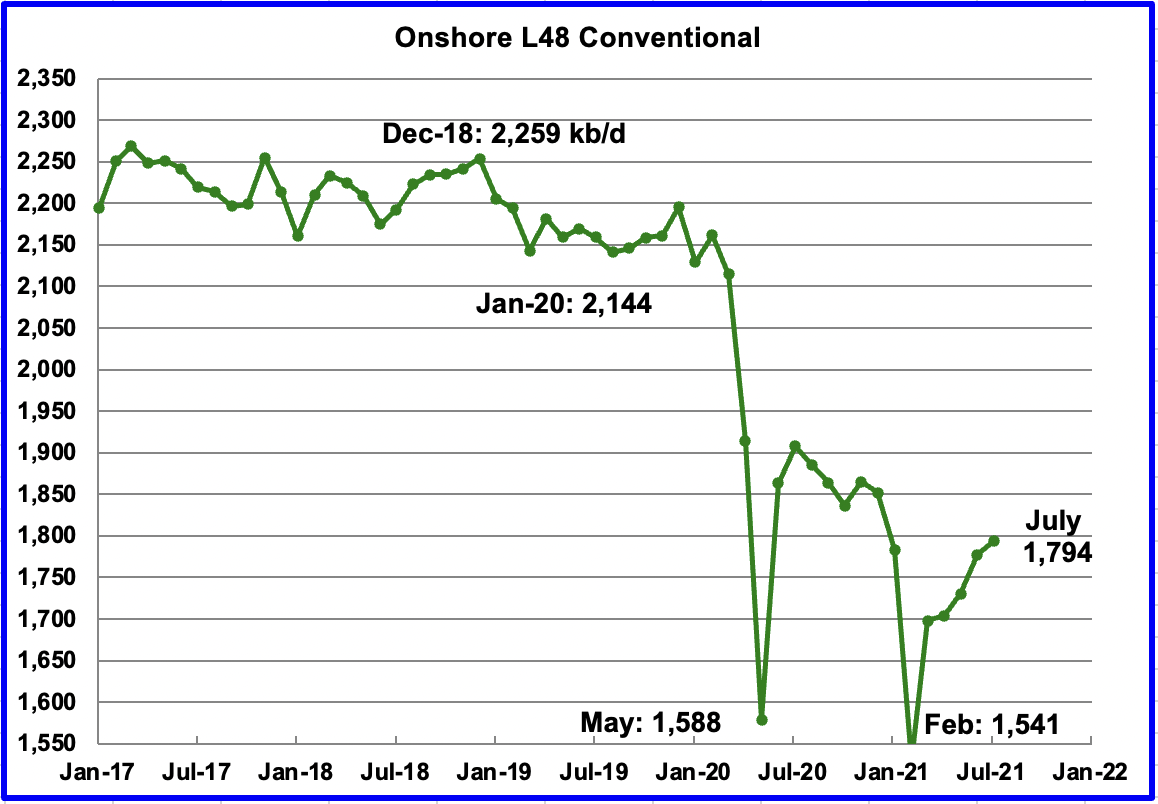
Conventional oil output in the On-shore L-48 is expected to increase in July by 17 kb/d to 1,794 kb/d from June 2021. This estimate is based on a combination of the July LTO output and the August STEO report that projects US on-shore L48 out to July 2021.
In the August LTO report, LTO output was revised up by 120 kb/d to 140 kb/d. This revised output resulted in a decrease in conventional oil output. The June conventional output of 1,881 kb/d in the July report has been revised down by 104 kb/d to 1,777 kb/d in the August LTO report.
4) Rigs and Fracs
Since the end of July, the US added 25 oil rigs during August for an average rate of 6/wk. Of the 25, 5 were added in each of Wyoming and Texas and 6 in New Mexico.
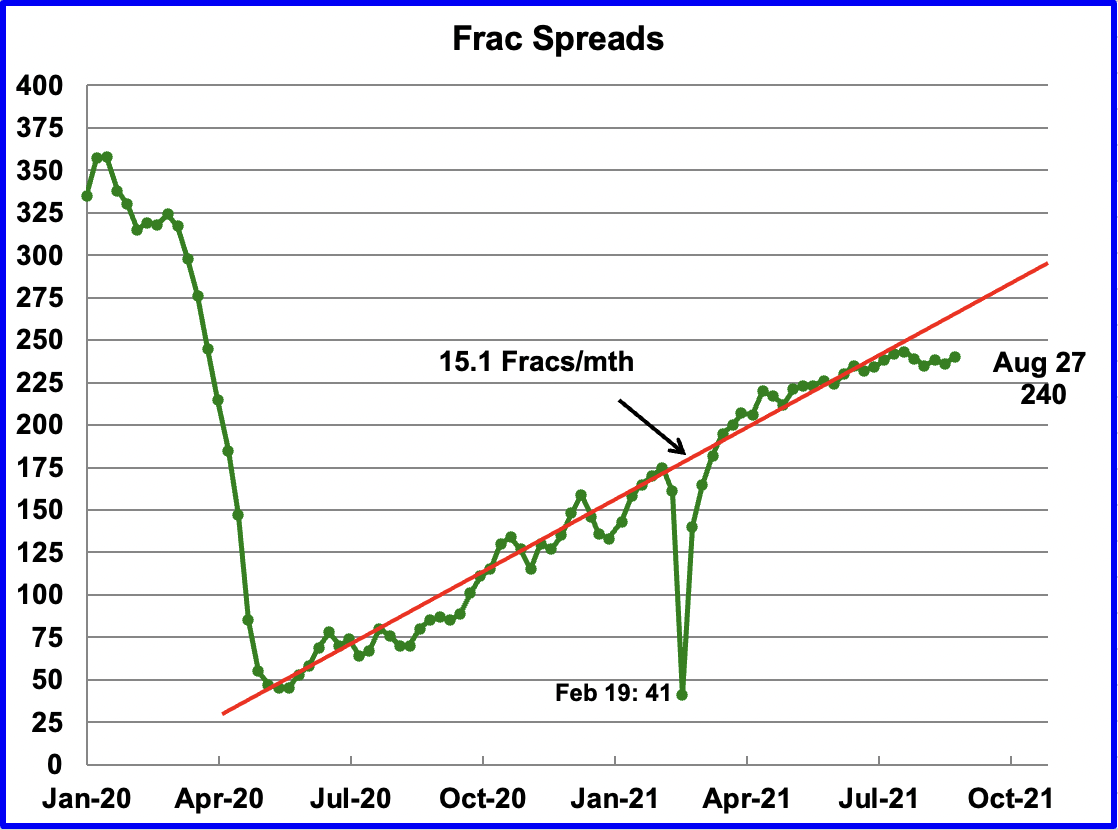
Since the week of July 23, frac spreads have not been added at the previous rate of approximately 15 spreads per month. During the week of July 23, there were 243 operating frac spreads. In the week ending August 27, 4 frac spread was added for a total of 240, fewer than in July 23.
Note that these 240 frac spreads include both gas and oil spreads.
5) World Oil Production
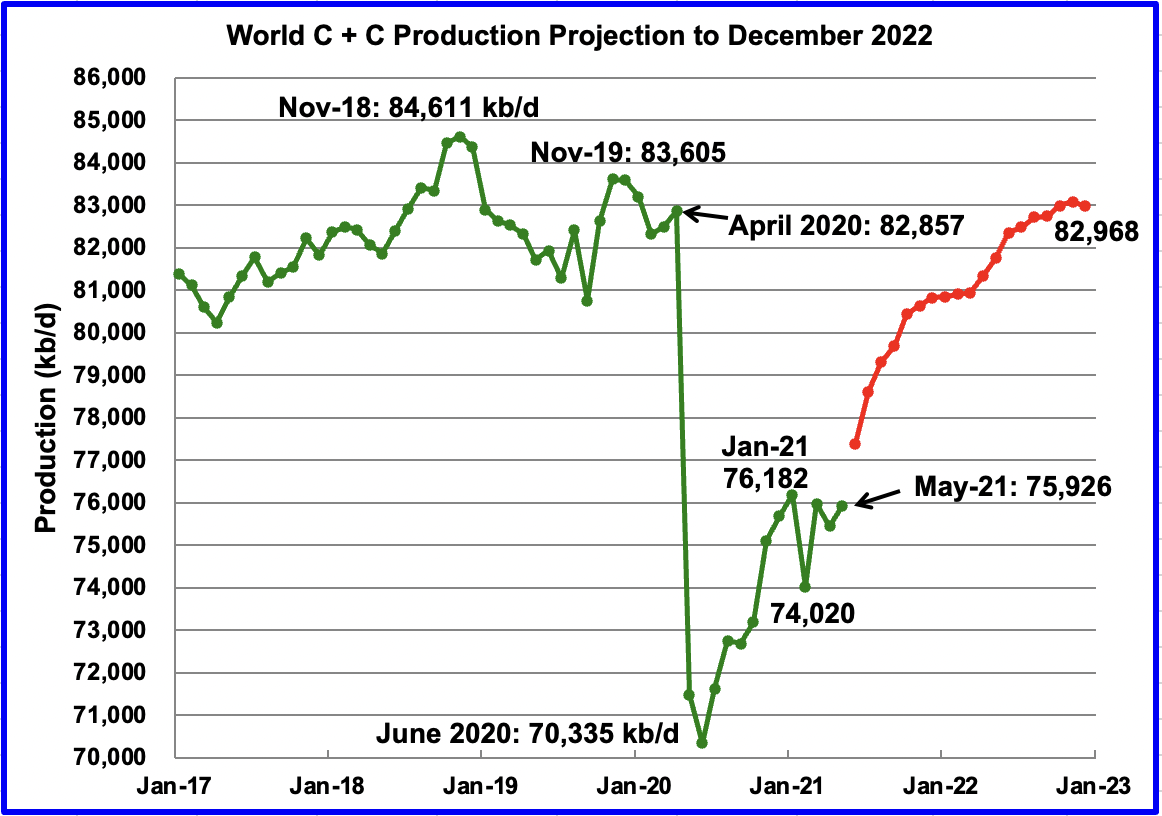
World oil production in May increased by 485 kb/d to 75,926 kb/d according to the EIA. Of the 485 kb/d increase, the biggest contributor was Saudi Arabia, 385 kb/d. There were a number of countries that had smaller increases of less than 100 kb/d, offset by countries with similar decreases.
This chart also projects world production out to December 2022. It uses the August STEO report along with the International Energy Statistics to make the projection, red graph. It projects that world crude production in December 2022 will be close to 82,968 kb/d, little changed from the April report. The December 2022 output is 1,643 kb/d lower than the November 2018 peak of 84,611 kb/d.
216 responses to “June US Oil Production Little Changed”
You express your uncomprehension for the linear trend of oil production starting from october for US STEO. So do I. I don’t understand also why EIA start an almost linear and flat trend for OPEC oil production starting from december 2021. Indeed, the group of the lesser oil producers of OPEC (Angola, Algeria, Nigeria, Venezuela, Gabon, Equatorial Guinea, Congo, Libya) experienced a decrease of daily production of 67 kb/month between december 2017 and march 2020. There is no reason that these decline will not continue. Furthermore, the Ghawar field experienced between 2008 and 2018 a decrease of daily production of 60 kb/month. So, if there is trend for OPEC it is one of decline.
Jean Francois,
Let’s look closely at your group of declining OPEC producers which includes Venezuela. Venezuela had an average monthly rate of decrease of about 36.5 kb/d over the Dec 2017 to March 2020 period. Currently Venezuela’s output has stabilized at about 500 kb/d, but even if it continued to decrease at the previous rate (the most recent rate of decrease has been about 9 kb/d per month over the past 16 months).
Bottom line is the 67 kb/d per month decline estimate is unlikely to continue at such a high rate, it is likely to fall to 30 to 35 kb/d per month.
Now to increasing OPEC nations (leaving off Iran that was hit with sanctions and is unlikely to decline as it dis over the Dec 2017 to Mar 2020 period). The big 4 (Saudi Arabia, Iraq, UAE, and Kuwait) increased output over the Dec 2017 to March 2020 period by 36 kb/d.
So it looks like OPEC output would be flat from a high output level (as was the case in Dec 2017 and March 2020). Note however that currently OPEC output is far below the March 2020 level by about 1922 kb/d.
The Dec 2021 STEO estimate looks reasonable, but the increases they forecast in 2022 are likely optimistic unless an agreement on the JCPOA (Iran nuclear deal) is reached between the US and Iran. If that is accomplished prior to the end of 2021 (seems unlikely at present), then the STEO forecast for OPEC output in 2022 might be an underestimate.
Thanks for the work Ovi!
The Russian propaganda news outlet says Iran is fixing to increase production by 1 mb/d:
https://www.rt.com/business/533596-iran-further-million-barrels-oil/
JFF
Not sure if their is a typo or a misunderstanding with what is happening in Ghawar.
Its current decline rate us close to 2% annually or approximately 75 kb/d/yr. This would translate to a number closer to 6 kb/d/mth.
Yes, it was a typo!
Thanks Ovi,
Great job!
Chart below has Permian basin horizontal oil rig count from Baker Hughes (using pivot table).
https://rigcount.bakerhughes.com/na-rig-count
The trend from Oct 23, 2020 to Aug 27, 2021 is about a 120 rig annual rate of increase over that 10 month period.
The early part of the data (Oct 23, 2020 to Mar 26, 2021) has an annual rate of increase of 174, and the later part has the rate of increase lower at 62 rigs per year (Mar 26, 2021 to Aug 27, 2021).
For comparison 2 years ago the horizontal oil rig count was 399, one year ago it was 121 and the most recent data point (week ending Aug 27, 2021) has the horizontal oil rig count in the Permian basin at 236.
Are you sure that a linear regression is correct to describe the curve? A logarithmic regression would fit more to the data.
Jean Francois,
Just showing the linear trend, not looking for best fit using arbitrary functions, as I stated in my comment the trend was higher, now it is lower, what happens next is not known.
Ovi.
I think shale well location numbers in the Permian are the key to the future. LTO argues those are far less than has been advertised.
The other issue is labor and materials to drill those wells. Helms in ND points to that.
The cost of steel pipe has skyrocketed. It is to the point where I am getting quotes on plugging some marginal wells, because the value of the both the surface and down hole equipment is worth more than what the well could be sold for as a producer.
Lease values are depressed, in part because of labor and equipment shortages. In part because of the fear of government regulations.
Now, not sure about all of this yet. I am getting some quotes, just to see. Would be interesting if right now one can come out with a positive cash flow P & A ones own wells.
COVID has resulted in a lot of weird stuff.
Shallow sand,
The issue in North Dakota may in part be companies moving their capital to New Mexico and Texas where costs are cheaper and there is a higher ROI.
The inventory problem in the Permian basin is an interesting one.
LTO survivor has said there are 5 to 6 years of drilling inventory left, though he never tells us at what rate of drilling he is assuming. If we take the maximum 12 month average completion rate in the permian basin (about 458 completions per month), that would be about 30000 wells completed over 66 months. If we assume oil prices do not increase in the future and that no other drilling locations are added in the future, we get a very conservative scenario for Permian output with ERR of 22.5 Gb. It is assumed rigs are added at the rate of the last 10 months (120 rig increase per year) until 425 new wells can be drilled per month, I assume at this point DUCs are steady state (little change month to month until drilling rate decreases). Total wells drilled are about 63000 (30000 inventory, plus 31000 completed to date, plus DUCs). I assume a maximum wellhead price of $67/bo for this scenario, well cost is $10.5 million, P and A is 500k, OPEX is $17.33/bo. Debt reaches a maximum of $130 billion in early 2021 and all debt is paid back by late 2026 for this scenario. If debt was at $160 billion in early 2021, debt would be paid back in full one year later in late 2027. It is assumed that 25% of net revenue is paid out as dividends, annual interest rate assumed to be 7.5%.
Higher oil prices and greater drilling inventory would allow for higher ERR. I expect that both will be higher in the future than assumed in this scenario and my guess is there is about an 85% probability that ERR will be higher than 22.5 Gb for the Permian basin. My best guess remains 46 Gb.
Leaving my other scenarios for Bakken, Eagle Ford, Niobrara, and rest of US tight oil unchanged with the Permian conservative scenario above, the US tight oil scenario looks like the chart below with ERR=54 Gb and peak in Feb 2026 at 8621 kb/d. I expect this scenario is too low by 20 Gb or so and peak will likely be later (2027/2028) at about 9500 kb/d.
This actually looks realistic.
Stephen,
I know to people here it does, but as I have suggested probably 65% of the USGS mean TRR will be produced in the Permian basin under a reasonable oil price scenario (one that has oil prices rising to $100/bo by 2028 in 2020$). Mean TRR for Permian basin by USGS estimate is about 75 GB, 65% of that is about 49 Gb, for comparison North Dakota Bakken/Three Forks mean TRR estimate by USGS is 11 Gb, 65% of that would be 7.15 Gb, cumulative production through Dec 31, 2019 plus proved reserves is about 8 Gb for North Dakota Bakken Three Forks.
I would put the minimum for Permian ERR at about 37 Gb with perhaps a 90% probability that ERR will be higher than 37 Gb. I have revised my thinking on the probability that the ERR will be 22 Gb or less to less than a 5% probability, it would require oil prices to remain at current levels or less for all future time. I doubt this will be the case until some time after 2032.
No, I’m more thinking this graph is a good representation of your idealized lab-grown model and how it might perform in the real oil world (based on the more sobering views of oil men on this blog), given price volatility, debt loads, spiking materials costs, lack of investment interest in fossil fuels, economic uncertainty in the next few years due to Covid variants, and a more rapid rise in EV adoption in high-use oil countries than expected because of the high oil prices, etc.
The real world .
https://tomluongo.me/2021/09/02/breaking-empire-means-breaking-with-saudis/
Stephen , your response to Dennis is one word ” bulls eye ” . The real world is different .
Your post is appreciated . Separate’s the wheat from the chaff . Kudos .
Stephen,
Perhaps you will be correct, I expect it will be 2033 befor demand for oil falls faster than the supply of oil. I also expect that eventually the World will get past covid, perhaps by 2023. There is likely to be a lot of pent up demand for travel new cars etc, working from home is nice, but people are social beings and many will want to return to work for more social interaction. There may be some reduced demand for oil due to work from home, perhaps it will result in a significant decrease in demand for oil.
Note the high oil prices will tend to overcome the economic uncertainty, rising costs, and lack of investment. The sobering views of the oil men have been input into the model with higher well costs, higher operating costs, lower new well EUR, etc.
I hope the transition to EVs happens as quickly as you imagine, but a more realistic view is that it will take 15 years for EVs and plugin hybrids to make a significant dent in oil demand. I wish it were not so, but I have modelled this and even 15 years may be too optimistic for a realistic EV transition scenario.
LTO survivor has said the oil is there, just not at $75/bo, he said $150/bo, but I think he may have been exaggerating, $100/bo will do it and by 2025 we will be there (perhaps higher) in 2020$.
As I am sure you are aware, no model represents reality with perfection all of them make simplifying assumptions, but rather than hand wave we have a set of assumptions and physically based well profiles, completion rates, prospective earth volumes that are likely to contain oil based on geology and geophysics and I run the numbers, subject to expert estimates from the USGS.
Note that the USGS estimate from 2013 for the Bakken/Three Forks yields a very reasonable ERR estimate using the same methodology I apply to the Permian basin.
North Dakota Bakken/Three Forks mean TRR=11 Gb and ERR=7 Gb, 7/11=0.64
Permian Basin mean TRR=75 Gb and ERR is probably 48 Gb, rather than 22 Gb, 48/75=0.64
Also note the assumptions of the Permian basin 22 Gb scenario, only 63k wells of a likely prospective number of wells closer to 125k and oil prices no higher than $70/bo for Brent in 2020$ ($67/bo at wellhead). These are not very realistic assumptions and would not be likely to lead to a fast transition to EVs.
Dennis,
6 years with the current rig count.
SS
Thanks.
I kept hearing how the price of Steel was going up. Did not make the link to drilling wells. Any idea if the increase is related to tariffs or just higher demand?
Ovi.
I don’t know.
I do know there isn’t a lot of 2 3/8” tubing around. Not long ago it was around $2.50 per foot. Recently paid $6.69 per foot.
We are scrounging around trying to find used, tested. But not a lot around.
Heck, I’d like to buy a new riding mower too. John Deere dealers say it will be at least November.
Lots of shortages.
Shallow sand,
Don’t these prices go up and down?
During the height of the pandemic there was a big drop in steel prices? What is the most you have paid for 2 3/8″ tubing in the past, maybe during 2011-2014 when oil prices were $110/bo and demand may have been quite high would be my guess?
Chart below is for steel rebar (couldnt find chart for tubing) from
https://tradingeconomics.com/commodity/steel
Dennis.
Yes of course they go up and down.
We keep some tubing in inventory, but not that much.
Same for sucker rods and down hole pumps.
When a well goes down, if you don’t have any on hand, you have to buy it.
The $6.69 happened because we were out and couldn’t find any used, tested. Why we might go ahead and plug out a few of our worst wells. We are also searching for cheaper over a wider area.
Another issue is likely that one of the supply stores in our area closed up shop a couple years ago during this most recent bust.
There could also be regional bottlenecks. We will find some cheaper somewhere hopefully.
Commodities are volatile. We contracted some corn earlier this year for $5.91 per bushel. Look at the price of corn the past few years. Then take that times 200 bushels per acre times a few thousand acres. That’s what farmers deal with too.
Just part of it.
Shallow sand,
Commodity prices are volatile and perhaps more so during a Worldwide pandemic.
For steel producers they may be happy right now, yes farmers are at the mercy of the market, more so than steel or oil producers because their product can spoil. I suppose steel can rust as well but shelf life is probably longer than corn.
For those interested in corn see link below
https://markets.businessinsider.com/commodities/corn-price?op=1
Up and down from $3 to $8 per bushel, but most of the time around $4/bushel (long term average).
What is the long term average steel tubing price for 2 3/8″?
This is why changes in investment measured in dollars are damped relative to changes in actual infrastructure. According to this paper: https://doi.org/10.2516/ogst/2019061
upstream investment in 2018 was 40% less than that of 2014 measured in dollar terms, but that translated into a 12% drop in terms of actual infrastructure. I believe that the damping will be even more significant in terms of ramping up for reasons that have been brought up by the invaluable comments of those who are actually in the business: labor and talent shortages combined with more expensive parts.
Total global upstream capex in 2020 and 2021 has fallen a further 40% from 2018 levels. Latest estimates are around $310bn (nominal) for both years. It also looks likely to continue for 2022 given current trends.
Much more interesting is the capex reduction by OPEC. There was a chart a couple of weeks ago with Saudi rigs at 27, lows since 2005. The total upstream capex by OPEC has come down to $13bn in 2021 compared to $40bn in 2017 – declining by 2/3 over the period.
chart here:
https://www.opec.org/opec_web/en/647.htm
Ancient archer,
There is a lag in investment, not clear that 2022 will be similar to 2021.
If investment is low oil prices are likely to be high and high oil prices will attract more capital the following year.
Schinzy,
How is “actual infrastructure” measured? Do you mean rig counts, offshore platforms?
Seems difficult to add this stuff up, probably an oil industry dollar index (reflecting overall oil industry costs) would be the way to go.
Dennis,
Good point. I don’t know how actual infrastructure is measured. But when you cut costs, you get rid of the least productive workers and you are buying fewer parts. Cost per well will tend to decrease. When you are expanding CAPEX, you hire new workers that probably won’t be as productive on average as the ones already working, you are buying more material so costs per well tend to rise.
Ancientarcher,
Thanks for the link.
Dennis,
Sure, 2022 investment in upstream might improve but the ridiculously low capex in 2020 and 2021 will have an impact on production going forward. And of course, as mentioned above, capex has been declining since 2014 – that will also have an impact.
Brace for lower supply going forward.
Your answer to that is – as prices increase, investment will increase.
My response to that:
1) will it? given all the hoo-haa about ESG and climate change?
and
2) even if investment goes up, which it will eventually, it will take 3-4 years for that to flow through to supply. It’s not as if you increase capex now and tomorrow you will be producing in new fields.
So, brace for a period of supply deficit.
Ancient Archer,
Yes I expect the market will be short of oil, perhaps oil prices go to $120/bo for 3 to 4 years, investment increases, then possilbly oversupply or adequate supply depending upon speed of transition to non-oil land transport. After 4 to 6 years the transistion may have proceeded to the point that oil prices start to fall as demand falls faster than supply. Potentially OPEC falls apart and we see a market share war with oil prices quickly dropping to $30/bo (in 2020 $). Of course this is one of an infinite number of possible future scenarios, only one will be correct, unlikely that it will be my scenario that is correct.
Schinzy,
Yes that makes sense. Keep in mind that on top of this there is technological change along with learning by doing that tends to gradually bring costs lower, though the rate of decrease in costs from this effect will fall over time. Also costs for materials and services may have fallen during the period of slack demand so these rising costs may just bring costs back to a “normal” level.
Steel Prices are up but the most important costs are completion costs which have been relatively flat for the first 5 months of the year but due to labor shortages, those costs are starting to climb again.
Steel tubing is a big business where I live, and 2020 was one of the worst years in decades. Production crashed. Now they are scrambling to get production back up to pre-pandemic levels.
Dennis,
Pressure depletion is real. Each successive year we will see lower and lower yields per well. I assume the current drilling rate because there is no new money coming into the industry. Companies with stronger balance sheets will: (1) continue to buy other companies/ producing barrels (2) pay down debt (3) attempt to make dividend payments.
It has been my experience that at current product prices, companies cannot pay down debt, pay dividends and grow production. The price prediction of $59 per barrel is not high enough to make LTO sustainable. This is a fact and now with steel shortages and labor shortages and cost push inflation the economics are getting worse. There will be a point in time where the locations and pressure are gone. It won’t be this year or next but its coming.
LTO
I need some clarification on your statement “Pressure depletion is real”.
If you are referring to a completed well with laterals, then the pressure will drop as the oil and water come out. Basic physics.
Is it possible that you are also saying/implying that there is a general pressure drop across a whole basin/field. My understanding is that LTO basins consist of a large number relatively small pockets of oil that are not connected. Hence fracking is required to connect them with small passages to bring the oil to the well bore.
If you are saying/implying that there is a general pressure drop across a whole basin/field, then that implies that there may be small connecting passages between a number of the small pockets of oil. Can’t think of another explanation.
Ovi,
We are seeing significant connection between wells spaced 1400 feet apart. Our original shut in pressure was 2400# at the surface as opposed to the child wells with 1600# shut in at the surface. Our IPs are only about 71.428% of the average flowing parent wells. I only expect this to get worse over time. Everything is interconnected and in some cases with wells 1420 feet apart we are seeing the production in the parent well being effected in a positive way with more water and hydrocarbon being produced. Despite the fact we have horrible permeability in the shale, the efficient nature of the frac complexes being propped open are creating pathways between wells.
Good analysis from Mike Shellman on interconnectivity in the Permian:
https://www.oilystuffblog.com/single-post/four-seasons-spraberry
Presumably the water flows better through the fractures than the hydrocarbons, as water molecules are smaller than most hydrocarbon molecules, though not methane I guess.
So if you are fracking and pumping in a lot of water, I would expect that you might be able to maintain total pressure, but not the partial pressure of the hydrocarbons. In other words you may be able to maintain total pressure, but if so you are unlikely to do anything about the increasing water cut.
LTO Survivor,
Current drilling rate is around 275 wells per month in the Permian, so 60 months of inventory would be 16500 well locations in the entire Permian basin if we assume 5 years of inventory at current drilling rate. Is that the number you have in mind?
The price assumptions of my scenario is $67/bo for crude oil at wellhead, NGL sold at 35% of crude wellhead price and Natural gas sold at 1.80/MCF. I assume a well cost of $10.5 million. The steel and labor shortages will be temporary, the market will adjust.
The model assumes average new well EUR starts to decrease starting in Jan 2020. The model uses an average EUR of 406 kbo per well. I have also increased OPEX for model to $17/bo.
I understand the pressure depletion is real, note that my expectation is that oil prices will increase, it is under that higher oil price scenario (with oil prices rising to $90/bo by 2025 and perhaps to $110/bo by 2028) that I expect a higher number of wells to be completed.
Does this 22 Gb scenario seem unrealistic to you? Even the USGS F5 scenario has a Permian TRR of 44 Gb, I would find any scenario with less than 60k wells completed in total (about double the number completed to date) difficult to believe.
How many total wells completed in the Permian basin do you expect by 2040? Are you thinking 45k? In the ND Baken we are likely to see about 25k wells completed minimum for a play with a mean USGS TRR estimate of about 11 Gb (ERR will be 7.5 to 8 Gb). Permian has a mean TRR estimate of about 75 Gb with a 90% condidence interval of 44 to 114 Gb. Permian cumulative production plus proved reserves at the end of 2019 were about 17 Gb, if we add probable reserves the total is about 25 Gb for the Permian basin. I expect we will see reserve growth in the future.
To everybody,
Yesterday the President of Mexico announced that Mexico will no longer sell oil abroad. All oil produced will be used in working at home toward Mexico becoming energy independent.
I just looked over Oil Price and Rigzone and there’s no mention of this. US refineries will be depending on Canada for a greater percentage of crude supply than has been the case, with Mexico (and Venezuela) no longer contributing.
Mexico ” resource nationalism” . Which country is next ?
Hih,
All of them.
I guess it is net exports right? Then this makes no difference, they are a net importer nowadays. Would be strange to ban exports completely as they need to trade to get the right grades.
Jeff,
Mexico is a net exporter of C plus C plus NGL, about 781 kb/d in 2020 and 425 kb/d in 2019, for the World net imports were about 20294 kb/d in 2020, so Mexico is about 4% of the total for 2020. Note that Mexico’s output will continue to decline, if it does so at the recent rate of past 15 years, Mexico will be a net importer of crude in 4 years.
From where did you get the numbers? It differs from eia, perhaps cc only? https://www.eia.gov/international/analysis/country/MEX
Best,
J
Jeff,
The numbers are from BP statistical review of World energy, I used production and consumption of oil in metric tonnes.
https://www.bp.com/en/global/corporate/energy-economics/statistical-review-of-world-energy.html
Part of the difference is how the data is reported, best to do it in tonnes.
If mexico exports 100 barrels of heavy crude and it get refined in the US (and often we get 105 barrels of product as it is lighter after refining process), then Mexico exports those products it looks like they have imported 5 barrels. When we do it in tonnes we have more of a one to one comparison. This is a problem with EIA data.
Thank you. I know the difference between volume-weight-energy but it seems there must be something else that is more important here. Processing gains alone do not explain 781kb/d.
Jeff,
I guess you could ask BP and the EIA, there are many different data sources and each place chooses what they think is best, in the grand scheme 781 kb/d is not a huge amount in a World market consuming roughly 100,000 kb/d of liquid fuel (about 0.78%).
If we use Mexico’s oil consumption minus oil production in barrels for 2020 using BP data we get 598 kb/d more oil produced than consumed, it is possible this oil was stored in Mexico and not exported, I assume all oil produced and not consumed becomes a part of net exports.
Maybe they should just tax oil to reduce waste. It’s cheap by European standards.
Port Fourchon update. Getting GOM production back online will likely take weeks…
“Port Commission executive chairman Chett Chiasson said in an interview with National Public Radio that the damage to Port Fourchon was “extensive” and “far-reaching”.
https://www.upstreamonline.com/production/far-reaching-hurricane-ida-effects-linger-for-oil-and-gas/2-1-1060345
Details on oil and gas shut ins for the Gulf:
https://www.rigzone.com/news/wire/usa_oil_sector_examines_ida_damage-31-aug-2021-166305-article/
Oil spill now occurring near Port Fourchon:
https://www.cbsnews.com/news/hurricane-ida-photos-oil-chemical-spill-gulf-of-mexico-federal-response/
Invest 91L could develop into a tropical system affecting So La by end of this week:
https://weather.com/storms/hurricane/video/watching-system-that-could-impact-the-gulf-of-mexico
Thought of Shallow Sand when I saw this
https://oilprice.com/Energy/Energy-General/The-US-Oil-Industry-Is-Facing-A-Talent-Crunch.html
The EIA predicted that Russia’s oil production would be up 120,000 barrels per day in August. Rystad energy had a similar prediction. Russia’s oil production was down 30,000 barrels per day in August. They only missed their guess by 150,000 barrels per day.
Bold mine
Russia’s August oil, gas condensate output fell to 10.43 mln bpd
MOSCOW, Sept 2 (Reuters) – Russian oil and gas condensate output decreased to 10.43 million barrels per day (bpd) in August from 10.46 million bpd in July, according to Reuters calculations based on an Interfax report citing energy ministry data on Thursday.
Total oil and gas condensate production was 44.09 million tonnes, Interfax reported, versus 44.24 million tonnes in July. The ministry does not provide a breakdown for the production of oil and condensate, a type of light oil.
The Organization of the Petroleum Exporting Countries and other producers including Russia, known as OPEC+, agreed on Wednesday to continue a policy of phasing out record production cuts by adding 400,000 bpd each month to the market.
It was not immediately clear why Russian oil and condensate production fell last month.
Nikolai Shulginov, Russian energy minister, told reporters that monthly fluctuations were not significant and Russia would reach a pre-pandemic level of oil output next May.
Russia plans to pump a total of 506 million tonnes of oil only this year, he said, a 1% decline from 2020.
In 2020 Russia pumped an average of 10,274,000 barrels per day. 506 million tons would be about 1% less than that or about 10,170,000 million barrels per day. Through the first 8 months of 2021, Russia has produced an average of 10,350,000 barrels per day. They are expecting production to drop further this year.
Oh, I believed that they were up to reach almost pre pandemic level (11,3 Mb/d) of 2019 in 2030 as it was said from a document of the Energy Ministry in April. As you mentioned, the recent statements are inconsistent. https://www.themoscowtimes.com/2021/04/12/russia-may-have-passed-peak-oil-output-government-a73558
“Nikolai Shulginov, Russian energy minister, told reporters that monthly fluctuations were not significant and Russia would reach a pre-pandemic level of oil output next May. ”
Next May is 9 -10 months away . Makes me go hmm—-mmm .
Ron,
The two comments by the Russian oil minister are contradictory, either he misspoke or was misquoted. Russian output is unlikely to be as low as 506 million tonnes in 2021, probably more like 524 million tonnes. Note that a 30 kb/d drop is pretty small, essentially statistical noise. Forecasts are often wrong, so no surprise.
Dennis, I did the math. He said:
“Russia plans to pump a total of 506 million tonnes of oil only this year, he said, a 1% decline from 2020.”
As I said, I did the math. 506 million tons is 1% below 2020 production. Do you think he misspoke twice or was misquoted twice?
Yes, a 30 kb/d decline is not very much. But it was 150 kb/d below what the EIA predicted. That is significant. And their production has been basically flat for five months when OPEC+ production was supposed to be increasing. That is very significant.
Also, the link posted by Jean-Francois Fleury is very significant:
Russia May Have Passed Peak Oil Output – Government Russia’s oil production is unlikely to recover to pre-coronavirus levels, according to a government strategy document cited by Kommersant.
Dennis, I think you fail to see what is really happening in Russia. Either that or you are simply in denial. Russia’s five very old supergiant fields, historically responsible for 60 to 70 % of Russian oil production, are in steep decline. They hope that new Eastern Siberian and Arctic oil production will replace that decline. It will help but come far short of making up for the steep decline in their old supergiant fields.
Ron Russian energy minister also said output would increase to pre-pandemic level by May 2022.
Perhaps that was the misquote, I was not there to hear what he said. My point was the comment saying output will decrease for the rest of 2021 seems inconsistent with output returning to pre-pandemic level 5 months later. I do not know what future output in Russia will be. My guess is they will return to about 11000 kb/d by June 2022 and then maintain that level for 3 to 5 years and then decline slowly (2%/ year for first 5 years and accelerating later to 3 or 4% per year).
Oh, that was the contradiction you were speaking of. In that case, I agree with you. And that is a very absurd contradiction. However….
My guess is they will return to about 11000 kb/d by June 2022 and then maintain that level for 3 to 5 years and then decline slowly (2%/ year for first 5 years and accelerating later to 3 or 4% per year).
No, no, and no again. Their production will not return to 11,000 kb/d, it will not hold steady for 3 to 5 years, and it will not decline at a mere 2% for 5 years.
The decline has already begun. And it will be far greater than 2% per year. Oh, there will still be ups and downs. That is, there will not be a decline every month. But the trend will be down at… at least 5% per year.
Ron,
Obviously you know more than the Russian energy ministry.
I stand by my best guess, time will tell us whose best guess proves more accurate, yours or the Russian Energy ministry.
Denis news from Russia:
RF at the beginning of September increased the average daily production of oil with condensate by 2.3%
08 September / 06:56
Moscow. The average daily production of oil with condensate in Russia in the first days of September is 1,455.3 thousand tons / day, which is 32.9 thousand tons more than in August (2.3% more). This is evidenced by statistics.
In August, condensate production in Russia was greatly reduced, as the Sakhalin-2 liquefied natural gas (LNG) plant, as well as one of the lines of the Yamal LNG plant, did not work for almost the entire month. In addition, on August 5, a fire broke out at the Surgut condensate stabilization plant of Gazprom.
In the first days of September, oil companies increased production of oil with condensate by 0.9% – up to 1,161 thousand tons / day, Interfax reports.
Thus, Rosneft increased production of oil with condensate by 0.1% versus August, LUKOIL – by 1%, Surgutneftegaz – by 0.9%, Tatneft – by 0.5%, Slavneft – by 3%, Gazprom Neft – by 0.1%, Bashneft – by 13.2%, Russneft – by 1.3%.
Among oil companies, production at NOC fell by 0.9%, to 104.1 thousand tons / day. A decrease was recorded in the subsidiary structure NNK-Nizhnevartovskoe oil and gas production enterprise – by 1.5%, NNK-Saratovneftegazdobycha – by 2.7%, Gusikhinskoe – by 2.1%, NNK-Pechoraneft – by 1 , 2%, NNK Severo-Varyoganskoe – by 0.8%, Tatnefteotdacha and Varyoganneftegaz – by 0.5%.
NOVATEK increased production by 4.5%. Other subsoil users, where Gazprom, which produces condensate, is also taken into account, increased production by 10.7% (by 22.2 thousand tons / day) – up to 230.2 thousand tons.
The PSA operators reduced the production of oil with condensate (by 1.6%): the production of Sakhalin-2 (operator Sakhalin Energy) fell by 11.4% – to 7.5 thousand tons / day, Sakhalin-1 (operator ExxonMobil) – by 0.8%, to 30.6 thousand tons / day.
In the very first days of September, everyone ramped up an average of 2.3%? That’s 237,000 barrels per day in just a couple of days. All they had to do was open the taps a little wider? Why didn’t they do that in August?
Well, if they can do that they sure as hell aren’t going to get those tax breaks now?
I have no idea how this is happening. This is partly due to the commissioning of capacity at the Surgut condensate stabilization plant of OJSC Gazprom.
Almost half of the oil produced in Russia has benefits for the mineral extraction tax (MET),
There are places where tax breaks (Mineral Tax Exemption) are important and apply:
– The Yamal LNG plant still has it, this tax was canceled for a long time (such a condition was at the beginning of its construction).
-Lukoil enterprises in the Khanty-Mansiysk District, where viscous oil is produced. After the government refuses to extend the privilege, Lukoil is holding a tender for the conservation of production capacities.
-Enterprises in Tatarstan, which produce viscous oil.
-Another number of companies with similar capacities.
I’m not ready now to talk in detail about the tax on oil production. There, except for the Mineral Extraction Tax (MET) (If the standard profit tax is 20% of profit before tax. For example, MET payments accounted for about 27.4% of Rosneft’s revenue or 347.9% of net profit for the entire 2018. For Tatneft, the share of MET in revenue at the end of 2018 amounted to 31% of revenue or 134.3% of net profit.) There is also an Export duty. According to the calculations of the Ministry of Finance of Russia, the export duty on oil in the Russian Federation from September 1, 2021 amounted to $ 64.6 per ton.
Your assumption about the peak production in the Russian Federation is close to the truth. But I think the decline will not be sharp and the plateau will probably last for another 2-3 years. Hopes for this are associated with Vostok-oil, production on the shelf of the Caspian Sea and in Eastern Siberia. In addition, trying to start production in the arctic basin, but this is a matter for the distant future …
Construction of the North Pole ice-resistant self-propelled platform is 85% complete
08 September / 12:06
Moscow. The construction of the North Pole ice-resistant self-propelled platform is 85% complete. The unique research vessel is being built at the Admiralty Shipyards in St. Petersburg.
“In all respects, the platform has no analogues in the world. The North Pole will open a new page in the research of the Russian Arctic and in international cooperation in the study of northern latitudes. Such a floating observatory will allow monitoring most of the Arctic basin, and timely obtaining reliable scientific data on natural processes. in the northern polar regions of the Earth, “said Alexander Kozlov, Minister of Natural Resources and Ecology of Russia.
The platform is a self-propelled displacement steel vessel. At the same time, the strength of the hull along the sides and bottom will withstand the compression of perennial ice. In total, the duration of the platform drift in terms of fuel reserves can be up to two years when restocking. It is assumed that the personnel will work on a rotational basis. The platform has a helipad for receiving Mi-38 helicopters.
The decision to build the ship was made in 2017 by the government of the Russian Federation, the department clarified.
We add that the North Pole is a whole scientific complex for carrying out various types of research and observation. There are 16 scientific laboratories on board with built-in modern equipment. For work on the ice, a mobile field ice camp is provided, as well as various transport equipment.
Along with the traditional complex of studies, the creation of an ice-resistant self-propelled platform will expand the range of studies and observations in the field of ionospheric observations, geological, chemical and environmental studies, acoustic tomography, studies of ice loads and ice breakdown mechanics, studies of the boundary layer and free atmosphere in the central Arctic, magnetic and gravity research.
Thanks Alex, your post makes perfect sense. I have never met a person who knows more about their countries oil production than you.
Alex , second Ron . You always come out with nuggets that we would never find .
Russia says that they have enough oil reserves to last 59 years – 19 years at current level of technology. gas reserves enough for 103 years.
Interview with head of ministry of natural resources (held in May 2021) published here:
https://www.rbc.ru/business/11/05/2021/609971fe9a7947e065f63cd4?from=from_main_1
In Russian, but easily translated to English in Chrome.
“He recalled that there was not a single year when Rosnedra had not been informed that the increase in oil and gas reserves was greater than the volume of production.”
So, reserve replacement is running at < 1 for a while now.
That Russia is investing heavily in its Arctic fields is enough to tell me that they are seeing and expecting significant declines from the resources (mostly in Western Siberia) they have been exploiting in the last few decades.
Dennis, I have posted this link before but it is worth posting again:
Alex Burgansky: Russian Oil and Gas Industry Surprises Analysts Sep. 25, 2009
There are plenty of projects in Russia, both, new projects and existing brownfield projects. Russia is a very mature producer. If you exclude all the drilling activity taking place every year, then Russian organic decline in production is close to 19%. To compensate for that organic decline, Russia drills somewhere between 5,000 and 6,000 wells every year.
And then there are two important questions. One, is there enough oil in Russia for 5,000 or 6,000 wells to penetrate? In my view, the answer is yes. As I explained, we are dealing with a very large reserve base. And the second question: is there enough money in Russia to do that, and can it be done economically? The answer to this question is not so obvious.
That was posted 12 years ago. 5,000 to 6,000 infill wells per year for 12 years, in those old supergiant fields, with a natural decline rate of 19%, have finally taken their toll. Did you really think they could continue doing that forever?
Ron,
No not forever, but certainly until 2019 as history shows. For the future of Russian output I assume thr Russian energy minister knows more than me about potential future Russian output.
Dennis, I would not dare question what the Russian Minister of Energy really knows. But I most definitely question what the Russian Minister of Energy says.
Are you implying that you would not?
Dennis, concerning the Russian Minister of Energy, I think there is a pretty good rule of thumb you can go by. Whatever he says concerning the short run, that is the near future, you can take to the bank. But the more distant future, a year or more out, he has an out when his predictions are nowhere near the mark: “But we did not get the tax breaks we were counting on.”
Remember, the Minister has been campaigning for tax breaks for the petroleum energy for a couple of years now. However, to my knowledge, no tax breaks have been forthcoming.
Ron,
May 2022 is only 10 months from now, I agree predictions further in the future are more likely to be wrong, no matter who makes those predictions.
In the mean time there seems to be mixed messages coming from the energy ministry, both are unlikely to be correct. Personally I doubt Russian output will be as low as 506 miilion tonnes in 2021. I also doubt output will reach prepandemic level in May 2022, the truth will be somewhere between these, my guess is about 11 Mbpd for Russian C+C output in May 2022.
Ron, the comment about 506 million tonnes of oil only may be output of crude oil only and not include condensate. 506 miilion tonnes for 2020 would be an average output of about 10.1 Mb/d. Just a thought, Russia was allowed 9500 kb/d of crude output in July inder OPEC plus agreement, but their crude plus condensate output was 10418 kb/d. This suggests condensate output was about 900 kb/d (roughly as the density is different than crude) in July. For an entire year this would add up to about 42 million tonnes of condensate (guessing it is 7.8 barrels per tonne for condensate). Add this tho the Energy minister’s “oil only” estimate of 506 million tonnes of crude and we get about 548 million tonnes of crude plus condensate for 2021.
Ron, the comment about 506 million tonnes of oil only may be output of crude oil only and not include condensate. 506 miilion tonnes for 2020 would be an average output of about 10.1 Mb/d.
No, for two reasons. One, only OPEC uses crude only. Every Russian estimate or stat is always C+C. And two, I told you I did the math. Do you doubt me?
506 million tons comes out to 10,162 kb/d. Their production in 2020 was 10,274 Kb/d. 1% less than that would be 10,171 kb/d. That is only a 9,000 difference. That is almost exact.
So yes, the Minister of Energy was spot on and was talking about C+C, not crude only.
Dennis, as I said, I did the math!
A second thought. When the Minister of Energy said 2021 production would be 1% less than 2020, did you really think he meant that 2021 crude only would be 1% less than 2020 C+C? Dennis, that makes no sense whatsoever.
Ron,
I don’t doubt your math. I am trying to reconcile contradictory statements by Russian Energy Ministry, the OPEC plus agreement is for crude only. It is likely that the ministry can estimate condensate output. I reallize that C plus C is what they report at the Energy ministry website.
Your assumption that “oil only” means C plus C may be incorrect, possibly oil only should have been translated as crude only.
Dennis, did you read my second reply that started with: “A second thought”? Obviously, the ministry was comparing apples to apples. When he said 2021 production would be 1% below 2020 production, he either meant C+C or crude only in both cases. So it really makes no difference.
However I know he was talking about C+C because his website:
Statistics clearly states: “Production (including gas condensate).
And if you had read the link that started this whole conversation:
Russia’s August oil, gas condensate output fell to 10.43 mln bpd you would have found this paragraph, bold mine:
Total oil and gas condensate production was 44.09 million tonnes, Interfax reported, versus 44.24 million tonnes in July. The ministry does not provide a breakdown for the production of oil and condensate, a type of light oil.
Dennis, the ministry never gives statistics in crude only, never!
Ron,
Yes I said they do not report crude only, but the quota agreements for OPEC plus are in crude only. So internally they must have estimates for crude only that are not reported.
Note that the OPEC plus quota for Russia is about 9500 kb/d of crude for July, which is about 40.34 million tonnes, output in July of C plus C was about 44.24 million tonnes for Russia. This suggests about 3.9 million tonnes of condensate output, if Russia met its quota for July. The 506 million tonne estimate for 2020 seems inconsistent with OPEC plus increasing their quota levels from August to Dec 2020. The average level of output for the first 7 months of 2021 is an annual rate of 514 million tonnes of C plus C. I am highly skeptical that Russian C plus C output for 2021 will be less than 514 million tonnes and my best guess is about 524 million tonnes of C plus C output for Russia in 2021.
Perhaps the Russia energy minister was trying to drive up oil prices by understating future output, or he misspoke or has since revised his estimate. In 2019 average Russian C C output was about 560 million tonnes, I doubt Russia gets to that level by May 2022, though much depends on oil prices, tax policy, etc.
Of course, they do. They exactly how much of each, crude and/or condensate, they produce. But you must know they don’t pay a lot of attention to their OPEC+ quota. However:
OPEC+ hikes crude output 750,000 b/d in July, slightly shy of target: Platts survey
The OPEC+ group’s largest producer Russia pumped 9.64 million b/d in July, above its 9.50 million b/d quota. Its compliance rate in July slipped to 90% from 97% the previous month.
Russia produced 10,461 kb/d of C+C in July. That means they produced 821 kb/d of condensate.
However, they report only C+C. But I am sure they report the correct crude only numbers to OPEC.
Ron,
It is likely more difficult for Russia to control output precisely as there are several companies and all may not comply with government output targets. It is not clear how compliant they have been with the qoutas as that information is not easily found.
Ron
Russia also encountered production difficulties last month. Its total oil output — consisting of crude and a light oil called condensate — fell about 0.5% to 10.43 million barrels a day after a fire at a Gazprom PJSC processing plant in West Siberia, according to data from the Energy Ministry.
Ovi, the fire was quickly extinguished but condensate production was cut off for about a week. They still produced condensate for domestic consumption but decided not to export any condensate for August. They had planned on exporting 100,000 barrels for the entire month. That works out to be about 23,000 barrels per day if that much condensate was indeed not produced. That is about three fourth the total decline for August. They would still have declined even if they had no fire. They were supposed to be up 120,000 barrels per day.
Gazprom cancels Aug condensate exports after Urengoy fire, sources say
net: exports – imports
Top steel exporters in 2018[1]
Rank Country Mt
1 China 51.4
2 Russia 31.5
3 Japan 29.8
4 South Korea 27.6
– European Union[24] 22.6
5 Germany 21.2
6 Turkey 18.5
7 India 17.1
8 Ukraine 15.2
9 Italy 14.9
10 Belgium 12.9
11 Brazil 10.6
12 France 10.2
13 Taiwan 10.0
Top steel net exporters in 2018[1] (Exports – imports)
Rank Country Mt
1 Russia 26.4
2 Japan 24.8
3 South Korea 16.1
4 Ukraine 13.9
5 China 13.5
6 India 12.1
7 Brazil 8.7
8 Turkey 6.0
9 Egypt 4.4
10 Germany 3.0
USA is a spectator as far as steel is concerned . It is not in a position to control prices . It can only apply tarriff ( which Trump did ) to save it’s own steel industry .
Shallow Sand,
Here is the most recent steel pricing we received last month.
NEW US ROD ¾ $2.12/FT
NEW US ROD 7/8 $2.55/FT
NEW 2-3/8 MW-55 4.7# $3.95/FT
NEW 2-7/8 MW-55 6.5# $4.70/FT
NEW 5-1/2 15.5# MW-55 $9.50/FT
NEW LS 8-5/8 23# $17.75/FT
We do try to keep a decent amount of tbg/rods on hand. For one thing we don’t have a lot of outside WI in our wells, and our production man is almost always on site babysittying the pulling units to make sure things go as they are supposed to. If you have to toss out 6 or 8 joints of tubing and get it on a whim from the supply shop, well, you know how costly that can get.
Kansas Oil.
Thanks.
The four joints at $6.69 per foot were from the supply store on a Saturday without seeing what we had in the yard.
But we are very low in inventory and that is our fault. We probably need to truck in a semi load and bite the bullet.
I’m no oil man, but do software in industrial enviroment.
We had once a customer who told quite a story. He has a big conveyor belt system, to supply machinery and out/ingoing trucks. He bought it from a big company, paying big, to avoid being stranded with a system from a gone company.
One day a motor burned out. No problem they thought, just have a call and emergeny order a new one.
They got told a new batch of these motors will start production in 3!!! months…
Now they have spare parts of everything in their warehouse, just because…
Other thing – got to a hardware store to buy a few shelves for a cupboard. Nearly tumbled back out when I saw the price tags. 200€ for a few boards. I’m only happy I don’t have to build something at the moment – if this continues they’ll steel old sheds…
Kansas Oil,
Are those prices fairly typical? I guess my question is, was the $2.50 per foot price quoted by shallow sand a somewhat low price for 2 3/8″ tubing by historical standards (perhaps this was the price in late 2015/early 2016 when things were pretty slow in the US oil industry)?
Thanks.
Article on tight oil today
https://oilprice.com/Energy/Crude-Oil/US-Shale-Ramps-Up-Drilling-But-Maintains-Spending-Restraint.html
Excerpt:
… the expected higher activity will not eat up more expenditure than companies have budgeted for this year, executives say. Shale producers have decreased drill times and achieved operational efficiencies. All of these allow them to do more with less investment, leaving a larger share of record cash flows to return to shareholders.
Supermajor ExxonMobil’s frack rates are now around 50 percent faster, which has led to a reduction in drilling and completion costs of more than 40 percent, Jack Williams, Senior Vice President, Overseeing Downstream and Chemical, said on the Q2 earnings call.
Diamondback Energy is decreasing the number of rigs and crews that it needs to execute the 2021 capital plan and reduced its full-year capital guidance by $100 million.
“On the production side, our wells have outperformed expectations this year,” Diamondback Energy CEO Travis Stice said on the earnings call.
“As a result, we are slightly increasing our Permian oil production guidance, which should not be taken as a conscious decision to grow,” Stice added.
The step-change in Diamondback’s drilling times is going to be permanent, CFO Kaes Van’t Hof added.
“And basically, we can do what we once had to do with 10 rigs, with eight now in the Midland Basin,” Van’t Hof noted.
Rick Muncrief, president and CEO at Devon Energy, said on the company’s call:
“We have no intention of adding incremental barrels into the market until demand side fundamentals sustainably recover and it becomes evident that OPEC+ spare oil capacity is effectively absorbed by the world markets.”
“The bottom line is we are unwavering in our commitment to lead the industry with disciplined capital allocation and higher dividends,” Muncrief added.
““On the production side, our wells have outperformed expectations this year,” Diamondback Energy CEO Travis Stice said on the earnings call. ”
Yeah , but we still loose money .
” “As a result, we are slightly increasing our Permian oil production guidance, which should not be taken as a conscious decision to grow,” Stice added. ”
We can’t grow because we can’t , but I must put lipstick on the pig .
” “The bottom line is we are unwavering in our commitment to lead the industry with disciplined capital allocation and higher dividends,” Muncrief added. ”
We are FUBAR .
World Production has been updated above.
World oil production in May increased by 485 kb/d to 75,296 kb/d according to the EIA. Of the 485 kb/d increase, the biggest contributor was Saudi Arabia, 385 kb/d. There were a number of countries that had smaller increases of less than 100 kb/d, offset by countries with similar decreases.
This chart also projects world production out to December 2022. It uses the August STEO report along with the International Energy Statistics to make the projection, red markers. It projects that world crude production in December 2022 will be close to 82,968 kb/d, little changed from the April report. This is 1,643 kb/d lower than the November 2018 peak of 84,611 kb/d.
83 mbpd in Dec 2022 . No way . What are these guys smoking ???
Hole in Head
Massive jump from May to August, a jump of 3,300 kb/d. Not clear where it all comes from.
Ovi ,doesn’t make sense . Numbers not adding up . Your post below indicates no such activity that would justify the figure of 3.3mbpd additional .
OPEC plus Russia increased output by 1200 kb/d from May to July. Norway up about 175 kb/d from May to July. That would leave 1925 kb/d, if OPEC plus increases output by 400 kb/d in August we would be 1525 kb/d short of the STEO estimate (note the estimate could be wrong if the assumptions made in making the estimate are incorrect for World C plus C, STEO gives a total liquids estimate which includes a considerable NGL and biofuels estimate). Natural gas output has been growing and NGL output would also grow, biofuels output may be higher in NH summer, though this might be offset by winter in Brazil. If OPEC plus continues to add 400 kb/d each month from Sept to Dec then we get the 3300 kb/d by Dec 2021. Declining output in some nations might be offset by increased output from Canada, Brazil, Norway, and US.
The 3300 increase by August 2021 is likely wrong, it may be more like a 1500 to 2000 kb/d increase from May 2021 to Aug 2021.
In the last post, Reuters reported the following
OPEC August oil output rises, but outages limit gain – Reuters survey
The Organization of the Petroleum Exporting Countries has pumped 26.93 million barrels per day (bpd), the survey found, up 210,000 bpd from July’s estimate. Output has risen every month since June 2020, apart from in February.
https://www.reuters.com/business/energy/opec-august-oil-output-rises-outages-limit-gain-reuters-survey-2021-08-31/?rpc=401&
This morning there is an update from Bloomberg.
OPEC Boosted Output Last Month Even as Some Members Left Behind
Bloomberg reports an extra 180 kb/d of OPEC output over the Reuters report. Summary below.
(Bloomberg) — OPEC boosted crude production last month as it continued the revival of supplies halted during the pandemic, but some members struggled to keep up.
The Organization of Petroleum Exporting Countries lifted output by 290,000 barrels a day, slightly more than stipulated by its road map for restoring output, according to a Bloomberg survey. Saudi Arabia and Iraq were the main drivers of the increase.
Despite the gains, the group is actually pumping about 10% below its overall quota as some members — notably Angola and Nigeria — suffer from deteriorating production capacity and technical disruptions.
Output from OPEC’s 13 members averaged 27.11 million barrels a day in August, according to the survey. Saudi Arabia increased by 200,000 barrels a day to 9.63 million, while Iraq ramped up by 110,000 a day to 4.08 million. Both countries were roughly in line with their new, higher targets.
The survey is based on ship-tracking data, information from officials and estimates from consultants including Rystad Energy AS and JBC Energy GmbH.
Nigeria’s production dropped again in August, by 90,000 barrels a day to a five-year low of 1.43 million a day. Royal Dutch Shell Plc has announced a disruption at the country’s key Forcados loading facility following signs of a leak.
Angola, which was able to keep output steady last month at 1.11 million barrels a day, is producing several hundred thousand barrels below its permitted amount. The country is reckoning with an exodus of foreign investment, and declines in capacity at deep-water oil fields.
In the broader OPEC coalition, Russia also encountered production difficulties last month. Its total oil output — consisting of crude and a light oil called condensate — fell about 0.5% to 10.43 million barrels a day after a fire at a Gazprom PJSC processing plant in West Siberia, according to data from the Energy Ministry.
https://www.bnnbloomberg.ca/opec-boosted-output-last-month-even-as-some-members-left-behind-1.1647168
”Russia also encountered production difficulties last month. Its total oil output – consisting of crude and light oil called condensate – fell about 0,5% to 10,43 million barrels a day…” Yes and the production will continue to decline according to the data of Energy Ministry. They are saying that in 2021 Russia will produce 506 million tons of oil. Given that they have produced on average 10,325 million oil barrel a day during the past eight months, that means they have already produced around 339 million tons of oil, leaving 167 million tons of oil to be produced untill the end of the year or 10,2 million oil barrel a day, give or take. Thus, their production will continue to decline.
Jean Francois,
If we take Russian Energy Misistry statements at face value (and also assume they do not change policy after making a statement). We would see output decline a bit by the end of 2021 and then ramp up sharply by May 2022 to reach the pre-pandemic level.
I doubt this is what we see. You guys tend to believ statements that support what you believe and discount statements that do not support your story, I guess we all do this. Supposedly Russian quota levels will increase by about 100 kb/d each month from August to December based on OPEC plus agreements. They could choose to produce less, but I do not think they will make that choice.
Good interview with Jeff Currie – Goldman’s head of commodities.
https://www.bloomberg.com/news/videos/2021-09-02/goldman-s-currie-says-jury-is-still-out-on-new-oil-equilibrium-video
Amrita Sen talking about OPEC and the demand supply situation going forward
https://www.bloomberg.com/news/videos/2021-09-02/oil-prices-should-be-higher-into-year-end-sen-video
Nice stuff Ancient archer, thanks.
Jobs numbers was awful this morning. Economy is rolling over due to inflation. Yet people believe that FED will push back any tapering of QE. And actually they probably will push it back. But that doesn’t stop inflation and the economy from rolling over. FED’s market put is going to be tested. And since FED doesn’t actually print money. Market will sell off anyway. Good luck with higher priced oil. My timeline is 12-18 months before major blow up or financial crisis.
HHH
I think the fourth wave of CV is forcing companies to delay their rehiring plans.
Yes and that is not going to go away. And that’s global. There will more variants right behind delta. And while vaccines may keep some people out of the hospital. The big picture is the vaccine hasn’t been a game changer.
HHH
I disagree. Where would we be without the vaccine. The world would be in a much worse condition.
Ovi is correct.
One example- I live in a county with a very big economy (#6 in the country- MLKing Co, WA)
It was the first big county in the US to achieve 70% vaccination rate months ago.
Businesses and roads have gone from very quiet back to very busy status.
Worse variants could set us back to square one. We would be in poor shape like those communities that have not embraced vaccination.
Ovi and Hickory,
I agree.
I also think the full approval of the Pfizer vaccine in the US will lead to more vaccine mandates from local governments and private businesses, so we may see vaccination rates increase. Hopefully a vaccine for 5 to 12 year old children will be approved by December in the US.
What is the status of vaccine approvals in Canada?
For Europeans, what is the status there? Full approval, children, etc?
Closing of economy was always a choice vaccine or no vaccine. Reality is this vaccine isn’t a sterile vaccine. And by the numbers things really aren’t that much different than when cases and deaths per day were at peak. We are just choosing to push on regardless.
And worlds economy goes into deep freeze not because of virus or vaccine. It goes into freeze because the response to the virus can’t be repeated in 2022. If you believe that governments can in someway do equal to the stimulus and spending that was done during 2020-2021 every year until end of time then things keep going. If your like me and know that doesn’t happen you know economic crisis is dead ahead
“And by the numbers things really aren’t that much different than when cases and deaths per day were at peak. We are just choosing to push on regardless.”
A massive difference is that now the people being hospitalized, and dying, are almost entirely doing so by choice. Those who have been vaccinated have lowered their risk enough to have a confidence in participating in public life. as you know- sentiment has a big impact on economic decisions and activity.
And yes- the Pfizer and Moderna and J/J vaccines are sterile.
-regarding J/J -‘The Johnson & Johnson vaccine uses what’s known as “viral vector” technology, which uses a harmless, inactivated cold virus to activate your body’s immune response to COVID-19. Because the Johnson & Johnson vaccine does not contain a live virus, you cannot get COVID-19 from the vaccine’
Factual knowledge is useful to a healthy economy
A sterile vaccine is where the virus stops with you after being vaccinated. Sterile mean you can’t transmit it to others.
None of these vaccines stop the spread of COVID. They might keep you out of the hospital but you can still spread the virus.
Ahhh… you are using the term incorrectly.
The vaccines are indeed ‘sterile’
‘Sterilizing immunity’ is what you are referring to, and it is true that like many other vaccines this one is not 100% effective.
“For example, the inactivated poliovirus vaccine does not produce sterilizing immunity and is 90 percent or more effective. A vaccine can lessen the ability of a pathogen to produce a disease response without sterilizing it. If it does sterilize against a pathogen, it can prevent infection. For example, the human papillomavirus vaccine induces sterilizing immunity.”
Nonetheless, almost everyone who is severely sick or dying with Covid-19 in the US are unvaccinated- and that is now an entirely voluntary situation. And bad for the economy.
Dennis
Pfizer, Moderna, Johnson and AZ are approved. AZ was only used early on. Second shot was recommended to be Pfizer, if first was AZ.
Also most Canadians got their second shot after 12 weeks. Apparently this gave a better antibody response than the US policy of 3 and 4 weeks for the second shot.
I have posted this earlier so just a repeat .
1. It is impossible for the FED to raise interest rates .
2. It is impossible for the FED to taper .
Both actions will crash Wall Street overnight , crash the dollar and have repcursions beyond the shores of USA . Having a reserve currency status has it’s advantages and disadvantages .The only option for Powell is to ” kick the can ” down the road and pray that the crash does not happen under his watch . The result of this inaction will be inflation , next stop stagflation and then deflation which will be for eternity . The final destination is deflation whether he acts now or delays . Last minute , the FED serves itself first , Wall street second and the rest can go to hell .
The common sense in the financial press is they can’t taper (much) when there is a recession. No way to let long duration bond interrest rate rise during a recession, making credit unaffordable.
Who will buy 10 years without the FED put? Getting paid 1% during 5% inflation? At 5% inflation bonds need at least 6% interrest (for AAA) to cover the risk. That’s an epic bond crash.
The FED has printed itself into a corner, they won’t be able to come out. In my opinion the only way out is only a currency reform – and to avoid this they can only print + pretend.
Yes, they can taper a bit, perhaps 20-30% less than now. And they should. But that’s it. When things get crashy they have to speed up again.
For the really long trend:
US interrest rate is sinking the last 40 years. And when they hit 0, they had to start QE as replacement for negative interrest rates. With a complete digital currency (no escaping) we would be at -3 – 4% interrest, with no need to QE.
https://www.bbc.com/news/business-35105299
You can see at this curve the year 2000 and 2008 crash correlates with increasing the interrest rate. So a QE taper will likely trigger a crash, followed by even lower interrest rats (even more QE …).
And they can’t afford a big crash now – in a everything bubble everything will crash, leaving a crater. Bonds, stocks, real estate, even gold and coins will crash. Banks will be annihilated.
So in a stock crash I give the FED a maximum of 2 weeks until they will QE the crash – stronger than 2020 when they stopped the corona crash.
FED did not stop the corona crash. FED stepped in shot it’s wad and markets kept falling. Until government stepped in and started bailing everything out.
FED put matters little to markets outside US treasuries. The Bank reserves that the FED creates out of thin air don’t leave the the FED. They aren’t used to keep markets bid. That is pension fund money and other retirement money that is keeping markets bid through purchases of corporate debt that CEO’s use to do buybacks.
FED can have QE at full blast and markets sell off and keep selling off I assure you.
Baker Hughes US rig count, oil rigs down 16 to 394.
lightsout,
For horizontal oil rigs the count is up by one from 368 to 369. The drop in rigs was inland water and offshore rigs, no change in land based drilling rigs. Obvious explanation is Hurricane Ida. For tight oil focused basins (Permian, Williston, Eagle Ford and Niobrara) rig count was up by 1 (Permian basin only, other basins no change).
Frac spread count was up by 4 to 240, this remains below the recent peak of 243 frac spreads for week ending July 23, 2021.
Dennis
I don’t understand your comment “No change in land based rigs”. The big drop was in Louisiana oil rigs, 17. I count all rigs, directional, horizontal and vertical.
Attached is the pivot table for Basins and States. Under “other”, there is a drop of 14, which occur in Louisiana. I assume the Louisiana fields don’t have a designation.
Ovi
They break rigs out in land,inland waters, and offshore.
All the decrease was in inland waters and offshore, land based rigs change was zero.
Louisiana has the most offshore and inland waters rigs of any state.
It was also hit hardest by Ida.
Basins
Ovi,
Rigs dropped due to hurricane.
Unsurprisingly.
Yes. It hit Louisiana and power is out.
Ovi,
I also looked at all oil rigs in US on land using pivot table, could was up for most recent week by one rig from 393 to 394.
Above “could” was a typo should be count was up by one rig …
I hesitate to use this particular author and this particular website for a source of info since the track record for straightup analysis is subpar, but nonetheless the information is worth considering-
“According to the OECD, carbon emissions, currently trading at around $60 per ton on the ETS, which is already a record high, need to rise to $147 per ton to make net-zero targets achievable. It would have been odd if commodity traders did not get in on the carbon game.
The Wall Street Journal reported this week that Shell and BP—which besides being oil supermajors, are also among the largest energy commodity traders in the world—had already built sizeable carbon-trading business divisions. Their business is currently focused on the EU, because of its well-developed carbon emissions market…”
If there is much accuracy in the article, it points to the global carbon concern as gaining significant momentum in this decade. This, along with lack of new projects with a prospect any return on investment goes a long way toward explaining the tepid oil activity of the majors in the last few years (ex BP).
https://oilprice.com/Energy/Energy-General/Could-The-Emissions-Market-Outgrow-The-Oil-Market.html
Coal prices up 80% in the last 3 months. https://www.barchart.com/futures/quotes/LQV21/overview
Natural gas in Europe up 100% in the last 3 months. https://www.theice.com/products/27996665/Dutch-TTF-Gas-Futures/data?marketId=5285052&span=1
Logic. The gas suppliers n°2 and n°3 of Europe (Norway and Algeria) are decreasing their exportations. Norway, because they are in gas production decline and Algeria because, while they are maintaining their gas production, they are supplying the increase of domestic gas consumption. Therefore, no surprise to the rise of gas price.
Shell GOM initial damage assessment from IDA
https://www.shell.com/media/news-and-media-releases/2021/shell-identifies-damage-at-wd-143-from-hurricane-ida-in-the-gulf.html#
More problems for Russian production.
https://www.upstreamonline.com/finance/surgutneftegaz-net-profit-plummets/2-1-1054458
From your link:
Surgutneftegaz reported a healthy 63% growth in revenues to 915 billion roubles ($12.2 billion) between January and June this year against 2020 on the back of stronger energy prices.
These higher energy prices helped offset a 7% decline in oil production to 1.08 million barrels per day in the reporting period.
That works out to be about 80,000 barrels per day. But more importantly a 7% decline during the reporting period??? I think that means January to June 2020 as compared to January to June 2021. In that case, it would mean a 7% annual decline rate.
Please, someone, correct me if that is incorrect.
Yes, you are reading correctly. Even if their oil production decreased of 7%, the increase of oil barrel price has been enough to compensate the potential loss of revenue due to the decline of production.
A very interesting article: Russia to add 154 million barrels of oil as Opec+ ceiling adjusted
The Kremlin says they can do it without giving tax breaks.
Kremlin optimistic on ability of Russia’s oil producers to recover output to pre-Covid-19 levels without new tax incentives and privileges
However, the oil companies call that bullshit!
However, he did not comment on repeated pronouncements from the largest producers such as Lukoil, Gazprom Neft, and Tatneft that they will require new tax concessions and other privileges as incentives to increase oil output.
Last year, the Kremlin suddenly scrapped granted tax exemptions for these companies’ major unconventional and brownfield projects in a bid to generate more revenues for the government.
Speaking earlier in July, Deputy Finance Minister Alexei Sazanov said the authorities have no immediate plans to change fiscal operating conditions for the country’s oil producers, as their financial results have already improved from 2019 and 2020.
So the Kremlin says “you can increase oil production and you are not getting any tax breaks.” The oil companies are saying “no we can’t”.
So we shall see in the next few months who is telling the truth. It’s a battle between the bureaucrats and the oil companies. I am betting on the oil companies.
Rampant corruption is a rarely reported reason for Russia’s oil production problems. The scale of the corruption in Russia mind blowing, something like a third of their GDP is stolen. A good part of that ends up in the pocket of Vladimir Putin who by some accounts is the richest person on Earth. Essentially more money for oil extraction and exploration means less money in the pockets of Putin and his friends and greed is a powerful motivator.
Ron,
Here’s a very important question I want to ask you in regards to Russian Oil Production. I have seen in many of your comments that you believe Russia will be peaking shortly in oil production.
However, when do you think they are going to start tapping into that ULTRA-DEEP ABIOTIC OIL which they have an endless supply of?
steve
Steve, you are mistaken. I do not believe Russia will be peaking shortly. Russia has already peaked. Their monthly peak was December 2018 and their yearly peak was 2019. Their December 2018 production was 11,455,000 barrels per day. That was just over one million barrels per day above their August 2021 production.
As for that abiotic oil, I think they need to drill a little deeper. 😂
Ron,
Thanks for the clarification on the “ALREADY” Russian oil peak. Will be interesting to see how this plays out in the media over the next few years as the world figures out that Russia has peaked.
But, THANK GOD for that Abiotic Oil. So, all they need to do is drill a bit deeper. That’s what I thought. Bigger rigs and more pipe should do the trick. Easy-peasy.
Who knows how much Abiotic oil is down in the creamy nugget center below Siberia.
steve
Another country that has probably already peaked is Saudi Arabia, and maybe even the USA.
Yeah, Russia, the USA, and Saudi Arabia, by far the world’s three largest producers. Russia has definitely peaked. There is a 90% chance that the USA has peaked, and at least a 60% chance that Saudi Arabia has peaked. But after saying all that, I think there is a 99% chance that the world has peaked.
Covid has probably added to the probability that the world has peaked. Many countries that cut production because of the covid demand depression, will never return to their pre-covid high. Shutting down stripper wells will often be very hard to restart. Kazakhstan is an example. They will likely never return to their pre-covid high. There are far more countries in decline now than those that can increase production. And the volume of oil production now in decline is far greater than the volume of oil still increasing.
Ron,
What about the Saudi’s? They got any ULTRA-DEEP Abiotic Oil down there in the Middle East.
steve
Abiotic oil is a fantasy of Soviet geologists. But, as the formation of so-called abiotic oil needs hydrogen, they had been very applied in finding natural hydrogen emissions on the territory of Soviet Union and as a result, they found a lot of them. By the way, the same work has not been carried out elsewhere and that could make Russia the first producer of our time and in quantity of natural hydrogen, if they are able to shift their attention from oil and methane to natural hydrogen.
Ron,
If oil prices rise to 100 per barrel in 2020$ we might see a new peak in 12 month average Russian C plus C. We will know more as oil prices rise.
Oh hell, Kazakhstan is going into decline.
KazMunayGaz suffers oil production slump
Kazakhstan company reveals grim operating results across almost all business segments
Kazakhstan’s KazMunayGaz has reported a continuing decline in output at its three key wholly owned oil-producing subsidiaries, suggesting that recovery is still far away despite the growth in international energy prices.
The state-run oil and gas holding company said its largest oil-producing unit, Ozenmunaygaz, cut output by more than 4% in the first half of this year, to about 106,000 barrels per day, compared with the same period in 2020.
Two other units — Mangistaumunaygaz and Embamunaygaz — reduced production by more than 5% and 10% respectively.
That’s very embarrassing for UE oil supply as Kazakhstan is one of the important suppliers of EU (the first being Russia) with an amount of imported oil almost equivalent to that imported from KSA and the first for France in 2019 before KSA.
On labor
The travails that Shallow Sand describes in attracting labor is a nationwide problem affecting most sectors.
The working age population of the US has peaked, and the labor participation rate has steadily declined from 67 to under 62% in the last two decades.
In normal times [with normal economic dynamics) this would be strongly inflationary, and the country would clamoring for immigrants with skill and motivation. Motivation is one attribute where immigrants typically leave homeborn citizens in the dust.
Ovi,
Great Update on U.S. Oil Production. Interestingly, in looking at the Permian Oil Production Chart from March 2021 to September 2021, it seems to resemble more of an Algorithmic increase than real production increases. I mean the monthly increases seem perfectly equal.
Any thoughts on this?
steve
Steve
Thanks. I don’t know anything about how the EIA projects Permian production. However I think you posted the answer in an earlier post. It is all about DUCs.
Looking at the more detailed projected info for the Permian for September, the decline rate is 243.6 kb/d and the production increase is 292.5 kb/d for a net increase of 49 kb/d.
Checking the projected DUC situation in the Permian, 263 wells are to be drilled and 393 completed. If there were no DUCs, then the production increase would be 263/393*292.5 = 195.7 kb/d. Without the DUCs, the projected Permian output for September would show a decline of 48 kb/d.
So I can only assume that the EIA uses their info on well completions and an average IP in the Permian to make their projections. The almost linear increase, I think, is directly related the linear decline in Permian DUCs, i.e. an average monthly rate of 125/mth.
Ovi
Thanks for your reply. What you show in regards to Permian declines and additions makes sense. However, I wonder if the EIA is taking into account the transition to Super Fracks the past year. Permian production is likely much higher per well and will likely show much steeper declines.
I really don’t know how they will continue to offset these future declines once they work through their higher-quality DUCs.
steve
Steve
I meant to include the required breakeven number of well completions that equals the decline rate. It is 327. So as the DUCs run out, they will have to drill an extra 65 wells per month to just stay even and their costs will be climbing.
Ovi,
Shaleprofile.com estimates that 286 completions per month is enough to keep Permian output rising by about 8.3 kbo/d each month. My guess is that Enno Peters does a better job of modelling this than the EIA.
One difference may be that the EIA could be asuming new well productivity decreases over time, Enno Peters makes the simplifying assumption the new well productivity is unchanged from his most recent estimate from August 2021 to June 2025.
Dennis
The 327 is just the break even number for now based on the current decline rate. As fewer wells are drilled the decline rate would also drop. Not surprised to see that the small increase number is 286.
I am sure your model would show that.
Ovi,
Correct. I know you realize this, but some people miss the fact that decline rates change depending on the completion rate. One way to think about this is that the decline rate will be higher as we decrease from 400 completions per month to 350 completions per month, but once the completion rate has stabilized at the lower level, the decline rate becomes smaller (compared to the period that the completion rate was decreasing.)
Another way to think about this is that the 327 completion rate estimate might be correct for one month, but the more interesting number is what happens at the 327 well completion rate level over a 12 or 24 month period. My model suggests that output would decrease a bit in the short term at a completion rate of 327 (by about 50 kb/d over 6 months) and then begin to rise over the longer term, rising by about 250 kb/d by late 2025. Currently the model underestimates output by about 100 kb/d compared to the EIA tight oil estimate by play.
Scenario assumes new well productivity starts to decrease in Jan 2026 (previous models assumed this decrease begins in Jan 2020).
Dennis
I see a total rise of 250 kb/d from 2025 to 2030. From 2022 to 2025 I also see a rise of 250 kb/d. The yearly rise rate in both cases is very slow. Not clear what time frame your 250 refers to.
Ovi,
The model increase is from Aug 2021(4056 kb/d) to Sept 2025 (4312 kb/d), or 256 kb/d. This is a very slow rate of increase due to the very low completion rate assumed. I doubt this is realistic, I expect the completion rate will rise to 450 to 550 new wells completed per month if Oil prices rise to at least $77/bo for WTI in 2020 $ as I expect in 2022 or 2023.
Steve,
They may choose to drill more wells as DUC inventory falls.
Supply projection for Permian basin by Enno Peters has output increasing at an average rate of 100 kb/d each year from 2021 to 2025.
See
https://public.tableau.com/shared/62KK4DZBW?:display_count=y&:origin=viz_share_link&:embed=y
Hi Steve.
I see they are at it again in Utah. Following the spectacular failure of Petroteq and the tar sands they now have a new idea. Apparently the Cane creek shale play is going to be huge!
Lightstout,
Indeed… penny stocks and manna from heaven all provide investors with RICH OPPORTUNITIES to part with their money. But, this has always been the case with STUPID INVESTORS. Nothing new here, except there are always a new group of POOR UNWORTHLY SLOBS to part with their money.
steve
A few months ago was a post regarding some oil finds in Namibia . Just picked this from Mike S blog . Someone had called the BS on the find ( don’t remember who ) , but this report confirms the fact that it was BS after all . We are going to see and hear a lot of such false and uneconomical discoveries in the future .
https://www.oilystuffblog.com/news-stuff
Offshore and Onshore Namibia oil and gas production may or may not ever amount to much.
The bigger point which had been raised earlier is supported by the uncertainty.
Investors (such as the collective pension funds of firefighters, police and health care workers) expect a return on investment.
Those sources of Capex funds are eager for good solid investments.
There are very few prospects of a return on investment in the oil sector [regardless of ESG sentiment or self-imposed restrictions on investment]
At current prices.
If we knew that oil was going to be over $100/b for a decade then there would be plenty of projects attracting capital.
Tech guy you are late , but anyway better late than never . In your post you have written “I don’t think the CCPV is going away. The vaccines are ineffective & just turning the vaxxed into super spreaders. The CCPV continues to mutate making it impossible to contain. Its now in about 40% of the deer population in the US. so its now able to jump between humans & other species. If it gets into the Livestock than there is going to be serious food problem as it would force beef & pork processing to completely shutdown. ”
I am in Europe we here have no info on the mutation from humans to animals . Please provide supporting information on your assertion . This is serious . I am following the virus but there is no such info on this mutation even in the alternate media .
Interesting. A quick search brought up this article:
https://www.popsci.com/story/health/deer-test-positive-for-coronavirus/
Covid is a generalist infection.
It infects many species. 45% of the deer tested in Wisconsin were positive.
Interesting though that COVID likely came from eating bats. So if it gets into deer and mutates for a while and then folks eat venison, do we get a new version of COVID? COVID 23?
Stephen- “Interesting though that COVID likely came from eating bats”
I don’t think that is necessarily true/accurate, Lets assume that bats were the vector of the virus to humans for the sake of discussion. It very well might have been from inhaling bat excretions, rather than eating the (poorly cooked) tissue.
That is how the hantavirus outbreak in the US four corners area in 1993 worked, and is a more common way for respiratory diseases to be spread-
https://www.cdc.gov/hantavirus/outbreaks/history.html
I’d say if Iraq and Iran could get their acts together they could be powerhouses someday as the rest of the world’s fields decline.
I looked at HKN Energy’s website. They have 7 wells in Kurdistan producing 30,600 BOPD.
No worries for Russian production. The arctic has hundreds of years of production ahead:
https://www.rt.com/business/533990-arctic-reserves-last-hundreds-years/
Not sure that RT is a scientificaly proof media…
Something that could very well weigh on oil price and actually everything is the debt ceiling battle coming soon. Reps have no reason to sign off on raising it in a timely matter. Which creates the problem. The US treasury not being able to issue more bill, notes, and bonds. Which creates a problem for the FED. They have nothing to buy if treasury isn’t able to issue more debt. And if they continue to buy anyway it creates a collateral shortage that goes acute. And all types of bad shit would happen in the dollar funding market. So FED in this scenario would have no choice but to taper. Until debt ceiling is resolved.
We are already slowing down globally. And potentially FED could be forced to tighten. But high prices for homes and rents are a huge issue hanging over markets. FED made policy error allowing prices to go too far. And we are all fixing to pay for it. We are screwed if they tighten and we are screwed if they don’t tighten.
I’d like to be in the camp that believes oil prices can go to as high as they need to be $100 or $150 whatever is needed to keep flow going. But economic reality gets in the way of that.
“Reps have no reason to sign off on raising it in a timely matter. Which creates a problem.”
What a bunch of right wing propaganda. The second sentence contradicts the first sentence above. You are trying to justify the next Republican attack on the American economy. 3H your ignorance is over whelming and destructive. Who with any common sense would intentionally destroy their credit rating? Let me help you, a dumb fuc*ing Republican out of the majority.
Also, why are you posting financial propaganda on the only oil side? I can help you with this question also, if you can handle the truth.
Man you have issues. Truth is they are very likely to draw out the raising of debt ceiling over months heading into mid-term elections and it will likely not be good for the price of oil.
Price of oil isn’t always about supply and demand.
I’m just giving insight in to what people who manage money and investments. Actually pay attention to.
Price matters to future oil production and anything that can effect price matters.
And while I’m on the subject of what going to happen around debt ceiling and the purposed spending bill. And how it is likely to have weight on the price of oil and oil production. There is a good chance the purposed $3.5 trillion dollar bill gets shot down by fellow Dems. And only a $500 billion bill gets pasted.
At which point the FED has to cut QE at $15 billion a month clip all the way to zero QE in short time. And that is very much going to matter to price of oil and everything else.
Dennis’s models depend on price to be accurate. And his rosy picture of where price is ahead aren’t reality in my opinion.
Your crap doesn’t contribute anything to Dennis models. His models account for different pricing.
Have Dennis model sub $40 oil over next decade. Then maybe we are closer to what is actually going to happen in oil production. He thinks there is a zero % chance of that happening.
The majority of people are totally disconnected on how truly bad shape the global economy currently is. We need to model what oil production looks like in a long lasting depressionary period.
HHH,
At sub $40/bo (2020 $), tight oil production looks like chart below. ERR is about 33 Gb, about 19 Gb of US tight oil have been produced through June 2021.
You are correct that my view is that there is less than a 0.01% probability the $40/bo or lower oil price scenario for all months from Sept 2021 to Dec 2050 will be correct.
I typically do not bother with such low probability scenarios.
A world scenario would depend on the supply that might be available at $40/bo, I am highly skeptical that even in a permanent depression from a financial crisis that oil prices would remain at $40/bo for a decade, perhaps $55/bo at minimum. Note that C plus C output only fell to 76685 in 2020 and that was due both to low demand and a huge supply glut as producers reacted slowly to the covid crisis. The actual level of consumption of crude plus condensate in 2020 was about 73423 kb/d during a period of very low economic activity. It is doubtful that this level of crude plus condensate could be produced profitably at $40/bo for the marginal barrel, thus $40/bo is not a realistic long term oil price even under depressed economic conditions.
Found this piece from 2018
https://ihsmarkit.com/research-analysis/valuation-scenarios-for-new-deepwater-projects-in-the-us-gulf-of-mexico.html
It suggests for deepwater offshore an expected future oil price above $60/bo is needed for FID. So we get a 6 Mb/d drop in tight oil and perhaps another 6 Mb/d drop in deepwater offshore output from 2018 level, that brings World output down to 71 Mb/d by perhaps 2028, or sooner. We might see a lot of stripper well output shut in as well at $40/bo, and probably little new investment so even onshore conventional will be declining at 5% per year, it becomes very clear that enen depression levels of consumption cannot be met at $40/bo over the next 10 years.
In 20 years under a non-depression scenario we could see oil prices fall as demand for oil falls faster than supply due to a transition in land transport. In the next 10 years the $40/bo long term oil price scenario is not happening and even a scenario with oil prices under $60/bo leaves the World short of oil and the real economy drives prices to a level where supply can meet demand.
HHH,
The scenarios assume $77/bo (WTI) in some cases. If oil prices are lower, output might be lower. Depends on demand for oil. I assume no economic shocks, I do not believe these can be predicted.
If we assume there will be a severe recession next week for every week in the future, eventually we would be correct.
Perhaps there will be problems raising the debt ceiling, when the economy tanks the finger can be pointed at the Republicans.
The biggest problem is people choosing not to be vaccinated, more mandates for vaccinations will help this problem in the US. Canada’s rate fully vaccinated is 77.4% of those 12 or older, for the US the number is 62% of those 12 or older are fully vaccinated.
For full population comparison
EU 57.8%
Canada 67.4%
US 53%
Dennis,
The contraction of GDP we experienced was because of the governments response to covid. Not because of covid. And if you look back to the Spanish Flu you’ll see that there wasn’t any real contraction of GDP during the time even though it was a much worse pandemic.
Having 100% vaccinated isn’t going to fix what is broke. If governments fail to spend, fail to put money in the hands of the consumers. Like they did with the response to covid. Economy goes into serious contraction. If covid disappeared overnight from the world. We’d still get a major economic shock without the “stimulus” being continued.
What is coming is very predictable. It’s like a drug addict going into detox right after the largest dose of drugs they ever took.
HHH,
You do recognize that the World economy is far more global today than it was in 1918? So you are comparing grains of sand with elephants (this is not even apples to oranges.)
During WW2 there was a very large stimulus in terms of spending on the military. The end of the war led to a temporary recession, followed by strong economic growth for 20 years. There is plenty of room for private economic spending which will supplement government stimulus as car manufacturers, battery manufacturers, miners for commodities needed for raw materials and manufacturers of steel, silicon and other commodities and installers of wind, solar, HVDC transmission, heat pumps, better insulated and tighter buildings, public transportation, cities designed for more walking and biking and less car travel. All of this real economic activity has a real chance of occurring, especially as those in power (both private citizens and government officials) realize the economic opportunity that exists.
The economic contraction would have still occurred even without a robust government response to the pandemic.
Part of the difference between the 1918 pandemic and covid19 was the lack of a robust response in many places and lack of medical personnel as many were engaged in the War effort. Also the War was a major vector for the spread of the H1N1 virus that caused the 1918 pandemic (which originated in Kansas).
Such a detox of the stock market and economic junkie will trigger a deflationary crash, ending the $ and €.
First a stock crash because of record high margin has to be repaid – and then the whole economy. Everyone struggling to pay back depts, and no money to get.
Oil will touch 2020 levels again, and US production will crash, too, as in 2020.
That is my prediction on a fast speed detox, both in state spending and QE.
The last time the government tried to get stingy in a crisis here was in the late 20s last century. That brought us the Nazis – and if the Nazis wouldn’t have made it, it would have been the Communists. The hardcore ones.
Yes, I’m with you – the state has to bring money. Call it as they like, green new deal, infrastructure pack – they have to spend big. And best build something somewhat useful as the great damns from the last crisis.
If the ECB indicates taper this week. Way I view that is risk off. Kneejerk reaction might be stronger Euro. But after market digest it. Market will view it as they aren’t supporting Europe like they should. Euro bearish.
Last time I checked the European Union collectively used more and imported more oil than China. Could also be viewed as bearish for oil price.
HHH,
Recent scenarios use $67/bo and $77/bo at wellhead long term (2022 to 2033) for the maximum oil price, this is consistent with many commodity analysts predictions.
See for high oil prices
https://longforecast.com/oil-price-today-forecast-2017-2018-2019-2020-2021-brent-wti
and for lower oil prices
https://primexbt.com/for-traders/oil-price-prediction-forecast/
Also
https://www.thebalance.com/oil-price-forecast-3306219
https://knoema.com/infographics/yxptpab/crude-oil-price-forecast-2021-2022-and-long-term-to-2050
https://www.mckinsey.com/industries/oil-and-gas/our-insights/global-oil-supply-and-demand-outlook-to-2040
The most pessimistic of the forecasts sees $55/bo long term.
Such forecasts underestimate both the need for higher oil prices for most OPEC producers and the lack of profits for tight oil at less than $60/bo at the wellhead (in 2020 $).
Those who predict prices are doomed to fail most of the time. While most of the countries who rely on oil prices for social programs cannot afford lower prices forever and those who drill for profit as private enterprises can’t continue to drill for marginal profits or anemic growth forever. Those who predict prices have been lulled into this magical thinking created by the shale revolution that any price above $70 per barrel will create another oil glut but it will not happen. All of the articles that are so kindly shared on this site reveal a world of oil reserve mostly in decline save and except perhaps a few like Iran and Iraq.
It will be interesting to see whether demand goes down more than supply over the next few years. In the long run $70 per barrel is not sustainable for a healthy industry but a healthy industry may not be required if the doomsday scenario for the global economy pans out.
LTO Survivor,
I agree. I think at least $80/b will be needed through 2025 and maybe $100/b from 2025 to 2030.
Prices for Brent in 2020$, WTI 3 dollars less.
Do you have a price in mind?
Assume World real economic growth from 2023 to 2030 is about 3% per year and 2021 and 2022 are 6% and 4% real economic growth annual rates for World.
I totally agree that higher prices are needed to make oil work over say next decade. I also believe that just because you need them doesn’t mean your going to get them.
HHH,
What happens to price when supply is lower than demand at the current market price?
What I am saying, and I believe LTO Survivor might be saying, is that at the oil price level you expect the market will be short of oil. You believe the World economy will see continued lack of demand due to a permanent financial crisis.
I am very skeptical that your scenario is likely.
Dennis , ” I am very skeptical that your scenario is likely ” . You are assessment is incorrect . Posted by me in the last thread .
HOLE IN HEAD
IGNORED
08/29/2021 at 12:54 pm
Ron , I have been trumpeting since long that pre covid is not coming back with a lot of push back . Where are we today ? Five continents . Arctic is ice . South America , Africa dead . Australia / New Zealand cut off . Asia , China India 1/3 rd of the world population in coma , the second wave has now hit Malaysia , Indonesia , Vietnam, Thailand with vengeance . Europe in coma kept alive by money printing . North America , US has its own problems with finance and now on top the political arena is going to get heated with the Afghanistan withdrawal . We are up the creek without a paddle . The virus mutates , the vaccine does not . We have now Alpha , Beta, Delta and Lambda variations and this will continue . Your last line is correct but with a little variation ” The world will never be the same again ” . Last minute , the virus has already heaved havoc on the economic system , too late now , only await further deterioration . “””
Dennis , the light in the tunnel is not the end of the tunnel , it is a light of the train moving towards us at full speed . Fasten up .
Hole in head,
Yes you are part of the permanent economic crisis coming any day crowd.
Perhaps some day you will be correct. I agree there are problems and they are likely to lead to a crisis, perhaps in 10 to 20 years. Often change only occurs in response to a crisis, unfortunately people will ignore obvious problems until they become acute and widespread, people dislike change and most are scientifically ignorant.
The covid pandemic is making everyone even more pessimistic than usual.
Vaccine mandates may change things, as well as better vaccine availability worldwide.
About half of India’s adult population has had one dose of covid vaccine, but I read there is a lot of hestitancy in rural areas.
Your now full of more bullshit and that bullshit just confirms your a right wing propaganda. The midterms are more than a year from now and the raising of the debt ceiling is an issue now because of past spending and “Republican tax cuts. A propagandist like yourself knows the damage to the economy and the price of oil that will be done if the Republicans hold the debt ceiling hostage. Your just lying the ground work to make that hostage taking acceptable to your right wing Nazi anarchist.
My issue is your propaganda. EV’s, politics, global warming, population growth, etc. can also effect oil demand now and in the future. With your ignorant thinking that makes all of them free game for conversation on the oily side.
Huntingtonbeach,
I support HHH in this disagreement. For several years I have held the position that peak oil is a low price problem, not a high priced problem. For me peak oil is about extraction costs rising faster than market prices. I have also said that I have great respect for Dennis’ models, but that I believed prices would tend to be lower than his guesses bringing peak oil closer. In other words, I think discussing the price of oil is relevant to this thread.
I do not always agree with HHH, but I do appreciate his perspective on the price of oil which I find remarkably refreshing. Many people make false conclusions from the so called “law of supply and demand” which is not a law, but a tautology. Many people make false assertions about the so called “free market”. Among other things, money is a value system. The most powerful way of manipulating this value system is money creation. Historically, free trade and free markets have been used to impose the value system of the dominant currency (along with debt and taxes, see David Graeber’s Debt, the First 5000 Years). HHH brings money creation into the discussion of oil prices which is clearly relevant.
Schinzy,
My view over the next 12-18 months. Is prices are likely to get hammered. Because we are on the backside of a massive expansion in government spending with likely very little spending in comparison. It’s going to be contractionary. Not what is needed for higher priced oil or higher oil production.
If money creation is a viable subject on the oily side. So are EV’s, politics, population growth, global warming, solar, wind and the “so called free” apple butter on your shoes.
Schinzy,
Nobody has made reference to the “law of supply and demand” which I agree is a tautology. Note that there are similar tautologies in money markets.
Money “creation” is not really an important factor, the created money sits in idle bank accounts and the velocity of money decreases in response, when interest rates approach zero, monetary policy has little effect on the real economy, it just holds up financial markets.
As to oil prices, and peak oil, it could be a low price phenomenon if demand for oil is lower than supply for the foreseeable future, I just find such a scenario difficult to believe.
Let’s say HHH is correct and that a severe recession is around the corner (I believe he is wrong, but also believe that it could be 50/50 which way it will go, I don’t believe charts of price movements tell us much). Even HHH is not predicting this will be permanant, perhaps there will be a recession soon or perhaps any serious recession doesn’t occur for 10 years (I am sure that there will be a serious recession in the future, when it occurs I am equally sure is unknown).
I know that you are smart enough to realize that a permanent recession in the future is not very likely. I am nearly certain (95% probability) that oil prices will increase between now and 2030 (slope of trend line of average 3 year Brent price from 2020 to 2030 will be positive in constant 2020 $). This is simply because supply of oil will be limited and costs will rise as oil depletes, the oil will be needed to keep the economy going and if price does not rise to a level where it is profitable to produce, supply will be short and price will be bid higher due to the fact that we cannot consume what is not produced (the tautology you refer to). Note that when I say prices increase, I mean real prices in a constant unit of currency (whether Euros, dollars, or any other currency one wants to choose). The money supply connection simply affects inflation rates, doing the analysis in real terms (as I always do) eliminates money supply from the analysis.
Dennis- “realize that a permanent recession in the future is not very likely”
I will differ with you on that point. A quick and profound energy supply shortfall is one way that scenario could be triggered and sustained. Of course it would be a very high price energy scenario, indefinitely.
Other triggering scenarios could be a low demand situation, but are much less predictable and perhaps less likely to occur, and less likely to be permanent- such as severe and sustained warfare, pandemic, cyber sabotage that is unfix-able, for example.
I’m not predicting these things, but would certainly not discount the possibility. This modern world/economy is much more fragile than most of us want to acknowledge.
Hickory,
My comment was to say what I thought likely rather than what is possible.
A large asteroid could strike the planet, we could have a large scale nuclear war, other stuff could happen that I have not thought of, etc. All are possible, none are likely in my view.
A permanent shortage of energy? Very low probability.
The world economy is much less fragile than many who comment here believe, especially in the absence of large shocks (such as a very large asteroid strike or WW3).
@Dennis
What I know from companies they are working much on resilience now. The chaos the corona lockdowns brought to the international supply chains is still not solved (chip shortage…). But companies are starting to react – no more single source suppliers, doing some stuff in the own companies – and suppliers distributet over several countries.
This will pay out on the long run – less dependency and less damage from a single region event knocking out one country.
Schinzy,
Can you tell us what your expectation is for the price of oil from now to 2030?
My oil price expectation in chart below, with medium or higher prices more likely, prices are Brent in 2020 US$ per barrel.
HB
As a fiduciary I don’t really have to like or care or agree with what happens in Washington. My job is to figure out how to make money regardless of the situation. Regardless of what the demographics are. Regardless of which way markets and prices are headed.
So you can label me as you wish I don’t care. I have really thick skin.
I don’t care if you like me or not or agree or disagree with what I say.
Only agenda I have is to get a better understanding of how peak oil will play out. I enjoy reading peoples blogs. Because just because i don’t agree 100% or 0% With someone else’s views don’t mean I can’t learn or take something away from the interaction.
A fiduciary is to be a person of trust. But your a liar and spew ignorance.
“Only agenda I have is to get a better understanding of how peak oil will play out”
Republicans holding the economy hostage has nothing to do with peak oil. In fact your original 8:59am post had nothing to do with peak oil. Just like all your other posts that display financial ignoance. Your comments belong on the non oily side. Better yet, they belong over at Tverberg’s lying fiduciary outhouse.
Besides thick skin. A hard head.
I also enjoy HHH’s comments, although I often don’t agree with them. I think your off base here HB with your propaganda assertion.
Dennis, don’t overestimate me. I can be very thick.
Here is a link to an article by Michel Lepetit (president of The Shift Project) which directly links oil and in particular LTO production to Fed policy:
https://www.linkedin.com/pulse/monetary-policy-carbon-neutral-michel-lepetit/?trackingId=X6ElSOSuQi+7+RRvpLD3cg==
The author contends that without unconventional Fed policy we would not have had as much unconventional oil. Peak oil would have occurred before 2015.
I agree with HHH in that Fed, and indeed worldwide central bank policy has backed itself into a corner. My suspicion is that there are many so called “zombie companies” that aren’t really profitable but survive because they have an infinite line of credit. If the Fed tightens, these companies go bankrupt, the stock market crashes, and oil prices fall. If the Fed does not tighten, we continue to have wild distortions in prices which will eventually cause shortages and inflation. I do not have as precise a time table as HHH. I was also expecting a crash, but I thought the crash would be preceded by a kick in oil prices of say 50% in 6 months.
Schinzy,
There is no doubt some linkage between financial markets and the real economy.
A stock market crash could indeed affect the real economy if it is severe (like 1929), but we know a bit more about how to deal with these problems from Keynes’s General Theory than was understood in 1929. Central Banks have less power than many realize.
Money is created through bank lending, if nobody wants to lend or borrow even at zero nominal rates (or negative real rates), then central banks have little influence on the economy.
Investors who are smart look for a good return on their investment, and investors will only be stupid for a limited period of time. Investors have lost patience with cash burning tight oil companies and many of them are now capital starved, this brings down completion rates and the growth of oil supply from tight oil.
If oil prices fall to under $60/bo as some here believe, the completion rate in tight oil plays may fall to zero. Tight oil output would fall sharply as a result and the oil market would be short on oil, this tends to push oil prices higher.
The idea that high oil prices would lead to a recession might occur at over $120/bo, but my guess is that oil supply will be adequate at that high a price due to lower demand (from demand destruction) and higher supply (as more capital will be employed in the oil industry at that price).
To create limitless amounts of money central banks need the state. And normally, the states cooperates.
I’d say classical left government then start dishing out social goodies – free health service, unemployment money, even unconditional base income.
Conservative governments like to push infrastructure, military and things like a border wall.
Both approach make the same – the first round of money lands in the pockets of a lot of people. Later it concentrates at the owners of business. Then the next round of goodies is needed.
In traditional times these goodies have been limited by tax income limits – but since 2007 state debt can grow infinite – with 0 interrest rates and central banks buying all these bonds.
So they can lower taxes and increase spending, like Trump. This is all central bank magic.
It’s another kind of socialism – central planned economy. Only without a 5 year plan, but the state providing the fields how much where is invested, or who gets a handout.
Every industry has to bow to that – the oil industry is now on the unwanted side, it is not liked for the green agenda. I think even in the USA it is on the way to 0 .
What shale described is the key – no young people want to enter this industry. Universities reduce proffesorships in oil technology.
We had this here in the 80s with nuclear industry. Even when Germany wanted an atomic plant, it isn’t able to build one and would have to buy one from somewhere. And even import the engineers to run it.
Dennis , ” Nothing happened for 70 years and then 70 years happened in 70 days ” ” Nothing happened in 20 years and then 20 years happened in 20 days ” . Learn some lessons from the collapse of the Soviet Union and the collapse in Afghanistan . I have oft said ” Just because it is not happening to you ,doesn’t mean it’s not happening ” . Collapse is not the sun which will rise in the East and set in the West . It will be patchy , a bit here and a bit there . The cookie crumbles at the edges . That is what is happening , you and me are at the centre so we are not effected ( at least for the moment ) . Your info on vaccinations in India is 100% incorrect . Your post is ” perhaps and ” may ” . No substance .
What Are Biden’s Real Priorities For U.S. Oil?
Americans are paying the most expensive Labor Day weekend gasoline prices since 2014 amid constrained stock levels and high benchmark crude oil prices. The end of the U.S. driving season comes just a few days after OPEC+ ignored the Biden Administration’s call for higher-than-planned increases in the alliance’s oil production in order to ease high gasoline prices and continue supporting the economic recovery.
Short term Priority- help keep fuel affordable and supply stable
Longer term Priority- help accelerate the weaning of the country from heavy oil dependency before depletion kicks in
Regarding the Longer term Priority– this country is probably a decade or two too late for that attempt to be successful in a timely manner and at scale considering the lack of the American population understanding on oil depletion and the resultant lack of a strong unified effort/purpose. In fact many people are outright hostile to attempts at adjusting the countries oil addiction.
nothing too mysterious or puzzling here.
In Europe, we are ”lucky”’ on this point : we are facing a decline of supply since a long time (since the beginning of the demise of North Sea oil field in 2000). That’s forcing us and politicians to adopt less oil consumming behaviors. Even if most of the people are not aware of what is happening.
I think US stock market correction lower is imminent. Imminent as in this week. RSI (relative strength index) is showing negative divergence with price on the Dow Weekly chart. Price is also only about 200 points from breaking trendline support.
Just something to watch unfold. Oil price will react to a pullback in stocks. Only question would be is this just a pullback to be bought or the beginning of a larger correction down.
Debt monetization
shorturl.at/arxyL
For all of 2020, Fed QE absorbed about 60 percent of issuance………..
France’s Total signs mega oil and gas deals with Iraq
French energy giant Total signed mega contracts with Iraq worth $27bn to develop oil fields, natural gas and a crucial water project that officials said Monday will be key for the oil-rich country to maintain crude output.
Total signed contracts with the ministry to develop the Ratawi oil field in southern Iraq, a gas processing hub to capture natural gas from five southern oil fields, and a much-needed project to treat Gulf seawater and inject it into reservoirs to maintain oil production levels.
But industry officials and technocrats inside the Oil Ministry said far more urgent for the wellbeing of Iraq’s oil industry was the seawater development component of the package of deals.
Oil is Iraq’s main industry and accounts for 90 percent of state revenues. To keep current production rates and meet future targets, water is reinjected into the field to maintain well pressure.
The Total deal also comes as other oil companies plan their exit from Iraq. Exxon announced this year it would be selling its shares from West Qurna 1 oil field. The oil minister has also said that British Petroleum will spin off development of the Rumaila oil field, the country’s largest.
XOM and BP moving out and Total moving in.
Interesting that they need water for EOR. Is water limiting their output at this time or is it needed to expand new projects?
https://www.aljazeera.com/economy/2021/9/6/frances-total-signs-mega-oil-and-gas-deals-with-iraq
Obviously, there are mature fields in Irak and Total seems to have the expertise to manage this as others. The Iraki officials want to profit, them and the rest of the country, of every oil drop apparently.
The Non-OPEC post should appear within the next 24 hours
The natural gas price in Europe is now at US$17.50 per mcf – equivalent to US$100 per barrel:
More than a week after Hurricane Ida passed through the gulf, 1.44-million barrels of daily supply remains shut in by gulf producers, 79% of the region’s total, according to the Bureau of Safety and Environmental Enforcement. The lost output is likely to continuing winnowing U.S. oil inventories in coming weeks, even as oil demand enters a post-Labor Day shoulder season.
“Because of this outage on the supply side, the global oil market is likely to be more undersupplied in the short term than previously anticipated. According to OPEC, the supply deficit in the third quarter will amount to somewhat more than 1 million barrels per day, while the IEA assumes a figure of just under half a million barrels per day,” Commerzbank analyst Carsten Fritsch said in a note.
The production shortfall will likely impact inventory reports coming later today from the American Petroleum Institute and on Thursday morning from the Energy Information Administration. Analysts, on average, are expecting stocks to fall by six-million barrels, according to a Bloomberg survey.
Water , water everywhere but what to do with it . WOR post on MIke S blog .
https://www.oilystuffblog.com/single-post/oceans-of-permian-water?postId=46f700e8-6316-4ae7-89e0-4b1db5df1d8d
HOLE,
Amazing how insane the entire Fracking Industry has become. I still am sticking with my Forecast for U.S. Shale Oil Production to collapse by 75% from 2019-2030.
steve
Steve , I disagree . My timespan is much shorter . You are being generous . :-0
HOLE,
Maybe so. But, what’s a few MBD between Friends anyhow? Regardless, if we do get a 75% collapse in Shale Oil Production by 2030, that’s down to approximately 2.1 mbd from a peak of 8.5 mbd.
That would be the DEATHKNELL of the U.S. Economy.
steve
A new thread for May Non-OPEC production has been posted.
https://peakoilbarrel.com/may-non-opec-oil-production-up-slightly/
A new Open thread non-petroleum has been posted.
https://peakoilbarrel.com/open-thread-non-petroleum-september-8-2021/