US August Oil Production at Record High

By Ovi

All of the Crude plus Condensate (C + C) production data for the US state charts comes from the EIAʼs Petroleum Supply monthly PSM which provides updated information up to August 2023.
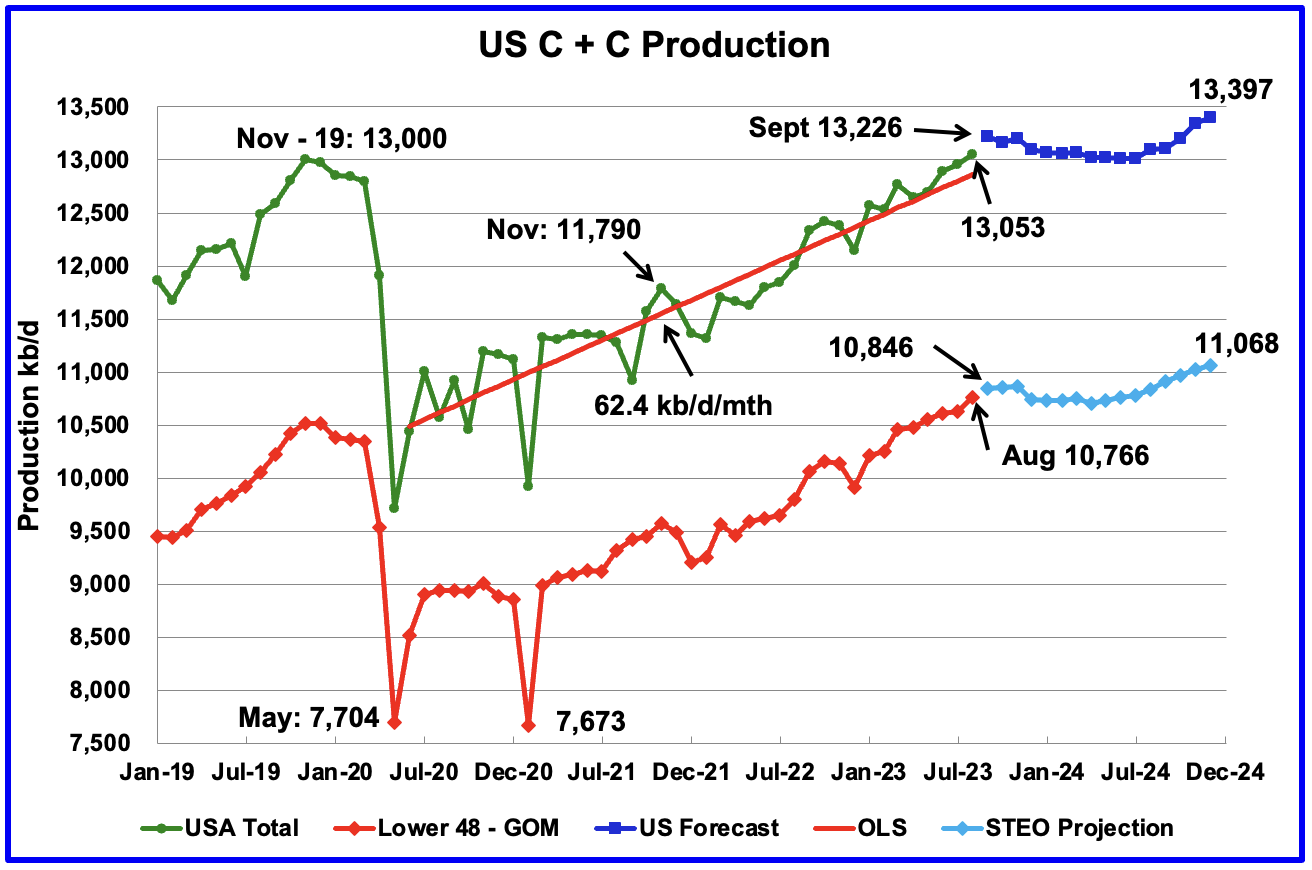
U.S. August oil production increased by 94 kb/d to 13,053kb/d, a new record high by 53 kb/d over November 2019. The increase was primarily due to increases in Texas, New Mexico and North Dakota. Note that July production was revised down from 12,991 kb/d to 12,959 kb/d, which accounts for 32 kb/d of the 94 kb/d August increase.

Read More
US July Oil Production Rises on Texas & GOM Jump

By Ovi

All of the Crude plus Condensate (C + C) production data for the US state charts comes from the EIAʼs Petroleum Supply monthly PSM which provides updated information up to July 2023.

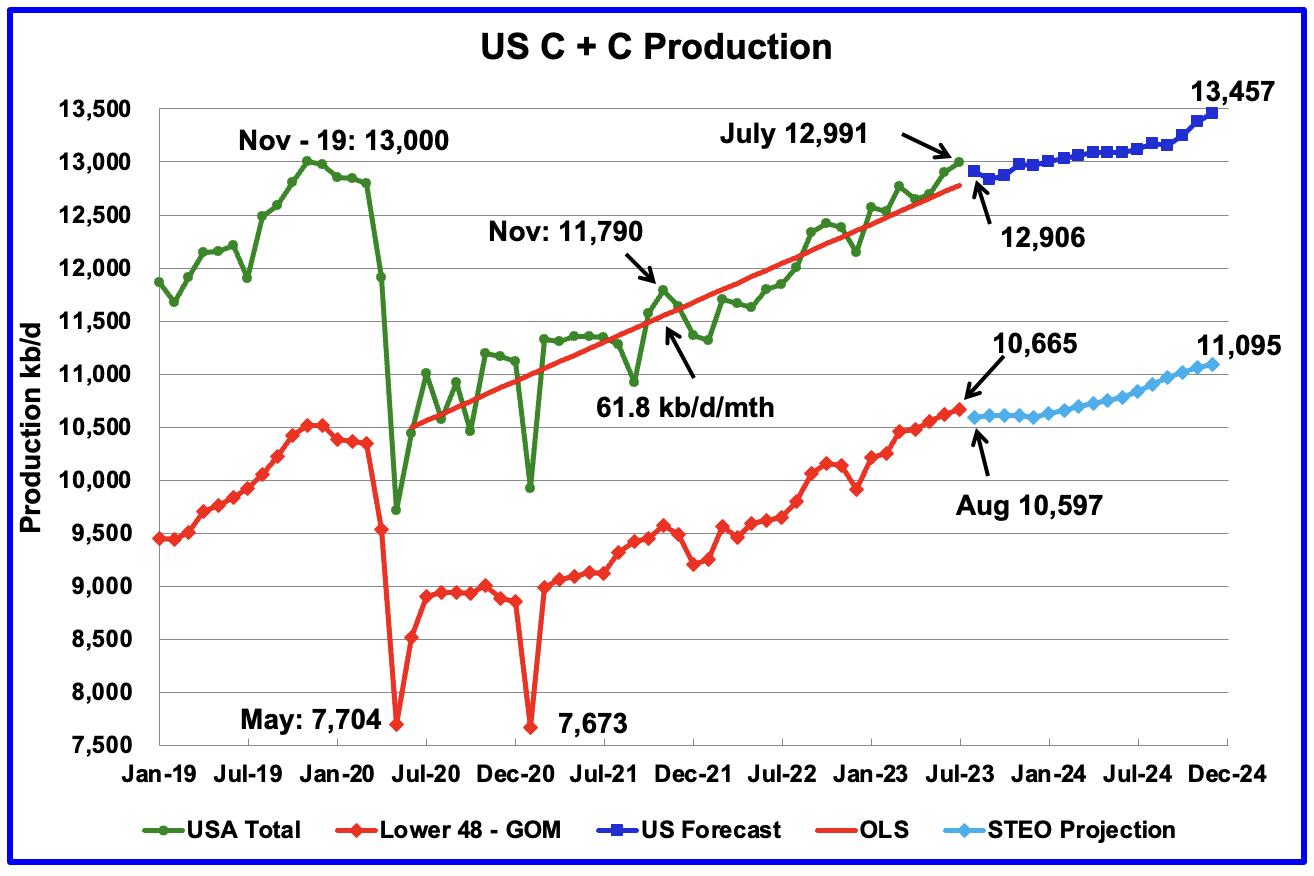
U.S. July oil production increased by 91 kb/d to 12,991 kb/d. The large increase was primarily due to a 73 kb/d increase in the GOM and a 72 kb/d increase in Texas.

The dark blue graph, taken from the September 2023 STEO, is the forecast for U.S. oil production from August 2023 to December 2024. Output for December 2024 is expected to be 13,457 kb/d which is 457 kb/d higher than the November 2019 peak of 13,000 kb/d.

Read More

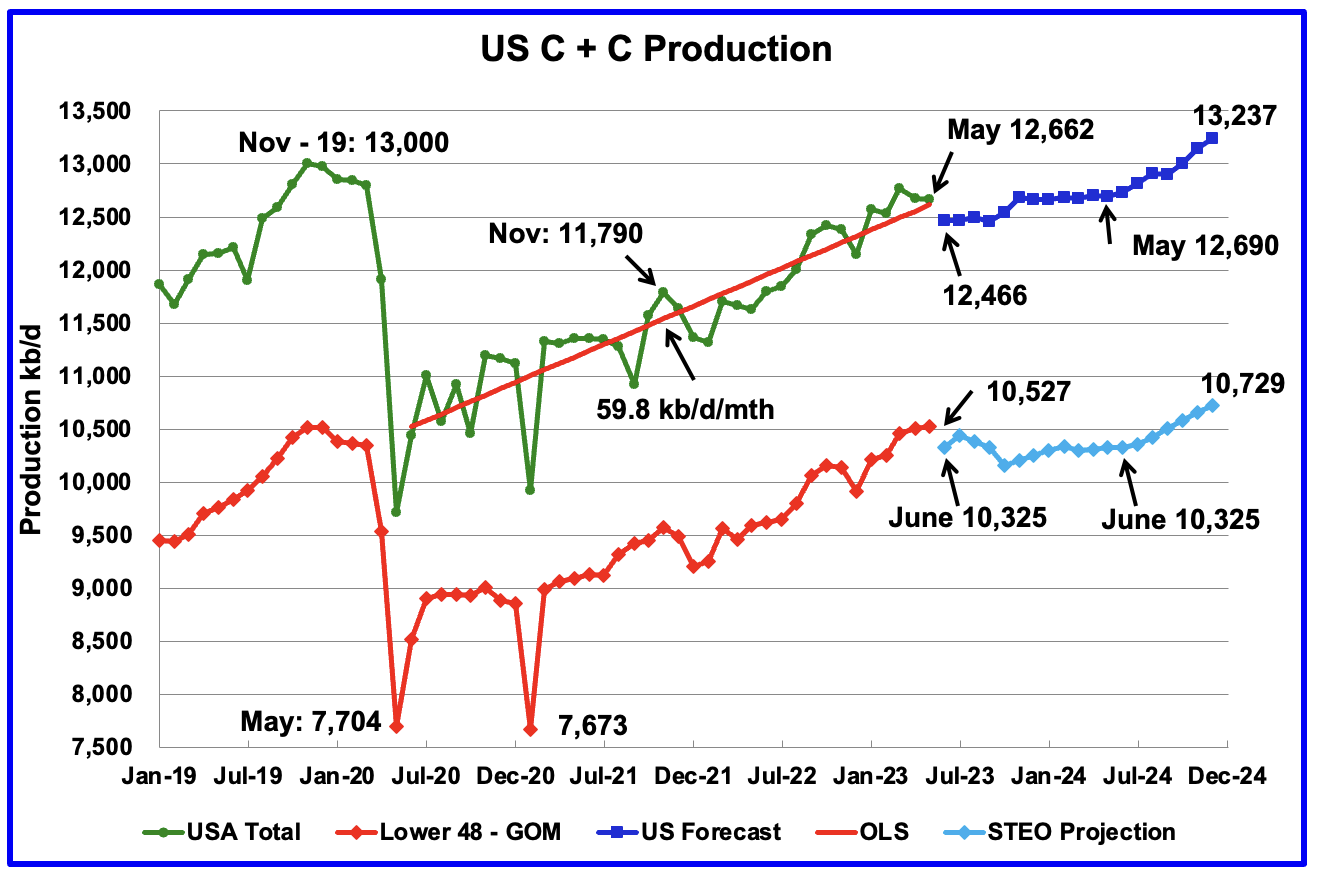
US May Oil Production Little Changed

By Ovi

All of the Crude plus Condensate (C + C) production data for the US state charts comes from the EIAʼs Petroleum Supply monthly PSM which provides updated information up to May 2023.

U.S. May oil production decreased by 15 kb/d to 12,662 kb/d, an atypical small change. The small change is primarily due to the upward revision of April output from 12,615 kb/d to 12,677 kb/d, an increase of 62 kb/d.

Read More

STEO and Tight Oil Update, July 2023

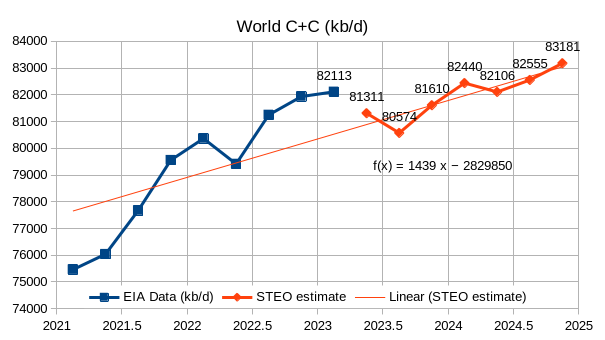
The EIA’s Short Term Energy Outlook (STEO) was published in early July. The chart below estimates World C+C by using the STEO forecast combined with past data from the EIA on World Output.

This month we have actual EIA data for 2023Q1 which increases the annual rate of increase for the forecast period compared to last month by 600 kb/d, part of the reason is an 800 kb/d forecasted drop in output from Q1 to Q2 of 2023. If we use the 2023Q1 to 2024Q4 trend the annual rate of increase is 911 kb/d, about a 100 kb/d increase from last month’s estimate. The trend from 2022Q1 to 2024Q4 is similar at about 916 kb/d. If this forecast through 2024Q4 is roughly correct, I expect increases in output after 2024 will be considerably lower, I also think this STEO forecast is optimistic. Annual average output in 2022 was 80.74 Mb/d and increases to 81.4 Mb/d in 2023 and to 82.6 Mb/d in 2024. These annual averages are 0.25 Mb/d less in 2023 and similar for 2024 as last month’s estimates.

Read More

March 2023 Non-OPEC Oil Production Drops

A post by Ovi

Below are a number of Crude plus Condensate (C + C) production charts, usually shortened to “oil”, for Non-OPEC countries. Normally the charts are created from data provided by the EIA’s International Energy Statistics in the first week of the month. Unfortunately the EIA was not able to update the production information for March until today. Consequently the charts below are produced from a mixture of country specific sites such as Brazil, Norway and China and the July STEO and the International report. The International report was used to update the March production data.

Where STEO data was used, the ratio of C + C to All Liquids was calculated. The average from the last six months was used to project the March production numbers and extended to May in a few cases.

World oil production charts are found at the end of this post.

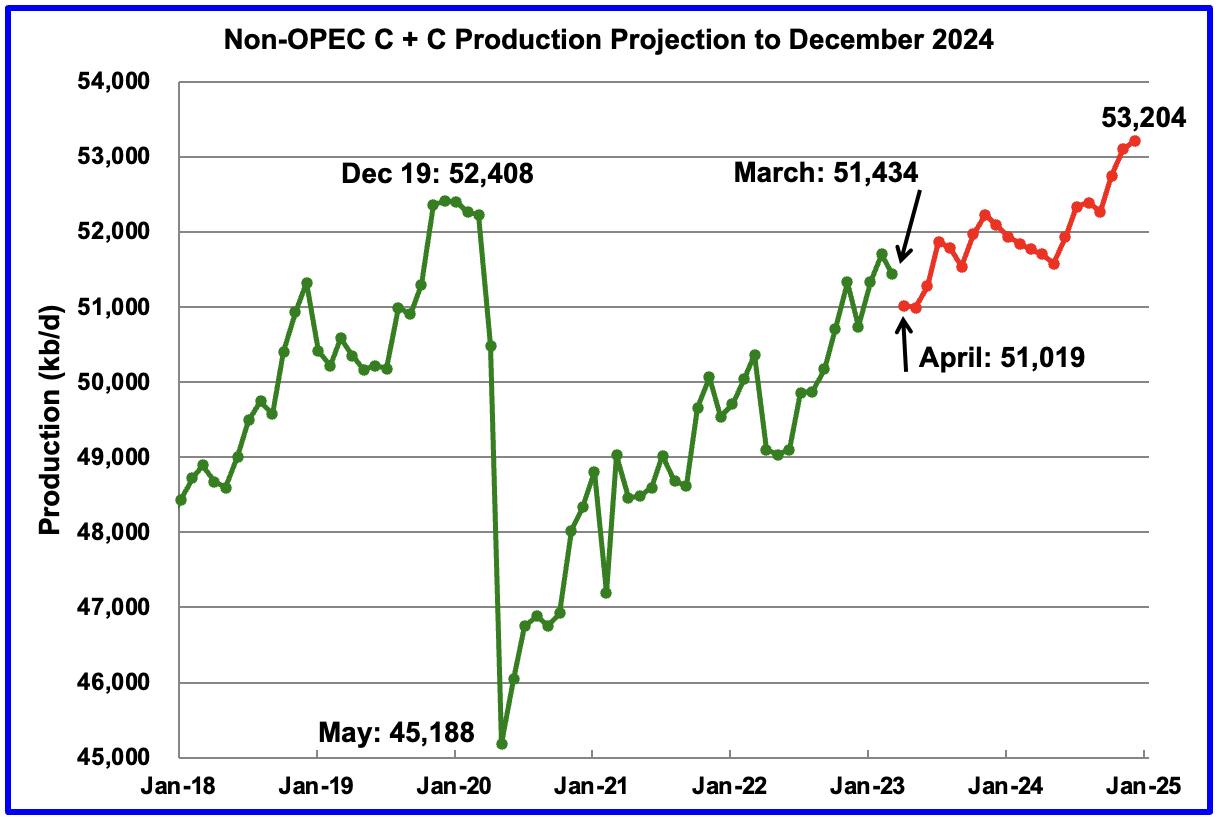
March Non-OPEC oil production dropped by 268 kb/d to 51,434 kb/d. The largest decreases came from the Russia, 300 kb/d and Brazil 146 kb/d.

Read More