Baker Hughes has published its International Rig Count with production numbers for October. This is a monthly rig count and breaks out the international rigs by oil, gas and miscellaneous. Baker Hughes does not include the Former Soviet Union countries in their count or totals. Baker Hughes also includes the US and Canada in their monthly count but they do not break US and Canada monthly totals out by oil and gas.
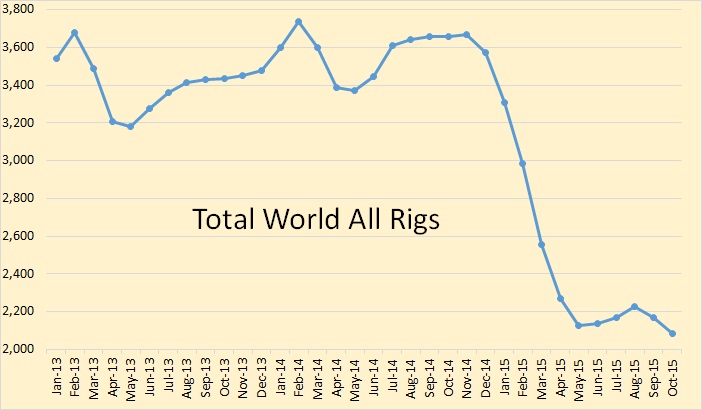
All rigs were down 85 rigs in October to 2,086 rigs. October 14 to October 15 total world rigs were down 1,571 rigs of 43%.
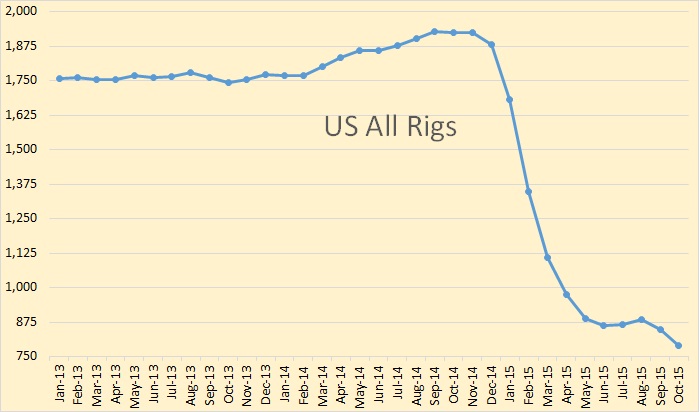
US total rigs were down 57 rigs in October to 791. October 14 to October 15 US rigs were down 1,134 rigs or 59%.
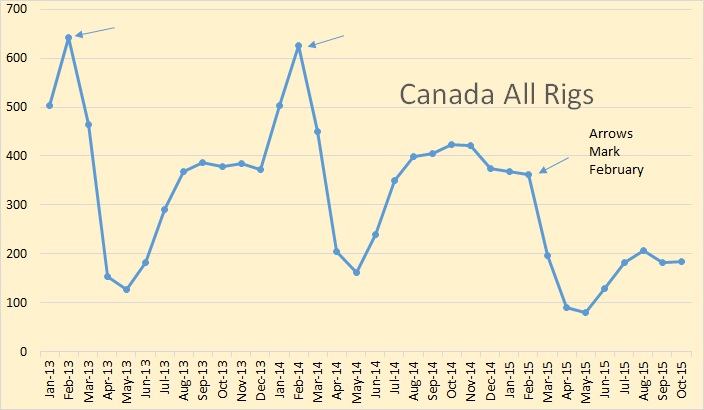
Canada was up one rig in October to 194. October 14 to October 15 Canada is down 240 rigs or 56.6%. For several years now Canadian rigs have peaked in February. This year it was different however.
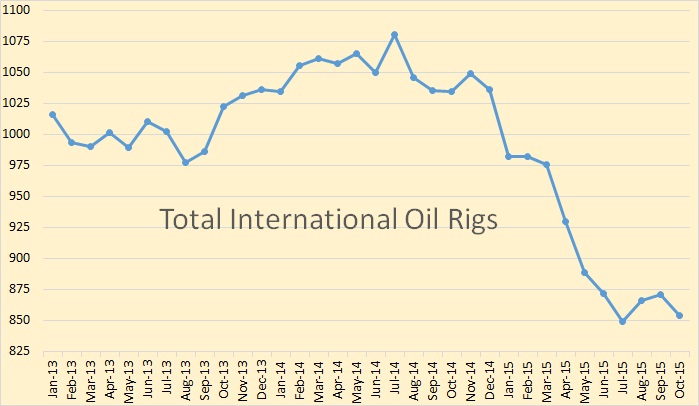
Total international oil rigs were down 17 rigs in October t 854. October 2014 to October 2015 total international oil rigs were down 180 rigs or 17.41% but have dropped 21% since last July. Keep in mind this does not include Russia or any of the other FSU countries.
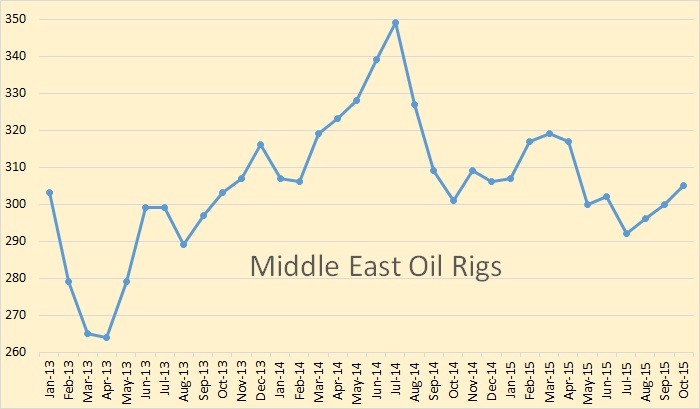
The Middle East rig count has been up three months in a row. They were up 5 rigs to 305. October 2014 to October 2015 they were up only 4 rigs however.
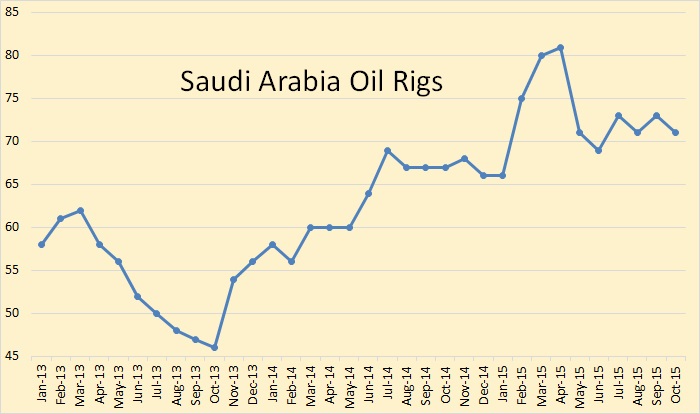
Saudi Arabian oil rigs peaked in April at 81. Saudi gas rigs stand at 54 giving them a total of 135 rigs in the country.
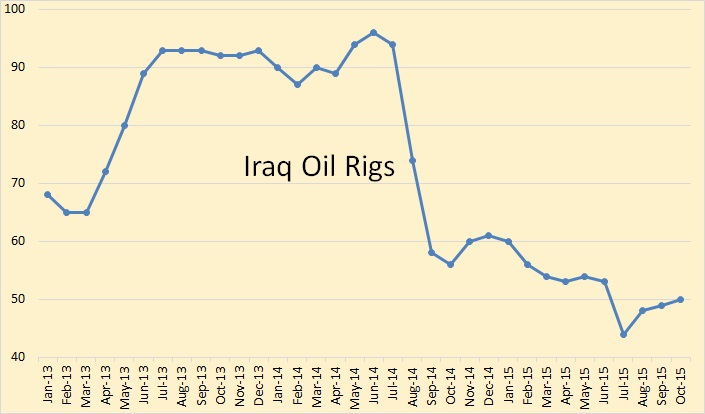
Iraq is one place in the Middle East where the rig count is falling. This is likely due to the ISIS insurgence there.
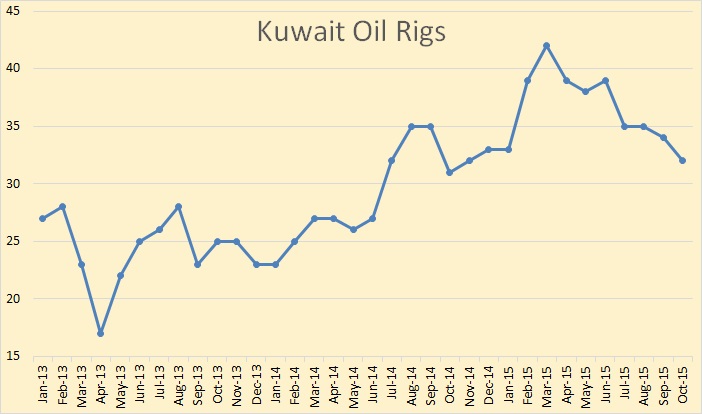
Kuwaiti rigs peaked in March 2015 at 42 and have since dropped by 10 to 32.
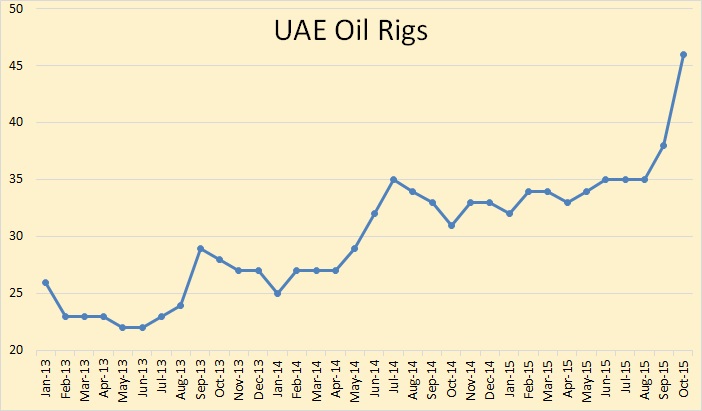
The UAE has doubled its rig count since 2013.
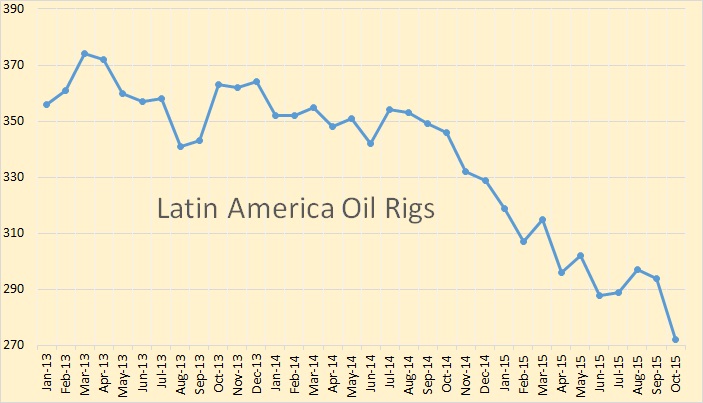
Latin America lost 22 rigs in October. That took them to 272. October 2014 to October 2015 they have lost 74 rigs or 21.39%.
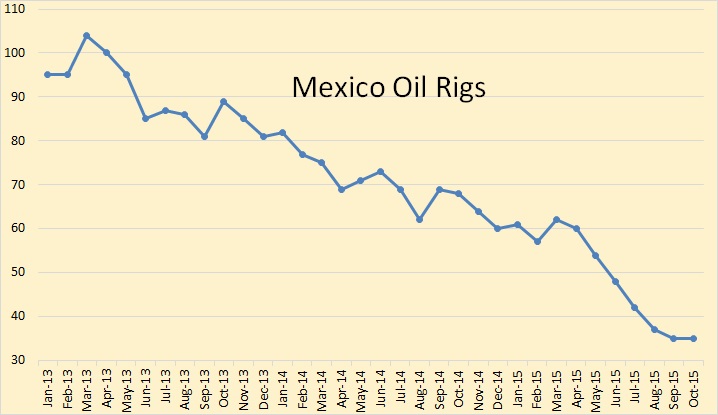
Baker Hughes uses “Latin America” instead of South and Central America. And of course Mexico part of Latin America. Mexico’s oil rigs started declining long before the price collapse. They hit 104 oil rigs in March of 2013 but are now at about one third that amount. They have had 35 oil rigs working for the last two months.
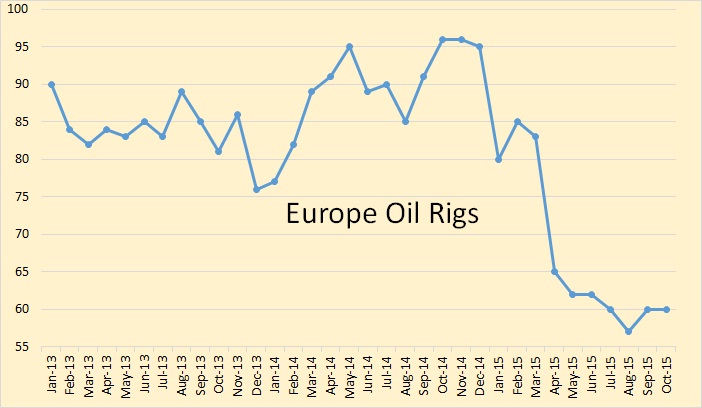
Europe, since last October, has dropped 36 rigs but now seems to have leveled out at 60.
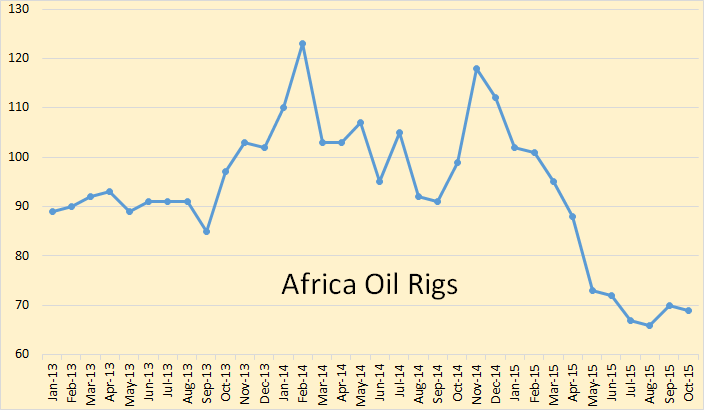
Africa hit 123 rigs in February 2014 and 118 in November 2024 is now down to 69.
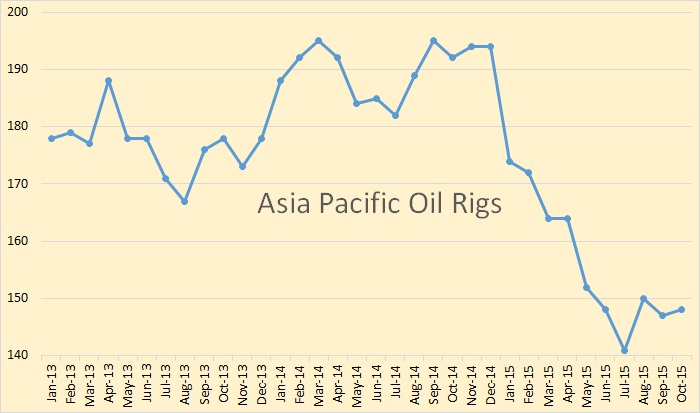
Asia Pacific oil rigs have followed the same pattern as the rest of the world, dropping about 24% since last fall.
Historically production has followed rig count with a delay of about one year. The worldwide rig count did not start dropping in earnest until January 2015. I would expect to see world oil production follow a similar pattern.
A couple of weeks ago I posted a bit about a new peak oil book: “Peak Oil: Apocalyptic Environmentalism and Libertarian Political Culture“. There is now an excellent review of this book on line: Past Its Peak.
Schneider-Mayerson’s questionnaire drew responses from about 1,750 committed adherents of the peak-oil scenario in 2011. That year now looks like the end of peak oil’s era of maximum public exposure. My own unscientific survey of otherwise well-informed people suggests that the whole concept is less than universally familiar, so first a word of explanation.
The claim that oil production has peaked, or will soon, is grounded in a hard ecological and economic reality: as the pool of oil in a well shrinks, it takes more effort and expense to pump out. The return on investment will eventually hit zero. An enormous amount of petroleum remains underground, but the energy consumed in extracting each barrel will exceed the energy produced by burning it. And once we reach that point on a worldwide scale — as must happen, sooner or later, when the last untapped deposit has been located and exploited — the effect can only be catastrophic.
I found another really good peak oil book on Amazon:
The Third Curve – The End of Growth as we know it
This book is a little dated, published in 2013 and is available on Kindle only for $7.99. But I found it an excellent and very easy read. If you have Kindle on your computer then you know you cannot copy and past from it. But Windows Snipping Tool works just fine. From the book:
My next post will very likely be Thursday, November 12th, after the OPEC MOMR comes out.
370 responses to “Worldwide Rig Count Dropping Again”
MEXICO’S CANTARELL OIL FIELD POSTS RECORD LOW OIL PRODUCTION
“The Cantarell oil field — an aging supergiant oil field in Mexico — saw its lowest production in over 30 years with an output of 206,000 barrels per day in October, said PEMEX Exploration and Production (PEP) on Thursday. In its latest weekly report, Pemex said that Cantarell was producing 256,000 bpd at the beginning of 2015, its lowest level since 2004, sparking fears that Mexico’s most productive field was running out of oil.”
Meanwhile Ku-Maloob-Zaap remains on a production plateau of about 850,000 bpd which is expected to continue until 2017.
http://www.shanghaidaily.com/article/article_xinhua.aspx?id=308285
Wow, thats an average decline rate of about 18% per year (since 2003).
Yeh, so much for the long fat tail theory. Mind you, there are extenuating circumstances (Aren’t there always?). I.E., PEMEX started shifting resources away from Cantarell a year or so back.
But I seem to recall a year or so back the big celebration over Mexico passing laws/regulations that were going to bring in foreign technical skills and undo the decline.
Nada.
Yes I guess the relatively low oil price is behind some of it. But on the other hand, as produktion declines it can support less and less resources working on it economically.
Yes, a year ago PEMEX announced a plan to spend $6 billion on Cantarell in 2017 to try to maintain production levels but this was cancelled owing to budget issues (coinciding with the drop in oil prices).
Hi Doug,
Long fat tails are for World output. The decline curves for different regions will not be in sync, or it is highly unlikely to be the case.
Long fat leads with short smaller tails. Western Oil production began in 1860. Over the past ~150 years demand and technology improved to create a very long and fat production curve. However, it’s likely that due to economic contraints, depletion, and extraction Tech peaking, future production will be well below expectiations. the decline curve can not possible match the long ~150 year period before peak.
Hi Techguy,
It is possible that the time to develop oil reserves will lengthen relative to the last 40 years.
Note that there is no expectation that the curve will look similar as oil output declines as it did when oil output was increasing.
Note that most of the oil output has occurred since 1900. The level of output prior to 1900 was pretty low. The average rate of increase in oil output from 1900 to 1973 was about 6.6% per year. The downslope will be far less steep unless a recession or depression reduces demand or oil prices become expensive enough that substitutes and increased efficiency reduce demand for oil. The URR of all C+C will be at least 3000 Gb (with 500 Gb from oil sands in Canada and Venezuela according to Jean Laherrere) and 2500 Gb from C+C less extra heavy oil based on Hubbert Linearization. About 1250 Gb of C+C had been produced at the end of 2014, if 2014 or 2015 are the peak output years, the 500 Gb of extra heavy oil will help to mitigate the decline rate. If oil demand is adequate to keep oil prices near $100/b and supply is adequate to match demand at this price, then oil output will decline slowly after the peak.
There is certainly the possibility that oil prices will rise too high too fast a rate of increase so that a recession will result. If oil prices rise relatively slowly (3 to 5%) per year, then the economy may be able to adjust as people buy hybrids, plug-in hybrids, and EVs, as well as use more public transportation and car pool in response to higher oil prices.
Once the peak is recognized, people will realize that high oil prices are here to stay and there will be greater incentive to use oil more efficiently. In addition car manufacturers will begin to offer more choices in fuel efficient vehicles so that consumers have a broader set of options (instead of the Volt, the Leaf, and the Prius all nice choices in my view, but limited).
“from oil sands in Canada and Venezuela according to Jean Laherrere) and 2500 Gb from C+C less extra heavy oil based on Hubbert Linearization.”
Oil sands need cheap and abundant natural gas. As more and more Coal plants are shutdown the demain for NatGas will increase considerably. Its very likely Oil sands net loser for drillers. I think for the most part Oil sand production growth is in the rear view mirror.
“Once the peak is recognized, people will realize that high oil prices are here to stay and there will be greater incentive to use oil more efficiently”
There will be considerable fewer jobs. Already just about every business is looking or moving to automation. Factories, IT, business systems, and even fast food businesses are all embracing automation. The world is moving to a rising level of poverty as job losses grow from automation, higher energy costs and more regulation. My guess is that within 10 years more than a third of existing jobs will disappear from automation and lack of demand for produced goods and services. Excluding a global war event.
Hi Techguy,
The oil sands that are extracted can be burned instead of natural gas, so the increase in oil prices that is likely to begin in 2017 will lead to continued growth in oil sands output.
Also you are correct that natural gas will become more expensive, this will lead to the expansion of wind and solar power and this will create employment. Automation is a problem, but not every task can be automated. The structure of the economic system may need to adapt to increasing levels of automation, if unempoyment rises as you foresee there will be social pressures for such changes or the economy will become more service oriented.
“The oil sands that are extracted can be burned instead of natural gas, so the increase in oil prices that is likely to begin in 2017 will lead to continued growth in oil sands output.”
That only works if the price per BTU of NatGas is much cheaper than the cost of Oil per BTU. Since Oil sands is very energy intensive, its NatGas needs to be considerably cheaper. I doubt this will hold as natGas prices rise.
Also consider that Prices for energy are falling because of falling demand. Much of the demand in the past 10 to 15 years was fueled with debt expansion. for the past 5 to 7 years its been the Emerging markets (China, India, Brazil, etc) that was driving globe growth. However they too have reach a credit crunch. Debt expansion has likely reached its peak, so the future is likely to experience tepid growth and probably decline as the debt needs to be paided down. Over capacity (driven by the global borrowing binge) is going to result in a large number of defaults that reduces employment.
“Automation is a problem, but not every task can be automated. The structure of the economic system may need to adapt to increasing levels of automation, if unempoyment rises as you foresee there will be social pressures for such changes or the economy will become more service oriented.”
You be surprised what can be automated 🙂 Its already “service oriented” economy, but even the service jobs are getting replaced with automation. Kiosks replacing cashiers\tellers. Call centers, IT, clerk jobs, etc. Its all getting automated, as well as outsourced overseas enabled by high-speed, low cost data comm. Not everyone can become a plumber or electrician 🙂
I’ve read the exchange above between Dennis & tech guy, and want to add the following:
1. When we design very large extra heavy oil projects we have to consider gas and electricity supplies, dilution, upgrading, transport, and marketing. Marketing includes ensuring we have refineries able to handle and process the resin and asphalt molecules.
Thus the tendency for these giant projects (100,000 BOPD or larger) is to design to hold a plateau for many years. I’ve designed projects as large as 400,000 BOPD, and those tend to be optimized with 20 to 30 year plateaus.
2. The industry is developing lower energy cost technology. This technology uses less energy but can cost more money. I can’t remember where my public versus confidential boundary lies, so all I can do is suggest you look up steam additives, vapex, and cold heavy oil production.
3. I’m aware of one study to use nuclear power in cogen mode for giant heavy oil projects.
Hi Fernando,
Thanks. Is the correct interpretation that increased natural gas prices may simply lead to substitution of bitumen, coal, nuclear or some other energy source to replace the expensive natural gas?
DC,
The Montney is a possible player in the Alberta oil-sands game. It’s NG rich and located in NW Alberta and adjacent BC, and some of the big guys are in there a-drilling. (ConocoPhillips and Shell come to mind.) It would be a source of supply of NG to the oil sands.
I only come across mention of it when James Burgess at OilPrice writes it up, but it might be more than just a puff, judging from the interest.
Any indication of what the M o M drop was?
Don’t know, but: PEMEX REPORTS BIGGEST LOSS EVER AS OIL MARKET ROUT CUTS DEEPER
“The company’s losses worsened as U.S. benchmark oil prices fell more than 50 percent from the third quarter of 2014, and the Mexican peso declined 21 percent versus the U.S. dollar in the same time frame. Pemex had a 50 percent reduction in the number of rigs producing oil and natural gas in the third quarter versus a year earlier. Output fell 5.5 percent to 2.266 million barrels a day.”
“Production has declined for 10 straight years since reaching more than 3.3 million barrels a day in 2004. As part of Mexico’s efforts to open the country’s energy industry to outside firms, the next round of offshore oil exploration leases will include joint ventures between Pemex and private companies.”
http://www.bloomberg.com/news/articles/2015-10-28/pemex-reports-12th-straight-loss-as-oil-price-batters-profits
I operate in Mexico. You guys should keep in mind that Pemex is a very poorly run outfit for a long list of reasons, not just poor management. Theft of their products, embezzlement, fraud, corruption and the fact that the government uses it as a piggy bank and all that’s just an appetizer. Their production is directly affected by all that and now they’ve asked the gringos to come in to spend the money to increase production.
There is a lot of corruption and fraud that is well hidden in the US but Mexico is Byzantine.
Byzantine! LOL. Old friend of mine (whose been dead for years) owned and ran a drilling company. He always said:” I’ll operate in any country in the world, except Mexico.” Reason: they’re all crooks plus a legal contract is meaningless there.
The US government is almost as bad and even worse in some ways.
But my point is that the Mexicans could increase production if they wanted.
How would the Mexicans increase production when its declining like it is? What price environment do you envision to make this possible?
Nein Herr Leanme, you know as well as I do that this price won’t support much of anything but Mexico still has a lot of good ground.
Tanker hijacking has been quite the lucrative pastime the last few years. They’ve had to find a way to move all the product being stolen from Pemex. Even moving it across into Texas and selling it to oil guys over there, a few of which were unaware they were buying stolen goods. And everybody got sued by Pemex for real money.
I keep a tight leash on my tankers.
I’ve been assigned to manage technical teams for assets with declining production, and managed to reverse decline and increase it slightly, but it required a huge amount of cash, very competent personnel, good rigs, and unorthodox approaches. For example, I had multiwell pads permitted and built without having a full understanding of where the hell the wells would be drilled.
HR, you are absolutely full of shit. The US government is in no way as corrupt as the Mexican government. It is the the lower levels of Mexican government that is the most corrupt. Everyone is on the take in the lower level local governments.
To say that Mexico could increase production if the wanted sounds like something so stupid it might come from the mouth of Ben Carson or Donald Trump. Mexico would love to increase production. They couldn’t do it because of laws that prohibited foreign companies from having a piece of Mexican production. Then the tried to open it up to foreign companies but got few takers.
To rattle off statements like you do is something you hear on schoolyard playgrounds. All mouth and no evidence of anything you say.
And tanker hijacking is what is keeping their production down? There was a lot of tanker hijacking off the coast of Somalia a few years ago. And it is still happening in Southeast Asia. It is in the news every time it happens, tanker or just a cargo ship. Funny, I haven’t seen any news stories about those Mexican oil tankers getting hijacked. Was that in the Gulf of Mexico? How on earth are they keeping those hijackings out of the news?
HR, you just make up shit. Stop it, go somewhere else if all you can do is make up a bunch of lies.
Well Ok.
For those of you who are so inclined OilPro has a good article from six months ago about PEMEX reported the number of illegal taps as 3,674 in 2014.
http://oilpro.com/post/12258/pemex-battles-ongoing-pipeline-theft
It also discusses an AP article about- The AP reported recently that there has been a 70% increase in illegal taps causing PEMEX to alter necessary processing steps when putting product in the pipelines.
The TV outfit 60 minutes did a 20 minute segment on the severity of the situation a while back and you can watch it at their website.
One of the most concise articles:
Mexico’s state-owned oil company Pemex filed a lawsuit in Houston against nine U.S. oil companies accused of buying and selling natural gas stolen by organized criminal groups.
According to Pemex, those companies facilitated black market sales of gas condensate stolen from the Burgos field which stretches across the north Mexican states of Tamaulipas, Nuevo Leon and Coahuila.
The company claims that “Some of the defendants knew, or at least should have known, they were trading in or transporting, stolen condensate.”
Much of the Burgos field is in Tamaulipas, which is controlled by the Zetas drug trafficking organization. Pemex said it had lost, at times, almost 40 percent of the production from the field, and that several Pemex officials had been kidnapped and threatened.
In June 2010 Pemex brought a lawsuit against five U.S. companies it accused of buying stolen natural gas condensate from Mexican criminal groups. Several were fined by a Texas court.
Mexican drug cartels increasingly use fuel theft as a source of revenue, particularly in the north of the country, as InSight has reported.
http://www.insightcrime.org/news-briefs/mexicos-pemex-sues-us-firms-over-oil-theft
But the most entertaining is from vice news on you tube that discusses the villages that have been burned to ground with the people in their houses after petroleum products that were running through the streets ignited. Im not sure if this was from 60 minutes or vice news, you can watch it here and it’s a good show
https://search.yahoo.com/yhs/search?p=60+minutes+pemex+pipeline+theft&ei=UTF-8&hspart=mozilla&hsimp=yhs-003
As far as “low level corruption.” This spring I’ve been working in Mexico for seven years. I deal with a lot of legit Mexican businessmen. We are surrounded by an ongoing drug war. Whenever the violence flares up and the topic of conversation turns to the drug problem, the Mexicans, to the man, point the finger at the Federal police and the Army. The Federales and the Army control the highways with checkpoints and heavily armed patrols. They are everywhere all the time. Nothing moves thru Mexico without their knowledge.
And I don’t think they are low level. I won’t even get into what they say about who controls the Army and the Federales.
As far as corruption on the US side, this scratches the surface:
http://www.insightcrime.org/news-analysis/us-police-corrupted-by-mexican-cartels-along-border
This will give you a flavor:
A Department of Homeland Security (DHS) report published this year revealed that approximately 2,000 police and other law enforcement officials are under investigation for their involvement in organized crime. The DHS is currently investigating public officials who have received bribes to protect criminals, facilitate drug trafficking, escort drug shipments, and traffic the Mexican cartels’ drugs.
I wish you all a happy and productive day.
This conversation mentions, then goes on to totally disregard, a crucial upstream factors point: The failed ‘War on Drugs’ ™. My brief premise: If the U.S. and Canada, then Mexico, all the rest of the Central and SouthAm countries, would implement the Portuguese solution to the ‘Drug Problem’ ™, then all the oxygen would be sucked out of the situation and the fire would go out. Look stuff up yourselves, I am not your Internet research intern.
Of course you utterly leave out the below-ground factors main point: depletion never sleeps….highest EROEI resources extracted first, diminishing returns cannot be escaped….things wind down as we struggle harder and harder, up to societal structural financial chicanery limits, to extract and burn the last remaining hours of ancient sunlight. All the talking points about hijacked tankers and illegal taps and corrupt federales are just faded margin notes in a tattered decaying old tome.
Ron,
I read HR’s “tanker hijacking” as referring to tanker trucks.
And you would be correct my friend.
Pemex is being deprived of many tens of billions of dollars through the years that could be put back into operations. I mean there is a massive theft going on.
There is one Mexican company that had, at my last glance of their equipment list, around 350 tankers. They had so many tankers get hijacked that more than half of their drivers quit. Said it wasn’t worth it anymore.
Here is the 9 month report for Pemex. Overall production looks stable. Something must be offsetting Cantarell’s decline.
Ron. Thanks for the post! Do you have statistics on number of oil rigs for OPEC members?
OPEC claims just 36,140 producing wells across all members in 2014, 35,272 producing wells in 2010, yet that 16,483 wells were completed 2010-2014.
For example, Ecuador recently announced oil production costs of $39 per barrel. Why would 3,592 onshore wells producing 556,600 bopd cost $39?
OPEC’s numbers look very strange, yet I cannot find any analysis of them.
Maybe those who have worked in OPEC countries could shed some light.
Based on OPEC information, across all OPEC members, over 40% of all wells producing in 2010 were abandoned by 2014?
I am surely missing something.
Shallow, the only data I have is the data published by Baker Hughes, OPEC, the EIA and IEA and other public data that can be found on the net. And it looks like you have researched this subject much deeper than I have.
I’ll try to put it together.
I just wonder about OPEC well count. I do not doubt OPEC countries are able to produce oil more cheaply than US on the whole, but since most keep the info private, and given many fields are very old and under EOR, I am skeptical.
shallow sand,
Here is a table from World Oil.
Wells drilled in 2013, 2014 and forecast for 2015 – Middle East
And North Africa
Rest of OPEC:
AlexS. Thanks!
What’s in the $39??
Fernando. I am not really sure about how the $39 is calculated. I think that private companies operate the production, and each has a contract which provides for how they are compensated. I believe $39 is the overall average cost to the government of Ecuador, per a report earlier this year that they were selling oil for an average of around $30 per barrel in August, and therefore operating at a loss.
The President of Ecuador announced this in late August and many news agencies picked it up on 8/26/15.
I think you are familiar with their production? I am just going off of news reports.
I consulted for an Ecuadorian subsidiary of a foreign company several years ago. I suspect you are right, they must be listing the delivery price charged by these ventures. The real opex is lower, but the oil is transferred with the CAPEX recovery included. They also have fairly steep pipeline tariffs and there’s a natural gas shortage.
Shallow
I did read some time back it was on the oil drum I think that the saudis were busy drilling shallow horizontal wells in northern ghawar to produce oil pockets but they only flowed for around six months.
Oil Production Vital Statistics October 2015
I think I would modify this a bit.
“Banks”. It’s perhaps more so high yield paper issuance, and we have seen at least one story indicating a bank (JP Morgan) orchestrated placement of the issuance in order to service debt JPM had actually loaned. So this would mean banks are selling debt to the public (with their powerful sales force), and doing so to protect their own loan portfolios. One might also wonder about their managed accounts (client money entrusted to in-house advisors) and if those accounts were put into this HY paper.
There was that JPM quote in response to a question about the risks to their loan portfolio. “We have offloaded that risk to investors.”
To a certain extent it all says that I forgot my own mantra: Nothing relevant to money is going to be allowed to destroy civilization, because it can be created from nothingness.
We imagined that a mini Apocalypse loomed, derived from shutting down oil production via loan shutoff simply because it was not profitable. How absurd, in retrospect. Profitable. Profitable was a lot more powerful a requirement pre 2009 than post 2009. Now, it’s almost laughable. No one is going to allow horrible outcomes just because numbers on a screen are red.
Mostly I disagree with Watcher, but I believe he is right when he says MONEY, or the lack thereof, will not be ALLOWED to destroy civilization.
I will put that into other words and say that a LACK of money MIGHT destroy civilization, in the same sense that an auto accident or plane crash might kill you. The possibility is very real that MISMANAGEMENT of money could result in the world going to hell in a handbasket, but imo the odds are at least fair to good that life as we know it will not end PERMANENTLY because of a lack of money.
Money is only a tool, no doubt one of the most useful tools ever invented, and NECESSARY, so far as I can see, but still only a tool. The modern world is not amenable to running on barter, and money is ESSENTIAL, needed as a MARKER to allow us to know who owns what and owes what to who.
But the RULES or LAWS we use to regulate the creation and supply and availability of money are man made, rather than laws of nature.
Money is like gold, which serves very well AS money, if you happen to have some gold, in that it is VALUABLE only because everybody or just about everybody BELIEVES it is valuable. About the only actual USE, other than as jewelry or money, I can personally think of for gold, in my own case, is as a material to fill cavities in my teeth, and a few grams would suffice for a lifetime. BUT if anybody wants to sell me some cheap, I am ready to buy- because I know I can sell it at a profit, or trade it at a profit.
But this is ONLY possible because just about every body has FAITH in the value of gold. Even skeptics will gladly buy today at eight hundred, knowing they can sell tomorrow morning for over a thousand to a million different eager buyers.
Likewise we have FAITH in dollars, or yen or marks or whatever, because we KNOW everybody else will accept them in exchange for goods and services. What this really amounts to is that we have FAITH in our governments creating and maintaining this abstraction we call money as a useful concrete tool (although most of it exists only as patterns of electrical charges on a screen or drive someplace. )
The world REALLY runs on physical goods and physical services, and on TRUST that we will be able to continue to exchange goods and services on terms agreeable to all of us, or most of us anyway.
Basically all that it means when we say we are a billion in debt for this, and ten billion for that, and fifty for something else, and a hundred billon for this and that and the other, and a few trillion for every thing all together, is that all those goods and services have been CONSUMED, and SOMEBODY has been PROMISED PAYMENT for them.
But human affairs involving money and commerce etc are not subject to rigid physical laws of the sort physicists and chemists and engineers ( and even old farmers ) are compelled to observe.
Everything that goes INTO a chemistry experiment, or a chemical factory, emerges at some point FROM the factory. Every last molecule, every last joule of energy appears on both sides of the equation, NOTHING is either CREATED or DESTROYED.
But in the case of credit extended to people ( or entire countries ) the actual goods and services are CONSUMED and no longer existent, except as waste and memories, remaining on the LEFT side of the equation. ON the RIGHT side, there is a pile of IOU’s, promises to pay to the people who were dumb enough to do the lending.
There is in the end NOTHING that can FORCE payment, because for the most part, the people who owe the debt, personally or in the aggregate , are either insolvent, or close enough to insolvent that the debt CANNOT be paid.
Now IF perpetual growth were indeed possible, perhaps the debts could be partly paid,and partly rolled over, and BAU could continue as usual for some indefinite length of time.
BUT I think it is safe to assume that most of us in this forum either believe that eternal growth is NOT Possible , or that even if it is, there is a substantial danger growth will stall for any number of reasons.
SO- what this boils down to, IF growth stalls, is that the holders of all that debt are going to find themselves on the receiving end of some extremely painful involuntary sex.
Some of them are one percenters, and they will fight to maintain their exalted status, but ninety nine to one odds against them mean they are going to LOSE that fight.
Some of the “owners ” of all this debt are people expecting to collect pensions, health care, etc,as they get older, based on past contributions. They are going to get the shaft too. People who expect to reap big profits on residential real estate are going to find their profits negligible to non existent.Fortunes based on high status BRAND NAMES will vanish, because in a collapse, good jeans for forty bucks are going to sell,for a while at least, whereas three hundred dollar jeans will not.
The physical resources we need to continue living as usual are growing short, but not so short as to threaten our current way of life IMMEDIATELY.
OTOH
A MONEY crisis is imo almost sure to erupt WELL before there is a truly serious resource crisis. Such a crisis could erupt tomorrow or next month or next year.
Leviathans are going to have to find a way to get rid of the old debts and restore faith in a new sort of money. ONCE faith in this new sort of money is established, we can get on with life.
Getting rid of the old money, and declaring the old debts effectively null and void, is going to be one hell of an interesting experience.There will be plenty of blood in the streets in plenty of places.
But there is nothing new about this sort of thing, it has happened many times in the past. Countries have lost wars, the local people lose their property and often their lives, the old debts are forgotten because the owners of them LOST the fight. Kings have borrowed money and then imprisoned or murdered the lenders.
The only real difference this time is that the fights are going to be INTERNAL mostly, rather than EXTERNAL. The banks these days are no more powerful than royal families and their allied nobles were in past times. They may win, in terms of surviving as businesses, but the people of the world are going to REPUDIATE their debts, and in the end, there is NOTHING the one percent, The OWNERS of all that debt, will really be able to do about it.
Whatever physical resources still exist at that time will STILL exist, and whatever human capital exists at that time will still exist.Most of it,at least, a lot of infrastructure will be torched, and a lot of good people will die.
If CONFIDENCE can be restored, life will continue as usual, within the limits of physical constraints such as climate and geology.
Confidence WILL be restored, but it might take a generation or two or longer for the restoration to happen.Eventually people will pitch in again on large undertakings.
The pyramids got built without oil and without bankers, although the rulers bookkeepers might be properly described as forerunners of bankers.
Mismanagement of money might result in the end of life as we know it, just as a plane crash can kill everybody on the plane.
But planes in trouble usually manage to get on the ground again without killing everybody aboard, and the mismanagement of money by governments and bankers is not necessarily going to do us all in. There is a big difference between WILL and MIGHT.
In reality, the world economy runs on real physical goods and services,on the one hand, and FAITH on the other, FAITH that we can continue to exchange goods and services on terms agreeable to all or at least most of us.
Money is an abstraction that is the actual EMBODIMENT of that faith. When, or IF we lose faith in our money, there is going to be hell to pay, plenty of blood in the streets, troubles of every sort out the ying yang.
But most likely ( no gaurantees ) the various Leviathans of the world will simply repudiate and declare null and void most or maybe even all debts, and start over again.
Whatever physical resources and human capital still existing at that time WILL STILL EXIST, and people will eventually be willing to engage in large scale works together again. The pyramids got built without oil and bankers.
The people who own OWN all the debt are going to find that they have been awarded the ultimate haircut, they are going to be not only pulled down off their thrones, but stoned and imprisoned and executed. People who own small chunks of it, for instance in the form of an expected old age pension, are going to lose those small chunks as well.
There is nothing new about REVOLUTION.
Elites and governments have been overthrown on a frequent almost clocklike basis since we first evolved societies with elites TO BE overthrown.
Countries have lost wars, the people who lived in them lost everything. Kings have imprisoned and murdered people who lent them money.
Business as usual is a dead man walking, and may die sooner than necessary on account of money troubles.
But in the end, we are collectively in deep DOO DOO MOSTLY NOT because of money but PRIMARILY because of overpopulation, environnmental degradation, and depleting one time gifts of nature such as oil.
There is a time lag of around six months between rig count and production change (see below chart for Bakken). In the comparable period during 2008/9 rig count started to rise in February 2009, yet production rose for the first time in October 2009. Should rig count start rising next month (if oil probably rises by an OPEC cut), production would be still down until at least April 2016.
What is the current fracklog to work through in the Bakken?
Are you using the EIA’s production figures? Oil production increased according to North Dakota state figures in May and June 2015, and September figures aren’t out yet (maybe this week).
Gwalke, the chart shows year over year change in production not production in barrels per day.
I thought it was m-o-m, not y-o-y. Reading what’s actually in the graph often helps understanding!
gwalke,
I used the numbers from https://www.dmr.nd.gov/oilgas/stats/2015monthlystats.pdf, the site Ron gave in his last post. For the previous years I have just changed the year within the address and this worked well. Although total EIA numbers show a resilient US production it is somehow mitigated by the still rising Golf of Mexico production, which is conventional and has a time lag between rig count low and production of around 18 months. Conventional production will start declining around April 2016 and then the recent trend in the Bakken will also show up in the EIA numbers.
Hi Heinrich,
I was unable to reproduce your production %yoy chart using NDIC data. Can you share how you interpret %yoy change in production? I would do it as this year divided by last year (for the same month) minus one and then multiply by 100 to put in percentage terms.
Dennis,
I took the month of the current year substracted the same month from the previous year and divided this results by the month from the previous year and multiplied the whole with 100. If you look to the chart of AlexS, it has the same pattern except he took numbers from 2010 to 2015 and my numbers were from 2003 to 2015. The whole point was to show the time lag between the low of rig counts and the restart of production. It perfectly fits a time lag of six months. Oil prices started falling in October 2014 – hence the production peak in April 2015. The same was true in 2008/9 when oil prices fell in August 2008 and production peaked in February 2009. Rig count recovered in Spring 2009 as production then started rising in the fall 2009. As a conclusion production will only recover by earliest April 2016 as rig counts are still falling. So far, the model works quite well. However, this works just for shale oil and gas. For conventional production the time lag stands around 18 months. Golf of Mexico production is still rising and will very likely start its decline by April 2016
Hi Heinrich,
Ok. the denominator of these calculations is never clear. I would tend to use either the current month or the average of current and previous month, using the earlier month in the denominator is an odd choice (at least to me).
I don’t think the rig count is a great indicator because the size of the frack log can change the lag time, as can the level of rig efficiency(wells drilled per rig per month). Both of these are variable over time so it is hard to predict what will happen going forward. The price of oil is the key variable and the future oil price is unknown.
Heinrich, all North Dakota stats can be found here:
North Dakota Industrial Commission, Department of Mineral Resources, Oil and Gas Division, home page
The chart I published with the monthly spuds update can be found by clicking on “General Statistics ” on the left of the page, then clicking any year after :
•Monthly statistical update”.
Ron,
Thanks for the link. This is why I like your website as you are open with your knowledge, which gives me a lot of input and insight. Thank you again.
Bakken y-o-y oil production growth (%)
Source: NDIC
Y-o-y oil production growth in the Bakken was still positive in August, but it will turn negative in 4Q
Y-o-y oil production growth in 4 key shale oil plays
Source: EIA DPR November 2015
The decline is more visible in this chart:
AlexS,
The whole point of my post was to show the time lag of rig count and actual production with some real numbers. However, the steep Eagle Ford decline confirms my view that there is something big going on in Texas as the decline is not linear – which is the basis of many mathemathical models – but exponential. It looks like producers in Texas are aggressively slowing down production, which is the right thing to do as this will pave the way for an oil price rise. There might be also something else going o other than a simple production cut as the well productivity shrank the first time ever in shale (see my below post). Nevertheless, I am already curious what the next numbers will be.
Thanks for clearing this up, Heinrich. I would definitely trust North Dakota DMR figures over EIA any day of the week. I was just having a brainfreeze and thinking the change was m-o-m not y-o-y.
Anecdotal…Canada
A friend of my nephew recruited him to start as a driller right after high school this year due to his work ethic, size, and that he obtained his C ticket welding while still in grade 12. Prime candidate. The job was to begin this September. The drilling company anticipated needing new employees. The experienced driller (his friend) was dispatched to a job after a long layoff just last month. He was recently sent home and told there would be nothing for even the experienced hands. There would be no openings in the forseeable future.
Nephew is drilling, but drilling water wells around Victoria and the gulf islands. He is very busy and doing pretty good for a kid 18 just out of high school. The wages are decent, there is lots of OT, a per diem, the works….all heady stuff for a kid. Many experienced welders have returned home from Alberta looking for shipyard work in Victoria. As such, he probably will not end up welding, either. However, when I got him into the welding program it was to get a leg up on kids who leave school not knowing what end of a wrench to hold. It was simply to get him his start, which it has. He can always return to school, later, with cash in his pocket as opposed to student loan applications.
Nephew is now saving for a condo or house. Old uncle (me) has advised him to wait until ‘after the housing collapse’ sure to hit Victoria any month now, at least as far as I can tell.
Having a profession such as engineering PLUS a trade such as welding is potentially the difference between a young man doing very well in the future and maybe just getting by.
I have always been a rolling stone myself, and always found it very much to my advantage to have qualified myself in multiple lines of work. My degree got me in the door on some occasions, on others my certifications as a welder, professional trucker, pesticide applicator, etc got me in or kept me in.
My CDL A with hazmat enabled me to keep working on a construction job once when pink slips were being issued right and left. SOMEBODY had to drive the equipment service truck a few hours hours every day, but there was simply no longer enough work to justify a driver with no other duties.
You can get a cdl in a month or less at a commercial school, or in a couple of months weekends at a community college.It’s as easy to get as falling off a log, it’s just a third grade level written test. I got mine by taking the road test and swearing truthfully that I had five hundred miles experience.
The more things you can DO , the more valuable you are as an employee, especially when business is slow.
A years hands on varied experience in residential construction and a quick course in reading drawings at the community college is enough to enable a willing man with a brain to save a hundred grand by building a himself a nice house. I know a couple of people who have done just that living in a camper in the back yard for a year while building.
With regard to peak oil book publications:
Permanent Oil Schock, L.F. Ivanhoe
“The two basic factors of the world’s oil supply are (1) geologic (discoveries) and (2) economic (distribution). Petroleum geologists have done such a good job of finding oil that it looks as easy as growing crops, and our engineers deliver the petroleum like clockwork. Consequently, the public and many planners consider global distribution to be the only supply problem and attribute all price swings to simple economics. They erroneously ignore critical long-term geological facts and assume that cash spent = oil found. This premise is invalid where no oil exists or where prospects are poor. Most people are unaware that the global quality of geological/oil prospects has declined so much that the amount of new oil found per wildcat well has dropped 50% since a 1969 peak. Discoveries of the most critical but easiest to find giant fields (each with over 500 million bbl of recoverable oil) are now stalled at 315 known worldwide. We are simply no longer finding enough new crude oil to replace the world’s huge consumption of 20 billion bbl (840 billion gal) per year.”
http://www.searchanddiscovery.com/abstracts/html/1987/annual/abstracts/0571a.htm?q=%2BtextStrip%3Aopec+textStrip%3Astatistics
Looks like the troubles are here to stay.
Hi R Walter,
Using production data for C+C less extra heavy (XH) oil, following Laherrere, a Hubbert Linearization (HL) results in an estimate for World URR of 2500 Gb. This method has tended to underestimate URR in tthe past (Laherrere in 2008 and 2013 at 2000 Gb and 2200 Gb) so I assume that future increases in estimated proved plus possible (2P) reserves will result in an increase in C+C-XH URR to 2800 Gb (a 12% increase over the HL estimate. I also assume extra heavy (oil sands from Canada and Venezuela) URR will be about 600 Gb, with C+C URR= 3400 Gb (including oil sands resources).
In Ron’s previous post I showed a possible scenario with extraction rates increasing though 2025 at ra similar rate to the 2009 to 2015 period. (This is the extraction rate from proved producing reserves of C+C-XH resources). Below I present an alternative scenario with extraction rates remaining at 2016 levels of 8.3% (in 2014 the extraction rate was 8.1% and 2015 is based on the October OPEC forecast for 2015 and EIA data through March 2015).
As Ron Patterson has pointed out occasionally, I don’t know what future extraction rates will be. I agree.
Below is the scenario presented in an earlier post which was more optimistic about future extraction rates. If oil prices are above $100/b and remain at that level, I think the scenario below is more reasonable, but I have been wrong in the past.
In the a post above I typed “ra” and it was supposed to be “a”, just caught it now. sorry. Note also that the lower extraction rate in the scenario with the lower peak in 2015(less than 80 Mb/d), results in a lower annual decline rate, mostly less than 1% except for 2015 where it is 1.5%.
For completeness, I did a scenario with extraction rates falling after 2015 to a level below the 2005-2008 average extraction rate by 2024. The annual decline rate rises to almost 2% from 2017 to 2021 and then falls below 1% by 2025.
I do not think falling output and the resulting high oil prices are likely to reduce the level of extraction of producing reserves unless there is a severe recession like 2008/9, note on the chart how little the extraction rate changed over the 2007 to 2010 period.
2200 Gb would be 300 billion metric tons.
2,200,000,000,000/7.3=301,369,863,014 metric tons of total oil extracted, yet of be extracted, past production and future production.
If consumption is 10 million metric tons burned each day, it is 3,652,500,000 tonnes per year consumed by the gaping maws of industry to allow civilization be in the gluttony mode, with half of it gone, 150,000,000,000 tonnes to go, then there is a fifty year supply in the ground and under the seas and oceans.
The metric system is of an advantage when calculating the numbers, IMO.
Thanks to Robert Wilson for the links to L.F. Ivanhoe’s findings and conclusions, appreciate it.
Hi R. Walter,
Note that cumulative production of C+C through 2014 is about 1250 billion barrels or about 170 metric tonnes. Also remember that the 2200 Gb does not include oil sands resources which Jean Laherrere estimates at about 500 Gb, these cannot be developed as quickly as conventional resources but the will help to reduce the decline rate if they continue to be developed after the peak.
Hubbert linearization for C+C less extra heavy oil for 1970-1986, 1987-2004, and 1993-2014 with URR of 850 Gb, 2000 Gb, and 2500 Gb respectively in chart below using EIA data and XH output estimates from the Canadian Association of Petroleum Producers (CAPP) and Venezuelan Orinoco output estimates from Jean Laherrere’s 2013 Oil Forecast.
Regarding your quote from Ivanhoe – “We are simply no longer finding enough new crude oil to replace the world’s huge consumption of 20 billion bbl (840 billion gal) per year.” When I divide 20 billion by 365 days, I get 54,794,520.5479. Unless misquoted, I do not have a clue what Ivanhoe is talking about. Using only crude, the world is producing over 70 million barrels per day. I know that we are not adding over a billion barrels of oil into storage every 2 months. So the world’s consumption of whatever he is talking about is significantly greater than 20 billion bbl per year.
The time it written was 1987.
Follow the link and read it all.
correction: the time it was written was 1987.
I noticed a mistake above. I said “proved plus possible (2P) reserves”, I meant to say “proved plus probable (2P) reserves”.
R Walter – Buz Ivanhoe’s newsletter was initially intended for snail mail distribution. Buz did not use computers. Jay Hanson was the first to post issue #1 on the internet.
http://hubbert.mines.edu/
Addendun http://www.mombu.com/politics/politics/t-lf-ivanhoe-has-come-and-gone-4430597.html
https://www.project-syndicate.org/commentary/debt-threatens-global-economy-by-richard-kozul-wright-2015-11#9bVidMsfaVX73OEz.99
Hi Schintzy,
If global growth stagnates, interest rates won’t rise by much. So high interest rates and low GDP growth is not a very realistic scenario. Very poor monetary policy could accomplish it (like Volcker in the 80s), but we may have learned something since then about monetary policy.
xxxxx test
http://www.theonion.com/graphic/beijing-fire-department-extinguishes-massive-five–51720
Good for a belly laugh and a test to see if I can get something to post.
“An oil-workers strike launched Sunday has shut down up to 13% of Petrobras’s daily crude production”
In 2007-2008 this would have sent oil up $20.
http://www.marketwatch.com/story/board-turmoil-hits-brazils-petrobras-2015-11-06
It’s a real debacle down there.
It’s a real debacle down there.
Yeah, sorta, kinda… this comes on the heels of a recent and prolonged bankers worker strike. The problem is that the current government can no longer afford all the social programs for the economically disenfranchised that it started during times of greater prosperity. It depends heavily on income from natural resources and the system is rife with corruption which further leaks away capital from many of these social programs compounding these issues. Everyone is still operating on the old models which can no longer work when the system encounters physical limits. These are precisely the circumstances one would expect when cheap oil is no longer available. The next thing to watch for is more political unrest which will not be able to be handled by either side of the aisle. Neither the left nor the right has viable solutions for these issues because they are not problems to be solved, they are solutionless dilemmas. The system is just plain broke, (pun intended) so you gotta fix the system and the good folk with all the vested interests don’t want to change or give up their gravy trains. Should be an interesting ride. The good news is that it has been raining quite a bit and the drought has begun to lift a little and there is more water in the reservoirs but I still think it is going to be a long hot summer. Of course Carnaval is just around the corner and all will be well, at least until ash Wednesday 🙂
Of course Carna(ge) is just around the corner and all will (not) be well, at least until ash Wednesday.
There, fixed that.
Everyone is in a real bind, might as well face the music.
Carnaval…bread and circuses…better than implementing a ‘The Purge’ tradition…or reinstating sacrifices to the Gods to bring good harvests or whatnot.
Are you ready for some Football? ™
Everyone is in a real bind, might as well face the music.
Did you say face the music?! Right, might as well! It’s a tough job but since someone has got to do it might as well be me… 🙂
Bellini – Samba Do Brasil
https://goo.gl/2d6idE
“G-o-o-o-o-d morning, slaves, and welcome to another sedition of,
It’s The End Of The World As We Know It And I Feel Fine
The show where all of the popos’ darkest fears come to life…”
The Silhouette Of The Amish (Instrumental)
There seems to be a gremlin in the soft ware that prevents a comment from appearing right away sometimes.
I could not SEE the one I posted at five eleven pm after an hour, and presumed it was not going to show, and posted a shorter version of it a couple of hours later, which also did not show on my screen— until this morning.
Hence the xxxxx test, which DID show up right away.
Are other commenters having similar problems sometimes?
I had one or two of my posts last week get snagged in the spam filter, but I edit the hell out of some of them anyway, recently thanks to Dennis. 😀
“Worldwide Rig Count Dropping Again”
Oh noes! 😀
Mac, your comments were caught by the spam filter for some reason. I released them this morning. Hope you don’t have this problem again. But I now check the spam filter several times a day to see if any comments are there that are not spam.
Hi Old Farmer Mac,
Maybe the spam filter looks for words capitalized, if you use boldface or italics, this may be less of a problem. Your comments did have a lot of capitalized words for emphasis. I know this is easier to type, but generally all caps is considered shouting on the Web and we like to keep our voices down 🙂
Hi Dennis,
I understand about the caps being considered shouting, but my comments are seldom directed at anybody in particular, and while the filter may be snagging caps, it has not been doing so in the past.
I can do italics and bold face, but it takes about eight or ten keystrokes the way I was taught to do it. The cap key is one stroke on and one off.
Perhaps there is a faster way?
Hi old farmer mac,
I was kidding about the shouting. I don’t know why the spam filter is picking up the all caps, but I have no way to adjust it. You seem to be using more of the all caps lately. I don’t know of any tricks for making bold easier to do.
WARMING SET TO BREACH 1C THRESHOLD
“Global temperatures are set to rise more than one degree above pre-industrial levels according to the UK’s Met Office….. This is the first time we’re set to reach the 1C marker and it’s clear that it is human influence driving our modern climate into uncharted territory….”
http://www.bbc.com/news/science-environment-34763036
Meanwhile:
CO2 LEVELS HIT RECORD HIGH FOR 30TH YEAR IN A ROW
“Greenhouse gas levels in the atmosphere reached a record high in 2014 and the relentless fuelling of climate change is endangering the planet for future generations, the World Meteorological Organization said on Monday….”
http://newsdaily.com/2015/11/co2-levels-hit-record-high-for-30th-year-in-a-row-wmo/
And of course:
The rise in carbon dioxide levels is being amplified by higher levels of water vapor, which are in turn rising because of carbon dioxide emissions, the WMO said.
Levels of the other two major man-made greenhouse gases, methane and nitrous oxide, also continued a unrelenting annual rise in 2014, reaching 1,833 parts per billion (ppb) and 327.1 ppb, respectively. Both rose at the fastest rate for a decade.
My only question: Who will be the first “armchair expert” to deny the significance of this?
Hi Doug,
Peak fossil fuels will help reduce the magnitude of the climate change problem. If the mean estimate for equilibrium climate sensitivity(ECS) is correct (3 C for a doubling of atmospheric CO2) and if Steve Mohr’s best guess for fossil fuels is roughly correct, the atmospheric CO2 would top out at about 520 ppm and then slowly decline. This would mean the equilibrium temperature would be about 2.7C above the pre-industrial average (Holocene up to about 1750). This ignores possible effects from methane and other GWGs, but mainstream climate scientists usually focus on the CO2 as this is the biggest effect. The other effect I ignore is the aerosols in China which may be masking some of the effects of increased CO2.
Fernando often claims that the GISS models have an ECS of about 2.5C (I checked this and he is correct). Using that value for ECS and the other simplifying assumptions the temperature rises by 2.2C. Still a problem, and of course there are other models with ECS of 4.5C and higher and we don’t know which of these are correct.
I often mention to Fernando that we don’t build bridges with a factor of safety of 0.83, usually it is 2.5 or higher. Not sure about fighter jets I guess those are just strong enough not to fail.
ANY REAL DISCUSSION of any serious issue NEEDS gadflys of the Fernando sort, because they help keep the political aspects of the discussion honest.
EVERYBODY in this forum ought to know by now that I am a firm believer in forced climate change which will mostly manifest as warming and that I am a pedal to the metal renewables and efficiency advocate.
But the simple goddamned TRUTH is that the environmental movement as a whole tends to gloss over or totally ignore some TRULY PERTINENT FACTS- the most important such fact being that fossil fuels DEPLETE.
Now a hell of a lot of people are perfectly willing to wink and accept such lies by omission if they agree with the overal goals of the people who tell them.
But there are also PLENTY of good reasons to make sure the ENTIRE truth gets out.
For example, I personally think a hot WWIII brought on by resource wars, with the KEY short supply resource being oil, might very well finish us off before we NEED to worry much about climate change, considering nearly all that might be left of us might be a few bones glowing in the dark. ( not literally )
I am not talking about oil being short enough to fight WWIII as a consequence in the VERY NEAR future, but ten or twenty years down the road ? We just don way of knowing for sure.
Dennis and Ron Patterson might not think of themselves as climate change gadflies, but insofar as THINKING and WELL INFORMED people are concerned, THEY ARE GADFLIES, because they point out very real weaknesses in the usual forced climate change arguments.
ANY REAL DISCUSSION of any serious issue NEEDS gadflys of the Fernando sort, because they help keep the political aspects of the discussion honest.
EVERYBODY in this forum ought to know by now that I am a firm believer in forced climate change which will mostly manifest as warming and that I am a pedal to the metal renewables and efficiency advocate.
But the simple goddamned TRUTH is that the environmental movement as a whole tends to gloss over or totally ignore some TRULY PERTINENT FACTS- the most important such fact being that fossil fuels DEPLETE.
Now a hell of a lot of people are perfectly willing to wink and accept such lies by omission if they agree with the overall goals of the people who tell them.
But there are also PLENTY of good reasons to make sure the ENTIRE truth gets out.
For example, I personally think a hot WWIII brought on by resource wars, with the KEY short supply resource being oil, might very well finish us off before we NEED to worry much about climate change, considering all that might be left of us could be a few bones glowing in the dark. ( not literally )
I am not talking about oil being short enough to fight WWIII as a consequence in the VERY NEAR future, but ten or twenty years down the road ? We just don’t have any way of knowing for sure.
Dennis and Ron Patterson might not think of themselves as climate change gadflies, but insofar as THINKING and WELL INFORMED people are concerned, THEY ARE GADFLIES, because they point out very real weaknesses in the usual forced climate change arguments.
Hi Old Farmer Mac,
As I said above. Using all caps for emphasis is probably what causes the spam filter to catch your comments.
It may take longer to use italics, but once you get used to it, it is not that hard, also as I mentioned all caps is considered shouting (on the web) and is impolite 🙂
I’m familiar with those arguments which all seem to underrate the affect of atmospheric moistening. Of course we all know that climate warms from burning of fossil fuels but the concentration of water vapor will (is) also increase in response to that warming. Moistening of atmosphere (especially in the upper troposphere), in turn, absorbs heat and further raises the Earth’s temperature. Methane, as you have alluded to, is a big unknown. The biggest mystery to me Dennis is how you project your big fat tails so far into the future, on one hand, and then presume that decreases in fossil fuel burning will somehow save us from catastrophic warming. Water vapour is the most dominant greenhouse gas. Water vapour is also the dominant positive feedback in our climate system and amplifies warming caused by changes in atmospheric CO2. This feedback is why climate is so sensitive to CO2 warming.I confess to being an armchair observer on this.
Hi Doug,
The equilibrium climate sensitivity takes into account the increased water vapor in the atmosphere as it is the main mechanism that results in warming due to increased levels of atmospheric CO2.
Fernando as repeatedly pointed out that the RCP8.5 scenario is nonsense if one accepts the limited fossil fuel resources that are likely to be extracted. I agree with that point.
Some people do not realize that most of the atmospheric carbon dioxide will remain in the atmosphere for many centuries (tens of thousands of years to reduce the level by half) if only natural processes remove it from the atmosphere, so that fat tail of carbon I am well aware of having read a lot of David Archer’s work on this subject.
In a fossil fuel scenario I have created using reasonable estimates of coal, natural gas, and oil and estimated land use change and cement production and natural gas flaring, there are 1200 Gt of carbon emissions (not CO2) and using a modified Bern Model I get about 520 ppm of CO2 for a maximum in about 2100.
If ECS is 3C for a doubling of CO2, because the effect is logarithmic that would be ln(2) or 0.693 for an atmospheric CO2 of 560 ppm, in my scenario we would have ln(520/280)=0.619. Using basic algebra we have
x=3*0.619/0.693=2.68 C.
I know that you know all this, this is for those who know less Math and Science than you.
I am not sure why you are arguing as I said this is a problem, any thing above 2 C is a problem in my view, and 1 C would be better still (though not very realistic).
A rapid transition away from fossil fuels is needed so we “only” emit 1000 billion tons of carbon from fossil fuels, cement production and land use change. Even this might be too much if the ECS estimate of 3C turns out to be too low (maybe it is 3.5C rather than the 2.5C or less that Fernando favors).
The folks at Real Climate think the methane story is overblown, but they (and I agree with them) think climate change may be a serious problem.
Short story, I agree with you.
Hi Doug,
It also occurred to me that Gavin Schmidt is one of the lead scientists developing the GISS models. I am fairly confident that he is aware of the effect of water vapor in climate change.
In the Real Climate post linked below Schmidt and Mann say the GISS E2-R model has an equilibrium climate sensitivity (ECS) of about 2.33 C (2.1/0.9 if you read the whole post).
http://www.realclimate.org/index.php/archives/2014/01/a-bit-more-sensitive/
The main point of the post is that some research suggests the models with ECS of about 4C give more realistic results, much of the difference in the models has to do with how they deal with clouds which is an area of great uncertainty in climate science.
Another interesting aspect is that it takes a long time for the system to reach “equilibrium” temperatures. See
http://www.gfdl.noaa.gov/blog/isaac-held/2011/03/19/time-dependent-climate-sensitivity/
For a model with an ECS of about 3.2C,it would take about 200 to 300 years to reach 2 C after atmospheric CO2 doubles (560 ppm). This is largely due to the time it takes to warm the ocean (with a mixing time on the order of 400 years).
Again my point is not that climate change is not a problem, only to point out that the “fast” climate responses are fast only in geological terms. By human standards the climate will change relatively slowly.
After 600 years the system has still not reached equilibrium temperature (temperature has risen to 2.7 C over pre-industrial for atmospheric CO2 doubling to a maximum of 560 ppm).
If we assume only 1200 Gt of carbon are emitted (due to fossil fuel depletion) and atmospheric CO2 reaches 510 ppm rather than 560 ppm, then the temperature would rise to 2.4C above pre-industrial (before 1750) Holocene average temperatures (roughly the year 2700). This is if the ECS is about 3.2C, using Isaac Held’s data from the link above and assuming the response to atmospheric carbon dioxide levels is logarithmic.
By human standards the climate will change relatively slowly.
Perhaps for those humans who live in shopping malls and office buildings… out in the real world the signs are already evident everywhere. Go talk to some ecologists!
Hi Fred,
I don’t know that it was an April Fool’s post. Did you read the post? Lambda is actually used in these equations, if you follow the links in the post it is referring to a real conference, that Schmidt thought was important.
Do you think that all problems in climate science have been solved? I can’t imagine you would.
Hi,
The post above I put in the wrong place.
Yes the temperature has increased rapidly compared to most of history, on that point we agree. The value of the climate sensitivity is not known with precision, if it is 4C it is certainly a bigger problem than if it is 2 C.
In fact the uncertainty is a big reason we should be cautious.
Another major positive feedback;
“What does a climate catastrophe look like in a real world context? Since September, daily emissions from Indonesia’s fires exceeded daily emissions from the entire U.S. economy on 26 days. To put it into perspective, the U.S. economy is 20 times larger than Indonesia’s. Van der Werf pointed out in a recent report that emissions from these fires over a three-week period are also already higher than the total annual CO2 emissions of Germany.”
http://www.wri.org/blog/2015/10/indonesia’s-fire-outbreaks-producing-more-daily-emissions-entire-us-economy
There is an estimated 1.2 to 1.6 degree increase already baked into AGW due to the 10 to 40 year lag time in warming. That plus there is an estimated 1.3 degree temp increase that can happen if we were to loose our umbrella known as Global Dimming. Odds are we are already past the tipping point so all planing needs to be from that perspective not the perspective that we have a certain time frame or carbon budget.
What should we do you ask? LESS!!!!
Hi Jef,
The research I have read says that 1000 billion tonnes of carbon emissions will keep us at 2C or below if the ECS is 3C. This does not include earth system feedbacks, but not all climate scientists agree with the 6C estimate by Hansen and the Earth system effects will happen over thousands of years, the focus should b on the ECS (equilibrium climate sensitivity) or the transient climate response (TCR).
Using current CO2 levels we have 1.57C of warming above pre-industrial baked in if the ECS is 3C. So if the current estimate of 1 C above pre-industrial is correct we have another 0.57 C of warming coming. The “aerosol effect” from Chinese pollution may or may not be significant, further research is needed on this as clouds and aerosols and their interaction is an area of active research with a great deal of uncertainty.
If you think we should be cautious and emit less carbon rather than more, I agree. I do not think it prudent to overstate the case.
Dennis – Not sure why you so easily dismiss the other top 3 or 4 greenhouse gases that are increasing and in fact nearing the hockey stick stage of exponential growth without any logical, physical reason for them to peak or decline.
Also aerosols are a global issue. China might be the biggest emitter but India is massive and in fact just about every Country is adding to global dimming. The science is much better understood than you seem to think and has been for a long time now.
To my knowledge there is nothing I have said or any others for that matter that is overstating anything AGW related, in fact the opposite is true.
Understating the urgency is the #1 reason that we are so screwed.
Hi Jef,
Read the following post from Real Climate, there is much work to be done.
http://www.realclimate.org/index.php/archives/2015/04/reflections-on-ringberg/
I am not disputing the science that is well understood. I am making claims that can be substantiated. The other gases are much less important than CO2, note how the levels are in parts per billion and at least for methane its residence time in the atmosphere is very short relative to CO2 so its effect over the long term is far less significant.
For a main stream climate scientist’s (David Archer) take on methane see
http://www.realclimate.org/index.php/archives/2013/11/arctic-and-american-methane-in-context/
Also note that if you believe that fossil fuels will peak, then scenarios that assume atmospheric CO2 will rise to 4x pre-industrial levels (1120 ppm) are to be ignored. We will not extract enough fossil fuel to accomplish that feat (though Michael Lynch may believe that we will).
Dennis,
I think there’s a risk here that needs to be included: “pedal to the metal” burning of fossil fuels.
I agree that the models you’ve presented of oil and other FF consumption are likely. But, they’re not geologically determined. The current curve of FF consumption and renewable/efficiency development is partly the result of public policy, which takes pollution, climate change and supply security into account. The current curve of coal consumption is largely the result of competition from cheaper energy, including cheaper gas and wind power.
The curves developed by Rutledge, Mohr, et al are descriptive – they’re not determined by geology. The obvious counter example to a simple HL projection for is the recent experience of the US: when prices rose, the US peak was revealed as not a simple geological fact, but as also strongly affected by pricing. And the clear counter example to a simple HL projection for coal is the large amounts of coal in the Illinois Basin (about 190 billion tons) which are not being burned because of relatively minor differences in cost vs sub-bituminous Powder River coal due to sulfur content.
Why is this important? Because we can’t depend on geology to take care of Climate Change. We can’t accept arguments like -“it’s not important….there’s not that much FF. So, just leave us poor drillers alone to Drill, Baby Drill!”.
Hi Nick,
So you think that there will be no peak in fossil fuel output?
How much is extracted is determined by two main factors, geology and economics. When the cheaper resources are extracted, what is left? More expensive resources. As the price of fossil fuel rises other energy resources will be developed. The total resource in place will not be extracted. Coal reserve estimates have continually been declining. I agree that it should not all be burned, higher process will prevent that from occurring.
think that there will be no peak in fossil fuel output?
Of course that’s not what I’m saying.
When the cheaper resources are extracted, what is left? More expensive resources.
Yes, but the increase in cost may be small, and/or due to government regulation (which could change). The obvious example is Illinois Basin Coal. There’s 190B tons of high sulfur coal which is denser and closer to consumers. It’s production is declining only because of regulation which imposes a cost penalty of about 2 cents per kWh.
I think most Illinois Basin coal is likely to stay in the ground. Eventually it’s reserves will be considered not economically recoverable, and no longer be counted as reserves.
But, forcing producers to deal with external pollution costs is a political decision. That’s something that Peabody Coal and the Koch brothers understand very, very well. They’re fighting pollution regulation every inch of the way. They’re trying to elect presidential candidates who would roll back pollution regulation dramatically.
So, we can’t just let down our guard, and assume geology will solve our problems.
Right?
Hi Nick,
The supply of low sulfur coal is probably ample for a decade or two or three yet, but if times are hard, and I for one expect times to be hard in MANY countries, then it seems likely high sulfur coal will be burnt, and gladly, given the choice between affordable and otherwise unaffordable electricity.
The use of high sulfur coal would be ESPECIALLY tempting in any country with domestic supplies of it.I will even go so far as to say the temptation might very well be irresistible . 🙁
Of course we can hope that renewables and conservation come along fast enough to allow us to leave coal before coal leaves us.
I am with you all the way concerning the kochbros agenda.
Hi Nick,
When fossil fuels peak, you expect that the rise in fossil fuel prices will be small?
I again am reminded of cornucopian arguments that just in time technological development will save the day.
Do you expect that the clean air act will be repealed? I do not.
In most cases, new wind power is cheaper than new coal power, so wind with natural gas backup until widely dispersed wind and solar can reduce the natural gas backup needed to 1% of total power consumed.
Other developing countries will hopefully learn from the Chinese experience that coal is not a great option and will choose wind, solar, and nuclear with a little natural gas backup. The high price of coal once peak coal is reached an hopefully with appropriate carbon taxes on all fossil fuels will help speed the transition.
Basically I agree with the idea that we should work toward moving as quickly away from fossil fuels as possible.
I just don’t agree that scenarios of “business as usual” that are highly unlikely (emitting 2000 Gt of carbon, when any more than 1400 Gt is not likely), are useful. As I have said, Michael Lynch and a couple of other people think such scenarios are likely, but they are wrong.
When fossil fuels peak, you expect that the rise in fossil fuel prices will be small?
Well, there are several questions:
When will FF peak?
When will FF supplies peak?
When will FF demand peak?
When will coal peak?
Look at the US – coal prices are declining, and reserves are being abandoned. The US could easily reach (and sustain for a long time) coal production levels 50% higher than it’s peak several years back. But, production may never even match it’s historical peak, not because of a supply problem, but rather a demand problem.
Right??
That’s the problem with Rutledge and Mohr’s analysis: declining production and prices are very often not due to declining resource quality or supply problems. In both the US and the UK, this is definitely the case: production peaked and declined primarily due to declining demand, not declining resources.
I just don’t agree that scenarios of “business as usual” that are highly unlikely (emitting 2000 Gt of carbon, when any more than 1400 Gt is not likely), are useful.
I think I agree.
But, not because those scenarios are impossible. That’s a key point: people like Fernando will say: ” we don’t need to worry about Climate Change, because geological limits prevent the high level scenarios”. That’s incorrect: it’s current public policy (combined with cheap Natural Gas and falling costs for wind & solar power) that make those scenarios unlikely.
Hi Mac,
Yes, I agree. In many cases the problem will come down to ineffective and corrupt government. For instance, India has failed to take advantage of wind and solar power, and is planning to build lots of coal plants, despite the enormous public health costs that will force on their citizens.
Hi Nick,
Mohr’s analysis is an analysis of supply and demand, and it seems from your comment you have read no more than a summary.
I will try yet again, it is never a question of supply or demand by themselves, it is the intersection of the two that is important.
As Supply is equal to demand, the peak in supply is also the peak of demand at the oil price where these meet when output is at its maximum.
Public policy is great and can improve outcomes especially for negative externalities such as air, water, and carbon pollution.
World coal will probably peak in 2020 to 2030, the price of coal will rise and much will be left in the ground due to demand for coal falling at the higher level of prices, this is what Rutledge’s work shows for coal, he does not have an explicit demand model (Mohr does), but because the amount of coal produced is determined in part by demand, a demand curve is implicit in the analysis.
Mohr’s analysis is an analysis of supply and demand, and it seems from your comment you have read no more than a summary.
Well, I looked into the reserve and cost detail for areas with which I was familiar, the US in particular, and his data appeared to be the same misleading data I’ve seen in other analyses, like those of Rutledge and the Energy Watch Group. For example, it appeared to assume that the Illinois Basin was declining due to classic supply limits, rather than small differences in pollution-related costs.
Have you looked to see if the Illinois Basin coal is included properly?
Hi Nick,
No I have not looked into the Illinois coal deposit. Do you expect that the clean air act will be repealed?
I think your belief in the power of the Koch brothers may be a little over the top.
You have claimed (correctly I believe) on many occasions that new wind (and the wind resource near Illinois is very large) is cheaper than new coal. Do you expect this to change?
You keep saying things are not “geologically determined”. Have you noticed that it is only you that is suggesting this is relevant? The actual amount of a good supplied is determined by both supply and demand. This is Econ 101, not hard stuff at all. Right?
No I have not looked into the Illinois coal deposit.
I’m choosing this as an example of a clear error, which indicates a larger problem with the whole reserve database: The US URR is only 129Gt (page 61). That’s less than 2/3 of what’s left in the Illinois Basin. It’s clearly very unrealistic.
Do you expect that the clean air act will be repealed?
1st: have you listened to candidates like Rubio??
2nd: this is a world estimate. China and India are building very dirty plants, which are indeed likely to be much cheaper than current US plants which have to scrub sulfur, mercury, etc.
I think your belief in the power of the Koch brothers may be a little over the top.
I hope you’re right. And, of course, the Koch brothers are not alone. But…they and their allies have had incredible influence over US politics. I can give more info if you’d like.
You have claimed (correctly I believe) on many occasions that new wind (and the wind resource near Illinois is very large) is cheaper than new coal. Do you expect this to change?
That’s for the US. I think that China is moving towards forcing newer coal plants to be somewhat cleaner, but….that’s a political process. Which is the whole point: it’s politics, not geology.
You keep saying things are not “geologically determined”. Have you noticed that it is only you that is suggesting this is relevant?
Many, perhaps most, people in the environmental movement know this very, very well. It seems to be in “peak” circles that it’s not so clear.
The actual amount of a good supplied is determined by both supply and demand. This is Econ 101, not hard stuff at all. Right?
You’d think. I haven’t been able to find a clear “supply curve”, with various URRs based on market price, anywhere in Mohr’s thesis. Can you help me find one?
Hi Nick,
The typical way these models are done is that the supply that is technically pssible to produce is determined and the demand is primarily a function of economic growth, price simply adjusts so that supply is equal to demand. Nobody can predict future prices, but it is assumed based on past technological progress and past trends in economic growth that better estimates can be made for future technological progress (which determines the technically recoverable resources) and future economic growth which determines future energy demand.
Note the EIA estimates 37 billion tons of recoverable coal resources in Illinois not 100 billion tons. For the US Mohr uses Hubbert Linearization to estimate coal resources, as always this is likely to be a minimum estimate, I think for the US it is likely to be close to the correct estimate.
Coal resource estimates in general are not very good, and tend to be skewed toward the high side. In the case of coal Hubbert Linearization will probably be pretty close.
Note that for the World estimate Mohr has 960 Gt as his best guess where the World estimate using Hubbert Linearization(HL) is 700 Gt (so his best guess is 37% higher than given by HL.
Read the following post from Real Climate, there is much work to be done.
Ehem… You did notice that was posted on April 1st, right? And that the stability of the basic ‘energy balance’ equation (ΔN = ΔF-λΔTs) that defines the sensitivity, , to zeroth order; and the challenge of estimating cloud feedbacks from process-based understanding, contains a variable (Lamb Duh) which is a reference to a previous April fools post titled Sheep Albedo Feedback…
Yes, there is much work to be done 🙂 🙂 🙂
Hi Fred,
The post was about this conference.
http://www.mpimet.mpg.de/en/science/the-atmosphere-in-the-earth-system/ringberg-workshop/ringberg-2014.html
I am pretty sure it being posted on April 1st was an unfortunate coincidence.
See equation 1 in the following paper
http://www.mpimet.mpg.de/fileadmin/atmosphaere/WCRP_Grand_Challenge_Workshop/Ringberg_2015/Ringberg2015_Final_WEB.pdf
lambda is used all the time in these discussions.
I am pretty sure it being posted on April 1st was an unfortunate coincidence.
Looks like you maybe right. When I followed the link I saw the posting date and most of the comments were about this:
http://www.realclimate.org/index.php/archives/2007/04/the-sheep-albedo-feedbacki/
So I didn’t even bother to read the rest.
Hi Fred,
I pay less attention to the comments and I am more interested in what Gavin Schmidt has to say, he has forgotten more about climate science than I will ever know.
Excerpts from several articles in Bloomberg and Reuters:
Saudi Vice Oil Minister Sees Price Surge After Cutbacks
http://www.bloomberg.com/news/articles/2015-11-09/oil-investment-cuts-at-200-billion-as-saudi-prince-sees-rally
The scale of the global oil and gas industry’s spending cuts are making another surge in energy prices possible by diminishing future supply, Saudi Vice Minister of Petroleum & Mineral Resources Prince Abdulaziz bin Salman said.
Investments have been cut by $200 billion this year and will drop another 3 percent to 8 percent next year, marking the first time since the mid 1980s that industry cut the spending for two consecutive years, Prince Abdulaziz said in a copy of his speech for delivery to energy ministers in Doha Monday. Nearly 5 million barrels a day of projects have been deferred or canceled, he said in the remarks.
Just like high oil prices can’t last, a prolonged period of low prices is “also unsustainable, as it will induce large investment cuts and reduce the resilience of the oil industry, undermining the future security of supply and setting the scene for another sharp price rise,” the prince said in the remarks. “As a responsible and reliable producer with long-term horizon, the kingdom is committed to continue to invest in its oil and gas sector, despite the drop in the oil price.”
Oil demand is expected to be 94 million barrels a day this year, rising 1.5 percent from last year, with about 2 million barrels a day of spare capacity, mainly held in Saudi Arabia, the prince said. Growth in Asia’s demand may slow “by efforts to efficiency enhancement and oil substitution,” he said.
“But the petroleum industry should not lose sight of the fact that scale matters,” with billions of people moving up into the middle class, the prince said. The size of the world’s middle class will expand from 1.8 billion to 3.2 billion in 2020, and to 4.9 billion in 2030, with the bulk of this expansion occurring in Asia, he said.
“Rather than being a commodity in decline, as some would like to portray, supply and demand patterns indicate that the long-term fundamentals of the oil complex remain robust.”
—————————————————————————
OPEC’s Badri says oil market to be more balanced in 2016
Nov 9, 2015
http://www.reuters.com/article/2015/11/09/us-asia-energy-opec-idUSKCN0SY0TN20151109
The oil market is expected to become more balanced in 2016 as demand continues to grow, OPEC Secretary-General Abdullah al-Badri said on Monday ahead of the producer group’s policy meeting next month.
“The expectation is that the market will return to more balance in 2016,” he said in a speech at an Asian ministerial energy roundtable in the Qatari capital Doha.
“We see global oil demand maintaining its recent healthy growth. We see less non-OPEC supply. And we see an increase in the demand for OPEC crude,” Badri said, according to the text of the speech published on the OPEC website.
Most of the oil supply increases in recent years have come from high-cost production, Badri said, in a clear reference to supply sources such as U.S. shale oil.
“The market is now taking on board this new reality and gradually resetting itself, as we can see with falling non-OPEC supply growth and stronger demand,” he said.
————————————————————————————
Yergin Joins OPEC in Seeing Market Balanced as Soon as 2016
http://www.bloomberg.com/news/articles/2015-11-09/yergin-joins-opec-in-seeing-oil-market-balanced-as-soon-as-2016
Global demand for crude will bring more balance to the oil market as soon as next year, according to Pulitzer Prize-winning author and energy consultant Daniel Yergin and OPEC Secretary General Abdalla El-Badri.
The oil market will rebalance in 2016 or 2017, as demand grows between 1.2 million barrels per day and 1.5 million barrel per days through 2020, Yergin, vice chairman of consultants IHS, said in a speech in Abu Dhabi. Demand will rise by about 17 million barrels a day to almost 110 million barrels a day by 2040, with 70 percent of the growth to come from Asia, the head of the Organization of Petroleum Exporting Countries said at an event in Doha.
“The next few quarters are going to continue to be tough as Iranian oil comes back into the market,” Yergin said Monday. “We really see 2016 as the year of transition.”
Current market volatility was caused by oversupply, mostly from high-cost producers, and oil stocks are above the five-year average, El-Badri said. Energy industry investment in exploration and production fell 20 percent, or by about $130 billion from 2014 to 2015, he said.
“The expectation is that the market will return to more balance in 2016,” El-Badri said Monday. “We see global oil demand maintaining its recent healthy growth. We see less non-OPEC supply. And we see an increase in the demand for OPEC crude.”
Oil prices are unsustainable at current levels and will rise gradually as international companies defer projects and production plans, United Arab Emirates Energy Minister Suhail Al Mazrouei told reporters .
“We have a vested interest to keep prices as stable as possible, but we cannot do that by reducing production,” Mazrouei said. “We expect the market will recover by itself because high-cost production will continue to decline.”
The U.S. is now the new swing producer of oil, with much room for efficiency gains, Yergin said. If U.S. law would allow it, the nation could be a major oil exporter by the end of decade, he said. Canada’s oil sands production will add more than 800,000 barrels a day by the decade’s end, and Iran will add 400,000 to 600,000 barrels a day to world markets within a few months of sanctions ending.
“The market will have to deal with a very significant overhang of inventories,” Yergin said. “There’s more volatility in this process.”
————————————————————–
Speculators Share Andy Hall’s Optimism That Oil Prices at Bottom
http://www.bloomberg.com/news/articles/2015-11-09/speculators-share-andy-hall-s-optimism-that-oil-prices-at-bottom
Andy Hall and Daniel Yergin think oil prices are bottoming out. Hedge funds agree.
Money managers’ net-long position in West Texas Intermediate crude rose 20 percent in the week ended Nov. 3, the most in seven months, according to data from the U.S. Commodity Futures Trading Commission. Bets on rising prices increased to the highest level since June.
U.S. onshore oil production fell for the fifth month in a row in August and supplies grew at the slowest pace since September in the week ended Oct. 30. Inventory data don’t indicate a surplus in the crude market and prices are set to rise, said Hall, one of the world’s best-known oil traders. Global supply and demand will begin to move into balance by late 2016 or 2017, according to Yergin.
“The fundamentals are starting to play out,” said David Pursell, a managing director at investment bank Tudor Pickering Holt & Co. in Houston. “You’ve got greater recognition that U.S. supply is falling and maybe falling faster. Inventories are building, but the pace of that build is more manageable.”
Onshore production excluding Alaska fell to 7.25 million barrels a day in August, down 334,000 barrels a day from March, according to Energy Information Administration data. U.S. oil inventories grew by 2.8 million barrels a day the week ended Oct. 30, the smallest gain since Sept. 18.
U.S. output will retreat by about 10 percent in the 12 months ending April, according to Yergin, vice chairman at IHS Inc..” Prices may rise to $70 to $80 a barrel by the end of the decade, he said in an interview.
Hall, the crude trader, said Saudi Arabia is producing close to capacity while Iraq is struggling to maintain output, while U.S. rig counts will continue to decline.
“We think the degree of negativity is unwarranted,” Hall, who runs $2.6 billion hedge fund Astenbeck Capital Management, said Nov. 4.
“The economy is on the rebound, China is coming out of a bear market, people are saying let’s get long oil,” said Carl Larry, head of oil and gas for Frost & Sullivan LP. “We’re near the bottom at $40, and there’s a potential upside that’s much higher.”
I just found this link and have not yet read it thru carefully, or read the additional links embedded within it.
But Slate writers are generally competent and this article has a LOT to say about a topic I brought up recently, namely the possibility that an extremely powerful solar flare IS A POSSIBILITY, that such a flare might actually not be all that rare an event, and that one sufficiently powerful could actually wipe out civilization as we know it by taking down the grid.If the whole effing grid goes down, it might simply be impossible to get it up again, within any time frame that would keep an industrial society from going mad mad.
http://www.slate.com/blogs/bad_astronomy/2015/11/09/solar_storms_new_evidence_that_the_sun_twice_erupted_violently_in_the_middle.html
The smog in China falls mainly between Shanghai and Beijing.
Deutsche Welle has a featured story on a study conducted by Berkeley Earth:
How smog is killing thousands daily in China
http://www.dw.com/en/how-smog-is-killing-thousands-daily-in-china/a-18653814
“Bad air contributes to 1.6 million deaths a year or roughly 17 percent of all deaths in China, according to a scientific paper recently published by independent research group Berkeley Earth. “For 38 percent of the population, the average air they breathe is ‘unhealthy’ by US standards,” said the authors of the paper, Richard Muller and Robert Rohde. Moreover, some 92 percent of China’s population experienced at least 120 hours of unhealthy air between April 5, 2014 and August 5, 2015, said the scientists.”
Early onset of apoptosis may be a result of severe air pollution.
More air pollution to help reduce the population of humans, not less so they live longer, is the answer!
More particulate matter in the atmosphere, not less! /sarc
OFM is not the only one who’s comment did not post. What happened to mine?
It’s up now.
WTH?
This came across my google news feed today…
“A BP official told the magazine that “energy resources are plentiful. Concerns over running out of oil and gas have disappeared.”
Things are so good, in fact, that Engineering and Technology says “with the use of the innovative technologies, available fossil fuel resources could increase from the current 2.9 trillion barrels of oil equivalent to 4.8 trillion by 2050, which is almost twice as much as the projected global demand.” That number could even reach 7.5 trillion barrels if technology and exploration techniques advance even faster.
This information backs up the idea that Earth is actually an oil-producing machine. We call energy sources such as crude oil and natural gas fossil fuels based on the assumption that they are the products of decaying organisms, maybe even dinosaurs themselves. But the label is a misnomer. Research from the last decade found that hydrocarbons are synthesized abiotically.
In other words, as Science magazine has reported, the “data imply that hydrocarbons are produced chemically” from carbon found in Earth’s mantle. Nature magazine calls the product of this process an “unexpected bounty ” of “natural gas and the building blocks of oil products.”
So don’t feel guilty about exploiting this “bounty.” There seems to be plenty to go around — and there will probably still be a lot left when technology, not hurried by government mandates and subsidies but guided by market forces, produces practical and affordable renewable energy.
But for now, enjoy our cheap, abundant and efficient “fossil” fuels.”
http://news.investors.com/blogs-capital-hill/110415-779176-we-are-not-running-out-of-oil-earth-produces-crude.htm
http://eandt.theiet.org/news/2015/nov/bp-global-oil-reserves.cfm
Can someone smarter than me please comment on this?
well, I doubt I am smarter than you, but this appears to me to be a big load of BS. I posted it because it appears to have reached mainstream reporting and BP is mentioned several ways.
No, I don’t claim to be smarter than you. But I will comment. If oil were produced abiotically, then the masses of hydrocarbons currently in the earth’s crust must have accumulated at a fairly slow rate over hundreds of millions of years, even a billion years or more, because otherwise, had they accumulated very rapidly, there would be so much hydrocarbon material in the planet that earth would be like Saturn’s moon Titan with whole oceans of methane and “rain”storms of hydrocarbon material showering down onto the planet surface. Clearly, then, IF THE THEORY OF ABIOTIC GENESIS OF HYDROCARBONS IS TRUE, the hydrocarbon in the Earth’s crust must have accumulated very slowly. And therefore the rate of genesis of hydrocarbons in the earth today will be far too slow to replace the hydrocarbons that humankind has extracted and burned over the past century and a half. Abiotic processes simply could not generate enough crude oil and natural gas to prevent the current rate of depletion of those fuels – so we would still have a Peak Oil crisis advancing upon us. But in fact, abiotic generation of hydrocarbons is just a nonsense dreamed up by neo cons and right wing economists with zero understanding of geology and an obsession with proving Malthus was talking out of his arse. It is they who are talking out of their arses.
This Mike is not the same Mike that used to post here but left a month or so ago.
Mike, the BP article was not about abiotic oil at all. BP does not believe oil is abiotic.
From the link:
Further advances in exploration and technology could help the resources soar up to 7.5 trillion barrels of oil or equivalent.
That’s a big truckload of bullshit.
Oil Discoveries Headed for New Low
The rate of new oil finds is on the decline, experts say.
A dismal rate of new oil discoveries may sink to new depths this year – one year after hitting a reported record low in 2013.
“It’s a big deal,” says Steven Kopits, managing director of Princeton Energy Advisors, a consulting firm. “The oil companies are pretty good at what they do and they have found a good chunk of what there is to find in the areas where they have access.”
So far this year, oil companies have discovered just 4.4 billion barrels of oil equivalents, Helge Lund, CEO of the Norwegian energy company Statoil, said last week, according to Reuters. And as global consumption of oil and other liquid fossil fuels has continued to climb – rising to about 33 billion barrels last year – the amount of new oil discovered in 2013 was only half that number, Reuters reported.
“It’s harder and harder to find oil in the conventional places using conventional methods, and so we’re going into tougher places with much more expensive technologies,” says James Hamilton, a professor of economics at the University of California-San Diego.
I tried to read the links included in the article about abiotic oil, and could not get any of them to work.Anybody else have luck?
Personally I am sure that oil is BIOTIC rather than aboitic and strongly suspect that anything in a publication such as NATURE or SCIENCE indicating otherwise has been quoted out of context.
But as our old friend ROCKMAN used to say, as a working oil man, he didn’t give a damn, so long as he could find oil, he had ready buyers for either sort, lol.
I apologize for posting this crap. Kerry Jackson appears to be an investment “guru”, climate denialist, shuck and jive huckster.
These people should be prosecuted.
Of course the liberal response would be to suggest prosecuting a person simply because his beliefs aren’t compatible with leftward thinking. That to me sounds like something straight out of North Korea. Fortunately with the United States being the land of the free and the home of the brave we have freedom of speech, which allows for all viewpoints to be welcomed anywhere.
Speaking of which, the gentleman in the Investor’s Business Daily article you posted is indeed on the right track, even if his views represent an inconvenience to your way of thinking. This is because the science about the origin of oil has indeed been changing dramatically over the last few years. A read of the current data presented in the crowd-sourced science journals will reveal that the idea oil is a fossil fuel has been abandoned by many who believe that oil is made by adiabatic processes arising from natural gas pools. Indeed, the very idea of oil being fossil in source in the first place came about due to the first commercial oil fields in Pennsylvania and Ohio being next to coal beds. However, this happened to be the only part of the world where that is true. Consequently, the whole concept of oil being fossil in origin began to fall apart when oil was discovered in diverse places all around the globe.
Wendell ,
Welcome to the forum and thank you SO MUCH for sharing your amazing ignorance with us, we all need a laugh once in a while.
It is obvious that you do not APPRECIATE the fact that virtually all of the the members of this forum are SCIENTIFICALLY LITERATE, where as you obviously are NOT.
It is probably fair to say that you know so little REAL science that you are not even capable of recognizing your own ignorance.
OFM: I have commented before about how impressed I am that regulars on this site give such a calm dignified and considerate response to the oddballs regularly appearing on this site with their one-off posts. Keep up the good work.
Oddballs?
Yeah, I’d say that someone who doesn’t know the difference between adiabatic and abiotic, at least on this forum, can legitimately be considered an oddball.
What exactly does the relationship, defined for an ideal gas, by the equation PV=nRT have to do with the production of oil?
Abiotic components are the non-living chemical and physical parts of the environment.
The fact that some methane or oil can be produced abiotically doesn’t in any way discredit the vast amount of available evidence that most of the oil, coal, and natural gas deposits on this planet are of ancient biological origin in the form of fossilized sunshine…
Denying this evidence is akin to being a flat earther and I find those people to be oddballs as well!
Well said Fred (as always). Perhaps if you were to apply for a small raise in pay your application would be favorably received.
LOL! Tks Doug.
Note to self: give yourself a raise.
Self to me: Your new business isn’t making any money yet, no raise for you! If you are lucky, there might be just enough petty cash for a beer. 🙂
Hi Wendell,
I agree that there should be free speech. There should also be the ability to prosecute people when that speech does harm to others. For example if I yell “fire” or “bomb” in a crowded venue so that a stampede ensues and scores of people are trampled to death, should I be prosecuted?
I am not a lawyer so perhaps such speech is protected.
Oldfarmermac:Shame on you to write such an uncivilized comment. What are your credentials? It is hard to tell since your comments, often rumbling along in great length, do not contain much valuable info apart from your personal preferences and ideas.
If the subject is OIL, my so called credentials are modest indeed. I have read a dozen books give or take, written by professionals in the field, the titles ranging from Simmon’s Twilight in the Desert to Yergin’s The Prize,etc, as well as following very carefully what is published in this forum and a couple of others that deal mostly with depleting natural resources. I read half a dozen or so REAL scientifically oriented publications.
I went to a “cow college” land grant university, where in my freshman year I took chemistry with the chemistry majors, calculus with the math majors, and biology with the biology majors, including all the labs, as well as the usual English lit class and another course or two.
It got harder after that.
So much for my own credentials.
I am the ONLY regular in this forum who refers to himself as a political conservative.
People like Wendell make me ashamed to be a conservative, as opposed to a stinking republican. Unfortunately just about every body who posts such foolishness as Wendell posted includes some additional remark indicating he is an utterly ignorant right wing true believing foot soldier who has swallowed the K brothers propaganda hook line and sinker.
Scientifically literate conservatives believe in forced climate change, overshoot, resource depletion etc etc.
Trolls like Wendell give ME a bad name.
He is probably a true believer foot soldier in the Koch Brothers army, unless he is merely a bot.
Dunning-Kruger alert?
I can’t think what it would be trolling for, so I guess D-K.
that the idea oil is a fossil fuel has been abandoned by many who believe that oil is made by adiabatic processes arising from natural gas pools.
LOL! That is the funniest thing I have read in a long time. However it finally explains why my SCUBA tanks are always full of hot oil after I fill them with compressed air…
the liberal response would be to suggest prosecuting a person simply because his beliefs aren’t compatible with leftward thinking.
The sensible comparison is to cigarette manufacturers, who knew their product killed millions of people, but concealed and lied about it.
Murder should be prosecuted.
Wait, are you really claiming that petroleum is abiotic? I really hope that this is sarcasm that has gone over my head.
Wendell,
What are crowd-sourced science journals? I’m curious; the term is new to me.
Can you name a few?
can’t find any crowd sourced science journals, but there is a wiki entry for citizen science…
https://en.wikipedia.org/wiki/Citizen_science
okey dokey so ,
“A BP official told the magazine that “energy resources are plentiful. Concerns over running out of oil and gas have disappeared.”
and
“”Thanks to investment into supercomputers, robotics and the use of chemicals to extract the maximum from available reservoirs, the accessible oil and gas reserves will almost double by 2050,” Engineering and Technology said.
”
nobody mentioned cheap
and havent we done this already ?
and “could” is not “can” or “will” ( as Ron has already pointed out )
Resource has not changed much , and maybe we could one day extract that oil, but then again at what price ?
At the right price we could ship in oil from Titan but I’m not betting that will sell well at the price asked .
Still daydreamer investors beware – caveat emptor …..
Forbin
Saudi Arabia will not stop pumping to boost oil prices
http://www.cnbc.com/2015/11/09/
“Mr Falih, who is also health minister, forecast the market would come into balance in the new year, and then demand would start to suck up inventories and storage on oil tankers. “Hopefully, however, there will be enough investment to meet the needs beyond 2017.”
Other officials also estimated that it would probably take one to two years for the market to clear up the oil market glut, allowing prices to recover towards $70-$80 a barrel.”
Chief, that link went dead, this might be right:
http://www.cnbc.com/2015/11/09/reuters-america-update-1-saudi-arabia-sees-robust-oil-fundamentals-as-rival-output-falls.html
From your link, bold mine:
“Non-OPEC supply is expected to fall in 2016, only one year after the deep cuts in investment,” he said.
“Beyond 2016, the fall in non-OPEC supply is likely to accelerate, as the cancellation and postponement of projects will start feeding into future supplies, and the impact of previous record investments on oil output starts to fade away.”
I thought just about everyone was expecting a rebound in production by 2017?
Hi Ron,
I think you are joking. I thought we might see a rebound if prices got above $75/b by 2016 at least from the LTO plays, but the deepwater stuff and arctic projects that have been put on hold will take much longer to react to a price increase. I have tended to underestimate the lag time between oil price moves and output. If the forecasts by OPEC and Yergin that have oil prices remaining below $70/b until 2018 are correct, then there will not be much of an oil rebound in 2017. At some point in the 4th quarter of 2015 we may see a bunch of LTO companies throw in the towel (or maybe in the first quarter of 2016), this may cause a steep drop in US output and the oil market may use up the oil in storage pretty quickly and oil prices might recover. Iranian output might rise to fill the gap from US output drops, Canadian output will also start to fall so there’s a lot of moving parts, very hard to predict what will happen in 2016, 2017 harder still. A lot depends on oil demand and the price of oil and I don’t really know what will happen to those.
Dennis, I never joke about these things. The EIA is expecting production to rebound next year, toward the end f 2016. I was not, and am not, expecting such a rebound but I was just quoting what the experts, (the EIA), was expecting.
Note: The new Short Term Energy Outlook is due out tomorrow, Tuesday November 10th, so we just might see a revision of these projections.
EIA Short Term Energy Outlook
Hi Ron and Dennis,
“I thought just about everyone was expecting a rebound in production by 2017?”
Correct me if I’m wrong, but don’t we have to have a reduction in production to have a rebound ? The Saudi’s and the Iraq’s seem to have more than offset any other world decline in the last 12 months. World demand seems to have continued it’s upward pace also. Couldn’t we be looking at $80 plus again going into the driving season of 2017 and a race to get American production back online before inventories drop dangerously low ?
https://www.iea.org/oilmarketreport/omrpublic/
My GUESS is that this current price is not sustainable going into next years driving season. Prices will break above this springs price of about $60 with inventories starting to decline during the spring and summer. At that point the future outlook changes a lot.
In 08 & 09, I was very heavily invested in independent refineries. My portfolio got the shit beat out of it. Every other day there was a story about which refinery was going BK or couldn’t finance the feedstock to keep the pumps turning. At one point, WNR was below $4 and VLO less than $14. Looking back, we find none of them closed their doors and they are all in the diver seat today with record profits. This is the nature of the oil business.
Oil demand increases maybe slowing, but it’s still growing. Keep me in the camp that we still haven’t seen peak. Future fuel economy savings and/or substitution will be the straw that brings peak oil because of regulation and/or high prices. Tverberg can take that to the bank, but she won’t.
Clearly the current low price isn’t sustainable and the world isn’t collapsing. But we could be in for a nasty war in the middle east.
Time will tell. If there is one thing we have learned over the last 10 years. There’s plenty of $100 oil in between those rocks.
Hi Chiefengineer,
There is less $100/b oil than many realize, this will become clear once oil reaches $100/b in 2017 and output struggles to meet demand, when we get to $150/b (2015$) in 2018 or 2019 and demand destruction struggles to balance the oil market and output is declining the mainstream media may start debating the “peak oil” question, by 2025 with oil at $170/b the “peak oil myth” will only be looked back at like the “spherical earth myth” from earlier times. Whether we can transition away from oil quickly enough to avoid a Great Depression in 2030 or so, I don’t know, not a bet I’d take.
The EIA is expecting production to rebound next year, toward the end f 2016.
http://www.investopedia.com/articles/investing/090715/us-becoming-more-energy-independent.asp
The US Is Becoming More Energy Independent
By Elvis Picardo, CFA | September 07, 2015 AAA |
America’s discovery of new oil supplies is creating profound changes in the global economy—most dramatically, a 55% plunge in crude oil prices that has roiled energy markets worldwide and reshaped the energy policies of several nations. Canada, the biggest source of US energy imports, has been forced to look for other overseas markets. India’s taken advantage of cheaper oil prices by slashing state subsidies for fuel and fertilizers. (See “Three currencies benefiting from lower oil prices”). At the same time, OPEC’s influence on global oil prices has waned.
GREATER ENERGY INDEPENDENCE
For decades, America consumed much more energy than it produced, importing oil to make up for the shortfall. That dynamic changed at the turn of the millennium and picked up steam in 2010 as high oil prices spurred technological innovations—most notably, the ability extract crude oil and gas from shale formations which had not been seen as economically viable.
LET THE GOOD TIMES ROLL! At least until the ability to extract crude oil and gas from shale formations is no longer seen as being economically viable!
And as we all know that could never ever happen, right?
Yikes!
Good thing there’s new adiabatic oil!
(This is not to be confused with ayurvedic!)
I think Mars has some too, and that’s why they are going there on a one-way trip to go and get some!
Hi Ron,
I thought you were poking fun at me. The EIA forecast for output does not look realistic if their forecast for oil prices is also correct.
Either oil prices will be higher than their forecast or output will be lower, perhaps a bit of both (somewhat higher oil prices and somewhat lower output).
Your guess would be at least as good (and probably better) than mine.
Ron,Dennis
The EIA. IEA. OPEC and most others expect non-OPEC production, excluding the U.S. and Canada to decline in 2016 and the next few years due to the decline in investments and postponement / canceling of new projects.
Production in Canada is still projected to continue to grow, but at a much slower rate than previously expected.
Finally, U.S. C+C production is expected to rebound in the second half of 2016 due to slightly higher oil prices ($55-57/bbl WTI). Also, U.S. NGL production proved much more resilient, than C+C, despite very low NGL prices.
Non-OPEC ex U.S. and Canada total liquids supply (mb/d)
Source: EIA STEO October 2015
Hi AlexS,
Thanks. I don’t think oil prices at $56/b is enough to increase the drilling in the LTO plays to the extent that output will increase, it may stop the decline and result in a plateau, it’s hard to know.
On the “liquids” forecast, the NGL is not adjusted for energy content as it should be, each barrel of NGL has only 70% of the energy content of an average C+C barrel and the every 10 barrels of NGL should be counted as 7 barrels so that the liquids are reported in barrels of oil equivalent (or better yet report the output in gigajoules (1E9) or exajoules(1E18)). The same conversion should be done for ethanol as well.
Dennis,
Note that not only the EIA, but also the IEA, OPEC, energy consultancies and investment banks are projecting a recovery in US oil production in the later part of next year.
That said, I agree with you that $56 WTI projected by the EIA may not be sufficient to trigger a fast rebound in drilling activity.
However there is also a backlog of drilled but uncompleted wells that could be completed and put into operation with slightly higher oil prices.
Most shale companies have announced further cuts in investment budgets in 2016, so I think it is difficult to expect significant growth in the U.S. onshore oil production in 2H16.
If and when oil prices reach $65-70/bbl, I think LTO may start to recover (probably in 2017 ?).
I think that annual growth rates will never reach 1mb/d+ seen in 2012-14, but 0.5 mb/d annual average growth is quite possible for several years with oil prices exceeding $70.
Hi AlexS,
I agree. Excellent point on the frack log, but at some point with the reduced rate of drilling the frack log will dwindle. Let’s take the Bakken where we have the best numbers, Enno estimates around 800 DUC wells (rough guess from memory), to make things simple let’s assume no more wells are drilled because prices are so low. If 80 wells per month are completed the DUCs are gone in July 2016. Now the no wells drilled is probably not realistic. If 40 wells per month are drilled (though at these oil prices I still don’t understand why) the 800 DUCs would last for 20 months rather than only 10 months, so your story makes sense at least for the Bakken.
I have no idea what the frack log looks like for the Eagle Ford. If its similar to the Bakken and they complete 130 new wells per month, with about 61 oil rigs currently turning in the EF they can drill 80 wells per month, so they would need 50 wells each month from the frack log. If there are 800 DUCs, then that would last for 16 months.
The economics are better in the Eagle Ford because the wells are cheaper and transport costs are lower, but the EUR of the wells is also lower (230 kb vs 336 kb), the well profile has a thinner tail than the Bakken wells. I am not too confident about the EIA’s DPR predictions for the Eagle Ford, output will decrease, but perhaps they(EIA) assume the frack log is zero and that only 75 new wells will be added to the Eagle Ford each month. If my guess of 150 new wells per month on average from Sept to Dec 2015 is correct, then decline from August to Dec 204 will only be about 100 kb/d and 255 kb/d from March to Dec 2015 (155 kb/d from March to August 2015).
Dennis,
One thing to be careful with the fracklog, is that not all of these will be good wells. It is fair enough that companies like EOG will have some good DUCs, (should there be a “k” in that?) in their fracklogs. But as the fracklog is worked through, I am sure there will be a some very ugly DUCklings, that nobody wants to admit to.
How many fall into this category, will be anybodies guess, but not all DUC, will turn out to be beautiful swans?
Hi Toolpush,
Excellent point. The best ducks will be cooked first 😉
I am not an oil man, can you tell which wells will be best before they start to flow? I would think this would be kind of random, but as I said I am very far from being an expert.
Hi AlexS,
On the predictions of the EIA and IEA, they also expect total oil supply to be quite high in 2040.
For example the EIA in their International Energy Outlook reference case they have C+C output at 99 Mb/d in 2040.
Their short term forecasts are probably better than that, but my expectation for 2040 C+C output is 62 Mb/d (which many believe is seriously optimistic, though you have never expressed an opinion as far as I remember).
So I take many of these forecasts with a grain of salt, they are often more optimistic than me, others are far more pessimistic, the middle ground is sometimes more realistic.
Dennis,
You said above that estimated URR of all global C+C (ex oil sands in Canada and Venezuela) is 2500 Gb. And about 1250 Gb of C+C had been produced at the end of 2014. So the remaining resources are 1250 Gb.
BP estimates total global proved oil reserves as of 2014 at 1700 Gb, or 1313 excluding Canadian oil sands and Venezuela’s extra heavy oil. Their estimate in 2000 was 1301 Gb and 1126 Gb. Hence, despite cumulative production of 419 Gb in 2001-2014, proved reserves increased by 187 Gb, or 400 Gb including oil sands and Venezuela’s Orinoco oil. Note that BP’s estimate is for proved (not P+P) reserves, but it includes C+C+NGLs. My very rough guess is that NGLs account for between 5% and 10% of the total.
You may be skeptical about BP’s estimates, but the fact is that proved reserves or 2P resources are not a constant number; they are increasing due to new discoveries and technological advances.
BTW, the EIA’s estimate of global C+C production increasing from 79 mb/d in 2014 to 99 mb/d in 2040 implies a cumulative output of 836 Gb, about 2/3 of your estimate of remaining 2P resources of C+C or BP’s estimate of the current proved reserves. Given future discoveries and improvements in technology, I think that further growth of global oil production to about 100 mb/d by 2040 should not be constrained by resource scarcity.
What can really make the EIA’s and IEA’s estimates too optimistic is not the depleting resource base, but the high cost of future supply, political factors and/or lower than expected demand.
,
Hi AlexS,
Thanks.
You are quite optimistic.
Note that I add 300 Gb to the 2500 Gb Hubbert Linearization estimate to account for reserve growth and discoveries.
The oil reserves reported in the BP Statistical review are 1312 Gb. Jean Laherrere estimates that about 300 Gb of OPEC reserves are “political” to keep quotas at appropriate levels with respect to “true” reserve levels. So the actual 2P reserves are likely to be 1010 Gb. Some of the cumulative C+C output is extra heavy oil so the cumulative C+C-XH output is 1240 Gb so we have a total cumulative discovery (cumulative output plus 2P reserves) of 2250 Gb through 2014.
My medium scenario with a URR of 2800 Gb of C+C-XH plus 600 Gb of XH oil (3400 Gb total C+C) assumes 550 Gb of discoveries plus reserve growth.
What do you expect for a URR for C+C?
Keep in mind that at some point oil prices rise to a level that substitutes for much of present oil use will become competitive, so oil prices above $175/b (in 2015$) are unlikely to be sustained in my view.
In a wider format below I will present a scenario with what extraction rates would be needed for my medium scenario to reach 99 Mb/d in 2040.
Comment at
http://peakoilbarrel.com/worldwide-rig-count-dropping-again/comment-page-1/#comment-546026
Hi Alex S,
I agree that high cost will be likely to reduce demand. The optimistic forecasts assume there will be low cost supply judging by the price scenarios. For AEO 2013 Brent remains under $110/b (2013$) until 2031 and only reaches $141/b (2013$) in 2040.
Depleting resources will raise production cost to more than these prices and demand will be reduced due to high oil prices.
There will be an interaction between depletion and the economics of supply and demand. It will be depletion that raises costs, which will raise prices and reduce demand.
It will be depletion of low-cost reserves that raises marginal costs and prices.
High-cost reserves may be abundant, but prices will rise.
Hi AlexS,
The High cost oil will never run out, it will remain in the ground. I am focusing on recoverable resources that can be produced and sold at a profit. I am often wrong on oil prices, but I doubt a lot of oil will be produced at $200/b (in 2015$).
corrected chart:
Oil Industry Needs Half a Trillion Dollars to Endure Price Slump
http://www.bloomberg.com/news/articles/2015-08-26/oil-industry-needs-to-find-half-a-trillion-dollars-to-survive
“Debt repayments will increase for the rest of the decade, with $72 billion maturing this year, about $85 billion in 2016 and $129 billion in 2017, according to BMI Research. About $550 billion in bonds and loans are due for repayment over the next five years.
U.S. drillers account for 20 percent of the debt due in 2015, Chinese companies rank second with 12 percent and U.K. producers represent 9 percent.”
[These are just the bonds that have yields higher than 10%]
[Its very unlikely that prices will recover in time to save many of the drillers, and even if prices recover, even $75 oil will not help since they need $90 to break even to service the debt. Also not sure who is going to buy maturing debt so it can be rolled over. Even if prices slowly recover, there is likely to be fewer people willing to loan money drillers.]
Don’t bet on it.
Probably be even better if the price declines more. Apocalypse will not be permitted.
I couldn’t find it, but there was a post in a previous thread about a gas pipeline in West Texas that was to move nat gas to Mexico.
Trouble brewing for Trans-Pecos?
http://www.truth-out.org/news/item/33551-while-keystone-xl-is-stalled-battle-against-larger-texas-pipeline-intensifies
I expect the pipeline will be built in short order. Truthout is a 75 % nonsense left wing website.
Fernando dismisses Schneiderman as an ambulance chaser, but….
“Last week the New York state attorney general announced an investigation into the climate change statements and policies of Exxon Mobil. Attorney General Eric Schneiderman issued a broad subpoena to the world’s largest private-sector oil company, seeking to discover whether Exxon Mobil misled the public and investors with statements that contradicted its own internal research on climate change. The investigation represents the clearest signal yet that fossil fuel companies may yet have to come clean on their long and well-funded history of obfuscation and outright mendacity on the science of climate change.
In a separate but releated case, Schneiderman’s office also announced a settlement with Peabody Energy, the largest publicly traded coal company in the world, after a two-year investigation that found that Peabody’s climate change denial program had “violated New York laws prohibiting false and misleading conduct in the company’s statements to the public and investors.” As part of the settlement, Peabody will revise its past disclosures to affirm that “concerns about the environmental impacts of coal combustion … could significantly affect demand for our products or our securities.””
http://www.technologyreview.com/view/543266/how-fossil-fuel-executives-fooled-themselves-on-climate-change/
Peabody Coal case press release
http://www.ag.ny.gov/press-release/ag-schneiderman-secures-unprecedented-agreement-peabody-energy-end-misleading
This seems to be building….
http://www.csmonitor.com/Business/2015/1109/Did-ExxonMobil-commit-securities-fraud-by-denying-climate-change
I limit my comments to the ExxonMobil subpoena by the ambulance chaser from NY.
In the new Drilling Productivity Report, the EIA cut its estimate for the Bakken oil production by 18-28 kb/d from March to November compared with the DPR issued in October.
According to the EIA, month-on-months declines are gradually accelerating:
August: -16
September: -20
October: -21
November: -23
December: -27
Bakken oil production estimates: EIA DPR Nov 2015, Oct 2015 (Bakken ND+MT) vs. NDIC (Bakken ND)
Estimates for the Eagle Ford were also revised down by 10-12 kb/d from March to November
The EIA DPR still predicts a much steeper oil production decline in the Eagle Ford (-436 kb/d between March and December) compared with the Bakken (-114 kb/d)
They have total shale production down 118,000 bpd in December and Eagle Ford down 78,000 bpd in December.
Oil production in the Permian basin continues to rise, but in the new DPR estimates for July-November were revised down by 10-23 kb/d
Combined oil production from 7 shale plays is expected to decline by 558 kb/d, from 5507 kb/d in April to 4949 (these numbers include ~800-900 kb/d of conventional production, mainly from the Permian basin).
New combined estimates for 7 plays were revised down by about 25-35 kb/d from March to May, and by 40-50 kb/d from June to December.
The Eagle Ford accounts for 78% of the total oil production decline in 7 shale plays from April to December.
Interestingly, despite a relatively stable and even increasing oil rig count in the past 8 months, oil production in Niobrara is expected to decline by 125 kb/d between April and December. In percent terms (-26.0%) this decline is even slightly faster than in the Eagle Ford (-25,4%). For comparison, The EIA DPR projects Bakken oil production to decline by 9%, in the Permian to increase by 5%, and in the 3 gassy plays: +3%.
Total production for 7 shale plays is expected to decline by 10%.
Niobrara oil production vs. oil rig count
Sources: EIA DPR Nov 2015, Baker Hughes
Much steeper oil production declines in the Eagle Ford and Niobrara are apparently due to much higher and accelerating decline rates of the existing wells compared to the Bakken and Permian basin.
Monthly legacy production declines as % of total production by 4 key LTO plays
Source: EIA DPR
Thanks Alex. Do you still think that Rystad made the more accurate prediction?
AlexS,
Although rig productivity (wells per rig) has increased, well productivity has presumably declined over the last few months. In below chart, the Bakken growth rate of wells producing is for the first time higher than the growth rate of total production. In other words more wells are needed to increase production and for the Bakken the threshhold for staying even has increased from 120 new wells to 160 new wells. As it looks like that this trend is accelerating, it is increasingly less efficient to deploy capital on drilling. This comes at a time when oil prices are low and companies are in a weak position to invest. In my view this will lead to a much sharper decline in shale production as in many mathematical models calculated so far. There are already some hints for this trend in the Drilling Report.
Hi Heinrich,
Much depends on the number of new wells brought online each month. So far there is little evidence that that there has been a significant decline in productivity in the new wells, though the decline rate over the first few months may be higher the overall cumulative productivity over the first 3 and 6 months has remained stable or increased slightly.
Enno and I have both presented scenarios showing that 120 new wells per month will keep output relatively flat. Below I show what things would look like with 75 new wells per month from Sept 2015 to Jan 2017. Clearly nobody knows how many new wells will be added each month, this will depend on many factors, mostly the price of oil.
Dennis,
Thanks for the opportunity to meet this point which is the key issue for shale. The main point from my above chart is the sudden change in well productivity. It is like somebody has turned off a switch. If the growth of wells does not match production growth, important things change. The term Capex is strongly tied towards production, reserve and asset growth. If an expense is directed towards slower growth or a shrinking asset base it cannot be classified as ‘Capex’ it is an operating expense. In other words an investment (Capex) is not an investment anymore if the return is negative – it is then an expense. The chart above tells me that shale Capex is not an investment anymore since a few months, but an expense. This turns the whole shale game upside down. In my view this is one of the reasons for the precipitous decline in Eagle Ford. It could mean that we have a decline in sweet spots – or something else. In any case the numbers tell me that we have now an exponential decline and not a linear decline – which is the base of your calculation. The required new wells for keeping production in the Bakken even could go from 120 per months to far above 300 over the next months. As companies are not likely increasing Capex at current oil prices, this will eventually lead to a strong decline in shale production over the next year.
Heinrich. Your point about CAPEX v operating expense is on the money.
I focus on the oil price necessary to be cash flow neutral and maintain production. That price is different for every company and constantly changes, but overall it remains much higher than current oil and natural gas prices.
Shale companies have been hiding behind this for quite awhile, but recently management is beginning to talk about maintaining production and cash flow neutrality.
Apparently some one important has signaled to them that the cash burn has to stop. I do not think $55 WTI or even $65 WTI will result in a return to 2011-2014 like drilling, which is what will be needed to cause US oil production to reverse its decline. The shale companies cannot return rigs at these price levels without burning more cash, on the whole.
shallow sand,
Thank you for your reply. My point is also that many shale companies have published low operating expenses over years by moving most of their expenses into the category ‘capex’. By the recent impairments they have moved a big chunk of their capex into the category expenses. So, basically they are saying to investors: sorry folks you have invested your money, but actually it is not invested anymore we have spent the money already on producing gas and oil and you will see a big part of your money never again. This is in my view a very unfair way to pretend to have low operating costs.
Hi Heinrich,
Enno Peters posts charts each month showing the well productivity. It has not decreased.
At the current price level some companies may stop completing wells and may stop drilling. There are a fair number of drilled uncompleted wells in the Bakken (Enno has two estimates 450 and 900, I am not sure which he favors, let’s call it 675). These wells are a sunk cost and are likely to be completed to keep up cash flow levels. Even if all drilling stops (which is unlikely) if 75 wells are completed from the frack log each month, there are 9 months supply of DUCs, if 40 wells per month are drilled the supply would be enough for 19 months of completions at 75 wells completed each month. My scenario assumes well productivity (the estimated ultimate recovery over the first 60 months) of new wells remains at 2013 to 2014 levels. So far the actual data shows no change in new well EUR (it actually increased slightly in 2013 and 2014 from earlier levels and has remained steady in 2015). Perhaps Enno or Freddy W have a 3 month or 6 month cumulative chart for the Bakken Three Forks. I have an old chart but they may have something more recent. Chart below is from data in April or May 2015.
Hi,
I just want to add that yes production has stayed relatively flat over the years. But water content has increased significantly. Fracking has become more costly also with more fracking fluids and so on. They have on the other hand become more efficient in what they are doing, but I think overall that costs have gone up.
Newer wells produce more in the beginning, but has higher decline rates for at least the first year. My guess is that the earlier wells will eventually have recovered more oil than the later ones.
New data will probably come out on Friday. Maybe I have something to show after that.
Freddy W.
Would be very interested to read your post.
Hi FreddyW,
Well costs have increased due to more stages and more proppant and this may be having an effect on water cut. I agree the first couple of months have been higher, with steeper decline, but what is more interesting is how the 3 month cumulative and 6 month cumulative has changed over time. The cumulative well profile is of greater interest when considering profitability of the well. Last time I looked at this (last spring) for Bakken/Three Forks wells in North Dakota, oil output was relatively flat or up slightly for 3 month and 6 month cumulative output. Claims of decreased well productivity are confusing a drop in the number of wells completed each month with a decrease in well productivity.
Another thing that people fail to realize is that it takes more wells to keep output flat as the total number of producing wells increases (Rune Likvern’s famous Red Queen effect) even if well productivity is unchanged.
Even more interesting would be to see how the 15 year cumulative production has changed. But we don´t have that ;). The 6 months cumulative production is not representative to ultimate recovery if the decline rate has changed. I think you get the best picture if you look at both the cumulative production and the production profile.
On the Eagle Ford see
http://www.rrc.state.tx.us/oil-gas/major-oil-gas-formations/eagle-ford-shale/
On the upper right side of the page is a graphic with “Wells permitted and completed in the Eagle Ford Play 11/01/2015”. There were 9655 oil wells “on schedule” (which means completed) on Nov 1, 2015. On Oct 1, 2015 there were 9322 oil wells “on schedule”. That is an increase of 333 oil wells in Oct 2015.
The problem is that we don’t know how many of these wells are “producing”.
If the “oil wells on schedule” is assumed to also be the “new wells producing” each month the model for the Eagle Ford does not match very well with my estimate for Eagle Ford output so either the output estimate is bad, the model is bad, or the new wells producing estimate is bad (or a combination of all three problems.)
The lack of quality data on the Eagle Ford play makes modelling a challenge. I trust the model below much less than the Bakken model where I have better individual well data, production data, and the number of new producing wells added each month.
The model assumes the new “wells on schedule” are not all producing and the new producing wells added are consistent with production data. I adjust the new producing wells added over the Oct 2014 to Oct 2015 period so that the total wells on those two dates match the completed wells on schedule, but the wells added each month reflect reported output.
In Oct 2015 154 new producing wells are added and this number decreases to 130 new wells per month by Jan 2016 and remains at this level until Jan 2017. As always we have to guess at future wells added and for the Eagle Ford we have to guess at the producing wells even for the past as this data is hard to dig up for Texas (which reports by lease rather than by well).
Chart with Model below. Output has fallen by 150 kb/d from March to August and the model predicts a further 100 kb/d fall in output through Dec 2015. In 2016 (if the 130 new well per month guess is correct) output falls by another 200 kb/d for a total decline of 450 kb/d from March 2015 to December 2016.
Hi all,
There have been several stories about oil companies pulling out of the Bakken and focusing elsewhere (such as the Permian basin). Have there been similar stories about the Eagle Ford that I have missed? I keep expecting that the wells on the oil schedule in the Eagle Ford play will increase more slowly based on comments I read here, but at least through November first this has not been the case. In the past 12 months there have been 2506 oil wells added to the schedule in the Eagle Ford play (209 wells per month on average). From Aug 2014 to Aug 2015 1895 new wells were added to the Bakken/Three Forks play (158 new wells per month). So for each play I assume the new wells added drops by about 80 wells from the most recent 12 month average.
The total drop in output from both play (Bakken and Eagle Ford) from July 2015 to Dec 2017 is 540 kb/d, if we add the Eagle Ford drop from March to July 2015 of 155 kb/d, then the total decline for both plays from March 2015 to Dec 2016 is 695 kb/d. Possibly increased output from the Gulf of Mexico and the Permian basin will moderate this decline to a small degree, also oil prices may rise due to declines in other non-OPEC areas, though the experts think this won’t happen until late 2016 or later.
Dennis,
In my view it does not matter why wells are not completed. It might be the oil price, it might be depletion, it might be well quality, it might be the lack of money….. The most important thing is that well productivity has clearly declined. This might change if the oil price goes up, or companies find new oil fields… , yet the fact is that well productivity declines and therefore oil production declines as well. What is most striking is that the decline is accelerating and the decline numbers we have seen so far are just the beginning.The actual decline in the Eagle Ford is enormous. Even if the decline of 78000 bbl/d and month just continues, we have have no production anymore by 2017. There must be an explanation for this – also in your model.
Heinrich,
Well productivity has not decreased. Again in the Eagle Ford there has been a slight increase in well productivity. The model assumes this holds steady at 2014 levels, we have much poorer data for the Eagle Ford an the number of wells completed each month and the output per well, so the model is more speculative than the Bakken where we have excellent data provided by the NDIC with considerable help from Enno Peters (who is amazingly generous to share the data he pulls from the PDFs on the NDIC website).
Dennis,
I have just checked the Eagle Ford production forecast from the drilling report. Production is forecast to be 1278 kb/d in December 2015, which is increasingly off from your forecast in the above chart. If the decline is roughly the same in January 2016, Eagle Ford production would be already lower than you predict for end of 2016. Is there any explanation for this?
Hi Heinrich,
The EIA’s DPR assumes fewer wells are completed. From Oct 2014 to Oct 2015 the completion rate was about 160 wells per month, I have assumed it drops to an average of 150 wells per month in Nov and December. The EIA must assume it is far lower.
Also note that the legacy decline rate drops as the completion rate drops, it is not fixed and does not always increase. I don’t think the DPR will be correct for the Eagle Ford.
I noticed a mistake in the comment above, I said the average completion rate fro Oct 2014 to Oct 2015 was 160 wells per month, that is incorrect. The completion rate was about 200 new wells per month in the Eagle Ford over that period.
Also legacy decline depends on the number of new wells added each month as most of the decline comes from the newer wells that have higher decline rates during the first few months of production. As fewer wells are drilled, production goes down, but the legacy decline (in barrels per day) becomes smaller as well.
The DPR gets this wrong, they show legacy decline increasing when clearly the number of new wells per month is decreasing and legacy decline should become smaller. Chart below shows legacy decline in the Bakken with a scenario that keeps the number of new wells added per month constant at 75 new wells per month, this gives the same output as the DPR for Dec 2015 so it is consistent, but the legacy decline does not match up. My model has 55 kb/d legacy decline in Dec (13 kb/d lower than Sept at 68 kb/d), but the DPR has legacy decline increasing from 69 kb/d to 71 kb/d. Chart below.
Hi Heinrich,
I have estimated about 900 DUC wells for the Eagle Ford based on rig counts from Baker Hughes and a Bloomberg estimate of 1250 DUC wells at the end of Feb 2015. I have assumed 1.3 wells can be drilled each month for each rig operating and that the 4 week average number of rigs on the last week of each month is an approximation of the average rig count for the month.
With about 60 rigs running in the Eagle Ford at the beginning of Nov and with a frack log of 900 wells to be completed if the rig count remains at 60 it is easy to imagine that 148 wells per month could be completed from Oct to Dec 2015 and 130 new wells per month for all of 2016. My Eagle Ford scenario is based on the existing DUC (Drilled UnCompleted) wells estimate of 900 in Oct 2015 and the rig count.
Thx AlexS for putting the EIA reports in a clear context and visible
Hi Alex S,
Continuing our conversation from above.
The flowing scenario assumes my medium C+C scenario with a URR of 3400 Gb of C+C is correct and that the EIA’s 2014 International Energy Outlook (IEO) reference case for C+C output is also correct. The IEO forecast is shown on the chart as “Data” from 2015 to 2040, when it is in fact a forecast.
In order for output to reach 99 Mb/d in 2040 and have C+C output follow the IEO reference scenario from 2015 to 2040, extraction rates from proved producing reserves must rise to 43% by 2040. If extraction rates remain at 43% until 2055, output will fall from 99 Mb/d to 53 Mb/d by 2045.
To say that such a scenario is unrealistic is a mild understatement. 🙂
I am somewhat less optimistic than Alex S on future C+C output.
Dennis,
what is “extraction rate”?
Hi Alex S,
See
http://peakoilbarrel.com/oil-shock-model-dispersive-discovery-simplified/
especially figure 8 if you don’t feel like reading the post.
The model presented in that post used Jean Laherrere’s C+C-XH URR estimate of 2200 Gb. I also ended up with producing reserves at too high a level in that model (65% of 2P reserves in 2010). The producing reserves in the US are about 42% of 2P reserves and for the World they would be lower (my guess is 35% of 2P reserves World wide are proved developed producing (PDP) reserves.) In 2010, 2P reserves (for C+C-XH) were about 1000 Gb so PDP reserves were approximately 350 Gb.
The extraction rate % is the produced oil divided by PDP reserves at the end of the previous year.
Each year PDP gets reduced by the amount of oil produced that year and it gets added to by any newly developed reserves that start producing. For the model I presented, the PDP reserves (labelled “producing reserves” on the chart and extraction rate are shown in the chart below.
Dennis,
Am I right that you and Jean Laherrere do not assume further reserve additions?
Hi AlexS,
You are correct about Jean Laherrere, but I assume there will be additions to reserves. See
http://peakoilbarrel.com/us-oil-reserve-growth-2/
For a summary of my views on reserve growth which are very different from the views of Jean Laherrere.
Also I use the Hubbert linearization as a minimum estimate of C+C-XH URR. Typically the HL has tended to underestimate the URR (in the case of the United States for example, but also for the World), so I estimate the World C+C-XH at 2800 Gb and assume about 700 Gb of discoveries and reserve growth will occur after 2010. Probably about 200 Gb of discovery and 500 Gb of reserve growth (or increases in estimated reserves as Ron likes to call this).
I also made a mistake in a comment above where I said 2P reserves were 1000 Gb in 2010, they were 850 Gb in 2010 and PDP to 2P reserve ratio was about 41% rather than 35%. As reserves grow (or the estimates increase) in the future the backdated 2P reserves for 2010 will become higher, eventually reaching 1240 Gb (if the 2800 Gb C+C-XH URR estimate is correct), that is 390 Gb of increased 2P reserve estimates on discoveries from 2010 and earlier (45% growth of 850 Gb of 2P reserves), another 430 Gb of discoveries plus reserve growth of discoveries after 2010 will occur over time.
Short answer Laherrere, no reserve growth, for me there is reserve growth.
short comment: your approach is correct, Jean Laherrere’s is not
Hi Alex S,
I am not sure if I interpreted your question correctly.
When you say reserve additions, do you mean reserve growth? Jean Laherrere assumes there will be future discoveries but I believe he assumes the 2P reserve estimates are a “best guess” which are equally likely to be adjusted higher or lower with the average being zero.
Looking at US and UK data and assuming that the UK reported 2P reserves are not under reported, the ratio of 2P to 1P reserves in the UK averages about 1.7, using this for the US 1P reserves to estimate 2P reserves (multiply 1P times 1.7), there is apparent reserve growth over time. Roughly 60% over 30 years. I assume for the World the reserve growth will be somewhat lower than seen in the US.
By reserve additions I mean reserve growth due to 1) new discoveries; 2) higher estimates of the old fields’ reserves
Hi AlexS,
Thanks. Do you have an estimate of C+C URR? The USGS estimates about 3100 Gb for C+C-XH and about 1000 Gb of extra heavy oil from oil sands, my “high” scenario is 400 Gb less than this with the same C+C-XH URR but only 600 Gb for extra heavy (XH) oil.
Dennis,
USGS’s, BP’s and other similar estimates are based on bottom-up analysis of thousands of oil fields and hundreds of hydrocarbon basins worldwide. Such an analysis is well beyond my modest capabilities. Any other approach is a guessing game, in my view.
Hi AlexS,
They are all guesses.
Laherrere and Campbell also look at data from basins all over the World. It is only a matter of which guesses are better. In the face of this uncertainty, I take the middle guess, essentially the Hubbert Linearization is my low guess (2500 Gb), the USGS estimate is my high guess(3100 Gb) and my best guess is the average of the high and low guesses for C+C+XH oil(2800 Gb).
On extra heavy oil I was influenced by Fernando who believes that the Orinoco belt is being produced very badly and that the USGS URR estimate of 500 Gb will be far off the mark, so I am only expecting about 225 Gb of oil sands output from Venezuela and 375 Gb of output from the Canadian oil sands. So 600 Gb rather than 750 Gb which would be the average of the low estimate of Laherrere and the high estimate of the USGS.
Yes. The Orinoco sweet spots are being damaged. At the rate they are going they won’t recover 10 % of original oil in place. The total oil in place is about 1300 X 10 to the 9th barrels. The official reserve numbers used a 20 % recovery factor, decreed by fiat (it wasn’t estimated on a sector by sector basis). The USGS estimate is bogus.
By the way, this week police authorities captured two nephews of the Venezuelan First Lady in a huge drug deal. They arrived in Haiti trying to move 800 kg of cocaine, were grabbed as soon as they produced a 1 kg sampler to a prospective partner, and were taken to New York. The two guys had diplomatic passports but the Haitians didn’t give them diplomatic immunity. The plane they were using belonged to a company controlled by President Maduro’s brother in law.
Shallow,
I’m think the guys at The Daily Reckoning are reading your posts here:
http://dailyreckoning.com/buyer-beware-horror-show-not-over-in-oil-stocks/
Keep it up and maybe CNBC will have you on! ????
John S, I don’t know about that, lol! The financial reports are out there for all to read.
I just know we are very concerned, as we end the worst year since 1998. We are ok now, but another 1-2 more years of sub $50 WTI is not going to be much fun.
Saudi and UAE are sure making it known there will be no cut. Gotta love the oil minister from Oman. He keeps it simple. Some paraphrased quotes:
“You sell oil and you want low oil prices? We do not see how that makes sense.”
“This is a commodity if you have one million extra barrels on the market, you just destroy the market.”
“We are feeling pain and talking like this is a God driven crisis. Sorry I don’t buy this. We created this ourselves.”
Also, I have read many conference call transcripts, and have to chuckle at the “conference call talk.”
They always use the phrase, “could you give us a little more color on _________.”. What is up with how they talk on these things?
I’d like to ask, “Can you give us a little more color on how you are ever going to repay $5 billion dollars of debt with these high decline 20,000′ wellbores, while continuing to pay yourself $6 million a year to oversee this financial debacle.”
Or, “Can you give us a little more color on how you convinced the bank to loan you more money to drill more unprofitable wells when your unsecured bonds are yielding 60%, your equity is trading for 63 cents and you are in arrears more than 90 days to your vendors?”
Finally, on the service side, “Can you give us a little more color on how you found a big enough shoehorn to wedge 28 stacked rigs on that lot?”
Sorry, I know tons of good people have lost jobs due to this mess, don’t mean to offend. However, its better to laugh than cry about this stuff.
“We are ok now, but another 1-2 more years of sub $50 WTI is not going to be much fun.”
I was looking at Alex graphs above and honestly I don’t know how just pure shale plays will be producing any more than 3-3500 kb/d even if the rig count stays at this level in a year time. And even this is optimistic. EF production is just ready to crater in the next 6 months. Bakken is at the same spot now that EF was in April this year and that is hibernating at the top and ready to follow EF steps. And that is just shale production.
“Saudi and UAE are sure making it known there will be no cut. Gotta love the oil minister from Oman. He keeps it simple.”
Oman is not in OPEC, so his comment has same weight as it would come from Canada and we know how influential is Canada within OPEC. Zero.
Ves. I know Oman’s oil minister is powerless. I just like the quotes.
He probably is so blunt because he has no control over the situation.
Let’s go with oil having abiotic origins, begin with two elements, carbon and hydrogen. Far enough, trace elements after that.
Where does the carbon exist on earth in pure elemental form, nothing else? A few diamonds, that’s it. Splash some hydrogen on the diamonds, voila, abiotic oil. lol
Where does hydrogen gas exist on earth, nuttin’ else, just all hydrogen gas?
Anyone? Bueller? CO2 as a gas can concentrate in pure gaseous state on earth, the prime example is Lake Nyl in Africa.
Carbon needs to be in a fixed state here on earth, all CO2 in a gaseous state in the atmosphere, no fixed carbon, no plants, no animals, carbon and oxygen combined, one of one and two of the other, all dissolved in the atmosphere, no carbon in the earth’s crust, there won’t be much life going on in such a harsh environment.
How will the oil form abiotically?
I know. There was a huge bubble of hydrogen, the size of Jupiter, it collided with the earth which had an atmosphere of all carbon dioxide, when the collision happened, the huge cold bubble of hydrogen fused with the CO2 gas atmosphere and instantly became all oil, carbon and hydrogen combined immediately from methane to long chained hydrocarbons, the remaining hydrogen combined with the left over O2 released from the carbon and there it was, instant water. Oceans formed right now, the oil was then floating on the water and deposited on the carbon free crust.
That’s how it happened and a short history of the firmament without any hydrogen until the planet of hydrogen gas collided with the CO2 atmosphere captured by planet earth devoid of carbon.
Now you know the rest of the story.
It is Lake Nyos.
Have to make the correction.
I personally thought high cost oil producers would be shutting in production significantly much sooner than they have.
My mistake, as best I can tell from my very limited knowledge of the various component parts of total production costs, is that I thought VARIABLE costs are higher and sunk or fixed costs are lower than I thought, as a general rule. So an oil company can have say seventy five bucks total cost in a barrel, but maybe only twenty five of that is a variable cost. Hence selling a barrel for forty bucks can still generate fifteen bucks of cash right away- cash the company is in desperate need of.
While this is obviously enough perfectly common knowledge in a forum such as this one, it seems as if it is totally unknown to most of the people who comment on oil in the msm media, telling us how yankee ingenuity is winning the oil war for us.
I am not sure whether they are simply so cynical that they think the public is stupid enough to believe the people in the oil production industry are utterly stupid OR they actually believe the industry is operating twice as efficiently, meaning at half or less the cost, it operated only a year ago.
Any body who believes professional people who have been managing jobs such as running drill rigs could double efficiency across the board in a years time is missing a few cards from his intellectual deck. Some of them would have figured out how to do it before the price collapsed. Sure costs of inputs have declined, the wages of experienced men are no doubt down sharply etc. But not fifty percent!
But the real reason production is holding up, so far as I can tell, is that the time lag between drilling and actual production is over a year in most oil fields. So the new oil coming to market now, except tight oil from places such as North Dakota, is coming from wells planned and financed and drilled prior to the price crash- most of it, anyway. North Dakota oil can be produced within a month or two of drilling if the well operator so desires.
If I am off base, somebody who knows better please let me know, because I am posting comments similar to this one in other forums.
Oil isn’t the only precious underground liquid depleting:
http://www.motherjones.com/tom-philpott/2015/11/california-saudi-arabia-fruits-and-vegetables
” Inspector? It’s all gone wrong, hasn’t it?”
Ho!
Our quest for oil independence widens!
http://www.businessinsider.com/r-carson-endorses-statehood-for-puerto-rico-at-island-rally-2015-11?op=1
“Carson called Puerto Rico “very strategically located for the defense of America, right near Cuba.”
“We have the Chinese already coming in and infiltrating the Caribbean,” he said. “We also have to recognize that we have global jihadists who are trying to destroy us. We need unity.”
…and we need Venezuela’s oil!
The TrumpCarson smoke and mirrors diversion is still in full-force!
Remember Fernando’s little parody about migrant smugglers a few weeks ago organizing the business using various models of boats?
He didn’t take it quite far enough to capture reality.
http://www.nbcnews.com/storyline/europes-border-crisis/345-migrants-found-luxury-yacht-greek-island-lesbos-n460576
If these guys had made it, they would have grossed close to a million bucks on just that one trip.
Peakoilbarrel bloggers,
I periodically write subversive posts for the Toulouse School of Economics debate forum. Last time, I made a few regrettable mistakes. So I am looking for proof readers to correct any mistakes before submitting. The post is: Dysfunction in the oil markets increases the probability of a deflationary debt spiral. The post explains why I agree with Gail about oil prices remaining low for some time.
I would like to thank Ron very much for this site. I think of Ron as the oil Kepler. Stare at the data long enough you see patterns. I do not comment very much, but I spend a lot of time here. It is the primary inspiration for my post. I appreciate just about everyone’s comments, special mention to Dennis who forces people to be precise.
Hi Schintzy,
Thanks. On a brief read of your post it looks fine. Economic theory would tend to point toward option 3 as the most likely outcome, eventually the actors in the oil industry will become more rational (as will investors). Whether government intervention in the form of “choosing winners” is the best option I am unsure about. Some government intervention is needed, but in my view the best option is an appropriate level of taxation on carbon emissions, with careful attention to unintended consequences on biofuels (rainforest destruction to plant inputs to biodiesel production). Tax the externalities and let the market choose the winners.
Schintzy –
para. 1, end sentence, “of of a deflationary…” (dup “of”s)
para 3: “the production price…” -> “price” should be “cost”.
para 5: 4th sentence: LTO production price –> cost.
bullet items: 3rd one “mal-Nvestment” –> “map-INvestment”
p.s. I think Gates is somewhat clueless, in that he ignores the manufacturing experience curve.
Lab based R&D is all fine and well, but real cost is driven out by production/installation/marketing/selling experience.
The other thing is his insistence that renewables be cheaper than fossil fuels.
(a) fossil fuels are tremendously subsidized, and people resist paying full costs reflected in higher price to the point of riots in the streets.
(b) the cult of techno-optimism blinds people to seriously asking “have we been living in an unsustainable fool’s paradise?”
Thanks sunnnv, fixed. Agree with you on Gates.
IEA World Energy Outlook 2015 on U.S. tight oil:
“The short investment cycle of US tight oil and its ability to respond quickly to price signals are changing the way that the oil market operates. The plunge in prices means US tight oil production is now stumbling: if prices out to 2020 remain under $60/bbl, without a rapid evolution in drilling efficiency and technology learning, tight oil production in the United States will likely see a substantial decline in output. However, with tighter markets leading to higher mid-term prices in the New Policies Scenario ($80/bbl in 2020) US tight oil ultimately resumes its upward march, growing by 1.5 mb/d by 2020 to over 5 mb/d.”
“The short investment cycle of tight oil and its ability to respond quickly to price signals is changing the way that the oil market operates, but the intensity with which the tight oil resource is developed in the United States eventually pushes up costs. US tight oil production stumbles in the short term but resumes its upward march as prices recover, helped by continued improvements in technology and efficiency improvements. But tight oil’s rise is ultimately constrained by the rising costs of production, as operators deplete the “sweet spots” and move to less productive acreage. US tight oil output reaches a plateau in the early-2020s, just above 5 mb/d, before starting a gradual decline.”
Change in production (2015-2020) of US tight oil for a range of 2020 oil prices
mb/d
AlexS,
It is interesting to see in this report the ‘depletion of sweet spots’. Secondly, there is also the view that ….’ if prices out to 2020 remain under $60/bbl, without a rapid evolution in drilling efficiency and technology learning, tight oil production in the United States will likely see a substantial decline in output…This implies that efficiency in drilling and technology learning have not yet played out as expected. There is also the hope that prices will recover soon and that this is the reason for a production recovery. As far as I could understand the public opinion, it has been the common view that shale can also withstand low prices. So, something has changed and this scenario is already gone. In my view only a substantial production drop in the US will trigger a price recovery as this will reduce supply and increase demand over a lower US dollar. The scenario that prices will recover without a substantial drop in US production is very unlikely over the short term. Furthermore the report states …..EIA expects U.S. crude oil production declines to continue through September 2016, when total production is forecast to average 8.5 million b/d. This level of production would be almost 1.1 million b/d less than the 2015 peak reached in April. Forecast production begins increasing in late 2016, returning to an average of 8.8 million b/d in the fourth quarter…. So, the scenario of a rise in production in spring 2016 has been extended towards September 2016. In my view this is still a little bit over-optimistic regarding the huge declines in the Eagle Ford and requires a price recovery by spring 2016, which is equally quite unlikely. In any case, the EIA has substantially moderated its forecast and the scenario of an ‘undulating plateau of oil production’ is quickly fading.
Having read the tight oil section, I couldn’t really see how they got from what is a decent and critical look at tight oil to the ‘big picture’ figures of 5.8 million b/d in 2020 and a long plateau to 2040. I imagine the headline figures are from the big complicated model, but the detail is done by a specialist.
The most important oversight was not talking enough about debt, but generally it was a strong piece.
gwalke,
Do you have the full report?
The WEO Factsheet and Executive Summary say that
“US tight oil ultimately resumes its upward march, growing by 1.5 mb/d by 2020 to over 5 mb/d.”
and:
“US tight oil output reaches a plateau in the early-2020s, just above 5 mb/d, before starting a gradual decline.”
There is no mention of 5.8 mb/d, nor a long plateau to 2040.
This forecast is actually in line with IEA’s Medium-Term Oil market report (February 2015), in which the IEA estimated 2014 US tight oil output at 3.6 mb/d and predicted 2020 production at 5.2 mb/d.
FYI
From: Ron Patterson
Sent: Tuesday, November 10, 2015 4:08 PM
To: Smith, Patricia (EIA)
Subject: International Energy Statistics
Dear Ms. Smith,
Has the International Energy Statistics been discontinued? It has been several months since the last update.
Thank you,
Ron Patterson
From: Smith, Patricia (EIA)
3:51 PM
Hello Mr. Patterson,
Thank you for your interest in the U.S. Energy Information Administration. Unfortunately due to database issues with the new International Portal, the monthly data has not been updated recently. We are working very hard to correct these issues and get back on a regular update schedule. At this point I cannot give you a firm date as to when the next update will occur. I apologize for any inconvenience.
Regards,
Patricia Smith
What do you think this means? What it says?
Yes I think it means what it says. And I would love to know what the “new International Portal” really is. I hope it means that when they eventually do get these issues resolved we will be getting more accurate and on time updates.
And I would love to know what the “new International Portal” really is.
Off Topic Warning:
Well I could try and tell you but you probably wouldn’t believe me, it’s really code for a Stargate Portal… 🙂
Watch this to see how someone who almost sounds normal can be absolutely batshit crazy! Compared to this guy, even most creationists and climate change denialists and other conspiracy theorists are completely rational.
https://goo.gl/0Yynrc
It’s a hoot!
Anecdotal re US conventional.
Company near us, 2012-14 drilled and completed many conventional wells. 2015 drilled no wells and completed the few remaining ones in first quarter.
Decline from Q3 2014 to Q3 2015 14.5%. Had grown production annually 2012-14.
Wonder how many conventional oil wells were completed 2011-14? New conventional wells may have a high decline too.
I know dwarfed by shale, but it all adds up.
Ron,
Care to explain all the disappearing and rejected comments here over the last couple days? Deliberate or a glitch? Personally I’d like to contribute on the pure climate change threads but your spam filter is nabbing my name for some reason and a few of my posts from yesterday are no longer up. I think others are having the same problem too, hence the decreased commenting and interest over the last week or so.
Matt
Matt, I do not put up with bullshit comments on my blog. If you have a scientific argument against global warming or climate change then I welcome your comments. But if you have a political argument against global warming or climate change then fuck off, I will delete your comments and ban you from the list. The argument is about science, not politics.
Understand?
I have a hard time with ‘drive-by-shooting’ comments along this issue from names that are not recognized and then disappear.
That’s spam-like and worse than trolling.
What makes it even worse is the left-right false dichotomous angle, along with the distraction from the real issue of this crony-capitalist plutarchy uneconomy and how it’s undermining our comfort and survival as a species.
CALIFORNIA 6TH GRADE SCIENCE BOOKS: CLIMATE CHANGE A MATTER OF OPINION NOT SCIENTIFIC FACT
“We found that climate change is presented as a controversial debate stemming from differing opinions,” said Román, an assistant professor in the Department of Teaching and Learning in the SMU Simmons School. “Climate skeptics and climate deniers are given equal time and treated with equal weight as scientists and scientific facts — even though scientists who refute global warming total a miniscule number.”
http://www.sciencedaily.com/releases/2015/11/151110120441.htm
Opinion given equal footing with data.
I wonder if that will be the case once a tipping point is passed? Of course then it may be too late to do anything about it.
For what it’s worth I’m of the opinion that drought in California is punishment from God for the evil ways of Californians!
Agreed, the drought just shows how we need the Word of God in our life. Only a fool says in their hearts there is no God. Jesus loves you and died for your sins. Follow Jesus and you will be fine!
Rose, I presume that you understand that your God fathered himself so he could have himself killed to save us all from himself. A supposedly infinitely loving God sends the majority of humanity to a torture chamber called Hell so that they can suffer extreme misery for an eternity. These assumptions are about as insane as mythic madness can possibly get. We can’t pray for you to get you mind back from this delusional frame of reference. However, we can tell you that there is not one single element to the supernatural that has any possibility of making sense. You live in a natural universe.
Why is it that so many atheists aren’t just quietly atheist, but in fact openly hostile and abusive (at least on the internet) to those who happen to express a profound personal belief in God?
Why do religious fanatics come to blogs like this one and insult the intelligence of people like myself, who, BTW never in a million years would go to to some blog where the religious are having a discussion about any topic. People like myself do not scour the internet looking for a fight with religious folk. But don’t expect me not to poke fun at your beliefs if you come here to push religious beliefs which I do not share and have nothing to do with the topics being discussed on this blog. So long as you don’t try to force your beliefs on people like myself you will find no hostility whatsoever.
Fred, the link to the music is not allowed in the US. I can’t face the music, maybe later.
God Almighty, religious folks have a tough time with atheists.
Twelve jokers got together, formed an organized effort to bring something of a belief system to the Great Unwashed, a population of uneducated, illiterate, gullible fools willing to believe some good news. The twelve clowns found Jesus down by the river with John the Baptist, saw a perfect opportunity, built a church, the Gregorians began to chant, and everybody on earth is now supposed to receive the good news, Jesus saves.
The godless communists came along and started to wipe out everybody, millions of them. The brown shirts in Berlin kicked the shit out of the communists for a while, marched to Stalingrad and froze to death.
The Soviets marched into Afghanistan and got bitch slapped by the muhajideen. With the help of some Stinger missles, the Afghans made life miserable for the Soviets for ten years. The God fearing muhajideen 1, the atheists 0.
Every atheist I know always takes US currency for payment of goods and services even though each and every bill says ‘IN GOD WE TRUST’ on them. Yes, the words are all capitalized on the back of a one dollar bill.
Every minted US coin has the same words on those coins.
You would think an atheist would reject US money, throw it away, so there is some hope for the godless atheists, they at least take the money. What atheist in his right mind would take money that says something about God on it, especially trusting in God? Freaking hypocrites, that’s what they are!
Money does all of the talking, especially the money that has words on it that say ‘IN GOD WE TRUST’. Removing those words from printed US paper money and US minted coins might not be a wise decision.
Ron, delete this post if you think it is over the line.
Money does all of the talking, especially the money that has words on it that say ‘IN GOD WE TRUST’.
None of my credit or debit cards has ‘IN GOD WE TRUST’on them. If I go to the supermarket or a department store I use ‘Plastic’. I usually do most of my banking, purchasing and bill paying online, I do have to trust the gods of the internet but I’m not sure that counts. I also use PayPal and am looking into virtual currencies such as Bitcoin. I just pulled some Brazilian currency out of my wallet and it didn’t have any mention of God on it. I also transact in Euros and haven’t seen any deities there either. The new currency has VISA, American Express, Master Card, etc.. on it, no need to trust in any deity there either.
The motto of the USA until 1957 used to be
E pluribus unum , 1957 was the year that things started going to hell in a handbasket… Just sayin 🙂
What atheist in his right mind would take money that says something about God on it, especially trusting in God? Freaking hypocrites, that’s what they are!
R Walter, it’s hard to tell whether you are being sarcastic here or not. If you are then that is funny. If you are not then that is the stupidest goddamn statement I have read in years.
For hundreds of years non believers had to claim they believed in god or else they were burned at the stake. They were not hypocrites because they wanted to survive. A lot has changed since then but we still must use the currency printed and coined by believers. We have no choice.
Even though we are atheist we still must live in a world where the laws and regulations are written by ignorant superstitious people.
“If you are not then that is the stupidest goddamn statement I have read in years.”
Now that is hilarious!
It is sarcasm through and through.
If there is a /sarc, then everybody knows it is sarcasm, makes it less funny, some might take it as a serious statement, but it is not. Better for it to remain a mystery.
In no way was it serious, just looks that way, sarcasm. Poking fun at money.
Poe’s Law RDRR Walter. Poe’s Law.
But don’t expect me not to poke fun at your beliefs if you come here to push religious beliefs which I do not share and have nothing to do with the topics being discussed on this blog.
Huh? I look up above, and you’re the one who brought God into the discussion by mentioning how you think He is punishing California through the severe drought going on there.
As I pointed out, Fred was mistaken about God causing droughts. God was more into floods. After the waters receded, after the BIG one, all those aboard the Ark disembark and have His promise that He’ll never judge the earth with a flood again. Recognizing His totally barbaric deed He gave the rainbow as the sign of atonement, which was nice but hardly made up for all the bloody the carnage.
Basically, you have to allow Fred a bit of latitude here; because Fred worships a Snake and gets confused. Personally I’m devoted to Odin’s boy Thor because as well as thunderstorms, he works like hell to protect mankind. That’s important.
Doug L,
Thor got anything to say about pulsars?
Huh? I look up above, and you’re the one who brought God into the discussion by mentioning how you think He is punishing California through the severe drought going on there.
Seriously?!
If you took that to be an attempt to bring ‘God’ into the discussion or as an example of my being an aggressive atheist itching for a chance to confront true believers, then you really need to completely reassess your entire outlook on life.
For what it is worth it was a very mild attempt at sarcasm and humor targeted at the readership of this site.
In hindsight, Rose’s comment in response, was exactly the kind of over the top, trollish drive by reaction, that elicited quite a few requests from the regular readership for her to take her views elsewhere.
Had I made my comment on some Christian blog, I might be able to understand a bit of pushback. Not here!
Here you go Rose!
Thank You God – Tim Minchin
https://goo.gl/zyT0NR
While you’re at it: http://www.godchecker.com/
YOUR GUIDE TO THE GODS
Discover almost 4,000 gods, goddesses and spirits from around the world
“Life in Lubbock, Texas, taught me two things: One is that God loves you and you’re going to burn in hell. The other is that sex is the most awful, filthy thing on earth and you should save it for someone you love.” ~ Butch Hancock
^u^
Anyway, I got a call from God just the other day, incidentally, and he told me that he’s working on abiotic, adiabatic, diabetic or whatever it’s called oil and to just hang tight.
I asked him how long it’s going to take, though, and he said that he isn’t sure but probably not soon enough to offset declines in regular oil/FF’s and the decline and/or collapse of global industrial civilization.
I reminded him that he’s God, though, and can do anything, to which he resplied that he works in mysterious ways.
No, God is more into genocide, filicide and ethnic cleansing then droughts. Of course I’m assuming we’re talking about the same god. Your Australian snake (Rainbow Serpent?) might do the drought thing.
You are a good example of why I believe God can use the Atheists to spark the young peoples interest in the Bible. Good people will see evil statements like yours and use it to ask questions about God of friends and parents. Then they will pick up a Bible and check it out. It would not be the first time some one meant something for evil and God used it for Good and it won’t be the first time evil doers dug a hole for a trap and then fell in it. Obviously it is hard to beat down a Book that has been a best seller for two thousands years. Peace be with you, God bless you this Evening. RMR.
God is a make believe concept, like a flat earth, reflexology, horoscopes and abiotic oil. Weak minded or scared people rely on make believe concepts to help them gain a (false) sense of security. And others pray upon them to gain power.
What is real is goodness and badness. Compassion or cruelty. Carrying capacity, and depletion.
So Rose, please take your god somewhere and try to oppress someone elses intellectual freedom. I’m not buying.
Oh, Ron, please, don’t take this one down. She is FUNNY.
-Lloyd
Your Australian snake (Rainbow Serpent?)
Yo! That’s my god, leave her outta this!
http://www.marketwatch.com/story/api-data-said-to-show-weekly-crude-supplies-up-63-million-barrels-2015-11-10
That should read “6.3 million”. But still…
The PBS News Hour had an interview with an Exxon-Mobil spokesperson. He claimed that their scientists were participating in the UN IPCC science panels. I have long felt that there was a big discontinuity between what the best scientists had to say and what came out of the IPCC reports. I had presumed that those scientists came from university, government and non-profit science based groups. The fact of significant participation of scientists from fossil fuel companies may explain some of the what I see to be a conservative bias in the IPCC reports.
Question for the oil guys on here.
With the spudding of Icewine 1 and other recent drills on the north slope is an Alaskan shale boom on the way.
It’s an exploratory well. It’s not going to produce any oil.
It’s going to explore a shale formation.
There is no nearby proppant source for Bakken-scale levels of fracking/production. There has been Alaska fracking, but the amount of proppant required for that was small and won’t scale.
Proppant can be shipped in. And the costs increased.
This whole thing is hype by the relevant company.
Proppant can be shipped in. And the costs increased.
Proppant would have to be shipped in by sea, to some Arctic sea port that I don’t think presently exist, then trucked to the drill site on roads that don’t presently exist. All the trucks would have to be shipped in by sea or flown in.
The shipping would have to be done in the summer because of the ice and the trucking in the winter because of the mud.
I really don’t think that would be much of a money making enterprise.
In its short term energy outlook, the EIA sharply revised its U.S. C+C production estimates for 2H15 and forecast for 2016.
Estimate for this year’s growth was increased to 580 kb/d from a 540 kb/d in previous month STEO, due to stronger than expected performance in onshore production. The biggest upwards revisions were made for August 2015: +187 kb/d, September: +160 kb/d and October: + 108 kb/d. The new production forecast for 2015 is 9.29 mb/d vs. 9.25 mb/d in October STEO.
Despite these revisions, the EIA still notes that “monthly crude oil production started to decrease in the second quarter of 2015, led by Lower 48 onshore production. From March 2015 through October 2015, Lower 48 onshore output has fallen from more than 7.6 million b/d to about 7.1 million b/d. EIA estimates total crude oil production has declined almost 0.5 million b/d since April, averaging 9.1 million b/d in October”, down 43 kb/d from September.
The EIA expects declines to continue through September 2016, when total production is forecast to average 8.54 mb/d. This level of production would be almost 1.1 mb/d less than the 2015 peak reached in April.
From the report:
“Oil prices, particularly in the second quarter of 2015, remained high enough to support continued developmental drilling in the core areas within the Bakken, Eagle Ford, Niobrara, and Permian formations, with July and August showing the first consecutive month-to-month increases in the oil-directed rig count since September and October 2014. However, with WTI prices below $50/b since August, oil-directed rig counts have resumed declining. Projected oil prices below $60/b throughout the forecast period are expected to limit onshore drilling activity and well completion totals, despite continued increases in rig and well productivity and falling drilling and completion costs.”
Rather counterintuitively, despite projected WTI oil price at $52-53/bbl in 4Q16, the EIA still expects a sharp rebound in U.S. C+C output in the later part of next year, to 8.92 mb/d in December 2016, up 386 kb/d from September.
The average 2016 production forecast was revised down to 8.77 million bpd, compared to 8.86 mb/d in last month’s outlook. As a result, output is expected to fall by 520 kb/d rather than 390 kb/d.
U.S. C+C production forecast: EIA STEO November 2015 vs. October 2015
Revisions in U.S. C+C production forecast: EIA STEO November 2015 vs. October 2015 (kb/d)
Most of the upward revisions for August-October reflect higher than expected oil production in the Gulf of Mexico. It seems that the EIA has overestimated potential losses from the platform shut-downs during the hurricane season.
Meanwhile, according to the EIA, “Twelve projects are scheduled to come online in the Gulf of Mexico in 2015 and 2016, pushing up production from an average of 1.4 million b/d in the fourth quarter of 2014 to 1.6 million b/d in the fourth quarter of 2016. It is possible some projects might begin later than expected, shifting some of the anticipated production gains from late 2016 into early 2017.”
Estimate of C+C output in the Lower 48 states ex GoM in 2H15 was also revised up by an average of 35 kb/d, including 48 kb/d in September and 55 kb/d in October. Most of downward revisions for 2016 are in the onshore production.
U.S. Lower 48 states ex GoM C+C production (mb/d)
Thanks for the update!
Not sure if anyone has posted this.
http://www.telegraph.co.uk/finance/newsbysector/energy/oilandgas/11986070/World-energy-watchdog-fears-1970s-oil-crunch-as-Mid-East-regains-stranglehold.html
With Saudi Arabia backing extremists in Syria
http://www.independent.co.uk/news/world/middle-east/syria-crisis-turkey-and-saudi-arabia-shock-western-countries-by-supporting-anti-assad-jihadists-10242747.html
ISIS bombing Saudi Arabia in return.
Iran and Russia supporting Assad.
http://www.telegraph.co.uk/news/worldnews/middleeast/syria/11919242/Why-does-Russia-support-Syrias-Bashar-al-Assad.html
Egypt engaged constant battles with terrorist groups
http://www.aljazeera.com/news/2015/07/egypt-sinai-clashes-150701233905170.html
Yemen civil war.
http://edition.cnn.com/2015/06/16/middleeast/yemen-child-deaths-in-conflict/
and Saudi Arabia trying to help fix the problem
http://www.theguardian.com/world/2015/nov/11/calls-for-investigation-into-saudi-arabias-actions-in-yemen
As the article says; there are a few dangers to being too reliant on the Middle East, the land of the religion of peace.
There is a case to be made for nuance.
Russia does not particularly support Assad. Rather, Russia opposes American imposed regime change.
“As the article says; there are a few dangers to being too reliant on the Middle East, the land of the religion of peace.”
I wonder what kind of religion is practiced by Wall Street, the american industrial-military complex and the Bilderberg Group et al , and whether the Middle East wouldn’t be more peaceful without these players’ imperialistic deliriums-turned-into-actions.
WHY THE OIL SANDS NO LONGER MAKE ECONOMIC SENSE
“Plunging oil prices may suggest that the world is awash with cheap oil but, in reality, what the world is really awash with is lots of expensive oil, much of it being produced at a loss. OPEC, home to the world’s lowest-cost oil, is pretty much producing what it always has. The market glut is from increased output from high-cost producers like the oil sands. Their existential dilemma in today’s market is that it is they, not OPEC, who must cut production to clear the glut.
http://www.theglobeandmail.com/report-on-business/rob-commentary/oil-sands-no-longer-make-economic-sense/article27170104/
This might be true if natural gas prices had not declined with oil’s price. Nat gas is a major cost to the oil sands effort.
Though maybe not . . . entirely. The nat gas supply is in Canada. Canada MUST have that oil flowing to collect the tax revs — so were that threatened they could somewhat dictate the price of natural gas as low as need be.
(Or of oil, upwards, per Argentina’s norm)
There is no tax revenue to be collected if there is no profit.
Just in case you were wondering:
Oil and Gas Taxation in Canada
And that, sportsfans, is why the price of oil is $77 / barrel in Argentina.
Ron,
I am sorry but you are very much incorrect. What are you posting is ONLY Royalty Tax on ownership of mineral resources on only government land. Income from Canadian oil and gas operations is taxed under 3-tier system:
1) A federal income tax, leveled on the “TAXABLE INCOME” of an oil and gas operations.
2) Provincial income taxes, based on the same or similar TAXABLE INCOME.
3) Provincial taxes, lease rental or ROYALTIES (Crown Charges) levied on the ownership of Canadian resources property.
So if there is NO TAXABLE INCOME there are no TAXES to be collected, except tiny fraction of ROYALTIES at these oil prices.
So I know exactly what is happening in my house and I am not wondering. But what I am wondering is why shale guys and their reckless sidekicks Wall Street bankers in the US are creating misery for the rest of the world oil industry including conventional play in US ?
I am sorry but you are very much incorrect.
No, I cannot possibly be incorrect because I made no claim whatsoever. Apparently, you are assuming I was making some kind of claim or statement about Canadian tax structure. I just posted the link and the caption that accompanied that link.
Don’t quite know what the agenda is here, but this passage from Alberta’s govt’ description of influx from oil sands says:
Royalties from the oil sands were $3.56 billion in 2012-2013. This is Albertans’ share of the revenue from oil sands production and helps fund many public services.
That’s share of revenue, not profit.
Yes, revenue on extracted resources. If there is no drilling due to being unprofitable you cannot tax royalties on resource that stays is in the ground, yet. But who knows maybe in the future government will start taxing even that. Maybe they will nationalize the oil industry, who knows. But as of now royalties apply only on extraction.. And that number that they mention in 2012-13 could be a third in 2015. Not much if you considering the costs of universal health care and up keeping infrastructure.
But Ves, aren’t we now seeing that profit is not a requi . . . oh you went there later in the para.
Ya, Argentina agrees. Make the price $77 so the oil flows so you can get royalties. Stop insisting that an imaginary substance conform to mathematics. It doesn’t have to.
Honestly I don’t know exactly what are you implying with this $77 in Argentina?
Who is going to give that difference from West Canada Select price and that $77 to the oil companies? I am telling you there is more chance of latent nationalizing oil industry “a la Air Canada” style, where you have only one truly international and so called “private” airline operating but whenever they are in loss government somehow robs Peter to pay Paul and somehow airline keeps flying.
And I think that is the case in Argentina where you have only one major oil company.
But we are not there yet.
I said well over year ago that this Gucci version of oil product is just one more boondoggle and now after well over a year another rag of the paper (G&M) decides to confirm that. Some smart cookies write these business columns if it took them more than a year to figure that out. It is hard to keep the narrative alive when reality is hitting you with thick stick every day.
Hi,
I’m from Argentina (sorry for my bad english)…
In Argentina are many players YPF (wich is a S.A. or Public Limited Co.) is the most important but there are many others… Also there are problems between Producers Provincies (they want more than $77 because they take royalties) and the Nation (that want to goes down with the cost of the barrel).
But there is a big difference with Canada and almost the rest of the world… We are now consuming the same amount that we are producing. So we don’t really care too much the cost of foreign oil… An other thing is that $77 is false because there is a lag between official dollar and real dollar ($77 are almost $55 or less),
Thanks and Welcome Demian.
I will take your comment then whatever Bloomberg tells me 🙂
Well thank you for the info because we know now it is not $77 but more in line with the Brent price ($55) or little bit higher after this week.
Better yo may have a mix…
Our official dollar today is 9.6 pesos but if you want to buy some they aren’t there… so you have to pay 15 pesos.
So, oil in pesos are almost 770 per barrel…
If you want to change your pesos to buy 50 dollars to buy oil outside you need 750 pesos… and pay import taxes…
I prefer to buy “$77 argentinian oil”…
Demian,
I comprende what are you saying about peso/dollar and why the Argentinian government did that. But here in Canada nobody still understands what hit them. Oil producers in Canada are getting half of what Argentina producers are getting in $US dollars. They would pee in the pants if someone – anyone would paid them the difference to $77 peso dollars or $55 US dollars.
Yes… I put that because many people use the argentinian case as a weird country… and there is not much difference.
Now I’m trying to understend what you are talking about Canada.
I wish I knew more about production costs for the four Gulf OPEC members plus Iran and Iraq.
I also wish I knew how much of KSA’s increase in oil production, for example,which began in March, 2015, was oil from storage as opposed to produced.
In any event, I bet the extra 1/2 to 1 million barrels (if truly produced) are the most expensive barrels they have. So one wonders how much more income is really earned by the extra barrels.
shallow sand,
KSA’s production was increasing from March and peaked in June. Since then, it has slightly declined.
I don’t think they will (and can, and intend to) increase it further.
Saudi Arabia’s oil production
Source: JODI, OPEC (direct communications)
AlexS. Thanks. Surprisingly, KSA has really not increased oil production that much, especially in relation to the United States.
Euan’s post above indicates there is neglible spare capacity and it is almost all heavy oil with no refining capacity available for it. Given KSA interest in shale tech, would appear 10.6 may be their conventional peak.
Russia has been able to continue to slowly increase production. Do you think Russia is nearing conventional peak? Any recent news on Russian LTO efforts?
Will interesting to see how this plays out.
shallow sand,
The IEA estimates Saudi capacity at 12.26 mb/d and sustainable spare capacity at 2.06 mb/d (in September). However these numbers can be overstated and actual capacity may not exceed 11-11.5 mb/d.
Euan is right that most spare capacity consists of heavy oil with high sulphur content.
3 other Gulf states have very small spare capacity of around 100 kb/d.
Hence production increases in 2016 can be expected only from Iran and Iraq.
Libya is a big unknown, which potentially can add up to 1 mb/d
I think Russia could further increase production in the near term, but not by much. In the medium to long term it will try to maintain production at current levels, so it’s probably not a peak, but a plateau.
Russian LTO is a long-term story, similarly to the Arctic projects. No significant additions are expected until next decade.
Among other non-OPEC, non-US sources, some growth may be expected from Canada and Brazil, but in both cases it will be slower than previously expected due to lower oil prices.
With the declining US output and continued (albeit slower) growth in demand, the market will begin rebalancing next year.
In 1H15, that will mean lower excess supply vs demand, and from 2H15 demand will likely exceed supply.
This scenario implies that additional supplies from Iran do not exceed 500-700 kb/d, Libya remains in doldrums, and there is no dramatic slowdown in global economic growth.
AlexS. Thanks for the post. I agree with you that Iran and Iraq appear to be able to add much more production than Saudi Arabia, Kuwait, UAE and Qatar combined.
Iraq in particular has many areas to be developed, subject primarily to political instability.
For example, Rumalia oil field production has ramped up significantly and it appears there is much room to run at a very low price.
Does anyone here have a source for how much money was loaned to the tight oil fracking industry?
You will find this number is fuzzy, as is true for all long term debt everywhere, because issuance rolls over on maturity and that may not be tracked.
Oil and gas debt held by US banks is over $270 billion, but that would include conventional production.
I have read in excess of $1/2 trillion, a number off the top of my head.
Shallow: I think you will find the press release at the link below from FDIC interesting:
https://www.fdic.gov/news/news/press/2015/pr15089.html
Here is an excerpt:
“Oil and gas commitments to the exploration and production sector and the services sector totaled $276.5 billion, or 7.1 percent, of the SNC portfolio. Classified commitments—a credit rated as substandard, doubtful, or loss—among oil and gas borrowers totaled $34.2 billion, or 15.0 percent, of total classified commitments, compared with $6.9 billion, or 3.6 percent, in 2014.”
I went looking for this because a local bank is seeking to increase is liquidity via a preferred stock offering. It is trying to raise a multi-million $ amount. The offered terms are a 5% dividend, 5 year term, and share repurchase at redemption date. The bank is 30 + years old.
I am told another local bank is doing a similar offering.
Hmmm…..liquidity issues and off balance sheet financing. Where has that been tried before in the oil patch?
Banks do preferred offerings all the time.
Quick example, go to finance.google.com and enter stock symbol bac. and that’s a period after the c and look at all the preferred offerings/issues.
Quick lesson for the partially washed. Preferred stock is equity that usually has no voting rights for corporate governance determination. Speaking practically it’s usually priced about $25/share and pays a higher yield than any common dividend. Preferreds get their dividend first. If there isn’t enough profit to pay preferred divvies and common, common has to get zero.
There are cumulative preferreds and convertible preferreds. Cumulative means if a quarter’s dividend is missed, ya gotta make up that quarter’s missed payout before you can pay to common shares. Convertible means can convert to XXX shares of common. blahblah
Anyway, a bank issuing preferred stock is not eyebrow raising in any environment. That is, excluding issuance bought by Buffet in 2009. Anything at all done that year was eyebrow raising.
Watcher, I am sure that you are far more knowledgeable than I in these matters. BUT…..those of us who witnessed and participated in the collapse of the 1st National Bank in Midland in the 80s get a little nervous when banks start needing money around here.
The article at the link below doesn’t begin to describe the human cost in West Texas caused by the 1st National Bank failure in 1983.
http://articles.chicagotribune.com/1986-03-23/business/8601220085_1_oil-prices-crude-permian-basin
John S. Thanks for the link! That is the release I was referring to earlier.
WTI below $43. Wow. Have to think the substandard or worse oil and gas backed loans are only going to grow.
Looking at Iraq and Iran more closely. I think those two are greater threats to KSA market share than US shale at this point in time. As US shale continues to drop, looks like Iran and Iraq are set to grow, with total costs likely lower than even KSA.
KSA has said repeatedly shale is no threat to them and they are no threat to shale. Shale oil can’t export. It CAN’T compete. And almost all US imports are coming from Canada and Mexico and Ven and Nigeria. Only about 1 mbpd from KSA.
They’re right — besides which shale oil isn’t the medium / heavy oil out of KSA. It’s not even the same product to envision as competing.
Watcher, you occasionally make some sense, sorta kinda.
But you know better, or at least you ought to know better, than to say shale oil doesn’t matter because it cannot be exported.
Oil is a fungible commodity traded in a brutally competitive world market.
A million barrels a day of domestic yankee production above and beyond “the usual” is a million barrels somebody formerly exported to us Yankees looking for a new home in some other importing country.
Taking a million barrels a day off our Yankee production would have approximately the same effect on the world market as if Saudi Arabia were to cut back by a million barrels a day.
But your remarks about oil supposedly going into storage recently seem to be very reasonable.
SURELY TO SKY DADDY the tank farms of the world must be getting pretty damned close to overflowing by now, and every rusty old tanker that will hold a few thousand barrels is probably full as well, sitting anchored someplace.
Perhaps the study of literature might turn out as helpful as the study of the sciences when one wishes to understand the business of marketing oil- or any other business, lol.
This quote courtesy of MR TWAIN throws a bright light on the words of the muckety mucks of the oil biz.
xxxxx
No fact is more firmly established than that lying is a necessity of our circumstances–the deduction that
it is then a Virtue goes without saying. No virtue can reach its highest usefulness without careful and
diligent cultivation–therefore, it goes without saying that this one ought to be taught in the public schools–at the fireside–even in the newspapers.
What chance has the ignorant, uncultivated liar against the educated expert? What chance have I against Mr. Per– against a lawyer?
Judicious lying is what the world needs. I sometimes think it were even better and safer not to lie at all than to lie injudiciously.
An awkward, unscientific lie is often as ineffectual as the truth. ”
XXXX
An awkard unscientific lie is often as ineffectual as the truth. Emphasis mine.
I am pleased that I ran across this little gem and posted it here sooner than Ronald Walter.
About that lyin’ Mark Twain, making up stories, Huck Finn, Tom Sawyer, and their adventures, all lies, lol.
“And I remember Muscatine — still more pleasantly — for its summer sunsets. I have never seen any, on either side of the ocean, that equaled them. They used the broad smooth river as a canvas, and painted on it every imaginable dream of color, from the mottled daintinesses and delicacies of the opal, all the way up, through cumulative intensities, to blinding purple and crimson conflagrations which were enchanting to the eye, but sharply tried it at the same time. All the Upper Mississippi region has these extraordinary sunsets as a familiar spectacle. It is the true Sunset Land: I am sure no other country can show so good a right to the name. The sunrises are also said to be exceedingly fine. I do not know.”
From Mark Twain’s book, “Life on the Mississippi.”
Muscatine, Iowa is known as the Button Capital of the World. Clams were dredged from the Mississippi mud, the clam shells were made into buttons.
Muscatine is the home of an office furniture manufacturer, HON, short for Homenomics, the company obtained surplus sheet metal from the US gov. It is the home of Monsanto, Kent Industries, an agricultural conglomerate, and also Bandag, a business that retreads worn tires.
Buttons from Muscatine crashed the world button market, went from a cottage industry to whole buildings equipped with machinery, electric motors, to punch out plugs to make buttons. Four species of clams were fished out of the mud to extinction. It is now illegal to dig clams for their shells. Clam shells with holes in them everywhere you go around Muscatine.
http://muscatinejournal.com/news/local/it-was-the-sunset-of-sam-clemens-years/article_adae133f-d02a-5ccc-80c5-e03d3cd18ec2.html
Samuel Clemens’ parents moved to Muscatine, he knew it well. Ain’t no lie.
If I’m lyin’, I’m dyin’!
My recollection is that someone posted a comment documenting that US imports from KSA is well below 1 mbpd.
OIL GLUT DEEPENS WITH 100M BARRELS AT SEA
“Patrick Rodgers, the chief executive of Euronav, one of the world’s biggest listed tanker companies, said oil glut was so severe traders were asking ships to go slow to help them manage storage levels.”
http://www.ft.com/cms/s/0/f763a6da-8859-11e5-9f8c-a8d619fa707c.html#axzz3rD5Ye7ss
wti futures 11-11-2015
Gonna put it all in those imaginary empty storage tanks.
And btw all you supply and demand worshippers . . . just who is buying oil to store, when storage has throughput? You aren’t buying to store it for future higher price. You buy it to store it to flow it outward incrementally to consumption, with new oil coming in to refill the tanks. FIFO. That’s how Cushing works. If price rose, the oil getting sold from storage just went in there last week or 2 weeks ago. It didn’t get there in January. There’s no big profit.
From the Financial Times on Energy Debt
http://www.bloomberg.com/news/articles/2015-11-11/opec-challenges-shale-afresh-as-iraq-crude-floods-gulf-of-mexico
Oil Industry Needs Half a Trillion Dollars to Endure Price Slump
Debt repayments will increase for the rest of the decade, with $72 billion maturing this year, (2015) about $85 billion in 2016 and $129 billion in 2017, according to BMI Research. About $550 billion in bonds and loans are due for repayment over the next five years.
Watcher and Shallow: Your numbers on total debt look a bit low, but I’m only siting the Financial Times.
dmg555. I was just throwing out things off the top of my head, which is probably not the best thing to do.
A lot of money borrowed by US upstream, and they are in tremendous trouble if prices stay below $60 WTI though 2016, and do not substantially recover in 2017.
http://www.bnn.ca/News/2015/11/10/Oil-could-hit-US130-as-US-output-falls-off-a-cliff-says-analyst.aspx
Cross post from Seadrill Investor Village board. Great interview.
Ron,
thanks for the post!
DOUG (and all),
those “global warming” lefties (or better: “leftwards” – as Wendell so eloquently put it!) are at it again.
They just made another “movie” to scare us all:
https://www.youtube.com/watch?v=IRlNHg64EW8
…and to think that this is Iceland in November…………………
………………………..heaven help us all!
Be well…..while you can…,
Petro
P.S.: if somebody did post the link already, my sincere apologies for missing it!
Sorry for the off topic (slightly) comment, Ron.
wimbi says:
11/07/2015 at 5:10 pm
“Hey Chief, why isn’t everybody yelling for the same —
Low CO2 transport ( and everything) and grid should be a national and a world priority.”
Hello Wimbi,
I think because of the same reason there is such a fight over the Affordable Care Act. They are both huge major economic changes with winners and losers. Keep in mind we are talking about peoples careers and lively hoods. Cutting into the profits of Exxon and Chevron. Remember less than a month ago how upset Mike was with Nick. Change can be difficult.
Right. That’s why I have given up on doing anything with those people. My simple strategy is to work locally, with people I know can influence other people right here and now, and hope it all grows.
So far, so good, and a huge amount more fun than groaning about hopeless world problems.
I have been very surprised to find so many small groups all over doing exactly the same. We gotta get together to cooperate, and I am spending some significant effort to help that.
So far, so good.
PS, I grew up fixing farm machinery in the 30’s-40’s, very simple indeed, no skill in diagnostics req’d when drive shaft lying in the mud twisted into a pretzel.
That driveshaft twisted my judgement to my initial assumption that any problem was simple to see and simple to fix.
But, truth to tell, a lotta problems today really are that, but people don’t do it. Like poverty. Solution- give ’em money. Problem solved.
Hi Wimbi,
I really regret never having had the opportunity to know you at the personal level. We think so much alike it’s scary.
But maybe you ought to have put a sarc alert after saying the solution to poverty is to give poor people money. Some body in the forum, maybe a lot of somebodies, is apt to take you literally.
Poverty is an incredibly knotty problem, one often discussed among old farmer philosophers over whiskey and cigars after the deer hunt or at the country store sitting around the stove on a nasty winter day.
Such men may be short of training in math and physics but they are as wise as any Nobel Prize winner in the ways of mens minds and personalities, and can tell many and many a story about people who are simply not just satisfied but proud to have figured out how to live working as little as humanly possible, regardless of the method- which can range from making a killing in the stock market to marrying money to just getting on welfare in one form or another.
I can name a dozen individuals at this very minute who are on disability who are in much better health than I am myself, and I still work. So do they- under the table.
In the words of some low life character in some novel or another, “I seen my chance and took it”, they saw their chance to get a check in the mail, forever, and took it.
I am ALL for doing something, lots of somethings, virtually anything at all, that will help impoverished people support themselves.
But simply GIVING them money will never work in this world.
The desire to work and be productive is not inborn like the urge to screw and consequently make babies, at least not universally inborn. It seems to be more of a cultural thing.
The dozen individuals I know on disability at this minute who are not really disabled to any real extent are all individuals known to me for many years. I would no more betray their identities than the typical member of this forum would run to the cops because he knows a relative smokes pot.
They all USED to hold such regular jobs as they could find. I am not passing judgement, I am a Darwinian and believe that it is as natural as the sun coming up for men to occupy every environmental and economic niche available to them.
I personally collect SS benefits and Medicare benefits which are in my own estimation more generous than what I should, in relation to what I paid in over the years, with the bill for these benefits being handed off to coming generations, whereas I am childless. But you can bet I am not turning these benefits down, no siree!!!!
Welfare is a damned tricky tool. Poverty is like GRASS, the green kind cows eat. The MORE you try to kill it by grazing it, the more and better it grows, because it is ADAPTED to grazing. Trees die from being grazed, and cows eat little trees. So if there are enough cows, the area in grass tends to EXPAND.
The more people you have on welfare, the more attractive an option it becomes for those who are not, if they are just barely getting by doing hard nasty dangerous boring demeaning poorly paid work. They take the bennies, and work under the table, and are better off for doing so.
As things stand this very minute, it is better for a woman and a loyal man and a couple of kids to be unmarried, with him officially living elsewhere, in the event one or both of them is qualified only for such low wage work as clerking in a store.
I can name half a dozen couples well known to me in this situation living in my immediate community, and if in their shoes, I would do exactly the same thing they are doing.
Many and many an hour I have spent trying to come up with a solution to this problem, with virtually no success, in terms of a short term solution.
Just cutting of benefits can work but only to a very limited extent. Doing away with benefits would be inhumane to the nth degree and a recipe for a revolution.
Better education etc help, but getting results takes a generation.
Perhaps somebody smarter than I am can enlighten me.
Are you familiar with Henry George from the eighteen hundreds, (his funeral was said to have been rivaled by only that of President Lincoln’s, but very much forgotten in our day) and his economic Ideas, such as ( allowing only one thing to be taxed, namely land.
The idea being that every person is entitled to their own labor, so it should not be taxes, whereas the inhabitants of an area are colectively responsible for the increase in the value of land, so it should be taxed for the benefit of the people.
He was of the persuasion, that every person on the earth has an equal right to the earth, and that taxing property owners land but not their improvements would be a good way to reflect his belief system.
This taxation in my opinion would take a big chunk out of all the crazy rents in our cities and the imposible land prices in farming country.
My Dad used to talk about some poor folks in Paraguay , dependant on handouts, etc. When the opportunity to make a profit raising soybeans presented itself these people woke up, and got to work. The Mexicans in the US are another example, that When there is hope people can do the unthinkable. But as soon as that hope to better ones position in life is lost, then it seems that nothing can counter it.
Mac says – “Perhaps somebody smarter than I am can enlighten me.”
“I can name half a dozen couples well known to me in this situation living in my immediate community, and if in their shoes, I would do exactly the same thing they are doing.”
Stop focusing on others who optimize their standard of living within the system and focus on changing the system for better opportunities that we live within.
Here is an example by your favorite presidential candidate to address climate change and the problem of winners and losers.
http://www.huffingtonpost.com/entry/hillary-clinton-coal_56449c92e4b08cda34878b5d
Democratic presidential candidate Hillary Clinton unveiled a $30 billion plan Thursday that would protect coal miners’ benefits and prepare their communities as the U.S. transitions to cleaner energy sources. While Clinton has embraced strong policies to combat climate change and ultimately voiced her opposition to the controversial Keystone XL pipeline, the Democratic front-runner’s new proposal makes clear she won’t forget about coal.
Thanks much for the response folks. again, and as usual, I have a simple engineer’s kind of solution to Q presently before the committee – what happens when poor people are given money?
Give some poor people some money and watch.
As I remember, it’s been done. Result, some goofs, some good tries, some raging successes. So? What else is new? Now what?
Some interesting recent articles:
http://energyfuse.org/bakkens-inevitable-downturn-means-more-dependence-on-west-african-imports/
…while output in the Bakken has held up relatively well, it is set for a dramatic decline, ….
http://energyfuse.org/iea-changes-tune-in-2015-world-energy-outlook/
……while the tone of IEA’s report may be calm, many of its conclusions are cause for alarm….
http://www.oxfordenergy.org/wpcms/wp-content/uploads/2015/11/WPM-62.pdf
In any case, something is moving now very fast. In my view, everything points to a dramatic decline of US production, which will trigger another massive price rise by 2017. It is a much better option for US shale companies to cut production now as fast as possible and start production again when prices are high. This preserves financial and geological resources and will do also some good for investors. Active rigs in the Bakken are just 66 in November 12, a threefold decline over last year. This is the right move in the right direction.
Heinrich,
Thanks for the links, particularly the Oxford research report!
Good study revealing the key trends, but not pretending to make their own forecasts.
Particularly helpful are the charts using DrillingInfo data, to which we don’t have access.
I agree with you that 4Q15 marks a more decisive turn in LTO production than what we saw earlier this year. The downward trend will continue next year, and if oil prices stay below $55–60, I’m not sure that tight oil production will rebound by the end of 2016. In fact, with low oil prices and subdued drilling/completion activity, the decline in LTO output may even continue into early 2017.
Hi AlexS and Heinrich,
Thanks for the Oxford link, very interesting.
The Oxford study fails to take account of wells waiting on completion and how this can mitigate the fall in the rig count. For the Bakken there are 993 wells waiting on completion (WOC), even with a rig count of zero if 100 of these wills were completed per month that would last for almost 10 months. A better analysis would consider that the oil companies will start to complete the inventory of DUC wells and that a steep decline in output is not likely. Of course they did not say that the “imminent decline” would be steep, but the focus on the drop in rigs seems to imply that conclusion.
Also interesting is the DUC well estimate of 1500 wells for the Eagle Ford. For the Eagle Ford it looks like a 5 or 6 month lag between the rig count and production volumes is a better estimate than the 3 months used in the Oxford report.
Hi Heinrich,
Yes for the Bakken there were about 80 wells completed in October based on the daily reports, where I assumed all confidential wells “plugged or producing” were producing rather than plugged. I also noticed there were 15 to 20 EOG wells that were temporarily abandoned, maybe they have shut in some wells and are waiting on higher prices (a guess by me).
Note that the recent scenario I posted for the Bakken has the completed wells decreasing to 75 wells per month from Sept 2015 to Dec 2016, which results in about a 210 kb/d decline from August 2015 to Dec 2016 for the North Dakota Bakken/Three Forks play. If the Eagle Ford Play completion rate falls to half its previous 12 month average (204 wells per month), the decline there will be much steeper.
For the scenario below the completed wells per month falls to 100 wells per month from Jan 2016 to Jan 2017, output declines by 360 kb/d from Aug 2015 to Dec 2016. The total decline for both the Bakken and Eagle Ford would be about 570 kb/d for these two scenarios.
Note when comparing my scenarios to the DPR data, about 140 kb/b should be added to my scenarios to account for the conventional output that the DPR estimate includes, but my model excludes. I have deducted my estimate of 137 kb/d from the DPR estimate and included it on my scenario for Sept to Dec 2015. The DPR has Aug to Dec decline at 266 kb/d, my model has decline at 122 kb/d over the same period. Chart below with completed wells falling by more than half over previous 12 month average completion rate (similar to the Bakken scenario).
Hi Heinrich,
As I mentioned yesterday the DPR scenario must assume fewer wells are completed.
I have created a scenario which roughly matches the DPR estimate from Sept to Dec 2015. The well completion rate must fall to 40 new wells per month (from a previous 12 month average completion rate of 198 wells/month), this seems unrealistic to me.
For this scenario the completion rate stays at 40 wells per month from Dec 2015 to Dec 2016 and output falls by 656 kb/d from Aug 2015 to Dec 2016 and by 265 kb/d from Aug 2015 to Dec 2015. Bakken and Eagle Ford together fall 865 kb/d from Aug 2015 to Dec 2016 and from the March 2015 peak the fall is about 1000 kb/d. Chart below.
http://www.bnsf.com/about-bnsf/financial-information/weekly-carload-reports/
Week 44 carload report:
Petroleum carloads: 8,502
2014 week 44 petroleum cars at 11,580.
BRK.A is $202,355, down from a 52 week high of $229,374.
Transporting oil by railcar has its ups and downs. A 900 dollar per car price swing for the stock price.
Hey Ron,
I feel like I’m being discriminated against. I think I’m the only one here who didn’t receive an offer to get help with my s.t.u.d.e.n.t d.e.b.t 🙂
But seriously, how does crap like that get through the spam filter while some of our regular and rather mundane posts get caught in it?!
Wouldn’t posting a toll free phone number be a huge red flag for the spam filter?
Cheers!
Fred
Fred, I have no idea how the spam filter works. But it does keep about 50 or so comments per day from being posted. All in all it works pretty good and only screws up on occasion.
All in all it works pretty good and only screws up on occasion.
Ron, To be clear, I’m not complaining I was genuinely curious! And BTW a big thank you to you for having put this site together and keeping it running so all of us can can keep up with unfolding events. I think I can speak for most here, certainly myself, I’d like to offer an apology for the many times we cross the line here and there. Thank you for putting up with our many foibles and idiosyncrasies. I know it must severely strain your patience upon occasion. So know that we deeply appreciate the work you do here!
Ditto that and don’t think we don’t appreciate your (usually 🙂 ) well reasoned and erudite comments as well Fred.
Absolutely agree 100% with both Fred and Doug.
Thank you Ron.
HOW OPEC JUST CRUSHED OIL WITH ONE CHART
“Just when you thought it couldn’t get any worse – amid supply gluts, production surges, market share scrambles, and demand disappointment – it does. OPEC this morning confirmed not only no change in the already weak global demand picture but the current oil inventory surplus is the largest in at least a decade. This has driven WTI prices down close to a $41 handle this morning (from over $48 a week ago) as simply put, there’s too much oil and OPEC’s grand strategy for solving this imbalance – pray for a colder winter…”
http://www.zerohedge.com/news/2015-11-12/how-opec-just-crushed-oil-one-chart
Given that we have probably seen little, if any, increase in actual global crude oil production since 2005, I wonder what percentage of the inventory surplus consists of condensate? As a case in point, reportedly most of Iran’s stored oil consists of condensate.
We have seen little, if any, increase in global CONVENTIONAL crude oil production since 2005. US LTO output is up 4.5 mb/d. There are are oil sands, NGLs, fuel ethanol and some other liquids, which are included in both global production and consumption numbers by the IEA, EIA and OPEC.
If we exclude non-conventional oil and non-oil liquids from production totals, then we should do the same with consumption. Consumption of oil from conventional sources also did not increase since 2005.
Guys, guys, guys. There is no law of the universe that says supply and demand determines price.
That’s like money again. A man made substance that doesn’t have to mean anything other than what man says it does. Since the start of the year people have been struggling to make it all fit a surplus presumption, despite there being no storage for that amount of oil.
It’s all crap, guys. The price is being determined by agreement between buyer and seller, and neither is searching the world to find full or empty tanks.
The price is being determined by agreement between buyer and seller, and neither is searching the world to find full or empty tanks.
Of course it is. And there are thousands of buyers and thousands of sellers. And a buyer buys according to his needs and what he can afford to pay for what he needs. And the seller sells according to how much oil he has to sell and what price he can demand for it.
Every buyer buys at the lowest price he can find and every seller sells at the highest price he can get.
It is not only supply and demand Watcher, it is also just plain everyday common sense.
Hi Ron,
You are correct. Watcher just doesn’t buy it. I have just decided to ignore his supply and demand stuff, economics is pretty basic stuff, but Watcher sees things differently and has a hard time distinguishing the actions of individuals and businesses on a microeconomic level from their interaction in the market as a whole. He should read a microeconomics introductory textbook.
I assumed that you knew I was talking about actual crude oil production, i.e., generally defined as 45 and lower API gravity crude oil (AKA as the stuff that corresponds to the price indexes), but perhaps I was wrong.
Some global crude oils:
Jeffrey,
Nobody knows exactly, how much condensate and light oil with higher than 45 API is produced globally. You may be right, that this number remained relatively constant since 2005. But does it really matter if growing part of global demand is met by non-crude liquids? After all, condensate and very light oil are valuable products, they can be used in oil refining (unlike most of NGLs).
P.S. Assuming that the share of condensate in conventional C+C production is constant, and large part of LTO is condensate and ultralight oil, the volume of oil that corresponds to you strict definition was indeed relatively stable or only slightly increased since 2005.
World Total Liquids supply 2005-14
My point is that it seems quite likely that despite trillions of dollars in upstream capex since 2005, we have seen little or no increase in actual global crude oil production, while global natural gas production–and associated liquids–have so far continued to increase. It seems to me that this might be an important point, since it would also be known as Peak Crude Oil, but I seem to be very much in the minority.
A slightly edited version of a prior essay follow. For the sake of argument, I assume that global crude oil production was about 70 million bpd in 2005, and that global crude oil production increased at the same rate as global C+C production from 2005 to 2014 (0.6%/year, rounding production off to 74 and 78 million bpd respectively).
Jeffrey,
Upstream capex is spent not only on oil, especially “45 API and lower gravity crude oil”, but on natural gas, and hence NGLs, as well.
But I agree with you, even if we include all hydrocarbons, growth in production since 2005 was much slower than growth in investments. That is called rising capital intensity, or rising capital costs per BOE. Operating costs per BOE were rapidly rising as well.
This reflects peak low-cost oil, not peak oil in general, as there is no physical shortage of oil.
Did I say it was?
Here is what I said:
It would help if people would respond to what I wrote, not what you guys think I wrote.
The majority of crude output is becoming heavier (more energy per barrel), so in energy terms the total energy in the C+C output may have remained the same even if there is more condensate in the C+C stream.
We really don’t have the data to say with any confidence what the energy output is. Though using BP’s data in Millions of tonnes of oil equivalent probably is about as close as we will get. Perhaps crude less than API 45 has remained constant. Nobody reports output in this way so a pretty complex set of assumptions need to made to conclude that. Perhaps the natural gas output has become much wetter, certainly natural gas output has not doubled since 2005 so for crude to have remained flat the barrels of condensate per barrels of oil equivalent of dry natural gas produced had to increase from 8% in 2005 to 13% in 2014. Hard to determine if this is correct, we only have data for OPEC (31 Mb/d and Texas 3Mb/d) so we have a little less than half of World output represented. We know that there has been a huge increase in condensate
in Texas from the Eagle Ford play so perhaps Texas is not representative of the rest of the World.
“The majority of crude output is becoming heavier ”
Exactly!
The majority of crude output OUTSIDE US is becoming heavier.
That makes condensate and ultalight oil particularly valuable, as they can be blended with heavier crudes.
Crude exports ban in the US, where, by contrast, C+C output is becoming lighter, prevents normal interexchange of crudes with different API gravity between the US and other markets
Hi AlexS,
I agree 100% on the export bans in the US, it is a stupid policy.
Based on 2014 data, the rest of the world (excluding US & OPEC) would be 47% of global C+C production in 2014. If the rest of the world is similar to OPEC, it would imply that condensate production in the rest of the world increased by about 1.4 million bpd from 2005 to 2014. My OPEC + US increase in condensate production estimate is 2.4, which would put the total global increase in condensate production at 3.8 million bpd, from 2005 to 2014.
As noted above, global gas production increased by 23% from 2005 to 2013 and global NGL production increased by 26% from 2005 to 2014 , while global C+C production increased by only 5% (EIA):
http://i1095.photobucket.com/albums/i475/westexas/Global%20Gas%20NGL%20C%20amp%20C_zpskb5bxu6d.jpg
While it seems to violate some people’s worldview, I don’t see any reasonable explanation for the discrepancy in rates of growth other than actual global crude oil production virtually stopped increasing in 2005, especially when we run the numbers assuming that crude oil production accounted for all of the 0.6%/year rate of increase in global C+C production from 2005 to 2014 (74 million bpd to 78 million bpd), i.e., this would imply no increase in condensate production, when we know that it is not true.
Hi Jeff,
The position that makes the most sense is that some of the increase was condensate and some of it was crude. Just because you are arguing that it was all condensate increase does not mean anyone else is arguing that it was an increase in crude only. So you have created a straw man that does not exist.
More qualitative objections to quantitative arguments . . . .
If we assume that 2.4 million bpd is a reasonable estimate for the increase in condensate production from the US + OPEC from 2005 to 2014, if the rest of the world showed no increase in condensate production over the same time frame, the maximum rate of increase in global crude oil production that we would have seen from 2005 to 2014 was was about 0.3%/year (assuming global crude production of about 70 million bpd in 2005, and rounding off global C+C production to 74 in 2005 and 78 in 2014)–as annual Brent crude oil prices increased from $55 in 2005 to $110 for 2011 to 2013 inclusive (remaining at $99 in 2014).
Mathematically, it’s a virtual certainty that the rate of change in global crude oil production was slightly negative or very slightly positive, perhaps +0.1%/year, from 2005 to 2014.
Jeffrey,
Most of OPEC condensate production is accounted as NGLs. So their numbers are not directly comparable with statistics for other countries.
OPEC definitions from their website:
” Natural gas liquids (NGLs):
those reservoir gases liquefied at the surface in lease separators, field facilities or gas processing plants. NGLs consist of field condensates and natural gas plant products such as ethane, pentane, propane, butane and natural gasoline. ”
http://www.opec.org/library/Annual%20Statistical%20Bulletin/interactive/2009/FileZ/definition.htm
They do not mention pentanes+, except natural gasoline. If there is some production of this category, it is included in “OPEC crude”
I subtracted OPEC crude only from EIA C+C.
It never occurred to that the condensate data quality is a problem, except of course where I discussed the issue in my comment up the thread:
*The EIA estimates that US condensate production increased by about one million bpd from 2011 to 2014.
In any case, the EIA shows that OPEC gas production increased by 51% from 2005 to 2013, while OPEC C+C production increased by 2% from 2005 to 2013/2014.
Given that the condensate is a byproduct of natural gas production, what does that imply to you in regard to condensate production?
In my opinion, if anything an estimate of an increase in 1.2 million bpd for OPEC condensate production from 2005 to 2014 is very much on the low side.
Bank sign shows Car Loan rates ~ 50% of Home Loans.
Korea made auto’s with a salvage value of 50% ( If Fuel Stays cheap ) in 24 months over stable Investments like Homes. Smells Funny. Anyhere, here come the juice to rule them all.
Jam up – It’s still Hurricane Season..
http://www.zerohedge.com/news/2015-11-12/something-very-strange-taking-place-coast-galveston
If you click on each ship on the map you can get the detail for each vessel – type of vessel and port of last call, etc. If you take the time to do that you will find that the vast majority of these vessels are not VLCCs and the last port of call for the majority of these vessels was Houston. Given those 2 facts, this does not represent a floating stock pile of crude oil….. But why let the zerohedge hype machine get in the way of facts…..
“Requiring a deadline Peakoil”
Begins to dominate discussion here, the type of oil – business. (?)
But it is important for planners is:
https://en.wikipedia.org/wiki/Predicting_the_timing_of_peak_oil
I understand there are no forecasts – because there is no reliable data on resources. (This is my personal guess, based on about what I read here in recent months.
Silly belief that “oil will never end” – leads back to the planning of idiocy like: transforming the railway lines on the road.
As if again and again, we would, years, 60th twentieth century!
My question is this: what are the oil resources of the Arab Gulf states?
Is no one knows? Is the real data are hidden (are available exclusively) for the most influential business?