The latest Petroleum Supply Monthly is out with the USA production numbers for January 2015. The data is thousand barrels per day with the last data point January 2015.
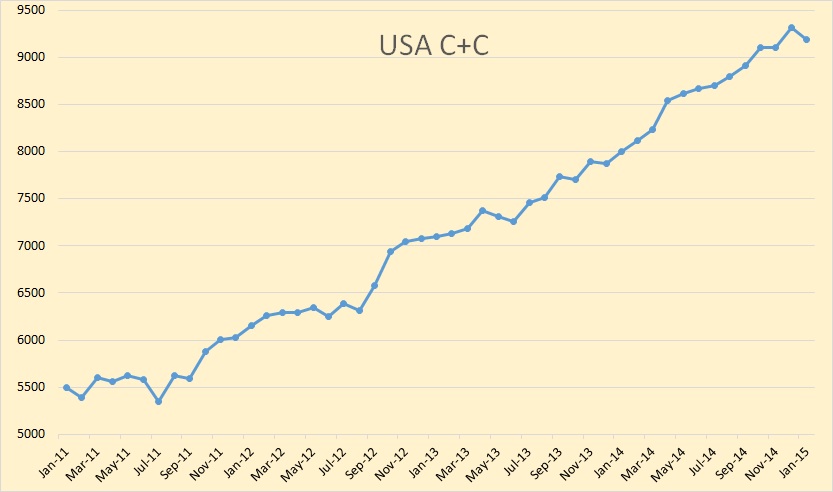
US C+C production was down 135,000 barrels per day in January. That is the biggest monthly decline since July of 2011.
I have shortened the states data to 25 months in order to give more emphasis on the January 2015 data.
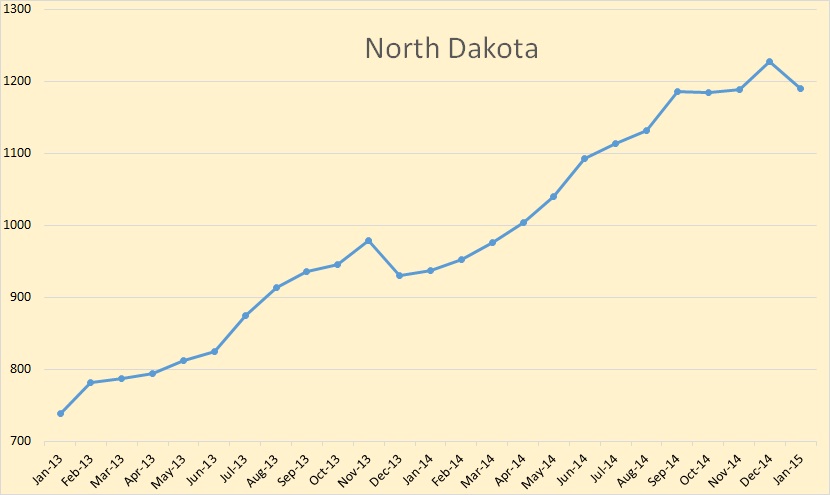
North Dakota was down 37,000 barrels per day, exactly what the NDIC reported. That is because the EIA gets their data from the states.
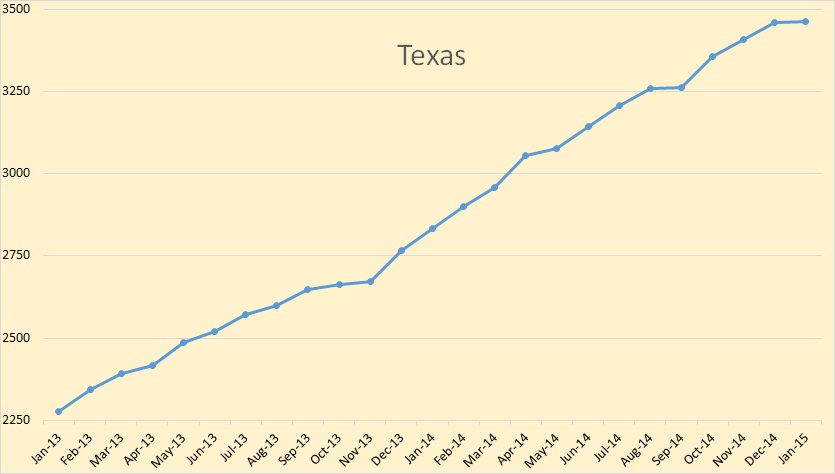
Texas was almost unchanged, up 3,000 bpd. The EIA gets the same data as we do from the Texas RRC so we know the data is incomplete and this is just an estimate. I believe this estimate is too high. I believe Texas should show a decline in January.
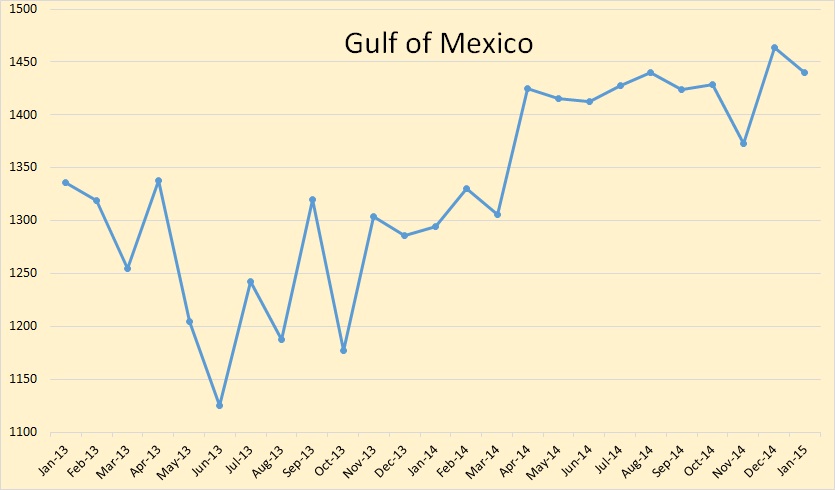
Production in the Gulf of Mexico was down 24,000 barrels per day. This could just be normal variation however, as such variation is common in the GOM.
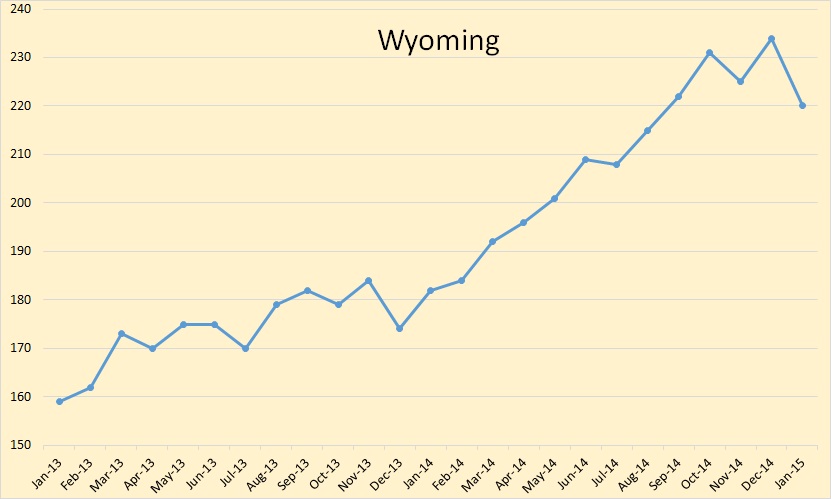
Wyoming was down 14,000 barrels per day. A huge drop for such a small producer.
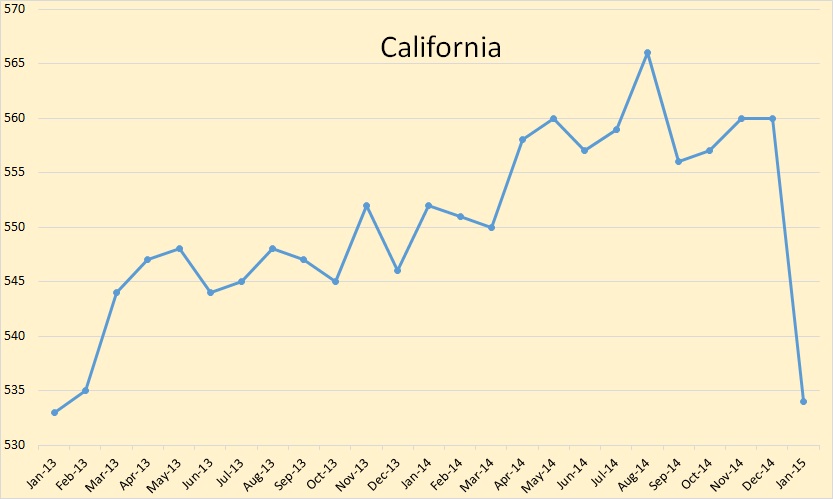
I don’t know what happened to California but they took a real hit, down 26,000 bpd or almost 5 percent of their production.
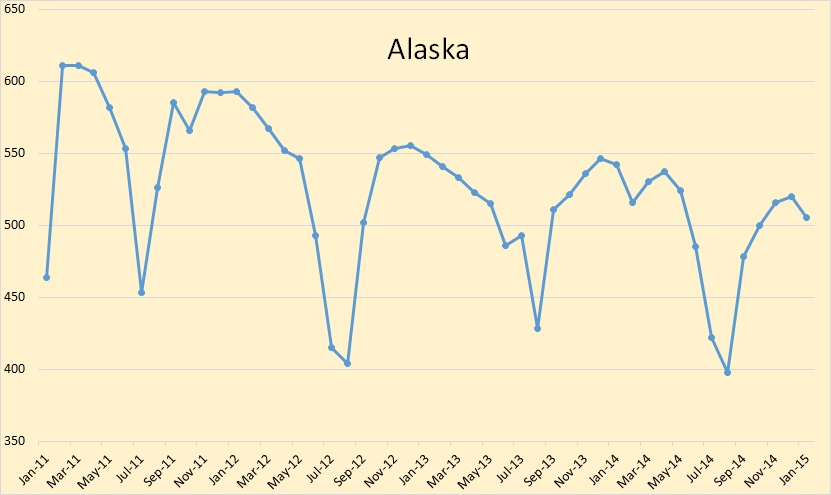
I am back to a 4 year chart with Alaska. Alaska was down 15,000 bpd. December is usually the peak month for Alaska and they do their maintenance in the summer.
Will the Kuwait-Saudi Neutral Zone be the first area to go over the Seneca Cliff.
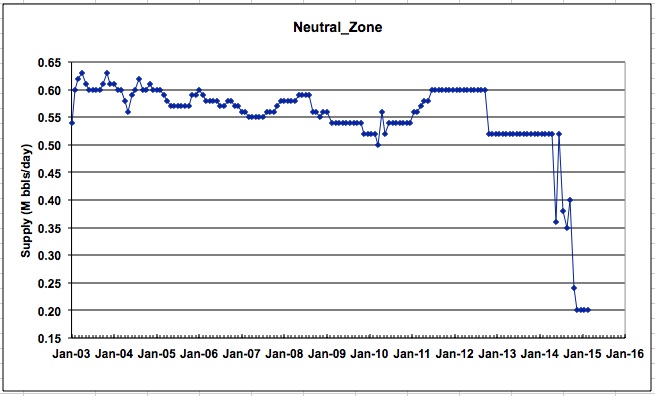
The Neutral Zone consist of four fields and part of a fifth. Not shown here is the Khafji field which is offshore.
Chevron – Aramco – KOC validate Wafra Steamflooding
In 2009, Chevron decided to test the thermal “EOR” enhanced oil recovery techniques with steam injection through the Large-scale Steamflood Pilot (LSP) project.
Since then the results of the steam flooding process enabled Chevron and its partners Saudi Aramco and its partners to envisage the development of Wafra in phases.
For the Wafra Phase-1 project, the operator KGOC is planning to invest $5 billion capital expenditure to produce 80,000 barrels per day (b/d).
The whole area is down from 600,000 barrels per day in 2011 to 200,000 barrels per day today. Apparently Wafra is down to almost nothing. But there is no doubt that part of the huge drop in Neutral Zone production is due to the shutdown of the Khafji field.
Kuwaiti production slid 60 kb/d to 2.76 mb/d in November due to the extended closure of the Khafji oil field in the Neutral Zone, run jointly with Saudi Arabia. The offshore field had been pumping about 300 kb/d before Riyadh shut it down on technical and environmental grounds. The Wafra oil field, in the onshore portion of the Neutral Zone, continues to produce about 200 kb/d. It is still not clear when Khafji will return to full production. For Kuwait, the Neutral Zone, which accounts for nearly 10% of its overall capacity, is vital to meeting output goals. In terms of Saudi capacity, however, the Neutral Zone accounts for only 2%.
In other news: Rosneft’s Vankor oil output may start declining next year
“(Vankor’s) oil production will stay at the plateau of 22 million tonnes this year, while next year it may decline slightly,” said Alexander Cherepanov, the chief engineer of Vankorneft, a Rosneft subsidiary which is developing the field.
The latest giant, or almost giant, to come on line in several years may be not what it was originally cracked up to be.
EDIT: Texas natural gas, oil production down in latest reporting periods: regulator
In the commission’s final production estimate for January, the state produced 81 million barrels of oil and 536.3 Bcf of natural gas. The commission’s final production estimate for December was 83.7 million barrels of oil and 553.2 Bcf of natural gas. The commission’s final January 2014 production estimate was 69.9 million barrels of oil and 566.5 Bcf of natural gas.
This works out to be 2,700,000 barrels of oil in December and 2,613,000 barrels of oil in January, a decline of 87,000 barrels per day. This does not include condensate.
_______________________________________________________
Note: If you would like to receive an email notice when I publish a new post, then email me at [email protected]
531 responses to “US January Production Data + Neutral Zone”
What happened in July 2011 to do the downtick?
Oh and I think I remember noticing a sharp smack to Calif’s drill rig count.
Hi all,
The edit function will be disabled for and hour or so.
Test it is working again, sorry if I messed anybody up.
Hi Ron,
I may have missed it because I skimmed quickly. The Dec estimate for C+C output was revised up by about 100 kb/d, so one wonders if next month the January output may be revised higher, the January estimate for the Monthly energy review and the Petroleum Supply Monthly are almost identical, but the Petroleum Supply Monthly(PSM) has Dec 2014 output about 100 kb higher than last month’s PSM and the most recent(March) Monthly Energy Review.
For the last 5 months from Petroleum Supply Monthly we have in millions of barrel per day
Sep 8.9
Oct 9.1
Nov 9.1
Dec 9.3
Jan 9.2
In Jan 2014 output was 8 million barrels per day so output has increased 15% in the last 12 months.
This may be the beginning of a sharp decline or the start of a plateau at 9.2 to 9.3 Mb/d, next month’s data will help us decide, I expect about 9 Mb/d in a month or 2, but a rebound in oil prices will keep output at that level or maybe a slight rise back to 9.3 Mb/d by 4th quarter, that depends on the oil price ($80/b or more will likely get us back to Dec 2014 levels).
I agree with Ron that when the dust settles Texas will be down from 12/14 to 1/15.
I also think absent an oil price spike, numbers will continue to trend lower throughout the year.
Just not nearly as many brand new 1000+ IP wells being put online as in 2014, and that has to show up at some point.
One further note, notice MRO down to two rigs running in Bakken, with one listed to stack. MOC is a conservative company, they have a tremendously strong employee safety culture, for example. They are not the type of company to throw money down a hole.
Dennis, I think it is just as likely that the revision next month will be down as up. Every month was revised this month back to January 2013 with the average revision up about 23 kb/d. But other months in the past the revisions have been just as strong in the downward direction.
As revisions come in from the states, the EIA revises their data and the biggest revisions likely come from Texas. That is why I think this January number will be revised downward.
Hi Ron,
You are probably right, I don’t follow this as closely month to month. I doubt it will fall below 9 Mb/d before June and if prices recover to $70/b or more by Sept, I think output will stabilize or increase slightly by years end. Oil price is the big wild card, if they stay under $60/b long term, then the output might fall to 8.5 Mb/d by Jan 2016 (this scenario is unlikely imo).
I guessing the drought in California wouldn’t really have any effect on oil production. There not any massive infilling projects out there are there?
Ron, the note says the Saudis shut in a 300,000 BOPd field for technical reasons. I suppose it’s technical and they increased production elsewhere to make up this loss?
Only half of that drop, or 150 kbd was Saudi’s. Their production was down 90 kbd from October to December and the other 60 kbd could be anywhere.
Ok, so they take a 150kbd net cut, increase 60 kbd somewhere else, and have an effective 90 kbd reduction. They may not have the spare capacity to make up the full 150 kbd loss?
Some interesting stats on Oklahoma earthquakes in the following Bloomberg article:
http://www.bloomberg.com/news/articles/2015-03-30/big-oil-pressured-scientists-over-fracking-wastewater-s-link-to-quakes
Interesting moral question. Is it more important to have $20 million diabetes centers than it is to not have a bunch of largely imperceptible quakes.
Study: Oklahoma’s daily small quakes increase risk of big ones
http://www.pressherald.com/2015/02/15/study-oklahomas-daily-small-quakes-increase-risk-of-big-ones/
There was a 5.6 earthquake in Oklahoma in 2011:
http://en.wikipedia.org/wiki/2011_Oklahoma_earthquake
1:2500 vs diabetes center.
Boren btw is the real deal. Moderate GOP Senator for many years who left some time ago to take that univ prez job, and obviously decided to keep it — 20 yrs. Michael Price, of “Mutual Shares” fame, also left Wall Street for Oklahoma Univ and brought his money with him. That place does have brains and bux.
Boren is, and always has been a democrat.
Yup, my bad.
Laughable — Americans have no idea how yawn-inducing they are or how childish they sound in substituting the clichés of partisan politics for thoughtful discussion
Interesting moral question?
To me a more interesting question is that all if this surplus energy hadn’t been spent on creating a society where people sit all day in front of screens for work and entertainment while munching french fries and fat burgers and processed chicken nuggets and drinking oversized cups of carbonated corn syrup, is it possible the we might not even need those $20 million diabetes centers at all. Gotta wonder what might happen if we learned how to walk, ride bicycles, eat healthy and at least occasionally turned off our electronic communications devices and actually had face to face conversations now and again? Nah, that would probably be a really bad idea…
I won’t be sorry if the scarcity/price of oil reduces the amount of corn grown for corn syrup.
Fred, you are probably very right. Lifestyle is a big factor in diabetes and cardiac epidemic in this country. Personally, I dropped TV years ago, because content was mostly valueless to me and the few shows I used to like I could get on my computer. Now I have little or no interest in TV shows at all.
However, the whole TV/Cable thing is changing. TV will be on most computers and other devices and on demand. So I doubt if the problem will go away soon.
As far as food goes, just eating food that doesn’t need a list of ingredients label would benefit a lot of people. You know, real foods that you have to cook at home (not just heat in the microwave). I was already eating a fairly healthy diet when the final straw happened. I like fruit pies, oftentimes make them myself, but went to buy one in a supermarket. The list of chemical ingredients was amazingly long. I put it down and now don’t eat commercially prepared food if at all possible. Who knows what that stuff really does to you.
How we could convince a large population to convert away from sugar/starch/ chemical garbage I do not know. We live in an age where most people want everything done for them and they want to spend as little time as possible on the mundane things in life (like cooking) and spend their time watching mindless entertainment or playing computer games, or texting incessantly.
Just to diferentiate re: diabetes (apologies for those who know this already)
My wife developed Type 1 diabetes at age 13. It is an auto-immune disease similar in origins to lupus, rheumetoid arthritis, etc…where an over-active immune system goes on to attack a part of the body. In a diabetic’s case, the immune system destroys the pancreatic islet cells that produce insulin. It may have started with a cold? No one knows how it starts. It didn’t start at 7-11, that much is for sure.
What is often disparingly referred to as ‘diabetes’ is actually type 2, where your body produces insulin but has trouble absorbing it (usually due to poor diet and being overweight, but not always), thus resulting in higher blood sugar levels.
In my wife’s case, who is in excellent physical condition at age 55, if she strays from a healthy life style and screws up her regimen, she will die in short order, either in a diabetic coma (first recognized as almost drunk-like behaviour, followed by a sweating convulsion) or will soon destroy her body much like a type 2.
Her excellent health is due to the great insulin now available, and blood testing kits (than you micro-electronic sensors and the people who made invented them). Also, I attribute this to her good character and determination, + the excellent medical care she receives from BC Medical Services (single payer).
I always like this next part….besides his sharing credit and noble prize winnings with fellow researcher Banting gave away the rights to ‘insulin’:
“Banting, Macleod, and the rest of the team patented their insulin extract but gave away all their rights to the University of Toronto, which would later use the income from insulin to fund new research.
Very soon after the discovery of insulin, the medical firm Eli Lilly started large-scale production of the extract. As soon as 1923, the firm was producing enough insulin to supply the entire North American continent.”
Imagine….giving the rights away to the university. It is a different world, these days.
My point being, I am a little sensitive about the term diabetes tossed around as if it is all a result of chunking up treats at the table and no exercise, or a lack of character. I have also met very fit people who have gone on to develop type 2 diabetes and need insulin. May it never happen to you good folks.
I have also read doomers who believe that folks who develop diseases such as dibetes should just be allowed to die….as if they deserved to get sick. It is not that simple. My wife has made huge contributions to her family, community, and career. The world would be poorer for her not having lived.
We are heading out in 20 minutes to go buy some kayaks!! Have to run.
regards
Paulo
From New England Journal of Medicine -2001
“A total of 91 percent of the cases of diabetes in this cohort (95 percent confidence interval, 83 to 95) could be attributed to habits and forms of behavior that did not conform to the low-risk pattern.
CONCLUSIONS:
Our findings support the hypothesis that the vast majority of cases of type 2 diabetes could be prevented by the adoption of a healthier lifestyle.”
http://www.ncbi.nlm.nih.gov/pubmed/11556298
The food industry is very much to blame, filling everything with sugars and pushing starches, as well as adding a long list of chemicals to our diets. About 60 percent of people cannot handle sugar surges well, causing diabetes and cardiovascular problems, also eye problems. If society would really push the info hard at people as to the risks, maybe more would eat and act sensibly.
There are so many great medical advances out there now. A friend of mine works for a company that made a device using modified EEG to detect eye problems in infants so that many can be saved from blindness before it is too late.
Good luck to you and your wife, a tough road to follow but enjoy life as much as you can. I lost my wife last year after a nightmarish decade long struggle with multiple cancers. We used to love whitewater kayaking and rafting together.
All the best to you too, Allan. This life business is tough for us all at one time or another. Thank you for your reply.
Hi Paulo,
Yes I am aware of the difference between Type 1 and type 2 diabetes. I was indeed referring to Type 2 diabetes which in our society is the overwhelming majority of the cases and it is generally exacerbated by poor diet, lack of adequate exercise and consequent obesity. And as I’m sure you are well aware there is very little incentive for preventive health care in this country. So we end up with a perverse system where 20 million dollar diabetes clinics are seen as the best solution to the problem.
I certainly wish you and your wife the absolute best! I myself gave up watching TV back in 2006 with all its mostly contentless programming. Haven’t really missed it. I do spend time on line but at least I get to access information that interests me personally. Perhaps I am deluding myself somewhat that this is a better use of my time but at least I feel that I have a little bit of control.
I have also been an avid ocean kayaker since 2000 and use my kayak as a diving platform out on the coral refs near my home. So I can highly recommend that activity, may you and your wife spend many many hours enjoying being out on whatever bodies of water that you may wish to explore!
Cheers!
Fred
Are the earthquakes taking place in the same horizontal plane where they fracture to produce natural gas?
Most researchers are attributing the increase in earthquakes to wastewater injection wells.
The epicenter depth generally is a few to many thousand feet below the frac depths (horizontal plane) of productive zones. Water injectors may be diverted below the production zones though, to keep from circulating water back to producers.
3.0+ Earthquakes in Oklahoma (2015 on track for 875):
Jeffrey: It would be great to have graph of barrels injected to compare to that.
I had the same thought – but can’t find anything as of yet.
There is the grand-daddy of injection wells and earthquakes,
the Rocky Mountain Arsenal injection well.
http://earthquake.usgs.gov/research/induced/pdf/Healy-et-al-1968-Science-%28New-York-NY%29.pdf
Right hand side of figure 1 shows good correlation between volumes of fluid and number of earthquakes.
Most of the wastewater is due to the rise of dewatering wells, and is being injected near okc and a bit north, where there have been a few 4+’s the past few months (the 5’s were near Prague on a different fault system). There really needs to be better regulation about the injection pressures that are allowed to limit the incidence of eq’s. Hamm’s tactics are a pure attempt at strong arming and it would be nice if there were some way to impose penalties for such behavior. Hopefully the drop in oil prices shuts in some of these dewatering wells down too and that exacts some punishment on Hamm.
Watcher,
Look up a term called the b value. Basically it shows that as lower magnitude eq’s increase, large eq’s scale with them (albeit logarithmically). I have to check the data (at home now), but I think the latest b values are showing that 5’s are likely to occur every 2-3 years, 6’s around 50, and 7’s every few hundred (maybe 700 if memory serves). Of course these are just estimates, but the risk only rises as fluid injection continues in the same formations that are already overpressured. One magnitude 6 or 7 could easily do billions of damage, not to mention possible loss of life, so I’d say it is important to limit the eq’s so they don’t wreck the $20 million diabetes center, plus lots more.
Hillson: Am not in earthquake prediction business but very intersted in the science and graduated before hearing of “b” values.
Was there at one time a thought process that small quakes were regional stress releasers that would actually lesson the chance of bigger magnitude, or at least divert the stress to another area down the fault? I also have been curious that in pulling up maps of epicenters they appear very scattered as opposed to lining up along one fault. Could we be looking at more of a regionally stressed area fracturing when friction is reduced by the injectors?
Not exactly. Injecting fluids at the pressures and rates they have been has changed the stress state in the subsurface dramatically. Easiest way to think about it is more small eq’s means more big ones too.
MBP, where for out thou?
Reverse faults, normal faults, thrust faults, whatever kinds of faults they might be, sometimes grow with depth (get bigger) and sometimes fizzle completely out with depth. They don’t often exist from surface to CE. Injecting waste water at 10,000 feet need not cause Mother Earth to burp at 7000 feet. She is always moving, doing Her thing, earth; I have had 30 year old production casing part, break in two, in a fault plane before. Its not like natural things stop occurring just because humans are around for a brief moment in geological time.
I often believe these shivers (we get them a lot in S. Texas too) are from massive amounts of produced water withdrawal along fault systems and pressure depletion. Injection wells are typically found in areas of production, and in areas of very high WOR. Just a thought.
Mike
Mike: Do you know if any injection wells were shut down in the Barnett earthquake swarm area?
No, sir, I do not believe so. I recall the TRC stating there did not appear to be any correlation but was going to “study” it some more.
Thou has been out looking at some moldic crinoid dolopackstone and wackestone cores. I am not a structural geologist, so though I took structure classes in undergrad its not something that I have focused on since then. There are probably people who have more knowledge on the subject than I do. That being said, I could see the small earthquake related to larger ones both ways, either by reducing overall stress or creating a situation where a major fault is more prone to slip. If anyone has any papers on the subject I’d like to read them.
I don’t think frac’ing a well will cause an earthquake that could be felt, I’ve looked at our microseismic and the propagations are not very far and there just isn’t that much water being put into individual producing wells. I’m sure it is technically possible but I just have yet to see the evidence for it. I do think that SWD wells could cause problems in the right tectonic environment, but the biggest issue to me is injection pressure. Many SWD wells inject above fracture pressure, which is dumb, and I think if they reduced the rates on those wells the earthquakes would reduce in frequency.
MBP, we inject above frac pressure because the disposal wells get the crap picked up by vacuum trucks, flow back, and mud. It’s not something I decided, but that’s just how it was done. Bottom line is I have seen wells take 10,000 bwpd year after year , all above frac pressure gradient. The disposal fall off shows the pressure builds. When I was supervising these things I made sure we didn’t have losses to through the upper seal at the well (ran temperature logs in offset producers). But I’ve always felt we didn’t do it 100 % right. By it I mean the water handling, and the way we had allowed the vacuum trucks to dump into the main water disposal tank. I assume it’s the same all over.
Do they do any Cutting re-injection in the lower 48?
In Sakhalin, they loved their re-injection well. All things went down, invert mud, cuttings and even cement, nicely sweetened with ample sugar.
These wells were definitely above fracture point, and also we were in a very seismic area. I haven’t heard of a big one there yet unless you count the 9.0 off Japan in 2011? smiles!
I went back and checked the data just to make sure I reported the right info. Using a simple b-value analysis, the frequency of EQ’s related to the current injections (2009-2015) are:
Mag 5 – every 5-6 years
Mag 6 – every 150-200 years
Mag 7 – every 4500-6500 years
whereas for the time period of 1970-2008, the frequencies were much lower:
Mag 5 – every 100-110 years
Mag 6 – every 900-1000 years
Mag 7 – every 7500-8000 years
The trends converge around Mag 7.2, indicating there is little effect of fluid injection on the very big EQ’s of Mag 7 or greater.
So my memory was way off for the 7’s, but the 5’s to 6’s are still very much a possibility in the near future, especially if fluid injection continues.
Image below (sort of) shows how these estimates were made.
Real Estate Fiesta in the Dallas/Fort Worth Area
Bloomberg: It’s almost impossible to buy a house in Dallas:
http://www.bloomberg.com/news/articles/2015-03-27/it-s-almost-impossible-to-buy-a-house-in-dallas
Down here in Houston, where we’re more tied to the oil industry, it’s a similar story. Housing inventories were at historic lows. There was a huge boom in detached single family, townhome, and apartment construction over the last few years. Now that the economy is slowing, there’s a developing glut of apartments and townhomes while SF housing development never caught up to demand.
One of the interesting aspects of the oil crash is the statistic that for every oil-related job in Houston lost, there are potentially 4 non-oil-related job losses. Government and business leaders down here are still optimistic, however, that this won’t be like the 80s because Houston has diversified into meds and IT. That 4-to-1 job dependency number doesn’t seem to reflect that hope. They also are counting on growth in the refining and chemical sectors to offset the upstream slowdown. But as I understand it, the success of the upstream sectors relies heavily on the Brent/WTI spread which narrowed as demand receded (until lately, when domestic oil stocks have been filling up).
I think Houston is in for a world of hurt that everyone is ignoring. Houston’s boom has been directly related to high oil prices. In effect, Houston has been living off of the massive wealth transfer from suburban America to the oil companies to go find that hard-to-reach oil. I don’t think demand will recover enough to rekindle the speculation necessary to keep the shale boom going again. So remember that next time you hear Rick Perry talk about the Texas Miracle.
Houston, you have a problem. Face it. The fundamentals of your existence are breaking down.
I was utterly stupified when I saw this Space Shuttle on the parking lot of the Nasa Space Center. It’s just corroding until it has disappeared, while you are looking at it.
My friends do not believe this. “Is this America?”
You could maybe adaptively-reuse that for a home with some architectural intrigue and panache… Imagine those thermal tiles on the kitchen floor or those engine exhaust cones on top of a trullo-like roof!
But if we had pure democracy, we’d be on Titan (etc.) by now, with truly robust, reusable spacecraft; liquid methane lake beachfront property and Earth-origin genetically-modified life swimming around; a terraformed Mars with a new moon, from a knockup of Phobos & Diemos and a few asteroids, circling it for some Earthlike tidal forces; Lunar cottage-country & low-grav sportsplexes; and Jacque Frescoworld (He’s 99 years old!) here on Earth, with Nick G ‘Can Do!’ EV valet-parking and PV-cleaning/polishing clones.
These could be where the clones sleep. It’s possible! Don’t let peak oil get you down! Everything will be fine! You’ll see!
Now some people might exclaim, ‘How can you let those poor clones sleep in those things?’. But then, BAU has built a world around us and expected us to ‘live’ in it whether we like it or not, so why not?
Keep up the good work, Caelan.
Your cover is secure.
[as usual, destroy this message upon reading]
——————-:END TRANSMISSION:——————–
Hey, still beats sleeping in a shack with a tin roof!
Or you could try micro dwellings >;-)
http://n55.dk/MANUALS/MICRO_DWELLINGS/micro_dwellings.html
Cheers!
They must be those things from where people do podcasts. (I always wondered about that. Now I know.)
Incidentally, is that your bamboo bike? I like, except for the yellow rims. I’d have gone with a neutral color, that way they are accentuating as opposed to overriding the bamboo’s natural color. Aside from that, how’s the ride? I imagine the bamboo naturally dampens some of the vibes?
Apparently, bamboo is a type of grass, so it’s a grass bike.
By the way, the fashion with men’s shorts seems to have gone back up over the knee and are generally tighter, less loose.
Thanks to your inspiration– ‘shack with a tin roof’ (which I think would be a fun project to renovate)– I found this cool site that I’ve bookmarked. It is one of those sites that, if you keep scrolling down, more pops up, and at a cursory glance, there’re some very nice shacks.
Speaking of podcasts, I’m listening to Ecoshock Radio.
Aside from that, how’s the ride? I imagine the bamboo naturally dampens some of the vibes?
Apparently, bamboo is a type of grass, so it’s a grass bike.
Roger that sir!
I’ve taken that bike on some pretty grueling trails and it has performed way better than I would ever have suspected. Given that it is designed to be a very simple bike and it has no mechanical shock absorbers it takes the rocks, roots and bumps remarkably well. Bamboo has the tensile strength of steel and because it is a grass it has the flex of materials such as carbon fiber. I love it!
I happen to like the yellow wheels it’s bright and cheery! As for my out of style shorts, I only wear my short tight ones on very special occasions BIG GRIN!
BTW, I have a friend in Brazil who is an agronomist and he owns a business called Bambu Carbono Zero he is a specialist in reclaiming depleted soils by planting bamboo, he tells me it is a great carbon sink too. The bamboo grows to commercial size much faster than any tree.
Fred,
Using bamboo for soil building is different! Here in central Florida, bamboos are invasive exotic plants and hard to kill. How does he get rid of the bamboo so he can grow something else once the soil is enriched?
Jim
hey Cracker,
Brazil has about 200 native species of bamboo so he is definitely not working with invasive species.
How does he get rid of the bamboo so he can grow something else once the soil is enriched?
I’d have to ask him about the specifics but I believe he harvests different tracts of it at different times. I also believe it is used as a means to prevent erosion so some of it is allowed to remain in place permanently. I think he also grows bamboo side by side with other plants, similar to what is done with Permaculture. So there is really quite a lot to it.
Next time I talk to him I’ll ask him.
Cheers!
Great stuff! As a kid I loved to burn it for the noise and flying shards as the joints steamed up and exploded.
I have been trying to make a logical fit of my automatic transmission to it, but hard to beat cost and simplicity of single speed chain.
Maybe should try bamboo in my pyrolyzer stove- turns it into gas and carbon. Carbon back to ground- negative carbon energy.
Interesting moral question?
To me a more interesting question is that all if this surplus energy hadn’t been spent on creating a society where people sit all day in front of screens for work and entertainment while munching french fries and fat burgers and processed chicken nuggets and drinking oversized cups of carbonated corn syrup, is it possible the we might not even need those $20 million diabetes centers at all, Gotta wonder what might happen if we learned how to walk, ride bicycles, eat healthy and at least occasionally turned off our electronic communications devices and actually had face to face conversations now and again? Nah, that would probably be a really bad idea…
I believe that one was a mockup, but still.
The oil crash should be short lived. As far as I can see production growth in the USA has stalled. We know it’s decining continuously elsewhere, and the low price encourages demand. Houston will be fine within 2 years.
Dallas. Wierd city. It looks like someone pulled the plug sometime early 1980’s. Still some 1920’s boomtime buildings last, others are replaced by 1970’s highrise. Others are replaced by… nothing. By parking lots in fact.
Nowadays, just like in the rest of the US, people flee the surrounding countryside and end up in suburbs of megacities, dreaming of big city life. Working at Subway’s or Wendy’s after all.
Cities boom because they boom. They grow because they grow. No significant economical activity sustains these cities, unless the fact that they are growing. (Phoenix AZ being the ultimate example.)
I write this from my average Belgian home. A house that was built in 1872, when Dallas was founded. I have everything available in walking distance.
https://www.youtube.com/watch?v=o_8b6ej0U3g&index=3&list=WL
23 minute video from Tom Murphy – A physicist explains the limits to growth. This presentation is very succinct, but may be a bit long term for some – the short term view starts around 20 minutes in.
Edit – you may have seen this 6 months ago.
Yeah, that video is quite succinct!
I’ve posted on this site a few times myself, I highly recommend watching more than once >;-)
Not playing for me. Can you post a link? Thx!
It was originally posted here:
http://library.fora.tv/2011/10/26/Growth_Has_an_Expiration_Date
But I want my pony!!!
Here ya go, you can keep it in a gerbil cage… there are times when I really hate humans!
It’s a strawman: no one is arguing that physical growth will continue forever, or that it needs to. Economies consist of Goods and Services, and the physical quantity of Goods can plateau, while their value grows (due to rising speed, quality etc. – think 2015 phone or computer vs 1980 phone/computer), and the value of services grows as well.
For instance, US sales of cars, homes, appliances etc., plateaued decades ago.
It’s a strawman: no one is arguing that physical growth will continue forever, or that it needs to.
Really? Where and in what context do you hear anyone openly discussing the downsides of economic growth? Not to mention that it is physically impossible to continue growth and it is not possible to completely decouple a value and services based economy from the constraints imposed by energy needs. As you well know, there is no free lunch!
BTW, Did a Google search on ‘The Benefits of Economic Growth”
About 56,700,000 results (0.53 seconds)
This sums up the mainstream view:
The benefits of economic growth include: Higher Incomes. This enables consumers to enjoy more goods and services and enjoy better standards of living. Lower unemployment With higher output firms tend to employ more workers creating more employment.
Benefits of Economic Growth | Economics Help
http://www.economicshelp.org/macroeconomics/economic-growth/benefits-growth/
anyone openly discussing the downsides of economic growth?
Economic growth isn’t the same thing as physical growth. Again, US sales of cars, homes, appliances etc., plateaued decades ago, while GDP is 2.5x larger.
it is not possible to completely decouple a value and services based economy from the constraints imposed by energy needs.
And, yet, US GDP is 2.5x larger than it was in 1979, while oil consumption is lower. Computers are 1,000 faster, but they weigh much less. Cars use half as much fuel per km, but they’re much faster, safer and more reliable. Doctors, lawyers and engineers use less paper. X-rays and photography don’t use silver film anymore.
Oil and other fossil fuels are expensive, dirty and risky. We don’t need them for a good life – the oil and coal companies would love us to think that they’re the only thing protecting us from disaster, but it ain’t so. We should kick the habit ASAP – we’ll be better off in many ways.
You do realize GDP dollars are not the same dollars now as then?
It’s adjusted for inflation.
The inflation adjustment includes speed, quality, etc. So, GDP growth is literally and officially defined as including those things. It’s very possible to have growth based on nothing but those “intangibles”.
It’s very possible to have growth based on nothing but those “intangibles”.
No, I’m afraid it is not!
Economic growth isn’t the same thing as physical growth.
Nick, you can’t possibly be serious! This is no economic growth without physical growth. At the end of the day it is impossible to completely decouple the economy from the physical world and therefore the laws of thermodynamics apply. Tom Murphy explains precisely why that is the case and let’s not forget, he is physicist, not an economist.
Tom appears to be a good physicist. And, as an amateur economist…not so much.
Tom is good at demolishing strawmen, like this.
Again, people have enough cars, and houses, phones and computers. They need improved versions, and they need better and more services: healthcare, eldercare, childcare, entertainment.
How? By better design, higher labor productivity, etc. Better ways of doing things, not brute force growth of “stuff”.
“How? By better design, higher labor productivity, etc. Better ways of doing things, not brute force growth of ‘stuff’. ~ Nick G
Don’t forget real democracy, freedom, ethics, where the ‘brute-force plutarchs and their henchmen’ don’t get to tell people what they have enough of, what they need and how to have it. That requires a fundamental rewiring of ‘economy’. Real and true economy means real and true democratic control over the means of production.
As for higher labor productivity; why, in what sense, for whom and for what? Corporate CEO’s? Governtheft-as-taxation? Minority/elite benefit?
You want growth? Let happiness, stability, real community, security, a resilient ecosystem, diversity, peace and leisure, etc., and time for all those grow.
BRAVO! That’s what I am preaching in my op-eds here and they are well received.
I am also having fun by shocking people by my somewhat luxurious living entirely on solar.
They simply can’t believe it. Doesn’t solar mean slim and simple?
My maternal grandparents were farmers. They used to tell me about the long hours they put in. My grandma used to work all day, but sometimes she would go catch crabs on a nearby beach. My paternal grandparents were mountain folk, from Eastern Cuba. Grandma was descended from French settlers, grandfather from northern Spain. My great grandparents had worked to send a grandson to school, he returned and built a small hydro dam, connected a generator to it, and they bought a fridge for their small country store. I don’t have anybody in my family who ever stopped doing something to get ahead. Some people work three hours a day and seem to enjoy that life. In my family we don’t. I guess that’s one reason why we don’t like communism, we don’t like freeloaders.
What is that statistic again about the US? 5% of the world’s population using 25% of the world’s energy?
There are some ‘conquistadors’ that install foreign puppet regimes that ‘their aides’ then make a petroleum career out of in aiding that level/scale of freeloading. Olé.
Maybe you and your family are not somehow related, but Spain and France, etc., sent a lot of ‘entrepreneurs’ to the ‘new worlds’ to help ‘develop’ them and ‘get ahead’ in part through African slavery and Native land-grabs and genocide.
Ya, we don’t like freeloaders over here either. The ones that matter.
“To accumulate wealth, power, or land beyond one’s needs in a limited world is to be truly immoral, be it as an individual, an institution, or a nation-state.”
~ Bill Mollison, from Permaculture: A Designer’s Manual, second ed.
Incidentally, we’ve apparently been doing agriculture ‘wrong’ for the past 7000 years.
Permaculture agro techniques appear less labor intensive and more self-perpetuating.
“The Special Period’s malnutrition created epidemics, but it had positive effects too. Manuel Franco describes the Special Period as ‘the first, and probably the only, natural experiment, born of unfortunate circumstances, where large effects on diabetes, cardiovascular disease and all-cause mortality have been related to sustained population-wide weight loss as a result of increased physical activity and reduced caloric intake’.
A paper in the American Journal of Epidemiology, says that ‘during 1997-2002, there were declines in deaths attributed to diabetes (51%), coronary heart disease (35%), stroke (20%), and all causes (18%)…
‘The famine in Cuba during the Special Period was caused by political and economic factors similar to the ones that caused a famine in North Korea in the mid-1990s. Both countries were run by authoritarian regimes that denied ordinary people the food to which they were entitled when the public food distribution collapsed; priority was given to the elite classes and the military.” ~ Wikipedia
The big mooches. The ones that matter.
Che Guevara ‘u^
Che Guevara was a mass murderer. That’s some hero you have. My great grandparents were born after the end of slavery in Cuba. From what I gather they were typical inmigrants: dirt poor, but with the ability to work pretty hard.
Yes, I heard about that, but you might be relieved to know that the tune, if recalled, has little to do with Che other than as a metaphor for something else. My intent there was more just for conceptual fun. I have little idea about the real activities of Che.
As for you, just because we share the same blog doesn’t mean your propaganda about Cuba et al. isn’t any less propagandistic. While I live in Halifax, I know very little about what goes on in the local official, etc. circuits, even if I think I might, such as just because I might glance at a free weekly rag on the bus.
But in any case, alas, murder and torture happen everywhere and in every system. Your communist bemoans, though understandable, are, in a sense, absurd reductions, perhaps like your notions of freeloading and the like. If we could travel into the past along each of our lineages, it is imagined that we’d likely run into more than a few murderers and rapists along the way.
Looking at one of my ex-girlfriends with Mongol heritage, I couldn’t help but sometimes feel as though I was staring at Ghengis Khan in the face, especially when she was angry at me.
BTW, hopefully, your great grandparents’ fridges or their grandson’s hydro dam didn’t interfere with other people’s lands, farming and general quality-of-life; hydrological cycles or wild species migration patterns, etc..
I don’t do “propaganda”. The Castro family dictatorship is a horrible thing. But I’m pretty sure it will disappear. Evil things end sooner or later.
They come and go like bad cramps…
BTW, does Cuba grow coffee, is it any good, and do you ever go back?
Whether growth can continue indefinitely long – as in forever in a closed space or system is not it question in terms of physics.
It can’t and case closed if you use the usual definition of growth meaning more stuff and more consumption of resources and more people on an ever increasing basis.
But Nick does have a valid point if you are willing to accept a different definition of growth – one that measures quality of life more so than quantity of consumption.
I would not argue that growth according to this alternate definition can continue INDEFINITELY or forever but I can’t see any real reason it cannot continue for quite a while – assuming good luck and stability.
I agree.
And, that’s ok. The idea that growth has to continue forever is also a “strawman”. The economy can grow until everyone has what they want, and then plateau. The economy won’t collapse at that point. Instead, the amount of time people work would start to fall, like France in the last 50 years.
But Nick does have a valid point if you are willing to accept a different definition of growth – one that measures quality of life more so than quantity of consumption.
Perhaps if you are talking mostly about some form of spiritual growth I might consider the point, however I think that arguments that hold that it is possible to continue anything like the current BAU model of growth, which by definition depends almost exclusively on growing consumption of goods and resources, then I obviously will have to strongly disagree that such is possible.
Just came across this review of:
“Collision Course”
Endless Growth on a Finite Planet
By Kerryn Higgs
https://mitpress.mit.edu/books/collision-course
Overview
The notion of ever-expanding economic growth has been promoted so relentlessly that “growth” is now entrenched as the natural objective of collective human effort. The public has been convinced that growth is the natural solution to virtually all social problems—poverty, debt, unemployment, and even the environmental degradation caused by the determined pursuit of growth. Meanwhile, warnings by scientists that we live on a finite planet that cannot sustain infinite economic expansion are ignored or even scorned. In Collision Course, Kerryn Higgs examines how society’s commitment to growth has marginalized scientific findings on the limits of growth, casting them as bogus predictions of imminent doom.
The more I hear people talking about growth being at all possible or that it is good in anyway, the more I am forced to reject the premise. It is simply absurd to believe that! The planet is already too full of humans and we have hit the resource wall. We are in deep ecological overshoot! The only reasonable future course of action is degrowth, a contraction of the economy and a world where we must do more with much less and learn how to be happier doing so. Anything other than that is doing the same thing over and over again, which happens to be the definition of insanity. >;-)
Cheers!
Fred
It’s just a matter of definitions.
The fact is that the official US government definition of growth includes quality improvement in both goods and services. Period. Full stop.
No increase in physical quantities of resources required.
It’s just a matter of definitions.
From Wikipedia:
“Because it is based on value added, GDP also increases when an enterprise reduces its use of materials or other resources (‘intermediate consumption’) to produce the same output.”
So, as Nick points out, “growth” can occur using fewer resources.
The only reasonable future course of action is degrowth, a contraction of the economy and a world where we must do more with much less and learn how to be happier doing so.
That’s just not how most Humans think.
I suspect growth will continue beyond our earthly boundaries.
http://www.space.com/29004-manned-mars-missions-planetary-society.html
We’ve already covered this ‘metagrowth’ on The Oil Drum.
But the invocation into a dialogue of any ‘official government definition’, and along a soulless ‘products and services’ tangent (as if one’s existence is reducible to government definitions and the consumption of products and services) seems both insidious and specious, especially when (said) government(s) doesn’t (don’t) even follow the letter of its (their) own definitions.
In any case, if the universe is infinite, then maybe ‘growth’ fundamentally is too… hopefully outside of the empty vapid officiousness of government/bureaucratic definitions.
If you consider having eight buttons instead of seven on whatever the latest Chinese coal to American landfill gizmo is, there might be growth. Hedonics, I believe is what they call such, ah, adjustments to the Grossly Damaged Planet numbers. An example throwaway:
http://techcrunch.com/2015/03/31/amazons-new-dash-button-hardware-offers-instant-orders-for-staple-products/
Well, that only has one button, but still has landfill written all over it. How are wages faring, by the way? Have those gone up by 2.5 or whatever the quoted number for progress is these days?
Nope, wages are still stagnant.
The Kochs are fighting hard to keep that going, too.
“Don’t let the pessimism in TOD and other PO websites get you down…
Too Funny:
“California is a net importer of oil. It produces only about 37.2 percent of the petroleum it uses. In 2007, the state spent nearly $50 billion for gasoline and $9.7 billion for diesel.
Petroleum-based fuels account for 96 percent of the state’s transportation needs. The dependence on a single type of transportation makes Californians vulnerable to petroleum price spikes. Transportation is the largest emitter of greenhouse gases.
The state is now at work developing flexible strategies to reduce petroleum use. It is developing alternative transportation fuels to reduce air pollution and greenhouse gas emissions.
Meantime, the demand for gasoline and diesel fuel will continue to rise because of population growth, the lack of mass transit, and the number of sports utility vehicles on California’s roads.
Also, jobs and housing continue to become farther apart, increasing the miles traveled by the work force.”
And we wonder why it is all going to hell in a handbasket.
It’s the blind leading the dumb.
You know, I found out why it’s so common to see higher density housing here where I live: real estate taxes are biased to charge per square meter of surface area within the lot, not the market value. The way to get around it is to build a complex with several buildings, put the tennis courts on top of the parking garage, build a single pool used by 240 apartments placed in 8 tall buildings, and have an area for small businesses which service the 500 people living in the complex. This is pretty common around here, in part because land is really expensive but also because a house with a large yard pays a really high tax.
That’s fascinating. So they charge based on land, not improvements (buildings, etc)?
How do they decide how much to charge per hectare?
Excellent question. They have a complex set of equations into which they plug in the property’s characteristics. What I’m told is that it values the land much more than the “value added” construction. It’s also limited to 50 % of the real market value.
I live in a fairly expensive area, the land is quite expensive. But I noticed there are large open areas to the north, about 500 meters from the beach. It would seem the land could be use for large houses on large tracts, but that’s not what we see. Most construction is condos.
But the whole layout here is quite different. We have an electric tram, bus lines, 300 kmph high speed rail to Madrid, and traffic tends to flow smoothly because all the lights are timed to turn green as long as you drive the speed limit (the max in town is 50 kmph).
It will all work fine as soon as you default on the loans that built it.
There’s no defaulting around here. I don’t know anybody with a mortgage. The debt seems to be at the local government level, and above. It’s a mix of really lavish spending (this place is spotless, it’s like Disney world), and too much welfare state. Around here the right wing is somewhat socialist, and they take bureaucracy as something God decided was good for us. But I don’t think personal debt is that high simply because credit just doesn’t get issued in large amounts. I do hear there are people in swanky dwellings around the golf course who have mortgages above the property’s value.
Fuel prices in California have to be the biggest farce on the planet, no maybe the second biggest behind manmade climate change science. But anyway consider this, with gas at $42.00 per barrel a few month back, in Orange County we were paying an average of $2.30 a gallon, now the price per barrel is $48.00 a barrel and the fuel prices are at $2.50 a gallon…yes the summer blend costs about 15 cent more that’s still over a dollar per gallon… lets put that in perspective
16 gallons – 16 buck$ to much
20,500,000(rounded) autos in CA lets say once a week fill her up (I fill up 2-3 times a week, but I am in sales and have to drive alot)
$328 million dollars per every 2 months
$656 million per month
$7.872 billion a year just because of price gouging
Notice how they NEVER find any criminal activity involved with the gasoline prices (manipulation) in California? Somehow I’m starting to think maybe federal Government and the State of California are involved in the manipulation???
It’s not just California that gouges – it’s nationwide. In Maryland I paid $2.099 on 1/23/15 and $2.449 on 3/23/15 – the last time I filled up my 31+ mpg 2013 Honda Fit. I keep mileage records for fuelly.com and fueleconomy.gov (where they’re publicly available), so I’ve got all the data at hand right now.
Prices rising from Jan through Mar-Apr aren’t new and are “supposedly” due to refineries being changed over from winter to summer blends. Last year, I paid a short-term low of $3.259 on 2/5/14, and $3.539 on 3/31/14 and it rose to $3.599 by 4/25/14 where it pretty much stayed until dropping slightly when summer began. In 2013 it was $3.299 on 1/17/13, and it bounced between $3.579-$3.799 between 2/22/13 – 3/29/13 before dropping a little in later spring.
All the prices mentioned are at the same lower-than-avg-price gas station.
Summer and winter blend my @$$. The bureaucrats got an excuse for everything. So just where and when and for how long is this price increase suppose to be? Where I live the frickin price has gone up .52 cents in less than a month. It always goes up like a rocket and comes down like a balloon. People’s driving habits do not change from one week to the next drastically. Everyone basically has the same similar schedule. Going to work, shopping, school, etc. I’ll bet the average person’s routine when it comes to driving their vehicle doesn’t change from week to week by more than 1/100 of 1 percent. So how do all the gas companies know to raise the pump price by a dime or more in one day? If I had invested in petroleum jelly 50 years ago I might be rich today because the energy producers have been sticking it to us all that time and laughing their way to the bank.
If the evil oil companies are ripping you off you should be buying their stock or – even better – open up a gas station yourself!
rgds
WP
WP,
Do you think the 3 above posters are human flesh, or purely electrons? Funny how 3 new poster arrive and bounce off each other on one of America’s most famous conspiracy theory, on how the oil companies rip of the US population.
Also funny how the US has some of the cheapest fuel in the world, baring countries that directly subsidize gasoline and diesel, yet everyone seems to want to complain how expensive fuel is, while driving their F-250
Toolpush. Kind of odd. In any event, before anyone blames gas stations and refiners, look at RBOB. Traded just like all other commodities. It can be irrational too. We live in a low gas price state, but we are .70 off the January lows, but so is RBOB, even though oil is the same as January, maybe somewhat worse. Brent spread to blame?
Tool:
Unfortunately they are probably human. It is very easy to look for scapegoats in pretty much any part of life for anything which isn’t going quite your way. (which means” more, cheaper, faster, easier”).
Also, if you think something is too expensive the simplest solution is to not buy it. Gas too expensive? Screw ’em – drive by and don’t buy gas!
But seriously, in general I have difficulty dealing with people who don’t think and once in a while I don’t take the usual course of action – ignoring them – but actually say (write) something. Fortunately on Ron’s site there aren’t that many of those people and even when they pop up they tend to leave somewhat quickly. Most of the regulars seem to understand that the best way of dealing with idiots is to ignore them.
rgds
WP
How can you speak about them as if they are not there?! That is so rude! ‘u^
Isn’t that what Harold Hamm did? Started his career as a grease monkey pumping gas?
A sly dog, Harold must be.
Actually, I completely changed my mind about what I wrote previously. What was I thinking!
Hm, yeah, me too. I got word back that Evan feels the same way. So, apologies to the rest of the blog for our little digression.
Yep. And, hey, guys, let’s take our meds before we post next time, shall we?
G’day Fellas,
Great to see y’all drop in again. You must have all been watching at the same time according to your time stamps.
Good to see y’all have a good sense of humour.
You also remind me of a little critter we had here recently. He is like a Chameleons. Keeps changing his colours.
Saw on my way to work local gas prices were raised less than 24 hours ago out of speculations on the effects of the rebellion in Yemen. Now they’re going to have to make a far greater rollback in light of the Iranian negotiations. But when do you suppose the greedy oil cos. are going to implement a rollback? Probably after they are done fleecing those of us planning on traveling for Easter.
Fortunately, I drive a Nissan Leaf, so none of that really affects me anyway haha.
No Flat Earth Wingnut with the lead?
Javier, where are you?
From Forbes and sorry if posted earlier;
http://www.forbes.com/sites/christopherhelman/2015/03/26/stop-propping-up-zombie-oil-companies/
” The thing is, much of the debt taken on by smaller shale oil producers will never be paid back unless oil prices go significantly higher than $100 — because even at $100 oil they weren’t generating any free cashflow.”
..
”A director of oil and gas financing at a big bank in Houston told me last week that he and his peers are currently in the throes of some ugly borrowing base redeterminations. Obviously, how much money an oil company can borrow against reserves depends upon the value of those reserves. With prices collapsed, a lot of tight oil now isn’t worth drilling at all — it’s worthless. Companies are busting the terms of their bonds and bank loans left and right — it’s common for borrowing covenants to require a company to keep their total indebtedness to within four times their annual EBITDA. But banks are waiving that requirement, for now. “We don’t know how to run an oil company; we don’t want to run an oil company,” says the banker. “Hopefully oil prices come back up this summer.” If not, by the time the next set of borrowing base determinations come around in October, there will be blood in the streets as many zombie companies will finally have no choice but to give up.”
A lot of upcoming writedowns in proven undeveloped reserves.
Thanks for the link Rune. It is true that banks do not want to operate oil assets, but I am surprised they would keep forking over more money knowing it likely won’t be paid back.
Even if we are lucky enough to get back to $65 WTI, I don’t see how that rights the ship for many of the shale companies. They need $100-$300, depending on how bad of shape they are in.
My, my. Imagine that. Covenant busting.
And he was fibbing. He doesn’t have to run the oil company. He can just take the reserves and hold them. They’re not going anywhere and he wasn’t going to get repaid anyway.
These bozos are walking into the workout session and saying “YOU!! YOU will be responsible for the destruction of US energy independence, and don’t you DARE believe for 1 microsecond that we won’t go public with this and name banker names, and maybe even where your kids go to school. Okay, I apologize for that one. But . . . you get the picture.”
This will work for a while. Maybe long enough to try that on the Fed.
Watcher, you deserve an Oscar: Stand-Up-Comedy. Now, if I understood 0.01% of your financial stuff I might be able to hold my head high around here. Alas, ‘twil never be.
Doug, hold your head high. Diverse knowledge makes this blog go, and believe me, you know a lot more stuff that I do not, than vise versa.
Watcher, the banks don’t want to, but can operate the assets until they are sold. Most of the production staff will stay on and work, they want a job and most oilfield personnel have a lot of pride. They pumpers live it, they are not going to walk away unless the pay just stops. Further, having a good group operating the leases enhances their value. We have leases adjoining us where the operators went broke, but the pumper didn’t go anywhere, unless the lease was just shut down.
The shale wells will generate a lot of cash, and as the banks have the first lien, they should be able to foreclose, have a receiver appointed, and keep the production going until sold. They don’t want to do this, but they will and have for over 100 years.
Alternatively, they will sell the mortgage for a discount to a third party (private equity) and be done with it. I have seen that up close too.
What banks will not do is drill more wells. I have never seen that. That is why I am surprised they are going to throw more money down the rat hole.
I guess this is where the long quoted oil field saying comes in, and I think the quote originated from HL Hunt, “Owe the bank a hundred thousand and it is your problem, owe the bank a hundred million and it is their problem.”
There is an old novel. Hmmmm Tom Wolfe. The Man Is Full. Something like that.
In it there is a scene that he researched. It’s what a bank does when someone thinks that if he owes 100 million then the bank has a problem. Banks have been doing this for a long time. There are procedures in the company manual for guys who think if he owes a lot the bank has a problem.
It ain’t pretty. It goes back to where money came from. The bank is fractional reserve and it can get its ratio tweaked. The borrower, has nothing.
So having read this latest Ronpost, I think to myself, “This is news! Let’s see if it’s being carried elsewhere.” So, I pop “us oil production” into the search box of my browser and select “news” from the results. The top news headline was “American Oil Production Grew by the Most in Recorded History Last Year” and apparently that bit of information is what the MSM chose to report. Gotta keep the happy stories going! Shame on Ron for not reporting that news!
More disturbing than Ron ignoring the news that US “crude oil” production has never grown by as much as 1.2 million barrels in a single year before now, is the fact that rather than report this drop in production, USA Today chose to report “US oil storage crunch might cut crude prices”.
It seems that the public must never be provided with any news that might suggest that all is not well in the state of “happy motoring”. Welcome to the Twilight Zone!
Alan from the islands
I think it is just generic reporters regurgitating things they have already read. Digging for new relevant info is hard work and requires a lot of effort.
There’s a tendency for the news to flow with the current. When I moved here I thought it would be different, but I see a pretty uniform coverage. This morning they are all serving exactly the same pablum to justify a Saudi invasion of Yemen using Pakistani mercs. A few weeks ago they all sang the same tune about Russia getting ready to invade us. I thought that was so ridiculous I decided to write about the threat posed by Finland (my two Finnish friends seemed to think it was funny).
DIRECT EVIDENCE FOR A POSITIVE FEEDBACK IN CLIMATE CHANGE: GLOBAL WARMING ITSELF WILL LIKELY ACCELERATE WARMING
http://www.sciencedaily.com/releases/2015/03/150330122439.htm
“A new study has confirmed the existence of a positive feedback operating in climate change whereby warming itself may amplify a rise in greenhouse gases resulting in additional warming.”
This implies the system is unstable. The temperature cannot rise forever. At some point equilibrium must be established between energy coming in and energy going back out into space.
It’s unstable, and equilibrium is very difficult.
It will eventually reach equilibrium, but algae may be the dominate life form.
….and/or cockroaches…
Petro
My vote goes to the Cyanobacteria they seem to like warm oceans with lots of CO2. Cytochrome C and his cousins are going to be busy >;-)
http://www.cop.noaa.gov/stressors/extremeevents/hab/current/cc_habs.aspx
Evidence also indicates that climate warming may benefit some species of harmful cyanobacteria (both freshwater and marine) by providing more optimal conditions for their growth (reviewed by Paerl and Huisman 2008 and 2009). Increasing temperature and CO2 either alone or in combination with nutrient availability may determine the growth and relative abundance of HAB species (Fu et al. 2008). Historical evidence from long term phytoplankton monitoring data and fossil records suggests that future climate warming could impact HABs through the alteration of their geographic range and shifts toward relatively more and earlier blooms (reviewed by Dale et al. 2006).
Interesting critters.
http://www.biofuelsdigest.com/bdigest/2015/03/23/joule-says-will-go-commercial-in-2017-solar-fuels-on-the-way/
Fred,
Have you ever seen the stromatolite fossils by Grinnell Glacier in Glacier National Park? – 6,693′ above sea level. Gives one an appreciation of time and change
The article doesn’t really contribute anything new. It’s a rehash of the old controversy over whether CO2 leads or lags large climate swings. The way the ice ages come and go make it clear the system is delicately balanced and the main driver is the orbital variations.
The feedback mechanisms are the clouds as well as the isostatic rebound of continental land masses previously under the giant ice caps in North America, Europe and Asia.
Actually there are many feedback mechanisms that can either amplify or diminish the effects of a change in climate besides the ones you mention. Another is the melting of permafrost resulting in the release of methane. And you should consider the release of carbon from ecosystems due to changing climatic conditions such as the die-back of high-carbon ecosystems (i.e., the Amazon). One that especially concerns me is Atmospheric Vapour because as the atmosphere warms its concentration of water vapour increases, further intensifying the greenhouse effect which in turn causes more warming, which cause an additional increase in water vapour — a self-reinforcing cycle. My understanding is that water vapour feedback may be strong enough to double the increase in the greenhouse effect due to the added CO2 alone. In any case, I think these discussions are best left to scientists who have the data and are trained in the interpretation a critical factors.
Oh, and respecting glacial isostasy, typical uplift rates are of the order of one cm/year (or less) and it mainly affects northern Europe, Siberia, and Canada. This certainly influences permafrost melting and methane release in a significant way but it would take a specialist to calculate the effect(s).
I did the calculations. It’s not that complicated. The rate is variable, when you remove the ice load the sucker starts bobbing up real fast, and the decline can be approximated with a simple exponential.
We had a lengthy discussion at Lucia’s last summer about the subject, feel free to go look it up. After the discussion I sat down and studied the subject and have developed a pretty good understanding of how this works. By the way, the movement of mass back and forth between the continents and the oceans influences volcanism. Think about it.
“By the way, the movement of mass back and forth between the continents and the oceans influences volcanism. Think about it.”
Well, I’m an engineer, geologist and geophysicist; I’ve thought about it and I don’t have the faintest idea what you’re talking about. You “did the calculations.” What the calculations did you do?
Work out the stress field change on top of a mid ocean ridge, with a magma chamber in near perfect equilibrium. Remove 100 meters of water worth of pressure, and you will see the pressure reduction causes magma to liquefy and allow gases to migrate, creating the conditions for eruptions. As far as I can see volcanic activity has to accelerate at the spreading centers whenever the ice caps are being formed. Neat, isn’t it?
In my case I think the scientists need engineers to supervise and review their work.
Three people were going to the guillotine, and the first was the lawyer, who was led to the platform and blindfolded and put his head on the block. The executioner pulled the lanyard and nothing happened. So, out of mercy, the authorities allowed him to go free. The next man to the guillotine was a physician, and he lay his head on the block, and they pulled the lanyard … nothing. The blade didn’t come down. So, to be fair, they let him go too. The third man to the guillotine was an engineer. They led him to the guillotine and he laid his head on the block and then he said, “Hey, wait. I think I see your problem.”
http://www.angelo.edu/faculty/kboudrea/cheap/cheap4_engineers.htm
Fernando you may well be right about this study adding little, though my guess is that extracting pattern from time series data is beginning to yield explanatory results for glacial oscillations.
Re climate feedbacks. You mention net albedo from clouds, ice and snow – sure they add to the fun.
But having non-condensing gases in the atmosphere is key to the temperature at equilibrium during oscillating orbital cycles. Without CO2 et al, and CO2 having a longish life in the atmosphere, the default condition would be “Snowball Earth”, (happened a long time ago), with the main greenhouse gas, water vapour condensed out.
I read that the direct heat-retaining effect of non-condensing gases is about 25% of total heat retention. The hotter the atmosphere gets the more H2O is carried in air (positive feedback), but the cycling of CO2 concentration between glacial min 180ppm to interglacial max 300ppm over the last million years interacted with hydrological cycle and H2O vapour concentration in a complex way. Despite complexity, the direct heat retention by recent CO2 400+ppm will drive positive feedback from water vapour via higher temperature. Additionally, the exchange equilibrium for CO2 between the ocean (plus terrestrial) carbon store(s) will change with temperature, as it did during previous glacial oscillation. Eventually though – following Peak Oil and etc. – whatever our ‘burn’, we should see a ‘Peak CO2’ followed by a much longer period of gradual net carbon sequestration, despite the by then prevailing higher global surface and ocean temperature. I should add as caveat; if the draw-down capacity of the ocean and vegetation fails catastrophically at any point then of course ‘we’ are into something else entirely – something akin to the PETM 55ma.
best
phil
Phil, I’m familiar with the process. I happen to think papers like this are like beating a dead dog. I suspect a lot of this is researchers trying to establish their careers and names producing papers which become quotable material for the media and of course the political machine. Nature publications serves very little that appears to be original thinking, it has become a political machine.
Doug L,
Another site for new papers is EurekAlert! It’s hosted by AAAS and supported by DOE, NSF, and NIH.
Thanks Synapsid, I’ll monitor it for awhile and perhaps add it to my already crowded tool bar.
Doug L,
Go to the home page and scroll down a bit until you see, in blue in the central column, View all science news; click on that. You’ll see a sidebar on the right that lists the categories, such as Chemistry & physics, or Earth science.
I find it a useful site and quick to scroll through. There’s lots of overlap between the categories so scrolling speeds up as you go.
CLIMATE-RELATED DISRUPTIONS OF MARINE ECOSYSTEMS: DECADES TO DESTROY, MILLENNIA TO RECOVER
http://www.sciencedaily.com/releases/2015/03/150330163347.htm
“A new study reports that marine ecosystems can take thousands, rather than hundreds, of years to recover from climate-related upheavals. The study’s authors analyzed thousands of invertebrate fossils to show that ecosystem recovery from climate change and seawater deoxygenation might take place on a millennial scale.”
I guess there are still Flat Landers:
Javier, where are you?
We need to know why a 19 year old paper on Philippine Volcanism is going to override 100 years of physics and climate science.
Yeah but think of all the new coral reefs growing in downtown Miami and Disney World there has to be at least a bit of poetic justice in that.
It might look like this again a few million years from now
https://www.youtube.com/watch?v=EMwxwRA9Xr8
…I duno about corals, man.
Acidity from prozac, nexium and viagra might be tough on their “bones”
I join you in a “glass half full” toast though…cheers!!!
Be well,
Petro
Hi Doug,
here’s some more “good” news:
http://thinkprogress.org/climate/2015/03/12/3632373/carbon-sinks-climate-action/
…and this from that lovely “free”, “beacon” of truth called NYTimes, of all places:
http://www.nytimes.com/2015/03/24/science/earth/amazon-forest-becoming-less-of-a-climate-change-safety-net.html
…even cockroaches shall have it tough!
Be well,
Petro
P.S.: thanks for the update, Ron!
Important: I posted this up top in the text of the post. But I will put it down here also because I think it is important.
Texas natural gas, oil production down in latest reporting periods: regulator
In the commission’s final production estimate for January, the state produced 81 million barrels of oil and 536.3 Bcf of natural gas. The commission’s final production estimate for December was 83.7 million barrels of oil and 553.2 Bcf of natural gas. The commission’s final January 2014 production estimate was 69.9 million barrels of oil and 566.5 Bcf of natural gas.
This works out to be 2,700,000 barrels of oil in December and 2,613,000 barrels of oil in January, a decline of 87,000 barrels per day. This does not include condensate.
I think we are learning Ron is good at this production prediction stuff. Unfortunately, the traders have their own agenda, so can’t make any money on the predictions, LOL.
Shallow, I did not predict anything, I just read the numbers from North Dakota and from Texas and it was obvious to any damn fool that production was way down in January. The EIA Drilling Productivity Report was the one saying “Production is still soaring through March.
Oil prices crashed, but US output is still rising. How long can that last?
What’s surprising, though, is that US oil output has kept growing even though oil prices have fallen by half since last summer. On March 25, the US Energy Information Administration announced that US crude production rose yet again to 9.42 million barrels per day — the highest level since 1973:
This is insane. The EIA Petroleum Supply Monthly just said January production was 9.185 million barrels per day. they are saying it is 235,000 barrels per day higher!
And that 9.185 figure is counting Texas as increasing 3,000 barrels per day higher while Texas is telling them that they declined by 87,000 barrels per day. You would think that people who write these articles would be a little more aware of what’s actually going on.
What are traders going to do when they find out they have been snookered?
I guess that we can all make money because there is only one thing that they will do.
Ron, February was a short month; when THAT production data comes out lots of folks are going to be having an OMG moment.
Mike
Hi Mike,
As long as we look at it in barrels per day, a short month does not really matter. Lower output would be good as oil prices will increase eventually, probably in August or Sept. Based on RRC data, there were a lot fewer wells completed in the Eagle Ford in Feb vs Jan or December. I don’t have data on the Permian basin (TX side), but they have seen a big rig decline there (mostly the vertical rigs) so I would think output should be lower unless they have a big backlog of wells waiting to be fracked. I am not sure if the Permian might pick up some of the slack from the Eagle Ford.
Also the adjustment factor for Jan is 1.175 which when applied to C+C in Texas leads to an increase in Jan output rather than a decrease.
Texas output of C+C in Jan increased by 143 kb/d from Dec when the adjustment factor is applied to crude plus condensate. Link for adjustment factor below:
http://www.rrc.state.tx.us/oil-gas/research-and-statistics/production-data/production-adjustment-factor/
The adjustment factor is not supposed to be applied to condensate, but some adjustment factor is needed as the preliminary number almost always is revised higher the following month.
Dennis, shouldn’t the Texas Jan production be down MoM after applying Dean’s correction?
Hi Candid,
There are many different estimates. The EIA’s estimate shows output was flat from Dec to Jan. The Texas estimate shows C+C output was up and Dean’s estimate shows it was down.
Depending upon what you would like to see you could get different results. In the past the EIA’s petroleum monthly data has been the best estimate, though Dean’s eastimates have been very good as well. The RRC estimates for the most recent few months are usually too low. Probably the best guess (imo) would be an average of Dean’s and the EIA’s petroleum supply monthly estimate. All of these estimates get revised over time and recent estimates tend to have the largest errors.
Dennis, I think the Platts data I provided Ron last night regarding actual oil production declines from December to January in Texas is the real deal, not guesses. Get with him on that. Dean’s got it down to the gnat’s ass. As you know, I don’t much care about guessing when all anyone has to do is wait a couple of months to get the full skinny. In Texas we rely on what Texas says about production, not the stinking EIA.
I own and operate lots of oil wells, Dennis. February was a “short” month and will reflect a disproportionate decline in production to days in the month. That will have to do with EOM sales, balancing reported production to actual barrels sold, on location storage, sagging prices and other operational considerations. That’s just the way it is.
You may only look at these production numbers on a BOPD basis, not me. I am looking for big headlines, like “US PRODUCTION IN FEBRUARY TUMBLES.” The shorts have got complete control of the oil market right now; I want their hair on fire by May and going long again.
Mike
I second that one Mike. I know we’re in a high lifting cost area. However, I feel better after scanning through several US 10K and seeing how much it is costing the big boys to fight the decline.
I wonder if we add in CAPEX just to keep production flat to LOE, taxes and G & A, how much of the world’s production is under water, in the red? I bet it is pretty darn high when all the costs are figured in.
I am concerned, however, that we are in some world wide bizzare economy, and even though logic should tell us this price cannot last long, it could because nothing makes sense. All of Europe with negative interest rates? While obtaining an undergrad finance degree in the 1980s, I never heard of that being possible. Do not recall being asked to calculate yield to maturity wherein yield was negative.
I interned at a bank one summer and processed home mortgage documents, interest rates were around 10%. I thought I was lucky as all get out when I bought my house and I could lock in a fixed rate at 7.5%. Now it appears such rates would lead to the Great Depression II, at least the way everyone acts.
I really don’t know what to think, except haven’t been in this shape except for 1998, first part of 1999 and about 3-4 months in 2008-2009. Can’t figure it out.
I would add that in the late 1980s and 1990s, the majors divested onshore lower 48 and went in the water and overseas, where they could make a better return.
I find it interesting that many have came back to lower 48 onshore, via shale, which has lousy economics. And yet well head is now low 40s at best. Something has to give?
Hi Mike,
The Platts article is wrong.
According to the RRC 77.639 million barrels of oil were produced in Dec 2014.
In Jan 2015, the Platts number is correct it is 81 million barrels.
So a 3 million barrel increase from Dec 2014 to Jan 2015 based on Texas RRC data. The Jan 2015 data point must be multiplied by the adjustment factor (1.175) to get the 81 million barrels.
Dennis, Platts is not the one doing the figuring here, it is the Texas RRC. From the link I posted earlier:
In the commission’s final production estimate for January, the state produced 81 million barrels of oil and 536.3 Bcf of natural gas.
Got that, the commission’s final estimate. So Platts cannot be wrong here because they made no estimate. The Texas RRC made the estimate. So you are saying they are wrong? Well, are you?
Oil output during January fell 11%, or 8.5 million barrels, as compared to the previous month.
No. (Adjustment factor) oil output during January fell 3.2%, or 2.7 million barrels, as compared to the previous month. (Non-adjustment factor) oil output fell 3.1% or 2.2 million barrels, as compared to the previous month.
I know you have a hard on when it cums to peak oil, but at least get your arithmetic right. January 2015 adjusted and non-adjusted oil output was higher than November 2014.
Hi Ron,
I am saying the Platts article is wrong about December output. I believe I clearly said they were right about Jan 2015.
For Dec 2014 the Texas RRC says 77.6 million barrels of crude output. See
http://www.rrc.state.tx.us/oil-gas/research-and-statistics/production-data/texas-monthly-oil-gas-production/
So I am not saying the Texas RRC is wrong, I am saying that the Platts article is wrong. The other link that Mike posted is also wrong, the most recent month is a preliminary estimate that needs to be multiplied by 1.175 to get the RRC’s best estimate for Jan 2015 output.
It is not at all clear why I would need to explain this, but I am just trying to set the record straight.
http://oilprice.com/Energy/Oil-Prices/Finally-Some-Good-News-For-Oil-Prices.html
Hi Mike,
That article is wrong, the most recent month of RRC data is always (at least in the last 3 years) lower than the month before. The most recent month must be adjusted using the production adjustment factor see
http://www.rrc.state.tx.us/oil-gas/research-and-statistics/production-data/production-adjustment-factor/
Well, Dennis, before you contact Oilprice.com and McGraw Hill Financial to tell them how wrong they are you better check with the Texas Railroad Commission first to make sure your “adjustment factor,” whatever the hell that is, still applies. In any case, I don’t much care.
Try and wait a week before you demand retractions, will ya? Oil is up $2.25 today based partially on this information and I can use the extra bucks.
Mike
Again, see my reply to you just above Mike’s comment. That data is not from Platts, it comes from the Texas RRC. They are the ones saying Texas January Crude Only production was 81 million barrels for the month.
From Mike’s link:
State regulator Railroad Commission of Texas just released data for production rates in January. Showing that output of both oil and gas took one of the most sizeable monthly declines in recent memory.
Oil output during January fell 11%, or 8.5 million barrels, as compared to the previous month.
Again, the Texas RRC released that data.
This is just Eagle Ford production:
http://www.rrc.state.tx.us/media/7078/eaglefordproduction_oil_perday.pdf
Hi Ron,
The Jan 2015 number is preliminary and should be adjusted up by 17.5%, to 81 million barrels, the oil price article failed to do that, in this case Platts Jan 2015 number is correct.
So we have 77.6 million barrels in Dec and 81 million barrels in Jan, not a decrease, an increase.
Dennis, this is not Platts data, this is Texas RRC data. The Texas RRC said production in December was 83.7 million barrels. The Texas RRC said January production was 81 million barrels.
Dennis, understand this is what the Texas RRC is saying was production for both December and January.
Hi Ron,
Can you post a link to where it says that on the Texas RRC website? I am not finding it, but 83.7 million is possible.
The Texas data is always pretty bad for the most recent 6 months or so, EIA estimates in the Petroleum supply monthly are much better. In 6 to 12 months we will know more about Jan 2015 Texas output.
Dennis, I don’t have the RRC link, it was Platts that said:
In the commission’s final production estimate for January, the state produced 81 million barrels of oil and 536.3 Bcf of natural gas. The commission’s final production estimate for December was 83.7 million barrels of oil and 553.2 Bcf of natural gas. The commission’s final January 2014 production estimate was 69.9 million barrels of oil and 566.5 Bcf of natural gas.
Texas natural gas, oil production down in latest reporting periods: regulator
However here is a link that IS an RRC link:
http://www.rrc.state.tx.us/media/7078/eaglefordproduction_oil_perday.pdf
Dennis, you need to apply the adjustment factor to both December and January. That will get you where RRC is with 83 and change in Dec v 81 and change in January.
Regarding the production adj factor – you’d think it would be going down with the new electronic filing (if said filing actually results in more timely and efficient processing). Instead it’s ticked up from 1.704 to 1.750.
DuaneX. It was 1.1750
I had jotted down a note of 1.1704 in Nov. So it must have ticked up to 1.175 in Dec? So far not going the direction I expected.
If Texas is showing a measurable decrease in production during January, when January was the month we saw the first real decreases in rig numbers, then as the decreased rig count starts to bight, oil production could make some big steps down the production scale.
Where as North Dakota has the excuse of winter weather during January, Texas does not.
If I am not mistaken, there was a bump up in crude rigs in 10/14. Given lag time between drilling and completing, makes sense that there was a bump in December.
I think we may very well find larger drops coming up in Feb 2015 and beyond. But maybe not, too early to tell.
I do think US onshore conventional is tanking. Look at all the little non shale producing states. Think that is a tell. Would not surprise me if that has dropped below 3 million barrels per day.
Am starting to notice a few wells not pumping around here, that usually are on. We’ve elected not to pull 5 that have went off since December with a hole or needing pump change. It all adds up when you have close to a million wells making that 3 million onshore conventional.
Yes, in October the oil rig count in the US went to 1609 and to 197 in North Dakota. But this really did not mean a lot, at least in North Dakota, because of the huge back of drilled but unfracked wells. At the end of January there were 825 of these wells.
From the latest Director’s Cut
At the end of January there were an estimated 825 wells1 waiting on completion services, an increase of 75. Comparing December completions and production increase to January completions and production decrease results in a requirement of 115 completions per month to maintain 1.2 million barrels per day.
Though it might be hard to believe, winter weather does impact production in Texas (especially the Permian). There are always wells shut-in during Jan/Feb and this Jan was especially bad since it was a time of high winds and hundreds of power poles got blown over. We had some fields shut in almost all of January. That wouldn’t be the only reason production would be down, obviously the decreasing in drilling has something to do with it, but it winter weather has always impacted the PB.
You can make money, but you got to have patience. When I saw the work being done here I decided to invest in oil and service company stocks. Now I just have to sit and wait.
Does this mean actual total decline is close to 225k bpd? And yes, not one “news” source is reporting a decline. Everyone is going with 100 year high in 2014 ! I think the real traders did figure it out in the end. Thats what caused WTI to ramp into the close.
Well, seems like the message may not have gotten through after all. Either that, or Goldman Sachs has not covered their oil short yet. WTI smacked right back down to 48 after close.
To be fair to the news sources, I followed the link Ron provided to the EIA’s Petroleum Supply Monthly and all I saw was links to various sets of tables containing lots of numbers. There was nothing there presenting the data like Ron does and looking at a couple of the tables, I didn’t see any data for the prior month so I’m assuming that tracking the data over time, based on the Petroleum Supply Monthly, requires some amount of work. However, when I clicked on the “Overview” tab at top of the page, under the heading “Current Issues & Trends” on the page that is presented. I see the headline, “U.S. oil production growth in 2014 was largest in more than 100 years”. What the media is reporting is simply something that appeared on the EIA website that seems newsworthy.
I also did a search for “us crude oil production” which brought up several pages including one that track US crude production over time with the latest data point being January 2015. There is also one that tracks production weekly with the last data point being the week ending March 20th. Just for the heck of it I worked out the average of the five weeks that ended in January and the result was 9,180 just 5 short of the figure reported by the monthly data. Doing the same calculations for the four weeks in February yields 9279 and for the three weeks reported so far in March 9402. Now, I, start thinking that, based on the weekly data, we can look for February’s monthly data to revert to the upward trend but, I started wondering about the basis for the weekly data and it was then that I remembered that Ron recently wrote about this. From Ron’s OPEC Crude plus More on EIA Estimates, “The EIA never revises the weekly numbers, they just adjust each weeks numbers to make up for any previous over or under errors in the data. So I am looking for another huge adjustment in the weekly production numbers soon.”
If it is the case, as is quite likely, that the EIA has happily estimated growing production week after while production growth has stalled and is possibly declining, those weekly figures are going to have to undergo some really massive adjustments to account for the shortfall! It should get pretty interesting from here on out!
Alan from the islands
Alan, click on this link: Petroleum Supply Monthly
Then go down to “Crude Oil” and click on “26 Production of Crude Oil by PAD District and State”. That will take you here, Crude Oil Production Then click on the tiny down arrow and change the Monthly data to “Thousand barrels per day”. Or just ignore all the above and click on this link and it will take you there directly. Crude oil production in thousand barrels per day
From this point you can click on any “view history” and get the data and a chart for production back to 1981 for all states and areas and back to 1920 for the total US. But if you work with Excel and want all this data in Excel you will need to click on this: “X Download Series History”. That will bring up an Excel spreadsheet from which you can make charts and graphs.
It’s all there, reproduced every month with the latest data. There is no need to save old data because it will be revised and the new page will carry the latest revisions.
Hey Ron, Guess what? The top (non advertisement) result when using Google to search for “us crude oil production”, is the annual version of the page you get your data from. Putting “monthly” in front of “us crude oil production” makes the top result the exact same page you linked to! So, I guess that proves one of two things or maybe both:
1) The MSM want to maintain a happy narrative and don’t want to report anything that might upset that narrative. The rational for choosing not to publish what many of us on this blog consider important facts, is best known to them.
2) The reporters and editors are just too lazy or incompetent to do anything other than regurgitate what is presented to them as news. It really wasn’t that hard to find the historical data for monthly oil production.
Alan from the islands
Hi Alan,
There was a revision to Dec 2014 output from last month, up 100 kb/d from the Feb Petroleum Supply Monthly. The Jan 2015 output is down 135 kb/d, in part because Dec 2014 output was revised up by 100 kb/d.
We shouldn’t get too excited about the Jan 2015 data point, as Ron said before next month it could be revised up or down, we will see at the end of April.
Yeah amazing how in the media production continues to increase.
Well, heck, maybe all those guys out of work in the Dakotas and South Texas can just go to Iran, or Mexico…
http://fuelfix.com/blog/2015/03/30/iran-riches-coveted-by-big-oil-after-decades-of-conflict/
YetanotherMike,
Saudi Aramco is not just hiring workers from the oil patch–they’re recruiting. They want shale experience, the sillies.
The Iranians issue very tough contract terms. And they aren’t babes like the Iraqi Shias. They will take a couple of years to sign a large contract. But we have to wait and see, the Israelis control a bunch of US politicians, they may throw enough sand on the nuclear negotiations to make them fail.
1995 to 2005 saw explosive growth in the world’s oil production and a relatively slow increase in price
2005 to 2010 saw a very small increase in production, a rapid rise and crash in price, but a rapid return to a high price environment.
2010 to 2015 saw a substantial increase in production (but not nearly as big as 1995 to 2005), mainly led by the United States, but also by other countries, namely Iraq, Saudi Arabia, UAE, and Kuwait. Of these, only Iraq has any room for significant growth. Iran will bring on its production which has been “artificially” kept low for obvious political reasons, but that’s perhaps one year’s worth of demand increase.
I think it is quite fair to 2015 to 2020 will be the years of plateau, if not outright decline. The last big conventional projects have come online, and any increases in production will come from unconventional sources. Unfortunately, the price the world would need in order to bring online unconventional sources fast enough to offset the decline of both conventional and nonconventional sources is probably too high for the world economy to bear for any length of time. Moreover, even in the state with the best infrastructure for oil extraction, easy access to capital, and subsidization at the state level, shale oil producers weren’t exactly doing well even at higher prices. So, it’s unclear if other states can ever replicate the success of the shale revolution.
Ron is fairly bullish by pointing to 2014 as the global peak, but he has the right idea. Any time between 2015 and 2020 is a very solid guess.
A more interesting question is not when the peak will happen, but what the decline will look like.
Actually I am picked the 12 month period beginning in September 2014 as the peak.
Hi Anonymous,
As far as decline,it may not be that bad if the United States Geological Survey (USGS) estimate for World Oil resources is correct. I have a new blog post up about this (very short), link below:
http://oilpeakclimate.blogspot.com/2015/04/oil-shock-model-for-world-4100-gb.html
Peak in about 2020 with annual decline rates under 1%, chart below.
Hi Dennis,
I guess we will know in a few years whether this graph is more accurate than your graph employing Laherrere’s lower URR estimates.
That 30 Mbpd in 2100 is a pipe dream. None of us will live to see it, but what’s the point of producing 30 Mbpd if you don’t get any net energy out of it? Just digging a hole but instead of filling it back up we dump it it the atmosphere. Only sounds good to an economist.
Hi Hilllson,
I do not expect extra heavy oil to reach 30 Mb/d. That chart was intended as an April fool’s joke.
Not funny when it has to be explained.
Hell, when I saw that chart I started trying to work backwards to see how much money it would take. Do you want me to finish it? Or give me a table of what you think would be Venezuela’s contribution and I’ll give you an outline. I’ll have to disguise sone aspects to make sure I don’t let the cat out of the bag.
Hi Fernando,
I think optimistically we might get 500 Gb from Canada and 200 Gb from Venezuela (once they get a better government in place).
The USGS puts extra heavy technically recoverable resources of both Canada and Venezuela at about 500 Gb each (oil sands).
I have no idea how much is economically recoverable, but I would assume we will need much higher oil prices for such production (700 Gb of extra heavy oil) to take place.
Under the most optimistic conditions you can imagine (high oil prices, and a smart government in Venezuela) what amount of extra heavy oil seems plausible, maybe 600 Gb( through 2300 AD)?
Dennis, right now? it’s really hard to tell. The government has very irrational policies. The problem I have is the pile of confidential data I’ve seen. What we think we know is that OOIP is about 1.3 billion bbl. ; but a lot of that oil is in really crappy looking sands. I would say the good quality sands hold about 500 billion. The primary recovery is very low, although it does have a bit of foamy oil drive (just a little bit). The primary production involves drilling horizontal wells and pumping them with progressive cavity pumps. The huge skeleton in the closet is water influx. Quite a few pads are suffering from excessive water cut. The water precludes the use of thermal methods. This means they are gradually putting in wells, pulling in water, and ruining the reservoir. This drops recovery factor to about 1/3 to 1/4 of what was estimated by PdVsa a few years ago (not all the sands are watering out). Thus this isn’t a question of changing government, it’s going to require urgent action to stop them from ruining a huge resource. I’m sorry I can’t give you a lot of detail.
Hi All.
I expect World C+C URR will be between 3000 Gb and 3800 Gb, below is a scenario with a World C+C URR of 3400 Gb, with C+C less extra heavy oil (XH) URR of 2800 Gb and XH oil URR of 600 Gb. Extraction rate for C+C-XH and annual decline rate of C+C on right axis.
Art Berman’s prediction of -600 thd bpd of shale oil by June was not taken very seriously, but may very well turn out to have been pretty accurate.
Maybe California production is down because of the lack of water ?
The latest Texas C+C by EIA vs my corrected data are reported below. Interestingly, the final Texas RRC estimate for crude only (no condensate) is almost identical to mine
The “Dean Curve” is definitive as the near real time measure of Texas output.
ahahah! ^_^ I will write your quote on my desk!
You have no paper?
yes, plenty, but for my colleague to see ^_^
You do pretty good work. What about the condensate?
here is my condensate corrected numbers
Below is a screenshot from July 2014 of one of Dean’s estimates. It turns out that the EIA estimate was pretty close to Dean’s most recent estimate for April 2014. In my opinion the EIA estimates will continue to be pretty good.
Also note that the May 2014 C+C estimate by Dean from July 2014 was about 400 kb/d less than Dean’s most recent (March 2015) estimate for May 2014. It will be interesting to see if the current EIA estimate for Jan 2015 ends up looking good in 6 months.
I think it will look terrible in 6 months. It is currently way too high.
Hi Ron,
You may have thought it was too high last July as well. The difference between Dean’s estimate and the EIA then and now is about the same.
Time will tell, EIA may be too high, but it will be closer to the RRC number 12 months from now, than Dean’s estimate.
Check this one out: Do Rig Counts Matter These Days?
Just check out the most current numbers from the oil and gas patch: Rig counts are down for both! The number of oil rigs has dropped more than 30% in the past six months. Natural gas rig numbers have dropped by more than 70% in the past decade.
Yet the United States is producing more oil and more natural gas than at any other time in the past four decades.
What everyone is looking at are the storage numbers. Crude oil storage is higher than it has ever been in history. To be honest I cannot figure this one out either. How can the production numbers take such a hit as they did in January and storage keep climbing? If anyone has a clue please post it.
Imports and a slowing economy?
I don’t know who really controls the storage but it can’t cost much more to run full compared to empty, and there may be some need to leave some space for contingency (e.g. in case of refinery outages) but if oil is in contango (or you think it should be) and you have existing import routes, available storage space, and available money, either your own or at low interest, why wouldn’t you keep on filling the storage as much as possible.
I don’t think oil prices are down due to over production. I think oil prices are down due to 9 years of stagflation. When oil prices are high, oil loses market share, but it takes time. Some of it is lost to substitution of energy sources, some to different living styles, and some to low wages and unemployment. I think China and India have decided to pay down debt rather than buy oil. If my hypothesis is correct, oil price will not rise before production declines significantly.
Or they are down because the dollar, as yardstick, has adjusted its length, in which case there may be no rise if there is a production fall, especially if an economic decline associated there with takes place and smacks consumption.
Though it may coincide. News of economic smashup in the US because of the destruction of the shale industry won’t do the dollar any good. Beyond which, the whole point of it all is to destroy the shale industry so there would be no point in letting the price rise until that job is complete.
I suspect that the Condensate to Crude + Condensate (C+C) Ratio for US production may still be increasing. Also, I think that there is usually a first quarter build in US C+C inventories, but of course nothing like we have seen so far this year.
It’s possible that last year US refiners hit the limit of what they could take in terms of very light crude and condensate as a percentage of total C+C inputs, causing them to reject more very light crude and condensate, and resulting in still relatively high net crude oil imports of about 6.8 mbpd, which is 44% of the C+C input into US refineries (four week running average)–contributing to the large build in total US C+C inventories, and I’m not sure how much demand there may be globally for more very light crude and condensate.
Until recently, I lacked hard evidence that refiners were not happy with the blend of C+C production that they were getting from US producers, but recently there was a Reuters article that someone posted, which is something of a “Smoking Gun.”
U.S. refiners turn to tanker trucks to avoid ‘dumbbell’ crudes
http://www.reuters.com/article/2015/03/23/us-usa-refiners-trucks-analysis-idUSKBN0MJ09520150323
Excerpt:
As noted in the article, producers are blending low API gravity crude with 50 API range condensate to get a synthetic WTI type crude oil with a low 40’s API, but insofar as the refinery is concerned, there is no difference between buying one barrel of low API crude and one barrel condensate versus two barrels of blended crude and condensate. In both cases, the combined input of the two barrels are deficient in distillate content.
So, I suspect that not only are condensate inventories building, but inventories of “Synthetic” WTI type crudes may be building too.
Synthetic Crude Oil, as produced by Syncrude in Canada, is a premium crude. In the attached chart you can see that it has a higher distillate content than WTI 48% vs 37%. Also note it has almost no bottoms (asphalt). I think it is also sweeter than WTI.
Yesterday it was selling at a premium of $US2 to WTI.
The spec for SCO can be obtained here:
http://www.cdnoilsands.com/energy-marketing/ProductSpecifications/default.aspx
I believe that there is a big difference between upgraded bitumen and a mix of low gravity crude and condensate, which is what the article was discussing.
Perhaps a better term for low gravity crude + condensate blends would be “Imitation WTI.”
In any case, the key point is that the article documents cases of refiners rejecting the crude/condensate blends, which raises an interesting question, just how much demand would there be for more very light crude and condensate production globally, even if tight/shale plays were commercially productive in more areas around the globe?
Based on EIA data, it took roughly half the global (oil and gas) rig fleet to boost US quality crude oil production (40 API and lower crude) by just 0.5 mbpd from 2011 to 2014.
What’s “very light”?
I’d say about 40 to 45 or so, and as I have noted several times, when we ask for the price of oil, we get the price of crude oil with an API gravity of less than 40 API, but when we ask for volumes, we get some combination of crude + condensate + NGL + biofuels.
Global crude oils, in terms of API gravity versus sulphur (note upper limit of API scale):
I do love your analogy which I believe goes something like this: A customer walks into the grocery store and asks the butcher “How much is your steak?”
Butcher “Our steak is $5.25 per pound.”
Customer “I see. And how much steak do you have?”
Butcher “We have 100 pounds of meat.”
I suspect we got too many producers jacking up their volumes with butane. Just a guess.
No!!!
You mean everything in those exploding train cars wasn’t high distillate content oil???
It was not clear to me what your word “synthetic” meant in your last sentence. I wanted to clarify that SCO, as produced by Syncrude is a premium crude.
Here is the refinery yield chart that I have posted several times, which shows synthetic crude (upgraded bitumen).
That’s the story, boys and girls. The yellow bar is pointing at doom.
As noted above, I think that “Imitation WTI” is a better term for the heavy crude/condensate blends.
I call that a condensate/extra heavy blend. I’ve done studies using this type of blend. It faces a large discount in the open market. The long term solution for the Canadians is to upgrade about 300,000-600,000 BOPD of the 8 API to 28 degrees API but avoid making coke, and that’s a bit expensive given their labor cost.
I forgot: what seems to work better is to use something other than a coker to drive the asphalt into a much lower mol weight fluid.
Syncrude itself, produces 300 kb/d of Synthetic Crude Oil (SCO). They have three cokers and one barrel of bitumen yields 0.875 bbl of SCO. The direct operating costs are in the $Cdn40/bbl to $Cdn45/bbl.
Not quite sure why you say avoid making coke. The released H2 is captured, plus additional H2, is used to upgrade the product to SCO.
In addition Suncor and Canadian natural resources sell upgraded crude products.
Ovi, the coke product has contaminants which make it really hard to market. It’s a nuisance.
For a new build 300 kbd upgrader I advocated we use a 4 drum coker with 18 ft drums, but also add a 10000 kbd unit to process a 4 degree API still bottoms feed . The unit cooks the molecules, we add hydrogen and catalysts and out comes a stabilized syncrude.
I don’t like to expose too much cash, the 10kbd unit would copy the “combi cracking unit ” the Germans built many years ago. Once we know how it works with a detailed understanding of the operating costs we can upgrade to a 50000 BOPd unit.
Here, read this
http://www.kbr.com/Newsroom/Publications/Brochures/Veba-Combi-Cracking-Technology.pdf
Anyway, that was my proposal about 9 years ago, but we build very few upgraders at this time.
Fernando,
I was surprised to see that this process could convert coal to usable oil fractions. How does this compare to the FT process?
Also as the shipping industry, the traditional waste disposal units for the oil refinery industry is put more pressure not to burn HFO, the refiners will need to find other methods of treating the bottoms.
It is a lot better to add H2 to long chain carbons and make a highly valuable products than creating low priced synthetic coal aka Pet coke.
Took push, this is better than an FT. I only discussed using it to process the still bottoms. But one german engineer who worked in the pilot plant told me theoretically they could put ground up coal and add extra nitrogen.
There’s an ogj article by an exxon engineer written a long time ago, who claimed the gasifier and ft approach was better. But we didn’t want to make any fancy synfuels. The key to moving a lot of that stuff is to keep it simple and let the refinery handle the cooking.
It gets even murkier as WTI’s def changes.
With respect to WTI and “imitation WTI”,
I was thinking an analogy of single malt vs blended whisky, but this makes more sense…
American Cheese vs. Cheddar Cheese
Ron,
I don’t believe it is useful to compare the history of oil to gas rigs. When the gas was $10+ mcf, A lot of the wells were vertical conventional gas, as Rockman was doing at the time. As the gas shale plays came on line, production caught up and the price of gas dropped and the gas rigs move out of town and changed to drilling oil.
The next thing, that happened with gas, was Marcellus and Utica shale came on line and flooded the market, which has been a game changer.
Neither of these two things have or are likely to happen with oil. The oil rigs that are being laid down are horizontal shale oil rigs. So they are the productive rigs, along with the some vertical as well being laid down. I do not see a “Marcellus” coming a long as an oilfield. I am sure we would have had some indications by now if it existed.
There may be some increase of productivity by drilling the sweet spots, but the rate of decline of the rig count, must have an effect on oil production given the appropriate time lags for completion.
And at a 24%/year decline rate from existing US gas production, in round numbers the industry has to put on line the current productive equivalent of the Marcellus Play, every single year, just to offset declines from existing wells.
Orrrrrr the story that dry gas was paying its own way was always bullshit and the price of associated NGLs has fallen with oil and gutted the numbers on gas wells, too.
Jeffrey and I have been musing about assay content and he has an article below that is relevant.
Refiners can get proper oil from imports. Some of them may process the Bakken/Athabasca blend, but they get the dumbbell effect of lots of one end of the assay spectrum and lots of the other end, but not a lot of middle distillates. So again, they’d prefer imports.
We HAVE seen import increases. And so, the less than great stuff coming out of shale stacks up. Add to this some redefinition of WTI and . . . .
Ooops, he already replied.
Ron,
Is there any way to figure out how much we’re actually using? Are diesel and gas storages at all time highs? In my neck of the woods gas is still $1.99 a gallon and diesel is $2.49 a gallon. If demand has really fell off and we keep producing at current rate there will soon be no storage space left, from what i’ve read that can happen in as little as two months and prices would fall further. It seem to me that if they are able to keep production at levels higher than at any other time in the past four decades with the number of oil rigs dropping 30% in the past six months that the sweet spots must be really sweet and they have all but abandoned any area that’s not so sweet.
Next couple of months is going to be very critical. As storage space runs out they will either have to cut production or sell into a market with not enough demand driving prices further down which is the exact opposite of what shale oil needs. Up until now not many producers have had to fold. Thats going to change. I’d imagine there would be a period of time where producers go bust, oil wells get shut in and shale oil doesn’t make a come back until prices are well above $100 and that won’t happen the moment production falls in line with demand. Production could easily fall in line with demand and oil stay sub $60. I see a situation developing where existing shale wells will be pumped until they are dry but until there is a global shortage in oil, prices will remain too depressed for shale to remain commercial.
The only way I know of telling how much we use is at Monthly Energy Review under the column “Total Products Supplied”.
The Weekly Petroleum Status Report will give you the storage numbers for storage numbers for every kind of petroleum product that the EIA tracks.
It doesn’t appear to be any issue with demand according to that Monthly Energy Review. Which makes me wonder how much more room is there to increase demand. My guess is that since demand isn’t really depressed in any way there might actually be more room for decreased demand than there is for increased demand. Looks like a demand plateau covering about 10 years or so.
I can’t think of anything that would currently boost demand beyond where it’s at. Near zero interest rates have pulled all the future demand forward that they possibly can.
And then there is global demand. The following chart shows normalized liquids consumption for China, India, (2005) Top 33 net oil exporters and the US, 2002 to 2012 (same trends continued in 2013).
As I have periodically noted, the volume of Global Net Exports of oil available to importers other than China & India fell from 41 mbpd in 2005 to 34 mbpd in 2013 (total petroleum liquids + other liquids, EIA).
Jeffery,
Thats interesting. Globally we are producing as much as we ever have and at a 1/3 of all time price while i’m sure cost are at all time highs. It appears global demand is at and all time high and oil available to importers besides China and India has fallen by 7 mbpd in eight years.
Sounds kind of Peak-oilish.
Hi Sawdust,
World Oil output(C+C) has continued to slowly climb, at least through Oct 2014 (12 month trailing average) which is the most recent EIA data point. Peak oil may arrive by August 2015 as Ron predicts (I believe he means the trailing 12 month average C+C from the EIA), or if oil prices rise we may see an undulating plateau (for trailing 12 month output) of +/- 500 kb/d from 2015 to 2020. Time will tell, but most will not believe we are at peak oil until the trailing 12 month average of C+C has fallen to 1000 kb/d below the peak.
The other problem is that IEA and OPEC total liquids data tend to confuse matters as the numbers are not reported in barrels of oil equivalent as they should be.
NGL and biofuels barrels should be reduced by 35% to account for their lower energy content relative to C+C.
Should be able to unrefinery gain that stuff for a raw crude bpd number?
New 18-minute episode out of It’s The End of The World As We Know It and I Feel Fine
That’s great, it starts with an earthquake…
I feel fine.
Hi all,
The editor will be down temporarily. Will advise when it is back up.
The edit function should be working again.
This is a test to see that it still works.
I think it does.
Warren Buffet is discussing expanding his car dealership business:
http://www.cnbc.com/id/102549930
from David Hughes at PCI
http://www.postcarbon.org/revisiting-the-shale-oil-hype-technology-versus-geology/
Summary and Implications
Central points from this analysis include:
Irrespective of price, geology is trumping technology in the Bakken and Eagle Ford plays.
The widely reported ramp up in well productivity in the Bakken and Eagle Ford plays over the past year due to technology improvements does not exist when examined at the play- and county-level . Although some operators may have experienced productivity increases depending on the location and quality of their leases (eg. Whiting in Mountrail County of the Bakken), others have experienced correspondingly greater than average decreases.
Well productivity in the top-producing counties of both the Bakken and Eagle Ford is declining, despite the application of the best technology. This is due both to saturation of the best parts of these counties with wells and resultant movement to lesser quality areas, and potentially to well interference as densely spaced wells cannibalize each other’s production.
The decline in well productivity in top counties is particularly disturbing given the incentive for operators to move drilling into core areas to maximize economics given the drop in oil price.
The widely speculated decline in shale oil production due to the fall in rig counts will not become fully evident in actual production data for a few months, due to the typical 2-4 month lag in data release, along with inevitable revisions.
The drop in rig count will certainly affect near term production but will not significantly change the amount of oil that can ultimately be recovered from these plays. In fact it will save oil for later, reducing the post-peak rate of production decline.
The industry’s propensity to drill its best locations first means that prices will have to go much higher to recover the last of the oil from these plays.
Projections in Drilling Deeper may be a bit too optimistic in the short term given the decline in rig count and associated drilling rate but are on track for the longer term.
“Driven by solar and wind, world investments in renewable energy reversed a two-year dip last year, brushing aside the challenge from sharply lower oil prices and registering a 17 percent leap over the previous year to stand at 270 billion dollars.
These investments helped see an additional 103Gw of generating capacity – roughly that of all U.S. nuclear plants combined –around the world, making 2014 the best year ever for newly-installed capacity, according to the 9th annual “Global Trends in Renewable Energy Investments” report from the U.N. Environment Programme (UNEP) released Mar. 31.”
http://www.commondreams.org/news/2015/03/31/year-eye-catching-steps-forward-renewable-energy
Citigroup: Oil price drop ‘won’t affect growth of renewables’
http://www.theweek.co.uk/oil-price/60838/oil-price-unlikely-to-rebound-says-saudi-official
How much of that is hydro?
I don’t think the 9.1% includes Hydro, or the total would be 22%.
http://www.ren21.net/Portals/0/documents/Resources/GSR/2014/GSR2014_KeyFindings_low%20res.pdf
Why might there be an oil glut?
The price is too high! The world could not afford 147 dollar oil and it cannot afford 48 dollar oil.
I’m all for two dollar per barrel oil, even less, a dollar and sixty cents would be even better.
A return to a true price and a fair-priced market is what is needed, not anything else.
Hundred dollar oil is a hyper-inflated price which causes an oil glut.
Fifty dollar oil is a hyper-inflated price. It just looks like it is cheap, but it’s still expensive.
Two dollar oil is a fair price.
Every single oil company will have to declare bankruptcy, but it will be better than what it all is now.
Two dollars for a barrel will bring the world back to reality instead of the surreal financial soft warfare going on now.
I’m not sure if you’re serious. But I’ll indulge you.
No rigs outside of the sweetest of sweet spots in Saudi Arabia could afford to operate on $2 a barrel oil, not without the most massive subsidization program in history.
OPEC is pumping full speed. The current price of oil is pretty much what the market will bear at current levels of demand and supply.
I know people here are skeptical of our ability to transition to a more sustainable civilization without impoverishing pretty much everyone, but I think we need to go full speed ahead.
In a just, fair world, QE money would go towards building the latest, safest, and most efficient nuclear power plants, putting solar panels on commercial and residential buildings, and subsidizing the cost of electric cars. A massive program of urban renewal, infrastructure spending, and investments in clean, renewable energy would go a long way towards breaking our civilization’s addiction to oil. And no half-measure bullshit: I’m talking a trillion dollar or more plan and investment in our future.
Really, this should have started in the 1970s, but foresight isn’t exactly a collective strength of humanity. In any case, we’re at a position where cheap fossil fuels = bad for the environment, bad for unconventional oil producers (who are taking a larger and larger share of overall oil production as each year goes by) and high prices = bad for the economy.
In a just, fair world, QE money would go towards building the latest, safest, and most efficient nuclear power plants, putting solar panels on commercial and residential buildings, and subsidizing the cost of electric cars. A massive program of urban renewal, infrastructure spending, and investments in clean, renewable energy would go a long way towards breaking our civilization’s addiction to oil. And no half-measure bullshit: I’m talking a trillion dollar or more plan and investment in our future.
While I understand the skepticism of people who don’t think this will/can happen, I prefer to focus on this than collapse. If collapse is inevitable, so be it. But if that is the case, then we have a choice of doing nothing and waiting for it, or doing something on the chance we’ll moderate the situation.
Why not QE military superiority?
That’s always the greatest risk. Collapse has no reason to be uniform.
Damn, I was going to praise my pun. Where went edit?
Well here’s an oxymoron for your pun:
“…latest, safest, and most efficient nuclear power plants…” ~ Anonymous
How is that all an oxymoron?
Do you read what you write?
The latest nuclear power plants are the safest and most efficient yet. That’s just how it works. We haven’t made things worse. There’s a comparative argument to be made (i.e., that the latest Chinese nuclear power plants are probably less safe than American power plants built in the 1980s), but that is in no way an oxymoron.
Are nuclear power plants the solution to everything? No. Are they dangerous? Yes. But there are worse alternatives.
It is imagined that some people would have to be literally ‘bathed in radiation’ and have oversized cancerous sores emanating from their skin from swollen organs beneath, and hair falling out, and vomiting and bloody urine, or stuff like that, before they finally agreed that safe/efficient/etc. and nuclear were indeed oxymorons.
By the time some people are convinced of anything, they are already dead by their own stubborn/arrogant ignorance, which may prove to be our lot for our species as well.
“Do you read what you write?” ~ Anonymous
I think you are projecting.
Incidentally, nuclear energy is funded by people coerced into paying taxes.
I can’t possibly be taken seriously, it would be a mistake.
I can be serious, not now, but now.
I will treat it seriously, that’s good enough.
All that is necessary is to return to a monetary system that is limited, it may seem utterly ridiculous and maybe it is. There is only so much gold and only so much silver, limited. Finite, like oil, fungible, like oil.
I say two dollars because ten two dollar barrels of oil are worth 20 dollars.
A double-eagle, an ounce of gold.
Silver is at 16 dollars per troy ounce. Three times 16 is 48, happens to be the price of oil in silver metal value. Three silver dollars buys one barrel of oil. Seven barrels of oil, a ton, will cost 21 dollars in silver coin.
A gold price of 1187 dollars, 1187 divided by 48 is 24.7291 barrels of oil.
What used to buy ten barrels of oil now can buy 24.7291 barrels of oil.
At a 1.60 per barrel, it would be 12.5 barrels of oil.
Either gold is overpriced by somewhere in the doubled range and oil is cheap by what an ounce of gold will purchase or too expensive by what three silver dollars will buy, by today’s current exchanges for commodities.
A gold standard will right the financial ship.
Seems insane, but a two dollar barrel of oil is a 100 dollar barrel of oil, but will be more valued and more productive.
A fiat system fails every single time and it will again.
Seems crazier than hell, but that’s how it happens.
Have fun while it all completely goes straight to hell.
Is it enough to keelhaul Javier sufficiently and thoroughly, or should the keelhauling resume and then euthanize the poor wretched soul?
Ronald Walter- The object of life is not to be on the side of the majority, but escape finding oneself in the ranks of the insane.
Investors are spending $600 million for a drilling rig, which costs hundreds of thousands of dollars per day to operate to find enough oil to ship it by pipelines over a mile deep under water for 50 miles to arrive at a refinery for a “fair” price of $2 per barrel? Tell you what; when you can purchase a first class postage stamp for under one half of one cent, I might entertain your thoughts. Until then —
In your unique case, I think that the following applies: “One must learn to think well before learning to think; afterwards, it proves too difficult.”
Dear Ron
I wonder if you realize that your prediction of Peak oil for 2014-15 coincides with a prediction by Jean Laherrere back in 2003?
Quotation from Richard Heinberg’s new book Afterburn, page 11. Quoting from The Party’s Over, 2003 edition, page 118:
‘Colin Campbell estimates that extraction of conventional oil will peak before 2010; however, because more unconventional oil—including oil sands, heavy oil, and oil shale—will be produced during the coming decade, the total production of fossil-fuel liquids (conventional plus unconventional) will peak several years later. According to Jean Laherrere, that may happen as late as 2015.’
Don Stewart
Nice comment Don: Maybe you’ve just put Ron (and Jean) in the history books.
No, I had no idea that he had picked “as late as 2015” but I think that is a great prediction, and I believe, spot on.
Niece Nikki from Norway (if you don’t mind alliteration) agrees and says to say Great Work Ron. I missed seeing her on my last trip because she was on a rig. Thought I might manage to visit her there but to qualify for a platform in Norway is harder than going to the Space Station – the (safety) engineer just looked at me and laughed.
I don’t know now, but the safety passport needed to fly offshore required a pretty intensive survival training course. It included a drop in an upside down cabin into cold water wearing blind goggles.
I don’t know now, but the safety passport needed to fly offshore required a pretty intensive survival training course. It included a drop in an upside down cabin into cold water wearing blind goggles.
This singer was invited to perform a concert on an off-shore rig. She and her band had to go through the training in order to perform.
▶ Katie Melua – The Gig on The Rig (Concert Under The Sea Trailer) – YouTube
Boomer II, That’s a super cool “vid” and Katie one great singer. But, we might get shot with one of those totally off topic arrows any time now? No, I take that back, it’s actually on topic and educational.
Yup, but it’s probably worse now, at least in Norway. Thing is, you not only have to be able to get yourself out of a out of a pickle, (as you say, upside down, blindfolded, in freezing water) you’re supposed to rescue a couple of “unconscious mates” at the same time. Hardly an old man’s game.
That might work in a swimming pool! I worked as a saturation diver on rigs off the coast of Brazil back in the late 70’s and I know we lost a team of divers in a chopper that took off from the heliport and nose dived right into the ocean. It sank like a rock no one got out. You’d figure if anyone had had a chance it would be a team of young, highly trained professional divers, as for chubby middle aged men? I very highly doubt they’d have any chance at all.
Heh, I’m not chubby, decrepit and senile of course but not chubby. Well, a little overweight perhaps.
Hi Don,
Note that in 2003, Jean Laherrere’s estimate for World C+C less extra heavy oil (oil sands in Canada and Venezuela) was about 2000 Gb, he later revised that estimate higher to 2200 Gb and in a 2013 paper by Jean Laherrere a Hubbert Linearization for OPEC and non-OPEC oil suggested a URR for C+C-XH(extra heavy oil) of 2600 Gb. Often the Hubert linearization method tends to underestimate the eventual URR. See pp 21-22 at document linked below (Feb 2013)
http://aspofrance.viabloga.com/files/JL_2013_oilgasprodforecasts.pdf
Note that Jean Laherrere continues to estimate 2200 Gb for World C+C-XH and in 2013 he estimated about 2013 for the World C+C peak, so I think he would agree with Ron’s estimate.
I think a plateau from 2015 to 2020 is more likely (though oil prices will play a big role and are hard to predict), if we call the midpoint of the plateau the peak that would be mid 2017. I think any near term decline due to low oil prices will be a head fake, output will return to 2014 levels as oil prices rise back to $100/b or more (by 2017 at the latest).
Dear Dennis Coyne
I’m not at all sure about the price of oil. I have been reading Gail Tverberg’s explanations for why she thinks that low prices will bring about Peak Oil rather than geological depletion. Gail relies on statistics and English language explanations. Richard Heinberg uses reasoning similar to Gail’s. Using more mathematics is BW Hill…who comes out on the same side of the argument as Gail, but with mathematical specificity. I am not sure about Hill’s model. He speaks of Exergy, and has some graphs showing that you don’t get as many BTUs for your money as you used to.
Here is where I simply don’t understand what Hill is doing. We know that Exergy is zero when the temperature of the energy source and the temperature of the environment are the same…no useful work can be done. We know the BTUs of a barrel of oil pretty well. Does Hill consider GDP as a measure of the ‘temperature’ of the economic environment in which the oil is used?
Back in 1900 a barrel of oil was a magical substance because the ‘temperature’ of the economy was so low. Most people were subsistence farmers. The complexity even of cities such as New York and London was nothing like it is now. So…we might reason that a barrel of oil will not have the same effect on society now as it had in 1900. It’s going to take a lot more work to increase the complexity of society even more. It’s similar to the fact that as the weight of a car increases, it takes more BTUs to get it to move.
I can see that reasoning that way might lead one to a sort of gridlock, where the society just grinds to a halt and collapses.
On the other hand, as I have said before, my favorite way to think about it is the Mobus and Kalton notion of rearranging the components of the system. In some sense, that is what has happened since the Big Bang…chemistry and biology and ecology and economics happened and complexity increased. With reduced energy, then the components will have to be rearranged to consume less energy.
But it is probably a mistake to think that ‘the Economy’ is a fixed thing with energy requirements. For example, Kyle Bass was recently talking about the possibility that all of the US citizens who have fallen out of the labor force since 2008 may never get another job, and will be ‘permanent wards of the state’. That is moving the components around in ways that preserve the prerogatives of the very rich. Similarly, the richest families have garnered almost all of the increased income since the Federal Reserve began its various programs. This is also moving the components around in ways that preserve the prerogatives of the very rich.
If I take the ‘moving the components around’ viewpoint, I can see the economy as being increasingly one in which the very rich can have anything they want, while lots of people will just be flushed out of the system and subsist on very little, and will die prematurely, for the reasons that were laid out in the Cancer articles I posted the link to.
In that scenario, I see no reason why oil prices cannot rise considerably, so that private jets can still fly and oil companies can still make money.
However, there is also the requirement that the mechanisms that made the very rich actually rich continue to work. For example, Wal-Mart made several multi-billionaires. But Wal-Mart sells into the lower end of the market. And Wal-Mart is not doing well because the lower end of the market is not doing well. So, today I read that Wal-Mart is squeezing its suppliers to try to restore profitability. Does the bottom end have to prosper so that the top end can prosper?
My head hurts thinking about all this, so I will quit now.
Don Stewart
Hey Don go find yourself a willow tree, scrape off some of the bark, make yourself an infusion from it and drink it before you go to bed… In the morning your headache will be gone. >;-)
On the other hand, as I have said before, my favorite way to think about it is the Mobus and Kalton notion of rearranging the components of the system. In some sense, that is what has happened since the Big Bang…chemistry and biology and ecology and economics happened and complexity increased. With reduced energy, then the components will have to be rearranged to consume less energy.
I happen to wholeheartedly agree. I think that Chapter 11 in Douglas Hofstadter and Daniel Dennett in their book,’The Mind’s I’ have a wonderful way of making us think about that reorganization of the parts of a very complex organism into a completely different one even though all the individual components have for all practical purposes remained the same.
http://themindi.blogspot.com/2007/02/chapter-11-prelude-ant-fugue.html
TORTOISE: There, there, Achilles-don’t feel bad. I’m sure you won t miss Fugue’s Last Fermata (which is coming up quite soon). But, to return to our previous topic, Dr. Anteater, what is the very sad story which you alluded to, concerning the former owner of Aunt Hillary’s
property?
ANTEATER: The former owner was an extraordinary individual, one of the most creative ant colonies who ever lived. His name was Johant Sebastiant Fermant, and he was a mathematiciant by vocation, but a musiciant by avocation.
ACHILLES: How very versatile of him!
ANTEATER: At the height of his creative powers, he met with a most untimely demise. One day, a very hot summer day, he was out soaking up the warmth, when a freak thundershower-the kind that hits only once every hundred years or so-appeared from out of the blue and thoroughly drenched J. S. F. Since the storm came utterly without warning, the ants got completely disoriented and confused. The
intricate organization that had been so finely built up over decades all went down the drain in a matter of minutes. It was tragic.
ACHILLES: Do you mean that all the ants drowned, which obvious would spell the end of poor J. S. F.?
ANTEATER. Actually, no. The ants managed to survive, every last one them, by crawling onto various sticks and logs that floated above tl raging torrents. But when the waters receded and left the ants back on their home grounds, there was no organization left. The cas distribution was utterly destroyed, and the ants themselves had r ability to reconstruct what had once before been such a finely tune organization. They were as helpless as the pieces of Humpty Dump in putting themselves back together again. I myself tried, like all ti king’s horses and all the king’s men, to put poor Fermant together again. I faithfully put out sugar and cheese, hoping against hope that somehow Fermant would reappear . . . (Pulls out a handkerchief and wipes his eyes.)
ACHILLES: How valiant of you! I never knew Anteaters had such bi hearts.
ANTEATER: But it was all to no avail. He was gone, beyond reconstitution. However, something very strange then began to take place, over the next few months, the ants that had been components of, S. F. slowly regrouped, and built up a new organization. And thus was Aunt Hillary born.
CRAB: Remarkable! Aunt Hillary is composed of the very same ants Fermant was?
ANTEATER: Well, originally she was, yes. By now, some of the older an have died, and been replaced. But there are still many holdover from the J. S. F.-days.
CRAB: And can’t you recognize some of J. S. F.’s old traits coming to the fore, from time to time, in Aunt Hillary?
ANTEATER: Not a one. They have nothing in common. And there is n reason they should, as I see it. There are, after all, often sever distinct ways to rearrange a group of parts to form a “sum.” An Aunt Hillary was just a new “sum” of the old parts. Not more than the sum, mind you just that particular kind of sum.
Bold mine.
This is one reason I have such a difficult time understanding why it is that people simply can’t even imagine anything other than the current system or why they get so hung up on politics, ideologies, various ‘ISMS’ etc, etc… It isn’t written anywhere that should our industrial civilization collapse, that at least some of us can’t pick up the pieces and reorganize them into something completely new and very different than BAU. Let’s face it we are at global peak oil so something has got give sooner or later BAU has to go but like a Phoenix rising from the ashes there maybe simpler and even better ways to create something from the parts.
Cheers!
Fred
I think you may be forgetting ant nature including ways of ant-thinking, ant-feeling and ant-acting whereby ants tend to naturally, independently of the influence of ant-culture, govern and control the direction of ant-life. The question of what these characteristics are, how fixed they are, and what causes them are amongst the oldest and most important questions ever discussed in anthills throughout the ant kingdom.
Do ants produce their overdue report on Russian shale?
Of course not! that’s something only the ‘Ant Hill’ is capable of doing >;-)
ANTEATER: Now there’s a vital point. It requires some elaboration. You see, what it comes down to is how you choose to describe the caste distribution. If you continue to think in terms of the lower levels — individual ants-then you miss the forest for the trees. That’s just toy microscopic a level, and when you think microscopically, you’re bound to miss some large-scale features. You’ve got to find the proper high-level framework in which to describe the caste distribution-only then will it make sense how the caste distribution can encode many pieces of knowledge.
No Doug, ‘ants’ can’t and don’t think, ‘Ant Hills’ on the other hand are capable of signaling and communicating with streams of dumb ants… >;-)
ACHILLES: So everything depends on the caste distribution, eh?
ANTEATER: Right. Let’s say a signal is moving along. As it goes, the ants which compose it interact, either by direct contact or by exchange of scents, with ants of the local neighborhoods which it passes through. The contacts and scents provide information about local matters of urgency, such as nest building, or nursing, or whatever. The signal will remain glued together as long as the local needs are different from what it can supply; but if it can contribute, it disintegrates, spilling a fresh team of usable ants onto the scene. Do you see now how the caste distribution acts as an overall guide of the teams inside the colony?
ACHILLES: I do see that.
ANTEATER: And do you see how this way of looking at things requires attributing no sense of purpose to the signal?
ACHILLES: I think so. Actually, I’m beginning to see things from two different vantage points. From an ant’s-eye point of view, a signal has no purpose. The typical ant in a signal is just meandering around the colony, in search of nothing in particular, until it finds that it feels like stopping. Its teammates usually agree, and at that moment the team unloads itself by crumbling apart, leaving just its members but none of its coherency. No planning is required, no looking ahead; nor is any search required to determine the proper direction. But from the colony’s point of view, the team has just responded to a message which was written in the language of the caste distribution. Now from this perspective, it looks very much like purposeful activity.
CRAB: What would happen if the caste distribution were entirely random? Would signals still band and disband?
ANTEATER: Certainly. But the colony would not last long, due to the meaninglessness of the caste distribution.
CRAB: Precisely the point I wanted to make. Colonies survive because their caste distribution has meaning, and that meaning is a holistic aspect, invisible on lower levels. You lose explanatory power unless you take that higher level into account.
OK Fred, I bow to your (superior) ant-knowledge.
LOL! At times I’m not even sure I’m capable of rational thought, let alone possess any kind of superior knowledge. I’ll leave that up to Dr. Anteater. I just wanted to put a little food for thought out there about reorganizing the existing parts of a complex system into a completely different system now completely unrecognizable to those who were part of the old system.
All the same old parts but now a completely different whole. It seems it can happen more frequently than Horatio might imagine in his philosophy. So I’ll leave it up to Daniel Dennett, who is a philosopher, to figure out all the details.
I’m just going to go follow a trail of crumbs >:-)
King/Queen
In any case, among social insects such as bees, termites, ants, etc… there are only queens and never any kings, maybe a few drones.
I have to wonder if the young lady in your art gallery has any nieces…and if they call her ‘Anty’? And if that might lead some to believe she is anti something. I’ll let you up the ante… GRIN!
‘u’
BTW, if you right-click the image, you can get its normal size.
hi Don,
Nobody knows what oil prices will be in the future, neither Gail or I can really say.
I expect in some sense low oil prices will be the reason peak oil arrives.
That is, $1000/b might allow more output, but it will be too expensive relative to alternatives. So what someone means by a “low oil price” is critical.
If Gail thinks the economy cannot support $100/b oil at present output levels, I believe she is incorrect. Time as always will answer these questions.
Maybe she means the economy cannot support $150/b oil at present output and GDP levels, that would be correct in my view. In the future, the economy is likely to grow and will be able to handle higher oil prices, especially if output is on a plateau or declining. The World can probably handle 4% spending on oil output, at 2014 GDP and C+C output levels, that would be about $110/b.
If C+C output remains at 2014 output levels and the World economy grows at 3% per year, then oil prices can also grow by 3% per year, so in 2030 $170/b (in 2015$) would be affordable due to economic growth.
Now these oil prices may not be high enough to allow oil to be produced profitably at 77.5 Mb/d, so the peak would occur because oil prices would be too low to keep output at the peak level. If that is what Gail means, then I agree.
Dear Dennis
You can ask Gail directly when she gets back from China in a few days.
But she frequently says that ‘our economy was built on 20 dollar oil, and that is what it requires to grow’.
My own thoughts on the matter go along with the ‘rearranging the components’ methodology. It is quite incredible to me that we have rearranged so many of them in recent decades. For example, I was watching a Japanese movie from the 1960s. The women were all sitting in a big room typing. The men were in a separate big room writing stuff in ledger books. Neither of those jobs exist anymore.
I don’t think there is any question that cellular phones have made travel less required and also more convenient.
Google’s self-driving cars may change the embedded energy in our transportation fleet.
All these things amount to ‘rearranging components’, and some of them lead, I think, to lower oil consumption. The Jevons Paradox is frequently invoked to ‘prove’ that efficiency is not an answer. But we may be in different times than Jevons. The appetite for digital services seems to be bottomless at this point. If the price of oil goes down, people may spend the savings on more digital goodies. The digital goodies don’t consume as much oil as additional driving around the countryside.
Just speculation on my part….Don Stewart
The US economy grew faster in the 1800’s vs the 20th century, using biomass and coal that was much more expensive per BTU. It grew faster before WWII, when energy was more expensive compared to after WWII.
This “cheap energy is necessary” meme makes no sense.
OTOH, EVs are cheaper than ICEs. Oil is expensive, risky and dirty: it’s time to phase it out ASAP.
And then there’s the EV meme.
“Battery-powered! It’s eco-groovy!” ~ Stephanie McMillan
That’s right the electric cars go 3.5 miles per pound of coal. They go till they break down on less than 100 pounds of modified silicon, without producing any pollution.
Guess what is going to win.
Try that one with an ICE
What does that mean to someone who doesn’t specialize in the field? Are you suggesting that EV’s are the lesser of two evils? But also, you have to actually make the things for everyone who wants one and avert Jevon’s paradox. There are a lot of contexts with EV’s and industrialization in general.
Hi Caelan,
Sorry, I am a scientist so I sometimes leave out much of the steps in between, wrongly assuming most people have thought it through already.
Basically, electric cars can run on the solar energy footprint equal to their horizontal cross section (their shadow). So if you either mount the solar panels on the car or, externally, it doesn’t take much panel (silicon and a mix of other elements to make the semiconductors operate across a wide electromagnetic energy bandwidth) weight to provide the overall power from the sun. Whereas fossil fuel powered cars are constantly needing more fuel mass to continue operation, solar powered cars just keep running on the massless energy provided by sunlight. The need for industry providing energy and it’s resultant destruction of the environment is then broken.
Yes, they are the far better of the two evils. Jevon’s paradox does not apply for several reasons. Economics and actual need limit the use and numbers. The coming rise of autonomous vehicles will greatly reduce the number of vehicles needed, especially in the densest populated areas. This disruptive technology will reduce the loss of huge amounts of current infrastructure and give the economic opportunity to produce positive changes elsewhere.
Yes we will still crush frogs and other little animals with the tires, at least for now. However, to reduce carbon pollution, greatly reduces the problems from peak oil and other peak fossil fuels is a great step forward. Reductions in global warming will save far more species than continuing BAU into collapse and the resultant chaos.
Lockstep with this gain is the growth of solar and wind. Cars with highly efficient solar panels on the car will need little or no power externally, so renewable energy gains will eliminate coal and gas powered electrical stations.
This glitzy high tech solution has such huge advantages (environmentally and in performance) that it should go forward. The best part is that it is advantageous enough to grab consumer market share and displace the ICE engine – a big step toward stopping the destruction that post peak oil would cause.
We can make more steps later. Right now it is best to make practical positive changes that can actually happen.
This “cheap energy is necessary” meme makes no sense.
The cheap energy has also led to energy waste that hasn’t contributed in a significant way to economic growth. Muscle cars don’t add to economic growth. Inefficient buildings don’t add to economic growth.
Hi Don,
I would suggest to Gail that there has been a lot of World growth since oil has risen above $20/b (in 2014 $), so I would disagree with her assessment. There are many things I would not agree with her on, generally I don’t agree with her analyses.
Looking at BP Oil price data in 2014$, oil prices have been above $20/b since 1974. She was probably talking about nominal prices which have been above $20/b since 2000. World GDP has grown quite a bit since 2000, so I am not convinced that high oil prices are a big problem, less than $110/b in 2014$ is ok.
I used to defend Gail occasionally from people who called her a shill for the oil industry and I think she is probably a pretty smart individual.
But I also think she has made a name for herself – and also created a career for herself – out of her long standing interpretation of the oil issue. What I am trying to say is that she could not come out publicly and say anything different from what she has always said even if she wanted to; doing so would not be good for her career.
Beyond this consideration I think she is trapped in the same kind of intellectual box as most professional people – meaning she cannot or chooses not to understand arguments made by people who think altogether differently, basing their their thinking on a different set of assumptions and a different world view.
Now my good cyber friend Fred and my good cyber friend Nick basically live in different intellectual worlds. They cannot even REALLY communicate with each other because they aren’t using a common set of definitions.
I inhabit a different intellectual mind space that overlaps the space each of them lives. So I can understand and agree that Nick is right that growth does not NECESSARILY mean more STUFF and more CONSUMPTION and more PEOPLE.
I have no trouble understanding what Fred means – and I agree that he is right too. His argument is more material or quantitative and much easier to grasp if you have the hard science mind set of a biologist.
Nick’s argument is more subtle.
Maybe I can illustrate it after a poor fashion. Suppose there is a community on a smallish island big enough and with a stable enough climate etc that the local population can be self sustaining – that the economy is sustainable – without the necessity of either importing or exporting ANYTHING.
The people on this island – if they are persistent and curious and ambitious and willing workers – MIGHT figure out ways to live a little bit better generation after generation- EVEN THOUGH they practice birth control or some other method of population control so as to maintain a stable population.
Now with the amount of people held constant and the economy long term sustainable – meaning it is based on using only renewables and resources that do not WEAR OUT or disappear with use – this higher living standard in my estimation can reasonably be called GROWTH.
If Nick has argued that such growth can continue INDEFINITELY or forever without limit I missed it.
An example of a finite resource that does not wear out would be stones that are picked up from a field and used to construct a retaining wall or wind break.
I have rambled all over without getting to what I think is wrong with Gail’s reasoning but I will come back to this later. Got some things to do that will not wait.
And now, a word from Ben Bernanke’s latest writing:
First, as I pointed out as a participant on the IMF panel at which Larry first raised the secular stagnation argument, at real interest rates persistently as low as minus 2 percent it’s hard to imagine that there would be a permanent dearth of profitable investment projects. As Larry’s uncle Paul Samuelson taught me in graduate school at MIT, if the real interest rate were expected to be negative indefinitely, almost any investment is profitable. For example, at a negative (or even zero) interest rate, it would pay to level the Rocky Mountains to save even the small amount of fuel expended by trains and cars that currently must climb steep grades.
Bailouts are coming. They will rationalize it all.
Do economists really believe such nonsense? How can we intervene and wrest control from these nut jobs?
Hillson,
” if the real interest rate were expected to be negative indefinitely, almost any investment is profitable. For example, at a negative (or even zero) interest rate, it would pay to level the Rocky Mountains to save even the small amount of fuel expended by trains and cars that currently must climb steep grades.”
Trust me I speak to hedge fund people & bankers on a regular basis & yes they really do believe this crap.
Nonsense. He is just trying to make the argument for public investment under these economic circumstances to an audience that is obsessed with deficit reduction.
It was a blog post. There was no audience.
Oh, I believe he has a target audience. Why else start a blog?
Watcher, Speaking of IMF, good chance Greece defaults on them first. Could happen real soon as large payment is coming due. I’m interested to see how the HFT’s work in a situation where buying the dip no longer works. They will either buy the dip and lose big time or HFT’s will become the markets worst enemy and take the market down big time.
The pivot towards Russia looks increasingly likely to happen. Southstream pipeline looks increasingly likely to happen as well. What will be interesting is will the rest of Europe place sanctions on any gas flowing through Greece. Russia could very well build that pipeline and the rest of Europe refuse any delivers through it. Or maybe Eurozone rips apart completely and gas flows freely to some countries but maybe not others.
You’re too trusting.
The Greek people will not want to leave cushy EU regulatory benefits and the right to travel to any EU country to find work. I doubt Syriza will ask for a referendum, because if it fails (and it probably would), the opposition can ask for a vote of no confidence and probably win.
Syriza has to go this alone and risk their party.
The more important part of the equation is “Primary Surplus”. Because if you default and you actually do have one, there is no immediate problem other than capital flight — which is not trivial but not decisive.
Potential energy of high elevation water is greatly diminished.
Infographic: Too Warm to Snow in California, Oregon, and Washington
Snowpack in February 2015 was pitifully low in the Cascades and Sierra Nevada mountain ranges.
By Kaye LaFond, Circle of Blue, Tuesday, 03 March 2015 14:25
Potential energy of high elevation water is greatly diminished.
There’s just as much high elevation water. The problem: it’s not sticking around as snow, so that it can melt when it’s needed by farmers.
Well, if we are going to quibble.
Calclim, the California Climate Data Archive
Yes, of course – California is having an overall drought.
I guess I’m thinking about the issue globally – we hear about the impact of shrinking glaciers on Indian farmers, and my understanding is that it’s about the timing of water flows, not the total amount.
California water restrictions now in place. Another historical moment in the mass of messy historical moments the last few decades.
http://www.bbc.com/news/world-us-canada-32151413
Californians are used to gyrating gas prices, but the latest swing from the lowest in years to nearly a dollar above the national average is leaving drivers in a tizzy.
Some are accusing oil companies of manipulating prices. The industry blames an explosion and a strike at two refineries. Academics say it’s structural — the unique way California gets and sells gas.
They may all be partially right.
http://www.latimes.com/business/la-fi-gas-prices-20150401-story.html
Oil companies are engaged in a conspiracy to make renewables more attractive in California. When they see those renewables are highly profitable they will install a million windmills and gigatons of batteries and profit enormously.
how does your comment relate to the article?
Higher gasoline prices encourage renewables. This gets Californians ready for plan B. We go with the flow, spend a few trillion in windmills using junk bonds and sell electricity to eager electric vehicle renters.
The electric vehicle producers/leasers will take over the energy collection and distribution arena also.
The electric vehicle producers/leasers will take over the energy collection and distribution arena also.
Yes, they will. And this isn’t any sort of liberal conspiracy. It’s a natural extension of their business experience.
Many of the newer billionaires in the US have ties to the Internet. So they want to use the same principles that allowed the Internet to grow globally to remake energy.
Plus companies that have been running data centers have had experience with backup systems and are now moving into their own energy generation, sometimes done entirely off the traditional grid.
Having seen how fast the Internet was able to expand because it has never been “owned,” these entrepreneurs see potential in freeing energy generation and distribution from centralized ownership and control.
https://www.dmr.nd.gov/oilgas/stats/historicaloilprodstats.pdf
January of 1984, 3101 wells producing 4,321,796 barrels per month in the Williston Basin. 1394 barrels per well per month.
January of 2015, 11,796 wells producing 36,905,844 barrels per month. A nine-fold increase in production and an increase of almost 2000 barrels per month per well to 3129 barrels per well per month.
The 32 million barrels of increase per month is 384 million barrels of increase in one year. From 50 million barrels per year to 432 million barrels is substantial. That’s what happened. Upends the apple cart.
The number of wells will increase some 1000 when the unfracked wells are completed, more production from the Williston Basin can be expected in the future.
The debt doesn’t matter.
The debt won’t matter. It does now.
PETM study:
Temperatures in tropical regions are estimated to have increased by 3 to 5 degrees C, compared with Late Paleocene values, during the Paleocene-Eocene Thermal Maximum (PETM, 56.3 million years ago) event. We investigated the tropical forest response to this rapid warming by evaluating the palynological record of three stratigraphic sections in eastern Colombia and western Venezuela. We observed a rapid and distinct increase in plant diversity and origination rates, with a set of new taxa, mostly angiosperms, added to the existing stock of low-diversity Paleocene flora. There is no evidence for enhanced aridity in the northern Neotropics. The tropical rainforest was able to persist under elevated temperatures and high levels of atmospheric carbon dioxide, in contrast to speculations that tropical ecosystems were severely compromised by heat stress.
Hi Ron,
Any possibility of inviting OFM back to the comboxes? I found his commentary enlightening and insightful (if a touch too homey at times).
Just curious.
I 2nd that.
http://rt.com/news/245961-mexico-oil-platform-fire/
Fire blazes on oil platform in Gulf of Mexico, 45 reported injured
A fire broke out on an oil platform belonging to Mexico’s state Pemex petroleum giant in the Gulf of Mexico, leading to the evacuation of about 300 workers and leaving at least 45 injured.
Pemex said on Twitter that the fire on the Abkatun Permanente platform in the oil-rich Campeche Bay broke out overnight and eight firefighting boats were tackling the blaze.
http://en.wikipedia.org/wiki/Bay_of_Campeche
http://www.upstreamonline.com/live/1396078/one-dead-in-pemex-platform-blaze
Oh no… This is 5 years almost to the day from BP’s Deepwater Horizon accident. Who needs April fools when the jokes are real.
http://www.pemex.com/saladeprensa/boletines_nacionales/Paginas/2015-029-nacional.aspx
[google translated]
Ciudad del Carmen, early today Camp.- The fire occurred in the area of dewatering and pumping Abkatun Standing platform in the Campeche.
Immediately the Emergency Response Plan Pemex was applied and further evictions of about 300 workers who were transferred to other platforms in the area.
Unfortunately the death of a company worker Cotemar is confirmed; so far 16 workers and company Pemex injured, two of them are reported in serious condition are recorded. They are being treated at the General Hospital Pemex City of Carmen and the Mexican Social Security Institute.
What is the estimated production rate loss?
Kam,
From the article
Roughly 40,000 barrels per day of production were shut in from the affected platform, but output in the rest of the complex was operating “normally”, Pemex told the Reuters agenc
Thx.
I am currently too embarrassed to post anything except this public apology to Ron – who has already privately graciously accepted one via email direct to him.
When he who shall not be named anymore here started calling me names I simply could not tolerate it without responding in kind. I really am a Scots Irish southern mountain hillbilly in terms of my upbringing and culture and I will not tolerate being called nasty names without responding in kind or escalating. Unfortunately on the net escalation is mostly limited to words.
In the world I grew up in people often killed each other over this sort of thing. It still happens occasionally.
I did not want to do anything long term to harm destroy this site which at present is imo the best one on the internet in terms of having great factual coverage of the most pressing issues as well as the very best participating audience.
So I quit posting.
But I sent Ron a very insulting email calling HIM a nasty for tolerating he who shall not again be named.
Then when I dropped in check the site out again be damned if he who shall not be named wasn’t still posting. I did not notice that Ron had banned him a couple of hours earlier. So then I posted a comment calling Ron something quite a bit less than complimentary for tolerating he who shall not be named trying to force the issue. This was of course way out of line. It is not my blog.
Incidentally if it is still up googling his ( he who shall not be named again ) handle will get you a site that has one comment as of yesterday afternoon- me mocking him. What is posted there speaks for itself. It is an attack on Ron that makes what he said about me sound like praise from a Sunday school teacher.
I will hopefully be back eventually , maybe soon , depending on how some pressing personal affairs go.
Hey OFM life goes on! Hope to see ya back soon old friend.
Cheers!
Fred
Hear, hear!
I thought that OFM stepped away to write his memoirs. Gilbert, I think, wrote an 8 volume biography on Winston Churchill. I was going to start an over/under contest – would OFM’s memoirs be more or less than 8 volumes. I guess that I will have to think of something else to add some humor around here.
If I were YOUNGER I might live long enough to write my memoirs. LOL
Eight volumes would never suffice given that I have changed jobs and careers about as often as some people change their underwear.This is to say I have never worked steadily at any given trade or profession but rather just done to suit myself at any given time meaning not working if I had some money left from the last gig. I probably took a couple of dozen jobs at the helper level just to get some education in the field while collecting a paycheck instead of paying tuition. For instance once I worked a couple of months as a carpenter trainee on a fire restoration crew for a company that specialized in repairing fire damaged houses.
So – My autobiography would be titled something to the effect ” The Life of a Jack of ALL Trades ”.
Welcome back, OFM.
OFM, Welome back
Yes, glad to see it OFM.
I too grew up where the court of appeal was Smith & Wesson.
It was a shock when in grad school I encountered the dominant style from sons of the shtetl –extreme rudeness + basic friendliness, Asimov and Feynman being examples.
I learned to much prefer this absence of any six-shooter.-indued superficial politeness.
Here, I am puzzled by those few who seem to have no purpose but annoyance. I remember TOD Leananan’s remark that her worse burden was straight-out mental cases, for whom the only solution was the ax.
Mike just posted the link to the chart below but I thought it important enough to post the chart itself. Eagle Ford oil production fell 99,660 barrels per day or just over 10 percent in January. And this is the Texas RRC giving us this data, not some news agency.
Wow. I also read in a Marketwatch story that EIA reported US production fell slightly for the week of March 27, and that was one reason WTI closed over $50 today. Seemed like they were estimating something just shy of 9.4 million. So wonder how far off that is?
Hi Ron,
Yes the Texas PDQ data is really bad for the most recent month. I would estimate Eagle Ford crude output at about 1230 kb/d for Jan 2015 and C+C at about 1535 kb/d for Jan 2015.
At minimum the 891kb/d needs to be adjusted by the production adjustment factor which brings it to 1046 kb/d and this will still be an underestimate. Typically about 80% of Eagle Ford output is crude so C+C would be about 1300 kb/d at minimum. The most recent RRC data has Eagle Ford crude at about 40% of Texas crude and for the state 89% of C+C is crude. Using the EIA Jan 2015 estimate of 3461 kb/d for all of texas we multiply by 89% to get 3080 kb/d of crude, 40% of this is Eagle Ford so 1230 kb/d of Eagle Ford crude and dividing by 0.8 gets us Eagle Ford C+C of 1535 kb/d.
Eagle Ford Condensate takes a hit in January also.
Texas RRC Eagle Ford Condensate
Ron, if I am reading this right, the production fell off that much in January, as compared to average for 2014, not December, 2014? Or I am not looking at this correctly?
I think you are reading it correctly but that cannot possibly be correct. January could not possibly be down that far from the average 2014 production. I think they are talking about December production. Else I don’t know what to make of it.
James Osborne just emailed me and wanted me to call him for an interview. I called him and it turns out he is with the Dallas Morning News. We talked for about 10 minutes about the Texas RRC and the EIA. He said folks he talked to did not trust the Texas RRC, they trusted the EIA instead. I informed him that the EIA gets their data from the Texas RRC and other states. He said his story would be in the paper tomorrow.
Cool deal about news story. I thought EFS oil was as high as 1.6 million per day towards end of last year. Seems something is messed up.
One thing I will say, although not scientific, is that EFS wells appear to really fall off a cliff after the first full month of production, if you look at Texas RRC PDQ, so if EOG and others stopped completions, it could show up big in a hurry.
There is nothing to be gained by talking to press and integrity of thought is risked. Everything he needs to know is on the screen, and it doesn’t really matter if he knows it or reports it. The inevitable is inevitable.
Hi Ron,
Recent numbers for the Petroleum Supply Monthly are only partly based on RRC data. The RRC has Texas C+C output in Jan 2015 at 3000 kb/d if we apply the production adjustment factor to both crude and condensate, EIA estimates 3461 kb/d so clearly the EIA does not simply report RRC data.
For some states such as North Dakota the EIA just reports the state data, not true for the most recent 12 months of Texas C+C data.
For some states such as North Dakota the EIA just reports the state data, not true for the most recent 12 months of Texas C+C data.
Dennis, the Texas RRC data is the only data they get. They must make their estimate, whether it be too high or too low, from the data they get from the Texas RRC.
None of those guys at the EIA can seem to agree. The Monthly Energy Review does not agree with the Petroleum Supply Monthly which does not agree with the Drilling Productivity Report which does not agree with the Weekly Petroleum Status Report. We know these guys are all just guessing. And for Texas I trust the RRC far more than I trust the EIA.
Hi Ron,
As you have said before (I think), the Petroleum Supply Monthly is the best EIA estimate, so that is what I pay most attention to. The EIA estimate from the Petroleum Supply Monthly is based on RRC of Texas data, but the EIA probably looks at past RRC data and sees how far off the RRC data is for recent months (the most recent 12 to 24 months tend to get revised up over time) and has some kind of algorithm that produces an estimate that is far superior to the estimates by the RRC, especially for the most recent 6 to 12 months.
I expect this to continue. Dean’s estimates are nice, but if you look back in time at his old estimates, they also tend to undershoot the data for the most recent 6 months. They are much better than RRC raw data, but not as good as the EIA estimate in the Petroleum Supply Monthly imo.
Dennis, the EIA estimates and then adjusts after the state data is final. Ron, correct me if I am in error.
As far as Marcellus gas output, up until this current month when it is changing to mandatory monthly reporting, the Pennsylvania Department of Environmental Protection – the state’s regulatory body – only required operators to report output every six months.
It was a complete impossibility to have 100% accurate numbers reported by the EIA in this instance.
Hi Shallowsand,
That is correct, but the state data takes about 24 months before it is final. After 24 months or so the EIA adjusts it’s data to match the state data, these adjustments are quite small, because the EIA estimates in the Petroleum Supply Monthly are pretty good to begin with (relative to the RRC estimates).
Must be time to go hunting Goldman Sachs analyst Damien Courvalin of “rig counts don’t matter” fame.
Look, I started this mess, it was me that sent the links. Platts is owned by McGraw Hill Financial; if they make false press releases with inaccurate information, its new to me. Oilprice.com and now Yahoo have picked up the same story. The basically all say: “State regulator Railroad Commission of Texas just released data for production rates in January showing that output of both oil and gas took one of the most sizeable monthly declines in recent memory.” I don’t know anything about this “adjustment factor” bunk. If there are some issues with these articles blame the authors. Sue them, I don’t care. I thought it newsworthy stuff, I passed it on. Sooner or later production in the US is going to fall off the cliff.
Let me say this, however: OIL OPERATORS IN TEXAS DO NOT REPORT OIL AND NATURAL GAS PRODUCTION TO THE ENERGY INFORMATION AGENCY. I have never done that in 51 years. Nobody does. Whatever the EIA gets they get straight from the Texas Railroad Commission. If folks do not trust the Texas Railroad Commission about oil and gas production in Texas, and believe the EIA instead, you have your jumper cables crossed.
Mike
Yes, as Mike knows, EIA number are projections until they get hard data from the states. Ron has hammered that one home and it is how things work, and has been that way all along. The problem appears that the media people do not know this or even bother to take the time to figure it out.
That is why I come to this blog, because it seems to be the only one that is ran by someone (Ron) who actually knows how the data works. The business news reporters, IMO, have no clue. They do not know how Mike, we or anyone else reports production data. They do not subscribe to IHS Energy or Drilling Info either, apparently. Those companies buy production info from the crude purchasers, so it is accurate too. I know it is because I can look up our lease production on those sites and it matches our run statements and check stubs.
It is kind of like with the “topping storage” BS. We have not had one time yet where a crude purchaser told us to get ready to shut in wells because they would quit hauling crude. We asked a gauger this one day and he laughed.
Even the EIA data shows 60% or so storage utilization, and that includes counting pipelines, which IMO distort that number high given pipelines must carry X amount of fluid at all times.
Further more, we typically have about 1/3 of our leasehold tank storage utilized, at most, and we could probably go two months without selling a drop if we had to. I assume many producers US lower 48 onshore could as well. We are operating leases, as are most, that at one time made a heck of a lot more oil, so therefore we have plenty of extra storage. I bet no one in the media thought of this either.
I continue to be baffled by how shoddy oil reporting is. Some dude with a big bank in NY, who is shorting the H E double hockey sticks out of crude, tells a reporter something and they take it for gospel. They have no freaking clue that many of these shale companies are toast, even if oil goes back to $100, unless they get bailed out by the Federal government. The bonds which mature in 2020 cannot be repaid unless oil spikes to $100+ and stays there, and even then it will be a stretch IMO. If those companies quit drilling wells, we will be back to 5 million bopd in less than 5 years. That US and Canada have been the only ones growing production, and they are the highest cost, should be a concern.
Family has owned stripper wells for 35+ years and this is the first time where we have seen publically traded corporations paying almost as much or more per barrel to keep production flat compared to us. That is not just CLR, WLL and the smaller Bakken players, that also is COP, MRO, EOG. Just look at the 10K. That stuff should be fact if its in the 10K. That is why I have been comparing our stuff to shale. If our little stripper stuff is more economic that most shale oil, there is a major problem if we think shale will save us from high oil prices.
Although I share Watcher’s concerns, maybe the media should at least read Ron’s blog. They might learn more than a little.
Mike Wrote:
“Family has owned stripper wells for 35+ years and this is the first time where we have seen publically traded corporations paying almost as much or more per barrel to keep production flat compared to us. ”
Can a stripper well match the initial output of a shale well? I would assume that its a case of the Hare versus the turtle. It much easier to “con” investors if you can show high initial output growth. The majority of shale “investors” do not understand shale drilling, so the “con man” selling shale have a much easier time getting investors to part with their money.
The shale oil was the modern day era version of snake oil. It cures all, and you need into invest now or miss out on a once in a lifetime investment. Shale drilling is just another gimmick investment, as the housing bubble (2004-2007) or the Dot-Com Bubble (1997-2000).
TechGuy. I will admit the scale of shale is massive and US needs it. It is very expensive, however, and for most, sub 100 WTI won’t cut it, let alone sub 50 WTI.
As to investors, they just look at production growth and EPS. Of course EPS is very distorted as CAPEX is put on a 7-10 year schedule. Try figuring earnings by writing off tangible leasehold equipment and IDC’s in the year incurred. No earnings. Problem this is year after year. Cash flow negative annually.
MLP’s owning stripper wells generate more cash flow than shale drillers on the whole. Think about that for a moment. The MLPs are in trouble too, bought too much too high with borrowed funds. If they are in trouble, shale with worse cash flow should be too.
Actually, after looking at some upstream MLP cash flow statements on yahoo finance, it appears the MLPs have been mostly cash flow negative too, even before distributions. It appears it is more a matter of degree. Most added a lot of long term debt as well. It sure has taken a lot of dough to boost US production 4 million bopd.
“I will admit the scale of shale is massive and US needs it.”
I am not sure why you think the US “needs” shale. It just digs us into a deeper hole because it postpones the problem and when the country & world has its wakeup moment, the production curve will be even steeper, and much more difficult to address. Much like the Dot-com bubble crisis was deferred by the even bigger housing bubble which was deferred by a sovereign debt bubble. The bigger the bubble, the bigger the crisis.
Good point. My comment was along the lines of supply demand. Without the shale assume US would be producing no more than 4.5 million barrels per day.
Where it puts things in terms of another debt bubble, I agree, is a problem. Hopefully, this debt bubble will primarily stay in the private sector, although I acknowledge government ends up being involved in some way.
Re: 4.5 mbpd
And the EIA’s own projection puts US quality crude oil production (40 and lower API gravity crude) at only about 4.5 mbpd in 2014.
I printed out the following chart and actually measured the EIA bar chart, and it looks like they projected that it took roughly half the global (oil & gas) rig fleet to boost US 40 API and lower gravity crude oil by only 0.3 mbpd–from 4.2 mbpd in 2011 to 4.5 mbpd in 2014.
http://i1095.photobucket.com/albums/i475/westexas/US%20Crude%20Oil%20Production%20by%20Type_zpsso7lpqgq.png
Jeffrey. I agree with you. I did state “no more than”. US was at best flat line before shale boom.
One riot, one ranger.
Mike, I have a question maybe you can answer. Or Ron, or anyone else.
We read that Texas is revised upward due to small company late reporting. However, if I look at EOG state wide, for example, is there a reason why their production numbers would not be final?
Do you and others “update” reports? I wouldn’t know why this would happen unless you catch an error after sending in. Would think public company reporting would be accurate.
If you look at big EFS players, we see some hefty drops from 12/14 to 1/15, assuming numbers are final. Would make reporting coming up in a few days critical if numbers are final and Feb falls off even more for big EFS companies.
Shallow, Mike will know a lot more about this than I, however I don’t think there is a problem with the data they send in. It’s the data that they don’t send in that is the problem. Apparently there are a lot of companies that don’t report at all until months down the road. Or they report some leases but not others… until later.
According to an email that ASPO-USA got from the an RRC official, in a lot of cases the RRC has the production data, but the lease numbers have not yet been assigned, and the production is not reported until it has a lease number.
So, as the number of new producing leases declines, one would expect to see a decline in the volume of upward monthly revisions.
Jeffrey. The new lease/no assigned number makes sense. Thanks.
Forgive me for answering this question in the first person narrative.
As an oil and gas operator in Texas I am “operated” by the Texas Railroad Commission; when its says for me jump, I ask how high? I am also bound by mineral laws in the Texas that are as old as Texas itself. Minerals are real property in Texas and often take precedence over the surface estate. Royalty paid to mineral owners is based on the precise accounting of barrels of oil. If my stock tanks get full I have to move that oil off location to make room for more oil. Like 96% of other operators in Texas, I sell that oil to 3rd party crude oil buyers who come pick it up in trucks and take it to a pipeline. When that oil drives out the cattle guard I better be reporting it to the TRRC the same month. Oil cannot be sold unless it is “produced” and sales must balance with production, to the barrel. The crude oil buyer reports the barrels bought from me, for instance on the POB lease, and my numbers better jive with his on the POB lease or I WILL be strung up from the nearest mesquite tree. The accounting practices are strict, and precise. They are all over the US as well; every states that has private mineral ownership likely requires the same accounting standards.
It is not possible to fudge production numbers, or file partial reports, or forget to file reports, or make stuff up, intentional or otherwise. It is NOT possible to defer filing production reports. One of the fallacy’s I have always gotten a kick about is the notion that producers can defer filing production under the guise of “confidentiality.” No can do. Not in Texas. Respectfully, lots of data hounds thought that was the problem in ND but in reality, when they discovered what “runs” meant, that was not the case. If oil was run, it was produced.
The problem in Texas, for those people needing instant data (we don’t think we have any problems in Texas, lol) is the time it has taken to process 12,000 new stinking shale well completion forms the past 6 years and to assign those leases ID numbers; exactly as Jeff speculated. The TRRC has the production data from month one but until that lease name gets a formal ID number, the production data is not released. Up until last year we could file new completion production on line or by paper. The paper reports had to go to a 3rd party to get scanned before it could be put into the TRRC database. The TRRC has switched to entirely digital reporting now and I suspect, with this downturn, it is going to get caught up quickly. In the end, however, every barrel gets accounted for.
Shallow, production reports occasionally must be re-filed to correct accounting mistakes, or errors for instance regarding tank gauges, or BS&W corrections between the buyer and the producer, but those corrections seldom, IMO, amount to more than 2-3 BO at the most. My staff in my office avoid having to re-file a production report like the bird flu. Its rare when we do, and I suspect the same for others, even big ‘ol EOG.
I don’t know how the EIA gets its production poop other than they are just good guessers. Forgive me, its a little funny to me to hear the federal government (that can’t balance a check book) knows more about Texas crude oil production than the Texas Railroad Commission. Ron, if that worm with the Dallas Morning News says he trusts the EIA more than the TRRC, please tell him Mikey said he is full of pinto beans.
Mike
Hi Mike,
The EIA gets the data from the RRC and then analyzes the statistics, which are tracked over time. The fact is the guesses by the EIA for Texas output are pretty good and for the most recent 6 to 12 months are much better than the official numbers reported by the RRC of Texas.
When does the lease number get assigned? Does it take 6 to 12 months from initial production for a lease number to be assigned?
Dennis, we live on different planets; mine is based on the here and now, yours is in the future. I use production data that I can rely on that gives me insight into individual well and overall field performance. What I need comes from the TRRC thru various research engines, like DI. I spend enormous amounts of money prospecting on the information the TRRC provides. I trust it.
You have different needs for information and I understand that EIA “guesses” about Texas production suit your requirements for predicting the immediate future. I respect that. Personally, I don’t think the EIA knows it’s ass from a rotary table and its just as responsible for lulling Americans into a false sense of security about its energy future as the CEO of Shale R Us saying we’re headed for energy independence.
I am not in the predicting business and you are. Keep up the good work, sir.
Mike
Hi Mike,
I agree at the individual lease level, the RRC data is great, I have used that data to estimate the average EFS well (the estimate is now 18 months old so not really relevant anymore). The problem when looking at the entire state is that many leases are not reported in the production database query(PDQ) in a timely fashion.
It is for that reason that the EIA estimate and the reported RRC output for the state of Texas are very different. I have tracked these over time and the EIA “guess” turns out to be very close to correct after the RRC data catches up in 12 to 18 months.
I know you don’t care, but many claim the EIA is lying, they are not, the estimates have been excellent in the past, until we find that this is not the case, it makes more sense to assume this will continue to be the case imo.
Mike, what’s the current practice for say six wells producing to a single manifold, with a test header and a test and production separator? Do you gave to correct well tests by a sales volume factor?
Mike, thanks for this information. There is a wealth of info here that we were not aware of. And it is all good to know. The take away from what you wrote is that the TRRC actually has the real production numbers but cannot make it official until they get a formal ID number for the lease they cannot officially release the data. But when they quote actual production numbers, like the numbers they released to Platts, then you can take it to the bank that these are real production numbers.
The guy from the Dallas Morning News, one James Osborne, actually said it was “some people he talked to” who said they trusted the EIA more than the TRRC. I googled him on the net and he is the “Energy Reporter” for the News. He seemed to know preciously little about energy to be their energy reporter. I looked at some of the articles and he talks more about “energy companies” than anything else.
Yes, the TRRC numbers are very real. They are the only folks that have the real information, other than operators like me.
Thank you.
Mike
Hi Ron,
We will see in 12 months if Jan 2015 output is closer to 81 million barrels as reported by the RRC for crude and 94 million barrels for C+C (using the production adjustment factor from the RRC for crude and condensate) or the 107 million barrels as reported by the EIA.
In the past the EIA estimates for the most recent 12 months have been far better than the RRC final estimate (after applying the production adjustment factor).
Mike is right that the individual lease data is very accurate, but the RRC always underestimates the amount of production that is not in the database for the most recent months reported. The final estimate for Jan 2015 by the RRC of Texas for C+C output will be too low by about 12 million barrels.
Dennis, I really think you are misunderstanding the numbers that the TRRC gave to Platts. The number, 81 million barrels, was not the number after they had added some adjustment factor. That is the number that the commission has for total Texas crude oil production for January.
The number after the adjustment factor had been added was 69.1 million barrels. But this was the barrels that they had the formal lease ID number, plus the adjustment factor.
The 81 million barrels was total production, the number of barrels that they had the lease ID number for plus the number of barrels reported but lacking the lease ID number. No adjustment factor need be added because they have all the data. That number has the same authority as the North Dakota numbers except this is crude only.
Hi Ron,
I believe that the misunderstanding is on your part. First I agree about the Jan 2015 number from Platts.
It was the Dec 2014 number that I did not agree with. I was wrong about that, here is a link showing that Platts was right
http://www.rrc.texas.gov/all-news/022515b/
So the Texas RRC says output decreased by 87 kb/d in Jan.
The Texas estimates are not very good, EIA estimates are much better.
Ron, 95% certain Dennis has this correct.
RRC: “In an effort to estimate actual monthly production more accurately, the Commission will calculate a supplemental production adjustment factor each month to be applied to the preliminary, reported statewide total of oil and gas well gas”
The 1.1750 has not yet been applied to the ~69 million which is clearly labeled preliminary production.
It also matches the 69.1 returned by PDQ which would be actual filed reports, again prior to applying the 1.1750.
The Lease ID number is a bit of a red herring. It explains one reason WHY the reports are slow to get counted and WHY the actuals are as far off as they are, but the adjustment factor is supposed to handle that.
It also explains one reason why, even with electronic filing and 100% compliance, you will still need an adjustment factor as long as there is a backlog in assigning IDs.
I wonder why the RRC does not use the multiplier on condensate.
Mike:
I have been saying for months that the EIA is lying – BIG TIME about Texas oil production.
You are right!
Hi Coolreit,
Yes you have, and you continue to be wrong.
Hi Mike,
I searched back for news items of Texas final output data and found the following for Jan 2011.
http://www.epbusinessjournal.com/2011/03/rrc-production-statistics-and-allowables-for-april-2011/
The Commission’s estimated final production for January 2011 is
31,756,675 barrels of crude oil and 523,585,060 Mcf (thousand cubic feet) of gas well gas.
The RRC currently reports 33,651,027 barrels of crude output for Jan 2011, about 6% higher than the final production estimate from 3 years earlier.
Screen shot of PDQ below, the RRC final estimates of statewide output are not very good.
For Dec 2012 we have:
http://www.rrc.state.tx.us/all-news/022713b/
The Commission’s estimated final production for December 2012 is 51,069,243 barrels of crude oil and 485,269,993 MCF (thousand cubic feet) of gas well gas.
Currently the PDQ (Production Data Query) has 57,786,411 barrels for Dec 2012, or 13% higher than the final RRC estimate. Screen shot below:
Note that I saved EIA data from March 2013 and the Texas C+C estimate was 68,820 kb for Dec 2012. The current RRC data says 68,841 kb of C+C output for Dec 2012. Now that is a good estimate by the EIA when compared with the 51,069 kb estimate by the RRC.
This is the reason that some people prefer the EIA estimates.
Dennis, I don’t work for the Texas Railroad Commission. I am not in the predicting business, I am in the oil business.
Look, you are pulling data from 4 years ago just to prove your point about this adjustment factor stuff. If you read what I wrote up hole, since the Commission went entirely electronic several months ago maybe there isn’t any adjustment factor anymore, I don’t know. Stuff is getting fixed up there in Austin, though I don’t think there was anything wrong with it to begin with.
Again, sir: I do NOT report production to the EIA, NSA, FBI or UCLA golf team. I report to the Railroad Commission of Texas. It is that reported production that is used in Texas, NOT THE EIA’S, to pay billions upon billions of dollars of royalty to mineral owners, including, but not limited to, some of the finest universities in the country; it is TRRC production data to which severance taxes are calculated that benefit all the people of the State of Texas, that every school district in Texas receives tax revenue from, as well as how county roads are maintained, rural water is managed…I can go on and on. TRRC barrels are real barrels.
I understand why some people need real time production data, kinda; if you think the EIA are the go to folks and know more about Texas than Texas does, goodonya.
Mike
Hi Mike,
Initially I did use 4 years back, then I did two years ago. The Production adjustment factor is from the RRC.
http://www.rrc.texas.gov/oil-gas/research-and-statistics/production-data/production-
adjustment-factor/
We agree that RRC data is best for individual lease data. For some reason the production data for the entire state is not very timely. Twenty four months is a long time to wait for the data.
For the most recent month
output reported as 68.949 million barrels
production adjustment factor=1.175
estimated output (crude only)=68.949*1.175=81.02 million barrels of crude for Jan 2015.
Dennis. It is difficult for me to understand all of this.
We have a subscription to IHS Energy. I can logon and look at the production sold from any lease of ours and the information is all correct. There is a less than 60 day time lag. Granted it is barrels sold, not produced.
I cannot figure out why production of a material amount would come in so late.
Neither can i.
Reverend Mr. Black, The Kingston Trio
A response I made to the controversy surrounding the individual who shall not ever be named again for the rest of time remaining in the universe, forever, it was sarcastic, sardonic.
Not that it matters any, that’s just how it is in the real world.
The comment?
To that individual who had that dreaded name, no mention of it at all:
“I for one can thank you for doing the unthinkable.”
Who in God’s name would thank somebody for doing something deemed to be unthinkable?
Did John Jacob Astor seek out Captain Smith and say, “Thank you sir, for sinking the unsinkable ship, nobody would have ever known, but now we do. Thanks so much.”
I was being sarcastic with a splash of cynicism, amounts to a dollop of pure unadulterated criticism, furtively disguised, of course.
I probably was a dumbshit for doing so, but I did it anyway, oh well.
About all of that war talk, here’s how it all will go, again:
https://www.youtube.com/watch?v=hs4s7LrAuMo
Or perhaps closer to home:
https://www.youtube.com/watch?v=jREUrbGGrgM
How about closer to home and closer to the present?
“End of the Ship” by Roy Zimmerman
https://www.youtube.com/watch?v=yXlzkuFBJ7s
LOL! not sure what happened there but that was definitely not the Roy Zimmerman song I wanted to link to…
Oil futures daily chart. Price action turned bullish Mar. 17-18th. The low and the following day formed a Bullish Kicking candlestick pattern. Which is a highly bullish reversal pattern. A daily close above 55.00 points to a move back to 68.00
Fundamentally speaking i see possibly for further declines. But price action is saying different.
I know this is not a trading blog but i think people would like to know where price is headed. I do technical and price action chart analysis for a living. I keep up with fundamentals as a hobby. (Maybe i should add a disclaimer here) This isn’t meant for investment advise. Just to add something i do know well to the conversation.
Zoomed in.
Good stuff Sawdust. Any chance of you looking at current technicals on CSIQ? Along with oil, I am also interested in solars. Thanks.
Re: DCPB (Dennis Coyne Price Bottom)
Dennis may have accurately called the bottom of the current oil price decline, in January, when Brent averaged $48. February averaged $58, and March probably averaged about $56.
During the previous comparable decline, in 2008/2009, monthly Brent prices rose at 43%/year from December, 2008 to February, 2011.
2008/2009 Monthly Brent Price Data:
12/08: $40
1/09: $43
2/09: $43
3/09: $47
4/09: $50
5/09: $57
6/09: $69
Hi all,
I know nothing about trading futures contacts. Definitely do not make any investment decisions based on my WAGs.
Hi Jeff,
I assume that you think oil prices will rise, if so I agree.
I doubt we will see 43% per year. On March 30 the Brent spot price was $54/b, a couple of years at 40% annual price increases would get us to over $100/b by April 2017, that sounds pretty reasonable to me. Clearly the price will not follow a smooth exponential rise it will oscillate above and below this general trend line in unpredictable ways.
It’s very short term data, but so far the observed (1/15 to 3/15) rebound in monthly prices (90%/year on an annual rate) has substantially exceeded the initial rate of increase in monthly prices after the 12/08 monthly low (43%/year on an annual rate, 12/08 to 2/09).
And of course, as I frequently point out the price we are talking about is the price of crude oil with an API gravity of less than 40, and I have argued that in the US (and perhaps even globally), refiners may have reached the limit of how much more very light crude and condensate that they can accommodate without causing an unacceptable loss of distillate production.
https://rbnenergy.com/every-rig-you-take-interpreting-eias-latest-drilling-productivity-report
Every Rig You Take – Crude Oil Production And EIA’s Latest Drilling Productivity Report
Now we all know RBN is an industry blog. Here is a great read on how they are trying to massage the “dreadful” news that the EIA are reporting declining oil production. It is great to see them pussy foot around and try to justify how the EIA could be wrong, and holding out hope, that production could still be increasing. The words they choose do not sound very convincing, but it seems they are compelled to keep the music playing.
Interesting study. I think it should entertain a couple of regular posters here, Did anybody mention batteries or ownership costs for a BEV?
http://www.greencarcongress.com/2015/04/20150401-luk.html
U Toronto LCA suggests that with CNG as primary vehicle energy source, EVs best targeted at non-attainment areas
The NG-e BEV pathway has the highest cost of ownership, 30% higher than those of non-plug-in vehicle pathways, despite having the lowest operating expenses. This high cost is largely due to the $13,000 battery that provides a 125-km (80-mi) driving range.
Heard that there is a concern there will not be enough graphite for EV battery production, each Tesla battery uses close to 100lbs? Any truth to this?
There is lots of graphite in the world.
Not really: In 2010 a European Commission included graphite among the 14 materials it considered high in both economic importance and supply risk. The British Geological Survey listed graphite as one of the materials to most likely be in short supply globally. The US has also declared graphite a critical material.
http://www.miningfeeds.com/2012/02/14/graphite-supply-and-demand
I stand corrected.
Graphite supply is about competitive cost, and time to market, not limits to overall supply.
“What if the current market almost doubles – new demand, between now and 2020, comes in at one million tonnes on top of the existing 1.2 million? Today’s graphite producers, other than the ones in China, are going to have to produce more and junior companies are going to have to get busy and start to develop deposits. There will be a premium placed on mines in stable, safe areas for investment.”
http://www.miningfeeds.com/2012/02/14/graphite-supply-and-demand
Chinese supply is temporarily limited by closing badly managed mines:
“More damaging than the graphite rain, the silver dust that falls from carelessly managed mines, is the hydrochloric acid used in China to process raw graphite into a usable form. The acid is highly corrosive and when released untreated as waste water into the environment is harmful to all forms of life. ”
But, there are alternatives, some of which were closed temporarily due to China’s low environmental standards which allowed artificially low prices.
http://www.bloomberg.com/news/articles/2014-03-14/teslas-in-california-help-bring-dirty-rain-to-china
According to this very detailed article supply appears not to be a problem even in the near-term: there are two Canadian mines that can supply large quantities.
In the long-term, carbon isn’t that hard to find, and synthetic graphite will work just fine. It’s twice as expensive (it would add about $110 to the cost of a Leaf), so it’s not preferred, but it’s viable.
http://www.techmetalsresearch.com/2014/03/going-natural-the-solution-to-teslas-graphite-problem/
The Technology Metals Research article that Nick posted is worth reading…
Going Natural: The Solution To Tesla’s Graphite Problem (See link in Nick’s post)
It touches all the bases regarding, quality, purity and processing… all of which are important for making the graphite anodes in li-ion batteries.
It also points out the companies in the near term that are capable of bringing production on line.
Also worth noting is that synthetic graphite is also available…
Nonetheless, synthetic graphite is twice the cost of battery-grade natural-flake graphite, and is typically derived from petroleum coke, which relies on crude oil as its source.
This high cost is largely due to the $13,000 battery
Nissan sells their battery for $6,500.
Cost differences between conventional vehicles and EVs go far beyond the battery: for capital expenditure (purchase price) no transmission, fuel system, engine cooling, hydraulics, pollution control etc. The engine has one moving part! For operations: much lower maintenance costs.
The Leaf costs less to buy (before tax credits!) than the average new US light vehicle. After tax credits it’s among the cheapest.
The Leaf is the lowest cost car on the road to buy and own, according to Edmunds.com, before tax credits! . After tax credits it’s insanely cheap.
What about the cost of depreciation?
Edmund’s includes depreciation.
Who cares about Edmunds?
Do your own calculation vs an equivalent volume interior vehicle of a proper gasoline engine and ante up results with their quoted depreciated price after 5 yrs.
And what, btw, is the cost to dispose of a toxic waste battery after the 8 yr 100K mile warranty?
Dood, this was done weeks ago here where it was all torn apart. Why are you back on this?
Have you looked at Edmunds? They give all the details for whatever car you like.
Nissan will pay you $1,000 to give them the old battery for recycling. Or, you could keep it – it’s likely to still have 70% of capacity left. That’s about 17kWhs – it would make a great backup battery for the house.
this was done weeks ago here
Yeah, this comes up repeatedly, and people object, and other people answer those questions. Do you remember anything specific that was particularly interesting?
Why do you need Edmunds if you have a calculator.
Go do the work. same company. Versa, the big seller subcompact. Run the numbers. Run the depreciation dollars.
It’s not a question of doing the calculations: I’ve done them, and Edmunds adds and subtracts just fine. It’s the underlying data:
Depreciation
Taxes & Fees
Financing
Fuel
Insurance
Maintenance
Repairs
Edmunds provides that, by year, for each model.
Do you have a good source for that, especially by year? I’d love to see it – it would be very useful, especially after the first five years. I asked for exactly that about a week ago here, and got no responses – I believe the technical phrase is “I heard crickets”.
The crickets were the squeaks in your bank account. Edmunds says their process is proprietary. My calculator is not proprietary. Neither is yours.
Go google Leaf depreciation and look at the avalanche of quotes of 20% residual value after 5 yrs, which is off of what, 35K up front? Vs something like 36% residual for a Versa that cost $17K up front.
You have no leg to stand on. And you know it.
Nah.
First, the Leaf list price is about $28k, not $35k – that’s an old price.
2nd, you can’t calculate depreciation off of the $28k number, because almost all buyers get the $7.5k federal credit, and several states have credits up to $5k. So, you can buy a new Leaf for as little $16k (less than the price you mentioned for a Versa).
Who’s going to pay more than $16k for a 1 month old used Leaf, let alone one that’s 3 years old??
The fact is, that over the lifetime of a Leaf you save about $20k in fuel, and several thousands in repair and maintenance. That’s very, very hard to beat. Heck, an ICE would pretty much have to be free to compete.
On the other hand….if you’re freaked out by the idea of depreciation, just buy a used Leaf. It’s insanely cheap transportation, far cheaper than any ICE.
It isn’t just about depreciation. It’s the entire context of the EV. Cradle-to-grave, the environment, human communities, impact studies…
Your ignorance appears willful/contrived; your comments, in some cases, spam-like.
Why the preoccupation with the EV? Why not permaculture for example? You are quoting government definitions upthread. Are you in government? Industry? What kinds?
Highways/Infrastructure/Materials for your ‘fucken’ EV’s currently require vast amounts of energy, resources and a tax-coerced public to fund.
Your ignorance appears willful/contrived; your comments, in some cases, spam-like.
Caelan, please use kinder language when addressing posters on this blog. Speak to them with the same verbiage you would use if you were speaking face to face.
Ron
Understood, Ron, and pardon that, I know better. It’s just that when speaking of this infernal economy and government, it is an attack on all of us, even if we don’t think so.
In any case, this is just a blog and I should remind myself of that as well. For the most part, we are just burning rubber while stationary here. As others have written, to paraphrase, it doesn’t really matter what’s written here. I would say it can, but maybe little. I would like to focus more on what matters.
Lastly, one can be polite, but fundamentally, dispassionate about what matters, and dispassionate about killing the planet. It probably helps to have dispassion where that is concerned, magazine smiles and all that. And it is already a war anyway. We both know that only too well.
What is collapse but a sum total culmination of a whole lot of little wars on the populations of people and much of the rest of life on the planet?
One irony, Ron, incidentally, seems that, amid your laments in that regard, and perhaps in some contrast to TOD, POB, maybe in large part by its header/framing, provides a kind of ‘lopsided’ forum in favor of those of the particular industries that are having among the largest effects in these wars and collapse.
One irony, Ron, incidentally, seems that, amid your laments in that regard, and perhaps in some contrast to TOD, POB, maybe in large part by its header/framing, provides a kind of ‘lopsided’ forum in favor of those of the particular industries that are having among the largest effects in these wars and collapse.
Huh? Could you translate that into English? Anyway, collapse does not necessarily have anything to do with war. Collapse is the collapse of government and government services and… Collapse is the disappearance of civilization as we know it.
Of course there will be a lot of wars but mostly civil skirmishes. But you could have collapse without any war or wars whatsoever.
“Your ignorance appears willful/contrived; your comments, in some cases, spam-like.”
“Caelan, please use kinder language when addressing posters on this blog. Speak to them with the same verbiage you would use if you were speaking face to face.”
LOL. Shit, my wife is consonantly saying stuff like that — face-to-face. And she’s almost always right. If that’s “out of line” we live in different worlds. We laughed about this over breakfast she added: “If you can’t recognize and then criticize willful/contrived comments for what they are how do you have meaningful debates.” I agree. She also added: Tell Ron that he should try lecturing a room filled with 2nd year engineering students and then try getting a comment from one of them that wasn’t: crap, willful, contrived and totally self-centered — to your face. But “Spam Like”, now that really is a bad thing to say. You must be ashamed of yourself Caelan?
Hi guys, I have posted a response in wider format below.
Used Leaf is terribly underpriced because of misplaced battery worries by potential purchasers. That’s why just this morning I told my guys to go out and buy three of them for $14K that had 10-15K on odometer. Mine has the same, and we think of it as new. We paid for it new exactly the US average new sedan sale price.
Needless to say, the market will very soon reflect that response by buyers like me.
I see ads in local papers all the time for $50K showoff pickup trucks.
“Can’t afford EV’s” –total bullshit.
Last week we had an EV show-and-tell. Tesla, Volt, Leaf, and Mitsubishi were all there. Their owners all praised them, and the Tesla pair had driven to Fla. and from there to Cal and back, with free and copious help from Tesla navigators, and using RV sites for fast charging.
The Mitsu guy used his on a commute every day, using up the entire advertised 60 mile range every time. He said he never had trouble, and had quit thinking about it.
I firmly believe that older pure electrics and plug in hybrids will sell for premium prices once working class folks who HAVE to drive realize how cheap they are going to be to drive and maintain.
The problem with resale values now is that only early adapters are driving electrics and plug in hybrids and they are well enough off to buy new cars. The typical man or woman on the street does not yet even know anybody who owns an electric or plug in car. So they are afraid that a Leaf or a Volt will let them down due to lack of familiarity..
This will change once there are enough older Volts and Leafs out there for people who have to drive really cheap cars to get to know them. My opinion is that when they once get acquainted lots of them will buy them in preference to ordinary cars.
Range doesn’t matter to everybody. Cost of ownership and operation are far more important to working poor people who MUST drive.
Yes, absolutely.
And don’t forget that the Volt doesn’t have a range limitation.
And, it’s dual fuel – if the grid goes out you got gas, if gas supplies are limited you’ve got electricity.
I’m looking forward to the point when EV’s and EREV’s like the Volt can be used as battery backups for your house.
I’ll be fascinated to see what Tesla does with home batteries – apparently the prototypes were sold for only $1500, +15 bucks a month for 10 years. That’s cheap for the many places in the world where power goes out for large parts of the day. It’s also cheap for places like Hawaii, where solar power on the roof is much cheaper than the grid.
Leaf sales are at 100,000. Looks to be growing.
In response to Toolpush’s comment that started this thread. The Green Car Congress link in your comment points to something well known which of course is that GHG emissions will depend on the primary energy source used to generate electricity in the jurisdiction the car (BEV) will be recharged.
How do EVs Compare with Gas-Powered Vehicles? Better Every Year…
Don Anair, Union of Concerned Scientists, research and deputy director, Clean Vehicles, September 16, 2014
AWS,
That is a good map. It is a shame the ICE cars being driven are not getting those numbers, which going by the new models being built are nearly all achievable, if only the car buying public would buy the correct vehicles.
The one thing that has struck me with hybrids and BEV, is that the main push has come from the US, whereas Europe seems to be the logical market, with their relative high fuel prices and their total focus on CO2.
I know Hybrid and BEVs are increasing sales in Europe, but I would have expected them to be walking out the door in much higher numbers than the US. I am also waiting for the F-150 BEV. That may have a greater effect on fuel consumption and CO2 due to the large numbers and high consumption, than fiddling around in smaller cars which the US public has shown they are resistant to, for what ever their strange reasons maybe.
I believe the new one has an Aluminum body, and a start-stop (micro hybrid) option. Perhaps a full Hybrid is not far off ?
http://www.digitaltrends.com/cars/2016-ford-f-150-hybrid-rumors/
Thanks John B,
I didn’t realize they had a hybrid on the drawing boards. My comment was a little tongue in cheek. Though I was fully aware of the 700lb saving from the Aluminium body. I also see the benefit of gaining fuel economies on the largest and most widely sold vehicle, is a lot more significant, that producing a taken number of very high mileage cars, that don’t sell in useful numbers.
The concept of getting the US public sensible and fuel efficient vehicles will need to be done by stealth rather than coercion.
The graphic from the UCS link above…
How do EVs Compare with Gas-Powered Vehicles? Better Every Year…
[…] Overall production fell 137,000 a day in January for the United States, 87,000 per day of that decline came from the state of Texas. Other states have also begun to see production drop with rig count. North Dakota production data indicated oil production dropped 3.3% in the month of January or 37,000 barrels per day. Rigs drilling in Texas averaged over 700 in January and production has already begun to fall. Only time will tell what will happen to production with the rig count in the 400s. […]
China’s Fuel Demand to Peak Sooner Than Oil Giants Expect
by Timothy Coulter, 11:28 AM EDT, April 1, 2015, Bloomberg
I guess that I will be a little skeptical. China has spent the last 10 to 15 years trying to purchase oil properties throughout the world – Canada, Africa, Australia, US, access to Venezuela, etc
The text is poor. “Shriveled” to just 3% Y/Y growth.
Mr. Lewis seems to believe nations will cooperate to keep co2 concentration below 450 ppm. He also displays a serious misunderstanding about large oil company capabilities. Tgey will buy their own stock, sell themselves, sever the production business, or self liquidate before they invest much in renewables.
Yesterday’s activity report at the oil and gas division of the NDIC looked bleak, six new permits, not many.
The Bakken Shale producers should ask the Chinese gov and/or bankers for some money in exchange for some oil. That’s what Ecuador did.
Forget about those other bankers and investors, they’re in deep enough already. The Chinese have cash.
The Chinese don’t care for investments in land locked regions. They may invest in a company to take technology back to China, or to market chinese components. I don’t see the attraction for them.
Didn’t China buy (rent) some land in Ukraine, 3.5 million hectares or somewhere in that ballpark amount? Kind of a landlocked place, me thinks.
Probably some of the land where Nikita Khrushchev grew up.
From this source, Russia had other plans for Ukraine and the China land purchase, rent/lease/own for 50 years, must have stuck in the craw of the Kremlin.
http://www.silkroadreporters.com/2014/05/13/russias-crimea-annexation-move-china/
On Cuba:
Medicine Sales
The U.S. embargo does not deny medicines and medical supplies to the Cuban people. In fact, on March 20, 1998, President Clinton announced that the U.S. government would take steps to expedite the sales and donations of medicines to Cuba. This was done through the streamlining of export procedures for medicines and medical equipment, and reduction in license processing time.
Might as well open the doors and trade
The Ukraine isn’t land locked. Chinese practice is to enter commodities projects with a clear path to the ocean. But I bet they’ll sign up the Bolivian lithium if they can.
Regarding your comment about Cuba purchasing medicine from the usa, was it intended for me? The Cuban dictatorship isn’t interested in sales, they want financing with the sales. And they want to rent slave labor to usa companies, and of course get tourists. They are turning fascist, and even have plans to have a hereditary dinosaury.
And China’s $9bn deal which gives DR Congo money vitally needed for infrastructure: 2,400 miles of road, 2,000 miles of railway, 32 hospitals, 145 health centres and two universities. In return, China gets a big slice of DR Congo’s natural resources: 10m tonnes of copper and 400,000 tonnes of cobalt. This virtually ties up the world’s cobalt supply, vital for batteries (lithium-cobalt-graphite batteries).
In the new normal, whenever there is any drastic financial desperation situation facing someone, China seems to always enter the conversation.
North Dakota rig count down to 94. None on the stack list. Looks like everyone wanted to be finished for Easter.
4 at the MIRU stage. If Baker Hughes number was to come out, they could be calling it 90 rigs actively drilling?
Baker Hughes rig count
http://phx.corporate-ir.net/External.File?item=UGFyZW50SUQ9NTc0OTk4fENoaWxkSUQ9Mjc4NDY0fFR5cGU9MQ==&t=1
As I posted before, Baker Hughes had ND down to 90 rigs, one of the biggest looses.
The US is down 22, 11 each oil and gas.
Haynesville is down 10%
Permian down 5, with Eagle Ford steady
We seem to be starting to settle near the bottom, as up till now everything has been down. I noticed this week ND was actually going up and down from day to day, and several basins and states are up this week, whereas all of this year, nearly every number was down from the previous week.
I assume Canada is still in the process of shutting down for spring break, but only have 20 rigs drilling for oil.
PS:Can anybody teach me on how to post the rig count PDF as picture. I believe you have to convert it to a JPG or similar, but I am having trouble doing that.
Toolpush, if you have windows then you have a program called “Snipping Tool” you can find it with a search. With Snipping Tool, you can snip any pdf file and save it as a Png, Gif or Jpeg. Then just display it as you would any other file.
Thanks Ron, I will see how I go.
attempt #1
Oh well,
My edit button is not showing, but I did get it posted, even though sizing is an issue.
I will leave it for now.
You can also do screenshots by using the keystroke combination CTRL+PRTSC you can paste that into PAINT and select the part of the resulting image you want, then cut that and paste that into another PAINT file and save as JPG or PNG.
select the part of the resulting image you want, then cut that and paste that into another PAINT file and save as JPG or PNG..
The “crop” command works well for that.
Toolpush. It worked for me.
Are you still headed to M.E.? What do you hear about this KSA Yemen situation? Read that Houthi(sp?) rebels are threatening to invade KSA if bombing does not cease. Don’t know how realistic that threat is. Be careful.
Chinese companies have $1.1 trillion in debt denominated is US dollars. So it becomes a big burden to chinese companies when their central bank does rate cuts as a weaker yuan makes it harder for them to service their dollar debt. China needs to devalue their currency in order to remain competitive in their manufacturing base and keep hundreds of millions employed.
Chinese days of official +7% GDP numbers are numbered. I say official as their official numbers are shady.
Sawdust,
I would not be too much concerned about a strong dollar as the dollar will see a reversal quite soon. The media is mum about the recent horrible economic data for the US economy ( wholesale sale inventory ratio, Chicago and Dallas PMI at multiyear low… and just today employment numbers which came out much below consensus at 126 000 new jobs). However it will not possible to deny this forever. If the oil price stays low, the US economy – stumbling along with shale oil and gas around its neck – is very likely manoevering in an unprecedent depression this year. Needless to say that the best way out of this situation is to let the dollar fall, which is a high probability to occur.
If you have not seen this film then you must. Fantastic!!!!! Ii is called “Peak Oil scientifically disproved” No professional PR firm or any organization payed to produce alike could have come up with this.
https://www.youtube.com/watch?v=isRIMZi0SB0
Cute deadpan. You could almost squeeze him for oil.
I esp liked the little guy getting showered with oil, the periodic wavering pencil, and the ‘feeder streams’.
To a soundtrack of banjo picking…
“I’m not some backwoods hillbilly making stuff up”
More on oil companies and debt,
http://www.bloomberg.com/news/articles/2015-04-01/reckoning-arrives-for-cash-strapped-oil-firms-amid-bank-squeeze
”April is a crucial month for the industry because it’s when lenders are due to recalculate the value of properties that energy companies staked as loan collateral. With those assets in decline along with oil prices, banks are preparing to cut the amount they’re willing to lend. And that will only squeeze companies’ ability to produce more oil.”
..
”Those loans are typically reset in April and October based on the average price of oil over the previous 12 months. That measure has dropped to about $80, down from $99 when credit lines were last reset.”
the 12 month avg stuff sounds a tad new. Hmmm.
Ok this is big news. We will know more at the end of April it seems.
the end of the quarter was Mar 31, and a previous article talked about quarterly avg price, or with 2 resets a year then 6 month avg. This 1 yr stuff looks like an SEC bailout.
Shippers not joining production investors in the Spectrum of Pain.
“What’s happening with prices and distribution is a new chapter in the history of the oil industry. ”
GOM not on this VLCC route map .
http://www.nytimes.com/2015/04/02/business/international/oil-shippers-take-advantage-of-a-new-boom.html?_r=0
Interview with BNSF spokesperson regarding crude oil train safety: http://www.mprnews.org/story/2015/04/02/bcst-bnsf-rail-safety
Earlier today, there was some good news for Brazil’s largest energy major Petrobras when as we reported earlier, none other than China through its CDB, agreed to lend $3.5 billion to the foundering energy giant. That was quickly offset by bad news later in the day when a massive fire broke out at a fuel tank storage facility in Brazil’s port of Santos, Latin America’s largest, forcing some eighty firefighters to battle a raging inferno which consumed facilities located next to Norway’s Stolt-Nielsen Ltd and Transpetro, a subsidiary of state-run oil company Petrobras.
This should properly count as Brazilian consumption.
(and not demand)
That’s what happens when you burn the midnight oil…
Dear All
I want to pose a question to the assembled wise old heads.
BW Hill says in a comment on What If An Oil Rebound Never Comes, on Peak Oil News:
‘To bring 3.5 mb/d on line has cost the US $1 trillion in debt. That is $286,000 per barrel in debt alone to bring one barrel into production.’
Questions:
First, does anyone dispute his numbers, or have better ones?
Second, do you agree that the trillion dollars hasn’t bought us anything of lasting value? i.e., it’s not an investment for the future.
Third, if you agree with his numbers and agree with the second statement, then what were we actually paying for the barrels of oil we consumed? (Fancy assumption here that price and cost will eventually find each other.)
Fourth, if the answer to the third question is horrendous, then does that cause you to reassess your position as to whether oil may really be a dead man walking?
I would sincerely like to hear your answers. I have fooled around with the numbers and the concept of barrels per day and the distinction between capital and consumption, and would like to hear other opinions.
Don Stewart
First, does anyone dispute his numbers, or have better ones?
It looks like he’s just dividing 1 trillion by 3.5 million to get the 286,000.
So that’s not a “per barrel” number, it’s a “per barrel per day” number. The question is, for how many years will that barrel be produced? Multiply that by 365. E.g. If the well produces for 20 years, that’s $39/barrel.
Also, I think the actual number for shale oil production is more like 4 million barrels/day. The 1 trillion in debt number is probably wrong as well.
I wouldn’t worry too much about BW Hill’s nonsense.
Don and John B. I do not know about the numbers you are kicking around, whether BW Hill has them right or not, so no comment there.
Just make sure that if you do any math on oil production economics, you do not forget to include all of the expenses that occur to operate the well, etc., after drilling and completion. If there was no LOE, I would have no worries.
What would “costing the US $1 Trillion in debt” mean? Debt can be expunged. What kind of joules cost is a cost that can be expunged? You still got the joules/day flowing.
This means not much.
Dear All
Here are my amateurish calculations of the prospects that light tight oil will be able to repay the debt the companies have incurred.
I use the One Trillion dollars of debt figure from BW Hill.
I use 4 million barrels per day, or 1,460,000,000 barrels per year as current production
Dividing, we get a debt load of 685 dollars per barrel per year.
But the wells will go on producing in the future. I will neglect operating expenses, and only focus on the debt.
From David Hughes, Drilling Deeper, we find on page 44 that the Field Decline Rate is 45 percent per year. The Field Decline Rate is the amount lost in a year with no more drilling.
Therefore, as a back of the envelope approximation, the wells producing a barrel of oil today will produce over the next four years:
1 + 0.45 + (.45X.45) + (.45X.45X.45)
or 1.74 barrels of oil for every barrel produced today.
So I change the divisor to 2,540,000,000 barrels of oil which can be recovered from the wells for which we are a trillion dollars in debt.
The debt load on the production from the existing wells is then:
$394 dollars per barrel.
As I said, I am not s professional. Something may be wildly wrong with these calculations.
Don Stewart
Dear All
Sorry, I realized I made a mistake. I should not have used .45 in the calculations…I should have used .55 to reflect a 45 percent decline. That changes the multiplier to just about 2. So the wells producing a barrel of oil today can be expected to produce another barrel of oil over the next 4 years.
Don Stewart
LTO wells seem to produce about 30% of their oil in the first year. So, multiply by very roughly 3.3, not 2.
That decline rate is tricky – the numbers usually quoted aren’t the overall 1st year vs the overall 2nd year, which is what you’d need to divide it that way. Perhaps just as important, the decline rate is smaller in the later years.
The decline rate us hyperbolic. Mount a spreadsheet with a hyperbolic match of the “type well”, run the cumulatives by semester, and sum over. It may be a good idea to cut the curve at 18000 barrels per semester.
Take that semester data and perform an accounting calculation on it. Pay taxes. Take the net cash flow after income taxes and discount at say 10 %. That’s your answer.
John B said:
I wouldn’t worry too much about BW Hill’s nonsense.
That must mean the John B is offering to repay the $1 trillion in debt that the shale industry can not repay. That definitely makes him a man of unusual character, and integrity. The pensioners, savers, and taxpayers that would have had to pick up the tab will be very relieved! Your benevolences is only surpassed by your compassion!
The US shale industry is no where near 1 trillion dollars in debt.
Its possible to start here, http://theenergycollective.com/energydeborah/2209271/shale-debt-redux
…and google until dark thirty; you will not find that number mentioned anywhere. The worldwide oil and gas industry maybe, not the shale industry.
Mike
Hi Mike,
What would your estimate be for the total cost of an “average” shale well?
And how many years would that well be operating?
And what would your estimate be for the total amount of barrels that well would produce?
I wanted to get an idea of the cost per barrel to produce shale oil, and I thought bwhill’s estimate of $286,000.00 per barrel might be a tad bit high.
WTI back over $50/barrel today.
http://www.oil-price.net/
Pretty close to real time data is here:
http://www.sgxniftydowfutureslive.com/index_files/DOWFUTURES.htm
$49.40something.
That site starts updating as New Zealand and Australia and then Asia comes online Sundays.
BNSF week 12
Down about 1000 cars from week 12 of 2014. At 650 barrels per car, that’s a decrease of 650,000 barrels in a week compared to week 12 of 2014. In a month, the amount should show probably 2 600 000 decrease in barrels.
9943 x 650= 6 462 950 barrels hauled in week 12 by the BNSF.
65,000 barrels per day that Delta Airlines has purchased to refine in Pennsylvania is delivered each day.
People would rather fly than drive. In an hour and a half, you’re 800 miles down the road. You’re there now, a comfortable ride, not road weary, ready to go again, beer is cold.
Flying is the New Appian Way.
Yep,
The railways are feeling the pinch.
http://www.ttnews.com/articles/basetemplate.aspx?storyid=37788&page=1
Railroads Caught by Speed of Crude-Oil Collapse
Hey, just wait a cotton picking minute here. What happened to “US oil production surging despite the drop in drilling rigs”?
BNSF Railway Co., the railroad owned by Warren Buffett’s Berkshire Hathaway Inc., posted a 4.5% drop in petroleum products in the last four weeks after a gain of 12.4% last year. BNSF’s network runs through North Dakota, making it the largest hauler of Bakken oil production. Union Pacific Corp., which serves Texas oil fields, saw its carloads plummet 25% in the four-week period.
Ron: I read the DMN piece today; well done. For the record I adamantly disagree that a lot of production reports required by the TRRC are often “delinquent.” They might be for 30 days, certainly not 2 years. Taking oil off a mineral lease without reporting it within the required reporting standards is liken to mineral theft. No operator in their right mind would open that can of worms. There are 46,877 lawyers in Texas who would jump all over that on behalf of their mineral owner clients, like road kill. Other than that, it was an OK piece; a little embarrassing to me that so few people in Texas know so little about oil.
http://oilprice.com/Energy/Oil-Prices/This-Is-What-Will-Determine-If-Oil-Prices-Go-Up-Or-Down.html
Here Oilprice.com more or less confirms its press release of yesterday regarding the decline in production in Texas based on released TRRC information. If they made a mistake yesterday, today they had a chance to retract it. They didn’t. If they’re wrong, they don’t think so.
I am baffled why a drop in Texas production would be so difficult for some to fathom. We know its gonna go down anyway, what’s the beef?
Lets go hunt Easter eggs this weekend. Absolutely nothing about the oil business can be modeled are predicted accurately. It’s dark down there. Its complicated.
Mike
Here’s the link to the Dallas News article Ron is quoted in.
http://bizbeatblog.dallasnews.com/2015/04/when-it-comes-to-oil-statistics-not-all-data-is-equal.html/
NG Demand Destruction Watch.
The Passive House in New York
By ALISON GREGORMARCH, New York Times, March 27, 2015
Most things I have seen on Passive House and been of single occupancy buildings. Multi-unit dwelling should have a great advantage over single dwellings due to the number of common walls and minimal external surface area, where most of the heat transfer would take place. That goes for the roof as well. New York with its large number of multi-unit dwellings should be a logical choice to spread the concept.
Toolpush,
For the reasons you mention it becomes easier to meet the Passive House standard the larger the building. Provided it doesn’t have a truly unconventional shape. Basically building heat loss declines as the ratio of exterior surface area to interior volume declines.
Heat is lost via the exterior of a building!
Toolpush understands the principle involved as I read his comment but it is perhaps a bit awkwardly expressed.
I will add that conversely the need for cooling is likewise related to the surface area to interior volume ratio in the same fashion – IF cooling is needed because of hot weather.
If cooling is needed mostly because lots of heat is generated inside the building by warm bodies , lights and machinery of any kind – then the energy cost of cooling will be proportional to the amount of excess heat thus generated .
A largish building well designed with lots of people and lights and office equipment in it may not need any heating input at all except maybe during winter holidays. In it may even require some cooling on coldish days. Fortunately getting rid of excess heat in cold weather is easy and cheap – if the hvac system is properly designed. All you need is either open windows or blowers in the duct work running. No fuel burnt on premises , no compressors and evaporators running.
I am not expert in these matters but after reading up on passive houses for a day or two it is my impression that building single residences to passive house standards is pretty expensive – still worth it but expensive. Larger apartment buildings are cheap to build to passive house standards because of economies of scale.
The law ought to require it for larger buildings as I see things.
The economics of PH largely depends on where it’s built. We just did some energy modeling for a single family house here in central Virginia with the goal of being ‘net zero’ by offsetting energy use with P.V.. The moderate weather and local utility costs made a double wall with staggered studs, triple pane windows U .14, S.I.P. roof R52, etc. extremely difficult to justify in terms of upfront costs. So you do it for other reasons and in other places.
What we learned from the model was that the G.S.H.P. (ground sourced heat pump) made all the difference in the world in terms of energy use. I would very much like to see the Federal tax rebate on renewable energy systems continued. All of my recent clients have installed them because of this one incentive.
Ground source heat pumps are expensive. I have one. Have you looked at the mini-splits?
Digging or drilling to put the ground loop in is a big expense.
The biggest challenge of a super insulated house in Virginia will be dealing with humidity as your cooling load will be pretty load leading to low run times for AC, and consequently low dehumidification.
The Santa Fe dehumidifiers are impressive.
Alison Bailes at Energy Vanguard who is in Georgia writes about Building Science and has more of a perspective on building in your climate.
Check out his blog if you aren’t already familiar with it.
Hi AWS,
Mini-splits are being used here, mostly in commercial renovation work. I don’t see them gaining market share in high end single family homes (ave. about $230/sq.ft.) yet.
The cost difference between a GSHP (with the rebate) and a high end SEER HP is easy for my clients to justify. In fact, they tell me right away that’s what they want. I don’t have to sell them the upgrade. ERVs and dehumidifiers are standard in my projects.
Thanks –
Sounds like a fun project.
I agree with Toolpush, I was just trying to expand and amplify what he expressed. Sorry for the lack of clarity on my part.
Ron
I know this is totally unrelated to this post, but I find your page (and only a few others) to be the only ones who currently present thruthful can correct data. Would there be any chance to post somewhere a link-page with trusted webpages in your opinion (oherwise I have to dig through old posts in an attempt to find them)?
Daniel
haha trusted webpages. Now that is cool!
We should encrypt them, too. To keep them out of the wrong hands.
I don’t have a link page and I don’t know what kind of links you are talking about. But for links that I visit regularly I just “bookmark” them and click on them when I need them.
http://www.eia.gov/petroleum/weekly/crude.cfm
My comment up the thread about the composition of US Crude + Condensate (C+C) production, and of course, the above chart is for stocks of C+C:
http://peakoilbarrel.com/us-january-production-data-neutral-zone/comment-page-1/#comment-508718
And an excerpt from same:
From Turner, Mason & Company back in 2012…
Dumbbelling of U.S. Crude Oil Supplies
I recall there was a discussion here at POB early on about ‘dumbbelling’. Back in the Nony days!
Discussed more extensively more recently.
Nothing to worry about, the US has enough oil to supply us for 285 years.
U.S. Oil Reserves, Resources, and Unlimited Future Supply
The best in the business, the U.S. Geological Survey, previously figured that the booming Bakken shale play in North Dakota only contained 150 million barrels, but experts now report that it could have over 20 billion. Leading researchers at Rice University conclude that the U.S. could have 2 trillion barrels of recoverable oil, enough to fully meet our current demand for a ridiculous 285 years!
From the Forbes article:
Today, the U.S. has more proven reserves than at any time in its history, thanks in no small part to the shale energy revolution that began in 2008 or so. It’s amazing to know that despite the extraction of 185 billion barrels over the period, today we have 70% more oil reserves than we had on June 6, 1944, when heroes landed at Omaha beach, fueled by oil, poised to end…the most powerfully evil force that ever walked the Earth.
Don’t know if that makes me laugh or cry…
Cheers!
Fred
Damn, that’s when I was planning on retiring.
2 trillion barrels of oil in the US?
Where do leading researchers at Rice University get garbage like this from?
Follow the money that paid the “leading researchers”.
So the writer at Forbes has a BA in poly sic, MS in homeland security and an MBA.
He quotes an NPR article that quotes Amy Myers Jaffe at Rice University.
Amy Myers Jaffe _was_ recently director of the energy policy part of the James A. Baker III Institute for Public Policy at Rice Uni.
Yes, that James Baker – buddy with Reagan & the Bushes.
She’s now “executive director for Energy and Sustainability at University of California, Davis with a joint appointment to the Graduate School of Management and Institute of Transportation Studies (ITS). At ITS-Davis, Jaffe heads the fossil fuel component of Next STEPS (Sustainable Transportation Energy Pathways). ”
A fossil fuel apologist, & renewables naysayer.
What was UC Davis thinking?
BTW – California got 5% of its electricity from utility scale solar last year.
http://www.greentechmedia.com/articles/read/solar-becomes-the-second-biggest-renewable-energy-provider-in-california
http://www.eia.gov/todayinenergy/detail.cfm?id=20492
other renewables replacing the hydro lost due to drought.
Frugal,
I believe at least 1 trillion of those supposed barrels of U.S. oil resources is that CRAPPY OIL SHALE in the western states. The estimates for EROI – Energy Returned On Invested for Oil Shale in Utah, Colorado and Wyoming is less than 2/1.
If the economics of the Bakken & Eagle Ford are barely commercial at $90-$100 at an EROI of 5/1, then how in the living Hell would anyone attempt to extract the over 1 trillion barrels of supposed oil shale at less than 2/1??
It is simply amazing how intelligent people make some seriously ignorant assumptions.
steve
Fractionalflow is recommended reading.
Oil Price/Interest Rates
From Rune Likvern’s analysis:
“Growth in future supplies of crude oil is now apparently between the proverbial rock and a hard(er) place:
For the oil companies the recent collapse in the oil price makes them cut and continue to cut in their capital expenditures (CAPEX) for exploration and development that should bring new and costlier oil supplies to the market (both offsetting declines from the legacy fields and adding growth) and at the same time allow for a decent return and strengthen their balance sheets.
The consumers, battered by declines in their real disposable income and bloated balance sheets, find it harder to take on more credit/debt. The reality becoming that the costlier oil gradually becomes less affordable for them.
The paradox in this situation is that the oil companies encouraged by the growth in the oil price since the mid 2000’s, which also was fueled by consumers’ credit/debt growth, took on more debt (increased leverage), thus betting on consumers’ abilities to continue to go deeper into debt to afford the costly oil that would allow the oil companies to retire their debts.”
The real paradox is consumers. In the early 1960’s, I was paying $.25/gal for gasoline. Adjusting for the consumer price index change, that is about $2.00/gal in today’s dollars. But, in 1960 I was getting 10 miles per gallon. Today, I am getting 20 miles per gallon. So, my cost in 1960, adjusted for inflation and for a per mile driven basis was equal to $4.00 per gallon in today’s dollars. But, today I am filling up with premium at $2.50 per gallon in today’s dollars. I sure hope that we do not go back to the high cost of 1960.
The reality is that when you adjust for inflation and efficiency, almost everything that humans use goes down in cost as time passes and volume of use rises.
Today’s minimum wage is 7.50 per hour, the average. The price of gas is 2.50.
In 1960, the minimum wage was 1.00 per hour. In 1960, the dollar was 90 percent silver metal content with 10 percent copper content.
The price of silver today is 16.75, 90 percent of 16.75 is 15.075. If the minimum wage were to remain in line with the price of silver, the minimum wage should be at 15.08 per hour, adding in some value for the copper in the minted silver coin.
The minimum wage has not kept pace with the old days of a minimum wage. Half of what it once was in minted silver coin in 1960. The price of gas is 2.50 today, the price of gas was 25 cents in 1960, ten times more. The minimum wage in 1960 was double what it is today using the value of silver in 2015 dollars. A minimum wage worker is paid half of what a minimum wage worker was paid in 1960. The minimum wage worker is really paying 5.00 per gallon for gas by comparing 1960 dollars using the minimum wage as the base to determine how much a cost really is. 7.50 dollar minimum wage today would be a 50 cents per hour minimum wage in 1960, makes the cost of gas at 5 bucks a gallon.
The minimum wage should be raised to 15.08 per hour immediately.
The dollar has lost purchasing power big time.
What does minimum wage have to do with the price of gas? In 1960, Mickey Mantle made $100,000 per year. Today, a baseball player with equivalent skills is making $25,000,000 per year. So based on that, the cost of gas should be immediately raised.
NFP jobs data came in at a dismal 126,000 jobs added slightly less than half the number that was expected. US equity and future markets are closed today. Monday will be interesting to say the least.
It appears that near zero % interest rates and ever increasing amounts of debt can no longer drive the economy forward. When those same 0% interest rates and ever increasing amounts of debt no longer drive equity markets higher, there will be massive implosion in the US economy. US corporation’s have borrowed trillions since 2008 and 95% of that money has been used to fund stock buybacks. Fed ever raising interest rates is a joke.
I’m not so sure Fed can step in and buy 4 trillion dollars in bonds and other securities this time around. They are already leveraged 80/1 meaning they have $57 billion in assets while holding $4.5 trillion in liabilities.
We might should start considering how another global meltdown would affect oil demand and production.
The Baker Hughes Rig Count is out. Actually it came out yesterday, because today is good Friday. Toolpush tried to post it above but it came out a bit too small.
Hi Doug, wife and Ron.
My ‘pardon’ was for Ron, not Nick G. I have no qualms with Ron, feel we are generally on the same wave, appreciate POB, and understand how he/we might feel after the recent nonsense hereon.
POB isn’t TOD, nor does it pretend to be despite the monikers. I kind of presume that, like over at TOD, but maybe less so, people who are against the FF, etc., industries (a likely smaller relative proportion than at TOD) share the same blogspace with those of and/or for the FF, etc., industries, and so it can be a tenuous association. In TOD’s case, it had the ‘benefit’, if we want to call it that, of some background moderation.
I posted my comment-in-question in a rush at a cafe with a bus to catch, so I missed the charitable word ‘apparent’ before ignorance, which was in part in reference to Watcher’s contention, if modulated by my own, that included a few years on TOD, with Nick.
The internet is not real life, despite its fragments and illusions of such, so it is important to keep that in mind and avoid being decieved into thinking otherwise. That said, however, I believe in cutting through the crap and throwing down the gauntlet online and in real life– and do so in both cases– such as if it is felt that someone is just jerking us around.
Many of those in so-called ‘diplomacy’ and/or working in office cubicles with night school certificates in ‘Human Communication’ or ‘Group Dynamics’, as well as those who spam (and their cousins, like those who sow misleading seeds of confusion and doubt), don’t necessarily care about facts or sound argument, such as if they contrast with their own agendas, which many are going to pursue around, under or over you if they have to.
—
Caelan/Ron,
Perhaps, in view of the above, the following will have me banned, barred and precluded from commenting on Ron’s Blog for time eternal; so be it. Mostly, Nick G sounds like a broken record to me. I’ve heard his comments about the amount of energy in solar radiation and his advocacy of EVs so often I wonder if he actually has a real life or if perhaps he’s a Nissan Leaf salesman using Ron’s Blog for some devious corporate purpose. And, sometimes (often), yes, he seems to be spouting spam. There you go, the verboten four letter word, kill me off as you wish.
Doug,
Seriously? Maybe your problem is just that you disagree with me? If so, say so, and give a clear argument, with logic and evidence.
How many times has Jeffrey Brown made identical arguments about Net Exports? Are they spam? No, first because he’s not trying to sell anything, and 2nd because he gives detailed logic and evidence, with numbers and sources.
I mention that solar is scalable because there are people saying unrealistic things about the level of energy available. They keep saying it, so I keep providing more reliable information.
Think that solar “radiation” is different than I said, or that I misinterpreted it’s meaning? Say so, exactly, and give an alternative number or interpretation, maybe with a link to a source or two.
People keep making unrealistic arguments about transportation being unaffordable, and EVs being unaffordable. Well, it’s just not so – EVs are cheaper than ICEs, and so I keep telling them that.
It just happens that the Leaf is the cheapest mainstream EV around. I like the Volt too, though it’s not quite as dirt cheap. Heck, I like the Tesla – if you have $90k to spend, it’s the best car out there, by a long shot.
Disagree about EVs being cheap? I answered Watcher’s arguments pretty completely, if you take the time to think through the whole discussion. Disagree? Then give your argument, with a little more detail than “you’re wrong.”.
So……why do I care? Why do I post often?
Well, why do you care? Why does Jeffrey care? Why does Ron run this blog, for no apparent reason other than he’s interested in thinking and talking about the topic?
So, it’s not relevant, but I’ll tell you anyway: because I find it interesting, and I find it meaningful. I’d like the world to be cleaner and safer. I’d like to see the world not heat up. I’d like to see the oceans still have reefs.
I’d like to not have to worry about bombs in the subway, because my country is waging oil wars. I’d like to stop seeing my friends and relatives coming home in body bags, missing limbs or with brain injuries or PTSD.
Make sense?
I don’t agree or disagree probably because I know nothing about solar power or EVs. I know there are a few EVs in Norway, where I spend about three months a year though I’ve had nothing to do with them, yet. I know a bit about solar radiation, probably as much as the next dude with Engineering Physics and Geophysics in his background: So what. What I object to is the repetition of tired clichés, ad nauseam, promoting a lifestyle (and products) that I don’t especially agree or disagree with. You champion EVs fine. You like solar, fine. But this is a PO Blog, not an EV Blog. Dennis and Jeff and Mike and Ron and Fernando, et al can completely fill the comments section, I hope they do. I’m here to learn about fossil fuels, when I want information on pulsar physics, I know where to go. I’m sure there are lots of EV and solar sits, perhaps you could direct those interested in that direction?
You champion EVs fine. You like solar, fine. But this is a PO Blog, not an EV Blog.
I’m fine with Nick, primarily because I find his comments a nice counterpoint to the gloom/doom ones.
I think whenever any of us starts about life with less oil, we start to go in different directions. If we would confine ourselves to just the oil numbers Ron and others post, then we probably wouldn’t argue about much.
So do we want to avoid talks about collapse, climate, carrying capacity, Communism, and so on?
this is a PO Blog, not an EV Blog
Uhmmm…..huh? Have you read this blog? Did you read Javier’s guest post – the one just before this one, all about what happens when oil runs out?? How about the two posts shown at the top: “Energy and Human Evolution” and “Of Fossil Fuels and Human Destiny”.
They’re all about what happens when oil runs out – that’s why the EVs and renewables are relevant.
Of course, I didn’t even start the EV discussion today: that was “Toolpush”: he asked a question about an EV-related study, and I provided more info. But, it doesn’t matter who started it – the things we’ll use when oil runs out are directly relevant to this blog.
I have another comment in the works. You’ll like it.
Hi Nick,
The Leaf may not be the cheapest car to own on the market any more.
Check out the Kia Soul EV:
http://www.kia.com/us/en/vehicle/soul-ev/2015/experience?story=hello
Thanks.
I looked at the Kia comparison chart and their pricing, and did find a cheaper EV, though it wasn’t the Kia Soul EV we were expecting. Turns out the Soul is priced at $33k before the tax credit…but the Mitsubishi iEV is priced at $23k!! If you buy it in Georgia, you’ll pay only about $12k for it – much less than the savings. Basically, you’re making money buying a new car.
Woo hoo!
So, maybe we have a new winner in the insanely cheap EV category.
Yes, There Are Paid Government Trolls On Social Media, Blogs, Forums And Websites
Ya, sure, ‘Woo hoo’. With other people’s stolen money.
John ‘Bee’? Nick ‘Gee’? Dave T? Sally C?… (rolls eyes)
How about real, full names with faces. I dare you.
It’s the Robopocalypse:
http://theweek.com/articles/547456/internet-killing-middle-class-jobs
Why did Boone Pickens lose $150,000,000 on wind farms?
Cheap Natural Gas.
…That powers windmill manufacturing.
Why Oil Companies Are Going Bankrupt:
http://www.onthebrink.co/why-oil-companies-are-going-bankrupt/