A Guest Post by George Kaplan
Overall Annual Production
US Gulf of Mexico C&C production has had a series of peaks; firstly two from shallow oil, the middle acceleration probably caused by the mid seventies oil shock; followed by deep oil development and finally by ultra deep oil, with a dip in the middle from the Deep Horizon drilling hiatus. Most production has come from eastern and central (i.e. mainly Louisiana) with some, and falling, from the western section (Texas).
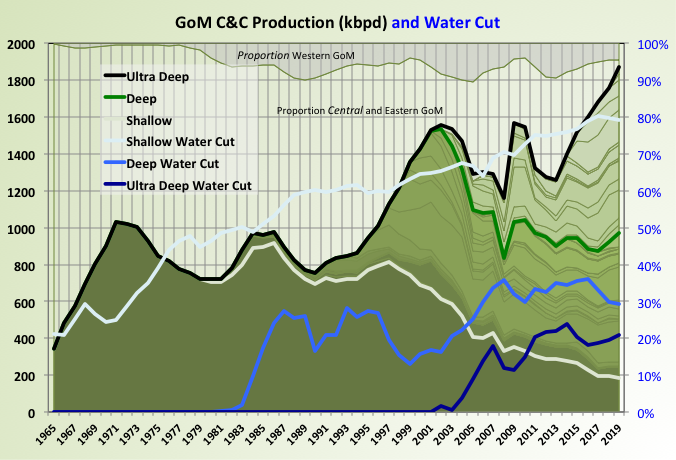
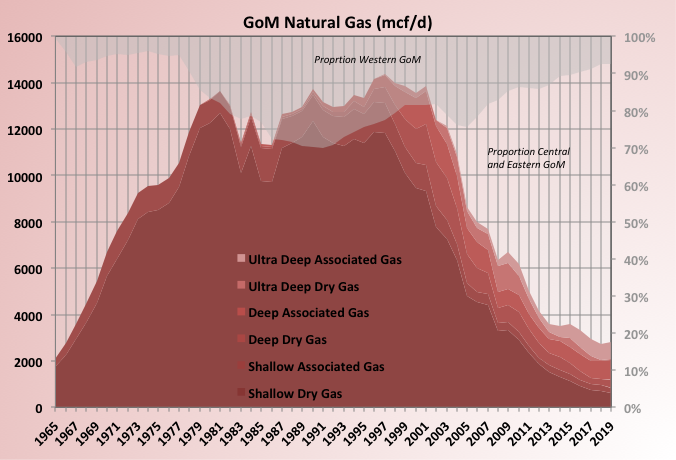
Natural gas production from shallow water (shelf) dry gas fields has been the largest single contributor to hydrocarbon production from the GoM, but it has now pretty much run its course. Two gas fields recently brought on-line in deep water were disappointments: Supertramp was a complete bust after the first month; Hadrian South (produced through Lucius) was produced hard for about eighteen months but was about only 70% as productive as expected. Infrastructure is being dismantled (i.e. offshore facilities, wells, pipelines, onshore gas plants) but some has to be kept to handle associated gas for the oil fields and can have impacts on production efficiency, such as the Enchilada pipeline and shutdown a couple of years ago.

Deep Water Details
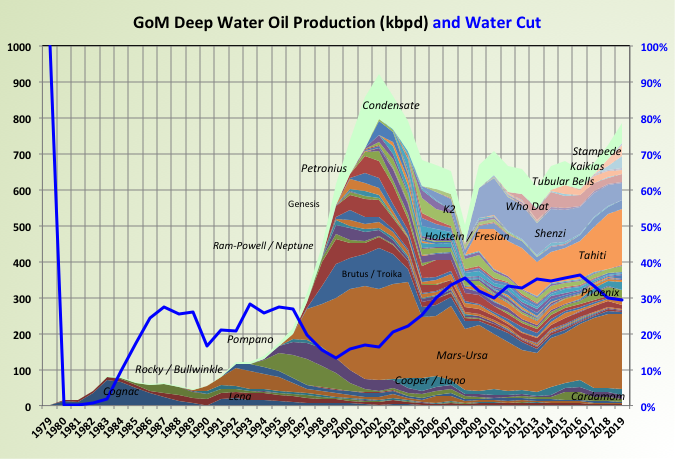
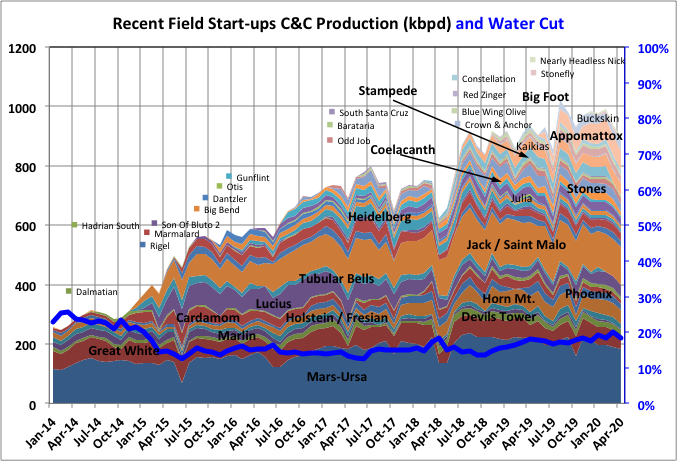
Deep water (1000’ to 5000’ water) peaked in early 2000s but has recently been rising again, from brownfield work on two of the large basins (Mars-Ursa and Tahiti, which includes Caesar/Tonga), plus a couple of large, recent fields (Stampede, which is a stand alone floater and Kaikias, which is a fairly large field but is being produced as a tie-back to the Olympus platform in Mars-Ursa). Olympus was built to produce two fields, South Deimos and West Boreas but it appears that they peaked (maybe without achieving design rates) and declined fairly quickly (since 2014) so there was plenty of spare production capacity. PowerNap is another fairly large near field development that is due to be tied in there too, at 35 kbpd peak; Shell brought the start-up of this forward in late 2019 (maybe indicating Kaikias isn’t doing as well as expected, but that decision may now be reversed.
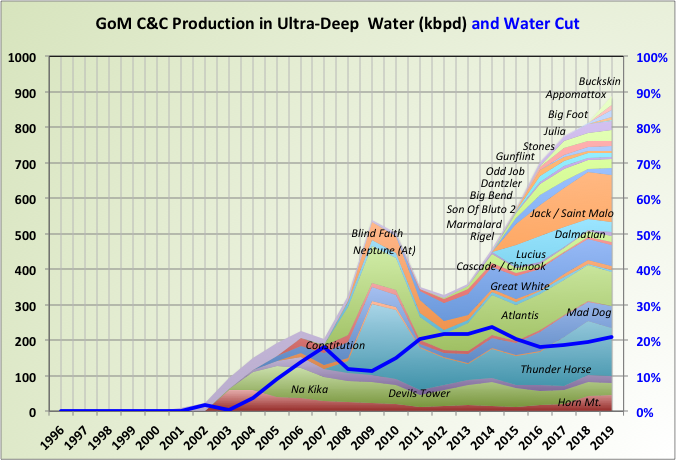
The ultra-deep developments (greater then 5000’ water depth) have been responsible for most growth recently. Initially several large fields were developed, Thunder Horse, Atlantis, Na Kika (a mixed oil and gas development), Mad Dog, Great White and Jack/St. Malo. Initially some of these had disappointing performance with reserve write-downs but a lot of brownfield development has kept them on long plateaus and increased estimated ultimate recoveries. After the 2014/2015 price collapse a series of smaller, fast declining tiebacks with fewer new surface facilities have been installed.
Now larger, stand-alone developments are coming on-line led by Appomatox, which is still ramping up. This was partly due to newer technology (e.g. 20 ksi drilling and wellhead equipment), partly in a fall of development costs along with the price drop and partly from an expectation, plus some fast tracked near field discoveries. In retrospect possibly misguided, in a recovery of prices. New on-going platform developments include Vito, Kings Quay, Anchor, and Mad Dog II, I don’t know how long these may be delayed given the current size of impairments and CAPEX reductions being announced by E&P companies.
There appears to be fewer opportunities for tie-backs (Taggart and Oarse are due this year) and brown field expansion (Atlantis III is a large current development) probably because they were mostly used up after 2014 and will reappear when some newer areas have operating central hubs. There are a few other large discoveries under conceptual appraisal (Whale, North Platte, Ballymore) but I doubt if many FIDs or further appraisal drilling will be made this year.
Note that I am not very consistent in the way I group fields, for example Who Dat (Deep) is a processing facility for Longhorn and Apaloosa fields but I’ve showm Odd Job, Rigel (aka Neidermeyer), Son of Bluto 2, Marmalard and Otis (not named on chart) as individual fields processed through a twin facility: Delta House.
Recent Overall Production
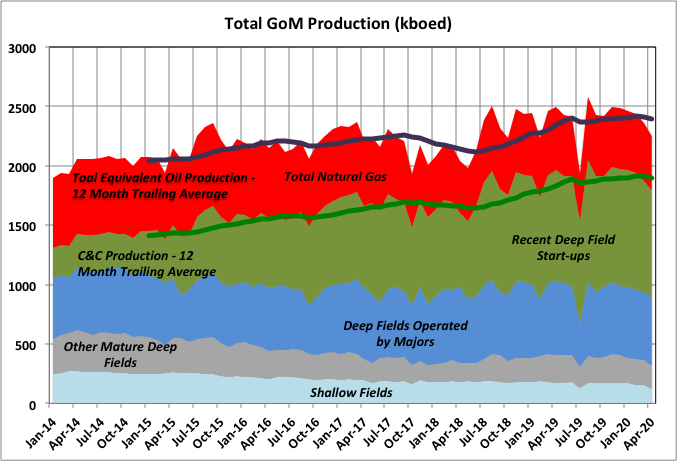
It is maybe interesting that the production seems to follow a step pattern – flat for a couple of years then a step up over three to six months. This is not apparent from the smoothing in annual average number. It may be, after some struggle, this could be correlated to oil price at some previous period. It all seems to come from the larger fields and so, if nothing else, it’s likely indicative of the groupthink that pervades most majors (same models, same decision processes, same mindsets). It could also be to do with preferred maintenance and installation periods, though I don’t see it lining up like that – certainly not as much as it would in the North Sea, say.
Shallow C&C and total natural gas production have been steadily declining but both recovered a bit in 2019. The more mature small and medium deep fields where falling fast with a step down when the Enchilada went off-line but grew significantly in 2018 and 2019, but now seems to be showing accelerating decline. The major IOCs tend to operate the larger deep fields, the more mature of theses have been holding steady. Most of the growth has come from recent start-ups (more details below).
Note that the obvious recent declines they are not quite as dramatic as shown as some numbers are delayed especially on recent start-ups (this may amount to 100 kbpd for April, but much less for earlier months).
Drilling Activity
BOEM reports active and inactive drilling and work-overs by well each month. I’m not sure how this is done – e.g. if it’s a snapshot of activity on a particular day as Baker-Hughes does, but if so active drilling number should approximately equal the total number of rigs, whereas it is actually less than a quarter. Nevertheless the total numbers have been falling generally in-line with each other. The numbers show a rapid decline recently but they are usually revised upwards in later reports so will not be quite as dramatic as shown.
Baker-Hughes rig count fell dramatically through 2014 and 2015, all from a net loss of shallow wells, but then held fairly steady, at around twenty to thirty, until this year when the pandemic has halved the number, with shallow drilling down to only a couple of rigs and no gas drilling at all.
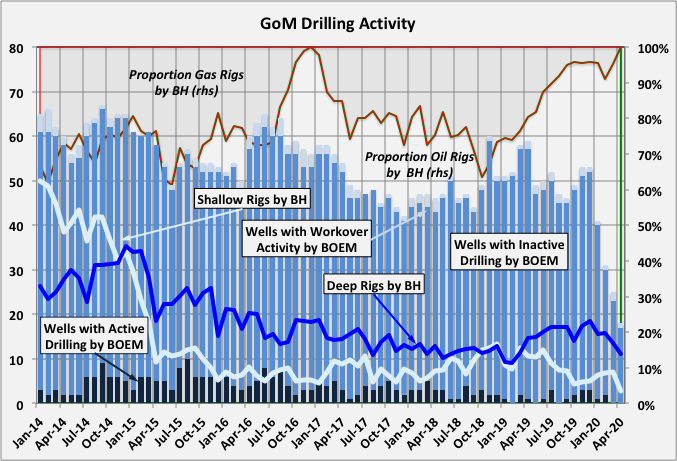
Currently, by the BSEE deep-water weekly activity report, there are nineteen rigs operating, nine are for Shell, three for BP and two for Chevron. I think the majority of these are on fields that are ramping up (Appomatox and Big Foot) and/or where there is a platform rig rather than MODUs (e.g. Mars-Ursa has three operating). There are still three exploration wells (for Shell, Total and LLOG) and at least one appraisal well (for Galapagos with BP).
C&C Production Details
Mars-Ursa is a large basin with three major production platforms (Mars, Ursa and Olympus), which were originally. It is shown here because Olympus was started in 2014 serving two new fields: South Deimos and West Boreas; it is difficult to separate it’s production from earlier fields. The other fields shown that were already flowing in 2014 had significant new fields or in-fill drilling added.
Gunflint, Big Bend and Dantzler are tied back to the Thunder Hawk platform; Rigel, Marmalard, Son of Bluto 2, Otis, Odd Job, Blue Wing Olive, Red Zinger and Nearly Headless Nick to the Delta House FPS; Dalmatian to Petronius Tower; Julia to Jack; Barataria and South Santa Cruz to Blind Faith; Crown & Anchor to Marlin; Hadrian South and Buckskin to Lucius; Kaikias to Ursa; Constellation to Constitution Spar; and Stonefly to Ram-Powell.
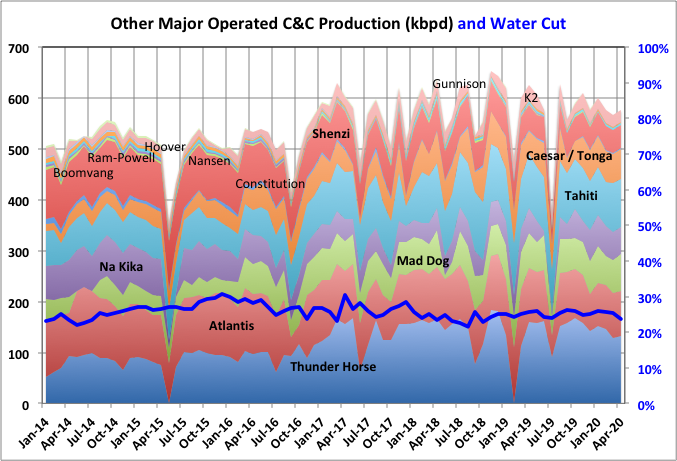
The larger platforms (usually run by major IOCs) has have held a combined plateau, may now be under accelerating decline although Atlantis III which is due soon, may hold it a bit longer – this is really a false conclusion because it is a new (deeper) discovery rather than brownfield developments of growth in original reserves. There have been some significant brownfield projects, e.g. Thunder Horse South and water injection, Tahiti Vertical Extension and Caesar/Tonga Phase II.
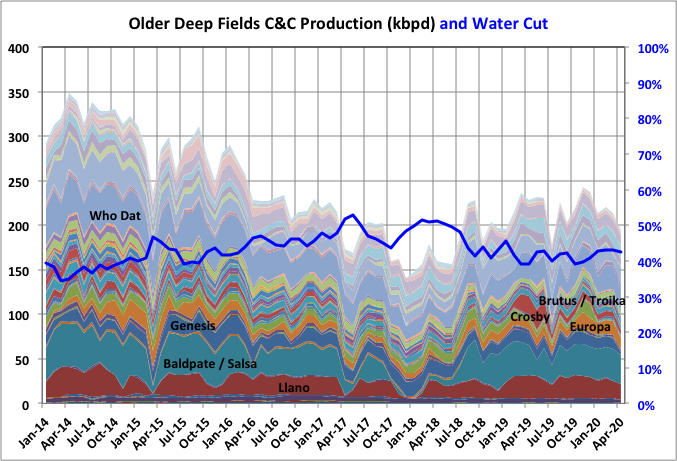
The mature deep fields (only the larger are named on the chart) have been in decline but recovered in the last couple of years. Partly due a bounce back after the Enchilada restart, but the decline appears to be accelerating now.
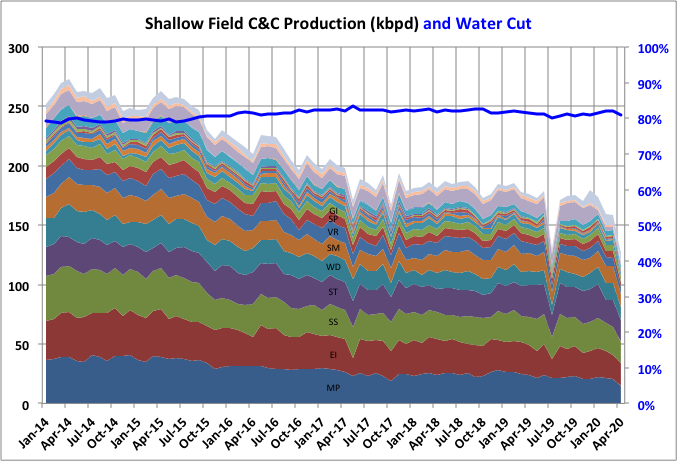
Shallow production has been generally declining but was held on a plateau for the last couple of years, I suspect mostly from in-fill drilling but possibly also through control of the water cut. The decline now seems to be accelerating again (as is usual when production is accelerated through brown field work).
Production by Field Size
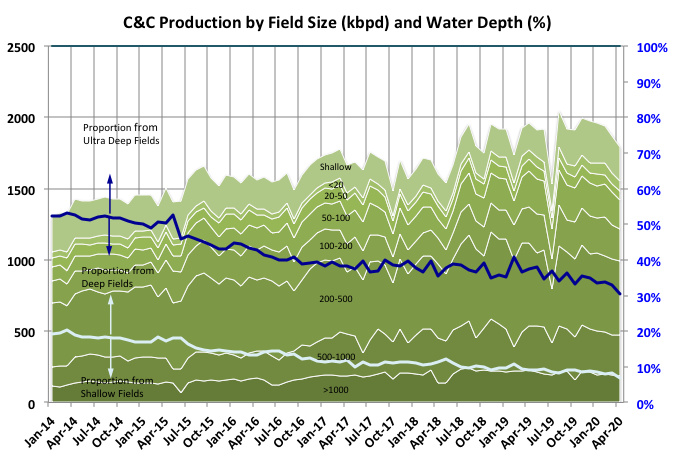
Most of the production and almost all of recent growth has come from the larger fields (based on size of the original reserves in equivalent oil barrels shown in mmbbls o.e.). Even as the C&C production has increased the proportion from ultra deep-water wells has been increasing faster.
Off Topic Finish: Canadian Drilling
Canadian rig counts have been steadily declining over the last decade for all months through the year. Much of this is because of the rise of long life cycle oil sands projects and the decline of faster declining conventional onshore wells. The price crash in 2015 produced a bigger step down and this year the Covid-19 lockdown has meant there has been no post frost thaw recovery.
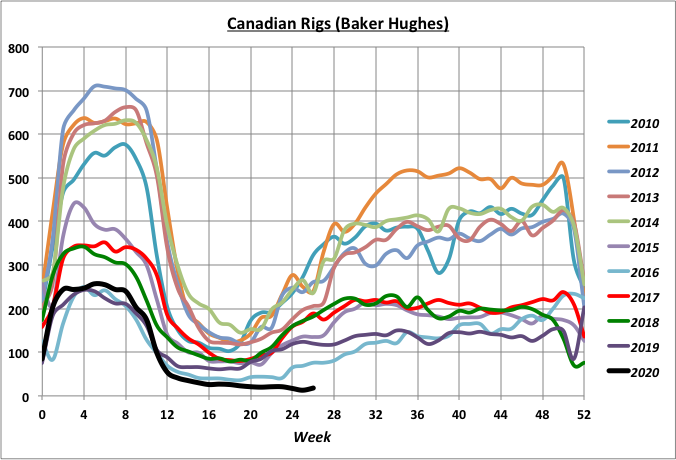
The frost thaw period has got noticeably earlier by one or two weeks, presumably because of the accelerated warming especially in the permafrost regions. I’d have thought the thaw pause would have ended earlier too, but it seems to be getting longer, maybe because of the overall drop in drilling or because the area for drilling has been changing (presumably moving north). Alternatively the warming may mean the frost heave penetrates deeper and lasts longer.
40 responses to “US GoM 2019 Summary: Part III – Production”
Massive oil-services company Schlumberger is slashing 21,000 jobs
https://www.businessinsider.com/schlumberger-slashes-21000-jobs-amid-pandemic-oil-rout-2020-7
I get a good laugh when i see articles on blogs (not this blog) where people are call for the demise of the dollar. They don’t understand what is really happening. Which is the world is being flooded with US denominated debt. The world is borrowing dollars like crazy. Which while it last is great. If we can just get to the other side of this virus price of oil is going to rocket. I figure we get 4-5 years of price inflation. (Lower dollar) followed by price deflation as the bill for all this newly created debt comes due and stimulus is withdrawn.
I see another 3-4 year stretch $100+ oil headed our way.
It’s not longer possible to withdraw stimulus – as it was not possible to raise interrest rates after the 2007 crisis.
This monetary system will come to an end, and will need a hard reset(everybody gets a 100$ new dollar bill, all old money is paper then). As all paper money systems (and token coin systems like the roman sesterz) before. Most times was a lost war or an economic crisis, often combined with a epidemic (wink wink) the trigger.
I’m with you with oil prices of 100$ , and a Dow Jones of 100.000 soon. We are short before the iconic gold over 2000$, and every hard asset, even over produced oil, will follow. The end game lasts one year in maximum – from denial to action.
And this discussion is correct here in the oil threat – because it will rattle all oil production world wide, even more than a short lifed military confilict in the gulf region.
George,
Do you think 2019 will end up being the peak oil production year for the GOM? 2018 was about 1.76 mmbopd, 2019 – 1.9, and 2020 will, I predict, finish at about 1.8 (it’s about 1.9 through April).
I’m going to stick my neck out now and say yes.
Haven’t checked to see the latest EIA predictions.
As you state, there are quite a few projects still ramping up (Appomattox is the biggest), and alot in the queue (ranging from Mad Dog 2 with first oil probably in 2022, to Whale, and alot in between.)
As I’ve stated before, Big E exploration is certainly past it’s peak in the GOM. I don’t expect much from that, but there could be a surprise here and there. Small tiebacks are the focus these days.
SLG – I’ve realised that I am pretty hopeless at forecasting; whichever way I lean I seem to get it completely wrong – in fact I might be a good contra-indicator. I was going to put together a post including something about this but maybe this will do (it’s really just a brain dump rather than a conclusion).
It certainly seems that the oil should be peaking but the production is lagging a bit behind what I would expect given the leasing and exploration activity over the last decade. This may be due to the opening up of gradually deeper areas, or the hiatus from the Deep Horizon catastrophe, or something else. Ramp up on the larger projects is quite slow compared to what I was more used to, mostly because no pre-drilling is done I think, there also are often multiple phases of development. The bigger fields and basins (Mars-Ursa, Thunder Horse, Caesar/Tahiti, Mad Dog, Atlantis) have added a lot of reserves from near field development or improvement of recovery (often getting back more towards their initial estimates), but those prospects must be getting exhausted now, and the new, deeper water, projects are not there yet to allow similar there. Mars-Ursa, especially, has had phenomenal success (although I don’t think the two initial fields to the Olympus did as well as expected), but I only know of the PowerNap tie-back for the future.
A couple of years ago the were a lot of tie-back plans or brownfield work planned, especially LLOG and Anadarko, but not so much now, even before the Covid-19 crash. It also didn’t do either much good – Anadarko sold-up to Occidental and LLOG looks to have had a bit of a fire sale to Ridgewood/ILX private equity fund (both deals must be viewed as a bit of a disaster by the procurers now). Another possibility is that some of the much vaunted fields like Leon, Moccassin, Yeti(?), etc. will be developed as smaller tie-backs rather than large greenfield floaters (Repsol are doing Leon, someone else (LLOG?) is considering Moccasin). However there are relatively few open qualified leases that would indicate possible future prospects. The deep water wells, especially from these smaller fields with no injection support, have high decline rates maybe 15 to 20% and normally no plateau period.
At the end of 2019, when oil was still at $60, I remember reading that Chevron (I think?) booked write downs of around $10 billion and stated that much of its deep water resources were not commercial at this price range, it must be worse now. In December 2019 the IHS Upstream Capital Cost Index, a measurement of development costs, measured 180, down from 230 when oil prices were at their peak. Given a supply shortfall enough to cause a price spike it is likely this index would rise significantly, made worse by the loss of workforce through demographic changes and the two recent price crashes. Therefore prices of $100 or more could be required to make some of these projects attractive again. Will this ever be seen – the camp that says the world economy can’t afford it seems to be winning at the moment, but maybe some kind of shale-like economic con or government intervention would allow it.
Another possible issue is increasing unplanned downtime either from failures in aging infrastructure or increasing
Hurricane activity; the GoM water is increasingly hotter, pop-up Hurricanes – i.e. that form quickly in the Gulf – seem to be getting more frequent, this years season is looking particularly bad.
Without Covid I would have said there could be a few years plateau with maybe one year exceeding 2019, but probably not now and it looked like a decline in January/February had already started, but I think that might be seasonally typical. Of course there’s always a chance of a Johan Sverdrup type discovery that would shake things up but it’s unlikely. Phew… I think I need a nap.
On another subject you had asked about the high recovery factors in some Norwegian fields. NPD reported recently that it hopes to get average recovery factors to 50% for oil and 75% for gas, so 80% and above for some gas fields seems reasonable.
Great stuff George Kaplan and SouthLa Geo. Thanks for the education.
Olympus was indeed used to develop mid-sized satellite tiebacks W Boreas and S Deimos, but a major purpose of the project was to drill more wells in the original Mars field from the platform as Mars ‘A’ is maxed out. Although the satellite discoveries certainly helped, the project was conceived before discovery of W Boreas and S Deimos, and known as Mars ‘B’. My understanding is that the Satellite fields have performed as expected.
Deep water rigs used to go for $650,000 a day. I wonder what now?
Roughly half, and maybe even less.
When rig rates were at about $650,ooo a day, the total cost to an operator (called the spread rate) would be over $1 MM/day. These extra costs includes well hardware, special services like the cost of logging or casing crews, etc.
The EIA’s Monthly Energy Review is out with estimated data for June. They have June production down by 497 thousand barrels per day. The decline began in December 2019 but did not really take off until April.
Month Kb/d …….Change since last month.
Oct-19 12,674
Nov-19 12,866 192
Dec-19 12,813 -53
Jan-20 12,755 -58
Feb-20 12,748 -7
Mar-20 12,730 -17
Apr-20 12,061 -669
May-20 11,394 -668
Jun-20 10,897 -497
Decline Since November -1,970
Ron,
From March to June the decrease for all US C+C is 1833 kb/d, for tight oil the decrease over the same period is 1391 kb/d. The MER may be overestimating the decrease from May to June or perhaps the tight oil estimate is wrong. For the tight oil plays they have a the following decreases in kb/d:
Mar- April 527
April-May 738
May-June 126
Typically the MER estimates for the most recent 2 months tend to be inaccurate.
I understand Dennis. My point in showing the decline started in December was to show the decline had begun four months before the Covid-19 catastrophe. I think that is very important. That point is overlooked by many analysts, including yourself.
And of course, I know that the MER guesses, often inaccurately, the last two months production. That’s why I said it was their estimated data.
Hi Ron,
The decline for tight oil from Nov 2019 to March 2020 had a an annual trend (using an ordinary least squares fit to the EIA data) of -95 kb/d per year from Nov 2019 (peak) to March 2020. So yes decline started earlier, but it was quite mild before April ( a decline rate of about 0.1% per year relative to World C C output annual average for 2019). Some might call it a plateau.
Oh and as I have suggested in the past all data is estimated.
Also looking at the US C plus C chart there have been plenty of periods of decline larger than the Nov 2019 to March 2020 decline which were then followed by increases in output, see Feb 2019 and Sept 2016 for the most recent episodes. The decrease before the pandemic was nothing unusual, just typical ups and downs of the oil market.
In the last post there was talk about the status of oil importing countries in a post-peak world.
China is the biggest oil importer and now they are cementing a long term relationship with Iran to secure oil.
“Iran and China have quietly drafted a sweeping economic and security partnership that would clear the way for billions of dollars of Chinese investments in energy and other sectors, undercutting the Trump administration’s efforts to isolate the Iranian government because of its nuclear ambitions.”
“The partnership would vastly expand Chinese presence in banking, telecommunications, ports, railways and dozens of other projects. In exchange, China would receive a regular — and, according to an Iranian official and an oil trader, heavily discounted — supply of Iranian oil over the next 25 years.”
” The document also describes deepening military cooperation, potentially giving China a foothold in a region…”
https://www.nytimes.com/2020/07/11/world/asia/china-iran-trade-military-deal.html
This a re-invigoration of the historic silk route trade, and is a winning combination for both countries.
It is a huge loss for the Trump campaign of trade war with China (they now will ignore Iran sanctions imposed by the USA), and his decision to unilaterally opt out of the international Iran Nuclear Weapons treaty.
With Iran’s strong influence over Iraq that developed after the failed Iraq invasion policy, the Iraqi oil supply also is more likely to fall under Chinese market control.
China will likely begin oil trading in its own digital currency this decade, undercutting the USD domination.
While the USA has been twittering away the recent years, China has been setting the groundwork for solidifying their future foundation.
https://www.forbes.com/sites/rogerhuang/2020/05/25/china-will-use-its-digital-currency-to-compete-with-the-usd/#faf80d31e8fd
I agree, well stated
Chart below compares DPR and tight oil estimates by play, from Jan 2017 to June 2020, over that period the average difference between the two has been about 866 kb/d over that period, this is due to conventional oil output in the tight oil and shale gas play regions covered by the DPR. Over the past 12 months (July 2019 to June 2020) the conventional portion of the DPR has averaged about 9.87% of the DPR total for all basins. Assuming this ratio remains constant in July and August 2020, I have estimated tight oil output for July and August 2020, the accuracy depends on both the accuracy of the DR estimate (often not great), and the assumption stated above (also likely to be wrong). Basically the DPR sees decline of tight oil slowing in July and August, we will know in a couple of months if this estimate is correct.
tight oil output (left axis) in kb/d and real oil price for US imports in 2019US$ (right axis). There is likely a one to two month lag between changes in the price of oil and changes in output as it takes time to change drilling plans. In late 2019 early 2020 it looks like $50 to $55/bo for real imported crude prices was a critical threshold where output changed dramatically when oil prices fell below this level. It will be interesting to watch changes in average monthly real oil price level and how it may affect tight oil output going forward.
https://www.click2houston.com/news/texas/2020/07/29/trump-rallies-oil-and-gas-workers-in-the-permian-basin-against-democrats-ahead-of-the-november-election/
Amazon. Strong earnings. On a day minus 33% Q2 GDP announced.
Hard to see how that stuff got delivered without burning oil.
Revisiting some numbers. US Q1 GDP -5%. In absolute terms, 21T became 20T.
-33% Q2 means that on 1 July US GDP was 15.6T. China’s about 14.5 right now.
Perhaps more significant, the 4T stimulus of late March got spent in Q2. Not all of it but most of it. The -33% included the stimulus.
There is supposed to be a surge in Q3. Numbers are all over the place as to how much. I wont pick one. Nobody has a clue.
The national debt today is 26.6T. Stimulus number 2, let’s just call it 2.4T. Gives us a nice round number of 29T debt.
That’s about what, 180% of GDP?
I don’t think there’s a fix for this. The historical fix would be go to war and conquer someone and take their assets. That sort of looks like the simplest one.
A pretext can be manufactured for all sorts of places, but pretty much all of them can provide assets only in the form of oil or gas. Well that’s not really true. Could conquer Panama in seize the canal and collect the transit fees, which add up to a few billion a year. Venezuela is an obvious target. We’re going to need some place no one cares much about, but has significant assets. A bit mutually exclusive.
Singapore could work. They are the designated fuel stop for pretty much all Asian sea traffic from the west. Find some reason to get angry at them and seize the territory.
Atlanta Fed just published its first Q3 GDP Nowcast. +12%. That is literally 1/4 of projections I’ve seen. Hope ladled on thick.
Watcher ,I could not have said it better . Not surprised , data worldwide is contaminated with bullshit . All is virtual . Caterpillar sales crashed by 40% in USA and all the MSM talks about is AAPL etc . When reality hits ,heaven help .
-33% Q2 means that on 1 July US GDP was 15.6T.
The 33% is annualized. IOW, that’s what you’d get if the quarterly decline rate continued for four quarters. So, the actual decline for this quarter was about 1/4 of the 33% annual rate.
“Current‑dollar GDP decreased 34.3 percent, or $2.15 trillion, in the second quarter to a level of $19.41 trillion. In the first quarter, GDP decreased 3.4 percent, or $186.3 billion (table 1 and table 3).”
https://www.bea.gov/news/2020/gross-domestic-product-2nd-quarter-2020-advance-estimate-and-annual-update#:~:text=Current‑dollar GDP decreased 34.3,table 1 and table 3).
This has come up before. It’s not pure annualized because the measurement is a % change from the quarter before.
I don’t remember when this was an issue. I *think* it was during the Greek upheaval and Greek numbers were not defined as the EU Troika was defining them. It spilled into US numbers . . . which at the time were coming out of the crisis and definitions were flying.
But okay, 8% down from the 1.25% down in Q1 will be moderated and that’s real using their PCE. A bit under 19T.
What’s 3.4T, anyway. Petty cash. Atlanta’s NOWCAST will bump it 3% to 19.4, though Atlanta offered up their number before the current death surge in California and Florida. Q3 negative and Q4 negative pretty credible. As is 15.6 end of year if they are.
Panama is easy money.
The Eia’s Monthly Energy Review came out three days ago. And the EIA’s Monthly Petroleum Status Report just came out today. The former, the Energy Review has data through June while the Status Report has data only through May. However, the Status Report has May’s C C data 896,000 barrels per day below the Energy Reviews June production data. I have no idea what is going on here. I know the Monthly Energy Review is often in error. But I have never seen it off this far.
…………. ………….. Monthly
…………. Monthly Petroleum
…………. Energy Status
…………. Review Report
Jan-19 … 11,856 … 11,865
Feb-19 … 11,669 … 11,679
Mar-19 .. 11,892 … 11,937
Apr-19 … 12,123 … 12,135
May-19 .. 12,113 … 12,163
Jun-19 … 12,060 … 12,088
Jul-19 … 11,823 … 11,819
Aug-19 .. 12,385 … 12,425
Sep-19 … 12,479 … 12,495
Oct-19 … 12,674 … 12,673
Nov-19 .. 12,866 … 12,860
Dec-19 .. 12,813 … 12,802
Jan-20 … 12,755 … 12,755
Feb-20 … 12,748 … 12,746
Mar-20 .. 12,730 … 12,737
Apr-20 … 12,061 … 11,990
May-20 .. 11,394 … 10,001
Jun-20 … 10,897
Ron , I know what is happening . We are in a mess and we don’t know how to get out of it . Be well .
Noticed that as well,, GOM production was down from about 1.9 in April to 1.6 in May. I’m going to wait til BSEE provides their update of GOM production, probably early next week.
In the past, both EIA and BSEE had very similar GOM production numbers – within a few % of each other, but of late the differences have been bigger – over 5%. I tend to believe the BSEE numbers because I think those are operator’s reported numbers, while, I think EIA is just an estimate. (Not even sure of that because if it is just an estimate, it has been, as I said, very close to BSEE numbers in the past.)
SouthLaGeo,
Have the PSM estimates been 5% higher or 5% lower than the BSEE estimates?
The difference for April 2020 is about 1%, with BSEE being 1% higher than the EIA estimate for GOM. EIA 1913, BSEE 1931 kb/d, for April 2020.
The chart below goes back to May-2019. Values overlay very well until January-2020 when they start to diverge. Biggest diversion was March-2020 where it is about 3%. I do stand corrected in that it has never exceeded 5%. The EIA estimate has usually been higher.
My initial comments above were also based on looking at the production data as it gets released. Both BSEE and EIA update previous month’s estimates as time goes by. I typically just go with the BSEE data, and update previous estimates based on changes that BSEE may have made.
Thanks SouthLaGeo. Often data gets revised, especially for the most recent few months for EIA data, I don’t follow BSEE data as closely as you, I agree their data is likely better (in fact EIA may simply revise their data so the two data sets are in agreement (which would account for the nearly exact match up to Jan 2020.)
SouthLaGeo,
The new BSEE data is out and April is about 3% lower than reported by the EIA and May about 4% lower, Data agrees closely through Dec 2019 and then starts to diverge with BSEE estimates always lower than EIA estimates from Jan 2020 to May 2020.
Dennis,
Thanks, I saw that. I honestly expected the May BSEE data to be higher than the EIA data, but it came in lower as you said – about 1.54 mmbopd. Not sure why so low. May be a combination of some facility work plus low price related shut in production. I’ll look at some of the field specifics to see if I can figure it out.
Another chart comparing MER and PSM. I tend to believe the PSM.
Difference in May 2020 of 1393 k/d, so if the PSM is correct (typically any error is less than 2%), the MER was off by almost 14%, yikes.
Also, I got an email from shallow sand with data suggesting that in his state output might recover in June. Mostly conventional production there as far as I know. The tight oil estimate for the EIA has tight oil down by 738 kb/d from April to May, but the PSM has US output down by 1989 kb.d from April to May, this implies conventional output (all C plus C output that is not tight oil) was down 1251 kb/d from April to May. In April conventional US C plus C output was 4281 kb/d, so a drop of 1251 kb/d from April to May 2020 would be a 29% decrease in output in one month, Shallow Sand has been predicting a big drop in May, this might be even larger than he expected.
Certainly a bigger drop than I expected.
The Sort term energy outlook from July 7, 2020 expected May US C plus C output to be 11200 kb/d, fairly close to the MER and far from the PSM estimate. I am fairly sure the MER is influenced by the STEO, which often misses badly.
Typo for my 7/31, 7:18 pm comment. Should be Short term energy outlook, rather than Sort term …
Here’s a dumb layperson’s question. What happens to the water (watercut) from GOM oil production. Is it separated off shore or separated on shore and how is it treated and discarded? Surely it’s not just dumped in the ocean?
It actually is dumped overboard – after a pretty thorough onboard cleaning and filtering process. Operators do a good job at this. They are constantly inspecting the overboard water to see if an oil sheen develops near where they are dumping the water, and, if so, find the problem and fix it.
The Chevron CEO says part of the loss they took was re-evaluating value of reserves at the lower price. His text suggested they went beyond SEC requirements, which might have allowed averaging the price of oil over a longer period. So this, plus a write down of the value of Venezuela assets via sanction, added to the loss.
Maybe the most significant text from him . . . “we will defend our dividend.”
A new US oil post has been published.
http://peakoilbarrel.com/us-may-production-plunges-2mb-d/