A post by Ovi at peakoilbarrel
All of the oil (C + C) production data for the US states comes from the EIAʼs Petroleum Supply monthly PSM. At the end of the production charts, an analysis of three different EIA monthly reports projecting future production is provided. The charts below are updated to May 2020 for the 10 largest US oil producing states.
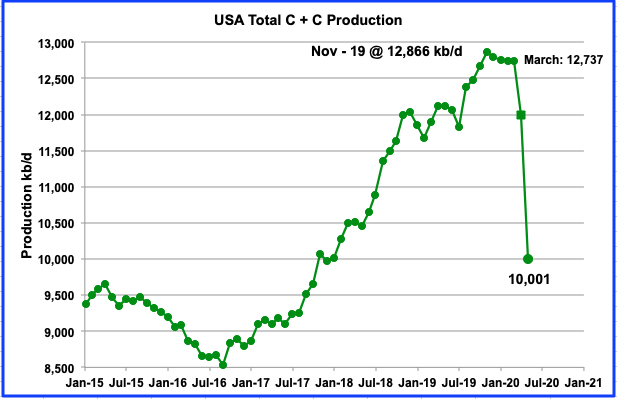
May’s production drop is just short of 2 Mb/d by 11 kb/d. Awesome. US oil fields began a slow and steady decline from November 2019 to March 2020. March brought the combination of CV-19 and oil price drop that led to the sharp production plunges in April and May. Since the current EIA data is two months delayed, May is the second month that shows the combined effects of the pandemic and low oil prices. Will June drop below 10,000 kb/d?
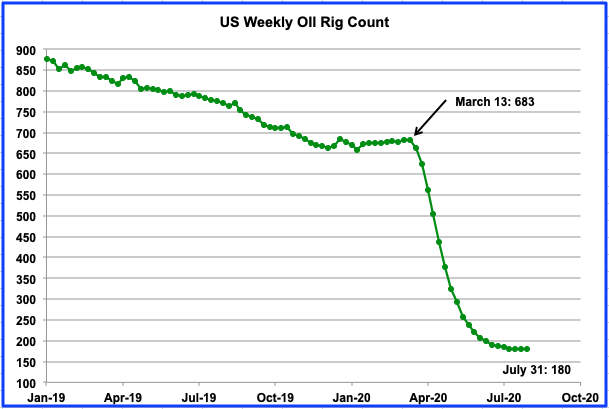
The weekly drop in US operational oil rigs is slowing and appears to be heading for a minimum in July. For the week of July 31, US oil rigs were flat at 180. As can be seen from the previous chart, oil production dropped in concert with the rig count.
The parking of rigs raises an interesting question, which hopefully someone can shed light on. With Rigs parked, Frac spreads down and contractors not working, prices must have dropped. So the question is “Has the cost of drilling a well dropped to the point that $40 WTI is the new breakeven price?”
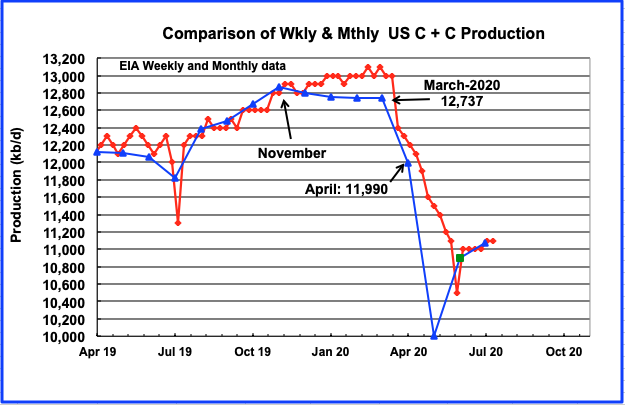
The last two points on this chart are projections. The green square is June output (10,897 kb/d) taken from the late July MER. The last blue triangle is the 24 day weekly average for July, 11,056 kb/d.
This weekly/monthly chart is updated to July 24 and is the source of much disagreement on this blog. Some participants think the weekly estimates are just a WAG. They have some evidence for this when looking at the May production number. The May average, using the weekly data is 11,491 kb/d. It is 1,490 kb/d higher than the just released PSM monthly number of 10,001 kb/d. Certainly appears to be a WAG for May. Never seen such a gap. Could the EIA PSM be wrong. Check back next month.
Another possibility to consider. Could this be a message intended for OPEC stating that the US has cut its May production by 2,736 kb/d from the November 2019 high of 12,737 kb/d, a cut of 21.5%.
As opposed to the bad weekly estimate for May, the April weekly average is 12,160 kb/d. The just released PSM May production number is 11,990 kb/d. Missing by 170 kb/d, 1.4%, classifies as a very good estimate. Something for both sides.
RANKING PRODUCTION FROM US OIL STATES
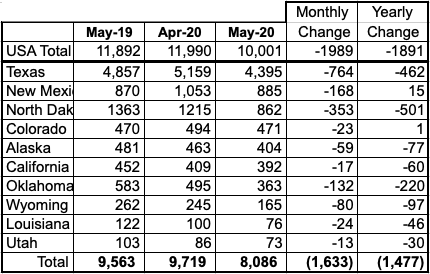
Listed above are the 10 states with production previously greater than 100 kb/d. This month both Utah and Louisiana fell below 100 kb/d but are retained for continuity. These 10 accounted for 8,086 kb/d (80.9%) of US production out of a total production of 10,001 kb/d in May 2020. Note that of all these 10 states, only two states, Colorado and New Mexico, produced more oil in May than the same month last year.
Not shown in the table is the GOM which produced 1,613 kb/d in May and would rank between Texas and New Mexico. Note that New Mexico displaced North Dakota as the second highest US oil producer for May.
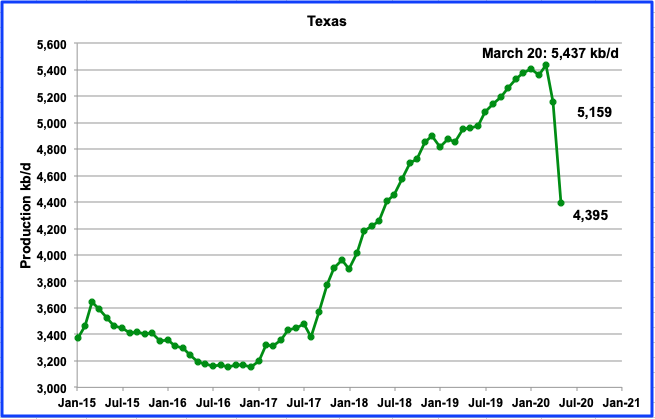
Production in Texas decreased by 763 kb/d to 4,395 kb/d in May, a drop of 15%. Unprecedented and demonstrates the need to keep drilling continuously in LTO fields.
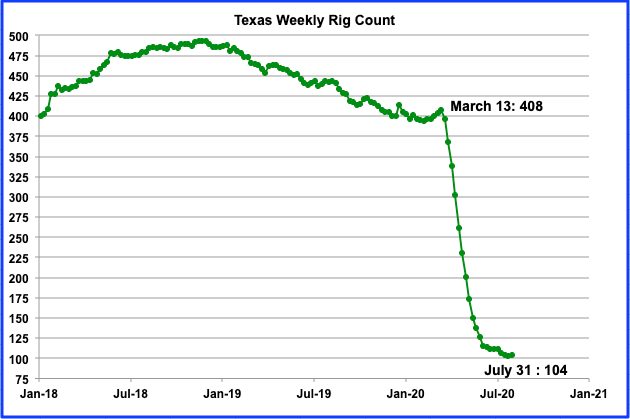
From March 13 to July 31, the Texas rig count dropped by 304 to 104 or 74.5%. An output drop followed in April and a larger one in May as shown in the previous chart. Note that for the weeks of July 14 to July 31, the rig counts were almost flat at 104, 103 and 104, respectively.
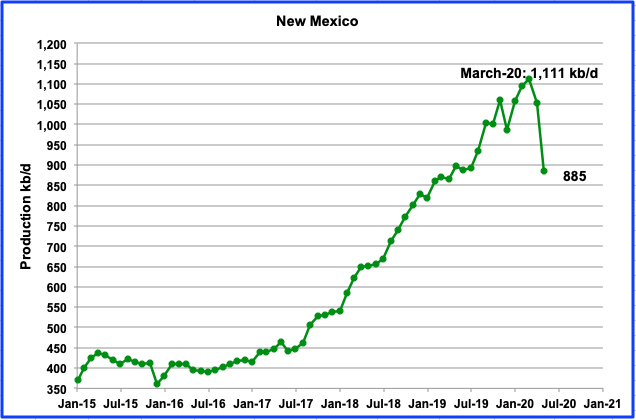
New Mexico’s production in May fell by 168 kb/d to 885 kb/d while April saw a smaller drop of 58 kb/d.
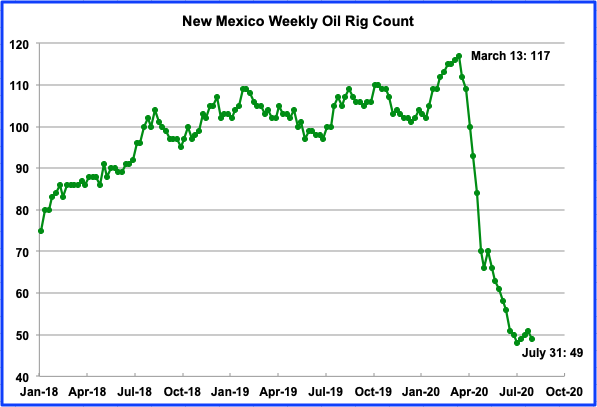
From March 13 to July 31, New Mexico’s rig count dropped by 68 or 58%. Over that same period, production dropped by 21%.
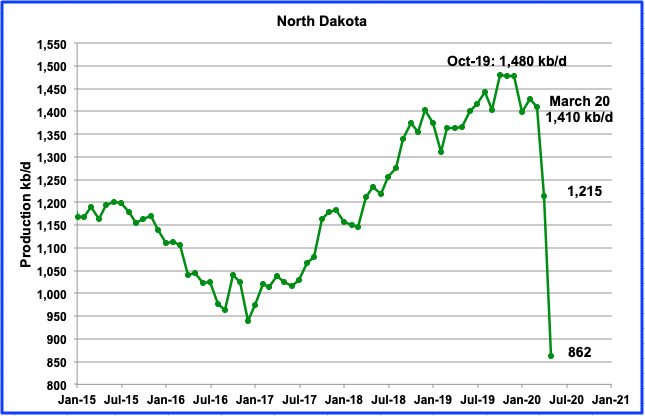
North Dakota’s oil production started to drop in November 2019 after peaking at 1,480 kb/d in October. In May output declined by 353 kb/d to 862 kb/d.
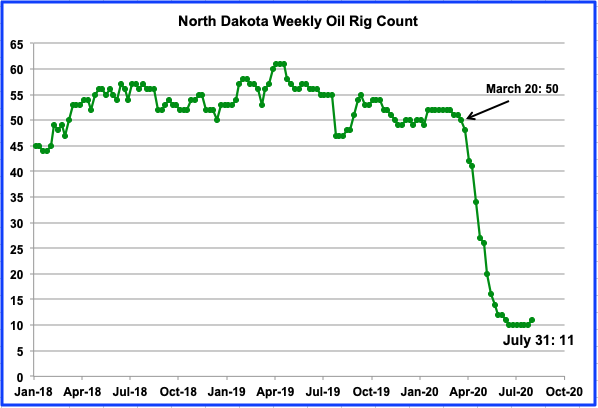
The North Dakota rig count has held steady at 10 for the weeks of June 19 to July 24. For the week of July 31, one rig was added to bring the total to 11.
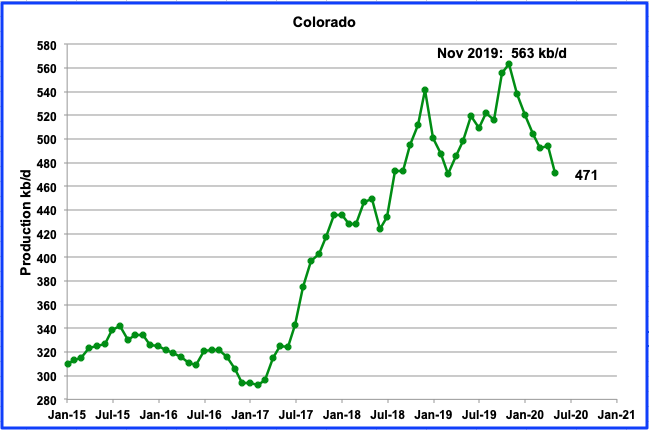
Colorado, after showing a small production increase in April, dropped by 23 kb/d to 471 kb/d. Colorado’s production dropped steadily since November 2019, until April’s short reversal. Colorado’s oil rig count has held steady at 4 for the last 6 weeks.
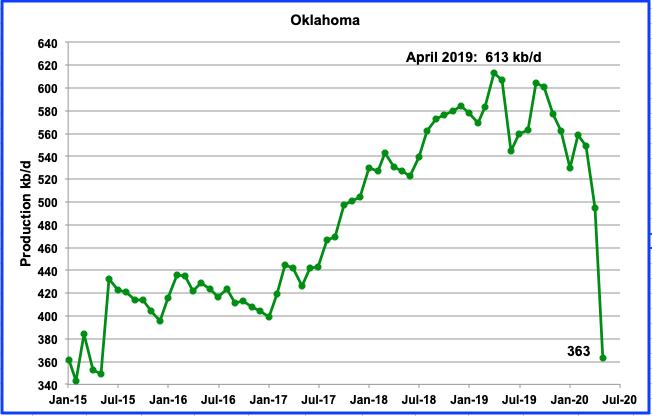
Oklahoma’s output started to drop in April 2019. It rallied a few times but made a significant drop in April and May as rigs were taken offline. In May output dropped by 132 kb/d to 363 kb/d. Oklahoma added one rig in the week of July 31 for a total of 11. In January they had 52 rigs operating.
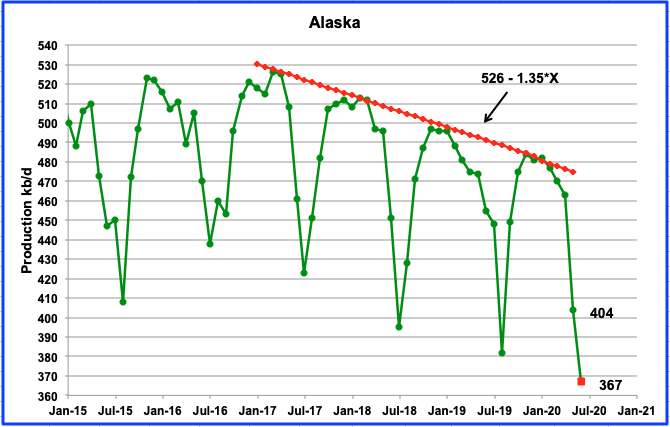
Alaska production continues its annual summer decline. In May output dropped by 59 kb/d to 404 kb/d. The latest July MER shows June output to be close to 367 kb/d (red square). If correct, this will be 15 kb/d lower than the August 2019 output of 382 kb/d.
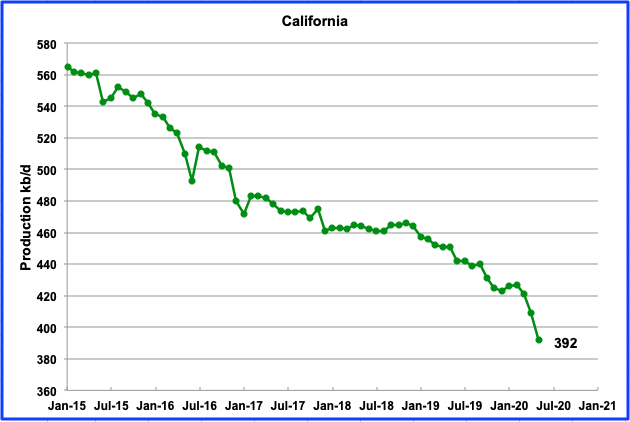
California’s slow output decline has accelerated in the last two months and dropped below 400 kb/d. April production was down by 12 kb/d and May was down an additional 17 kb/d to 392 kb/d. Over the last three years, the average decline rate has been close to 24 kb/yr. Production has dropped by 29 kb/d over the last two months. During the last 10 weeks, California has had only 4 rigs operating.
Is the decline related to this company going bankrupt?
Headline: “Major California Oil Producer Falls Victim to Collapse in Crude Prices Amid Pandemic”
Facing a mountain of debt amid a historic coronavirus-driven crisis in the petroleum industry, one of California’s biggest oil producers has filed for bankruptcy.
Industry analysts say the filing late Wednesday by Los Angeles County-based California Resources Corp. is a dramatic illustration of the challenges facing oil producers as pandemic-fighting measures across the globe have drastically reduced demand for petroleum products and contributed to a crash in crude prices.
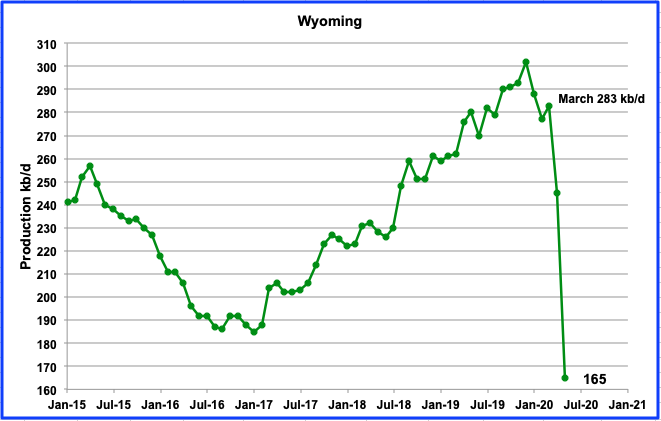
Wyoming’s production in May decreased by 80 kb/d to 165 kb/d, a drop of 25% compared to the December 2019 high of 302 kb/d. During the week ending July 31, Wyoming had 1 oil rig in operation, down from a high of 20 in January 2020.
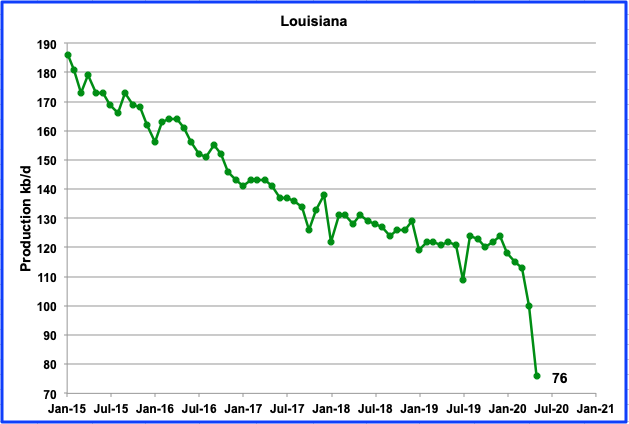
Louisiana’s output began its steady decline in January. In May production was down by 24 kb/d to 76 kb/d. In January 2020, on average, 49 rigs were operating. There were only 29 operating in the week of July 31, a drop of 1 from the previous two weeks.
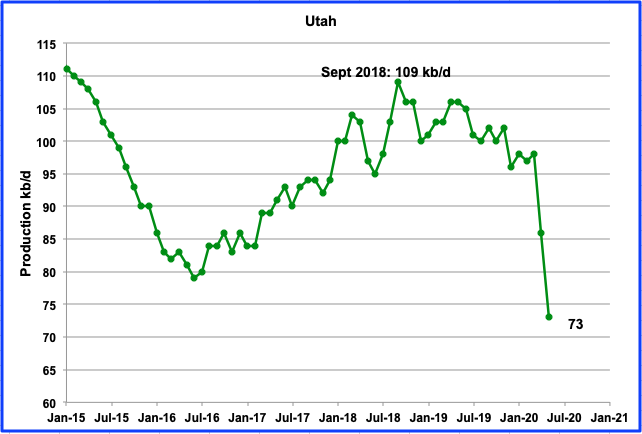
After the low in June 2016, Utah’s production peaked in Sept 2018 at 109 kb/d. Since then, output has been unsteady but with an overall decline. It declined by 11 kb/d to 98 kb/d from September 2018 to March 2020. In April, production dropped by 12 kb/d to 86 kb/d and then by another 13 kb/d in May to 73 kb/d. Utah’s oil rig count slowly climbed from 4 rigs in January to a peak of 8 in the week of April 3. By the first week in May, no rigs were operational and none are in operation now.
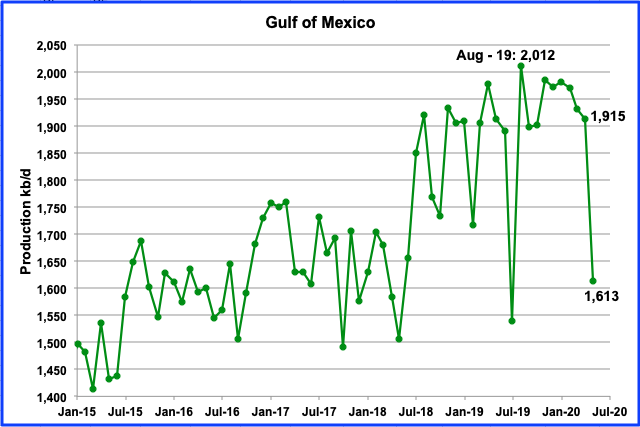
Over the past year, GOM output has kept bumping up against a production ceiling of 2,000 kb/d. However in May output dropped significantly by 303 kb/d to 1,613 kb/d. This could be related to scheduled maintenance, similar to July 2019.
UPDATING EIA’S DIFFERENT OIL GROWTH PROJECTIONS
1) DRILLING PRODUCTIVITY REPORT
The Drilling Productivity Report (DPR) uses recent data on the total number of drilling rigs in operation along with estimates of drilling productivity and estimated changes in production from existing oil wells to provide estimated changes in oil production for the five principal tight oil regions. The charts are updated to August 2020.
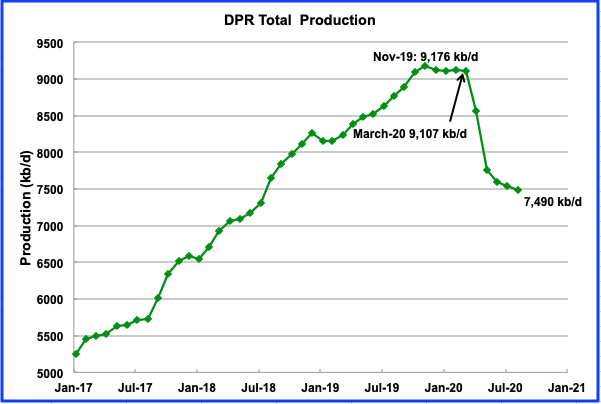
Above is the total oil production from the 7 basins that the DPR tracks. Note that the DPR production includes both LTO oil and oil from conventional wells/fields.
According to the July DPR report, LTO oil and conventional oil output peaked in November 2019 at 9,176 kb/d. The projected output in August is 7,490 kb/d, down 56 kb/d from July. The contributions from four of the basins are shown in the charts below.
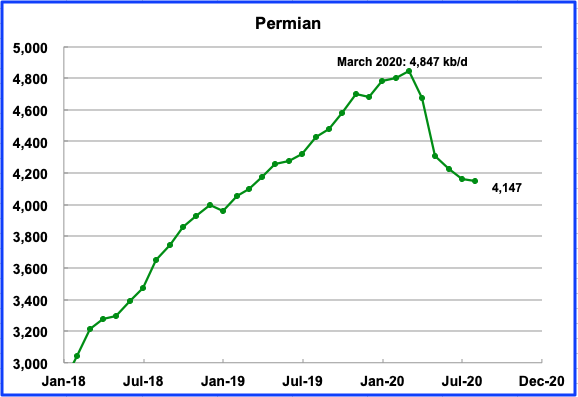
Permian output in August is projected to be essentially the same as July, 4,147 kb/d, down 13 kb/d.
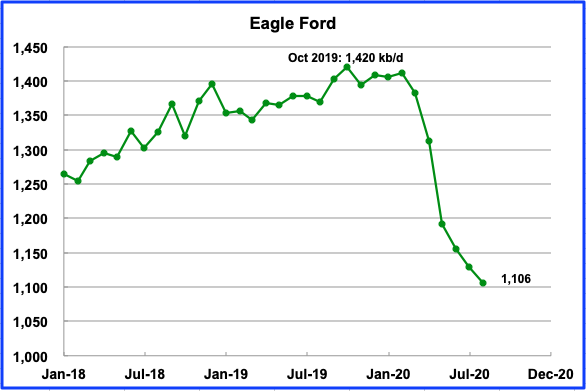
Eagle Ford’s output had its biggest drop in May, 120 kb/d. August’s drop is projected to be a much smaller 23 kb/d to 1,106 kb/d. It should noted that July’s output was revised down from 1,173 kb/d in the previous report to 1,129 kb/d in the current one.
It is interesting to note that the combined May output for EF (1,192 kb/d) and the Permian (4,309 kb/d), of 5,501 kb/d is greater then the combined Texas (4,395 kb/d) and New Mexico (885) output of 5,280 kb/d. Expect some revisions in the next update.
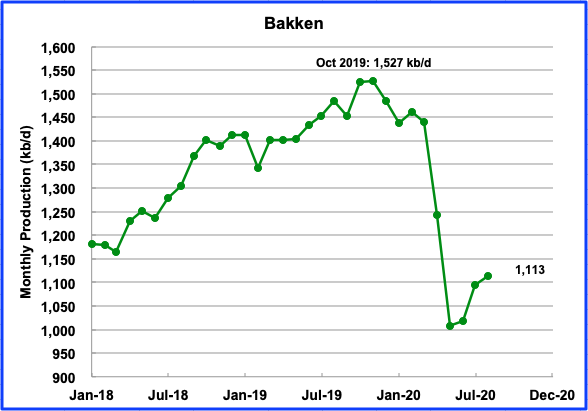
The Bakken is projected to have two big output drops in April and May and then begin to increase output in July to 1,095 kb/d and then to 1,113 kb/d in August. See additional comments in the LTO section.
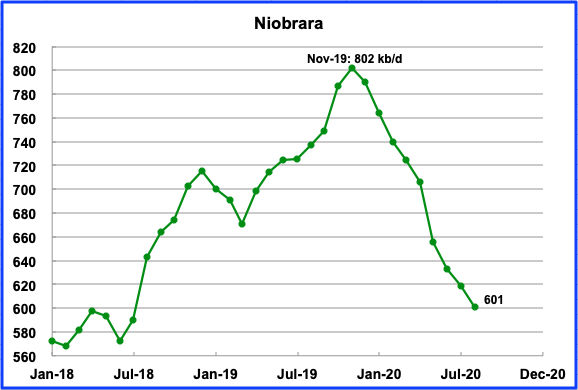
Niobrara output is expected to drop by 18 kb/d in August to 601 kb/d.
2) LIGHT TIGHT OIL (LTO) REPORT
The LTO database provides information on LTO production from seven tight oil basins and a few smaller ones. These charts are updated to June 2020.
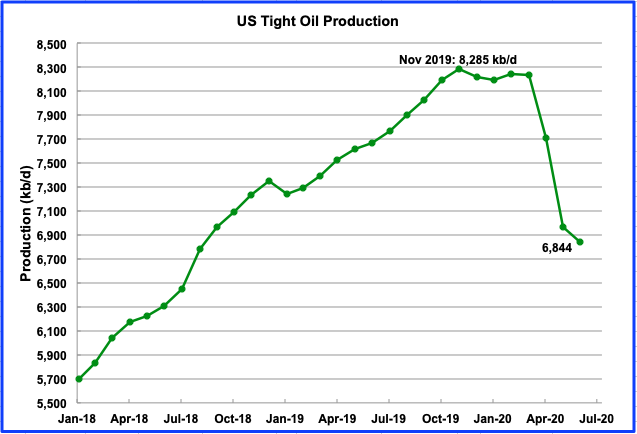
June’s total LTO output is expected to decline to 6,844 kb/d from 6,970 kb/d in May, a drop of 126 kb/d. The large declines seen in April and May are over.
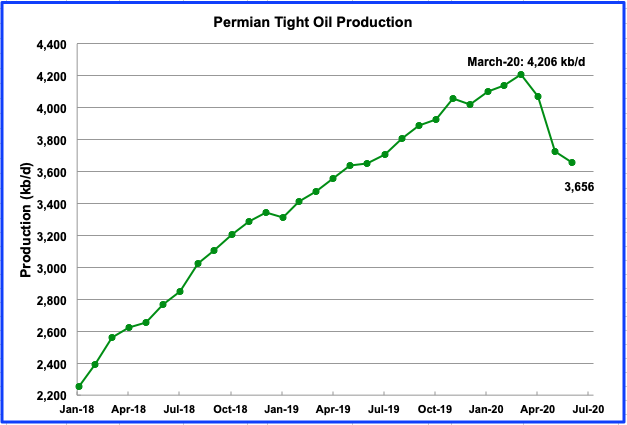
Permian LTO output in June is projected to be 3,656 kb/d, a drop of 71 kb/d from May’s 3,727 kb/d, more than half of the total LTO decrease.
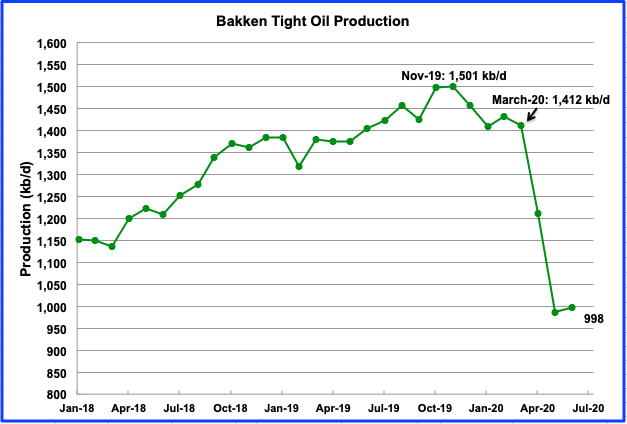
The Bakken is forecast to increase production by 11 kb/d in June. What are they smoking? See next chart.
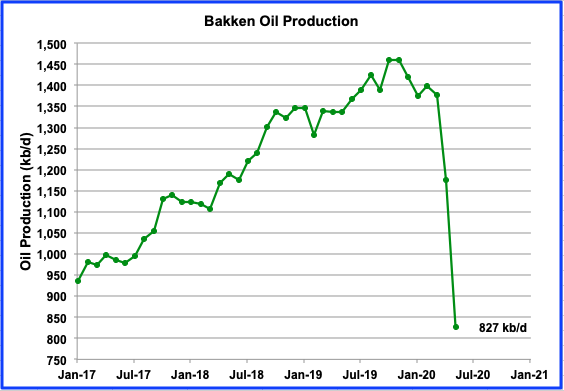
North Dakota is reporting that May output was 827 kb/d. Where does the above LTO May projection (987 kb/d) showing more output than all of North Dakota come from. The LTO report was published after ND reported their production????
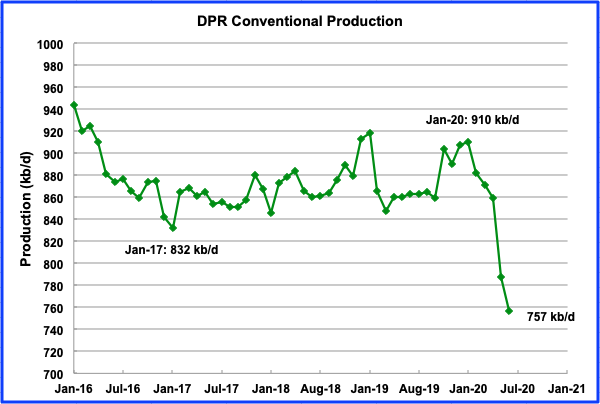
This chart shows that conventional oil in DPR basins is also being shut in. The chart was obtained by taking the difference between the DPR and LTO production estimates up to June 2020. From Jan-20 to June-20, conventional oil in DPR basins fell by 153 kb/d, or 16.8%.
3) SHORT TERM ENERGY OUTLOOK (STEO)
The STEO provides projections for the next 13–24 months for US C + C and NGPLs production. The July 2020 report presents EIA’s oil output projections out to December 2021.
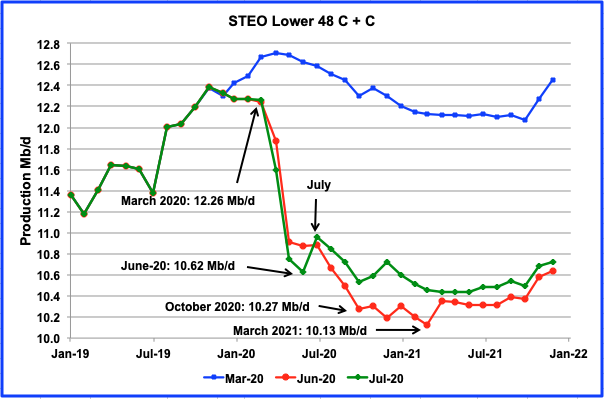
The July STEO report revised their June report estimates/projections up from July onward. The production estimates for May and June have been lowered.
The STEO is projecting a major drop of 1.64 Mb/d in US L-48 production from March 2020 to June 2020. Note how the July STEO has increased its output projection by approximately 200 kb/d to 400 kb/d in the September 2020 to March 2021 time frame compared to June’s estimate.
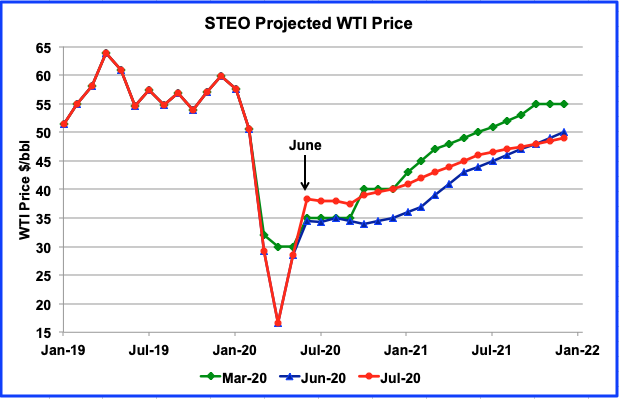
Now that the price of WTI has moved above $40/b in early August, it appears that the STEO March projection was closer to the early August price of $40/b than their June estimate. The July STEO is now projecting an average price from June to October of between $37/b and $38/b, which is lower than the current price.
World Oil Production
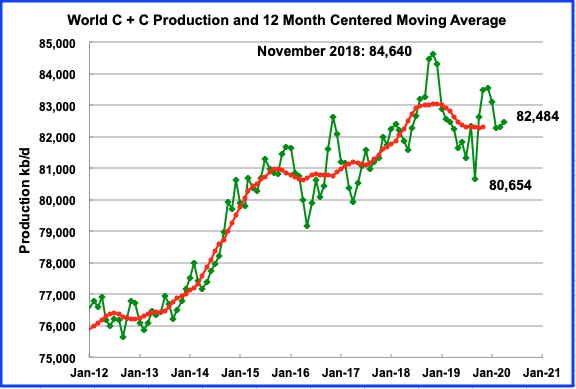
World oil production in April increased by 168 kb/d to 82,484 kb/d. OPEC’s production increase of 1,919 kb/d in April was offset by Non-OPEC’s decline of 1,751 kb/d.
As to the question of whether we will see further declines in US output in the near future (next 6 months), my answer is no. This assumes the May 2020 estimate from the PSM is roughly correct (within 2% of the final revised estimate).
I came across the following link
https://iprb.org/wp-content/uploads/2020/07/Illinois-Q2-2020-Oil-Production-Report.pdf
This is data for Illinois oil production which is mostly (perhaps entirely) conventional oil. The low oil prices in May may have caused many operators to wait until June to sell their oil. The oil is only counted as “produced” when it gets sold, so some of the oil sold in June may have been in holding tanks at the lease (actually produced in May) and then sold (and reported as “produced” in June.
In short, the bump in June may well be temporary. and then July production will fall (but assuming prices remain where they are, output in July would be somewhere between the May and June output level.
Screenshot below of link above.
Dennis
Ignoring their April and May numbers, it looks like production capacity this year is up by close to 5%.
Yeah, too bad that consumption capacity is going to be down by 15 to 20%.
Consumption will likely fall further as airline reduce flights and layoffs continue. Its possible there will a lot of layoffs coming in Sept & October. Banks are cutting back on loans and this is going to impact employment. Lots of small business have been borrowing money or using personal savings to keep operating at a loss, and a lot of these business will shutdown this fall. Also consider that resturants won’t be able to continue outdoor dining when the weather gets cold.
I suspect that Oil prices will fall back into $30s or perhaps $20s later this year, unless there is a War with Iran. (possible consider all of the recent sabotage in Iran this summer).
So we’re all going on welfare?
And a life of leisure pursuits?
“a life of leisure pursuits?’
Nope, Think European Pre-20th century, 90% in poverty ~9% middle class and 1% robber barrons.
Already on the trend as 1% owns about 70% of all assets and bottom 90% own about 5%.
https://rwer.files.wordpress.com/2018/11/ruccio-and-jamie-2.jpg?w=1024&h=863
“So we’re all going on welfare?”
I think about 50% to 60% of the US population is already dependent on gov’t: Gov’t jobs, unemployment, pensions, & entitlements. So perhaps close to reality.
Sounds like a command economy.
Ovi,
Are you talking about Illinios?
There annual average output was 23 kb/d from 2017 to 2019. Where do you get the 5% increase?
Are you looking at a single month? Production capacity should be measured over a 6 month period at minimum, in my view 12 months is a better measure.
Yep—
Oil giants Exxon and Chevron post massive Q2 losses
https://www.youtube.com/watch?v=tyeZsHSUCaQ&feature=youtu.be
The Chevron CEO says part of the loss they took was re-evaluating value of reserves at the lower price. His text suggested they went beyond SEC requirements, which might have allowed averaging the price of oil over a longer period. So this, plus a write down of the value of Venezuela assets via sanction, added to the loss.
Maybe the most significant text from him . . . “we will defend our dividend.”
I guess CVX will be defending that dividend with the help of Solar and Wind-
Chevron to Build 500MW of Renewables to Power Oil and Gas Facilities — and It’s Considering More
-https://www.greentechmedia.com/articles/read/chevron-to-build-500mw-of-renewables-globally-to-power-oil-and-gas-facilities
Exxon should earn billions according to their 15 usd goal…
https://www.bloomberg.com/news/articles/2019-03-14/exxon-aims-for-15-a-barrel-costs-in-giant-permian-operation
Perhaps something went wrong…
Ovi,
Your Texas weekly rig count is only about 100 now. According to ExxonMobil 2019Q2 earnings call transcript, VP Neil Chapman believes there is energy communication between benches in the Permian. With low rig counts, could this energy communication decrease the production of further fracking wells because the oil has dispersed, causing lower oil density? If true then it will be harder for Permian oil production to increase as oil prices increase.
https://finance.yahoo.com/news/exxon-mobil-corp-xom-q2-042333862.html
Sam Margolin — Wolfe Research — Analyst
Good morning. My first question is about the Permian. The industry for a while now, but may be coming too ahead here is seems to be having some issues with spacing and its impact on productivity. We don’t have a lot of precise numbers about your spacing, but we do know that your development plan sort of calls for, call it a high concentration of lateral feet per square mile, or just, you have a lot of wells that are stacking up in your section.
So can you talk about just broadly, this might be too complex a question and I don’t want to get too esoteric, but just broadly how you’re managing some of these issues we’re seeing in the industry given the nature of your development plan in the Permian?
Neil A. Chapman — Senior Vice President
Yes. Sam, it’s, of course, like you, I read many of the different results in the industry. I would tell you that in terms of planning basis, again, it’s unchanged from the detailed plan that I laid out in March and what I said at that time that we are driving a different approach then the industry with these really leveraging a combination of this large contiguous acreage that we’ve had and leveraging the scale of ExxonMobil. And of course, you will recall that I went through all of that. I also discussed at that time that we are working on plans that will develop and drill multiple horizontal benches at one time.
Our feeling is that there is communication between these horizontal benches. And if you go in and drill one bench now and expect to come back years later and drill the other benches, we do see and we do believe there’s communication between the benches. Energy dissipates and our belief is that drilling up multiple benches simultaneously in the approach that I laid out is to be the right way to go.
We are at the very early stages of that. Frankly, it’s too early to highlight anything new from what I said back in March of last year. I am aware that there are competitors out there who’ve looked at spacing and have moved along a line of having closer spacing than we have in our plans. I have heard that and I think everybody in industry has read about that.
My understanding is the company involved in that has pulled back from it. It hasn’t been successful. We have not taken that approach. Our spacing is not as tight as that. So it’s early days. We have nothing new to report versus what we said last time. As I said, we are on plan and nothing different.
Tony,
Basically their approach looks at the basin in three dimensions, rather than focusing on only two dimensions. Seems sensible.
When utilizing rigs in a given area, develop all viable benches simultaneously ( as near as possible). Also don’t space wells too tightly as your productivity per well will be lower and cost to produce increases.
Tony
It is interesting that the questioner asked about lateral spacing of wells and got an answer regarding benches.
One of the critical factors that determine the rate and amount of oil that comes out of the ground is pressure, (Chapman uses phrase “Energy dissipates” when layers communicate). So Exxon is taking the right approach. By drilling all layers at once, they can control the pressure drop between layers if the layers communicate. It is possible that the communication between layers could be caused by the fracing or could be through natural cracks. Note that the rapid decline in in LTO wells is related to the rapid pressure drop and the small volume that the well is communicating with.
There was a company in Canada that was using water flood to get more oil out of its Bakken wells. They drilled water wells into their oil well region and then fracked them so that they would communicate with the oil region. They then pumped water down to get more oil out. They claimed it worked. In essence pumping the water down helped to maintain pressure in the reservoir. Similar to what the Saudi’s do in Ghawar.
With regard to the Texas rigs, it refers to all rigs. I am going to update that chart to just oil rigs. For the last 6 weeks there have only been 90 oil rigs in operation.
There was a pivot in markets early Friday morning. When The Bank of Japan decided it was no longer acceptable for their currency to appreciate against the dollar. One little comment moved the whole damn market. Dollar weakness might be ending early as other central banks make moves to curb currency appreciation.
Which is not good for oil price. You want the dollar to be trending down if your long oil.
HHH, Is this a similar action or something different ? Not clear for me . Please assist .
https://www.bloombergquint.com/markets/thailand-s-gold-plan-may-curb-baht-without-incurring-u-s-anger
Oil prices were expected to be very low in May at the end of April. This may have led to an inordinate number of well shut ins or choking of output (where shutin was not feasible) in May which wouls account for the large drop in output. The recovery of oil pricescto $40/b might lead to increased output in June.
Dennis
The weekly chart in the post shows a production increase in both June and July. It will be interesting to see what the EIA reports for July 31 output this coming Wednesday. Will they drop production for the last week of July in recognition that June and July were a bit optimistic.
Ovi,
My understanding is that weekly estimates for L48 are based on STEO projections, not sure how PSM figures in to the weekly estimate. My guess is that they will be around 11.0 to 11.1 Mb/d for US C+C output. Currently the centered 5 week average of the weekly estimate is about 11 Mb/d for June and July 2020, that is probably a pretty good estimate (within 2% or so) for June, July, and August in my opinion. I expect we will see a rebound of about 1 Mb/d from the currently reported May output level (from the PSM) in June. In addition, it is possible the May estimate might be revised higher in future months.
Explanation of weekly US crude oil estimate is explained on page 38 of document linked below
https://www.eia.gov/petroleum/supply/weekly/pdf/appendixb.pdf
Quoting the relevant section below:
Domestic Crude Oil Production (Tables 1 and 9)
EIA estimates weekly domestic crude oil production using a combination of short-term forecasts and the latest available production estimates from Alaska. The four data elements contributing to the estimate are:
• the most recent Short-Term Energy Outlook (STEO) model estimate (including interim estimates) for average daily production for the lower 48 States and the Federal Gulf of Mexico (GOM) from STEO Table 4a: http://www.eia.gov/forecasts/steo/data.cfm?type=tables
• daily production volumes delivered from the North Slope of Alaska to the Trans-Alaska Pipeline System (TAPS) (reported to EIA by the Alyeska Pipeline Service Company);
• daily volumes of natural gas plant liquids produced on the North Slope delivered to TAPS (reported to EIA by BP); and
• daily production for South Alaska estimated from monthly production reports (lagged by two months) from the Alaska Oil and Gas Conservation Commission (AOGCC).
Most of the uncertainty in the weekly estimate is associated with the STEO forecast for lower 48 and GOM production. For example, when lower 48 crude oil production is either increasing or decreasing rapidly, the accuracy of the estimate for any particular month is likely to be reduced. During tropical storms or hurricanes that affect Gulf of Mexico oil production, near real-time daily shut-in volumes reported by the Bureau of Safety and Environmental Enforcement (BSEE) are subtracted from the daily lower 48 estimate. See Previous STEO Forecasts at http://www.eia.gov/forecasts/steo/data.cfm?type=tables for comparisons of current and previous monthly STEO forecasts for lower 48 oil production and percent changes for STEO quarterly forecasts. The weekly estimates of domestic crude oil production are reviewed monthly when the Short-Term Energy Outlook (STEO) is released to identify differences with recent trends in survey-based domestic production reported in the Petroleum Supply Monthly (PSM) and other current data. If a large difference between the two series is observed, the weekly production estimate may be re-benchmarked on weeks when the STEO is released.
Oil in the $40 is pure speculation of a quick “V” recovery, but that is unlikely. Also China has been hoarding Oil as the likelihood of US enacting trade sanctions on China over Hong Kong, and threats to India and Taiwan. China has even managed to Tick off Russia, and Russia is ending arms sales to China.
Techguy,
On 7/27/2020 the spot price for WTI was $41.46 and the spot price has been over $40/bo every day since July 3. Futures prices have also mostly been over $40/bo lately.
As to future oil demand, that is difficult to predict. If prices remain low, output will fall, as there is not a lot of oil production that is profitable at under $40/bo.
Oil consumption has collapsed and will remain that way until this pandemic is resolved. Airtravel is down, large number of workers are now working from home and not commuting into work, & there are a lot of unemployed people. This is happening globally. The only reason why Oil bounced back up is increase demand from China as it hoards Oil expecting the US to slap on sanctions, & Speculation of a “V” recovery.
Tech Guy,
Agree there is an oversupply of oil for first half of 2020, the high stock levels for crude plus petro products will keep oil prices low (under $45/bo) and non-OPEC oil output is unlikely to recover to 2020Q1 levels in the second half of 2020, and probably not until the second half of 2021.
Much depends on getting the pandemic under control, Europe and East Asia seem to be getting things under control. US, Brazil, and India are examples of how not to address a pandemic. The US is an embarrassment in this regard.
” US, Brazil, and India are examples of how not to address a pandemic. The US is an embarrassment in this regard.”
That is putting it mildly.
And it should acknowledged, in a discussion thread such as this, that the nations oil demand and overall economic activity, has plummeted to such a degree in proportion to the failure of policies to handle the virus.
The self-proclaimed ‘wartime president’ would be court-martialed for dereliction of duty [‘the shameful failure to fulfill one’s obligations’], if that was a mechanism in our system.
It did not have to go this way.
Heterogeneous responses to the pandemic means its economic effects will last a long time. Travel will be restricted until the slowest response becomes effective. I anticipate lower than expected oil prices through 2021.
Schinzy,
What oil price do you expect? My guess is $40/bo for Brent until June 2021 (+/- $5/bo in 2020 US$).
Using the EIA’s tight oil production estimates by play and PSM data for L48 minus Federal GOM output, I have estimated US L48 (excluding GOM) conventional (does not include tight oil) C+C output from Jan 2017 to May 2020. A big drop of 1088 kb/d from March to May 2020 which is about 52% of March 2020 US L48 onshore conventional output. Shallow sand has suggested we might see some recovery in June or July, perhaps to roughly April’s level, it would be interesting to hear what other industry folks think.
Dennis. My guess relates to lower 48 conventional production only. I think June will rebound, in part, because some states do not require operators to report production monthly, and the data is therefore from crude purchasers. So sales, not actual production, is what is being reported.
Many conventional operators shut in around the negative price event of 4/20/20, and resumed production in mid-late May, 2020, when it became apparent prices were not likely to go negative again at contract expiry.
So, many conventional operators held onto mid-late May, 2020 production, and didn’t sell it till June. Also, some who shut in for that period also experienced a temporary flush of production at re-activation.
My guess is that July conventional US lower 48 will be lower than June. Again, just a guess.
Keep in mind that I am ONLY referring to conventional, which is now a small percentage of US total. As shale completions have dropped off a cliff, my guess is overall US production will continue to drop in the second half, probably starting this month, as lack of shale completions overcome re-activation of shut in wells.
Lastly, I can’t even guess on what GOM will do. You have a couple of experts who post about GOM, they are the ones to ask about that.
Things are still brutal in all of US E & P. XOM lost around $1.2 billion in US upstream in the 91 days of the second quarter. That is with no asset impairments. This proves the lie of $15 BO break even touted by XOM. Why would XOM have curtailed so much production?
XOM was considered a very conservative company at one time. That XOM is now boldly lying is a sign of something, I suspect.
Previously the lying was confined to the pure shale players. Now it seems most all of the public US E & P’s are fibbing.
On another topic, did you read that a zip code in Boulder Co., CO is responsible for the most per capita CO2 emissions of any zip code in the US? The same county that is the epicenter of the “leave it in the ground” campaign.
There are two sets of extremists trying to destroy the US oil and gas industry. One is generally very right wing, and lies about shale profitability. The other is very left wing and wants to eliminate all fossil fuels, while being in denial that it continues to use fossil fuels in countless ways, including in its high dollar EV’s.
I’m sure I’ll regret posting this.
Hi SS,
Is the study discussed in the article below the one you were thinking of? I think if you read the whole article carefully, you’ll get a fair and detailed discussion of the issues in the study…
https://www.denverpost.com/2020/07/20/rich-people-colorado-us-carbon-pollution/
I really have to question this; there must be something about this area that makes it an outlier and makes the data look worse than it is.
I happen to co-own a cabin in this zip code, right at the base of the mountain shown in the photos online (Mt. Meeker). There are no McMansions in this area that I can recall, and many residents struggle financially. There are lots of log cabins, many of them small (500 to 1000 square feet). Many of the cabins are vacation cabins that are occupied in the summer but not winter; that may give them a zero population and lower fuel use than the study assumes.
Thanks Shallow sand.
Seems the oil and gas industry did pretty well from 2008 to 2016, JB is pretty middle of the road. The far left of the DP is full of sound and fury, but will accomplish little.
At some point fossil fuels will deplete, I think. What is your plan for when that occurs?
A transition plan of some kind is needed in order for the economy to function when there is less less fossil fuel energy available, don’t you think?
SS , I read that XOM have develop new drilling tecnology where they save time, drilling cost and get more oil up from the tight rock. Do you think they will be able to significant reduce their break even price with this?. Guess they drill two longetudial wellbore similtanious.
Dennis
With rigs and frac spreads flat and March and older wells declining at close to 400 kb/d/mth, where will the increase in production come from in June. Will it come from reopening wells that have been shut down.
Can your model estimate how much of the 2 Mb/d May drop comes from shutting wells vs natural decline. Wondering if your model calculates the natural decline from all wells being open in April, you could then subtract it from the decline of 2 Mb/d to get an estimate for the loss due to wells being shut. The DPR says the May decline is close to 1.3 Mb/d. However I think that includes wells being shut.
Ovi,
Enno Peters has a vey nice model at link below, you should try it, it is free.
https://shaleprofile.com/us-tight-oil-gas-projection/
You did point out that the Bakken estimate for May 2020 by the EIA looks too high, by about 125 kb/d by my estimate, so if we account for that error (and assume it is the only one), then conventional output in May would be 125 kb/d higher than my estimate above (1139 kb/d). My guess is that much of the drop in the Bakken was also due to many wells being shut in, this may have occurred throughout the US tight oil basins for the same reasons that many conventional wells were shut in. Much of this shut in production may come back online in June and July.
Current projection for Permian, Williston, Eagle Ford, and Niobrara from shale profile. EIA has these 4 basins at 7366 kb/d in March 2020 and at 6124 kb/d in June 2020. The shale profile model has 7172 kb/d in March and 6895 kb/d in June.
Note that this projection assumed rig counts are unchanged from last week’s reported level through Dec 2022. Higher rig counts would result in higher output and lower rig counts lower output.
Model below includes output from all tight oil and shale gas basins.
Ovi,
DPR not as good an estimate as tight oil production estimates by play. Some of the tight oil decrease is due to wells being shut in, in North Dakota the number of producing wells fell by 2246 in the month of May (from 13746 to 11500, a decrease of 16%). We don’t have good data for other basins for May regarding producing wells.
The decrease in May from conventional was about 1126 kb/d, much of this may come back in June, some of the Bakken decrease might also rebound and some of the 863 kb/d decrease in tight oil (perhaps half) may be due to shutins and reduced flow rates (choking) due to low prices, so even if tight oil declines by 300 to 400 kb/d and conventional by 100 kb/d due to natural decline, this could be offset by shut in wells coming back online in both conventional and unconventional (perhaps up to 1500 kb/d increase then maybe a 450 kb/d decrease from natural decline with a net increase of roughly 1000 kb/d.) Then in July we might see decreases in US output continue, mostly from tight oil, if rig counts are unchanged (see shaleprofile.com model).
For Industry Participants
In the post above, I wrote
“With Rigs parked, Frac spreads down and contractors not working, prices must have dropped. So the question is “Has the cost of drilling a well dropped to the point that $40 WTI is the new breakeven price?””
Can anyone provide insight on the ? and how much the cost to drill and frac a well has dropped and what is a more current break even price for LTO oil”
Ovi. Look at how terrible the financials are for Nabors Industries (NBI) which is the largest US shale driller. For example, 6 of the 12 active rigs in ND are Nabors rigs.
Nabors has pretty much hemorrhaged cash since the late 2014 oil price crash. It just did a 1 for 50 reverse stock split. It and it’s competitors have been undercharging for its services for over six years, yet US shale E & P’s are still in bad shape despite getting services for below provider costs.
If the service firms are willing to keep losing even more money, break evens can continue to fall, of course. I’d say a big reason break evens have fallen since 2014 is that service firms have been willing to take on losses. That is what I see based on service firms financials.
Note both Schlumberger and Halliburton recently have stated they are greatly lessening US shale exposure.
Also note that shale exposure is now being deemed a weakness in analyzing the oil majors.
But the propaganda will continue thru the election.
SS
I wonder what roll CVX and XOM will play in exploiting their shale resources and setting the strategy. Will they look at all of their world assets and just pump from those that are least cost and leave the LTO in the ground or just pump at minimal levels. They have the resources and where with all to look at the world perspective to say oil will get back to $50 and $60 and then they will look more closely at LTO. As far as I can see, combined they currently produce about 6% of the LTO. However I have read their plans are to produce more in a few years. That is what they were saying about six months back,
What is critical going forward is that the US lets OPEC increase their production and share the demand increase that will be coming and share is the slowly increasing price. Will common sense prevail and will drillers realize that pumping all out doesn’t help anybody.
My idealistic world may show my ignorance of the real world US oil market.
Ovi,
I am not an oil industry person, but my analysis of the Permian basin suggests that for an 11 million dollar well (full cost including land and overhead) the discounted net revenue over the life of an average well will be equal to the well cost (I call this breakeven) when the well head price is $56/b (in 2020$)over the life of the well. I assume in this analysis that the average 2020 well has similar estimated ultimate recovery as the average 2018 well, which is 373 kb over a 185 month life (15.5 years). I include NGL and natural gas in the analysis assuming the average barrel of NGL sells at 25% of a barrel of crude and that natural gas sells for $1/MCF at the lease. In many cases the natural gas is flared because the operator has no pipeline space in which to ship their gas, in that case the breakeven price would be higher as there would be no natural gas revenue. In short, the $55/bo breakeven oil price (2020$) is likely too optimistic.
Dennis
My question is what would that $ 11 M cost be for that well today with so many rigs idled and frac crews idled? If the cost of that well today would be reduced to $8 M, that would equate to roughly $40 for LTO by scaling linearly.
I am wondering if any industry people could shed some light on the cost of renting a rig and crew today and how much lower it is than in January.
Ovi,
I think rig and frac crew rates were already cut to the bone since 2018, not much room for further rate reductions, that is what I gleaned from shallow sand’s comment. I assume average well costs are unlikely to fall by 27%, perhaps 5% at most, so perhaps well cost falls to $10.5 million (and in my opinion this would be optimistic). If we plug the $10.5 million well cost into the spreadsheet, breakeven oil price falls to $53.50/bo (2020$) for wellhead price. Using an assumption of $8 million for average well cost (an unrealistic assumption from my perspective) would result in a breakeven oil price of $43/bo (in 2020$) for wellhead oil price.
Have production costs come down in Canada since January?
covid19 issues would tend to increase costs I would think.
Dennis
I have no knowledge of costs of wells in Canada.
Below is a rig count chart. Canada has a very seasonal rig count due to the spring breakup when roads gets too soft. Good drilling in the summer months, then holidays for Xmas and NY, peaking in February. However this year there has been no summer bounce. Most of those rigs are in Alberta and Saskatchewan. Of the 11 on July 31, 6 are from Alberta and 4 from Saskatchewan.
I don’t know of costs but here are some brief lines from the latest Q1 for Crescent Point Energy. They operate in the Bakken and into the Saskatchewan Bakken.
– CFPS was $0.21 (Note no earnings, just cash flow)
– OPEX $11.89/BOE (I assume this does not include Capex since it is the next line)
– 2020 capex guidance trending closer to the lower end of the $650-700mm range. Crescent Point is pointing to more than 10% in well cost savings during 2020 relative to original expectations. Some of this is due to drilling days, but the majority is due to reconfiguration of completion design, particularly at Flat Lake and in North Dakota
– Slower activity levels and waterflood success, particularly in the Viewfield Bakken have reduced the expected corporate decline rate to 25-26% in 2021 from 30% in 2020.
– 25.0 mBOE/d of shut-in production volumes during the year. While most of this production is economic, there is a risk of further volatility in commodity prices due to industry production coming back on stream and the risk of further COVID-19-related demand risks.
– Is there any other company trying water flood to reduce decline?
Ovi,
I don’t think many (or perhaps any in US) are using waterflood in tight oil wells. I was looking at an EOG investor presentation and they claim their well costs are always decreasing, but they do not include land costs in their well cost estimates, I consider full costs. For the Permian this is probably about $9 million, and perhaps might fall by 5% to 8.5 million. It still doesn’t result in a profitable venture. EOG claims their wells are profitable at $30/b0 and $15/b NGL and $2.50/ MCF Natural Gas, but note two problems, they overstate their EUR for a “typical well” (more like a top 1% well) and the NGL is likely to sell for $8/b at a $30/bo price and Natural Gas hasn’t seen $2.50/MCF since Nov 2019, the average price from 2017 to 2019 was over $2.50/MCF for NYMEX spot, but lately there has been a glut in the US. Often the low prices stated in the news depend on unrealistic underlying assumptions. The devil is always in the details.
Slower activity levels and waterflood success, particularly in the Viewfield Bakken have reduced the expected corporate decline rate to 25-26% in 2021 from 30% in 2020.
I had no idea that waterflood was possible in any source rock reservoirs. The reason that they are source rock reservoirs is that the porosity and permeability are so tight that the oil cannot escape and migrate to reservoir rock, where waterflood is possible. Are you sure about this Ovi? What is the source of your information?
Ron,
I think its technically possible in fractured source rock but ofc it will add extra cost to running operations and also to capex and complexity of operation that combined with minimal returns in total well life production is probably reason its not used. Or in short, its not profitable.
Ron
The source was an oil analysts report on the CPG Q1 results. They have been experimenting with this since 2015. As you can see in the picture, the water flood well is drilled into fracked zone. This allows the the water to migrate into some of the fracked and connected oil deposits and increase the pressure.
I assume this is only done if there is a lake or a readily available source of water, which could be the case for the viewfield site in Saskatchewan.
https://www.researchgate.net/figure/Waterflooding-Pilot-Test-No-1-in-the-Viewfield-Bakken-by-Crescent-Point-Energy_fig1_266662504
Crescent Point has announced that it has finalized negotiations and successfully completed the unitization of its first waterflood unit in the Viewfield Bakken resource play.
https://www.shaleexperts.com/articles/Crescent-Point-Completes-First-Viewfield-Bakken-Waterflood_999915114
Thanks for the update Ovi. I had no idea any waterflooding was going on in the Bakken. I wonder if it will continue now that the Bakken has crashed?
Ron,
Note that this is the Canadian Bakken (I think.)
Dennis
Yes it is the Cdn Bakken. It stretches into Saskatchewan. CPG has three areas that use waterflood. I have to assume the water is close since Saskatchewan is full of lakes. They have three fields where they use water flood. See lakes near viewfield.
https://www.crescentpointenergy.com/operations/focus-areas
Thanks Ovi. Interesting stuff.
Difficult to find up to date info on tight oil in Canada. Best I could find was this
http://www.cer-rec.gc.ca/nrg/ntgrtd/mrkt/snpsht/2014/10-01tghtl-eng.html
In 2018 the IEA estimated Canadian tight oil output at about 400 kb/d (for 2017).
Do you know of any more recent estimates? From what I can see at the CER, they don’t seem to break out tight oil production.
Dennis
There are tight oil plays in Alberta, Saskatchewan, BC and Manitoba. Here is a CER link. A bit out of date but has some interesting info.
https://www.cer-rec.gc.ca/nrg/sttstc/crdlndptrlmprdct/rprt/tghtdvlpmntwcsb2011/tghtdvlpmntwcsb2011-eng.html#nnx2
Thanks Ovi.
I saw that, but was looking for something more recent, I think that doc is about 9 years old.
Ovi,
Another factor that occurs when the rate of drilling decreases is that producers drill only their best prospects, so called high grading. In that case the average well completed may have higher than average estimated ultimate recovery (higher productivity wells are completed). This has been ongoing since 2015, so a lot of the most prospective areas in many basins (Williston and Eagle Ford) are fully drilled, the main basin where this might not be the case is the Permian.
It is instructive to look at onshore horizontal oil rigs operating in the US compared with horizontal oil rigs in the Permian basin. The chart below has the centered 5 week averages of onshore horizontal oil rigs for all of the US and Permian basin, with the percentage of the US total in the Permian Basin. From Jan 2019 to July 2020 the percentage of US onshore horizontal oil rigs in the Permian basin has increased from 56.4% to 77.6%. Mike Shellman has recently (in past few months) suggested $11 million for Permian well cost.
Here is a recent post by Mr. Shellman
https://www.oilystuffblog.com/single-post/2020/08/01/The-Responsiblity-of-Influence
also a little about Mr. Shellman at link below, the man knows his stuff, no doubt in my mind.
https://www.oilystuffblog.com/about
I have learned a lot from Mr Shellman, his analysis in the post above is among the best I have seen on shale well economics.
I forgot the chart for percentage of Permian horizontal rigs.
Corrrection, Mr Shellman recently suggested $9 million for full well cost for a Permian basin well on June 23, 2020, see
https://www.oilystuffblog.com/single-post/2020/06/23/Why-Are-There-ANY-Rigs-Running-In-the-Permian-Basin-
For a $9 million dollar well the breakeven oil price is about $47.50 at the well head, using a 42 month payout rule would require a higher price of $53/bo. Pros like Mike use a 36 month rule for the well to “pay out”. For the average 2018 Permian well, the well pays out in 36 months at a well head oil price of $55/bo. This assumes natural gas is not flared.
For a producer that flares all produced natural gas, this eliminates revenue from both NGL and natural gas. For that scenario, 42 month payout occurs at a wellhead oil price of $60/bo and 36 month payout at $62/bo at the well head.
In any case, not many Permian wells are profitable at a wellhead oil price of $38/bo, so as Mike has asked, why are so many horizontal oil rigs still turning in the Permian basin (122 horizontal oil rigs as of July 31, 2020)?
I do not have a good answer.
Offshore Driller Noble Files for Bankruptcy
https://247wallst.com/energy-business/2020/07/31/offshore-driller-noble-files-for-bankruptcy/
BP begins its exit from the oil industry:
“Its shares rose more than 7% on Tuesday after BP unveiled earlier than expected a plan to reduce its oil and gas output by 40% and boost investments in renewable energy, such as wind and solar, over the next decade.”
https://www.reuters.com/article/us-bp-results/bp-halves-dividend-after-record-loss-speeds-up-reinvention-idUSKCN2500LX
“Its shares rose more than 7% on Tuesday after BP unveiled earlier than expected a plan to reduce its oil and gas output by 40% and boost investments in renewable energy,”..
So, is the drop in expected oil and gas output an intentional policy of the worlds 7th biggest major oil company, or more of an acknowledgement of their resource depletion?
Another link: BP will slash oil production by 40% and pour billions into green energy
The company expects demand for fossil fuels to fall by 75% over the next 30 years if the increase in global temperatures is limited to 1.5 degrees celsius, or by 50% if warming is less than 2 degrees, BP head of strategy Giulia Chierchia told investors. BP said its oil and gas production will fall by at least one million barrels a day by 2030, a 40% reduction on 2019 levels. The bulk of its annual capital expenditure over the next five years will, however, still be in oil and gas.
BP’s plan to pivot away from oil after a century of exploration will involve major investments into bioenergy, hydrogen and carbon capture and storage.
I think they will just let their current production go into natural decline but do little to no exploration for new petroleum resources. Anyway, that’s the gist I get from the articles.
IIRC, BP exited Solar Panel manufacturing about a decade ago to focus on Oil & Gas. I doubt BP will return to making solar panels. As far as bioenergy & hydrogen: Both needs fossil fuel inputs to work.
We’re probably going to be in a long term economic depression as the world struggles from its debt binge for the past 20+ years and pandemic that probably will be a problem for years.
Tech guy. BP has not announced any intention to become a PV manufacturer. Their solar investments will be channeled through project developers such as Lightsource BP
https://www.lightsourcebp.com/us/
example of one such project in Texas-
https://www.lightsourcebp.com/us/projects/impact-solar/
hydrogen…needs fossil fuel inputs to work.
How’s that?
Please respond on the non-petroleum post – I’ll keep an eye out for it…
They say that they’re reducing their dividend in large part due to a “reset” of price expectations. That doesn’t seem consistent with an expectation of a dramatic decline in production due to depletion.
U.S. Oil Production Dropped Massively In May, And Recovery Not In Sight
Summary
EIA 914 came out with a report indicating US oil production dropped massively in May, down to ~10 mb/d.
June US oil production averaged ~10.5 mb/d. July US oil production is averaging ~11.29 mb/d so far. August US oil production likely to average ~11.3 mb/d.
By year-end, US oil production is expected to finish between ~10.3 to ~10.7 mb/d.
The trajectory for year-end depends in part on how fast oil prices recover by Q4. If WTI is above $50/bbl by October, then we expect US oil production to be closer to ~10.7 mb/d. If oil prices are below $50/bbl by October, then US oil production will be closer to ~10.3 mb/d.
Following the collapse in drilling activity, US shale growth will take a permanent hit, while growth won’t resume until 2022.
You don’t tend to see a company’s price increase when it cuts its dividend. Before such an announcement the yield is defined by people that defined the price to be such and such. That yield would have built into it an assessment of all sorts of risks, not the least of which would be piling on some more debt to pay that dividend.
Now, there’s no reason for any of this to make sense, of course. But generally speaking if the yield has been determined to be appropriate last week and the dividend is cut, then in order to maintain the yield where it was you need a price reduction, not a price increase.
I think this is a surprise. The market was not expecting a cut. They were expecting debt to defend the dividend. The absence of debt incurred has been viewed positively.
To presume that you got a 7% move on the basis of expectations 30 and 40 years out, for bizarre expected revenue sources like biomass and hydrogen, nah. People were just glad to see debt will not defend the dividend.
Don’t know why they should be. They could borrow at 0 or less percent.
They could do what XOM is doing and eliminate employee retirement benefits to protect the dividend.
Doesn’t sound like something a company with $15 BO break even in the Permian Basin would be doing.
Shallow Sand,
I had forgotten about the $15/bo claim, for others see link below (the claim was made in March 2019).
https://www.dallasnews.com/business/energy/2019/03/14/exxon-thinks-it-can-lower-its-permian-drilling-costs-to-15-a-barrel/
Also Mike Shellman commented on this at Oil Price (page linked below), Mike’s comment is about the 10th on page 1 (as usual Mike is spot on.)
https://community.oilprice.com/topic/5274-exxon-aims-for-15-a-barrel-costs-in-giant-permian-operation/
UK still operating under EU rules. They don’t allow much pension gutting.
Says it all really.
https://www.offshore-energy.biz/bp-to-cut-fossil-fuels-output-by-40-per-cent-by-2030/
They already have reduced production from 2019 levels. If the virus fades, they can ramp it back up and remain truthful.
The EIA has just published its weekly numbers and it appears that the weekly has made a small concession to the May PSM 10,001 kb/d production number. This weeks US production is estimated to be down by 100 kb/d.
Looking at Dennis’ chart above, it looks likely that the bounce back of 1000 kb/d in June from May will be due to bringing shut wells back online.
Ovi,
The basis for the weekly L48 estimate is the STEO, the 4 week average for July is about 10.6 Mb/d for L48, the STEO has L48 at 10.95 Mb/d for July and 10.85 Mb/d for August, Alaska is expected to be 410 kb/d in July and 440 kb/d in Aug, the weekly reports use actual estimates from Alaska. On August 11, the STEO will revise their expectations, probably lower for May, June and July 2020. Keep in mind the weekly data is never revised, they just base it on the information they have, all they have to go on is the STEO, tight estimates by play, and past estimates in the PSM, for August, the STEO is the only game in town.
Ovi,
Comment at link below covers source for weekly crude estimate
http://peakoilbarrel.com/us-may-production-plunges-2mb-d/#comment-706706
In the DPR, the completion of June is way down. Now, there is the FRAC spread report that was higher in June compared to May. I don’t understand exactly this report. I’ve no confidence on what the weekly report estimate, especially in non-BAU situations.
I’m pretty sure that the wells that were shut in in May will be reopen in June. But I’m not sure how high production will get.
Today, the rig count went a little bit down again. It’s been 4 months of a fall of drilling rigs, so US oil production is, IMHO, gonna fall lower in July and August from the June level. I don’t expect any recovery at least until the end of the year. In 2016, it took 5 months after the completion began to pick up for the production to go up. The situation now is anyway different.
Tita
You wrote: “I’m pretty sure that the wells that were shut in in May will be reopen in June. But I’m not sure how high production will get.”
I agree that many wells were shut in and that is why there should be a rebound in June when they reopen. Makes sense but being wrong is also possible.
I’m pretty sure that the wells that were shut in in May will be reopen in June.
Do you believe that the reason they shut down in May will not be a factor in June? Why?
Ron,
Oil prices were lower in April and May, so wells were shut in, oil prices rose in June and July to the point where reopening the shut in wells made economic sense. A lot of conventional output was shut in due to the negative prices in April which caused fear that producers might have to pay for oil “sold” to refiners. After the April debacle, many stripper well producers shut in their wells for the month of May and brought wells back online in June when the oil market had stabilized (with prices at more “normal” levels).
I think Tita has this right, there will be a brief bump in output in June, (due to shut in wells being brought back online) and then US output will continue to decline as the completion rate in tight oil plays will not be high enough to offset the decline in legacy tight oil output.
Ron
I think that consumption went up in May and further up in June, despite being depressed from usual levels. Prices were also up from depressed levels.
I also think that for operators, reopening wells that were shut in is not a costly operation. IMHO, operators would do anything to get a stream of cash.
What happened in May was the consequence of the mayhem in Futures in the end of April…
In the history of US oil production, a 2 Mb/d drop MoM never happened. The biggest was in May 1952 due to a strike (-1.3 Mb/d), followed by 2008 and 2005 because of hurricanes (around -1 Mb/d). Any big drop is usually followed by a rebound. I expect a 500kb/d to 1Mb/d increase in June.
As OVI said, I may be completely wrong. It’s just guessing from my part. I try to follow US production from history data.
LTO is cash flow negative. Always has been. The rig count went down because investors stopped putting money in. Profitability doesn’t matter, if investors put in money, it will be spent extracting oil. The rig count going back up is contingent on investors coming back in. We will see.
Schinzy,
Not quite correct that tight oil has always been cash negative. Depends on prices over period in question. Currently tight oil is cash flow negative due to low oil prices. If Brent oil prices rise to $60/b, that is no longer the case. Also keep in mind that al lot of the recent drop in US output (from March to May 2020) was due to wells being shut in or choked back. A well that already has sunk costs will be able to cover OPEX even at current prices so completed wells will continue producing. The model from shale profile that I have presented elsewhere on this thread shows what happens to tight oil output if the rig count remains unchanged and the completion rate per rig also remains unchanged from current levels, basically output drops by another 1000 kb/d by Dec 2020 from May 2020 levels, but this is offset by an increase from conventional production of about the same amount (1000 kb/d). The net outcome is that Dec 2020 output for the US will be about the same as May 2020.
LTO extraction has always been cash flow negative. That does not imply that the wells drilled were all unprofitable, that means that companies spent more than they earned. It is possible to remain cash flow negative for a long time while making profitable investments. The reason extraction rates rose so quickly is that investors kept on throwing money at the venture. Some may have made money. What I am saying is that without investors, the number of rigs will not rise quickly. If LTO companies have to self finance, extraction rates will not rise as quickly as they fell.
Schinzy,
For some firms that might be true. Check 2019 cashflow statement for EOG at link below (see 10 K).
https://investors.eogresources.com/sec-filings/default.aspx
When oil prices have been low, then most of the tight oil producers have indeed been cash flow negative. At Brent oil prices over $60/bo, most of the well run tight oil firms have been cash flow positive.
Thanks for all the good information and comments.
It is possible to convert Oil to plastics. (pyrolysis) But is IT economical viable? And how is the EROEI? Any thoughts? Thanks. Be well.
I don’t think you get any energy return from plastic. Unless you set it on fire.
What is IT?
Plastics are made from organic matter. You can transform plastic into synthesis gas by heating the plastic under pre-stoichiometric (starved air) conditions. This causes chemical reactions such as pyrolysis, which turn the plastic into gas. You can then burn the synthesis gas and put the hot flue gases though a boiler to make steam/electricity, or directly burn the synthesis gas in an internal combustion engine (a modified natural gas engine). The energy output is quite low but it works although it’s difficult to commercialize this process. In case you’re wondering, I work for an engineering firm that has researched and tried to commercialize this process.
And I think plastics are made from oil or natural gas.
There are so many types of polyolefins. Polyethylene ( C2H4 ) is the same as Candle or bees wax. Burns clean with no ash.
IT should read “it”. Damn autocorrection.
And I was meant to write plastics to oil, not opposite. Sorry I got this all wrong…
https://oilprice.com/Latest-Energy-News/World-News/Continental-Resources-Restarts-Curtailed-Oil-Production.html
Further up, Dennis asked, “Have production costs come down in Canada since January?” While I don’t know the answer to that question, I can provide some info reported yesterday by Canada’s biggest oil producer, Canadian Natural Resources (Ticker CNQ).
In the report, they provide some info that many of you would understand better than me. Here is my understanding. For C C:
Realized sales price, net of transportation $Cdn 22.03
Royalties 2.34
Production expense 13.71
Netback 5.98
I also have access to an oil analysts report on CNQ which shows that the OPEX varies from $10/b to $17/b. So maybe the 13.71 is an average.
Their original Capex, Pre pandemic was $4.05 B. Production is 921 kb/d crude and 1,165 kboe/d. Using 1000 kb/d, gives total production 365 Mbbls. So average Capex per barrel is $11.10/b.
CF from OPS = 365,000,000 x 5.98 =$2.18 B vs the report’s number of $1.73 B. Close but I must be missing some expenses.
Total average cost per barrel is 13.71 plus 11.10 = 24.81.
They continue to pay a dividend of $1.70 per share.
I will send the analysts report to Dennis to complement the CNQ Q2 report. If you want it request it from Dennis.
https://www.cnrl.com/upload/report/132/02/q120-interim.pdf
New non-petroleum post is up at:
http://peakoilbarrel.com/eias-electric-power-monthly-july-2020-edition-with-data-for-may/
If oil prices are back to profitable levels then why is the rig count still falling?
U.S. Oil Rig Count Falls To Lowest Level Since 2009
The number of oil rigs slipped for the week by 4 rigs, according to Baker Hughes data, bringing the total to 176, compared to the 764 active oil rigs this time last year. Two of those four rigs lost this week were in the Permian Basin.
The total number of active gas rigs in the United States stayed the same at 69 total rigs. This compares to 169 rigs a year ago.
To compare active rigs with supply figures, the EIA’s estimate for oil production in the United States fell for the week ending July 31—the last week for which there is data, at 11 million barrels of oil per day. Oil production in the United States is 2.1 million bpd less than its all-time high reached earlier this year.
Just how much of that 2.1 million bpd will be back by the ene of the year? Any guesses?
Ron
Attached is the detailed state oil rig count for 2020 for the last 5 weeks. The only change since last week is New Mexico dropped 4 oil rigs and added 1 gas rig. It seems the only place where drilling activity is changing is in New Mexico and that is DOWN.
Gas Rigs
see
http://peakoilbarrel.com/us-may-production-plunges-2mb-d/#comment-706841
tight oil output falls by about 2 Mb/d by Dec 2020 with no further change in rig counts, if we assume conventional output changes little (as decline rate are lower and especially for stripper wells) and out GOM experts suggest little change in GOM output (new projects will offset declines). So very little of the 2 Mb/d will be back by the end of 2020.
Ron,
It is not clear that the oil price has risen enough to make new tight oil wells profitable. That would require a wellhead price in the Permian basin of at least $50/b, which is equivalent to a Brent oil price of at least $55/bo. For stripper wells already producing in March and temporarily shut in due to low oil prices in April and May, those wells may be restarted bringing back about 1000 kb/d if 100% of them are restarted by June 1 (which is unlikely), a more realistic estimate might be 750 kb/d. Also some tight oil wells may have been shut in or choked back due to low prices in April and May and some of that output might also return in June, we might see 300 to 400 kb/d from those wells in addition to the shut in conventional production. So the total bump in June might be as much as 1100 kb/d for all US C+C output from the recent PSM estimate for May 2020.
Dennis/Ron
The STEO is projecting June production to be 9.39 Mb/d. See Below
Permian horizontal oil rigs on left axis and % of US horizontal oil rigs in Permian on right axis.
Below is part of an article from Bloomberg
Shale Job Losses Accelerating and the Worst May Be Yet to Come
By David Wethe
August 10, 2020, 12:00 AM EDT
Roughneck job cuts accelerated in July and the outlook may worsen as new Covid-19 cases stifle economic activity, according to the Petroleum Equipment and Services Association.
The U.S. oilfield-services sector shed 9,344 jobs last month, a 43% increase from June’s losses, the industry-funded trade group said in a report released Monday. That pushed the industry’s total job casualties since the pandemic emerged to 99,253.
Texas, Louisiana, Oklahoma, Colorado and New Mexico were the hardest-hit regions for oilfield job cuts, according to the report, which crunched U.S. Bureau of Labor Statistics data with help from the University of Houston’s Hobby School of Public Affairs. Oilfield employment in American fields hasn’t been this low since March 2017.
The August STEO is out and it is projecting a 400 kb/d downward revision to the May PSM US production of 10, 001 kb/d and a further drop in June.
Ovi,
Based on frac spread counts and information provided by shallow sand, I think the STEO will be wrong for June 2020. Frac spread counts have also been flat since May so completion rate for tight oil plays may not change much for June vs May, but the biggest thing the STEO is missing is the huge drop in conventional output in April and May of 1100 kb/d, and I expect much of this output will come back online in June along with output from shut in tight oil producers (probably another 500 kb/d), an increase in US output of 500 to 1000 kb/d in June is more likely than a drop in output. Sometimes the STEO gets revised lower (as the cases you have chosen) but in many cases the estimate gets revised higher as well, I expect we will see that in Sept.
Frac spread count from Primary vision.
Dennis
I guess we will have to wait till next month to see if US June output ends up above or below 10,000 kb/d.
Ovi,
Yes we will find out on Aug 31, the tight oil estimate is down by 125 kb/d in June, but it is likely conventional output might rise by more than tight oil decreases. Only a couple weeks to find out.
Dennis. I was surprised that North Dakota only slightly rose from May to June. See shaleprofile.com.
Also, looking at Montana preliminary data, there is reported just 33,605 BOPD for June. I am not sure if that is complete.
I also follow Arkansas data some. Again, not sure how complete it is, but wonder if it is more accurate than what EIA has for them. Arkansas has high cost stripper production and what they are reporting for April and May seems more likely than what EIA has reported. Arkansas is showing just 5K BOPD for May and 6K BOPD for June.
Another good proxy for conventional wells that has fairly up to date data is Utah. Utah has been holding around 4,800 active oil wells. That dropped to 4,585 in April and 3,398 in May. June should come out before long. Utah tends to have lower per BO LOE than most of the “small” states.
Also, I am beginning to sense there is less liquidity floating around in oil and gas than at anytime in recent memory. I think even the larger public companies are becoming strapped. How else would you interpret XOM ending it’s employer match for its employees defined contribution plan.
Things are really bad, worse than 1998-99, although I still have some old-timers arguing with me about that. But those arguing with me sold out awhile ago and retired, so they really aren’t experiencing this hammering.
Add in the very negative view of the industry, worst I have ever seen. A major reason BP is changing course is they cannot find enough talent willing to work for a company strictly in the fossil fuel business.
I really don’t know that we will see a big production snapback in June. I thought ND would be better.
Hi shallow sand,
Do you know why Utah has relatively low BO LOE?
Two of Utah’s crudes go under the names black wax and yellow wax, which I’ve long found intriguing.
I’m just stating anecdotally what I have seen, nothing scientific regarding Utah.
It’s a function of BOPD per well. The wells average about 20 BOPD. There had been about 4,800 /- active oil wells in the state prior to the April crash.
In most states stripper wells average under 5 BOPD. Some states are under 1 BOPD per well. Kansas averaged 1.65 BOPD per oil well in 2019, for example.
Utah wells are likely deeper than average also, so total expenses per well are probably higher, but on a per BO basis, I think they do better. Again, just based on JIB statements for some production I have seen for sale.
Synapsid.
Just from my reading on the Internet, the waxy crude solidifies at temperatures below 100 F. It is just about all truck hauled to refineries near Salt Lake City.
The posted price I find is around $32, and I have also read some past articles about it which also indicate that it has historically traded at a significant discount to WTI.
During a 1963 cold snap, the oil solidified in a pipeline, causing about 5 miles to be dug up and completely replaced.
Tesoro proposed a heated pipeline when oil prices were high, that would have cost in the billions. That was abandoned in 2015. Marathon Petroleum now owns that refinery, which is the largest in Utah, capacity stated at 61K BOPD.
Also, many housing developments have come to the nuisance of the refineries as Salt Lake City has grown. The refineries have been there since before 1960. An explosion at one of the small refineries in 2009 resulted in a lot of property damage, but no injuries.
This is just what I have read and I’d welcome info from people who have direct knowledge of Utah oil production (or any other state/field).
Hi shallow sand.
Thanks, and I’d like to hear from people familiar with Utah’s oil patch too.
Some of my favorite country in the world out there. I haven’t been there for a couple of decades and I think it’d break my heart to see it now.
Synapsid.
I have only been to Salt Lake City’s airport.
I have been to the SW Utah, to the Parks. Really enjoyed it.
Shallow sand,
Thanks for the insight. My guess is based on the data that someone shared with me for Illinois. Conventional US output fell by 1100 kb/d in April and May, much of that may have been stripper well output that was shut in, I am guessing at least half of that comes back. I was also surprised North Dakota didn’t see more of a bump in output, some of the problem there may be transport cost with various pipeline issues etc, keeping output shut down.
I would certainly agree with the notion that completion rates for new wells will be very low in June, so perhaps on balance output may be flat in June, I was expecting perhaps a 500 kb/d increase in US C+C output in June 2020 based on your earlier comment, maybe the newer data points to flat output. We will see in about 17 days whet the EIA estimate is, but when things are changing, the EIA estimates miss the changes in smaller producers (only the big companies are surveyed) so EIA estimates may miss the mark by more than usual and we will have to wait for state data to become more complete in 12 to 18 months.
Dennis. It’s hard to say. I’m just throwing out some smaller state data as it’s being released, and some may not be complete.
Even the slightest move towards recovery or things getting better is dollar positive. That is how the market will trade it. The dollar will be your risk on trade instead of risk off. People that are long gold and silver or even bitcoin are going to find that out. I think under right scenario oil and the dollar can both go up at same time at least for a period of time. Particularly when no interest rate hikes or monetary tightening are on the table. In a recovery US assets will soak up the worlds liquidity pushing dollar higher and asset prices higher. In a recovery oil demand will return and higher prices will also return.
In early June there were articles saying that China has elevated its consumption to a level essentially equal to December 2019.
In mid-july there emerged projections of year-over-year consumption for the second half of this year to be flat. That’s only for the second half. Their consumption in the first half was sharply lower than 2019.
The EIA has just released their weekly estimate and it does reflect what was published in the STEO yesterday. The STEO estimates that August output will average 10,600 kb/d. See STEO chart two comments above. Today’s weekly estimate is 10,700 kb/d.
Also today, the EIA posted the notice below regarding the need to re-benchmark their weekly estimate.
So we are still left with the question, “What are the information sources that the STEO accesses to make their estimates?” My guess at this point are frac Spread schedules from Frackers and drilling info which they may access under some confidentiality agreement.
EIA Notice: “Crude Oil Production Re-benchmarking Notice: When we release the Short-Term Energy Outlook (STEO) each month, the weekly estimates of domestic crude oil production are reviewed to identify any differences between recent trends in survey-based domestic production reported in the Petroleum Supply Monthly and other current data. If we find a large difference between the two series, we may re-benchmark the weekly production estimate on weeks when we release STEO. This week’s domestic crude oil production estimate incorporates a re-benchmarking that lowered estimated volumes by 304,000 barrels per day, which is about 3.0% of this week’s estimated production total.”
An inflection point for NG?
https://seekingalpha.com/article/4368026-ung-rally-in-gas-arrived?utm_medium=email&utm_source=seeking_alpha&mail_subject=ung-ung-the-rally-in-gas-has-arrived&utm_campaign=rta-stock-article&utm_content=link-2