The EIA’s, on June 30th, published its Petroleum Supply Monthly. I Think their numbers are just way too high. I compared them with the EIA’s Weekly Petroleum Status Report. The chart below shows the Results.
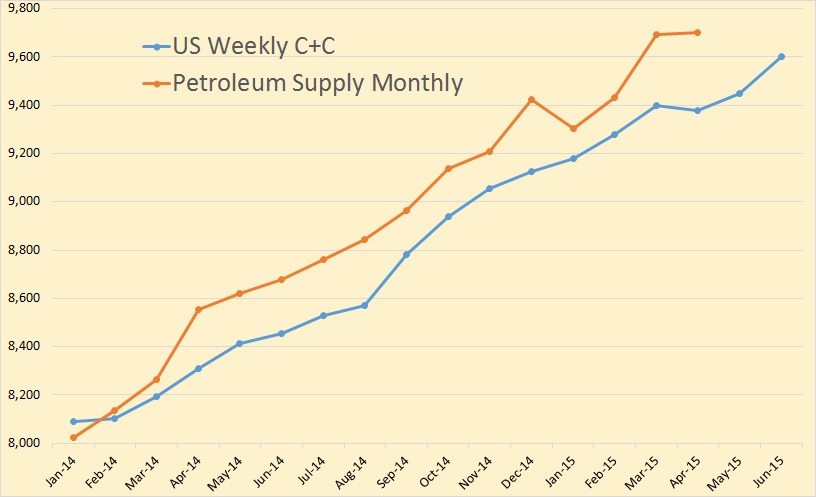
I averaged the weekly numbers and converted them to monthly data. They were pretty close for the first three months of 2014 but then they begin to diverge. Of course they were much closer earlier but in the Petroleum Supply Monthly has, over several months, been revised upward. The Weekly Petroleum Status Report is never revised.
In April, the Petroleum Supply Monthly shows US C+C production 322,000 barrels per day above the weekly average of the Weekly Petroleum Status Report.
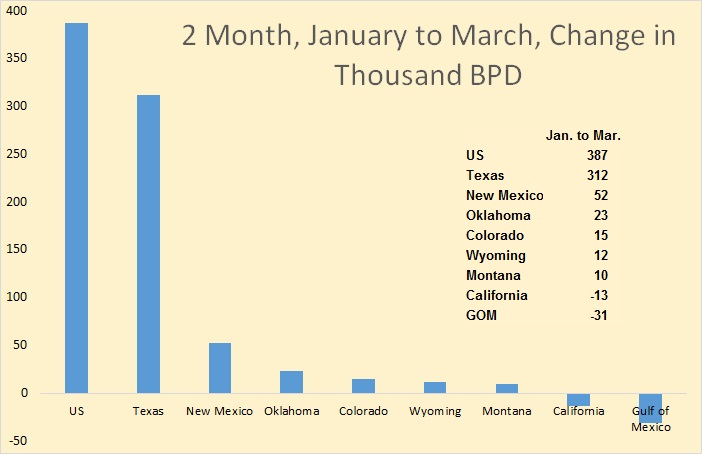
The Petroleum Supply Monthly shows US production increased 387,000 barrels per day in the two months January to March. That is an increase when oil rigs were being stacked by the dozens. They show Texas up 312,000 over those two months and New Mexico up 52,000 bpd. That means they think the Permian, which is mostly in Texas but partly in New Mexico, was really booming during those two months.
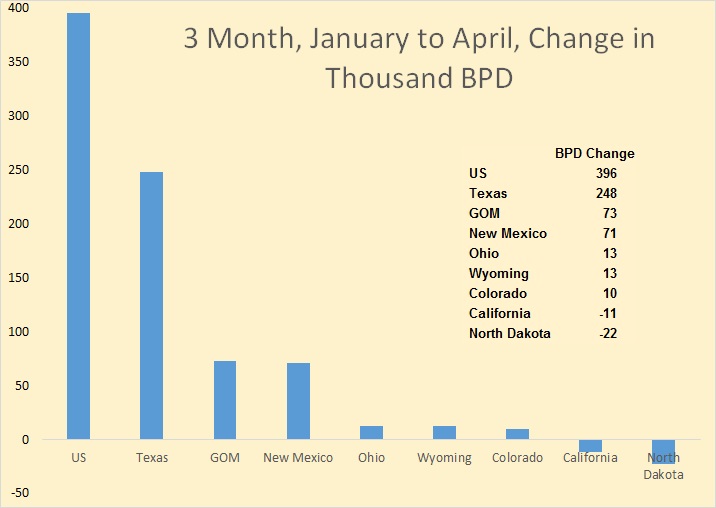
The EIA has crude production continuing to climb during April, up 396,000 bpd January to April. The Gulf of Mexico, which had been down slightly the previous three months, was shown up 104,000 in April, giving them a gain of 71,000 bpd over the three months.
But obviously Texas is where all the action is.
Dr. Dean Fantazzini, Moscow School of Economics, Moscow State University, has worked out an algorithm, described here, where, based on the data supplied by the RRC, he is able to predict, with some accuracy, what the final data will show.
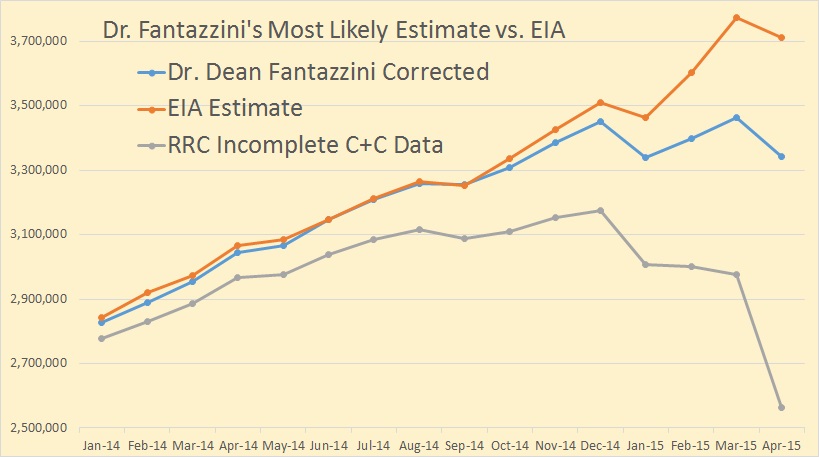
Dr. Fantazzini publishes three estimates, High, Low and Corrected or what I call “Most Likely” which is in between his high and low estimates. I am here using only his corrected data. As you can see up through September 2014, he and the EIA were extremely close. But then they began to diverge.
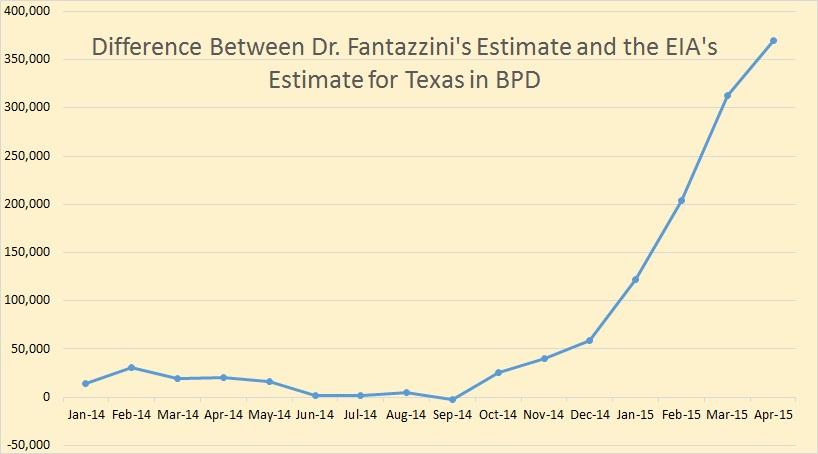
The difference between the two estimates widens every month for seven months reaching almost 370,000 barrels per day in April.
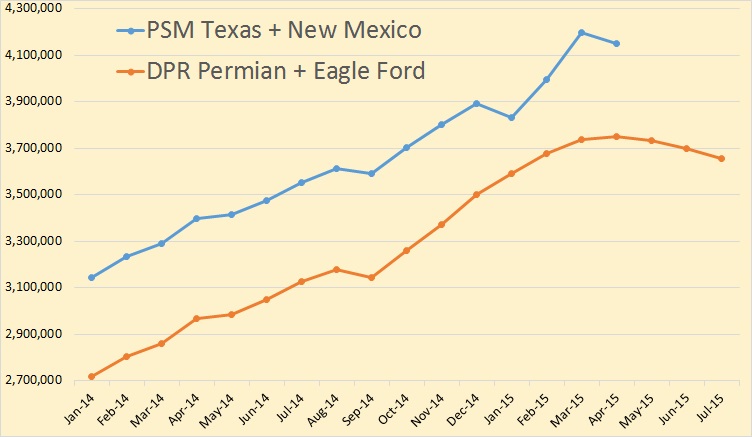
The Drilling Productivity Report has the Permian + Eagle Ford peaking in April.
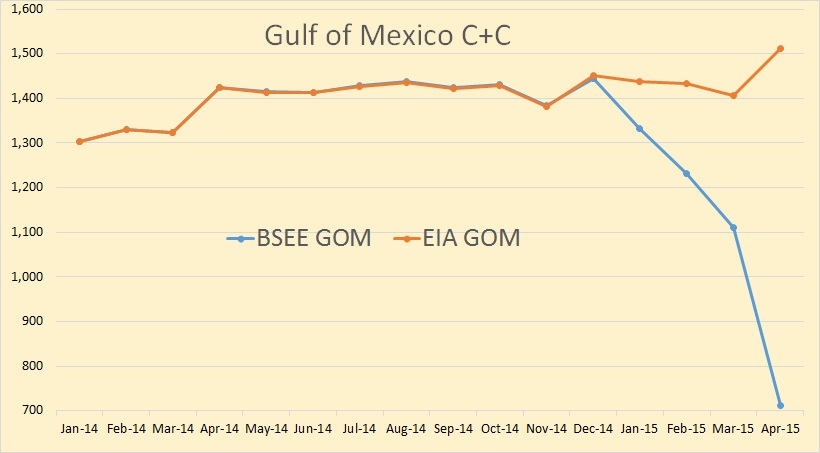
The EIA gets their Gulf of Mexico data from the US Bureau of Safety and Environmental Enforcement. The BSEE, like Texas, does not get their data on time. But after four months all the data is pretty much in. But here the April data is apparently only about half complete.
The EIA likely has the January, February and March GOM numbers estimated pretty close. But I think the 104,000 barrel per day increase they show in April is unlikely.
In Conclusion, I believe that the EIA’s crude oil production numbers since January are too high. And they get a little more out of kilter each month. However the EIA revises the Petroleum Supply Monthly every month. So the numbers will be revised, little by little, every month, until they get them them right.
___________________________________________________________
Note 1: Due to the long holiday weekend and a dearth of data this time of the month, this will likely be my last post until late Tuesday afternoon or Tuesday evening after the EIA’s Short Term Energy Outlook comes out. I am sure I can hammer out something from that.
Note 2: If you would like to receive an email notice when I publish a new post, then email me at DarwinianOne at gmail.com .
509 responses to “The EIA’s Questionable Numbers”
Great read. When do you believe the actual data will be corrected?
They revise the numbers every month. So they revise the numbers piecemeal, little by little every month until they finally reflect what is reported to them by the states. The revisions will be so gradual few will notice.
The numbers are so wrong because many states, not just Texas, don’t report their final numbers until many months have passed. But eventually they get the numbers correct.
The WSJ has discovered “Net Export Math.”
WSJ: As Saudis Keep Pumping, Thirst for Domestic Oil Swells
Kingdom is poised to break records for crude output, but its ravenous energy needs threaten its ability to ramp up exports
http://www.wsj.com/articles/as-saudis-keep-pumping-thirst-for-domestic-oil-swells-1435786552
Link to my comment on BP + EIA data on Saudi Arabia’s net exports:
http://peakoilbarrel.com/bakken-april-production-data/comment-page-1/#comment-521843
Whilst the Saudi population in common with the rest of the middle east has grown substantially and its consumption with it in recent years I sometimes wonder if we are dealing with a case of Muhammad Saeed al-Sahhaf aka Baghdad Bob or Comical Ali.
What I mean by that is that hyping their production level is such an important part of their bragging rights that they are willing to do so even when it is clearly not in their interest. Well before the US shale boom they were apt to do this even when logic would dictate that they talk down their production (obviously the quota system also plays a significant role). When their production finally nose dives I think they will claim the same or higher production while increasing their consumption estimates more and more in fact this will likely be the message that all the last great net oil exporters will give us towards the end.
Interesting admission by Khalid al-Falih:
Reuters (January, 2015): Saudi Aramco to renegotiate some contracts on low oil price -CEO
http://www.reuters.com/article/2015/01/27/saudi-oil-aramco-idUSL6N0V60Z320150127
The politics of oil prices are complicated indeed.
While the Saudis have plenty of reasons to want to put the screws to the Russians they can’t trust the rest of OPEC to honor the cartel’s production sharing decisions.
But it appears they are willing to cut a deal with the Russians who do have at least ONE thing in common with them. They both want a higher price for their oil.
http://finance.yahoo.com/news/saudi-arabia-leaving-u-behind-215428719.html;_ylt=AwrC0F9wMJVVCHUA4SyTmYlQ;_ylu=X3oDMTByMDgyYjJiBGNvbG8DYmYxBHBvcwMyBHZ0aWQDBHNlYwNzYw–
By the way ” our” Jeff Brown and host Ron ought to be on the talking head shows. The fact that they aren’t proves that the MSM is not really competent , perhaps by choice, when it comes to energy.
I am an hopeless amateur when it comes to oil compared to the pros who hang out here but to the best of my knowledge the Russians have until recently always done what they promised in terms of delivering oil and gas.
I predict that if they cut a deal with the Saudis to cut production they will honor it.
Jeffrey, are the other Gulf OPEC states similar to KSA, in that their exported oil is also falling due to rising internal consumption?
I can shoot you the data base for the (2005) Top 33 net exporters. It’s only updated through 2013 (still waiting on EIA consumption data), and there have been some revisions since we compiled the data base.
My email: westexas AT aol Dot com.
As I have repeatedly pointed out, what almost everyone is missing is the enormous difference between rates of change in production and CNE (Cumulative Net Exports) depletion*. I estimate that we may have already burned through around 30% of post-2005 Global CNE.
*As combined production from the Six County Case History increased by 2% from 1995 to 1999, they had already shipped 54% of post-1995 CNE (major net exporters, excluding China, that hit or approached zero net exports from 1980 to 2010).
the decline in net exports was largely offset by the drop in US net imports
The decline in US net imports certainly affected the demand for Global Net Exports of oil (GNE*). But within OECD countries, we also had some countries with increasing net imports, e.g., the UK.
Of course, on the demand side, the key factor has been the ongoing decline in what I define as Available Net Exports (GNE less Chindia’s Net Imports, CNI). ANE fell from 41 MMBPD in 2005 to 34 MMBPD in 2013, and BP/EIA data indicate that the ANE decline probably continued in 2014.
Based on most recent EIA data, the US is still dependent on net crude oil imports for about 40% of the crude + condensate (C+C) processed daily in US refineries, and a plausible estimate is that our existing C+C production is declining at about 20%/year (we have to run very fast to stay in place production-wise). The US is one of about 157 net oil importing countries in the world.
Based on current trends (rate of decline in GNE/CNI Ratio), in about 16 years China & India alone would theoretically consume 100% of GNE, leaving no net exports available to about 155 net oil importing countries.
*Combined net exports from top 33 net exporters in 2005 (EIA)
So we have current trends saying that:
– Saudi Arabia will become a net importer in 15 years.
– China & India are to consume 100% of net exports in 16 years.
As those trends become unsustainable, we are going to have lots of interesting things happening during the next decade.
I am surprised that most people don’t seem to notice how things are taking a turn for the worse lately. At the same time the world is radicalizing, (Isis, Syriza, French National Front, Spanish Podemos, etc) and the world economy is worsening (Greek bankruptcy, fake recovery, world commerce diminishing, China growth reducing). To me is like seeing storm clouds approaching.
Terrific confirmation, Jeffrey. I have sent your comments on to others many times these past few years. Unfortunately, the confirmation by a major MSM publication is what John Q Public needs to see in order to accept reality. I have already sent it on!!
regards
Cherry-picking Brown circa 2005 is funny and real funny.
2015 net export math.
Ah, those trips to the archives.
Speaking of archives, here is a link to, and concluding paragraph from, my first article on net exports (January, 2006):
http://www.theoildrum.com/node/984
While it’s true that net exports have not fallen as much as I expected, it’s also true that my early 2006 article on net exports precisely nailed a major inflection point. The original draft of my article said these factors “will interact this year” (2006) to produce an unprecedented net oil export crisis (my article was edited by the Oil Drum editors).
Following is a Gap Chart showing Global Net Exports through 2012. At the 2002 to 2005 rate of increase we would have been up to about 71 MMBPD in 2013, versus the actual rate of 43 MMBPD.
Yes indeed, Jeffrey, and 10 years ago soon, too…
And of course I recognize marmico from ‘The Archives’ too. Hi marmico.
Hi Marmico,
Those charts are for Saudi Arabia, not the world. Net exports for Saudi Arabia did not drop as much as some people expected in 2005, Jeffrey Brown was not alone in this assessment. There were many who thought at that time that Saudi output would soon peak. The actual 2014 net exports are close to the high end of the confidence interval.
Marmico. Am I reading it incorrectly, or are exports down since 2005 per the chart you posted.
Long term oil predictions usually don’t look so good in hindsight. For example, look at the stuff put out by the EIA.
Further, I think Citi is in the camp that KSA becomes a net importer of oil by 2030. They recently predicted the 2014-15 oil price crash, which almost no one saw coming. However, they missed the bottom by over $25 WTI.
At the 2002 to 2005 rate of increase in Saudi net oil exports (7.1 MMBPD to 9.5 MMBPD), they would have been up to about 23 MMBPD in 2014, versus the actual (BP + EIA) rate of 8.4 MMBPD in 2014.
As Dennis noted, Saudi net exports in 2014, at 8.4 MMBPD in 2014 (versus 9.5 MMBPD in 2005), were at the top end of the 95% confidence interval in the paper that Sam Foucher and I coauthored on the (2005) Top Five Net Oil Exporters (Saudi Arabia, Russia, Iran, UAE & Norway):
http://www.resilience.org/stories/2008-01-08/quantitative-assessment-future-net-oil-exports-top-five-net-oil-exporters#
And the fact remains that Saudi net exports (as revised per EIA) rose from 7.1 MMBPD in 2002 to 9.5 MMBPD in 2005, but have been well below the 2005 rate for nine and almost certainly 10 straight years.
Sam Foucher’s specific projection, circa 2007, for Saudi Arabia was that their net exports would decline at a rate of between 0.7%/year and 8.7%/year. The actual observed 2005 to 2014 rate of decline n Saudi net exports was 1.4%/year, which is within Sam’s predicted decline rate boundaries.
Regarding the overall (2005) Top Five, their combined net exports fell from 24 MMBPD in 2005 to 21 MMBPD in 2013 (2014 data not yet compiled), which is below the upper end of the 95% confidence interval.
Jeff, I love your net export math analysis. I wish you’d do a blog where you update the numbers from time to time. I’ve been reading about KSA’s max production but what I’m not seeing big press attention on is their declining exports. I beg you to do a little blog page where you do a ‘live feed commentary’, so to speak, or a semi annual update on production/consumption/export data and talk us through the export land model as it plays out in real life on planet earth.
The problem is that consumption numbers are only updated on an annual basis, although the EIA revises their production and consumption numbers more frequently.
Hi Jeffrey,
One problem with your “Gap” chart was that 2002 to 2005 was an unusual period where OPEC tried to keep prices in check by raising output to full capacity, then they could raise output no further without further investment which takes some time. If you look at the trend of saudi net exports over a longer period it is clear that the 2002 to 2005 period was unusual so the gap chart is not very convincing to me. Saudi net exports from 1999 to 2013 using EIA data below.
I completely disagree. Comparing 2002 to 2005 to 2005 to 2013 makes enormous sense for the following reasons:
Annual Brent crude oil prices doubled from $25 in 2002 to $55 in 2005. They doubled again, from $55 in 2005 to an average of $110 for 2011 to 2013 inclusive (and they averaged about $99 in 2014).
So, we are looking at the production/export response to one price doubling (2002 to 2005), versus the production/export response to a second price doubling (2005 to 2013).
This seems so obvious to me that I don’t see how anyone could disagree with the approach.
But the real, and virtually ignored, problem is that I estimate that Saudi Arabia has already shipped close to half of their post-2005 CNE (Cumulative Net Exports). While everyone is lulled to sleep, focusing on production, almost no one is looking at catastrophically high CNE depletion rates (see Six County Case History down the thread).
And the hard fact of life is that given an ongoing, and inevitable decline in production in a net oil exporting country, unless they cut their consumption at the same rate as, or at a faster rate than, the rate of decline in production, it’s a mathematical certainty that the resulting net export decline rate will exceed the production decline rate and that the net export decline rate will accelerate with time.
This works for ANE too. Given an inevitable ongoing decline in GNE, unless China & India cut their net imports at the same rate as the rate of decline in GNE, or at a faster rate, it’s a mathematical certainty that the ANE decline rate will exceed the GNE decline rate and that the ANE decline rate will accelerate with time.
While the conventional wisdom is that there are no problems in sight, in regard to global oil supplies, there is the following chart.
Observed Rates of Decline 2005 to 2013:
ANE = GNE less CNI (Chindia’s Net Imports)
GNE: 0.8%/year
ANE: 2.3%/year
At a GNE/CNI Ratio of 1.0, China & India alone theoretically would consume 100% of GNE. Apparently the ANE decline continued in 2014.
Hell ,I am so impressed by the net export model that I want an autographed picture of Jeff and Sam. Gonna get it photoshopped and put myself in it too and hang it on the wall in the den so I can tell more colorful lies about being a real peak oiler ten or fifteen years from now. 😉
How about it JB??
Here are net exports in Millions of tonnes per year, relatively flat since 2004, down a little but not by much.
http://mazamascience.com/OilExport/
With the scale stretched to focus on 2000 to 2014, using paint on the image above, the World net exports for millions of tonnes per year are in the chart below.
So, Global Net Exports (GNE) showed a strong increase from 2002 to 2005, as annual Brent crude oil prices doubled from $25 in 2002 to $55 in 2005, but they declined as annual Brent crude oil prices doubled from $55 in 2005 to an average of $110 for 2011 to 2013 inclusive, and you really don’t see any warning signs on the horizon?
And in a similar fashion, everything was peachy for the Six Country Case History from 1995 to 1999. Their production was up by 2%, although they had shown a mild net export decline. But there was the fact that in only four years, they had already shipped 54% of their post-1995 CNE (Cumulative Net Exports).
In any case, I estimate that remaining post-2005 Global CNE are down by 30% of so, as of the end of 2014–about 30% depleted in only 9 years. Incidentally, this method of estimating CNE was too optimistic for the Six Country Case History (by 23%).
Hi Jeffrey,
Yes I think there will be problems. There a couple of problems with your analysis. One we do not know what either the ANE or CNE will be in the future. Why is it that we would naturally assume that all of China and India’s demand for oil will be satisfied and the rest of the World gets what is left over?
I explained why a doubling in price fro 2002 to 2005 did not have the same effect as a later doubling, in the first case there was excess capacity for OPEC to increase output and in the second case there was not. One cannot look at oil prices in isolation, in 1972-75 ($18/b to $61/b) and in 1978-80($53/b to $97/b) there were also substantial rises in oil prices and net exports grew relatively slowly in both of these periods. The better explanation for the difference between the rise in net exports in the early(2002-2005) vs late period(2006-2014) is the absence of substantial excess production capacity in Saudi Arabia and other countries after 2005 and OPEC’s decision that the World could live with oil prices above $60/b (in 2015$). In 2002, the thinking was that oil prices above $30/b (nominal dollars)would cause the World economy to crash and OPEC did all it could to avert such a crash by pumping as much oil as it could. By 2006 the spare capacity of OPEC was all gone.
The other thing is that consumer demand responds slowly to changes in the oil price. By 2011 when oil prices had stabilized at the next doubling in price (annual average prices) above the 2005 oil price level consumers had enough time to buy more fuel efficient cars so the long term demand response to higher oil prices had time to manifest. In addition, there was slower World growth due to the 2008 financial crisis which also reduced oil demand.
Bottom line, the World economy and oil demand can respond differently to a doubling of oil price depending on the circumstances. So I would not expect net oil exports for the World to be a simple function of the price of oil, it is more complex than that.
The concept of “available net exports” is also flawed, there is no way of knowing which countries will receive what quantities of oil. There will be a market price of oil determined by supply and demand of all countries for oil, China and India have no special claim on oil.
The concept of “available net exports” is also flawed, there is no way of knowing which countries will receive what quantities of oil.
I really don’t understand what “available net exports” have to do with “who will receive what imports“.
Hi Ron,
When one country exports oil there must be other countries that import oil. The Export land model assumes that as net exports fall, the amount of oil imported by India and China will be unaffected and that what is left over (available net exports) is shared by the rest of the importing nations. I do not think it will work this way, I believe supply and demand from all countries in the World will determine a market price and that price will determine how much oil will be imported given the net exports on the World market.
When one country exports oil there must be other countries that import oil. The Export land model assumes that as net exports fall, the amount of oil imported by India and China will be unaffected and that what is left over (available net exports) is shared by the rest of the importing nations.
Clearly Jeffery knows that will not happen like that. As he shows in his post below he was using that as an example to show what would happen if China and India did not cut their rate of imports. It was an example.
Oil is a fungible commodity. The only way China an India could keep their imports from declining, if net exports declined, is to simply outbid everyone else. I really don’t think they wil be in a position to do that.
Hi Ron,
I may just not understand Jeffrey’s terminology, it seems that the concept of available net exports (ANE) implicitly assumes that China and India get a certain share of net exports and everyone else gets what is left. I see no reason to single out certain countries the global net exports (GNE) are available to everyone willing to pay and I think the ANE category is unnecessary, it just seems very arbitrary to create a special grouping for China and India.
Most oil is sold on long term contracts as oil is used for feed stock for refineries. Price, some formula linked to the market pricing.
This gives exporters some assurance about income.
Hint, check out what countries opted for long term contracts (like 20 years) and with what suppliers.
As available net exports are adjusted for these volumes, it becomes easy to figure out who is most vulnerable as net exports tanks.
As noted below, following are the mathematical facts of life regarding Net Export Math, and as noted below, the observed rate of decline in ANE was about three times the observed rate of decline in GNE, from 2005 t0 2013, which resulted in ANE falling from 41 MMBPD in 2005 to 34 MMBPD in 2013 (with the decline apparently continuing in 2014).
As discussed below, given an ongoing and inevitable decline in GNE, the only way we will not see the ANE decline rate continuing to exceed the GNE decline rate is if China & India cut their net imports at the same rate as the GNE decline rate, or at a faster rate.
I continue to get qualitative objections to a quantitative analysis.
So far, the pattern has been that net oil exporting countries that subsidize petroleum consumption, e.g., Indonesia, continued to subsidize consumption, even as they become net importers, and the countries that heavily tax petroleum consumption, e.g., the UK, continued to tax consumption, even as they became net importers. But for the two examples cited, Indonesia & UK, both regions showed accelerating rates of decline in net exports.
Hi Rune,
Thank you for taking the time to educate me.
I was not aware of the long term contracts, as oil supplies tighten there will be all kinds of scrambling to get oil, but under these circumstances the oil exporters may be less likely to strike long term deals unless they are worried about “peak demand” as oil prices rise.
If debt becomes an issue (or more of a problem than it already is), then demand for oil may fall as fast as net exports fall and oil prices may stabilize. It is doubtful the World would stay on this knife’s edge for long and oil price volatility seems more likely. It really seems that a World Oil cartel would be better than the alternative, maybe Canada, Norway, and Russia should join OPEC so we could get oil price stability. We could have the TX RRC and NDIC work with this new “OPEC” and create some stability in the oil industry.
I guess that’s sort of my whole point, isn’t it? GNE rose sharply in response to the first price doubling, but fell in response to the second price doubling. This is so transparently obvious to me that I remain astonished that anyone disputes the validity of the approach.
What will happen is not clear, but what has happened is quite clear, and the same consumption trends (shown on chart below) continued in 2013 (and apparently in 2014).
In any case, as noted elsewhere and to paraphrase Heinlein, Net Export Math is a Harsh Mistress.
*The volume of Global Net Exports of oil (GNE) available to importers other than China & India (ANE) fell at 2.3%/year from 2005 to 2013, as GNE declined at 0.8%/year.
Yes Jeff, what you say is true. If your assumptions are correct (that the level of imports by China and India are unaffected by declining net exports) then the available net exports will decline very fast.
I think your assumption is not one I would make.
Also net exports will eventually decline and if oil exporting countries consumption is unaffected by rising oil prices and declining output then net exports will decline faster than overall output.
The faster this occurs the more that prices will rise which will lead to a faster transition to alternatives to oil (public transport, plug in hybrids, and EVs and more rail for transporting goods and possibly hybrid or natural gas driven trucks).
It could be that oil exporters will try to reduce domestic consumption so their source of revenue does not disappear as oil importing nations rapidly transition away from oil.
India and China have been growing rapidly relative to the OECD, it is expected that their share of global net exports would increase. We will all have to do with less oil in the future, the OECD should lead the way in transitioning away from oil for transport.
Dennis,
I don’t know how many ways I can say that we are talking about mathematical certainties.
Hi Jeff,
And I will repeat if your assumptions are correct, the analysis will be correct. It is not your math, it is the underlying assumption that China and India’s rate of increase of oil consumption will not change as oil exports decline.
As far as long term contracts, these will be broken when it becomes necessary. That is if the contract is to supply oil at a given price for 20 years, the contract will be renegotiated, the seller may decide the price they want is so high that the buyer fails to agree, then the seller can just sell to the highest bidder.
If most oil is locked up in long term contracts and output declines, contracts will need to be broken eventually.
Perhaps you could point out where I made this assertion?
I have shown an extrapolated decline in the GNE/CNI Ratio, but as I have repeatedly pointed out, given an inevitable ongoing decline in GNE, the rate of decline in ANE will exceed the rate of decline in GNE–unless Chindia cuts their net imports at the same rate as, or at a faster rate than the rate of decline in GNE.
In other words, given declining GNE, the GNE/CNI Ratio will decline, unless Chindia cuts their net imports at the same rate as GNE, or at a faster rate. This does not require China & India to maintain their recent rate of increase in oil consumption.
Let me put it this way. Given an inevitable ongoing decline in GNE, if Chindia’s net oil imports remain constant and never increase, the ANE decline rate will still exceed the GNE decline rate and the ANE decline rate will accelerate with time. I don’t know how many different ways I can say this.
As I have repeatedly said, we are dealing with hard mathematical certainties, and qualitative objections to basic math concepts will not make the math go away.
Dennis wrote;
”As far as long term contracts, these will be broken when it becomes necessary.”
From where do you take this? Any examples?
The Buyers have agreed to market price or some derivative of it.
Hi Jeff,
Why would China’s and India’s oil consumption never decrease? Those countries which are growing rapidly will have an increasing share of oil consumption. Based on IMF data China’s GDP has tripled since 2002 and India’s GDP has increased by a factor of 2.5 since 2002.
ANE as you define them, will no doubt decrease faster than global net exports, because China and India will continue to grow faster than the OECD.
Eventually as oil output declines everyone’s consumption will decline including China and India, how the oil is distributed will depend on demand.
Hi Rune,
No I do not have examples. I mistakenly thought the long term contract was at a specific price.
Let’s say 35 Mb/d of crude is under a 20 year supply contract and net exports drop to 30 Mb/d, there would be some contracts that would not be fulfilled if that occurs.
You suggested that most oil supply is under long term supply contacts, does this apply to 90% of net exports?
Hi Rune,
Finding the amount of oil traded on the spot market is difficult.
http://www.encharter.org/fileadmin/user_upload/document/Pricing_-_chapter_3.pdf
at the link above on page 72 they claim about 30% of oil is traded on the spot market, but the document is from 2007.
http://www.platts.com/IM.Platts.Content/InsightAnalysis/IndustrySolutionPapers/oilmarkets.pdf
The paper by Platts (2010) estimates 5 to 10% of oil is traded on spot markets. Also the “long term” contracts are typically 1 to 2 years with a renewal clause that gives each party the ability to not renew.
So there is unlikely to be the need to break any contracts, I had misunderstood how short these long term contracts were.
Hi Jeff,
There are a number of assumptions to the export land model:
1. Net Oil Exporting nations will generally increase their consumption of oil until their net exports decline to zero.
2. China and India’s oil consumption will probably grow and is unlikely to decrease.
These assumptions are likely to be correct, but beyond this we don’t know the rate that oil consumption will increase in net oil exporting nations and we don’t know how much future oil will be consumed by India and China.
This is on top of uncertainty about when peak oil will occur and how fast oil output will decline.
I agree that Available net exports are likely to decline faster than global net exports and that global net exports are likely to decline faster than oil output.
It is not clear to me how much faster these rates will be and I do not think the World case will be similar to the 6 country case.
In the 6 country case those countries could simply become oil importers, for the global case this will not be an option so things will play out differently.
Dennis,
Some years ago I saw reports of some South East Asian countries entering into long term contracts of 20? years with some Middle Eastern oil producers/exporters.
As the links you provided shows that most of the oil is on some contract of varying durations which may have some renewal clauses.
What could have been interesting, if feasible, was to draw a chart with time axis and volume axis, stacking the contracts according to their duration/expiration with the longest durations at the bottom.
This could visualize how much of the oil was somehow tied up in contracts and how this developed with time.
As net exports starts to tighten it will set up some dynamics that may be perceived. Several oil companies with strong national ties are likely to get whispered to take care of their (home) nation’s supplies first.
Oil may be sold to preferred customers (politics comes into play).
Importers with little or no long term contracts and little leverage (both political and economic) may find themselves with steep declines in supplies (imports).
The point is as net exports starts to decline there likely will not be a pro rationing of available exports.
The whole Net Export thing seems to hinge on the assumption that exporters can’t get more energy efficient, even though they tend on average to be the least energy efficient economies around.
If the Saudis, for example, would stop wasting so much energy, their consumption would fall rapidly.
Many things are possible, but given an ongoing, and inevitable decline in production in a net oil exporting country, unless they cut their consumption at the same rate as, or at a faster rate than, the rate of decline in production, it’s a mathematical certainty that the resulting net export decline rate will exceed the production decline rate and that the net export decline rate will accelerate with time.
This works for ANE too. Given an inevitable ongoing decline in GNE, unless China & India cut their net imports at the same rate as the rate of decline in GNE, or at a faster rate, it’s a mathematical certainty that the ANE decline rate will exceed the GNE decline rate and that the ANE decline rate will accelerate with time.
Hi Jeff,
The reason China and India’s net imports of oil rose so much from 2002 to 2014 is because they grew very rapidly. I used data from the IMF’s World Outlook to plot the normalized GDP of China, India, US and Germany.
http://www.imf.org/external/pubs/ft/weo/2015/01/weodata/index.aspx
Over that period real GDP grew to 114% in Germany (total over 12 years), 125% in the US, by 243% in India and 312% in China by 2014 (2002 value would be 100%. So it is not surprising that net imports went up in China and India relative to the US.
German oil from Energy Export Databrowser.
http://mazamascience.com/OilExport/
Mac,
I can shoot you a pic, but Sam seems to have vanished from the Internet.
A key question:
How much of KSA’s domestic oil consumption is used for electrical generation?
Okay, I’ll have to answer the question: about 20%, or around 600k bpd. The rest? Industry, and personal transportation. KSA uses about 3M bpd, which is more than Germany, a country with 3x the population and 5x the GDP. It makes no sense – most of it is wasted. Growing that number at all, let alone to 10M bpd, is economic insanity.
So, how smart is KSA?? I’m told they’re very smart about running Aramco. But, they’ve been talking about solar for years, and doing nothing. When will they start installing solar PV, which produces power for about 1/3 the cost even now, and whose cost is still falling like a rock? When will they raise gasoline prices, and reserve cheap/discounted fuel for the minority that truly needs it? When will they raise oil and gas prices, instead of wasting vast amounts of money and energy on a domestic industry that is set up for failure when the inevitable decontrol of fuel prices occurs?
How long will KSA shoot themselves in the foot??
Here is an article about Saudi refining.
http://www.reuters.com/article/2014/11/04/saudi-oil-refineries-idUSL5N0SQ3UH20141104
Solar panels may require water washing in the desert, and that’s a very expensive commodity. I’d love to see estimates of water use by a solar plant near Riyad.
The article about Saudi refining is interesting, but not relevant to this discussion: we’re talking about net exports, so refined products don’t change that.
Solar panels may require water washing in the desert
I’d be surprised. I think you need to provide evidence of this idea – otherwise, it’s just FUD (Fear, Uncertainty and Doubt – a misinformation and fear-mongering device).
Even as we speak, Jordan is in the process of buying PV at less than 7 cents per kWh – that’s nearby, and less than 1/3 the cost of generating power with oil.
Hi Nick G.
Refined products do have a connection with net exports though, don’t they? Every barrel of Saudi crude refined is a barrel not available for export.
Net exports include refined products.
Think of it this way: very few end-users actually consume crude oil. Generally, consumers use refined products. It doesn’t matter a whole lot who does the refining. Whether KSA does the refining or the US, what matters is the availability of refined products to end users.
Thanks Nick. I’d got it into my head that the topic was the Saudi situation.
What OFM calls a senior moment.
I’ve used the following example to illustrate the differences between gross and net exports:
Production Land (P) has 2.0 MMBPD of production, but no refining capacity. Refinery Land (R) has 2.0 MMBPD of refining capacity, but no production.
Ignoring refinery gains and other minor issues, P has consumption of 1.0 MMBPD, and R has consumption of 1.0 MMBPD.
P’s gross exports to R are 2.0 MMBPD. R’s gross imports from P are 2.0 MMBPD.
R refines 2.0 MMBPD, consumes 1.0 MMBPD, and exports 1.0 MMBPD of refined product to P.
P’s net exports are production (2.0) less consumption (1.0) = +1.0 MMBPD.
R’s net exports (actually net imports) are production (zero) less consumption (1.0) = -1.0 MMBPD.
Alternatively, you get the same answer if you define net exports as gross exports less gross imports.
Fernando stated: Solar panels may require water washing in the desert
Nick replied:
I’d be surprised. I think you need to provide evidence of this idea – otherwise, it’s just FUD (Fear, Uncertainty and Doubt – a misinformation and fear-mongering device).
Nick, now I realize you have not done your solar panel homework. I lived in the Saudi Desert for five years. Dust is a serious problem. The wind blowing across the desert picks up dust and everything gets dusty. Due at night makes the dust a serious problem. It makes the dust turn to a kind of goo. Trucks, with pulsating water spouts, must wash the high voltage power line insulators down periodically to prevent arcing. I have always been very skeptical of solar panels in the desert because I know what a serious problem the dust and dew will cause.
Solar in the MENA Desert
Problem: Dust build-up is the greatest technical challenge facing a viable, desert solar industry.
A 0.4-0.8% per DAY baseline yield loss caused by dust.
60% energy yield losses during and after sand storms are widely reported.
If left more than a day, dust particles from organics, dew and sulfur adhere to the panels.
Challenge: Current solutions in the market rely upon;
Expensive, unreliable, human labour in remote, desert conditions.
Water (desalinated, transported and wasted).
Complex, sensitive equipment, that will fail in harsh conditions.
Cleaning cycles of 4 days or longer, which allow dust to build up and adhere to the panels.
Is Anything Stopping a Truly Massive Build-Out of Desert Solar Power
In the desert near Abu Dhabi in the United Arab Emirates the Middle East’s first large CSP plant recently faced down the dust issue. In order to reach the 100-megawatt-capacity goal of the Shams 1 plant, developers had to add substantially more mirrors to the plant than planned due to dust in the atmosphere. Scott Burger, an analyst at Greentech Media’s GTM Research who focuses on the region, said the plant probably ended up costing three times the initial estimate, thanks in part to dealing with that dust. And now that it is built, Shams 1 sends a series of trucks up and down the lines of 250,000 mirrors every day, using robot arms to spray that precious water and clean away the dust.
Ron,
Those are interesting articles, and I appreciate your finding them. But:
Both of them state quite firmly that sand and dust aren’t showstoppers. Every location has its unique problems, but there is very little doubt that solar can massively replace KSA oil fired generation, and do it for much lower cost.
And,
You found them, not Fernando. If somebody is going to persistently throw doubt on something, they should do a little work and find some evidence for their ideas.
Ron, thanks for the thorough discussion. My experience is similar, I’ve worked in the Chalbi desert (Kenya), lived in Patagonia and SE Spain, and exchanged notes with friends over dust problems in other areas.
SE Spain is fairly close to the Sahara, we get their dust all the time, and the local newspaper reports the dust is a major cost issue for the owners. I’ve also read there’s a conflict over water use between the large solar plants and local agriculture. The two sides are having dogfights over water use rights.
When I worked in the Chalbi we had small dust devils every afternoon, these dumped so much sand I used to wear swim goggles and usually had a diaper stuck under my helmet. I remember one time a big Texan boy who flew in with me started laughing when he saw me put my swim goggles on my helmet, and made a joke about where the hell was I going to go swimming. The next day he found out what it was like.
And all of that kind’ve makes sense, except…you’re relying on personal (anecdotal) experience and popular news reports (which are often inaccurate or incomplete).
Here’s a counter-example: we often hear questions about water use for fracking, but when you really quantify and analyze the amounts used, you realize that they’re pretty trivial. Certainly not a showstopper (something that will prevent a significant number of wells from being drilled).
re: Soiling… anecdotes…
Just today, I was reading the May 2014 issue of IEEE Journal of Photovoltaics.
(Vol 4, number 3) (yes, I know – I’m behind, but that’s how it goes with technical journals…)
While my main focus was on Wolf et. al. “Modeling the Annealing of Dislocation Loops in Implanted c-Si Solar Cells” (p 851), there is an article by
Burton & King “Spectral Sensitivity of Simulated Photovoltaic Module Soiling for a Variety of Synthesized Soil Types” (p 890).
http://ieeexplore.ieee.org/stamp/stamp.jsp?arnumber=6732891
Abstract at:
http://ieeexplore.ieee.org/xpl/articleDetails.jsp?arnumber=6732891
It seems to be open access at the moment, though there may be some unexpected cookie left on my home machine allowing me access.
One of their references seems to be a nice review, but it is not open access.
T. Sarver, A. Al-Qaraghuli, and L. L. Kazmerski, “A comprehensive review of the impact of dust on the use of solar energy: History, investigations, results, literature, and mitigation approaches,” Renewable Sustainable Energy Rev., vol. 22, pp. 698–733, 2013.
http://www.sciencedirect.com/science/article/pii/S136403211300021X
Burton & King say in their introduction: “The study of soil accumulation on photovoltaic (PV) surfaces has been of interest for nearly 70 years” then give the reference to Sarver et. al.
Another reference, that I do have, is:
H. Qasem, T. R. Betts, H. Müllejans, H. AlBusairi, and R. Gottschalg, “Dust-induced shading on photovoltaic modules,” Progr. Photovoltaics: Res. Appl., vol. 22, pp. 218–226, 2012.
http://onlinelibrary.wiley.com/doi/10.1002/pip.2230/abstract
In Figure 1, for August 1982, a very exceptional month, but nevertheless an existence proof of real severe dust in the Kuwait International Airport area,
a bit more than 450 grams of dust were deposited per square meter.
That’s a pound of dust over a square meter in a month!
From their abstract, if amorphous silicon (a type of thin-film PV) loses 33% in photocurrent at 4.25 mg/cm^2, (that’s 42.5 g/m^2), what would more than 10 times that dust do?
Ron is right about dust in the desert.
It varies by desert, some has lots of nasty salts that are hygroscopic with the dew, and will form gnarly films that are hard to remove, and are conductive/corrosive when damp.
People think the deserts of the world must be wonderful places for solar, and some are. But a particular problem in most of the mid-East is the dust in the air – as alluded to with the Shams-1 concentrating solar thermal plant. All concentrating solar power (thermal or PV) needs good Direct Normal Insolation. Dust in the air (or on the surface of a mirror) scatters that direct-from-the-sun light. Flat plate PV can use that scattered light just fine, as long as the dust in the air/on the cover glass isn’t too thick.
Dust on mirrors is one reason GlassPoint Solar puts their concentrating mirrors (to make steam for Enhanced Oil Recovery) inside flat glass greenhouses. The flat glass is easy to clean (they use a robot on the roof, and collect the water in the gutter so much is reused) and cheaper than curved glass, and the mirrors are light weight aluminum honeycomb, protected from the wind (something else some deserts have a lot of).
http://www.glasspoint.com
Their presentation on the challenges of deserts, lots of nice pictures, recommended to all:
http://www.glasspoint.com/download/6236/
More details on building their plant in Oman:
http://www.glasspoint.com/download/3375/
edit: added this:
http://www.greentechmedia.com/articles/read/GlassPoint-Wins-53M-From-Oman-Shell-VCs-For-Solar-Enhanced-Oil-Recovery
flat PV panels on fixed mounts can use dry dusters.
Several are mentioned herein:
http://www.treehugger.com/solar-technology/rugged-robot-saudi-arabia-cleans-dusty-solar-panels-without-using-water.html
it’s the curved concentrating solar thermal mirrors with the intervening supports for the thermal tube that you end up paying some guys to drive trucks with water sprayers.
n.b. the NOMADD was developed with Saudi money hiring a bunch of outsiders at King Abdullah U.S.T.
http://www.nomaddesertsolar.com
Wow! Great info. I and my development team loved to work on that kind of problem. Lots and lots of top-of-head obvious ways to get a satisfactory solution. Just go to it, rake up a bunch of the most promising, do a quick and dirty first analysis, rank according to promise, make some prototypes, take ’em out in the desert, report back, iterate until done to taste.
I guess we would not have taken a year to get something quite satisfactory– given ,of course, an arms-race level of funding and support.
After all, the clean energy race is a damsight more important than the ICBM race.
And about that wind. Didn’t I hear somewhere that wind can be useful?
“How long…”
Looks like another 8 years…
http://www.bloomberg.com/news/articles/2015-01-20/saudi-arabia-delays-109-billion-solar-plant-by-8-years
They want to do it all with locally sourced material,
and right now they don’t have much in the way of local manufacturing.
They also don’t have a competitive power market or much in the way of interconnect policy for distributed energy.
They also have been pursuing nuclear power – air cooled one hopes…
Maybe you can get a flavor of the bureaucratic and academic approach that is a lot of talk, but not so much action yet.
http://www.kacare.gov.sa/en/
On top of that, a way different culture…
Hi Ron,
The Weekly data seems to under report output, so that data can mostly be ignored as it is a very rough guess.
Dean’s numbers match up pretty well with the EIA Petroleum supply monthly TX C+C data through December 2014 (only a difference of 60 kb/d).
After that we do not know whether it is the EIA’s estimate or Dean’s estimate which is incorrect.
I have used Dean’s data (thank you for sharing Dr Fantazzini) to estimate the percentage correction each month and used that rather than the absolute correction (in barrels), this gives a slightly higher estimate, I also used only the April 2014 to April 2015 data for both oil and condensate, where Dean uses Jan 2014 to April 2015 for oil and April 2014 to April 2015 for condensate (possibly due to missing data).
Below are the estimates in kb/d for Sept 2014 to April 2015 in kb/d for Texas C+C
(first # is EIA data, second is average of eia and my estimate, and the third# is my estimate using Dean’s data with % corrections)
Sep 2014, 3254, 3266, 3278
Oct 2014, 3335, 3335, 3335
Nov 2014, 3426, 3422, 3418
Dec 2014, 3510, 3500, 3490
Jan 2015, 3463, 3416, 3370
Feb 2015, 3603, 3518, 3434
Mar 2015, 3775, 3640, 3505
Apr 2015, 3711, 3540, 3368
Where we do not know which estimate is correct, I think the average of the two estimates would be better for Jan 2015 to April 2015. Just one person’s opinion, the EIA data from the petroleum supply monthly is not great, but through March it is high by no more than 8% and I think it will be more like 4% (135 kb/d). We will know in a couple of months.
Dennis,
You brought up a valid point in the comments to Ron’s previous post. That is that the explanation for US still rising since 9/14, while ND has not, is due to ND Bakken being earlier in time than both EFS and Permian unconventional.
Have you ever taken a close look at Elm Coulee in Montana? That, of course, is where the 21st century horizontal shale oil boom started.
I perused the MT state site last night for awhile. Of course, I am interested in long term production of these wells. It appears that most wells in Elm Coulee, most of which were completed between 2003 and 2008, settle out to around 10-30 barrels of oil per day. Interesting is how little water these wells produce. 30-300 barrels per month is very common, it appears.
In any event, do you think by taking a look at Elm Coulee, where it appears activity has pretty much stopped, could give us some clues about where the ND Bakken production is headed? Also, could it be a predictor for how other unconventional oil fields in the US will play out?
I also looked at 10K for both Continental and Whiting for the year ending 12/31/03, which was the year Bakken production commenced in Elm Coulee for Continental. I jotted down some things that were interesting, to me, at least. Will post later when have the time.
Hi Shallowsands,
I have a hard time figuring out the Montana data base so the most I have done is dig out annual output data for the whole Bakken/Three Forks play. For North Dakota I have Enno Peters excellent spreadsheet.
Short answer no I haven’t studied it. An excellent idea though. As to other LTO plays, I don’t know how similar the plays are, but based on stuff Mike and Fernando have said, probably not similar. I think it would help with the ND Bakken, but the way these older wells were completed is probably more like pre-2008 ND Bakken wells which may make for somewhat of an apples to orange comparison to the 2008-2014 wells in the ND Bakken/TF.
Hi Shallow sands,
Based on looking at about 10 wells (not really a big enough sample I admit), it looks like some of these old wells last a while, what is not clear is how many have been abandoned over the years, so we might only be seeing the “good” wells.
Dennis, contrary to some, I think Bakken wells will produce for many years. IMO, they will produce at rates of 5-20 bopd 20 years from now. Almost no water, probably rod pumped only a few hours a day.
As long as down hole failures are kept to a minimum, they might make decent stripper wells if oil prices are strong. One down hole failure per year would really hurt economics, though. Two or more would likely render them uneconomic. That is why I have wondered about vertical hole deviation given the huge rush to drill, apparently to save money.
We have a few wells that produce low volumes of both oil and water. They are on time clocks. OPEX is very low, we would be great even now if all of our production were like those. Some have had no down hole failures for over 5 years.
shallow sand
I think you are right
There were only 3 producing wells at the Elm Coulee / Bakken in Dec 2000 (one well wasn’t producing, probably, it was dry)
All three wells (!) are still producing at between 10 and 20 barrels per day
Look, for example at this well, which was initially drilled vertically and then re-drilled horizontally:
Permit to Drill 11/18/1988
Date Well Spudded 12/3/1988
Date Well Completed 2/14/1989
Intent to Horizontally Re-drill Existing Well 11/25/2003
Horizontal Re-entry, Date Well Spudded 12/8/2003
Horizontal Recompletion, Vertical Well 1/18/2004
Chg production by installing RHBM pump & rods 4/26/2013
Production history (b/d)
This well is 15 years old, was initially drilled horizontally and fracked. In 2008 converted to injection and in 2011 from injection back to production
Dennis. Good point about longer lateral length and more frac stages.
I wonder if, in the long run, the extra expense spent for these things will have been cost effective.
Hi Shallow sand,
The super fracks move production closer to the present where it is discounted less, at oil prices above $80/b it probably is worth it, at lower prices maybe not. Rune Likvern knows this best, I think for the Bakken in North Dakota he estimates a break even at about $70/b, but I may not be remembering correctly and that may be a point forward estimate.
Dennis, so do the big fracks increase EUR or just front load?
I guess that question cannot be answered definitively, but what is your opinion?
Hi Shallow Sands,
It may increase EUR a bit, bit it is difficult to say for sure.
In the ND Bakken there was a definite increase around 2008 when the super fracks were introduced with a likely doubling of EUR from about 150 kb to 350 kb (over a 30 year life), further increases in 2013 and 2014 seem to have just changed the shape of the well profile (more output in first 12 months) without a significant increase in cumulative output over the first 18 months, so either no increase in EUR or a marginal increase from 350 kb to 360 kb. So in my Bakken Model the wells from 2007 and earlier have a lower well profile than the 2008 and later wells. I have little data for the wells before 2007, so this early well profile is a guess on my part.
Hi shallow sand,
I took a closer look at August 2006 through Dec 2007 wells from Enno’s spreadsheet and the EUR for those wells is about 224 kb vs 348 kb for the average 2008 to 2012 well. It is possible that the lower well profile that I estimated (without much data at the time) was too low. When I substitute the higher well profile (EUR=224 kb) for 2005 to 2007 wells, it changes the Bakken model very little.
Dennis. 1198 wells in Elm Coulee field.
In April, 2015:
16% produced under 10 bopd
59% produced 10-30 bopd
16% produced 30-60 bopd.
9% produced over 60 bopd
Most of the top 25% completed since 2010.
Once the wells hit 10-30 range, most produce about one tank truck of water per month. These wells could be economic for 50 years or more.
Hi Dennis, which % did you use, the ones from March to April or some averages?
D.
Hi Dean,
I used corrected value in barrels for each month for T to T-23 for all months from April 2014 to April 2015 for both oil and condensate and divided each by your “corrected” value for each of those months. Then I took the average of those % corrections for all months from April 2014 to April 2015 for T to T-23 and finally multiplied those average % corrections by your corrected estimate, the difference is not that big in fact.
I also have realized it would be better to use the data value from the RRC rather than your estimate, so I will rethink it a bit.
Hi Dean,
So I have redone things with your correction factors and converting to percentages using the RRC data plus correction factor in the denominator where the RRC data is the most recent data downloaded. It turns out this gives a somewhat lower estimate for the correction factor than your method (with very small differences between the methods.
EIA, average, my estimate
Sep 2014, 3254, 3249, 3243
Oct 2014, 3335, 3315, 3295
Nov 2014, 3426, 3398, 3370
Dec 2014, 3510, 3472, 3435
Jan 2015, 3463, 3393, 3324
Feb 2015, 3603, 3493, 3384
Mar 2015, 3775, 3611, 3447
Apr 2015, 3711, 3516, 3322
I made a chart using the data Dennis posted.
How does the inventory data fit into all this? If indeed production is starting to fall then the latest inventory increase seems to be counter-intuative.
“If indeed production is starting to fall then the latest inventory increase seems to be counter-intuative” this could be explained by increased imports especially considering the high lease condensate content & lack of demand thereof of shale oil.
Production is just one thing affecting inventories. Imports and withdraws are two more. Refineries withdraw supplies from inventory according to demand which depends on the state of the economy.
Inventories, last Friday, were over one million barrels below where they were just over three months ago.
Date ………inventories in k barrels
3/20/15 … 466,678
6/26/15 … 465,379
Thanks. I must be too simple to understand this. But i thought imports are down and rafinery capacity is pretty much at limit. Which of those data is proven and which is assumed?
This is the kind of deep capture that rules markets today. The reason is because the real story on payroll numbers or many other measures would show that the world is in a depression with food stamps the new soup kitchen. Markets are no longer driven by a price signal but by Central Planners and their banks. Just look at the zerohedge link on JP Morgan and their massive commodity derivative exposure.
http://www.zerohedge.com/news/2015-06-29/jpm-just-cornered-commodity-derivative-market-and-time-we-have-proof
http://www.zerohedge.com/news/2015-07-02/americans-not-labor-force-soar-640000-record-936-million-participation-rate-drops-19
I have no idea who these “Central Planners” are. But I do know that they do not plan the price of oil. The price of oil does swing from day to day based on news and sentiment. But the long term price of oil is based on supply and demand.
Your first Zerohedge article is about derivatives. A derivative is something that derives its price from something else. The price of oil derivatives is derived from the price of oil, not vice versa.
Your second Zerohedge article is about unemployment. Now that does affect the price of oil. But “Central Planners”, whomever they are, have little control over that.
But the long term price of oil is based on supply and demand.
Unproven, and btw impossible. Dollars/barrel cannot be dependent on only barrels. It must be dependent on dollars, too, by definition.
Your second Zerohedge article is about unemployment. Now that does affect the price of oil. But “Central Planners”, whomever they are, have little control over that.
If the US central bank has no control over unemployment, then there would be no reason to assign unemployment to that central bank as one of the two criteria for monetary policy in the dual mandate — which is the law. Price stability and employment. Somebody thought they had control over it. In fact, they think that themselves.
As for the purity in general of the marketplace, with the system hanging by a thread no one rational would leave it to the essentially random fluctuations of free markets. You can make a good case for that being irresponsible.
Unproven, and btw impossible.
If the price of oil is dependent upon something other than supply and demand then the burden of proof is upon those who say it is dependent upon something else to describe what and exactly how the price is manipulated. So far I have heard a lot of theories but none of them makes any sense whatsoever. And you have supplied nothing in this post that gives any hint of how the price is controlled by “Central Planners” or anyone else.
Dollars/barrel cannot be dependent on only barrels. It must be dependent on dollars, too, by definition.
But of course. Price depends on supply and demand. Dollars are the price part of this equation. Did you not understand that Watcher?
If the price of oil is dependent upon something other than supply and demand then the burden of proof is upon those who say it is dependent upon something else to describe what and exactly how the price is manipulated.
Says who? Why isn’t the burden of proof on those who say price is supply and demand dependent, and as is so with any scientific hypothesis, evidence to the contrary requires one to reject the theory.
So there is that price on the shelf that doesn’t change as a function of the number of products on that shelf. You show up Monday, price is X. You show up Wednesday, fewer items on the shelf, but the price is still X.
Walk into McDs. Ask for a fish sandwich. “Sorry, sir, we have no more fish sandwiches.” “Oh, but the price up there is what it was last week when you had some.” “Uhm, what?”
2010, zillions of empty houses out there. Big supply. Price should fall. Banks refused to accept the lower price. Big supply, constant demand, no fall in price.
Done. You gotta toss that theory and work on another.
Hi Watcher,
Housing prices did fall in markets where there was oversupply.
The price is set by the market which is an aggregation of all those buying and selling.
If you own a store you can set all your prices at 2 times the level of all other stores, it is your choice.
Such a store owner finds that he sells very few items and either will reduce his prices or go out of business.
Have you ever had a McDonalds tell you they were out of something? It has never happened to me.
You have proven nothing. Especially for oil markets where none of your examples are applicable. The theory works well enough, though it is not perfect, exactly how equilibrium prices are established requires some strange constructs such as an “auctioneer” to establish market clearing prices in Walrasian theory. The fact is there is no auctioneer so there will be inefficiencies in the system as some goods will be sold above and below a market clearing price. Another problem with the theory is that consumer preferences are taken as given, exogenous to the market. Clearly if this were the case there would not be clever advertising schemes to try to create demand, so the theory falls down there as well. Nonetheless it is the best theory we have.
In order for a theory to be discarded, a better theory needs to be advanced, you have failed on that score.
Says who? Why isn’t the burden of proof on those who say price is supply and demand dependent, and as is so with any scientific hypothesis, evidence to the contrary requires one to reject the theory.
Yeah, what Dennis said plus common sense! Common sense should tell you that a seller wants to get the highest price he can so he sells to the highest bidder. Common sense should tell you that a buyer wants to buy at the lowest price possible so shops until he finds the lowest price.
Supply and demand is the default position. The market is just an auction, every seller getting every dollar he can and every buyer paying as little as he can. It is just common sense. It is not a theory.
Have you ever had a McDonalds tell you they were out of something?
Yup. Have. No change on the displayed item. The guy who bought the last one paid the same as the guy who bought the first one.
Done. Find another theory.
Oh and it’s not the default position. Victory is.
Notice how there are anti dumping regulations on the books? And Tarriffs?
Why are you guys doing this self delusion thing? You know perfectly well actions are taken to make the price of things whatever pursuit of victory suggests it needs to be.
Victory? Sometimes Watcher you make no sense at all. That last paragraph is about the silliest thing I have read in a long time.
Hi Watcher,
A store does not adjust the price based on the amount in stock. The market price of a good is determined by the market supply and market demand, nobody (except you) thinks this operates at the store level. So again you have only proven you understand very little about economics.
Hi Watcher,
If your theory that we can make prices whatever we wish, then all buyers would get their stuff for free and all sellers could charge an infinite price for their product.
You do see that this would not work well in practice, I would think. 🙂
Ron,
I think he means that, yes, while the supply and demand for oil determines its price, since it is bought in dollars the relative strength or weakness of the dollar can and does influence the price of oil.
edit: wrote this before reading any of the comments, so ignore it if necessary.
No Anonymous, that is not what he means at all. He completely denies that supply and demand determines the price. Obviously you have not been following Watcher’s post on this subject at all. He has hammered on this point for months. He thinks that somehow, somehow, others, somehow, cotrols the price of oil.
Of course he has never explained exactly how they do this.
Watcher. Maybe it is just me, but most of the time I do not have a clue as to what you are talking about. For example “with the ‘system’ hanging by a thread.?”
What “system?” The educational system? The political system? The religious system? The banking system? [If you are talking about the US banks, do not admit it, since it would indicate a total lack of understanding.] The socialist system? [Europe] The communist system [China, Cuba, Venezuela, etc.] The capitalist system? [US, Canada, Japan, Korea, etc.] The world trading system? The manufacturing system? The agriculture system? The construction system? The transportation system? The utility system?
Or is there a “Watcher system” that incorporates some or all of the world’s many integrated systems that is “hanging by a thread?”
A long, long time ago, I read a story. I think that it was titled “Chicken Little.”
The Watcher System rejects use of threads as a corruption of laissez faire.
That was a joke, where is the laughing.
The true price of anything is what somebody is willing to pay for it. It’s really just that simple.
s Haiti Relief Bounty Tournament will match all bounty money won and donate the
total relief efforts to Haiti up to $50,000 and also contribute
all tournament fees collected. In the long run sports like
soccer, cricket, volleyball and other exclusive sports events World Cup and Olympics are more enclosed
because of their ideal viewership in the world which furthermore captured a
large number of the dignified viewers. There is also a trend of many college students running
up debts on sports betting.
Nissan Leaf sales June 2014 — 2347. For first 6 months of 2014 — 12736.
Nissan Leaf sales June 2015 — 2074. For first 6 months of 2015 — 9816.
That’s down 23% year to date. Volt sales down 34%.
Total June car sales were down 3% at 676K. So the Leaf’s decline beat the average decline. Wow.
Light truck sales up 10% to 800,000. hahahahhahahahahaah
The electric revolution continues!
You’re just a plain old spoil sport Watcher. Now the EV Disciples will emerge, both of them.
Hi Doug,
With oil prices so low is anybody surprised? Oh wait, prices don’t matter in Watcher’s world, never mind. 🙂
Pretty much.
Those sales could increase sharply with no change in the price of the car OR in the price of oil.
Increases in US per capita real income would do it.
And thus, once again, price is proven less than compelling.
Why do I have to teach this stuff? How can y’all not figure this out?
BTW sales could fall, too. As income does. As it has been doing.
Yes watcher,
The idea is pretty simple. At a given level of income, a higher price for a good will result in less demand and a lower price more demand. Demand will also be affected for a single product by the introduction of other products that are better. Part of the reason for a fall in the Volt’s sales is that many buyers are waiting for the 2016 Volt which has many improvements over the old model. Prices will be reduced to sell off the older models. The price of oil will also affect car sales as will income.
Ahh, “many”.
If you can’t measure it, it’s not science.
Hi Watcher,
We will be able to measure the change in sales when the new Volt goes on sale, there are many variables that change in economics so the “science” is very difficult when you cannot control your variables as in a physics or chemistry experiment. So yes, social sciences are less “scientific” than some physical sciences, climate science also suffers from the inability to put the earth in a lab and to do controlled experiments which are repeatable.
As I said before we do the best we can with the theories that we have, come up with a better theory and you can win a Nobel Prize.
Hi Dennis,
Do you believe when Art Breman says that US oil producers at this moment loose $3.20 for every $1 of barrel that they make?
Let’s assume that that is the correct calc. My question is why there are 640 rigs still drilling in US? If supply is adequate why they are drilling? Shouldn’t supply and demand work there as well regarding to the number of the active rigs? I agree that for actual price of oil at any given moment it is quite hard determine how it is formed and where is equilibrium. But with rigs should be simpler especially if we look for the last 7 months since not all rigs can be stacked right away. Yes, number of rigs are halved, but at $57 does anybody in US make money? According to Art they are losing money. So why they are still drilling?
There are at least two good reasons ,from the pov of the people drilling, to keep drilling.
One is the hope of rising prices. The people who have been preaching dirt cheap oil indefinitely have already been shown up for incompetent price forecasters over the last few months. Oil is much closer to sixty than it is to twenty and with so many rigs parked depletion will most likely mean a rising price over the next year or two – in SOME peoples opinions at least.
The other is that it is sometimes the case that it is cheaper to run at a loss than it is to simply shut down.
For example suppose you own a restaurant in a rented building and are losing say three thousand bucks a month with all hired help including management. If the rent is four thousand bucks a month your are a thousand bucks better off to stay open- at least until the lease expires.
Plus there is generally a possibility that business will pick up and you can get your restaurant – or your oil wells – running in the black.
I know very little about oil except what I read but this explanation basically applies to any cyclical business.
And now we are at the end of ‘cyclical business mode’.
There is a lot of undrilled acreage plus a lot of leases likely have clauses requiring more than one well. Drill it, pay to extend or modify the lease, or lose it.
Also, almost all drilling at this point are public companies. Wall street will punish those with falling production, even though that does seem counterintuitive during low prices.
Some may have hedges to take advantage of yet this year.
Maybe don’t want to pay more termination penalties to drilling companies.
Just a few reasons, sure there are more, including a few may be ok at this price.
Shallow,
only hedges could be a valid reason but don’t they expiry in June for most of them.? I just read article about that few days ago.
All other reasons I don’t buy it because the drilling and making every barrel afterwards at loss is more expensive then all termination fees. I don’t buy that.
Ves. Don’t know that reasons I listed are smart or right thing to do. Just throwing out stuff.
Have discussed why you keep a water flood going. Do not want to lose the drive.
Also, on existing priduction, keep in mind all you have is a lease. It will expire if you leave it shut in too long.
Dumbest thing to me is pub co saying will return to drill at $65. Why would you put a lid on oil speculators in that manner?
Mac,
Hope is very good human trait. Same as Grace, Love and Faith. But I don’t think that businesses are run on Hope. Let’s forget the hope. And anyway my question was why do you keep drilling a NEW loss making wells from a get go? So that first reason is not good.
Second reason. again I did not ask why do you keep already producing wells running. There could be a reason if cost analysis is done that keeping them going is cheaper then shutting them down. My question is again why do you keep drilling a NEW wells when it is obviously cheaper option just NOT to drill. Isn’t the cheaper option not to drill? Make sense to me. So again that second reason with your example of restaurant is not valid because you are not opening a new restaurant down the block if the first one is not making profit.
I have known many small business men who ran at a loss at various times hoping for business to pick up. I used to be a small businessman myself and sometimes ran at a loss.
Some went broke. Some hung on to their crews and regular customers and made a ” killing” when business picked up again.We ran our orchards at a loss sometimes for years on end when the market price was below our production costs due to the industry over expanding. When the market EVENTUALLY turned we made VERY good money given that enough others gave up and there was then a short supply. One of my neighbors spent a lot of money establishing a new orchard and after three years of good production running in the red had a bulldozer in and converted it back to a hayfield. There was a short crop the following year. We did VERY well that year.
There are plenty of news accounts of large businesses hanging on for years losing money year after year. Sooner or later they get bought out or close.
You DO NOT KNOW for sure that it is cheaper for a given operator to quit drilling. It is obvious enough that a lot have quit or nearly quit , as evidenced by the stacked rig count.
But for the rigs still running, the people doing the paying are running on the basis of either straight dollars and cents accounting considerations or hope – most likely a combination of the two.
As others have pointed out, there are many substantial expenses you may have to pay even if you quit.You can lose your leases, your experienced crews scatter, getting the key people back could be very hard, you have to pay termination penalties, you may have to go straight to bankruptcy.
If you are drawing a good salary as and executive level employee or owner, even though your OVERALL business is losing borrowed money or market cap , you can keep paying the girls tuition at that snotty snooty private college. Your wife can keep the Benz and you can still play golf at the country club.
You can even be working on hiding some assets from the bankruptcy judge you may be expecting to meet a year or two down the road. 😉
My seat of the pants guess is that barring a really sick economy , oil will be closer to a hundred within eighteen months than it is to fifty five to sixty. Depletion never sleeps courtesy of Matt Simmons.
Mac,
Apple orchard as example does not apply. That is like “renewable” product, it grows every year 🙂
Oil on the other hand is like Slurpee that can not be mixed again. Once you suck that Slurpee out of the ground – no more.
I cannot reply down thread but the people who have wells already pumping are generating badly needed cash even if they are not actually making money.
They may be drilling new wells for the many other reasons mentioned in other comments.
It is true that an orchard is renewable over the long term and oil is not – but within the time frame that businessmen either orchardists or oil men make decisions, this makes no difference. The fact that any GIVEN well is not renewable does not matter short term so long as there are still plenty of places to drill new ones.
Orchards have a life span too, the same as an oil well. The only real difference is you can put a new orchard in the same spot.
Incidentally the life span of an orchard is not too far different from that of an oil well, ranging from a few years to a few decades.
“According to Art they are losing money. So why they are still drilling?”
For preventing production at least from declining maybe also. Could be that in several wells production is dropping like a rock.
If it would be the hope of rising oil prices, they better wait.
Hi Ves,
First, I do not know if Art Berman’s calculations are correct.
Has he assumed that oil prices will remain at $60/b forever?
Is that assumption correct? Maybe the drilling and completion continues only in areas where the best wells have been drilled previously and the oil companies need the output in order to keep the company operating. The oil companies may believe that oil prices will increase, I do not know exactly why they continue to drill, but it may be a combination of many factors, some of which I may not be aware of.
Hi Dennis,
I don’t know if Art’s calculation is correct but I wrote let’s assume it is correct in order to analyze what is happening in reality. To be honest we don’t know if EIA data is correct and we don’t know even if Baker Hughes data are correct with 640 active rigs in US. But that is data that we have so we have to make sense with what we have. So, so far nothing makes sense.
” Has he assumed that oil prices will remain at $60/b forever?”
Of course not. Price is always going up or down. But that is not my question. My question is why do you drill NOW when it is cheaper NOT to drill now?
Why do you assume that oil companies know when the price of oil will go up? They do not know. How they would know? If they know they would make a killing on the stock market and leave drilling and refining to someone else 🙂
Hi Ves,
The oil companies probably estimate what they think the future price will be. Every business has to make some estimate of what they think will happen in the future. It does not matter if they are correct in fact, their decisions will be affected by their expectations.
Let’s say you owned an oil company, what do you think the future trend of oil prices will be? If you think they will be lower in the future, then prospective wells will be less profitable based on that expectation, if you believe oil prices will be higher then those wells will seem more attractive.
Expectations make a big difference.
My comment is all about expectations, whether it makes sense to drill a well today has everything to do with the expectation of future oil prices. I do not assume that Art Berman is any more capable of predicting future oil prices than I am and his analysis will be affected by his assumptions about the price of oil. If the losses in the oil industry calculated by Art Berman are correct, then eventually oil companies will start to go bankrupt unless oil prices rise.
If some oil companies stop producing (due to bankruptcy or inability to borrow), then oil supply decreases and the oil price goes up.
It may well be that everyone is just trying to hold on until their weaker competitors go out of business, in the mean time there are bills to pay and they try to keep the oil flowing to pay the bills.
Edit: On Art Berman being correct, I guess what I meant is that assuming he is correct may not be a good assumption.
Art’s analysis probably relies on assumptions and some of those may not be correct, I am sure that if all of Mr. Berman’s underlying assumptions are correct then his analysis is correct, the assumptions make a big difference.
“Let’s say you owned an oil company, what do you think the future trend of oil prices will be?”
I don’t know the future trends of oil prices and that is why I don’t invest in the individual stocks but in the whole index market. But I would not be drilling at this price NOW.
Hi Ves,
I do not know the future trend of oil prices either. Let’s take the stock market, something that you may pay attention to.
Why do you invest in an index fund?
My guess is that your expectation is that the general trend of the stock market will be up, unless you prefer to lose money.
If you owned an oil company, I am pretty sure you would have an opinion about the future trend of oil prices, wouldn’t you agree? This does not mean that your opinion will be correct, any more than someone’s opinion that stocks are a good investment will necessarily be correct.
Note that I also tend to invest in a broad index fund as I have had little success picking individual stocks, it is not worth the time and effort to me and seems like a crap shoot even with considerable research.
I also think the general trend of oil prices will be higher until 2030 to 2035, but I have no skin in the game. I think we will be at a minimum of $200/b in 2015$ by 2030 unless peak oil has caused an economic crash before 2030.
“Why do you invest in an index fund?”
There are many reasons but just to make a quick reply is this: “investing in index funds should, based on previous 400 year history of stock market, fulfill my financial goal (and that is to supplement income in retirement) correspondent with the risk that I am willing to take by investing in them”
Hi Ves,
So even though you do not know exactly when stock prices may rise or fall your expectation is that the general trend of the past 400 years is a good predictor of roughly what the next 20 or 40 years might be.
It may be that oil companies simply assume the price of oil will remain constant and base their investment decisions on the current oil price. If so, the current behavior does not make sense unless more drilling is done to survive until competitors fold.
From comments that Mike has made about the Eagle Ford, there is not a lot of drilling, but the completion work continues on wells already drilled and in a few months we will see output decline. Rockman over at peakoil.com says much the same.
Each of them knows 10,000 times more than me about the oil industry (at minimum) so we will see LTO output decline this summer or by fall at the latest.
I mostly agree with you that the continued high output from the LTO plays does not make sense. This is probably why Ron is convinced that the EIA estimates are wrong. I agree they are too high, but I would guess 200 kb/d too high (in April), Ron’s guess would be different (maybe 400 kb/d too high for the EIA estimates from the petroleum supply monthly).
Oil companies have internal oil price forecasts. There’s a private service which collects the forecasts and distributes them to participating companies, but they aren’t named (companies are identified with a letter code).
I’ve used those forecasts to understand the potential sale price for properties being considered for disposal.
I think many offers for such properties came from big time gamblers with extremely optimistic forecasts. When you see a company acting crazy, the behavior is caused by either a high price forecast, or the company is run by a crazy geologist.
Maybe they drill now because they already purchased the pipe, drilling rig and service company rates are very low, and they can afford to drill and wait 6 months to a year to get a higher price? This means they must be getting a 20 to 30 % discount on overall point forward prices.
Hi Dennis,
That is the beauty of continues investing in broad market because you are NOT concerned when the market goes up or down short term, and anyway you would not know. Do you care more, depending on long term financial goals (in my case income in retirement), what market does in 5 years or in 35 years?
Well someone will say” ohh but how do you know that just in time for retirement in 35 years market crash?” Well that is why you do annual rebalancing of your portfolio with weight moving from equities towards bonds at the rate that you think is appropriate with your risk appetite as you are nearing retirement.
There are 3 things that people don’t understand when they are investing:
1) They cannot identify their financial goals.
2) They don’t understand concept of Risk. (ind. stocks vs index or equities vs bonds)
3) And they don’t have a long term plan that they stick to it. (Market timing – meaning nonstop selling and buying is recipe for disaster)
And on the end if I don’t reach my financial goals (mainly beating the inflation) then I will have to work longer or spend less in retirement or give tennis lessons to farmer kids in exchange for milk and flour 🙂
or maybe I do nothing and that is actually very hard work 🙂 (breaking a habit of “doing mode” and relearning a habit of “being mode” o boy that is hard thing to do 🙂 )
back to the topic of oil,
yes, it think I agree with you we will have to wait little longer, probably until October to see how things develop with shale lines of credit and what the price of oil will be at that time.
Hi Ves,
I agree with your investment philosophy, it is much like my own.
Perhaps the oil companies are doing what is needed to keep their business functioning in hopes they can outlast weaker competitors.
In other words, they need a certain amount of oil sales to generate the revenue needed to keep the company going, no drilling at all would lead to rapid decline in output and a fall in revenue, so they are drilling just enough on their more productive leases to keep the losses to a minimum.
The companies in better financial shape can probably reduce their drilling (such as EOG and XTO) and weather the storm. Those that continue to drill are in survival mode.
Science goes on. That’s why wells are still drilled. We need to understand where the best locations for drilling are when price does rebound and we need to understand the best ways to complete wells in those locations. People outside of the industry may not see it, but we don’t just stick holes in the ground and hope there is oil. There is a mass of data behind every well that gets drilled and not acquiring that data for years because price is down hurts you on the backend. Yes, the number of wells that get drilled is drops significantly, but if you don’t spend your time trying to figure out the best locations and why certain wells produce the way they do, then when price rebounds (and it will), you are at a significant disadvantage. So you poke a few holes now, get your data, and wait for price to hit the number where you are comfortable that money will be made.
MBP
Great points.
That may be playing out, to some extent, right now in the Powder River Basin. EOG is taking the lead in a consortium, of sorts, with about ten other operators to systematically approach development of what one analyst has described as a ‘mini Permian’ in the PRB.
The stated goal is to have protocols (75% fed gov controlled), infrastructure, and – to an extent – geological understanding in place so as to optimally develop that resource in years to come.
More people buying Teslas?
EV sales worldwide are still up over this period last year.
http://insideevs.com/monthly-plug-in-sales-scorecard/
The electric revolution continues…
So those fortunate enough can drive to economic collapse in a Tesla; drive to protests and social unrest in a Tesla; get your car smashed in/with a Tesla; break your Tesla drivetrain on increasingly-unmaintained roadways from decreasing tax-revenue in a Tesla; wonder if you can find another use for, or where you’re going to find a replacement for, your dead battery in a Tesla; wait in line at bank runs in a Tesla; wait increasing times and spend increasing amounts of money for parts and service in a Tesla; drive to increasingly-empty grocery-stores in a Tesla; pick up hitch-hiking economic/ecologic/etc. refugees in a Tesla; drive through economically-depressed neighborhoods and gutted communities in a Tesla; re-adapt your Tesla for urgent self-preservation-related gardening and farm-work in/with a Tesla; get valuable materials stolen from your Tesla with a Tesla; drive home from a personal pink-slip event in a Tesla; pretend to be going to work the next day because you can’t bring yourself to tell anyone yet in a Tesla; camp out your home eviction in a Tesla; drive to an unemployment or welfare office in a Tesla; wait out rolling blackouts in a Tesla; pass by social unrest-vandalized EV recharging stations in a Tesla; trade in your Tesla for food or hunting or gardening equipment with a Tesla; wait for hours every workday in gridlock in a Tesla; commit suicide in a Tesla (but not the tailpipe-carbon-monoxide way); learn how to ‘hunt-and-gather’ along the highway in a Tesla; and last but not least, do roadkill the electric revolution way!
Drive cross country for free with the Tesla supercharger network.
http://www.greencarreports.com/news/1097109_tesla-supercharger-network-growth-surges-over-last-14-months
“Significant ecological impacts and major cultural investments in monumental architecture and statuary thus began soon after initial settlement.” ~ Wikipedia
Rapa Nui Supercharger network:
I guess someone has Tesla envy in their mom’s basement
Niobrara is located almost entirely within the states of Colorado and Wyoming. Yet the Drilling Productivity Report has Niobrara production 106,000 barrels per day below the combined production of Colorado and Wyoming, according to the Petroleum Supply Monthly. But of course the difference could very well be production, from those two states, that lies outside the Niobrara area.
North Dakota + Montana production vs. DPR data for the Bakken
Hi AlexS,
Based on this chart it looks like the DPR estimate for April is about 100 kb/d too high for the Bakken/Three Forks. Would you agree? I am assuming the DPR looks about right in Nov 2014 and assuming the ND+Montana data is correct so that the Bakken is probably about 1200 kb/d in April 2015 (ND and MT).
Yes, Dennis, I also think that DPR estimate for April is about 100 kb/d too high
It’s rather strange, given that NDIC and Montana’s Board oil numbers and EIA’s numbers for these two states are quite accurate and the DPR numbers are from June issue.
So the DPR team is using its own formulas and they don’t care about looking at actual data
Here are the numbers in kb/d
Ron,
Your charts show that growth in US oil production in the Mar-Apr and Feb-Apr was largely driven by Texas and New Mexico.
Below is the chart for January-April. It shows that these two states accounted for 93% of total US oil production growth in the first 4 months of the year and for 113% growth in US oil production excl. the GoM and Alaska. I also included incremental production from the Permian and the Eagle Ford, using the DPR data
Hi AlexS,
I understand the red part of the Permian and Eagle Ford bar, (from the DPR I assume), the red part of the TX and NM bar is the increase in 2015? So either the DPR has overestimated or the difference in the red bars is due to declines elsewhere in TX and NM. Is that right?
No that’s wrong, blue is Texas and red is New Mexico on one bar and blue is Permian and Red is Eagle ford on the other, I think.
Nice charts as usual, thanks.
Also I doubt the DPR is underestimating Eagle Ford and Permian increases, so AlexS’s excellent chart shows that the EIA estimate for TX and New Mexico is at least 20 kb/d too high, my guess is more like 100 kb/d too high in April, maybe more.
Dennis,
the chart shows the increase in production in April 2015 compared to December 2014
blue is Texas, red is New Mexico
blue is Permian, red is EFS
Hi AlexS,
Do you agree with my interpretation that this seems to indicate that if we assume the DPR is correct for the Eagle Ford and Permian, that the EIA data for Texas and New Mexico’s incremental C+C production in 2015 must be at least 20-30 kb/d too high?
If the DPR estimate is too high by 100 kb/d for 2015 change in C+C output for the Eagle Ford and Permian as I suspect, then the EIA’s petroleum supply monthly would be too high by about 120 to 130 kb/d for TX and NM incremental C+C output in 2015.
Dennis,
I posted this chart to show that two states, Texas and New Mexico,
and two plays, the Permian and EFS, were the main drivers of the US production growth in the first four months of the year. Unfortunately available statistics for those sources of oil supply are the least reliable among all US oil production statistics. I would not guesstimate which numbers are more accurate – the DPR’s or the main EIA team’s.
Besides Texas and N.Mexico oil production includes not only the Permian and Eagle Ford (see the chart below)
Hi AlexS,
Oh I think based on your chart of the Bakken, we can tell that the DPR is suspect, the EIA Petroleum Supply monthly is not perfect, but it is considerably better than the DPR.
I am aware that not all Texas and New Mexico output is from the Permian and Eagle Ford (for Texas about 86% of output is from the Permian and Eagle Ford plays). Your chart does indicate pretty clearly that all of the output increase from these two states
since 2007 has been from these two plays ( actually they account for more than 100% of the increase, so other producing areas of those states has declined somewhat).
One interpretation of that first chart (texas, New Mexico, Permian and Eagle Ford) is that the Petroleum Supply Monthly(PSM) would be about 25 kb/d too high, if the DPR is accurate for incremental production in the Permian and Eagle Ford for 2015.
Based on Dean’s Texas estimate, the PSM is about 400 kb/d too high, I would split the difference and suggest the PSM may be 200 kb/d too high. If that guess is correct it implies the DPR has incremental production for the Permian and Eagle Ford in 2015 roughly 175 kb/d too high (for Jan to April).
Here Ron watch this video it may help you see the cesspool that Wall Street has become.
https://www.deepcapture.com/2014/07/while-cnbc-searches-for-its-courage-glenn-beck-and-patrick-byrne-discuss-oligarchy-on-the-blaze/
Dr. Don, I am not at all surprised by shenanigans that took place under the Bush administration. I am a little surprised that you would use Glen Beck and Fox News as your source. That being said, nothing in that film even remotely suggests that supply and demand does not control the price of oil. Even if Bush’s Treasury Secretary was corrupt as hell, that has nothing to do with whether the price of oil is controlled by supply and demand or some mythical “Central Planners” or not. Consider this statement: “The price of oil is controlled by Central Planners because Wall Street is corrupt.”
That is the perfect example of a non sequitur.
Glen Beck considers boycotting Disney for making a film about Darwin’s “Voyage of the Beagle”
That has nothing to do with the subject being discussed but I just thought I would post it because it is so funny.
Maybe of interest to some here, maybe not.
From Whiting Petroleum 10-K for the period ending 12/31/2003 and ending 12/31/2014. I picked 2003 because that is when Bakken production started to take off in Elm Coulee Field, Richland County, Montana.
2003 ending PV10 $784,623,000
2014 ending PV10 14,135,400,000
2003 ending long term debt $188,000,000
2014 ending long term debt $5,628,800,000
2003 BOE per day 16,966 (40% oil)
2014 BOE per day 114,500 (80% oil)
2003 average product prices realized: $27.50 oil, $4.78 gas
2014 average product prices realized: $81.50 oil, $5.53 gas
Share price 3/1/2004 (adjusted for splits) $11.80
Share price a few minutes ago 7/2/2015: $31.47
Same information for Continental Resources
2003 ending PV10 $842,420,000
2014 ending PV10 $22,770,000,000
2003 ending long term debt $285,144,000
2014 ending long term debt $5,997,915,000
2003 BOE per day 13,405 (71% oil)
2014 BOE per day 174,189 (70% oil)
Share price 7/30/07 (adjusted for splits) $7.64 (IPO was in 2007 I think)
Share price a few minutes ago 7/2/15 $40.17
Some interesting notes from Continental 2003 10-K
Drilled first four horizontal Bakken wells in Richland County, MT. IP between 400-1,200 each. Each well cost between $2-2.5 million to complete. Each was assigned EUR BO (not BOE) of 500,000 barrels.
(Note, from 2014 10K, Continental plans to drill 186 net wells in Bakken in 2015, at a cost of $8 million per well, with an EUR average of 775,000 BOE)
Also from 2003 10K. Continental has long life reserves, relatively stable mature production, subject to gradual decline rates. Low reinvestment requirements to maintain reserve qualities and production levels.
Furthermore Harold Hamm was not only the person in charge of Save Domestic Oil, but in 2003 was also the president of the National Stripper Well Association.
I have identified 3 of the 4 wells that CLR completed in the Elm Coulee field in 2003, on Montana’s website. Unfortunately, I cannot see where I can get the cumulative production from the MT website, other than adding each month. Maybe have time some other day. However, of those three, one has been shut in for several years, one is producing under 20 barrels per day, and one is still producing 70-80 barrels per day, and will likely be the only one to hit (if not already) the 500K BO EUR as projected in the 2003 10K.
Interesting stuff to me, hopefully to someone else as well.
Thanks, shallow sand, very interesting indeed
One thing almost no one besides me focuses on is debt to PV10 ratio.
2015 is MY ESTIMATE based upon Q1 borrowings and oil and gas prices to date:
Whiting Petroleum
2003 24%
2014 40%
2015 94% * my estimate
Continental Resources
2003 34%
2014 26%
2015 72% * my estimate
SD debt to PV10 per 2014 10K 58%
HK debt to PV10 per 2014 10K 77%
Both will be over 100% per 2015 10K IMO
SD share price currently .76 and HK share price currently 1.10.
No reason WLL will not be here by end of 2016 and CLR by end of 2017 assuming current NYMEX strips and continued borrowing to drill.
Once a company’s debt to PV10 hits 100%, they are insolvent.
Wonder when main street investors will wake up to this?
Hi Shallow sand,
I agree with Alex S your comments are very interesting. Thanks.
Hi Shallow sand,
I checked cumulative output on a couple of wells (not Continental) from 2001 and cumulative was in the 180 kb to 250 kb range. you can get monthly production for the wells and download to an excel file and just sum up the barrels. A lot of work, Enno Peters has super skills and could probably automate this process, I unfortunately never learned how to write proper code for Excel so am of little help. I usually brute force these things and my time would be better spent just figuring out how to write the code.
Dennis, what was the early production on those Elm Coulee wells?
I am starting to think Elm Coulee could be a good analog for ND Bakken. For EUR purposes, anyway.
I wish the MT website had cumulative production by well. Maybe it does, and I just have not found it yet.
Hi Shallow sand,
I decided to discard the files. There is an excel button that lets you download files. I did figure out that for wells that started producing between 1986 and 2007 only about 7% of the wells had been abandoned through 2015. This was from a sample of about 600 wells most of which started producing after 2001.
If you have access to drilling info you could probably get this data easily (I do not have such access).
Dennis. Thanks. I will look at MT closer.
If you were calculating profit/loss over a five year period in ND Bakken, for a well drilled this year, what range of production would you use.
In other words, would 150-350K oil and about the same in gas be accurate?
I realize there are many variables, and we never know what will happen with any oil/gas well.
I guess it would be interesting to see a five year high case and low case.
I think I am getting a better handle on LOE, although bad things can happen there too without notice.
Thanks for all the info!
Hi shallow sand,
Looking at Enno Peters data 92k to 285k is the 5 year cumulative for 60% of the wells, the mean is about 152k. I used a log normal distribution to assess.
Thanks Dennis! That is much lower than I thought.
Assume $55 oil in field and $2.50 gas in field over 60 months.
200,000 mcf gross gas sales over 60 months.
10% severance tax (recently enacted)
20% royalty
$14,000/ mo. OPEX over 60 months
$100,000 down hole repair CAPEX annually
$1.oo per BOE G & A
$8 million to drill and complete. $4 million funded from other well cash flow, $4 million borrowed at 5%.
Real quick I get:
285,000 BO in 60 months net $9,051,333
152,000 BO in 60 months net $3,890,933
92,000 BO in 60 months net $1,562,933
So the high case barely covers, low case and mean are both a financial disaster IMO.
I have been using 220,000 for the mean, thinking maybe with a recovering oil price in 2017-2019 they could make it up.
This is worse than I thought, and I am pretty negative on shale economics.
As always, if I made a computational error, please advise.
Hi Shallow Sands,
Does $55/b over 60 months seem reasonable?
If prices remain at these levels it will surely be a financial disaster. Note that $55/b at the wellhead would be about $67/b WTI, if transport costs are $12/b on average. pipeline capacity has been expanded in North Dakota so average transport costs are probably less than $12/b.
You need to create a more reasonable oil price scenario and evaluate on those terms.
If you believe that WTI will remain $67/b for 5 years, you would be unlikely to be drilling more LTO wells.
Did you discount the cash flows in your analysis?
Remember a barrel today is worth more than a barrel tomorrow(due to both inflation and the time value of money).
Also by using the lognormal distribution the average ends up close to the median well, there are a bunch of highly productive wells which skew the distribution for the wells with 60 months of output so that the mean cumulative for 60 months is 194 kb.
Let’s say the oil companies can eliminate the lower 40% of the distribution by selective drilling, so that only the wells in the 40% to 90% part of the distribution (the more productive wells) are drilled. If we take the mean of that truncated distribution it is 216 kb with 68% of the wells (if the distribution is normal) between 148 kb and 243 kb.
Perhaps the oil companies are using that kind of logic to justify drilling or think oil prices will rise to $75/b. Try $63/b at the wellhead and the EURs above to see if LTO has a future (at low oil prices).
And remember that all oil companies think that they drill above average wells.
Hi shallow sand,
I created a scenario using your assumptions.
For gas I assumed 20% of BOE is gas, I ignored borrowing costs and I assumed that WTI starts at $64/b and rises over time.
If prices follow the scenario in the chart below this works for the average well, where net present value of the first 60 months of output is equal to well cost of $8 million.
Spreadsheet at link below:
https://drive.google.com/file/d/0B4nArV09d398RW5seHlyQ2RRdWM/view?usp=sharing
Dennis. I have no idea where oil prices will be the next five years. I sure hope better than I assume in my calculations.
Of course, with front loaded wells, 2015-2016 prices are much more relevant than 2017 and beyond.
How we were able to expand greatly in early 2000’s was due to the result of very low oil prices in the late 1990’s.
The local industry was so beaten down, that one could buy production and buy puts for 2-3 years that would make payout pretty certain, provided the leases were operated properly and decline rates held, which they did.
The opposite now appears to be true for shale, being that buying puts or hedging through SWAPS or costless collars now will guarantee that shale producers CANNOT payout their wells drilled in 2015. They will largely be doomed to economic failure, except in the very best area’s such as Parshal. I think many of the other good spots, such at WLL San. pool are pretty well drilled up. Just look at the map.
Drilling and completing wells with the hope that prices will rise significantly is very dangerous unless you have the cash to do so and do not mind losing it. Even ConocoPhillips and Marathon Oil do not have the cash to do this.
What the shale drillers refuse to accept is that they now control much of the crude traders perception. See what adding just 13 oil rigs did to prices, WTI is back down to $55.
I really hope oil does not head back down below $50 WTI, but that may be what it required to finally shut the credit lines and high yield debt funding off.
Mike was exactly right months ago as to what these shale drillers should have done. That was pay the penalties and shut down all rigs. Conserve cash and try to ride it out.
The debt expansion just prolongs the low price agony and will end up dooming almost all of these companies.
As I have been touting recently, look at long term debt to PV10 ratio. Companies that pass 100% are in big trouble, and I think almost all the shale drillers will be there or close when the 10K come out in early 2016.
Contrary to Mike, I think there could be another early 2000 opportunity around the corner for smaller producers with the shale wells in the Bakken Once companies go BK, everything will be beaten down, but there will be over 10K wells out there capable of producing at low decline, low water cut for many years. If a small operator can pick up the right one’s, could make a killing when oil goes back up. That is why I worry about vertical well deviation. I think I would be more inclined to focus on older wells, which may not only have better well quality, but may also have refract potential in the event high prices come back and. persist.
Elm Coulee is very interesting to me. It is no longer a hyped area. CLR has many, many wells there, and it might be a good place for a small producer to take a shot in the event CLR goes BK or has to conduct a fire sale.
Just speculating, but I would not mind picking up 10 Elm Coulee wells making 10 net bopd average for say $20-25K per net BOPD, once the crash has fully set in and every one is beaten way down. When oil then rebounds to $100, with LOE at $25, you are looking at a one year payout.
I have a feeling EFS will not be a place I would be interested in, however. I think decline in those will likely not stabilize so well. Permian have no clue, but so much is on old shallow HBP acreage that it would be too complicated, and too competitive.
Who knows?
Hi shallow sand,
Oil prices are of course unknown. The lower they go the worse it will be for oil producers, the oil market may be anticipating fallout from the Greek vote this weekend. If Greece exits the Euro it will create a lot of uncertainty in the short term.
Eventually some of these producers will throw in the towel, at that point prices will go up unless there is a European financial crisis.
Shallow Sand, your assessment of shale oil economics is basically correct; don’t be dissuaded from it. WTI is not 65 dollars a barrel and moving higher, it is 55 dollars a barrel, down 7 bucks the past 30 days, and moving lower. Remember the V word we have talked about that will now forever throw a kink in the predictability of LTO economics. A five year payout on an 8 million dollar well, using borrowed money, is a poor business decision, regardless of the “ifs.” Nobody, I repeat nobody can predict the price of crude oil. Shale oil economics DO NOT work. I am astounded at how few people get that. It is a waste of time to be predicting the future of LTO in America without discussing profitability, debt and future financing.
My beliefs regarding EUR type curves and when economic limits might be reached are primarily based on my learned experience in the Eagle Ford. You would be absolutely correct in avoiding 12 year old EF production. My doubts about shale wells after year 12-14 are based on reservoir performance, fracture closure, loss of reservoir energy, increasing water saturations, operational issues with low fluid entry wells on rod lift at 9000 feet TVD, cost issues with high WOR wells on rod lift at 9000 feet TVD and a host of other reasons, including what I believe will be 150-200,000 dollar per well plugging and decommissioning costs. Some of those factors may not be the same for the Bakken, most of the them will, however. Including winter weather. I would not be too quick to rush to judgment of the longevity of Bakken stripper wells based on a few 10 year production curves from a few wells on one Bakken field. Re-frac’ing economics are far from proven.
Money matters.
Mike
Mike. I am speculating re Bakken wells long term. Much of that comes from vertical well performance for holes drilled pre 2000. Those wells generally were kept running through some pretty tough economic times.
Chances of us actually doing anything up there are pretty slim in reality. A long way from home. But low volume wells can be operated from long distance with one good pumper.
We have made good money on the “leavings” of some major independents, that btw used to be integrated companies till they listened to wall street too much. May be opportunities in some of these shale wells some day, maybe not.
I do think EFS will not be one, mostly due to your info, but partly due to looking at RRC PDQ. The decline is worse than bakken, which is really saying something.
I do agree, no experience w 10,000′ well bores. Had some non-op at about 5,500′ which were ok. Rest is under 3,000′ so need to watch what I say. a lot of internet oil in my deep well views.
I think maybe the sh– is going to hit the fan for shale in a year or so. I’m just not a patient person.
I have been hitting on debt to PV10. Keep in mind, that includes PUD.
If we use debt to PDP PV10, shale oil was mostly at 100% or more, all will be at year end.
PV10 of course, are future cash flows discounted to 10%. Some banks have been using PV9 due to low interest rates. That is the most aggressive I am aware of.
I am absolutely astounded that I never read anyone in the finance industry mention PV10 in relation to shale oil company debt. Heck, they barely mention PV10 at all.
That is the sign to me there is much BS out there.
Shallow, I understand what PV10 is. I am also very aware of the dance that a shale company does in determining its booked reserve base. Including PUD’s, for instance, that require more borrowed money to drill. It’s ridiculous and therefore I do not put much stock in the discounted present value of over inflated, un-audited reserves that a public shale company indulges itself in. The true debt to asset ratio for most of these shale companies at the moment is, in my opinion, far worse than you can imagine.
Shit has already hit the windmill for the shale oil industry. One only has to look back in time 10 years to see what a debacle the shale gas industry was, for instance. History is simply repeating itself. Why people have such a hard time understanding the failed economics of shale oil is perplexing to me. Speculating about it’s future clearly has a very high entertainment value.
Mike
Hi Mike,
You are right the economics looks bad, I am trying to reconcile why the drilling has not stopped. The breakeven price using Shallow sands estimates and the average Bakken well is $77/b. If oil price starts at $43/b and rises by 10% per year until reaching $172/b in 15 years, then the net present value of future output is about $8 million using a 10% discount rate.
You are correct that nobody knows future oil prices. What do you use for an oil price when making decisions? I would think you have to make some guess about the future, even though Texans don’t like estimates 🙂
Dennis, respectfully, you are using too many if’s again. It’s clear to me those companies still drilling shale wells are the very biggest of the big with sufficient reserve bases to continue to borrow money. They are taking advantage of what I believe is a 25% reduction in drilling and completion costs, economy of scale, and some of the best acreage in the best sweet spots. What wells are being drilled now in this economic climate I almost tend to believe are necessary wells; necessary say from the standpoint of drilling commitment clauses in leases, guaranteed production volumes in hedge contracts, even reserve bookings that might be necessary in loan agreements. Otherwise, I don’t know why they are still drilling wells. It makes no economic sense to me at all. If you could get the sumbitches to tell the truth they would probably say exactly the same thing.
Forgive the dumb analogy but it seems to be these shale oil guys are addicted to money. They cannot shake the addiction; as long as their is money to buy they are going to keep drilling wells. Part of the addiction is denial about their long term health. They also believe oil prices are going to go up and they will eventual be able to shake the addiction and be cured. The shale industry’s denial is so deep it cannot help itself any more; when prices do recover the dealers will be on the street with more money and the shale oil industry will grab every bit of it they can and drive the price of oil right back down again with over supply. The LTO industry knows there is something very wrong, it does not know how to fix the problem except to drill itself out of trouble. I have never seen that work in 50 years, ever.
I believe it is never a good idea to make a decision as to drilling a well or making a production acquisition on the hope that someday oil prices will go up, thank you for asking. I have 11 wells to drill beginning late 3rd quarter. I have justified all of these wells economically using 65 dollars per barrel…over their entire life span, and they will still be producing 20 years after I eat the dirt sandwich. Do I believe that oil prices will be 65 dollars in 5 years? No. But I cannot make a prudent business decision based on hope. I have minimum time to payout and ultimate return requirements and I can make that work at 65 dollars. I must deal with the reality of today, not tomorrow. When prices increase someday, it will be, as they say in Louisiana, lagniappe. But I am not counting on that.
It is important to speculate about the future of LTO production in America. It will have a direct bearing on our future. Respectfully however, I think most people posting here are completely missing the boat. For the shale industry to survive it must somehow reduce it’s addiction to money, become profitable, and manage it’s debt. There seems to be a general assumption that the money will keep flowing into the shale oil industry because of a few articles on the internet and some quarterly reports by CLR, or whomever. I don’t think that will be true much longer myself.
But, I am not in the shale business. Thank, God.
Mike
Hi Mike,
For the average Eagle Ford well assuming shallow sand’s estimtes for OPEX, etc can be applied to the Eagle Ford and a well cost of 7.5 million on average and transportation costs of $5/b, the breakeven is about $65/b.
I have assumed about 20% of of the BOE is casing head gas) and the focus here is on oil wells rather than Gas wells. Also note that at these low prices the cash flow becomes negative at 85 months, I have assumed the well is shut in when cash flow becomes negative, the well is producing 17 b/d at 85 months. If oil prices rise at 10%/year after 5 years, then the well can go to 12 years before becoming cash flow negative.
This confirms that at $55/b these wells do not make sense, economically, $66.5/b is needed to cover abandonment costs along with initial well costs and operating costs,G+A, taxes and royalties (30% of wellhead revenue), downhole maintenence, and transport cost assuming oil prices remain at $66.5/b forever.
Edit:
Mike was writing at the same time as me.
Hi Mike,
I agree completely with all you say above, the average Eagle Ford Shale well almost works at $65/b, they need $66.50 to break even with a 10% discount rate. Out of curiosity, what would you use for a discount rate? I imagine 10% is too low in the real world, would 15% do it, can you give way your secret to success? 🙂
Note that if I bump the discount rate up to 15%, the break even oil price goes to $69/b, at 20% it is $72/b.
Spreadsheet for eagle ford at link below (it is set up at a 15% discount rate but that can be changed to anything that makes sense, then adjust WTI price so that NPV is more than 7.7 million note that these are “real discount rates”, the nominal discount rate would be 3% higher (assuming 3% inflation). So a 10% real discount rate would be the same as a 13% nominal rate, if inflation was 3%.
https://drive.google.com/file/d/0B4nArV09d398Z2lIYmx6c0hNaHc/view?usp=sharing
Dennis, I agree with everything you’ve said and the methodology you have used to reach your conclusion. 65 dollars will allow the shale oil folks to pay back their drilling and completion costs. But that is really not the point, is it? Profitability is. Being able to pay back over 300 billion dollars of debt is.
How can the Bakken be that much different, really, than the EF? Higher EUR’s but steeper decline rates. Higher well costs, higher transportation costs and lower oil. Those guys are going down up there too.
Using PV10 is what we say in the oil business, “API.” It is standard. It’s what the SEC requires. Everybody uses it. Personally, PV15 makes far more sense to me given the funky definition of proven reserves the shale oil industry uses.
In any case, the importance of understanding the significance of PV10, or PV whatever, when evaluating the shale oil industry is critical. PV10 will put all but one of the big 7 shale producers in America, EF or Bakken, under water and drowning by year end. That is the story, that is what should scare the beegesus out of all American’s. Imagine what the price of oil would be without American LTO!
Well, unless those shale boys can get their ca-ca together, quick, there will no more LTO business.
I am a broken record. My opinions are rooted in a half century of oil and gas exploration. I have seen booms and busts and many price collapses. I get checks from these shale wells, and see the costs. It does not take a degree in accounting, or reservoir engineering, to see the economics of shale oil is failed. But I have to work getting my oil out of the ground and don’t have time to make charts and models, google this and google that all day long to prove my point. My comments I am sure are viewed as pessimistic. I believe they are realistic.
Shallow and Rune seem to be the only ones that truly understand the significance of profitability and debt to the shale oil industry and can write about it in meaningful terms. Predicting the future of LTO and when oil production will peak in America, and in the world, now depends on how all this very expensive, marginally profitable, or unprofitable unconventional shale oil stuff can be paid for.
You are getting with the program, Dennis. Stay with it.
Mike
Hi Mike,
I appreciate that you, Rune, and shallow sand have taken the time to educate me.
I know you don’t waste your time with toy models, but I imagine when deciding whether to drill a well you are looking for a certain rate of return, the discount rate essentially is this rate of return and when I say 10% discount rate for the well, this is essentially a 13% rate of return on the investment in nominal terms (assuming an inflation rate of 3%). So the well is profitable at $66.50/b, but probably not profitable enough given the risks of getting oil out of the ground. Can you tell us the nominal rate of return you use for your business when evaluating projects? If I use a 15% nominal rate of return would that be close to realistic?
On a different note I was wondering about OPEX.
Shallow sand suggested $14,000/ month with $100,000/year for down hole maintenance ( which I did monthly at $8,333/month) so a total of $22,833/month for OPEX (it seems to me that this yearly maintenance should be a part of OPEX, though accounting rules may treat it as CAPEX).
The problem with this in my view is that I would expect OPEX to be higher if the well is producing 500 b/d, than if it is producing 10 b/d. Fernando has suggested a fixed plus variable formula with OPEX equal to
A+Bx, where x is the output of the well in barrels per month. Does that make sense?
What about A= $10,000/ month and B=$4/barrel where x is in barrels per month, would that be a good rough start, any suggestions for more realistic valus for A and B based on your experience?
DC, Mike is just upset that people outside his field are doing the math, and doing a better job at it. In the climate arena it is not so bad, because amateur weather geeks have long held their ground against the pros. For instance, the El Nino modeling is really looking interesting.
Scope, my industry does not actually have the need to “model” peak oil issues. We are in the business of finding oil and gas to make money, not to make guesses, for instance, about the future of shale production in North Dakota. You, like so many others, don’t have the ability to discern shale production that is hardly 10 years old and that represents 5% of total world production, from conventional production that has gotten on very well, thank you, without the peak oil community’s assistance the past 150 years.
For me to be upset about your math models I’d have to feel those models were important in helping me find, and produce more oil and gas. I don’t.
Mike
So why are you here?
Not to engage with you about things you know absolutely nothing about.
Given the new age of “Permanently lower oil prices,” SUV’s of all sizes continue to sell like crazy, and estimated vehicle sales for the US have been revised upward for 2015.
http://www.usnews.com/news/business/articles/2015/07/01/jeep-sales-drive-fiat-chryslers-8-pct-june-us-sales-jump
Why would people want to buy fewer US cars anyway? Why is there this bizarre US green desire to preserve oil barrels for use by the Chinese?
Car dealers have learned to never underestimate the chronic ilnumeracy of the general public. Sell ’em low mpg SUV’s at a price premium when gas prices are low, then when gas prices inevitably explode, take them back in-trade at a fraction of their value, replaced with a new high-mpg compact (now also selling at a premium price). Maximize profit at both ends of the cycle.
Trucks and SUVs make more money for the auto makers, which would suggest that the margins are better on those vehicles, which would also suggest that consumers are getting less value for their money than if they bought more fuel efficient vehicles.
In other words, the consumers are getting ripped off, to some degree, but perhaps don’t realize it.
The Unconventional Black Swan
Ronald Walter,
As the advent of shale has been announced years ago, I am not sure that shale is really the black swan. Announced revolutions do not take place. The real surprise will come in my opinion that this was the last hurra.
Reply to Shallow Sand’s question to me from the previous Bakken article posts.
Yes, I am retired since September 1999. With respect to coping with zero interest rates, my brief story [leaving out details that would take pages], and applicable to almost nobody.
I was always good at math, became a tax CPA and have always done my own taxes and invested without any financial advisory help. In the 1950’s, starting in 7th grade, dad put me to work at the JC Penney store that he managed. In 9th grade, he made me open a savings account to put in money for college. That is the last savings account that I ever had. I have never invested in bonds. I have never invested in mutual funds. I have never owned a CD. I was always interested in the stock market, and in 1965 within 90 days of getting out of the army, I opened a brokerage account with Merrill Lynch. Small stock investments, picked them myself – maybe 4 or 5 shares and $200 at a time. Made a lot of mistakes. Read the Wall Street Journal every day. I have always been 100% invested in stocks during good times and bad [since retirement, I usually about 3-5% in cash, enough to last a year]. You have to fully accept the ups and downs – like a gambler. If a gambler puts down $20 on red and it comes up black, he will not quit gambling and he will not fret about it. If you are right 2/3 of the time, the returns on that difference, for me, have vastly exceeded what reasonable interest bearing investments would have brought.
Suppose it goes down, and stays down. Like France’s market in 1939.
Or up, like France’s market in 1939.
btw firecalc.com
Probably invalid now since that world doesn’t exist anymore, but you should be familiar with the statistical solutions.
No “probably” about it. I try to be charitable, but sometimes it is just not possible. If anyone ever read anything about France in 1939 and then tried to obtain some investment insight from such reading ………….. well, they need to pay for professional investment help.
You didn’t understand. France’s market from 1900 to 1938 and deep understanding of it would not have helped you in 1939.
And that’s often as far as it goes.
Little if any talk about the chaotic perturbations in a particular system/game and its dynamics played out over time…
Kid: Daddy, why did Communism fail?
Dad: Well, people learned that if there is no benefit to working harder than someone else, why work at all?
Kid: Is that the only example?
Dad: Well, no. When the Pilgrims landed in America in the 1600’s they discovered the same thing. Some people did not want to help to produce food, but they wanted a share of the food that the rest of the people had raised. So, the Pilgrims instituted a system of “no work” then “no food.”
Kid: Did that solve the problem.
Dad: No it did not. The people that did not want to work started calling such a system “corrupt.”
Kid: So, what is the major problem with that?
Dad: The people who do not want to work and who want to destroy our system since it is “corrupt” get the same right you do. You each get one vote.
“Indeed I have always been of the opinion that hard work is simply the refuge of people who have nothing to do.” ~ Oscar Wilde
“The oppressed are allowed once every few years to decide which particular representatives of the oppressing class are to represent and repress them.” ~ Karl Marx
Never heard of Jason Read [I do not “read” in those circles, no pun intended (which always means a pun is intended)]. But, he seems to be saying exactly what I would expect of someone who does not want to work, but wants all of the benefits. Self indulgent writing is not work, in my humble opinion.
There’s a peculiar irony or ironies that I would be speaking, in albeit, limited, fashion about human work-level and ‘benefits’ with someone, presumably within a 40-hour workweek culture, on a fossil-oil-depletion-related site, where such a substance as oil that requires such little work to extract and produce compared to the (squandered) work and ‘benefits’ it produces; and where some of whose members seem especially interested in technology, presumably with the idea that it somehow augments quality-of-life, such as with regard to efficiency and reducing work… But no matter…
When we think about work, what are we thinking about and are we thinking the same thing? What is it? And when many of us ‘work’, how does it affect our world– what kind of work are we doing– and might we be sometimes putting 8 loaves of bread on someone else’s table for every 2 we put on ours?
“Here’s good advice for practice: go into partnership with nature; she does more than half the work and asks none of the fee.” ~ Martin H. Fischer
”“Did you know that before the Industrial Revolution, the average person worked for about two or three hours a day? Studies from a wide range of pre-industrial civilisations show similar data– it takes only about fifteen hours a week to provide for all of our basic human needs. And that’s using hand tools.” ~ Walden Effect
Sometimes I am provoked to the extent I forget myself..
Only a very poorly informed person or a FOOL could ever believe such bullshit. In a VERY FEW places it is or used to be possible to live as a hunter gatherer during certain parts of the year and lay in the shade most of the day. Life expectancy was thirty years or less. Not many people around back in those days.
OTHERWISE – the vast majority of the time thru history -you worked your ass off.
Fifteen hours a week did not suffice to supply my families basic needs back when I was a kid and we were all farming partly by hand and partly with machinery. It took that long or longer JUST to grow and process the food we ate on a year around basis. Sewing and laundering sufficient clothing using a SEWING MACHINE kept my mom busy another hour more days than not. Sky daddy alone knows how long it would have taken had she had to grow her own cotton and wool and used a loom rather than buying cloth.
Of course some people would not consider staying warm and dry in a winter rain or a blizzard a basic human need. We spent a full day a week just cutting and chopping and toting wood during the winter months. When my Mom and Dad first got married just toting water from the spring to the house took Mom an hour a day.Of course some people do not consider having water to bathe in a basic human need.
Specialization enabled us to produce a huge SURPLUS quantity of apples, peaches, and certain field crops such as green beans -but you cannot live on apples and green beans. We sold them and used the money to buy METAL tools ranging from axes to tractors. Roofing and nails. Glass for windows.
But given the amount we could earn by selling, it was still practical and economic to grow nearly all our own food- because we had near ZERO middle man costs doing that – no shipping, no wholesaler, no retailer, no trip to the store, no need for new containers every purchase – I still use glass canning jars now getting upward of a hundred years old. The only reason to discard one is if you drop it and break it.
Men and women alike we averaged working ten hours a day at least. I worked an hour a day from the time I was in school – minor chores such as feeding chickens, keeping the kitchen wood box full – until I was around ten or twelve. From then on I worked a couple of hours a day on more important chores plus helping with ”adult” work.
Growing up that way I learned to emulate serious adults rather than prancing rock stars and professional athletes.
I will try not to forget myself again but there is a limit to the foolishness beyond which I cannot help myself once in a while.
I work 20-30 hours per week and I’m retired!! Sometimes way more than that. Of course, I like to work and am always building. Work = staying alive and contributing.
Ron’s blog is very serious work as well as everyone’s contributions.
We had visitors this week and I had to socialize every day for a few hours. I slowly went nuts in a hammock on the river bank. As soon as they left I got a couple of hours in on my sons tractor. Way more fun.
The quote you cherry-picked clearly states before the Industrial Revolution, and so not necessarily all the way back to classic hunting and gathering. Also…
“Paul Wheaton explains the benefits of creating a permaculture system. He describes that, once constructed, this system essentially runs itself according to nature, allowing the farmer to relax until harvest season.
Douglas Gayeton: What is your definition of permaculture?
…Permaculture is a symbiotic relationship with nature so that I can be even lazier. If I do things today, I could give a gift to my future self. For example, one of the techniques I can use is the build a hugelkulter bed. This is basically a large mount with soil on top of wood. If I build it large enough, I don’t need to irrigate, fertilize, worry about pests, or plant seeds. I only need to harvest. Therefore, I saved my future self a great deal of annual effort. For me, permaculture is about how I set up a system that will continue to pump out food without further interaction on my part.
Douglas Gayeton: Why do you emphasize the term laziness when you talk about permaculture?
Paul Wheaton: When I talk about permaculture, I use the word ‘lazy’ because producing food in a traditional garden strikes me as a lot of work. It turns out that you can create a system where it takes no effort at all, with the exception of harvesting, to get the same food.
Is that not a worthy thing to seek? When talking about agriculture on a large scale, whether it’s organic or conventional, the tractor makes an average of seven passes across the land to do things, and each pass is petroleum powered. How can we convert that system to something that requires only one pass per year to produce food?
Douglas Gayeton: What is the difference between permaculture and organics?
Paul Wheaton: My favorite example is the Colorado potato beetle. In an organic system, when you have the Colorado potato beetle, your first job is the panic. You will need to do something now to save your crop. You will usually sprace[sic] something organic or you’re going to smash bugs individually.
In a permaculture system, you’re not going to be growing things in rows of monocrops. You’re going to add a lot of texture to the landscape and have your potatoes growing in all kinds of odd places throughout this bizarre landscape. If you see a potato plant that has Colorado potato beetles on it, you don’t acre. Clearly that potato plant shouldn’t be there and Mother Nature, acting through the Colorado potato beetle, is going to take that plant out. Once that potato plant is gone, something else will do really well there.
In the meantime, in another patch, there is a potato plant that doesn’t have any Colorado potato beetle on it and it won’t get any. That’s a healthy thriving plant. It won’t succumb to the Colorado potato beetle. When you have a long row or a field of potatoes, everything is homogenous. The soil has roughly the same pH, the amount of sunshine the plant gets is roughly the same for all plants, all the conditions are the same. If those plants get hit by the Colorado potato beetle, they’re all going to be equally susceptible to the pest.” ~ The Homesteader
@Paulo, sure, if you can minimize the work you dislike then, if you’re so motivated, you can enjoy more of the work that’s fun. I generally don’t mind fun work or working for myself, my family and my true community.
Mentioning specialization and apparent and relative monocropping may have enabled you to blow yet another hole in your own foot where I am concerned, old farmer mac. But that seems par for the course and a hole in one for you.
Just because old ‘farmer’ mac and family did things in certain ways years ago doesn’t stand to reason that it must be that way now or in the future, nor that others can’t do things differently– and better. But of course some folks can’t be helped or don’t want to be, sometimes maybe because they think that their way is simply superior, or the only way, the way they are merely familiar with, or because it’s their way or the highway.
Before laying down text calling anyone or anyone’s ideas foolish (and I use quotes from many others which in turn reference others), I would respectfully suggest you practice it beforehand in a good mirror until you get it right.
It’s high time we start thinking and talking about working smarter as opposed to harder, and with respect and relative to nature, and then applying it.
This whole culture’s practically a fool’s errand.
“The Eden that Europeans described when they reached North America was not a wilderness, but a well-managed resource, a complex combination of nature and culture, ecology and economy, a system so subtle and effective that it eluded the settlers who saw only natural wealth free for the taking. The result of this land grab in North America is that only 2% of the land is now wild, its major rivers are polluted, its lakes have caught fire, and its forests are dying from the top down. The tragedy of this commons was that it never really was a commons after colonization, but was surrendered to plunder, privatization, and exploitation in the name of Manifest Destiny and progress.” ~ intelligentagent.com
“Forests precede us, while deserts dog our heels.” ~ Derrick Jensen
I am sorry I forgot that arguing with a fool is a waste of time.
I have read hundreds of history books and have a degree in agriculture from a major research university. I have forgotten more about farming than all the dreamers and idiots you continuously quote.
You see NOTHING. Specialization is the key to living a decent life unless maybe you own your own tropical island with fruit dropping year around and fish in the tidal pools.
It would have been literally just about impossible for us to have manufactured our own axes and glass never mind a tractor.
We sold apples enough to BUY pipe which we could never have created on our own to pipe water into the house.
Now as far as living the simple agrarian life envisioned as an ideal by Thomas Jefferson and other thinkers , that is an admirable IDEA.
But it has never happened and it never will since organized societies overrun simple ones.
The SHIRE is my favorite place in all of the literature I have ever read. But even in the Ring Trilogy the bad guys are out there.
Most likely I will be able to refrain from responding to such unadulterated bullshit for a couple of months.
Your chest-puffing/-thumping and noise-making aside, apparently, without effective long-term/sustainable/regenerative agro– which in part presumably means some so-called ‘farmers’ pulling their heads out of their asses– we will be lucky if we have much time for any other form of specialization beyond some forms of so-called agriculture– ‘your’ apples-and-beans ‘monoculture’.
Perhaps some agro curriculums advised (or still do) on, say, the proper admin of Roundup or offered courses in ‘Antibiotics For Feedlot Livestock’, or the students could take a ‘work-study/co-op’ semester with Monsanto and learn about ‘new and exciting GMO’s on the horizon’ or how to feed cow by-products back to cows for even madder cows.
Garbage in, garbage out, old farmer mac.
(*psst*: Methinks old farmer mac doesn’t actually know much, if anything, about permaculture.)
United Nations Calls for an End To Industrialized Farming
Quote from the article:
“In 2013, the United Nations announced that the world’s agricultural needs can be met with localized organic farms. That’s right, we do not need giant monocultures that pour, spray and coat our produce with massive amounts of poisons, only to create mutant pests and weeds while decimating pollinators and harming human health. Don’t believe the hype: We do not need genetically modified foods ‘to feed the world.’.”
Duh.
And kindly do us a favour and increase the signal to noise, if you can. This is, after all, a peak oil (and effective responses) blog. Thanks.
https://www.youtube.com/watch?v=QfYCrLq1DJU&feature=youtu.be
Virtually no one can “pull his own weight” in terms of “energy slaves” per capita. In our hierarchical system of obscene income and wealth inequality, especially for hoarded overvalued financial assets at no velocity, the top 0.001-1% enjoy an equally obscene and highly economically inefficient (uneconomic) share of the net energy per capita from “energy slaves”.
Rather than tax labor’s earned income, production, and productive capital accumulation, it is much more economically efficient to tax highly progressively net energy per capita/household consumption to encourage conservation, efficiency, and increase earned income as a share of output.
This is unlikely to happen, as the hyper-financialization of the US economy since the 1980s, and especially since 2008, has become “policy”, i.e., creating and sustaining unprecedented financial bubbles as a share of wages and GDP in order to encourage the so-called “wealth effect” (proven dubious).
However, now the net annual flows to the financial sector and its top 0.001-1% owners now equal annual GDP output, i.e., labor product, profits, and gov’t receipts are pledged to the rentier owners of the financial sector in perpetuity. No growth of real GDP per capita less net flows to the financial sector is possible.
Therefore, we often hear that poor, working-poor, and working-class Americans who receive gov’t transfers are getting “money for nothing”. However, unearned income in the form of interest, dividends, capital gains, fees for services in the financial sector, pension and benefit payouts, etc., is also a form of “money for nothing”, but we are conditioned to perceive the income as a result of skill, intelligence, hard work, thrift, delayed gratification, deferred consumption, etc.
Yet, the income is a transfer from labor, profits, and capital formation/accumulation. One comes from gov’t taxing labor and capital and/or borrowing from private-sector financial capital accumulation, and the other comes from corporations or ownership of private financial capital accumulation.
Accelerating automation of paid employment and firms deploying the intelligent systems will use even more “energy slaves” in place of paid employment and purchasing power of labor hereafter. No one can compete for “energy slaves”, hours worked, and purchasing power with intelligent systems, robotics, biometrics, bioinformatics, telepresence, etc., operating 24/7, in the dark, and at the speed of light, taking a larger share of “energy slaves” per capita, wages, and GDP in the years ahead.
Fewer hours worked at higher wages/salaries and/or some form of equity ownership/profit sharing of intelligent systems means of production and/or a basic income guarantee/income subsidy will be necessary in the next 10-20 years; otherwise, we risk the collapse of the mass-consumer economy for the bottom 80-90% of households.
Here’s an article about how some billionaires are talking about spreading more wealth around.
Billionaires to the Barricades – The New York Times: In March, for instance, Paul Tudor Jones II, the private equity investor, gave a TED talk in which he proclaimed that the divide between the top 1 percent in the United States and the remainder of the country “cannot and will not persist.” Mr. Jones, who is thought to be worth nearly $5 billion, added that such divides have historically been resolved in one of three ways: taxes, wars or revolution.
Clueless. Started investing in dividend reinvestment plans in college. Never hold much cash, other than in farm and oil operating accounts.
My problem is knowing when to sell. I am horrible at it. Also, absolutely hate paying capital gains taxes. GE, Coca-cola and Prizer are prime examples of mistakes. Dead money for years on end.
Also, in 2008-2009 saw balances drop over 50%. I think that would scare the crap out of me as a retiree. Especially as I start to detiorate mentally. So hard to find someone to manage a stock portfolio.
Concern is knowing that stocks after 1929 crash did not recover till 1954.
Shallow – I know that it is not easy, and that my path is not one easily followed. Sorry for your misfortune. I learned with small amounts, over years of time. With a historical perspective, GE and Coca-Cola around 1999 were selling at price to earnings multiples of over 3 times the previous 100 years average. With respect to Pfizer [I assume “Prizer” is a spelling error], the drug stocks got to 30 year lows on a price to earnings basis in the period of time [generally] shortly before Clinton’s election and the year following. I was buying during that period of time. Then, in September of 1999, all major drug companies were selling at near record high multiples – – – and I sold every share I owned.
Anecdote: I have a handicapped brother, and in 1962 my mother [who had just divorced dad (who drank too much)], knowing my interest in stocks, gave me $200 and said buy some stock that you think will grow and help Tommy. I invested it in Pfizer. Tom is still alive and that $200 is worth over $35,000 and [I think] pays an annual dividend of over $1000. I would have to check, but I think that it was worth more in 1999, but, nonetheless, shows the power of long-term investing. A lot of it is a feel that you get over the years. About 13-14 years ago, I owned some Enron. There were about 20+ analysts following them and virtually all of them had a buy or strong buy rating. But, the stock started going sideways to down. I did not have a clue, but it did not seem right. I sold it all and found out why later.
U.S. oil rig count rises by 12. The price of oil seems too low to justify an increase of rigs, so what is going on ? LTO production dropping significantly ?
WTI getting crushed because the rig count went up 12.
Loan a shale oil company money, they will drill a hole, to quote David Einhorn.
Dr. Don,
That was yesterday, because of inventory rise and hope for an Iran nuclear deal.
The Baker Hughes Rig Count
Here’s some news about Venezuela
http://blogs.platts.com/2015/07/01/pdvsas-operational-decline-mirrors-decline-in-employee-benefits/#comment-606260
The black market rate is 490 bolivars per usd. Seeing signs of fractures within Chavista ranks. The government has announced they will hold national elections in December, but refused having international observers from impartial organizations.
The Maduro regime is obviously in danger of collapse in the relatively near future.When it comes it is going to be extremely painful on the people but sooner rather than later is probably their best hope. The longer it takes , the longer the suffering will be prolonged.
Now here is one thing that nobody has ever explained to me in terms that make any sense at all.
We read in this blog article posted by Fernando that an oil worker is making the equivalent of fifty cents to a dollar fifty Yankee per day. No economist or pundit ever seems to dispute such figures. I have been seeing them tossed around for years.
But there is absolutely a zero chance of anybody actually living on the purchasing power of a buck a day spent here in the USA. You cannot buy enough dry beans and flour for a dollar a day in this country to live.
So why the Fxxk dose every body repeat this sort of garbage?
What is an oil worker in Venezuela living on in terms of what it would cost if bought here in the USA ?My seat of the pants guess is that between various subsidies which may or may not be available etc the average worker who is supposedly making a buck or two is actually making at least ten bucks or twenty bucks in dollar equivalent purchasing power. For fifteen or twenty bucks you can buy enough of the cheapest sort of staples by careful shopping here in this country to ( inadequately ) feed two to four people plus maybe a bottle of aspirin once in a while. If you have to you can wear the same clothes until they literally fall apart and put cardboard in worn thru shoes. You can just quit paying rent or mortgage payments if everybody else does the same, or you can double and triple up or live in the street . Your teeth can be left to rot. You can live without seeing a doctor or having a hot bath etc.
But you cannot live and do physical work very long without taking in a couple of thousand calories and some protein and minerals.
There is a difference between extreme poverty and actual starvation. You will starve on a buck a day in the USA barring somebody GIVING you food.
I do not have more than a very foggy idea how much a working Venezuelan is making but it is more than a dollar and a half yankee equivalent a day by any HONEST accounting.
Pointing this out repeatedly over the years has never gotten me any answer other than insults .
Mac, it’s a mixed bag. First, the exchange rate: it ranges from 6.3 bolivars per USD to 490 bolivars per U.S. dollar. The rate many like to use is the SIMADI, which is used by the government to dole out bolivars to any foreign investor willing to bring money in. SIMADI is at 198 b per usd.
The government imports food and sells it at a low price. My guess it’s equivalent to 20 to 50 b per $. But this is low quality and there isn’t enough (this leads to huge lines when food shows up at the market). A food rationing system is in place to try to reduce the lines.
So most items other than the subsidized food sold at government markets is sold at the full SIMADI rate (used in this article), or at the 490 black market rate. Things such as shoes, clothes, medicines bought in Colombia, spare parts for cars and buses, cell phones, light bulbs, and sports equipment are all priced at the black market rate.
This means a worker can barely feed his family with extremely low quality food, and can’t afford to pay for a back operation for his mom because she needs a prosthesis and other imported goodies. He can’t buy decent shoes for his kids, nor that baseball bat he had promised his 14 year old.
These union workers are used to living quite well, the oil field jobs always paid above average, but nowadays they are getting screwed. Maduro is mentally retarded, he seems to believe the communist bullshit about everybody making a miserable wage and supporting a bunch of communist party parasites living in mansions and surrounded by bodyguards.
And this is why when these regimes fall the proletariate is the first to take the rope and hang them by the neck.
Thanks for this background info.
The very cheapest non welfare rent I know of back in these hills is a hundred bucks a month for a house that is ready to collapse. The landlord actually could care less about the hundred bucks and would just as soon bulldoze that old house but he lets the family stay in it so long as there are no complaints. He will evict them and burn it rather than fix up the house which is basically too far gone to repair it.
The four people living in it simply must have somewhere in the neighborhood of twenty bucks a day to buy ( non welfare ) food and a few necessities such as soap and flea market clothing.
I am talking an absolutely bare bones existence from one day to the next , beans, potatoes , cabbage – just about homeless and not far from actual starvation. No doctor, no school supplies, no luxuries of any kind except a small black and white tv. Outdoor plumbing. No car. No phone.
The minimum electricity bill is around thirty bucks a month. That keeps a refrigerator and a couple of lights on.
SO- a man supporting his wife and two kids at this level here in the backwoods of Appalachia working is making two hundred bucks a week or more. Some do not work at all of course except maybe some under the table work. They live entirely on welfare of one sort or another.
The ones making minimum wage with full time jobs – close to three hundred bucks a week – get food stamps free school lunches etc.
Anybody in Venezuela supporting a couple of kids MUST be making somewhere to close to this amount in terms of ACTUAL PURCHASING POWER HERE in the USA , or is receiving the difference in subsidies.
He sure as hell is not living on the equivalent of two bucks a day yankee dollars by any intellectually honest accounting. His shelter may be even more decrepit, he may not have electricity at all. But his true income cannot fall to two bucks a day in American dollars except using an exchange rate to make the comparison.
The underhanded intellectual trick is that the average nincompoop who reads this crap is stupid enough to just extrapolate to thinking a person can live ENTIRELY on four pounds of potatoes a day (at fifty cents a pound which is a cheap price here in the states ) and NOTHING ELSE AT ALL.
Most oil workers own their homes and have them paid off. Electricity is heavily subsidized. They get the subsidized food from a government market, don’t but pay most bills, don’t have much medical care, can’t afford to fix their 1992 Chevy Lumina, are selling furniture….
You see, these conditions emerged over the last 24 months. Inflation is running at 100 % plus, they aren’t getting raises, the subsidized food gets worse. Most of them can’t afford toilet paper or shampoo.
I think the ongoing nature of the crisis just escapes you. A few months ago I sent some money to a family to help them survive. The black market rate was 275. Today it just hit 497. That’s over say 5 months.
And this is why there’s so much theft and corruption. Everybody who is able to do it is stealing whatever they can. Or they help thieves who are running wild around the pant perimeters.
Look, in 2002 I heard a gang cut one Km of an oil pipeline for the steel. 8 inches of thick wall schedule 80, taken over night. The oil spill was fairly large, and later two workers died during the rush job to patch the line. So what do you think happens now? It’s total anarchy.
”I think the ongoing nature of the crisis just escapes you”
The Nature of the crisis is clear enough to me but the actual extent of it in terms of the oil workers was not – until I read your reply just now.
What you are telling me is that even the oil workers are very rapidly falling into the most desperate sort of poverty and are already or soon will be unable to support their families at even a bare subsistence level.
The revolution cannot be very far off. At some point the people are simply going to turn on the authorities even if they are gunned down in the streets for doing so.
No doubt you are familiar with the history of Solidarity in Poland. History does not repeat but it does rhyme to some extent. ( Sometimes I think you and I are the only two people who hang out here who have spent any time actually studying the history of communism.)
I believe the Venezuelan people will throw out the Maduro regime within the near future.There may or may not be quite a bit of bloodshed.
Who knows whats going to happen? The Maduro regime has an extremely sophisticated repression and spy system. They use software to track phone messages, use of the Internet, and put wire taps all over. The set up is run using Cubans. Last night I saw a letter sent by the phone company to the secret police with very detailed information about sone Twitter users who criticized the government.
These young people were captured and are kept in jail without holding a trial on orders by Harrington, a venomous Torquemada figure. I understand these serial abusers are seeing their bodyguards murdered, so maybe the party is about to start.
By the way, Harrington is one of the seven sanctioned officials which Obama singled out as particularly vicious and corrupt.
Here’s a link to an op Ed by tutu discussing Venezuela in the wsj
http://www.wsj.com/articles/SB11760718815427544683404581070303188592870
The bolivar hit 500 last night.
I am only an arm chair rather than a real historian but it is common knowledge that there is a discernible progression involved in the collapse of such a government.
The regime in order to last must accomplish at least a couple of things. IT must maintain an income in order to support itself, and it must take at least minimal care of the welfare of both the workers bringing in that income and the welfare of the workers of the security or repression apparatus.
I have not yet heard anything about the goons such as Harrington and his underlings not being able to feed themselves and their kids. I never hear anything about the soldiers and cops starving in North Korea either.
But with the oil workers being unable to support themselves and their families already , or fast approaching this level of poverty, the income stream is in great danger of collapse. Production is WAY off already.
As things get worse it will eventually occur to some of the people who are in a position to do it to burn down some refineries and tank farms.
I doubt a fire deliberately set by somebody who knows his stuff , a refinery engineer or maintenance supervisor, could be put out due to a lack of adequate manpower and equipment-ESPECIALLY if somebody opens a few critical valves and cuts a few critical power cables just prior to starting the fire.
This could probably be accomplished with as few as four or five men in on the job. Maybe even just two or three. It’s a cinch that the fire fighting equipment has been neglected, maybe even stolen, and that safety training has been extremely lax. Half the men on the scene would probably run instead of manning their fire fighting station.
If the oil workers can’t live, then the death of the regime is a given, it’s just a matter of time. There is nothing supporting it except oil revenues so far as I can see.
It may be the redneck in me coming out but this sort of government is the primary reason nobody will ever get MY firearms until they pry them out of my cold dead fingers.
My favourite all time response to this type of situation was made by Todd, (and many of you remember him from TOD).
Keep your head down and stay off lists.
Friends, food/water, network, and guns are a given, imho.
@ Paulo (just above):
If you think Todd from TOD didn’t make it onto all kinds of lists then I have some prime swamp…err..I mean farmland to sell you in Florida.
Cheers!
Venezuela: Monday black market rate at 519 bolivars to the usd.
An interesting turning point in the NE Nat Gas market.
http://www.eia.gov/naturalgas/weekly/
Supply decreases slightly. Dry natural gas production decreased slightly this week by 0.2%, averaging 72.1 billion cubic feet per day (Bcf/d), 4.8% higher than last year’s levels, according to Bentek Energy data. Imports of natural gas from Canada decreased by 0.8% overall, with eastern Canada becoming a net importer of natural gas from the U.S. Northeast. LNG sendout was down 17.1% week-over-week, remaining at minimal levels. Total supply decreased for the week by 0.3%.
This may bounce around in the short term, but the writing is on the wall in the longer term. I suspect the Midwest market will be next? With Mexico taking more Nat Gas, and LNG export, starting up this year, it can’t be long before the US finally becomes a Nat gas exporter.
I assume that you meant the US becoming a net natural gas exporter, since we have been exporting gas to Mexico for quite a while. BP shows US dry gas production of 70.5 BCF/day in 2014, versus consumption of 73.5 BCF/day. Note that changes in gas storage year over year can affect the consumption number.
Longer term, the problem I foresee is putting on line about 17 BCF/day per year of new gas production, which will be necessary to offset declines from existing wells, assuming about a 24%/year rate of decline from existing wells.
To put 17 BCF/day in perspective, Canada + Mexico’s combined 2013 dry gas production was 18.5 BCF/day in 2013.
So, all we need to do in order to maintain current gas production is to put on line virtually the productive equivalent of Canada + Mexico, every single year.
Jeff,
You are correct, I meant “Net Exporter”. I do realize you always quote how much capacity has to be brought on line, due to the fast depletion of these wells. In the early years of Haynesville as in the current years of the Marcellus, depletion is extremely rapid, but the rush to drill HBP wells seems to out pace the pipeline takeaway capacity.
It is interesting to note, that Haynesville after hitting a peak of 7.2 bcf/d in Jan 2012, when the price of Nat gat was in double digits, stabilized around Jan 2014 at 4bcf/d, with prices in the $4 mcf range, and maintained that for the last 18 months, with a current rig count of 27 and max count of 50 rigs at any one time. Current prices are now below $3 mcf and May production is at 3.977bcf/d. As per http://www.eia.gov/naturalgas/weekly/img/ShaleGas-201505.xlsx
It appears this 4bcf/d supply can be maintained without an expanding rig count number. I suspect the tail on the gas shale wells, maybe more stable than the tail on the oil shale wells. Though I believe we will have to wait a little while for this to be confirmed. Now what financial gyrations these gas shale companies are going through, I have no idea, I am just following the production figures.
Jeffrey, the decline rate changes over time. It will be much lower in 20 years. My guess is that it will stabilize at 10 to 15 % for the full well population.
Do ya think?
I’m getting extremely tired of going over this again and again.
I am stipulating a “What if” steady state production scenario, which means that a very high percentage of production in any given year comes from wells put on line within the previous two years, which means a very high overall decline rate.
Maybe you should model it? I’ve been doing it since 1978, when I first ran into very hyperbolic declines. The models I’ve run had 30 to 40 year well lives with a 10 % to 8 % decline after year 5. The key is to build a huge well population, and having the plateau rate steady out so that one keeps on drilling to fill in for the decline. It’s also useful to assume EUR declines over time.
I’ve been able to generate steady plateaus in real life drilling 6.5 % of the producing well population year after year.
This means that a 1000 well population requires 65 new wells per year, and 65 wells are abandoned (this allows recycling the pumping units and well equipment).
How many of your case histories were very high decline rate shale plays?
In any case, Louisiana, with a mix of conventional gas and shale gas, showed a 20%/year net decline rate from 2012 to 2014, which of course means that the gross decline rate from existing wells in 2012 and 2013 was higher, and probably much higher, than 20%/year.
I wasn’t working with “shale” in 1978. But that’s not relevant because the curves were hyperbolic. This takes a very analytical approach using hyperbolic decline curves which eventually become exponential. It’s evident that the higher the overall rate the harder it is to meet the plateau. So the other key is to bring the plateau to a reasonable level.
I see the oil and gas industry works in a pretty weird anarchy, producers don’t seem to share ideas and coordinate infrastructure, and they behave a bit cowboy. I’m used to a much more disciplined approach, organizing joint venture pipelines, plants, and whatever else we can to reduce costs and improve economics.
Toolpush,
When examinating the numbers, the opposite is the case and Canadian net imports are strongly on the rise. Although Eastern Canada is a net importer of US gas, Western US net imports are at record high. Total Canadian imports are up 15,7% from last year and Western US imports are up 42%. The numbers are somewhat distorted due to the heat wave in the Pacific Northwest, yet the underlying trend stands for a strongly falling US production down from over 74,5 bfc per day in December 2014 to less than 72 bcf last week. Inventory build last week was just 69 bcf – a three year low and would be much lower if not for record Canadian imports.
2.5 bcf per day is over 300,000 barrels boe per day less than six months ago. So the natural gas market is way ahead of oil in production decline. Lower oil prices in the months ahead will force companies to cut capex even further and this will restrict natgas production even further. By year end production will be in my estimate at least 10 % lower and the US natgas market can only hope that Canada has enough gas to send to the US.
Hi Heinrich,
If your scenario is correct, what will happen to natural gas prices? What happens after that to the rate of new wells brought online? This will then affect the supply of natural gas, demand might also be influenced by the change in natural gas prices.
There are also a number of projects to expand pipeline capacity in the Marcellus and Utica plays where there is more output capacity than pipeline capacity at present so wells are being choked back du to lack of transport capacity.
Dennis,
As it is difficult to watch the detailed numbers I watch just the macro numbers. It may be true that there are a lot of uncompleted wells, yet it is difficult for me to verify it. Therefore I observe the market by the ratio of gas prices to oil prices. If the ratio goes up it indicates that there is less supply for natgas in comparison to oil. Gas was more an aside from oil drilling as the high oil price subsidized gas production, hence the gas price did not matter very much. Companies made cash from oil. As companies make less cash from oil and liquids, the gas/oil ratio is now up more than 50% from last year. This indicates less gas production versus oil. As in my opinion the oil price has a long time to stay low – I still remember our discussions a few weeks ago and actually observe the UGAZ/UWTI ratio – oil cannot subsidize natural gas production anymore and companies need therefore a higher gas price. The UGAZ/UWTI contains everything. It includes also the change in legacy rate, which has changed considerably over the last few years. Production managers think in my experience in a linear way and very likely do not consider that they have to invest much, much more to achieve the same growth as in the latest years. In my opinion the UWTI/UGAZ ratio indicates already a dramatic turnaround in the natgas market.
Mr. Leoplold
Current production/status data from Ohio’s Utica/Marcellus is freely available on a weekly basis from their regulator’s site Ohio Division of Natural Resources. Way more data than even the ND folks provide and at no cost.
As of last Tuesday, there were 917 producers and 429 either drilled or being drilled.
The West Virginia Department of Natural Resources offers the same info on their site, but at the moment it is only updated annually, I believe.
The big enchilada, The Pennsylvania Marcellus/Utica has monthly updates on their state’s Department of Environmental Protection site. As of the end of April (posted on June 18), there were 6,629 producers and 2,674 wells either drilled or being drilled. (Some of the drilled are fractured, but I do not know how many).
Pennsylvania wells are currently increasing by two a day.
There is a whole cottage industry arising in collecting, analyzing, disseminating shale-related data via the internet. Fascinating stuff.
I’ve kicked in a few bucks – via subscriptions – to a few sites so as to save me from wading through reams of numbers. MarcellusGas.org has way more graphs, charts, numbers than even the folks on this site and seems to provide exceptionally comprehensive info
coffeeguyzz,
Thanks for giving me your information. Although I am checking many websites, it is difficult for me to understand what is just promotion and what are the facts. So I am trying to base my opinion on information which is independent from any manipulation. Price of oil is already an important information, yet it can be manipulated as well to a certain degree as companies and governments can increase inventory or sell and buy on the futures market. However backwardation and contango gives much more information about the situation of a market. Currently the natgas market goes into backwardation being years in strong contango (up to 50%). This tells me that companies cannot sell anymore on the futures market as it is more favourable to sell on the spot market. So far companies could sell natural gas on the futures market for the double of the spot market price. This is why RRC (Range Resources) can still drill like hell as they have a strong futures balance (sell gas for above 4.5 mfc instead of spot 2.5 mfc). However, RRC has only some good hedges this year (80 to 90 USD per bbl of oil and just 3.5 mcf for gas) and next year they have to sell at spot. As virtually all profit of RRC comes from the hedge book, RRC has to curtail production already as it makes no sense to sell 2016 futures.
The best and most reliable information comes from the relative change of oil versus gas prices. This gives information about the shift between these two markets and phases out any manipulation and misinformation.
This week alone the relative change between oil and gas prices has been over 23% (related to UGAZ/UWTI). And year over year the difference is over 100%. Although both markets are weak, the relative change is just an teutonic shift and indicates much higher gas prices in the future.
Heinrich,
I came across this article that basically backs up all I was saying about pipelines, Marcellus and Canadian Gas.
https://oilandgas-investments.com/2014/investing/the-very-bearish-case-for-canadian-natural-gas/
The Very Bearish Case for Canadian Natural Gas
Canadian natural gas prices could drop by well over half in 2015 as new pipelines allow very cheap Marcellus gas to flood North America says a November 4 report by Canadian brokerage firm Macquarie Securities.
The report–titled Red Dawn–says Marcellus gas could displace western Canadian gas in Ontario, the Midwest and even the US west coast–forcing Canadians to accept huge discounts in their gas prices just to be able to sell their natural gas at all.
The report outlines how inter-connected the North American gas grid is. And a huge flood of Marcellus gas is already changing gas flows across the entire continent. Macquarie outlines TEN new pipeline flow increases into the Midwest, FIVE into the US Northeast, and THREE into eastern Canada.
As I understand it, the EIA is estimating that the Marcellus needs about 8 BCF/day of new production per year, in order to maintain current production.
“All hail the Mighty Marcellus” …. Julius Ceasar
(Mebbe)
Push
The operators there are regularly drilling 5,000’/7,000′ laterals with 40/50 stages at depths from 6,000’/9,000′. Cost about $6 million per.
Much of the current drilling is either for delineation or retention for lease holding, but several operators are running out of time to HBP (most leases were for 5 years, also).
Within two years, takeaway will increase by several BCFd.
Over at the Peak Oil site, there was a posting describing the shallower Upper Devonian as having over 30TCF recoverable, qualifying it as a supergiant … and practically no one has ever even heard of it.
Lottsa gas coming out of there in the coming years, Push.
Lead item on Drudge:
Greek banks down to €500m in cash reserves as economy crashes
http://www.telegraph.co.uk/finance/economics/11714655/Greek-banks-down-to-500m-in-cash-reserves-as-economy-crashes.html
Maggie had the Socialists figured out a long time ago.
They always run out of other people’s money. It’s quite a characteristic of them.
You obviously have that confused with ALL other isms as that is exactly what got us in this situation by allowing the banking/finance sector to run rampant on other peoples money.
Socialism has ALWAYS budgeted social programs through real economic revenues not debt. Problem arises when this perceived success is seen as a revenue stream that can act a collateral for loans and gov officials deem it beneficial to society to draw on that.
Funny, I’ve always found the banking/finance sector people to be quite level headed. It’s everyone else that’s nuts.
That’s not what I saw socialists aka commies do in Venezuela, Cuba, and elsewhere, they go in debt to their ears, default and blame capitalists. It’s a bit childish.
By the way, I wrote a post in my blog about Syriza, including a funny photo and everything. You should get a good laugh reading it.
Yeah Jef, they start borrowing and pretty soon they run out of other peoples money. 😉
Debt appears to be substantially more addictive to politicians than even the worst drug is to a susceptible individual.
Debt would be ok if it were used ONLY to finance useful undertakings such as building NEEDED infrastructure. But a SUBSTANTIAL part of it always winds up financing nice cars for government employees.
A car pulls up in front of a hillbillies shack and the driver lowers the electric window to ask the hillbilly directions to a neighbors house. Hillbilly asks him to identify himself.
”I’m with the War on Poverty.”
Hillbilly takes a long look at the car with govt tags and replies ,” Looks like you winning.”
It is imagined that any anthropologist of the far future would kill to be a fly on the wall during this civilizational collapse. In any case, perhaps Greece, with a dash of the ME, is the general shape of things to come.
If they sign onto the new BRIC banking system run by Russia and China, the credit cards will still work.
And if they can guarantee they won’t send money to EU creditors, I’m sure Russia or China could step in to help out with the relatively small fiscal primary deficit, which would disappear entirely with a Russian oil discount.
It all comes down to the 320 billion. Russia isn’t going to give them money that they then send to Russia’s enemies. Much like the EU won’t give Ukraine money that has to service loans they carry from Russia.
Possible food supply problems in Greece:
http://news.yahoo.com/greek-bank-closures-may-deplete-supermarket-shelves-155431880–sector.html
Jeffrey,
One interesting thing we realize here in Europe is that we are running out of coins. In Greece and Bulgaria there are basically no coins available and it seems also in the rest of Europe, people are horting coins. This reminds me to a story of a Belgian company owner (Au Pain Quotidien) whose grand father horted coins during the second world war, so that the children could take a bath in the coin pool in the cellar. The argument was that new paper money could be printed quickly, yet coins will keep the value all the time. This was the way his grandfather survived the second wolrd war. I am curious what the Central bank will do about this, because a shortage of coins will certainly slow down the business.
CO2 EMISSIONS THREATEN OCEAN CRISIS
“Writing in Science, experts say the oceans are heating, losing oxygen and becoming more acidic because of CO2.
They warn that the 2C maximum temperature rise for climate change agreed by governments will not prevent dramatic impacts on ocean systems.”
http://www.bbc.com/news/science-environment-33369024
Sounds like the typical propaganda we are seeing this year. The article in the BBC quotes these guys babbling on without showing any evidence. They fail to quantify what’s the actual change they project in ocean ph or oxygen content on a regional basis. As Paris approaches we can expect loads of bs popping up to get people to agree to whatever they think is convenient.
I traced the paper via a different article, and here we see why most of this material fails (it uses RCP8.5 as a Business as Usual Case). The IPCC seems to have created the RCP8.5 to serve as a fundamental piece in their propaganda machine. And most scientists don’t realize a lot of what they are doing is based on a garbage projection.
http://www.sciencemag.org/powerpoint/349/6243/aac4722/F1
And most scientists don’t realize a lot of what they are doing is based on a garbage projection.
Do you really believe that MOST scientists lack critical thinking skills and are unable to gather data themselves and correctly analyze it?!
Yet, one self proclaimed genius, know it all, retired petroleum engineer, is able figure everything out on his own!!
Seriously, Bro, give it a rest already, you don’t know half as much as you think you do and your are blinded by ideology!
I think most scientists are too specialized, or are eager to get published. Getting published in a field such as marine biology is rewarded by going along with the RCP8.5 bullshit.
You see, I jumped out of my chair when I saw the IPCC RCP8.5 case, but I study lots of different fields, so the graphs jumped out like a sore thumb. I seriously doubt a college professor who wants a steady career would dare challenge rcp8.5. That would be like challenging the Quran in an Iranian school.
Fred, your lack of curiosity could be overcome if you ever decide to read in depth the material, rather than trying to insult me. That approach you use doesn’t work. I AM smarter than you in this area, but you can catch up.
Fernando just to be clear, I am not trying to insult you! But you do come across as an arrogant know it all with a big chip on his shoulders! Nobody can be an expert on everything! Yet you insist on denigrating scientists who have spent their entire careers to become specialists in fields that you have not!
Let’s say three specialists in liver cancer, professors of medicine tell me I have a malignant liver tumor, I do not then do my own research by reading medical books and then decide that maybe they are wrong and I don’t need surgery and chemotherapy.
Yet that is exactly what you are doing with regards climate science and specifically the impacts of ocean acidification. And yes, I do know that that oceans are alkaline and not acidic. Whether you accept the facts or not, tropical coral reefs are in serious trouble all over the world and acidification caused by increased CO2 pollution is a big part of the problem.
BTW it might surprise you to learn that I actually have studied this subject in considerable depth… no pun intended! If you think we don’t have a problem then,you sir, are wrong!
Fernando is apparently marvelous
https://www.youtube.com/watch?v=ygs-4GfqPcM
Fred, your analogy missed the mark. Let’s go over the problem one more time:
A few years back, the IPCC decided they would have four cases used to test the climate models. These cases were designated RCPs. The scientists were told to match a greenhouse gas forcing set up by the IPCC. Reference is below (pik postdam de).
I realize your condescending and patronizing attitude towards my opinions arise because I’m just an engineer. But my career evolved so that I had to supervise a lot of professionals, including very high powered scientists. I was expected to get these people to work together and to create quality products. I was also given the responsibility to sign off on their capabilities (this is a delicate matter, because we did things which could get lots of people killed).
So in spite of having only a simple engineering degree I have been trained for over 40 years to read and understand the way outfits like the IPCC did their work, and how it can, and is, being misused.
The key focus should be on the rcp8.5, a case prepared by scientists to meet a preordained objective. Let me repeat: rcp8.5 yields the answer the IPCC requested. There was very little science, but a huge amount of politics on how this came to pass.
Now we see this case, which many consider an exaggerated global warming projection, to be the base case used by tens of thousands of scientists performing follow up studies.
In other words, the system was rigged and now we got a pile of garbage being generated. And the beat goes on.
http://www.pik-potsdam.de/~mmalte/rcps/
Hey Fernando, again, I’m not being condescending towards you. Furthermore I too have had positions of responsibility where I trained software engineers to interact with customers and I also had a job teaching both scientists and engineers to use a very high end technical and scientific graphics application. BTW a lot of those engineers happened to be Petroleum engineers. For the record I was always more inclined to have a higher level of respect for those people who tended to show a modicum of humility with regards the fact that they did not know everything as opposed to the fortunately rare know it alls who usually had more difficulty learning what I had to teach them, precisely because they already had everything figured and weren’t open to new ideas.
As for the IPCC, I have always recognized it as being a political organization however my main differences with you have nothing to do with them!
There is real science done by scientists all over the world that are telling us that: ‘Houston We Have A Problem’.
I’ll just stick to ocean acidification caused by CO2 and what it is doing to coral reef ecosytems. This is not due to some vast conspiracy of greenies wanting to become rich on grant money.
I can provide plenty of links to scientific papers and I’m providing one link here to NOAA’s site on ocean acidification as a starting point. Of course if you think the NOAA is part of the conspiracy then it probably won’t help much.
http://www.pmel.noaa.gov/co2/story/Ocean+Acidification
If you’d like to do an experiment and better understand how pH affects coral ecosystems may I suggest you set up a living coral reef aquarium or two, one as a control.
Once your reef communities are stable allow the pH in one of the tanks to start decreasing over time and maintain a log of the changes and deaths that will start to occur. Keep in mind that an aquarium is a highly simplified and artificial ecosystem but it should serve to at least partly illustrate in a very stark manner what happens in marine ecosystems… Disclaimer keeping living reef aquariums is neither easy nor cheap!
Here’s a graph from that NOAA link.
CO2 is causing a decrease in ocean pH levels and that in turn is having major effects on marine ecosystems.
Can’t be much clearer than that. Thanks Fred.
The magnitude of the impact is higher than it looks from just charting the pH changes, dramatic as that looks alone. The pH is buffered by carbonate ions and as the pH drops these are used up and are therefore not available to produce calcium carbonate, which is what makes up shells.
It’s not having a major effect. A lot of their moaning arises from their extrapolations using rcp8.5. The IPCC orders up a funky case which lacks a sound basis, then the results are sold to scientists who use them “because the IPCC says so”. A lot of this global warming hysteria is driven by rcp8.5. Get it? It’s total bullshit.
That link just goes to yet another government run scientific messaging service that reeks of a liberal agenda.
Let me tell you this, the oceans are not anywhere close to being ‘acidic.’ Period. A mix is acidic if it has pH below 7.0, it is alkaline if pH is above 7.0. The ocean’s pH is well above 7.0, not a trace of acidity to be found anywhere, let alone to somehow be ‘increasing’ as a consequence of enjoying the low cost and reliability of generating electricity from fossil fuels.
And about that electricity generation, even the EPA’s own models show that the 30% carbon emission reductions desired by their new out-of-touch and burdensome regulations will only cut temperature increases by 0.018 degrees over the next 100 years. Seriously, they want to spare you a temperature increase of 18 thousandths of a degree in 100 years, with the only trade-off for you being skyrocketing energy bills. Does it sound like you’re getting the good end of that deal?
Of course if you can’t deal with the minuscule temperature increase you could move to a cooler climate. For example, you could increase your elevation by 2 feet to counter the 18 thousandths of a degree temperature increase if the EPA’s regulations are not imposed.
Happy Independence Day to everyone reading here today. May God continue to bless our country and keep us the freest people in the world. Enjoy the rest of your day!
Grotesque, arrogant right-wing propaganda. Get real.
Let me tell you this, the oceans are not anywhere close to being ‘acidic.’ Period. A mix is acidic if it has pH below 7.0, it is alkaline if pH is above 7.0. The ocean’s pH is well above 7.0, not a trace of acidity to be found anywhere, let alone to somehow be ‘increasing’ as a consequence of enjoying the low cost and reliability of generating electricity from fossil fuels.
Just as a reference:
Arterial and venous blood must maintain a slightly alkaline pH: arterial blood pH = 7.41 and venous blood pH = 7.36. Because the normal pH of arterial blood is 7.41, a person is considered to have acidosis when the pH of blood falls below this value and to have alkalosis when the pH rises above 7.41.
Just curios do you know what happens to a human when his blood pH falls to 7.0 or below ?
Ocean Acidification
On the pH scale, which runs from 0 to 14, solutions with low numbers are considered acidic and those with higher numbers are basic. Seven is neutral. Over the past 300 million years, ocean pH has been slightly basic, averaging about 8.2. Today, it is around 8.1, a drop of 0.1 pH units, representing a 25-percent increase in acidity over the past two centuries.
Carbon Storehouse
The oceans currently absorb about a third of human-created CO2 emissions, roughly 22 million tons a day. Projections based on these numbers show that by the end of this century, continued emissions could reduce ocean pH by another 0.5 units. Shell-forming animals including corals, oysters, shrimp, lobster, many planktonic organisms, and even some fish species could be gravely affected.
Pay no attention to the trolls behind the curtain. It’s all about the equilibrium of the carbonate ions.
The mental children who do not want to accept responsibility for their actions are squirming under their disingenuous cover story blankets. They know, but to acknowledge would be to grow up and that is not happening.
Ever try to argue with a three year old? Waste of time. Take away their toys and send them to their rooms. They do not deserve our time.
It’s not about the equilibrium of carbonate ions, it’s about life forms being able to build using carbonate at a given ph. As it turns out, they can handle the ph from cases other than rcp8.5.
If the work being done wasn’t based on so much bullshit we would be saving a lot of money.
It’s not about the equilibrium of carbonate ions, it’s about life forms being able to build using carbonate at a given ph. As it turns out, they can handle the ph from cases other than rcp8.5.
It’s not about the rcp8.5! There is plenty of research and data from sources that are not connected with the IPCC.
Marine organisms might be able to handle lower pH if that were the only stressor. It isn’t and warming seas are a big problem as well!
You obviously don’t know much about coral reef ecosystems!
You can do your own reading on Google Scholar.
Seriously get yourself some living reef aquariums to get at least a feel for some of the issues involved.
BTW, are you saying that everyone on this list is a bullshitter?!
If so, what is your evidence for saying that?
http://ipcc-wg2.gov/AR5/images/uploads/WGII-AR5_Authors.pdf
Relax. You are just ignorant of the facts. The subject has become mostly political, and this causes a refusal to look at facts. When a study uses the projections from RCP8.5 the results are tainted.
There’s a tendency to put “science” on a pedestal by people who don’t really understand how it has decayed, in the sense that we see a lot of poor, fake, adulterated, and unethical “science” being published.
I was trained to dig way down on very large and complex studies to identify how data is mishandled, cooked, misinterpreted, statistics mangled, and projections grabbed out of the air. And I keep seeing very large gaps in the IPCC work. The RCP8.5 is a monumental fiasco, but there are other problems.
Here, read this critique about modern science so you can glimpse how serious the problem has become:
https://www.sciencenews.org/blog/context/science-heroic-tragic-statistical-flaw
The author is the managing editor of Science News, and it’s about science and science publishing in particular, with emphasis on the misuse of statistics.
Doug: The oceans are alkaline. Maybe they are becoming less alkaline. It is like if a friend has a high blood pressure. You do not say he is becoming more dead. You might say that he is less well than he used to be.
It’s the same, I suppose. The fundamental problem with these papers is the sheer ignorance they display about the climate politics. They don’t realize (or can acknowledge) the study is based on bullshit asumptions they pick up from the IPCC report.
Read “A chemist in Langley” to see a pretty good description of what went on.
http://achemistinlangley.blogspot.com.es/2015/06/on-rcp85-and-business-as-usual-scenario.html
Can you prove that RCP8.5 will absolutely NOT happen under any combination of political circumstances?
c.f. Tony Abbott’s rollback of carbon tax, the Saudi’s delay of their solar program, etc. etc.
Why are you hysterical?
RCP8.5 is “maximum credible warming”.
If someone models what happens to some coral reef under the RCP8.5 scenario, and they say they used RCP8.5, what is wrong with that?
They’re not saying it will actually come to happen, because they can’t forecast what the politics will be, any more than someone modeling what might happen to squirrels on Mt. Graham under RCP2.6.
Do you seriously deny that we canNOT screw up the environment in a major way?
c.f. Pleistocene overkill, Mycenaean AND Classical Greece collapses aided by deforestation, etc. etc. etc.
Why do you blame the scientists when political types put the “business as usual” label on RCP8.5?
typical lukewarmer distraction/denial?
It is like if a friend has a high blood pressure. You do not say he is becoming more dead.
No you say he is increasing his risk of becoming just dead! Happened recently to a very good friend of mine who thought he was invincible… Now he is exactly that, just dead, he could have listened to his doctors and lived quite a few more productive years…
I guess I’ll quote myself to show you were I’m at:
” Ocean pH changes are a concern, because shell forming creatures will require time to evolve to the more acid (less alkaline) conditions. However, nearly all the papers and articles written about the impact use an unreasonable UN IPCC projection designated RCP8.5. Se this about this topic http://achemistinlangley.blogspot.com.es/2015/06/on-rcp85-and-business-as-usual-scenario.html
Here’s an example http://ocean-acidification.net/2014/03/20/creating-a-portal-to-ocean-acidification/
All the work done using RCP8.5 is unsound and requires rework using a more reasonable emissions and temperature projection. ”
http://21stcenturysocialcritic.blogspot.com.es/2015/07/nino-3-4-sea-surface-temperature-index.html
Subsidies.
Latin America and Caribbean countries. Care to guess % of GDP for oil subsidy?
1%. Of GDP. Some more. Venezuela is 7% but note Ecuador is, too. 7%.
Trinidad/Tobago 2%. Argentina 2.1%.
This is not some kind of few pennies gas tax cut. This is 1% of GDP. When the US is forced to do this, we’re talking $180 billion dollars redefining price.
Mexico and Brazil, 1.1% and 1.2%.
Panama 0.3%. All that canal revenue and they still change the price of oil for their people.
Supply and demand. hahahahahahahaha
The meme in the news is very bearish for oil prices. (you can find 100’s of articles) that oil is over supplied. That prices are not taking a toll on production. Iran is coming back on line. Saudis want to break the back of fracking. New taxes on oil sands producers. China imploding, Europe imploding, Liquidity drying up. Anyone want to take the other side of the trade?
Andy,
Yes I take the other side. The scenario of low oil prices is extremely bullish for natural gas, which will go up tenfold over the next few months. This is very inflationary for the US dollar, which will fall substantially over the next few months. This scenario is very bullish for the World economy as a new inflation cycle starts.
I think what Heinrich Leopold meant to say is interest rates will never rise and more Fed QE is on the way. This is very inflationary for the US dollar, which will fall substantially once all the dust is settled over in Europe. This scenario is very bullish US equities and oil an gas, but not so much for the global economy as asset prices will soon outpace the available energy needed to service the debt that supports such lofty asset prices an a new deflationary cycle will begin.
Sawdust,
Trends are never linear, but show interactions. Therefore we have always a new combination of oil prices, the dollar, the stock market, interest rates etc. This is why we can never rest on past experience and should never do what our fathers have done. The most important shift over the last few years has been the increase of oil production in the US, which decreased the US current account deficit from over 700 bn to 450 bn per year. This strengthened the US dollar and slowed down the World economy as the worldwide economy needs a cheap dollar to thrive. This is exactly why the oil price will not go up as in 2009/2010. However a low oil price weakens the US economy, which is now an energy superpower and oil investments will go down. So, that is right the US economy will stay likely very weak over the next few months and interest rates will likely stay low. However also something very important happened in the oil and natgas market over the last few years. Having marched in tandem over decades, oil and gas are going now countercyclical. In some way oil subsidized natgas production as natgas has been more of a co-product from liquid rich plays. This kept natgas prices low as long as oil prices were high. As the oil price comes down, the trend for natgas reverses dramatically. This is what the ratio of UGAZ/UWTI which is 100% higher than last year indicates. Although this is my scenario, I believe that this will drive up natgas prices in the US, which is inflationary in the US and not worldwide. Inflation in the US will weaken the US dollar which will trigger at some point higher oil prices in a few years, which will then reduce natgas prices and the cycle will change again in let us say in 2020.
Heinrich,
A lot of that dollar strength has come from Yen and Euro weakness over the past couple of years. Soon China will join the party at the zero bound of interest rates strengthening the dollar even further. Dollar strength will continue unless Fed removes ambitions to hike rates. Which is what my personal view is. That it’s only a matter of time before they are forced to back away from interest rate hikes due to a strong dollar. Dollar moves on what expectations are of monetary policy and what actual monetary policy is.
Trade deficits have little baring on strength or weakness of the dollar. Capital flows however do have a great effect on dollar strength or weakness. Capital flows are created by the combination of what different central banks monetary policy happens to be. Way more capital flows through financial markets than the actual real economy where we trade actual stuff that leads to trade deficits or surpluses.
In a world where interest rates are low. Carry trade is the best way to create profits. And everything is a carry trade as long as there is a differential between interest rates among countries. Buy assets with lower yielding currencies in higher yielding currency countries. Particularly in countries who’s interest rates are expected to rise.
I agree world needs a cheap dollar. But we are not going to get it unless Fed fires up the QE again.
I should add dollar weakness would not be a good thing for the euro it would complicate the effort being made to crush the Euro currency.
Sawdust, I have been thinking very hard about what makes a currency weak or strong. Interest play a strong role, yet the current account defici plays increasingly a role with the advent of oil price volatility. When oil goes from 100 USD to 50 USD per barrel, the value of total oil traded goes from (assuming 30 mill barrels per day exported/imported) 1000 bn USD to 500bn USD. This is a huge change in capital flows and surprised anyone. In my view oil was the main reason for the financial crisis as a higher oil price increased the US current account deficit, which decreased the US dollar which in turn increased the oil price again. The central banks worldwide panicked and stepped on the brakes too much to stop this spiral and hence the collapse.
One example how interest rates and current account deficit influence a currency is Japan. Japan had at least for a decade a strong currency and zero interest rates. It was just when the Japanese current account turned for the first time negative in 2013/2014, the Yen collapsed.
The US could enjoy a big current account deficit for a long time as Asian central banks invest their trade surplus into US Treasuries. However in 2005 to 2008, the current account somewhat exploded to 800 bn USD per year and this was for the dollar too much despite relatively high interest rates.
As a summary I would say interest rates play a role, yet if the current account escalates the currency has to drop – sometimes precipitously. This is why a high oil production is of tantamous importance for the US economy and the US dollar.
Yen collapsed cause the BOJ introduced QE that was larger than the Fed’s QE in an economy a third the size of US economy.
The dollar is the largest carry trade of all! Since the introduction of 0.25% interest an several rounds of Fed QE. Some + $7 trillion or debt denominated in dollars has been borrowed and invested in assets in higher yielding currency countries abroad. This weakened the dollar and help emerging markets recover from 2008. (China is struggling now cause that flow is going the other direction now). When all that capital starts to flow back due to rising interest rates in the bond market, or due to insufficient fuel aboard. Dollar will strengthen massively.
Every debt denominated in US dollars that is either defaulted on or settled means less dollars in existence.
I think it’s possible we are fixing to see a massive repricing in the credit markets. Fed and the rest of the CB’s lose control of bond market and stocks collapse at the same time.
Deflation city and worldwide depression.
Or we will get more QE and negative interest rates here in the US.
Fed might decide to let it all collapse in order to try to maintain dollars roll as reserve currency of the world.
Heinrich,
If I recall correctly, I think that you thought that the 24%/year decline rate estimate for existing US gas production that I have been using (which is Citi Research’s estimate) was too low, which I found interesting.
In any event, I think that you have made a strong case for higher US gas prices this winter, and I was wondering if you could provide a summary of your analysis. With your permission, I would like to forward on your analysis to some industry guys (with or without your name, whichever you prefer).
Jeffrey,
Thanks for your comment. In my view, the difference for shale versus conventional is that shale gives excellent results at the beginning of the investment cycle as it is possible to produce an initial high return. This is just the opposite to conventional oil and gas investments, which require high upfront costs and produce a much better return over time. In other words shale is related to variable costs and conventional oil and gas drilling is a high fixed cost based business. These are two completely different business models and have basically nothing to do with oil and gas in the first place. Due to the increasing legacy rate, shale produces less and less returns over time. So, the 24% decline rate is not fixed and is zero at the beginning and grows over time and will eventually rise to 30% when the US natgas market is completely converted to shale. This is a very important dynamic for the market with serious consequences on future investment returns. My comments have triggered quite some reactions and I have made some long replies to toolpush, coffeguyzz, sawdust which could be of interest to you. So, if you send me an email to [email protected] I can send you a summary if you want more information. As I have predicted on this site a low oil price for quite some time (the reason is the lower US trade deficit due to high oil production), which strengthens the US dollar and thus lowers the world economic growth and thus oil demand, I feel quite vindicated that my views are correct.
Sent you an email. Following is a link to an article by Bill Powers that I think someone posted before:
https://oilandgas-investments.com/2015/natural-gas/the-texas-natgas-massacre/
Jeffrey. I remember reading the Texas natgas massacre article.
I generally agree with the author, but despite fear of starting another RRC reporting debate, he does use RRC data, which probably exaggerates the decline in 2015.
Jeffrey,
Thanks for the article, which I have seen already. At least it shows that I am up to something. Of course I could be also wrong or it could turn out not as big as expected, yet the numbers never lie and they tell me it is big.
Heinrich,
The scenario of low oil prices is extremely bullish for natural gas, which will go up tenfold over the next few months.
Which Nat Gas price, are you referring to, when you say it will, go up tenfold over the next few months? The Henry Hub, currently at $2.77, going to $27.70 mcf, or the local Marcellus price, currently @ 97c going to $9.77 mcf?
Surely 97c mcf as per http://www.eia.gov/naturalgas/weekly/ would indicate stranded supplies of Nat gas, begging to be released to a market? If the local price of Marcellus gas, was equivalent to Henry Hub, then I would may find your predictions more reasonable, but until this price difference is equalized by added pipeline capacity or a decline in Marcellus production, then I find your predictions would have a very little potential for success.
As the pipelines are reversed and expanded, we will be able to see how the Marcellus and Utica production reacts. As I said before, if the local Marellus price equalizes with Henry, then we will will know the area was full of bluff and bluster. If the local Marcellus price stays low and producers still line up at the exit points with cheap gas, then we know the area has the goods and will be around for some time to come. I prefer to wait, rather than to speculate, though I do feel the gas shale plays have a better chance of survival than the oil shale plays, as the Nat gas market, being mainly domestic, will be much quicker self correcting, of which you agree, by your ten hold price rise statement.
toolpush,
Yes I know a tenfold price increase is very general. If we have Marcellus prices at 1.3 USD per mcf and Henry Hub spot price at 2.7 mcf, this would translate into a price range of 13 mcf to 27 mcf. As you have said that additional pipeline capacity will equalize the overall natgas price, I would suggest that the Henry Hub natgas price could reach 20 USD per mcf. As you probably know we had already 90 USD per mcf early 2014 for a few days in the Northeast. This was mainly due to cold weather, yet it indicates that the natgas market in the US is a very tight market, with very little import and export capacity. I also think that the price spike will not be permanent as the high price will trigger a strong reaction from producers and prices will come down again during the summer.
However my market indicator shows that the natgas market is – despite yet low prices – as tight as it is usually during October/November.
Heinrich,
Interesting you raise the point the NY city gate reaching $120 mcf in Jan 2014, while Henry Hub also rose in price, but only to around $7 mcf. I could not find a price for Marcellus gas at the time, but I suspect it was still less than Henry, rather than anywhere near the $120 price for NY city gate.
I am not sure what this suggests to you, but to me, it suggests that there was a major shortage of gas in the NE cities, but not too much of an issue in the gas producing regions. This leads me to believe there was a shortage in transport, not a shortage of gas!
Jan 2014, was a short term, acute event. A longer term event is currently taking place where Marcellus gas is selling for 40% of the current Henry Hub, once again due to pipeline restraints.
Many of these extremely high prices were the result pipeline construction delays, brought on by the infinite wisdom of the vocal population of the NE. I do realize these are not the plans of the industry, but I will not be surprised, if one day I hear, the NE market is being supplied US nat gas from Canada, as pipelines from the mid-west are built into Canada, from the Marcellus in an expeditious fashion, while the more direct Marcellus/NE pipelines suffer continuing delays. It appears the population of the NE prefer to have oil and propane trucks running up and down the streets, rather than underground pipeline delivering nat gas.
As I have said before, when I see the Marcellus price react to expanded take away capacity, I may have to adjust my opinion, but until then it seems there is a good supply of nat gas to markets willing to build transport.
If gas hits ten bucks a mcf, which I personally consider a real likelihood within the not too distant future , certainly within a decade imo, how much will it cost the typical HOMEOWNER at retail at the far end of distribution system, including all taxes etc?
Wholesale or bulk prices matter to industry. Retail prices matter to consumers and small businessmen. Retail may be several multiples of quoted wholesale but a wholesale price increase may be passed along rather than multiplied.
Even if the production forecasts for USA domestic gas turn out to be on the money, there is still the wild card of exports to be considered. The retail price could go out of sight.
I foresee a lot of people switching to heat pumps – if they can.Most people who have or can borrow five to ten thousand bucks can switch.
The price of residential gas is currently about 4 times the pipeline price. The residential price appears to follow the season. Highest in July and lowest in January. Pipeline and residential prices do not appear to move together very well, so I would assume it is a constrained utility.
In the Northeast we have a mix of older homes which are not necessarily very well insulated and newer ones that are better insulated and sealed. A doubling of natural gas prices could cause a $1000 to $2000 rise in heating cost per annum per residence.
Toolpush,
Transport is a high cost for shale as pipeline companies are asking for a fee if there is no transport in fear of the high decline rate. So this may be a reason for the transport constraint. However my indicator sees this as an summary indicator. there is no need to know why there is a supply constraint. It is sufficient to know that there is a supply constraint for whateer reason.And the writing is on the wall: there will be a huge supply shortfall in about six months – whatever the reason maybe. To be sure it will not last very long. Maybe a few months. As soon as the industry receives more cash, production will go into high gear again.
Heinrich,
Ron has stated he is a little light on posts for a while, and I would like to see more detail of your analysis. What about submitting a post to Ron expanding on your details for your Nat Gas price predictions?
Just a few questions from my side, are you suggesting there will not be enough gas in storage this year, even though the current gas storage numbers are building faster than previous years?
Also as, nat gas goes past $4 to $5 mcf, coal plants will be maximized and LNG export will not start up. As it approaches $10 mcf, all LNG tankers will be heading to the US, and as it goes over $10 mcf and oil is still at $60 per barrel, then oil will be substituted for nat gas. I really feel your historical high for Henry Hub price of $20+ mcf claims need to be backup by quite a lot of detail.
Push
I was curious as to the specifics and time frames of several of the takeaway pipelines from the Marcellus/Utica formations and this is some of what I learned …
Actual construction, post groundbreaking, is usually fairly short, maybe 12/18 months for pipes 500/1,000 miles long and 24″/36″ diameter. Normal procedure would be to start work from 3 or 4 points and ‘join up’.
Pathways for the biggest pipelines follow electric transmission lines or already existing pipelines for about 90% of the routes. The mid stream boys obviously do not wish to go chopping down any more trees than is necessary.
Right of way is seldom more than 100′ wide during construction and 50′ thereafter for shrubbery or trees. Farming can recommence over the pipelines as prior, which surprised me.
Upfront fees and ongoing ROW (right of way) fees are paid to the property owners with the stipulation that the pipeline operators can routinely access the sites per inspection/maintenance protocols.
Apparently the pipeline operators anticipated fierce opposition at every step of the process and some, recently, have begun some hard-nosed, legal maneuvers to expedite the installations.
Thanks Coffee,
I know the NE has been a headache for new pipelines due to local opposition, and will take time to work through, if they succeed at all. Just look at Keystone. A lot of the new planned takeaway capacity to the west, south and South east, consist of mainly pipeline reversals. Very little digging or new paths required. Once approved these reversals should be easily implemented. Also any further expansion for these reversed line, with be by adding compressors, and or looping the line within the existing right of way, so delays should be minimal.
There are a couple of very large new pipelines planned to head to Dawn and one through Michigan, to supply Canada. I would say the population in these areas will not cause the same hassle as the New Englander’s have over in the NE. This is the reason, I stated, it wouldn’t surprise me to hear Marcellus gas supplying the NE via Canada.
Time will tell, but at the rate this new capacity is to come online in the next few years, either Marcellus/Utica supplies the goods, or there are going to be a lot of empty gas pipelines?
Push
Way, way more known resource in the Marcellus alone to fear lack of product.
The shallower Upper Devonian has fewer than 100 wells accessing it thus far and yet some are describing it’s recoverable potential in tens of trillions of cubic feet.
Ultimately, the Biggest Brother down in the basement – the dry Utica – may far surpass them all.
The schedule you mention excludes the compressor stations and the engineering and permitting. The total schedule is about five years.
Toolpush,
I derive my prediction from a big change in the relative strength of the gas market to the oil market. I have never seen a change like this. The price increase will not be forever and it will last a few months max a year as then the forces, which you are describing will kick in and prices will go down again. Yet it is vey likely that the volatility in the natgas market increases over the next future. I will do a summary of my thoughts and there is probably some publication of it.
Toolpush,
Just a few details about the latest natgas inventory build:
2014 2015 in bcf
week 23 107 111
week 24 113 89
week 25 110 75
week 26 100 69
The current storage build is at a three year low and related to consumption closed to all time lows for this time of the year, despite strong Canadian imports. To be sure storage levels are still high, yet the dynamics have changed considerably. As oil prices are going down this trend will be even more pronounced.
Heinrich,
Comparing 2015 build to 2014 build, is not a fair comparison, due to 2014 being an extreme year from the extra cold weather.
,,,,,,,,,,, 2011,2012,20132014 2015 in bcf
week 23 80 67 95 107 111
week 24 69 65 97 113 89
week 25 98 57 95 110 75
week 26 78 39 72 100 69
Just to fill in a few extra years, to show that 2015 is not out of line with former years. The reason, Henry Hub is at $2.77 mcf, rather $4, is they do not want to store too much gas, and are forcing the excess gas onto the prompt market to be consumed, rather than stored.
A few points:
Majors started cutting back on upstream capex, even prior to the current oil price decline.
Following is my normalized chart for Global Crude + Condensate (C+C), Natural Gas Liquids (NGL) and Global Gas (2005 values = 100%). Based on EIA + BP data, Global NGL was at 127% (0f 2005 values) in 2014, Global Gas was at 124%, but Global C+C was only at 105%.
As I have periodically noted, condensate, like NGL, is a byproduct of natural gas production, and the only reasonable inference that one can draw from the foregoing is that global crude oil production (45 and lower API, and especially 40 API and lower) crude oil production has almost certainly been flat to down since 2005. And a reminder that when we ask for the price of oil, we get the price of crude oil with average API gravities of less than 40.
In other words, the global oil industry spent trillions of dollars to keep us on what has almost certainly been an “Undulating Plateau” in actual crude oil production. So, what happens as that upstream capex declines? And then there is the “Net Export Math” consideration.
In addition, there definitely seems to be mixed messages about China. If memory serves, I saw a recent report about high oil imports, and the last vehicle data I saw indicated that Chinese car sales were supposed to hit a record high this year.
But, as they say we live in “Interesting times.”
And a trip down memory lane . . . .
Economist Magazine, March, 1999: The next shock?
http://www.economist.com/node/188181
Yet here is a thought: $10 might actually be too optimistic. We may be heading for $5. To see why, consider chart 1. Thanks to new technology and productivity gains, you might expect the price of oil, like that of most other commodities, to fall slowly over the years. Judging by the oil market in the pre-OPEC era, a “normal” market price might now be in the $5-10 range. Factor in the current slow growth of the world economy and the normal price drops to the bottom of that range. . . .
The supply situation is even gloomier for producers. Unlike 1986, oil supplies have been slow to respond to the past year’s fall. Even at $10 a barrel, it can be worth continuing with projects that already have huge sunk costs. Rapid technological advances have pushed the cost of finding, developing and producing crude oil outside the Middle East down from over $25 a barrel (in today’s prices) in the 1980s to around $10 now. Privatisation and deregulation in such places as Argentina, Malaysia and Venezuela have transformed moribund state-owned oil firms. According to Douglas Terreson of Morgan Stanley Dean Witter, an investment bank, this has “unleashed a dozen new Texacos during the 1990s”, all of them keen to pump oil.
Meanwhile OPEC, which masterminded the supply cuts that pushed prices up in the 1970s and 1980s, is in complete disarray. The cartel will try yet again to agree upon production cuts at its next meeting, on March 23rd, but, partly thanks to its members’ cheating on quotas, the impact of any such cuts will be small. OPEC members fear that Iraq, whose UN-constrained output rose by 1m barrels a day in 1998, may some day be able to raise production further. Last week Algeria’s energy minister declared, with only slight exaggeration, that prices might conceivably tumble “to $2 or $3 a barrel.”
Nor is there much chance of prices rebounding. If they started to, Venezuela, which breaks even at $7 a barrel, would expand production; at $10, the Gulf of Mexico would join in; at $11, the North Sea, and so on (see map). This will limit any price increase in the unlikely event that OPEC rises from the dead. Even in the North Sea, the bare-bottom operating costs have fallen to $4 a barrel. For the lifetime of such fields firms will continue to crank out oil, even though they are not recouping the sunk costs of exploration and financing. And basket-cases such as Russia and Nigeria are so hopelessly dependent on oil that they may go on producing for some time whatever the price.
And . . . .
In late 2004, Daniel Yergin predicted that oil prices would be down to a long term index price of $38 by late 2005 (which caused me to suggest that we price oil in “Yergins” with One Yergin = $38).
Also in 2004, the Saudi oil minister reiterated their support for the OPEC price band of $22 to $28.
n August, 2009, Michael C. Lynch predicted that oil prices would soon be back to a long term price in the low 30’s.
In early February of this year, Ed Morse predicted that oil prices could fall as low as the “$20 range for a while.”
My prediction is that global net exporters will continue to deplete their remaining volume of post-2005 CNE (Cumulative Net Exports of oil) at an accelerating rate of depletion.
I estimate that Saudi Arabia shipped about 5% of their post-2005 CNE in 2006, and I estimate that they shipped about 9% of their remaining post-2005 CNE in 2014, AKA an accelerating rate of depletion.
It would be amusing [assuming you do not work for them or own any of their stock] to compute BP’s finding cost per barrel of reserves over the past 5 years. One project is now over $58 billion and rising, with maybe no further production from it.
That’s booked as “negative good will” and isn’t included in the finding cost.
Jeff
How much of their post 2005 CNE Saudi Arabia has shipped so far in your opinion ? How long would their post 2005 CNE last at current production rate? Thanks –rex
“That prices are not taking a toll on production.”
Andy,
Not yet. With rig count so much lower now, LTO production decline must start soon.
“Iran is coming back on line. Saudis want to break the back of fracking.”
IF the Iran nuclear deal is reached. And then it will take time before they can export considerably more oil.
KSA has oil consumption growing, at fastest rate in summer months, so oil exports are probably not growing or even declining.
Also you have to take into account the points in the comments from Mr. Brown.
H Neumann, others:
It’s worth recalling that Saudi Aramco is part of a number of refinery and petrochem JVs and that they are coming online. Part of the oil that isn’t being exported is going to the domestic production of refined petroleum products, some of that for export, and this portion of non-exported oil can be expected to increase in volume over time.
Saudi Arabia took a long time to wake up to the value of downstream investment but it’s getting attention there now.
Iraq is getting short shrift here. http://fuelfix.com/blog/2015/07/01/iraqs-oil-exports-climb-to-record-with-output-at-all-time-high/#33412101=0
Meanwhile, ISIS controls a huge portion of the country, Iranian backed militias seem to be largely in control in the Shiite areas, and there is increasing tension between the Kurds and the central government:
Kurdish oil deal with Baghdad unravels as tensions rise
http://www.reuters.com/article/2015/03/13/us-iraq-kurdistan-oil-idUSKBN0M91MQ20150313
That prices are not taking a toll on production.
Nonsense. Canada, in June, down 430,000 bpd from its high in February. But the EIA data only goes through February so no one has gotten the word yet. The Bakken is down below where it was in September, seven months ago. And Texas is also down if we ever get the correct numbers. Niobrara is down.
All we have is guesses as to non-OPEC production for the second quarter of 2015. But when the data comes in it will show that non-OPEC production is way down and it is down partly because of low oil prices and partly because some countries are simply in decline.
One question is how much longer US shale driller’s banks and bond investors are able to remain in denial.
Bloomberg recently reported the Office of the Comptroller of the Currency sent out a warning about US oil and gas company debt levels and profitability to the banks.
Maybe the reality will show up soon
http://www.zerohedge.com/news/2015-07-03/fdic-sounds-alarm-insolvent-zero-hedged-oil-gas-producers
This posted?
Yes. May shut things down when they realize long term low prices put CLR, et al in 2017 where SD, HK are now.
Some are starting to take note;
”The top 60-odd shale firms are making a return of roughly zero on the swollen stock of capital they employ. Despite this, investors value them at well above book value, which suggests their share prices are frothy. Many firms are juicing up the cash they can crank out of their old wells. In the first quarter of 2015, 31% of the cashflow reported by the top firms came from derivatives bets placed when the oil price was high. These hedges will expire over the next year or so; cashflow will fall.”
http://www.economist.com/news/leaders/21656707-ingenuity-americas-shale-industry-admirable-state-its-finances-awful-there-will
Thanks for posting the link, Rune
There is another very good article in The Economist
Fractured finances. America’s shale-energy industry has a future. Many shale firms do not
Jul 4th 2015 | HOUSTON AND MIDLAND, TEXAS
http://www.economist.com/news/business/21656671-americas-shale-energy-industry-has-future-many-shale-firms-do-not-fractured-finances
Some excerpts
Since December shale firms have cut costs by 20-25%, according to Bob Brackett of Sanford C. Bernstein, a research firm. This has been achieved by brutally squeezing the oil-services firms that provide them with rigs, pumps and staff—big services companies such as Halliburton have fallen into losses and small ones are on life support.
The shale producers have also cherry-picked which wells they drill, concentrating on the best prospects and fine-tuning their engineering methods. As a result the number of rigs active in America has dropped by half since the start of the year.
The shale industry’s dazzling response to low prices—austerity combined with growing production—has enthralled Wall Street, which has continued to supply shale firms with an abundance of their most vital raw material, capital. So far this year oil-production firms have raised $15 billion of equity and $20 billion of bonds, helped by frothy markets, a near-zero Fed Funds rate and a partial recovery in the oil price. Even Goodrich, the troubled firm in Houston, managed to issue in February $100m of “second-lien” debt, which is secured against assets, at an 8% interest rate. Most firms have paid far less than that on new debt. The buyers of these securities are mainstream investors on the hunt for yield, but also distressed-debt funds that were set up in early 2015 to pick over the carrion of the shale industry. They have found fewer carcasses than expected and instead are bidding up prices.
Exuberant when oil prices were high and resilient when they are low, the shale industry appears unbeatable. Yet just how good are its finances? The Economist has examined the books of the 62 largest listed exploration and production (E&P) firms in America whose collective output is mainly from shale. The results (see charts) suggest many firms are more vulnerable than the bullish noises from their bosses suggest. There are three sets of concerns: the juicing-up of the results announced for the first quarter of 2015; high leverage; and the industry’s returns on capital.
First, consider the juicing-up of performance. During the quarter to March the industry reported aggregate cashflow from operations of $15 billion—this is the money the business throws off before capital expenditure and financing activity. But this reflects the benefit of derivative hedges taken out in 2014 when oil prices were much higher, and which in most cases will largely run out over the course of the next year or so. Exclude derivatives, and cashflow was 31% lower.
All firms have slashed their capital-investment budgets for 2015—a reduction of a third is planned in aggregate. Having traditionally invested far more cash than it generates, financing the gap with debt, the industry is keen to show it can live within its means. Yet while promising cuts it continued to spend heavily in the first quarter, to the tune of $35 billion, about the same as a year earlier. Were the industry to have balanced its books (excluding the benefit of hedges), capital investment would have needed to be 70% lower. Capital investment feeds through to production volumes with a lag of 3-9 months. Today’s healthy production figures are no guarantee of future bounty.
The second concern is a deep well of debt. Listed E&P firms owe $235 billion and during the first quarter debt rose, reflecting continued heavy spending. Assume a firm is in trouble if its net debt is more than eight times its annual cashflow from operations (based on the annualised first-quarter figures and excluding the benefit from derivatives). On the basis of this snapshot, 29 of the 62 firms are distressed, owing a total of $84 billion. Listed shale firms with distressed balance-sheets account for 1.1m barrels a day of oil production, or 1.2% of global oil production.
The final worry is the returns on the $570 billion of capital the industry has invested. David Einhorn, a noted shortselling fund manager, has said frackers are bottomless pits.
In most industries returns can be gauged by comparing a firm’s capital to its “steady state” cashflow, after deducting the capital spending needed to maintain its assets. This is how Exxon and Shell measure the value they create. But this approach does not work for shale firms: rather than husbanding long-term assets, like conventional oil firms, they are constantly investing in creating and depleting a whirl of ephemeral assets. If conventional oil firms are like ranching, shale is a rodeo.
Notwithstanding this, it is fairly clear that listed shale firms are unable to earn a fair return on the historic capital they have invested at the current oil price. Based on the first quarter (excluding derivative gains), their overall annualised return on capital was 8%, before any taxes or any capital investment. After deducting a rough guess at the capital investment required to keep production flat in the short term, returns on the historic capital invested fall to zero. Some 55 of the 62 firms, accounting for 4% of global oil production, are making inadequate returns, by our reckoning.
62 US E&P firms
Debе ($bn) and Leverage (Debt to annualized operating cash flow , excluding derivative sales)
15 is 1Q15
Sources: Bloomberg, The Economist
Rune and AlexS. Thanks for the links!
Wonder how the bank higher up guys and gals are going to explain the the Office of the Comptroller of the Currency bank examiners that they loaned shale oil companies money to drill more oil wells, despite said companies already being in debt over 100% of PDP PV10?
The PV10 is provided right in the company SEC 10K, so there are no shady appraisers to blame, like in the housing meltdown of 08-09.
Very happy to see some media starting, finally, to dig a little. Keep it up! Maybe by fall borrowing base redeterminations, between OCC and MSM, the TBTF bank consortiums will drastically cut the LOC’s
OCC- Office of Comptroller of Currency
LOC’s – Lines of credit
Thinks most are familiar with the other two.
Which BP Project?
Robert’s Raper #6 2015 Prediction:: BP will be bought out or merged in 2015.
http://www.energytrendsinsider.com/2015/01/08/my-2015-energy-predictions/
Happy Energy Dependence Day.
Maybe bp will change their name to Amoco and dump the UK properties? That would go over well, Amoco used the America flag, and has always had better gasoline.
Why speculate?
Some will do anything for their 15 milliseconds of fame.
”But, even after the sell-off, the place of BP in the life of the British nation – and at the heart of government – remains strong. Only last month, Downing Street told BP and city investors that it would not remain neutral if BP became the target of a foreign takeover.”
http://www.theguardian.com/environment/2015/may/20/revealed-bps-close-ties-with-the-uk-government
I’m sure Downing Street will bend its knee if BP changes its name to Amoco. The brand can be marketed in the UK as “Amoco (former BP)” using that little sunburst logo in red white and blue.
http://www.nytimes.com/2015/07/01/world/americas/us-and-brazil-agree-on-climate-change-actions.html
Does’t this mean people here documenting so microscopically lamenting the state of the future of oil move their chips over to renewables, now if not sooner?
Also, Resilience says that the estimates of PV rate of growth have missed by near 50% by not counting domestic installations rightly. Sure seems like that from what I see just looking out the window.
Popping up all over like weeds after a rain.
Why not move them to killing the enemy? Much lower risk.
PV is killing the enemy- fossil fuels
I am mostly WITH Wimbi on days I feel optimistic.
Nobody can really know how low and how fast the cost of renewables will fall but it is getting to be pretty obvious that before much longer wind and solar power will be as cheap or cheaper in good spots as coal and gas. The flip side of this coin is that nobody can really know how HIGH and HOW FAST the price of fossil fuels will go up. The ” good spots” qualification is subject to rapid expansion as the prices of wind and solar fall and the prices of coal and gas go up.
But we live in a Darwinian world and no mistake. National security considerations alone are ample to justify continued high levels of investment in renewables.
The arguments about renewables not being able to shoulder the load are fools arguments given the never ending and ever accelerating depletion of fossil fuels. Even if renewables never do shoulder the load, current investments in renewables will serve to extend the life of our fossil fuel endowment by some years. Compared to doing without electricity , that is a world class bargain.
My belief is that barring the collapse of business as usual SOONER, the cost of renewable electricity will fall to the point that it is a no-brainer even to the owner of a coal mine within the next ten years and that there will be a boom in renewables comparable to the real estate and computer booms of recent decades. THAT would push the oil and gas depletion can another decade down the road.
I own a compact car ALMOST solely for the simple reason that it burns only a third as much gasoline per mile as my ancient old Chevy four by four truck.
Improving energy efficiency, renewables, and changing lifestyles/ conservation all taken together mean that a wealthy and still well endowed society such as the USA has a fair shot at squeaking thru the coming population and resource bottleneck all skinnied down but otherwise more or less whole.
But I am also convinced that the population and resource situations are already so far out of hand that a brutal die off is baked in for large parts of the world.
As far as the storage issue is concerned , it can be solved mostly at the consumer end simply by making a few relatively easy changes in lifestyle and a few thousand dollars worth of investments per household in new appliances, insulation, thermal storage , etc.
And as far as integrating renewables into the grid is concerned, from all I read, the problem consists of integrating them into the EXISTING grid – not the grid that will exist twenty years from now- assuming the country is willing to pay for the necessary upgrades. Paying will be a lot more palatable than doing without electricity as the fossil fuel supply depletes and/ or as politics and war prevent free international trade in fossil fuels.
Old Farmer
I think most of the problems with the grid are imaginary so far. Just old fart business people not wanting to change or adapt.
People don’t realize how little electricity we actually NEED. I run a house and do everything I want on 5 kwh a day. When I go conservative it is a lot less.
I think that creative adaptations will make the grid more usable and stable anyway. Let’s say the wind blows too much too long and the sun is also shining. Coded signals go to homes and businesses that tell heat pumps to freeze water (for later air conditioning) or heat water/ stone storage (for later heating demand). Arc furnaces can be turned on to make metals at lower electric prices, power can be routed to electric trains, hydrogen can be generated for storage, car batteries can be charged, home and business storage batteries can be charged.
Can you see the smiles on the faces of the manufacturer that gets the notice that his electricity will be half cost or less for the next 6 hours? He can ramp up production or run those chemical conversions cheaply.
Good time for that dryer and dishwasher to turn on too.
During low wind/sun times the storage can be brought on line. Homes and businesses will be signaled. They will cut back and/or switch to their own storage and local storage facilities will come on line.
Nobody said that power had to be continuous or the same price all the time. In the old days we had warehouses and stockpiles because delivery was not as reliable and all systems needed buffers.
I think most of the problems are in the minds of fossilized businessmen who don’t want to change.
I am sure you know how to live without much electricity.
I can see there will be problems, the freak storm systems that dim the sun too long or freak weather that provides no wind for a week or more. They will be rare but once we learn how to adapt to low power usage and take advantage of the high power times it will be no big problem.
Isn’t that how we used to live and how farmers live, live by the weather changes, plan ahead and adapt to changes as best we can. Probably a better way to live and makes people more conscious of the world they live in.
I think that creative adaptations will make the grid more usable and stable anyway. Let’s say the wind blows too much too long and the sun is also shining. Coded signals go to homes and businesses that tell heat pumps to freeze water (for later air conditioning) or heat water/ stone storage (for later heating demand). Arc furnaces can be turned on to make metals at lower electric prices, power can be routed to electric trains, hydrogen can be generated for storage, car batteries can be charged, home and business storage batteries can be charged.
Silicon Valley has more investment money that it knows what to do with. Finding ways to make energy generation, energy distribution, and energy usage more efficient will be projects for them.
Zep,mighty glad to see you say that. What I think too. Before I went PV all the way, my house lived quite well on 6kW-hr/day.
Now, with excess of wealth from “overbuy” which I got at a bargain, I am profligate with power and urge my wife to use it to the hilt when she sees the sun.
And, as you say, not when no sun. Works just fine.
That’s why I think solar is just about ready to really take off. Fantastic bargain!
I am setting up a seminar, equipped with all the stuff, for demos, to show others how to do it. Lots of locals- many low income- are interested.
Climate disasters = carbon tax = conservation/renewables cheaper than ff’s = more development to c/r= even greater cost advantage to c/r, and so on and on.
Conclusion. FF’s doomed, soon, not later.
Seems sorta obvious to me.
Problem is, if we wait for the disasters the disasters will promote a need for more energy so that all energy sources will be tapped including more fossil fuels. It will be political suicide to reduce fossil fuel usage when we would need the energy to help the people in the disaster zones.
Catch 22 squared
Disaster, you are cleared for liftoff.
Disaster = more Disaster = yet more disaster =———–
Nope, don’t work, disaster no. 1 and 2 lead to far fewer people, the ones who have their act together then live rich lives on the huge piles of trash left by 1 and 2.
Happy tines are here again.
Sorry, didn’t realize the scope of your disasters. Was thinking of increasing drought, floods and storms. Even massive storms and drought here have not caused massive loss of life (certainly not enough to stop population growth). If those happen more often they will tap out the money and energy system after a while which might lead to some decrease in population.
What kind of disasters were you considering?
Well, for example, hundreds of millions of africans and asians showing up in sweden denmark and any other place they can get to which has a door open even a tiny crack.
Ditto with USA and latin america.
Thus far renewables remain woefully uneconomic. The lack of energy storage is a huge hurdle. I suspect what we are seeing is the emergence of a near religious movement pumped up by a very crafty business lobby interested in riding the gravy train that emerges when governments start micromanaging the economy.
Because government micromanagement is a natural for leftists this leads to an interesting mix, the hammer and sickle together with a solar power symbol.
Now go try to sell solar in India to satisfy all their future needs and let’s see how far you get.
Here’s an analysis for the USA. Check page 9..
http://instituteforenergyresearch.org/wp-content/uploads/2015/06/ier_lcoe_2015.pdf
”Thus far renewables remain woefully uneconomic.”
This is obviously true on the grand scale.
But how many more years of AFFORDABLE oil and gas do we have left?How long can we COUNT on free international trade even in COAL?
NEVER MIND the climate issue for the moment. ( I do agree with you that the IPCC is politically controlled and that you could not get a job in or near the climate science field unless you toe the politically correct line. )
BUT I do also believe that the climate science is basically sound. The only real argument you make in respect to climate that I agree with is that the projected growth of fossil fuel production is greatly exaggerated in the modeling case most often used.
One FACT that my hard core conservative friends never seem to internalize is that government either directly or indirectly determines the direction of just about every damned aspect of the way we live already.
The smartest man I have ever known taught me to adopt the point of view of an alien biologist observing our planet from a flying saucer – just watching , doing nothing else. Totally impartial as to what he observes and what happens – as disinterested and impartial as an etymologist counting ants feeding on a particular dead beetle.
To a substantial extent we have control over our individual lives but government like it or lump it is generally MIGHTILY influenced by special interest groups of countless variety, some of which are enormously powerful. Sometimes the pressure results in useful investments , sometimes it results in an absolute boondoggle.
In the case of renewables I believe that even though mega bucks have been wasted the overall investment is totally justifiable on the basis of our overall health and welfare over time.
The Wonderful Wonderful MARKET and the (almost ) Invincible INVISIBLE HAND have worked many wonders in the past and will work more in the future. BUT they need a substantial amount of time to work their miracles.
When it comes to managing the problems involved in the inescapable depletion of fossil fuels, we simply cannot afford to WAIT for the MARKET to solve the problem. It’s JUST TOO DAMNED BIG A PROBLEM.
We will be fighting ENOUGH resource wars no matter how hard we push renewables NOW. If we can double or triple the size of the current renewables industries by ANY means possible then that means starting from a TRIPLED BASE when the fossil fuel supply shit hits the fan -which IS going to happen eventually.
At some point the various Leviathans of the world will turn their attention in their slow and ponderous way to doing something about a lack of affordable oil, gas and coal.
When that happens the bigger the renewables industry base , the better our chances of pulling thru without an outright hard crash.
If you ever REALLY need submarines and destroyers it is EXTREMELY important that you have shipyards PRIOR to that need arising as well as some new ones recently designed and tested so as to be ready to ramp up production.
I hardly ever run across an engineer who seems to really understand the REALITY of biological overshoot but my own professional background enables me to understand it very well indeed and the risk of an outright collapse of the economy is so high as to be a virtual given in most of the world-barring near miracles on the technology front or an unlikely social revolution. ( It is not IMPOSSIBLE that birth control could be made universally available and ENOUGH women convinced and /or their men bribed to use it to solve the population problem but the odds of such a revolution are EXTREMELY slight. )
I am a big believer in technology but I also understand that major transitions take A LONG TIME when we replace old expensive key major industries with expensive new industries.
The risk of collapse is high even in places such as Western Europe and the USA but we DO have a decent shot at pulling thru the coming resource and environmental crises – all skinned down but more or less whole -IF we get our acts together NOW.
Ten or twenty years from now it will be too late to build out renewables from a small starting base in the face of fast declining supplies of ever more expensive fossil fuels. Any hope of a successful transition, barring miraculous good luck, depends on getting enough of a head start on the job.
Because government micromanagement is a natural for leftists this leads to an interesting mix, the hammer and sickle together with a solar power symbol.
I think you continually discount Silicon Valley. At one point you suggested that as there is more renewable energy in California, everyone who can will relocate to the middle of the United States.
The Silicon Valley types don’t fit the leftist mold. They are more libertarian as a group than anything else. They may happily take whatever government incentives are offered for their projects, but they fundamentally believe they can do better than the public sector. That may or may not be true, but you seem to think that the only people promoting renewable energy are communist types and the only people opposing the Keystone pipeline through Nebraska are Venezuelan fronts.
Silicon Valley sees money in disrupting the traditional energy companies and they heading that way.
By refusing to move from your theories, you are missing a lot of the picture.
I’m not saying science isn’t basically sound. I believe the climate sensitivity is on the lower end of the envelope, I think the IPCC does a terrible job, and the solutions being proposed are mostly worthless.
On top of that we got a serious problem with dishonesty in science, poor peer review, politicians using science items as Trojan horses, fundamentalists opposing science, plus strawberries taste like hell thanks to the way they are selected for their appearance.
politicians using science items as Trojan horses,
Okay, that part I still question. What politicians promoting what policies? What would be their motivation to go to all the trouble to fake scientific data for what ends?
As I said, the push in the US for reconfiguring the energy-related industries will be coming from Silicon Valley. People like Musk. They see money to be made.
They don’t “fake the data”. The core problem is the selection, BY DECREE, of GHG forcing = 8.5 watts per m2 in 2100 as an end state.
There’s nothing FAKE about it. They don’t hide it. They just say it’s a number they decided to use. It was a number a COMMITTEE chose to use.
Where the whole thing falls apart is when we see the IMPOSED results used for additional studies. And this is where the sheer amount of propaganda creates a brainwashing effect. Most of the hysteria is caused by a calculated decision made by a COMMITTEE to create a case which leads to elevated temperatures.
Don’t worry, most people are unable to figure this out. They keep crying and putting their hands to their face as the bullshit washes over their heads.
This is a fairly continuous and very hard pressed version of the Iraq WMD lie. Go ahead and swallow it.
There’s nothing FAKE about it. They don’t hide it. They just say it’s a number they decided to use. It was a number a COMMITTEE chose to use.
I still don’t see why governments would go to this much trouble.
If governments want a certain outcome and are manipulating results (as you seem to suggest), why would they do this? Climate change is not an immediate threat, and therefore is not a strong motivator to get people to change their behavior. We can already see this.
So climate change as a political tactic is a poor one. You haven’t told me why anyone would be bother with it to gain control or to change consumer behavior. There are far easier, faster, and more effective ways to get results.
Most of your arguments seem to come back to what happen to you as a teenager in Cuba.
Folks here may be interested in maps 65 and 66.
http://www.vox.com/2015/2/17/7917165/maps-that-explain-america
FWIW.
On this Fourth of July, Alex Epstein from the Center for Industrial Progress is asking his friends and fans to join him in celebrating fossil fuels–coal, oil, and natural gas–by watching and sharing “Why You Should Love Fossil Fuels”, a video he helped create with Dennis Prager and his team at Prager University. The five minute “course” has already drawn over 500,000 views since it was posted on Earth Day. (In comparison, Alex Epstein’s most-viewed video before this has 22,000.) Please share far and wide, for it’s time we stop thinking about how to save the planet from human beings, and instead resume thinking about how to improve the planet for human beings. — From Alex
http://www.youtube.com/watch?v=49Teja5YNCo
The guy from 300 years ago wants to know why everyone is so incredibly fat? Answer: Energy! Petro-chemical fertilizer added to corn makes lots of Doritos and high-fructose syrup.
Celebrating with oil (and their refined products)…
https://youtu.be/e2MfsMmki5U
As Ron White says” You can’t fix stupid.”
There is a new paradigm that is growing stronger and stronger.
http://www.solarimpulse.com/leg-8-from-Nagoya-to-Hawaii
Yep, all great fun. I would love to have one of those. 28 mph cruise speed is just fine.
How about a PV blimp? Or a herd of passenger blimps all circling the earth downwind.
And how about covering all railroad rights of way with similar PV, and running the trains on it. If I had that choice, I might even do a little travel.
As it stands now, I will never get on another airplane.-and my bike is too slow- and I far too feeble.
Hey Wimbi, I have no doubt that solar blimps will have a bright future!
http://www.solarship.com/aircraft/
Solar Ship’s innovative hybrid cargo aircraft occupies an unfilled capability gap in transport solutions for hard-to-get-to places, faster than a truck and more flexible than an aircraft.
Advanced aerodynamics, synthetic textile laminates, smart electronics, lightweight batteries and high-efficiency photovoltaics are our enabling technologies. The design also scales well, with lift capacity growing with the cube and solar capacity growing with the square as wingspan increases.
Whether it is northern Canada or remote Africa, the need for critical supplies has never been greater. Solar Ship’s 20m Caracal currently brings a self-fueling, solar-powered cargo lift vehicle into landing areas shorter than 75m. Wolverine, the next version, will add greater range and payload capability.
I like the superplastics. This month’s Scientific American had a really neat article about the new passenger jets they’ll be able to build using high strength low density plastics. They think they’ll be able to increase fuel efficiency about 40 %, reduce noise, etc.
He lists diking out marshlands as one of his progresses. Does he have even the slightest idea what that does to groundwater levels? I live in an industrial nation with lots and lots of rain, and we have problems with dropping ground water levels. This guy know little to nothing about the natural systems.
Just to pick on one of the many things he bring up in the video.
This guy know little to nothing about the natural systems.
That seems to be a pretty general problem with people who do not grasp that there are real limits and that fossil fuels are finite and will not continue to support our currently artificial systems forever. Meaning that sooner or later we will be back to being dependent on those natural systems in a big way… Might not be a bad idea to invest in preserving those systems and learn to live in better harmony with them.
Every problem we are solving for these days started out as a solution to some other problem we created earlier. I know, I know, its kind of hard for many of you to wrap your heads around that one.
I just sent my son in Saudi Arabia the following email:
Sell everything. The market is headed for a very big crash. Likely in Q3 but no later than Q4.
Of course I don’t expect anyone to take my advice. The sole purpose of this post is just so I can later say “I tole you so!” 🙂
Love you,
Dad
The Apocalypse trade never pays off. An end to Wall Street means there’s no one working there to write a check.
On the other hand there is farmland, at the base of a mountain with a perpetually running stream, 50 miles from a city of 50K+ (50 miles is blisters), and well armed. You won’t live there. That’s just your destination and you hope no one has already found your stash, ignoring title deeds.
Lots of alternators sitting around with nothing to do, so they can spin in the stream. Solar is worthless. No shipping. All those spare alternators deal with no shipping.
My suggestion is a cave with an underground stream in cold weather territory to traverse the first winter, which will kill off most of the primary threat. Then go to the mountain base farm, the stash for which was hidden.
My farm is so situated. IF the shit someday hits the fan hard and fast, and the sheriff can’t answer the phone anymore because there is no phone and no sheriff, we will have a perimeter community defense. Just about every body around here has a personal arsenal and an OLD TESTAMENT way of looking at the world. Quite a few are hard core old military and rednecks who believe in doing unto ( strange or unrecognized ) others before they do unto you.
If it becomes necessary to shoot first, well, there won’t be anybody around to ask the questions later.
The big problem with a community defense is that we could never mount a good enough defense to fight off a band of well led professionally trained raiders.
Fortunately I estimate the likelihood of a mad max scenario coming to pass HERE within the next twenty years or so as no more than one or two percent annually.
There is a big difference between unlikely and impossible.
PV already on hand with a few spares can be expected to work for a decade or two at least. Just a few kilowatt hours a month would be priceless. That would be enough to run some power tools and keep a refrigerator running and that sort of thing.
A few new lithium ion batteries for a drill or saw plus a panel to charge them would be worth a virgin daughter.
Unfortunately where my property borders a stream the drop in elevation is not sufficient to efficiently operate a turbine or water wheel. I might be able to get a hundred watts – but even that much would be priceless. That runs four twenty watt LED lights after allowing for losses .
If I could put my hands on a few large heavy duty batteries such as tow motor batteries a hundred watts would allow me to do all sorts of things for a decade or two as needed on an intermittent basis.
I really ought to learn how to do is manufacture my own biodiesel from scratch but it sure does seem like a lot of trouble considering the low odds of ever needing it.Stashing a thousand gallons is a lot more attractive and cheaper proposition. That’s enough to run a subsistence operation for half a dozen people a LONG time- long enough to raise and train a couple of draft animals.
The apocalypse is in the NEW TESTAMENT. Your neighbors are behind by a whole testament.
You forgot the smiley face. The New Testament is all about getting along.
The Old Testament is about blood and guts.
I guess there are interpretations of Revelations that have an old testament point of view.
And, of course, the peculiarly American view of the apocalypse has a lot to do with widespread fears of The End Of The World As We know It.
The Apocalypse is the gaining of world changing knowledge. We are in the midst of that right now.
Armageddon is the destructive wars that could end the world.
I think that people are afraid of knowledge since they generally don’t implement it and avoid it. They are not afraid of war because they go to no end to make it happen.
Jesus was a Jewish Apocalypticist.
He was one of many “prophets” that claimed to be the Messiah that was sent by Yahweh ( where did he go? ) to destroy the Romans and allow poor and down trodden Palestinian Jewish to inherit the kingdom of heaven on earth.
Jesus’s language was Aramaic.
The early New Testament was written in a deprecated form of Greek.
Greek speaking people can’t communicate with Aramaic speaking people. Especially during a time period of extreme illiteracy and geographic isolation.
The Gospel writers were born decades after Jesus had already died and never met him or his followers.
Their stories are based on rumors they heard passed on by unreliable oral tradition. They also copied each others writing as Mark has a copy of Mathew in front of him while he was writing it! (I may be mixing that up)
The apocalyptic parts of the New Testament were largely removed in later versions, as by the end of the first century no apocalypse took place and it would be silly to keep saying one was going to happen in the 1st century, when it was the second century or later!
See Bart Ehrman’s “Misquoting Jesus”. It is outstanding.
There is no historical evidence Jesus even existed from historians on the ground at the time, Roman or otherwise.
And, being a Roman backwater, and Roman Historians pretty anal about recording events, this seems very suspicious.
That is wrong Cytochrome. There is lots of evidence that a human Jesus existed.
After all, lots of people, who didn’t know each other, wrote about him and they said similar things about him.
There is no evidence that he became God or formed part of the Holy Trinity.
Read Bart Ehrman.
http://www.bartdehrman.com/books/did_jesus_exist.htm
He wrote a book on that topic specifically.
https://www.youtube.com/watch?v=o4q3WlM9rCI
For you Cytochrome,
Back to Peak Oil!!
Greek speaking people can’t communicate with Aramaic speaking people. Especially during a time period of extreme illiteracy and geographic isolation.
There were a very strong greek precense in the jewish territories. To such a degree, there even where jews who only spoke greek. Lots of people knew both languages.
Also, the jewish male population knew how to read. They where the first people to introduce general alphabetisation for men.
EAST(ish) of the jewish territories there are the (now defiled by ISIS) trade city of Palmyra. These lands were not extremely isolated.
You need to check your historical facts, I’m afraid.
I’m not an expert on the topic, so could be wrong.
However, the gospel writers certainly didn’t know Jesus or his followers.
In fact, no one knows who the gospel writers were.
The gospel writers were highly educated Greek speaking people. They can tell by their writing style.
Jesus’s followers spoke Aramaic and were illiterate, uneducated, poor and they were being oppressed by the Roman government. That’s why the Messiah prophecy was appealing to them.
The evidence suggests Jesus thought an apocalypse was imminent within his lifetime, which is why he thought you should forego material possessions so that you could enjoy treasures in heaven.
We are still standing here.
The modern day versions of Christianity were changed to focus on sin, because the apocalyptic version was a failure.
I recommended Bart Ehrman because he is an expert.
If you are interested in the topic, he gives an evidenced based view of the New Testament that is entertaining to the laymen and he can speak Aramaic and Greek so he can discuss what the earliest texts say.
I always thought it was the belief that a cosmic Jewish Zombie who was his own father can make you live forever if you symbolically eat his flesh and telepathically tell him you accept him as your master, so he can remove an evil force from your soul that is present in humanity because a rib-woman was convinced by a talking snake to eat from a magical tree…?
Or, at least, that is what I read —
Does anyone elses book say anything different?
Exactly. And don’t forget the book of Fairy Tales. For example: The Lord preserves all who love him, but all the wicked he will destroy. Whoever believes in the Son has eternal life; whoever does not obey the Son shall not see life, but the wrath of God remains on him. And on and on.
But don’t all those people in hell live forever too?
Or are they the ones who go to college and end up in a cubicle where every day seems like a pointless forever?
Don’t worry, your god will send plagues, famine and flood. Then when it isn’t happy because the inhabitants didn’t listen well cities will be destroyed and then the world will be drowned again.
That is after a bunch of wars and general mayhem along with a lot of begetting and begatting.
We read the same book!
Just as long as we didn’t stay in the same motel! 🙂
If ever there be a doubt, be certain I am making an attempt at humor.
I can and do laugh with everybody else but it is ironic to see so many VERY intelligent people totally miss THE crucial point about religion.
The ironic fact and highly amusing fact is that half of the planet is more or less the inherited property of the people you are making fun of- the ”PEOPLE of THE BOOK.”
It is understandable that engineers who seldom take more than a couple of survey courses in the humanities would not understand this. It is less forgivable on the part of people trained in the life sciences since evolutionary psychology has been around now for half a century.
We ARE NOT THINKING MACHINES. We are naked apes and we live by the story or the narrative or by whatever name you wish to call the glue that holds us together.
The ancient Jews who more or less invented monotheism founded one of the two or three the most successful movements in history.
The fact that this movement is founded on myth rather than physical fact is entirely irrelevant to appreciating the POWER and the DURABILITY of it.
Religion is a glue that holds people together and confers biological fitness. It may have outlived its usefulness – or maybe not. My guess is that it has not- not yet anyway.
People are ALWAYS going to find some SOMETHING to rally around – the swastika, the hammer and sickle, the yankee flag, membership in a particular ethnic group, a professional society or a particular social order based on some arbitrary standard , something.
When we cease to believe in SOMETHING ( God) we never believe in NOTHING to paraphrase Lord Chesterfield.
The human mind apparently is incapable of functioning without some means of identifying with a larger group, without believing it is PART of SOMETHING bigger and grander.
When it comes to religion , we should be careful what we wish for – we may GET IT.
IT might be worse.
Of course none of this negates the contrasting meme that the two oldest professions are reputedly the priesthood and prostitution.
That’s all fine, so long as I am free to not be part of a religious community.
Ah, “the belief in the belief in religion” as Dennett put it.
I’m getting on in years, and can’t tolerate BS as much as when I was young.
Mac,
Your thinking is rather constrained.
wrt:
“The human mind apparently is incapable of functioning without some means of identifying with a larger group, without believing it is PART of SOMETHING bigger and grander. ”
I, and others, identify with a larger group known as Humanity.
No further elaboration required.
No appeals to supernatural zombie sky daddies of any shape or flavor.
fini
Solar is NOT just PV. Solar thermal is easier by far for the back yard junk genius. There are solar thermal generator designs anybody with a little skill can make.
Sure it takes bright sun. Even I have a fair bit of that here in somewhat hilly billy country.
Any US junk yard is a gold mine.
That reminds me, I should also add a focused tracking sensor to my array. I noticed that in the last decade there are very few really clear days anymore. Even the sunny ones seem to have a high cloud haze. Just a handful of those bright blue sky days a year now. Would be interesting to measure the differential between direct sunlight and diffuse.
That’s called dimming. There’s a long term study at an observatory in the Canary Islands measuring dimming. But I think they may have run out of budget.
Another interesting effect being noted is the tendency of water exposed to sunlight to evaporate less.
Watcher,
I would kindly like to remind you the apocalypse trade called the Chinese stock market just collapsed 30% in the past few weeks… with more enemas to come.
Steve
Well, when the down-turn starts and you can be sure it will be a crash and not a correction, because of big catalysts, you may consider to go short the Nasdaq for example.
A Primer On “Net Export Math”
Given what, in my opinion, seems to be massive and widespread ignorance and/or denial regarding Net Export Math, following are some simple scenarios.
Definitions:
GNE = Global Net Exports = Combined net exports from (2005) Top 33 net exporters (total petroleum liquids + other liquids)
ECI Ratio = Export Capacity Index Ratio = Ratio of production to consumption
CNI = Chindia’s Net Imports
GNE/CNI Ratio is analogous to ECI Ratio
ANE = Available Net Exports = GNE less CNI = GNE available to importers other than China & India
In 2013, in round numbers, we had the following (millions of barrels per day for non-ratio data):
Top 33 Production: 63
Top 33 Consumption: 20
Top 33 Net Exports (GNE): 43 (versus 46 in 2005)
ECI Ratio: 3.2
CNI: 9
ANE: 34 (verus 41 in 2005)
GNE/CNI Ratio: 4.8
Let’s look as some scenarios.
Production – Consumption = Net Exports
In 2013, for the Top 33: 63 – 20 = 43 (GNE)
GNE – CNI = ANE
In 2013, for ANE: 43 – 9 = 34
For the sake of argument, let’s assume that Top 33 production drops by 25% over a 20 year period (63 to 47 MMBPD), a production rate of decline of 1.4%/year, but there is no increase in Top 33 consumption. GNE falls from 43 MMBPD in 2013 to 27 MMBPD in 2033, a 2.3%/year rate of decline.
In 2033, for the Top 33 (GNE): 47 – 20 = 27 (versus 43 in 2013)
Let’s also assume that CNI never increases and remains constant at 9 MMBPD. ANE would fall from 34 MMBPD in 2013 to 18 MMBPD in 2033, a rate of decline of 3.2%/year.
In 2033, for ANE: 27 – 9 = 18 (versus 34 in 2013)
Given the above referenced 2013 to 2033 rates of change in Top 33 production, the only way that the GNE decline rate would not exceed the production decline rate is if Top 33 consumption fell at the same rate as, or at a faster rate than, the rate of decline in production. However, what we observed from 2005 to 2013 was that Top 33 consumption increased at 2.6%/year.
And given the above referenced 2013 to 2033 rate of change in GNE, the only way that the ANE decline rate would not exceed the GNE decline rate is if Chindia’s Net Imports fell at the same rate as, or at a faster rate than, the rate of decline in GNE. However, what we observed from 2005 to 2013 was that Chindia’s Net Imports increased at 7.1%/year.
Finally, let’s assume the same Top 33 (20 year) production decline, but assume that Top 33 consumption increases at 1.0%/year (versus 2.6%/year recently). And let’s assume that Chindia’s Net Imports increase at 2.0%/year, versus 7.1%/year recently.
With the same rate of change in Top 33 production, down 1.4%/year, the GNE decline rate would increase to 3.1%/year (GNE falling from 43 MMBPD to 23 MMBPD), and the ANE decline rate would increase to 6.1%/year (ANE falling from 34 MMBPD to 10 MMBPD).
With the above slight increase in Top 33 Consumption and in Chindia’s Net Imports, for 2033 we would have:
GNE: 47 – 24 = 23 (versus 43 in 2013)
ANE = 23 – 13 = 10 (versus 34 in 2013)
Top 33 ECI Ratio (2002 to 2012, decline continued in 2013, and probably in 2014). At an ECI Ratio of 1.0, GNE would theoretically be zero.
GNE/CNI Ratio for 2002 to 2012 (decline continued in 2013, and probably in 2014). At an GNE/CNI Ratio of 1.0, ANE, the volume of GNE available to about 155 net oil importing countries, would theoretically be zero.
Hi Jeffrey,
Does that last scenario strike you as realistic? When a scenario looks unrealistic, then it probably is. As net exports decrease, oil prices will increase and demand for oil will change. Perhaps in 2030 all net oil exports will be shipped to India and China, but I doubt it (note that a GNE/CNI ratio=1 implies that exact scenario).
Why is the consumption of the net exporting nations and China and India not affected by the GNE/CNI ratio approaching 1? I really think the mathematics is impeccable, but the underlying assumptions are problematic.
So far, apparently through 2014, globally we continued to slide toward a point that we cannot arrive at, a GNE/CNI Ratio of 1.0.
In any case, in regard to Scenario #2, the assumptions are that the rate of increase in Top 33 Exporters consumption falls by 62% (2005 to 2013, versus 2013 to 2033) and the rate of increase in Chindia’s Net Imports falls by 70% (2005 to 2013, versus 2013 to 2033).
hmmm. Let’s try again at a practical approach to these export questions.
A key question:
How much of KSA’s domestic oil consumption is used for electrical generation?
About 20%, or around 600k bpd. The rest? Industry, and personal transportation. KSA uses about 3M bpd, which is more than Germany, a country with 3x the population and 5x the GDP. It makes no sense – most of it is wasted. Growing that number at all, let alone to 10M bpd, is economic insanity.
So, how smart is KSA?? I’m told they’re very smart about running Aramco. But, they’ve been talking about solar for years, and doing nothing. When will they start installing solar PV, which produces power for about 1/3 the cost even now, and whose cost is still falling like a rock? When will they raise gasoline prices, and reserve cheap/discounted fuel for the minority that truly needs it? When will they raise oil and gas prices, instead of wasting vast amounts of money and energy on a domestic industry that is set up for failure when the inevitable decontrol of fuel prices occurs?
How long will KSA waste roughly 25%, or more, of their oil production??
Lots of talk and planning but little action on the wind and solar power front in KSA. Indicates to me that they either have political problems or know something more about their oil and gas resources than we do.
Don’t forget that they get extreme sand storms in Saudi Arabia. I am not sure that anyone has a good technological solution for solar in a high sand storm area.
Tilt and shake mountings and/or a bunch of employees clean them at night on a scheduled basis.
http://qz.com/444936/kenya-is-building-africas-biggest-wind-energy-farm-to-generate-a-fifth-of-its-power/
This is obviously something that can happen at only a very few places but this wind farm is expected to run at well over sixty percent capacity factor.
I wonder how many other such places exist where some long distance high voltage transmission lines could be built to get the juice to a place it is needed.If a suitable pumped storage site happened to be within a hundred miles or so this could probably be considered base load power.
That QZ link has an exaggerated efficiency projection. I reviewed the project details, the financing technical advisors believe it will be 46 %, a very high figure.
The project is located in a wind corridor close to Lake Turkana. This is near the place where I used to work in the Chalbi desert. The town where I found the guy wearing coat and tie is Marsabit, the local “capital”.
They felt they had to limit turbine size because the local roads are terrible. Other information: the project will cost $775 million U.S., the contract price is $8.42 per mwh. The project is getting soft European financing, and has European owners from energy funds set up to help poor nations.
http://www.power-technology.com/projects/lake-turkana-wind-power-project-loyangalani/
http://www.nation.co.ke/business/Ground-breaking-of-L-Turkana-Wind-Power-set-for-Thursday/-/996/2770134/-/mmfe1uz/-/index.html
The project makes sense because Kenya has hydropower it can use to load follow and make up for the wind intermittency.
This is really good news for the Chalbi desert tribes I discussed in my blog. They are extremely poor, and I suppose now they’ll get electricity and run a few light bulbs. But the problem will remain the lack of water.
OFM,
I remember a friend of mine from high school that moved to Kansas. Complained that it was windy there all the time. Not sure he had a grasp of “all the time” because he was in a Titan missile silo for days on end, but I guess when he surfaced he noticed a lot of wind.
Kansas Wind Farms – Capacity Factors and Monthly Average Power Generation (MWh)
http://www.kansasenergy.org/documents/Kansas_wind_capacity_Factors_122012.pdf
A 37.4% overall capacity factor.
http://www.scientificamerican.com/article/perovskite-solar-cells-could-beat-the-efficiency-of-silicon/
Perovskite solar tech is still a newborn. But it may be commercialized within the next two or three years.
It is hard to say how much if any cheaper it might be than other solar pv tech and the balance of system costs are the real hold up in any case.
Greater efficiency would help reduce Balance of System costs. Increase efficiency by 25%, reduce proportionately the amount of racking, installation time, etc.
Nick makes an excellent point concerning efficiency of panels and overall system costs but it is my impression that we yankees are still paying twice what Germans pay for equivalent systems because our building codes and permitting and inspection processes are simply awful when it comes to small scale pv.
In some countries it’s bribes, in the US it’s layers of middlemen, lawyers and government.
Read this recent post
http://judithcurry.com/2015/05/31/solar-grid-parity/#_ednref4
I would have thought Britain would have been a logical market for EV and Hybrid type vehicles. Small country, compact living and very expensive fuel, though street parking is seen as a problem. Yet it has take 2 years for the govt to give away 35000 5000 pound bonuses to buyers of electric cars? Apparently the pace of sales has picked up, but why such a slow up take, especially with all the free giveaways?
http://www.ghanaweb.com/GhanaHomePage/world/Britain-5-000-giveaway-boost-sale-of-electric-cars-366525
In early 2011 the government introduced the £5,000 grants (£8,000 for plug-in electric vans) and promised that the scheme would continue until 50,000 were awarded. Early take-up was slow, and two years later just 3,200 had been made – largely because there were so few electric vehicles to choose from.
Prices of electric vehicles are still above the cost of conventional petrol and diesel cars, but the government grant is only part of the savings drivers enjoy. Electric vehicles are zero-rated for car tax (vehicle excise duty) and exempt from the London congestion charge (£14 a day) – but, above all, they cost virtually nothing to run.
A full charge will cost around £2 to £3 and will give a typical range of around 100 miles. Driving 100 miles in a petrol or diesel car will cost around £12 to £18.
Free charging and free parking is also available at charging points in many towns and cities up and down the UK (zap-map.com lets you search them all).
Ford is having trouble meeting the US demand for pickup trucks:
http://www.ft.com/intl/cms/s/0/2b112c16-0932-11e5-881f-00144feabdc0.html?siteedition=intl#axzz3f1Bnojru
Conventional wisdom seems to be that we are going to have permanently lower oil prices due to production from very expensive wells in very high decline rate tight/shale plays around the world.
At least they are 5%-20% more efficient than the previous generation of F-150s. Nevertheless, as a personal vehicle for commuting, which they are often used for, they are a pretty dumb choice.
That 5%-20% efficiency improvement for the F-150s, the best selling vehicle in North America represents a huge drop in gasoline demand as loyal F-150 drivers replace their old trucks with the new generation.
The interest in trucks will continue to be a dilemma for the oil industry. People buy the vehicles in part because fuel is cheap now relative to a few years ago. Raise the price of oil to keep oil companies afloat and the consumers will get very unhappy.
So I guess you keep the price low until enough oil companies go bankrupt, the supply drops, and then the prices go up to make the hard-to-get oil worth worth producing again.
Subprime auto/truck loans make up about one-quarter of outstanding sales/loans:
http://blog.credit.com/2015/03/is-there-a-subprime-car-loan-bubble-111925/
http://www.nytimes.com/2015/03/02/business/dealbook/wells-fargo-puts-a-ceiling-on-subprime-auto-loans.html
http://www.wsj.com/articles/car-loans-see-rise-in-missed-payments-1420768083
http://wolfstreet.com/2015/01/09/subprime-auto-loans-spike-sales-industry-in-denial-implosion-to-hit-broader-economy-more-than-banks/
But no problem:
http://www.cnbc.com/id/102475311
http://www.ibtimes.com/heres-why-high-risk-subprime-auto-loans-are-growing-auto-loan-defaults-arent-1796804
https://www.moodys.com/research/Moodys-Delinquency-rates-on-subprime-auto-loans-eased-in-fourth–PR_323174
http://www.usatoday.com/story/money/cars/2015/05/19/auto-loans/27568421/
Without subprime auto loans, vehicle sales would be 12-13M instead of 16-17.
With the shale and energy-related transport sectors and goods orders contracting, industrial production manufacturing markedly decelerating since Q4 2014, and retail sales ex autos decelerating to an historically recessionary rate YTD and YoY, booming vehicle sales are about the only thing preventing the US economy from decelerating below “stall speed” and towards no growth or contraction.
Note that housing and auto transport costs combine for 50-55% of the typical after-tax US household’s spending (more for those under age 35 and over age 65).
Housing has reportedly picked up a bit, but new housing’s share of GDP is at a post-WW II low, along with wages as a share of GDP.
US SAAR real GDP per capita is growing at just 1% YTD (0.3% real per capita) and 1.5% (0.8% real per capita) since Q4 2014. To avoid deceleration below the historical ~2% “stall speed” for the 4-qtr. avg., US SAAR real GDP will have to accelerate in Q3 to 3.5-4%, which does not appear likely.
Once vehicle sales roll over, there’s little remaining to prevent the US economy from further deceleration below “stall speed”.
Bonuses for electric vehicles don’t make sense. A better solution is to pay a 300€/year bonus to owners of vehicles which emit less than 500 kg CO2 per year. The bonus can become effective when the vehicle goes through the yearly vehicle inspection.
Electric vehicles would pay using the average emissions for electricity marketed in each country.
In fact subsidies have been worked out in very fine detail to an individual county level.
It ranges from areas where EVs deserved significant subsidies e.g. Los Angeles ($4,958) to areas where EVs deserved to be taxed e.g. D.C. (-$1,077)
see http://www.citylab.com/weather/2015/06/where-electric-vehicles-actually-cause-more-pollution-than-gas-cars/397136/
The comment was about British program to give a 5000£ bonus to electric car purchasers. That program was designed by mentally retarded bureaucrats.
My area has a mix of solar, hydro, natural gas and coal and nuclear generation. Coal is less than 30 percent.
I calculated the CO2 output of a coal electric EV per 100 miles versus a 25 mpg ICE. The ICE produces about 80 pounds of CO2 and the EV about 60 using 100 percent coal driven electric (the worst case).
I have come to not trust most studies, especially those done by economists, concerning energy. If it doesn’t make sense, then toss it.
Check your arithmetic or conversion factors. Your numbers are way off the British and EU results.
Europeans and Britons have already responded to high prices: they use on average 18% as much fuel per capita for personal transportation.
The US, with its massively inefficient light vehicle fleet, is the best place for EVs to get started.
Nick,
I agree on the macro level, the US is the best place to start replacing petroleum products from transport, but on the micro level, ie the individual car buying public, they weigh up the advantages/disadvantages in each market place. Even thought the Brit/European is using less fuel than his US counter part, he is still spending the same if not more in total, than his US counter part and most likely have shorter commutes. Therefore the European most likely has the ability to save more than the American and therefore should be more likely to be early adapters to the electric vehicle, but they aren’t? The question why?
Someone down thread, suggested the amount of money in Silicon valley has the ability to change the way we do things, and maybe there is a rub off in the US market along these lines. But apart from that, I am at a loss of why EVs and Hybrids have not been the big sellers in Europe. The fact of all the financial incentives in Europe have not been able jump start the EV point is a telling point in my opinion.
As a personal bias, I feel the Europeans have taken a more logical path to fuel economy, by down sizing, which to most Americans seems to be sacrilege and therefore are required to reinvent the wheel to achieve the same purpose.
Europeans only consume 18% as much fuel per capita. So, with fuel prices twice as high, they still only spend 40% as much per person.
Europeans have more efficient cars, they have fewer cars, and they drive them much less. That gives greatly diminishing marginal returns on the additional investment in electric vehicles.
European car makers have invested in diesel. It has been a bit of a wrench to switch over to hybrid electrics and pure electrics, though now they’re doing it.
European homes are less likely to have private garages. That means that pure electrics require more public infrastructure investment, though again that’s now in process.
Nick,
Americans certainly drive further than Europeans, but do you have any idea of how many miles Americans are driving their electric vehicles? I would have thought it would be a lot less than the average car due to the issues involved in longer distance travel.
HI Toolpush,
I have not seen any hard figures but such anecdotal evidence as I have gathered by reading various car sites indicates to me that most ev and plug in hybrid owners are driving their cars quite a bit, actually as much as they can, for a couple of good reasons.
One is that you just always drive the new car since it IS new and under warranty – more pleasure and no need to let the warranty run out on time rather than mileage.Two , low out of pocket operating costs and getting back as much of the purchase price this way as soon as possible.
Almost everybody I have talked to in various forums who owns a BEV also has a conventional car- which they use for OCCASIONAL longer trips. The conventional car mostly sits around except on vacation or going to see Grandma etc.
A person who has a sixty mile or greater round trip commute can make half or more of it in a VOLT before the ICE kicks in. There seems to be quite a few Volt owners who are racking up serious miles commuting but I am not an expert in such matters.
I do know that the vast majority of Americans drive less than sixty miles a day most days. Hardly anybody percentage wise drives more than a hundred miles a day on average except if his JOB involves using his car on company business.
This comment is ANECDOTAL in nature.
Hi Nick,
You keep using the “personal transportation” number which is cherry picking. Us the total oil use per capita for Europeans vs the US which is roughly half the level, if you want to be taken seriously.
Dennis,
We’re talking about EVs for personal transportation. Industrial/commercial oil consumption isn’t relevant.
Hi Nick,
We are also talking about oil, the amount consumed is what matters. Europe doesn’t use many EVs so maybe EVs are not relevant. Higher taxes on gasoline changed things in Europe and population density is much higher there which is relevant for public transportation.
Sam is correct that better public transportation in the US is unlikely to get us to European levels of fuel use for personal transport. At a low oil price and with little hope for higher taxes in the US, it will take a long time for plug in vehicles (EVs plus Volt like cars) to catch on enough to make a difference.
Hope is nice, but it doesn’t get us where we need to go.
Hope is nice, but it doesn’t get us where we need to go.
Pot calls kettle black.
We are also talking about oil
Well, we can if we want to, but that’s not where this conversation started. Look back at the first comment: it’s all about light vehicle EV adoption rates in the UK.
I agree that EV growth rates aren’t quite what we need them to be. That is, of course, due primarily to resistance from the car and oil industries, and secondarily to the problems of a new industry – fear, inexperience, lack of economies of scale, lack of diverse model selection, etc.
I agree – hope alone won’t do it. It requires action.
So – have you told your elected representatives to support EV and alt energy, and made a campaign contribution??
I think it has to do with the hot/cold weather combination. Electrical vehicles aren’t practical in areas with hot summers because the temperatures degrade the batteries. The EV performance really stinks in winter if the temperature drops below 5 degrees C. And their range tends to suck if one has to run the heater.
Then you have to add the way our parking is laid out (I live in a condo and the parking area is under the tennis courts where we have shared space for about 100 vehicles). To get a charging hook up I will need a separate meter run from the main transformer. And that costs money.
Nick,
How far do Americans travel compared to Europeans? I think you’ll find our considerably higher population density plays a significant role. Unless you’re planning on moving everywhere in the USA closer together you’re missing a big part of the picture.
Sam,
The average European light vehicle uses about 60% as much fuel per unit of distance traveled.
The great majority of Americans live in urban areas, just like Europeans. Since WWII, Americans have chosen different patterns of mass transit versus personal vehicles, and have chosen different patterns of suburban and exurban housing.
These are choices, and they have a lot to do with fuel prices.
Something for folks who think oil will stay cheap long term to think about
http://www.bbc.com/news/business-33379982
Yep Mac,
Shell certainly are not planning on cheap oil to be around for long.
OFM/Push
40 to 50 meters water depth?
About 200 miles off the coast?
Could the waters be that shallow up there?
Push, not only is that way too shallow for anchoring, I did not see anchors in the accompanying picture. Do all these rigs use that stationary, automatic positioning system nowadays?
Shoot, @150′, you could jump over the side to retrieve the Pusher’s dropped coffee mug off the bottom. 🙂
Coffee,
Yes it is shallow water, and they do seem to have gone out of their way to use anchored rigs rather than DP. The Drillship they are using is a 1960’s converted freighter. It was owned by Transocean for many years, Known as the Discoverer 511. It is a turret moored anchor system. This allows the ship to be turned into the weather with out upsetting the BOP, just like a DP drillship. I believe the Federal pollution controls has created the need for using this out dated rig, as CO2 output is measured against each lease. On the other hand DP in such shallow water would be difficult, but I was told by an inside source that the Stena Drill Max was suppose to be the rig of choice.
The Polar Pioneer is also anchor vessel,designed for Norwegian conditions, if my memory serves me correctly. I saw this rig leaving Singapore at Christmas Eve, so it has been a long road to drill two well in the artic, many months later.
150 ft, should be BOP,one joint riser and slip joint. Just need to watch out for float ice drifts?
A word of advise, don’t play around with the Pusher’s coffee! lol.
It’s on the continental shelf, but it may have been dry land during the ice ages (I think it was, but I’m not sure).
It’s not too shallow for anchoring, but it definitely needs very stout anchoring to avoid over flexing the riser. But I believe the sea state will be mild, there’s sea ice nearby, and ice doesn’t allow waves to get too big.
Surely you mean dry ICE in the ice ages . A bit like the giant lake that is greenland.
No, I meant dry land. Not all the Arctic was covered by glaciers. To find out the glaciation history we could take a core. Dry land usually has a very thick low temperature permafrost, glacier covered soils are very compact. We can tell where the ice free corridors were located by the compaction history, the soil temperatures, and the organic material in the cores. I’ve worked in Arctic offshore Projects. But I never looked at that site.
Fernando,et al.,
Sea level was about 130 meters lower at the last glacial maximum than it is today.
Shell will drill one well, not two. The permit was changed, according to Bloomberg or Downstreamtoday.
Synapsids, I don’t know the site history, and I don’t have the isostatic rebound for that spot. I don’t think it’s significant. I’ve seen areas with 250 meter rebound, way east, Hudson Bay to Ellesmere.
Fernando,
There was very little ice in Alaska at the last glacial maximum except in the southern part of the state (Alaska Range and St Elias Mountains–that region.) North of there, there was glacier ice in the Brooks Range and points east blending into the Cordilleran Ice Sheet over in Canada but not much elsewhere; Alaska was the eastern part of Beringia and Beringia was very dry. That’s why we find that huge tonnage of fossils from grazers like bison and horses and wooly mammoths. (We didn’t get the wooly rhinos, though. They never got farther east than western Beringia.)
If Shell is going to drill in the Chukchi Sea they’ll be drilling in a region that was mostly free of ice at the LGM; I’d expect no isostatic rebound at all.
Exactly, Beringia, like most of Siberia and all of north and northeastern China, was not glaciated. It was a grassland steppe. There is a large area in the Yukon Territory that remained ice free as well, that surrounding Aishihik Lake.
Hi Doug.
I didn’t know about that ice-free area in the region around Aishihik Lake. Do you have a reference?
A glimpse at the map suggests that’s in the area between the Cordilleran and Laurentide Ice Sheets that opened and closed at various times. It’s called the Ice-free Corridor by some when it’s open.
A book you might like, if you don’t know it, is After the Ice Age, The Return of Life to Glaciated North America, by E C Pielou. She’s a Canadian biologist (may be deceased by now) and has written several good books about the North.
Hi Synapsid,
Yes, best reference in the world, me. Seriously, had a crew working in that area in the 1980s and we were kind of amazed by the fact overburden was laterites (very deeply weathered soil) as opposed to 95% of Canada cloaked by glacial gravels. I discussed it with a GSC (Geological Survey of Canada) geologist to discover that the unglaciated area is multiple hundred square mikes; don’t remember any details. Suppose I could dredge up references if you’re really interested though I’d rather finish reading about a recently discovered pulsar that’s been misbehaving badly: Erratic rotation period.
Doug,
Laterites! Those are subtropical or tropical, for crying out loud. How old were they? I’ll track down references, so’s not to distract you.
Keep me posted on that pulsar, too. OK?
Like I wrote, I tend to think it was dry land. They may even have deep permafrost. Did the Brooks range glaciers weigh down the range and uplift the shelf? How thick was that ice?
Fernando,
The ice was just in alpine glaciers and wasn’t likely there all that long in the western Brooks Range–most of the ice was farther east in the range. The old maps had a lot in the western Brooks and in the DeLongs, but that has been revised down a lot. (I went and looked.) I’d expect little or no isostatic adjustment on the Chukchi Shelf.
There was a good deal more ice in the region during the previous, Illinoian, glaciation but that was some 100 000 years before.
OFM, note that since 2007-08, US real final sales per capita have averaged ~0% while the price of oil averaged $85-$100. Historically, the US 5- and 10-year rate of real final sales/GDP averaged less than 1%, and at times near 0% or negative, with the price of oil above $40.
The US is in a situation today in which we cannot afford to extract profitably 9Mbd of oil at $55-$60 AND grow real final sales/GDP over a 5- to 10-year period. The Eurozone and Japan are in the same predicament, and now China is following along (China’s labor force is contracting with productivity at no more than 1%, implying potential real GDP per capita for China hereafter of less than 1%), resulting in 65-70% of the world’s real GDP per capita decelerating to below 1% since 2007-08.
If the economy can grow no faster than 0-0.7% in real terms per capita, and the energy and debt service costs of extracting lower-quality, costlier crude oil substitutes render the process unprofitable, how likely will we be able to continue to build out the renewables infrastructure to scale AND prevent the economy from contracting AND maintain indefinitely the fossil fuel infrastructure?
Peak Oil and “Limits to Growth”.
Go-o-o-od morning, slaves, and welcome to another sedition of…
It’s The End of The World As We Know It and I Feel Fine
The show where dogs go to riot.
This slave is enjoying a vacation by the pool.
I stumbled across this news:
“U.S. shale producers have brought down the breakeven cost from $35 to $20 per barrel,” ANZ bank said on Friday.
What is this ?
As group they were loosing money at $100/barrel, and all of a sudden the break-even price is $20/barrel?
Hi Frugal,
They were not losing money at $100/b, they borrowed a lot so they could expand faster than their cash flow would allow, but when prices were above $100/b they were doing fine. Break even oil prices are about $67/b in the Eagle Ford and roughly $77/b in the ND Bakken, at prices higher than this there is money to be made. The low ball numbers are absurd, the claim that money was lost at $100/b is also absurd.
Must be operating costs and overhead?
I am sure there are some shale wells that break even in that ball park. The number is very few.
There are many that will not payout at current oil prices.
One thing brought up in the Econimist articles needs be be mentioned in the discussion.
The majority of the shale companies spent money very recklessly prior to 2015. This money largely was borrowed.
Maybe they all have retreated to the core and are obtaining large expense concessions. Unfortunately, they are stuck with the 2010-2014 borrowing. They need to do much more than break even to get out of that hole.
I agree with Mike that PV10 may not be accurate, but it is really all we have. I also agree with him that proved undeveloped PV10 is not a great metric as it requires more money to be borrowed.
However, I think long
term debt to proved developed PV10 is an important metric. Should really use the standard measure calculation, as income taxes do have to be paid. For example, CLR PV10 all categories drops over $4 billion when income taxes are included.
It is pretty simple, really. If an oil company cannot hedge producing production and pay its long term debt, where does that put them?
Hoping for a combination of higher oil prices and better, more cost effective wells than you have already drilled is speculative.
If they are around break even on all new wells (which I doubt) at current prices, they are still in financial trouble. To me, break even means PV 10 for the well will be $0.
Another example would be apartments. Say you built during a boom, paid way too much but rents were high. Rents suddenly drop by half. You can now build apartments for much less, and break even or maybe make a small profit. However, you are still stuck with the expensive apartments and all the debt incurred to build them.
However, now throw in that those expensive apartments not only are just fetching half the rent they were, but the vacancy rate (decline) is growing rapidly and five years after they were built, will be 1/4 or less occupied.
I’ve mentioned before when I would visit a city 2000-2007, I was blown away by the number of new home being built and wondering where all the high paying long term jobs were to pay for them. Some of them were fascinating homes. Kind of like some of the shale technology and IP rates.
But it all has to be paid for.
”But it all has to be paid for.”
In the business as usual scheme thinking inside the usual box indeed it all has to be paid for.
BUT if one adopts the biologists or the physicists or chemists pov, nothing is gained or lost any more than in a chemical reaction. The OWNERSHIP of the borrowed money is in effect LOST by the lenders and defacto gained by the creditors who do not pay . This may not do the borrowers any good within the usual bau scheme of course.
Are the apartments ”wasted ” or ” waste ”? In the bau sense they may be such.
But they are no more waste or wasted than throw away consumer items or sports stadiums or cars designed to be scrapped within fifteen years etc.SOMEBODY is apt to get a great deal of utility or value out of them. The landlords loss of high rent is the tenants gain of cheap rent.
Nature gives not a hoot or a damn about waste and loss. The grain the farmers lose to rats is the rats gain. The entire biological system is in balance overall at all times allowing for time lags. Of course changing circumstances drive it to constantly changing new equilibrium states.
Shallow Sand,
As can be seen from the privately owned new housing starts graph below, the housing industry never recovered from the last recession. Data is monthly and seasonally adjusted.
Vehicle miles traveled /civilian non-institutional population June 1969 to June 2015. US only, monthly. Millions of miles/thousands of people. This only includes everyone above the age of 16 and not in the military or institution.
Definite downtrend in miles/person since 2002 but downtrend looks to have leveled out.
Hi shallow sand,
When corporate profits are zero in GAAP terms, then corporate taxes are also zero.
breakeven cost include cash operating cost + capex + some other expenses, including interest and income tax + IRR (internal rate of return) of 10-12%.
I have not calculated well breakeven costs, but here are costs per barrel of oil equivalent for EOG Resources, one of the most efficient shale oil & gas producers.
Some investment banks and some experts now use “half-cycle cost” as breakeven cost.
This only relates to cash operating costs per boe, does not include capex, interest and implies IRR at 0% instead of 10-12%.
So when they say that breakeven is now at $20-25/boe, this is complete BS
It is above $50/boe even for the most efficient producers and well above $60 for the shale sector on average.
Thanks AlexS,
Very interesting. At a 10% nominal discount rate I get Bakken break even oil price at about $71.50/b on a point forward basis. For the Eagle Ford the break even is $64/b.
For a nominal discount rate of 15%, Eagle Ford break even is $67.5/b and Bakken is $81.5/b.
Dennis. Referring to post above about my OPEX estimates.
I had a discussion with a Seeking Alpha article writer recently. He was calculating well payout by merely multiplying production by NYMEX WTI price. I was critical of that approach and provided one if my simple five year calculations.
He replied that some operators will voluntarily provide lease operating statements. Maybe we should try contacting a few to see if they will? They are public companies, after all? Maybe we could get Whiting’s data room emailed to us from back when they tried to sell out earlier this year! LOL!!
Any companies in particular you would like me to start with?
I would pick the top 5 producers in the Bakken and maybe the same for Eagle Ford and Permian Basin (in that order), the Permian may be a waste of time as trying to estimate a well profile is very difficult in the Permian basin (due to the mix of vertical and horizontal wells and the huge number of wells that have been drilled in the past few years). So focus on Bakken and Eagle Ford. Continental, EOG, XTO, and Pioneer come to mind, but you follow this much closer than me so your judgement would be better than mine.
Also Rune Likvern knows these details at least 100,000 times better than me so he would have better advice, maybe ask him at over at his blog.
http://fractionalflow.com/
From his recent post:
The 8 companies are; Continental Resources, EOG Resources, Hess Bakken Investments, Marathon Oil Company, Oasis Petroleum, Statoil Oil & Gas, Whiting Oil and Gas Corporation and XTO Energy.
These 8 companies had around 63% of total LTO extraction from Bakken as of April 2015.
Read Mr Likvern’s assessment of these companies and maybe pick from this list so you can build on the foundation that Rune has constructed.
Hi Shallow Sand,
Did you see this comment
http://peakoilbarrel.com/the-eias-questionable-numbers/comment-page-1/#comment-525193
What do you think about such an estimate for OPEX cost plus down hole maintenance?
The total OPEX over 5 years would be similar to the straight $14k per month plus $100k per year, but we would have higher total opex during the high output part of the well profile and somewhat lower OPEX in the late years, my suggestion is $10k per month fixed with a $4/b cost for the varying well output (Fernando’s idea actually).
Using the OPEX above and assuming well cost plus abandonment costs at $8.7 million and a nominal rate of return of 13% (inflation 3%) the break even oil price is about $77.5/b (refinery gate price) and where break even means you get your 13% ROI.
If we reduce ROI to 10% (nominal), break even falls to $71.5/b and if we raise ROI to 15%, the break even oil price rises to $81.5/b
An item from the Peak Prosperity folks:
In A World Of Artificial Liquidity – Cash Is King
And you’d better have some stashed out of the system
http://www.peakprosperity.com/blog/93378/world-artificial-liquidity-–-cash-king?utm_campaign=weekly_newsletter_186&utm_source=newsletter_2015-07-03&utm_medium=email_newsletter&utm_content=node_title_93378
This is an imperative. Apart from precious metals mining companies and some energy companies, it’s hard to find markets that are NOT in a massive bubble as a result of ZIRP, NIRP, QEternity, hyper-financialization of the economy, and now central banks overtly printing to buy equity shares (or index futures).
Madness.
Cash/liquidity will eventually become dear (already is in Greece, of course) and produce a superior net return to bubbly assets, i.e., return “of” your money vs. a return “on” your money.
For all:
Bloomberg says Greece voted No. With almost all votes in it was 62% No to 38% Yes.
Next up is what the EU does. The word “chaos” comes from Greek, I believe.
CNBC World talking heads, broadcasting from London, say that most analysts had expected a yes vote, although I think that the polling suggested a narrow no vote.
So what happens now?
FT: Greece votes No — now what?
http://www.ft.com/intl/cms/s/0/2066a902-2346-11e5-9c4e-a775d2b173ca.html#axzz3f1Bnojru
BBC article on Iceland, Cyprus & Greece:
http://www.bbc.com/news/world-europe-33354036
“So what happens now?”
Greeks called the bluff. So now we will see if the other side was bluffing?
To be continued .. 🙂
Oil traded in dollars likely to fall in short term.
probably, but like shale guys care 🙂
They better care. Oil will likely trade below $55 WTI for awhile.
The average WTI price the first six months was $53 and change, I believe.
Add on an Iran deal, and we could be looking at an average price in the second half below $53.
There has been a lot of talk of break even, adding rigs or whatever at $65, which may or may not mean WTI $65.
We really haven’t been there and may not be for awhile.
As long lines of credit are open so they can search with remaining rigs for imaginary sweet spots in ever decreasing breakeven price they don’t care much. And their talk of adding rigs at $65 that is just “selling a sizzle, not a steak “. Is that how saying goes in Texas? 🙂
And it is not just them whole economy is science fiction, look beloved Tesla, selling few thousands cars a year and have market cap of GM and Ford combined 🙂
And it is not just them whole economy is science fiction, look beloved Tesla, selling few thousands cars a year and have market cap of GM and Ford combined 🙂
There’s a lot of money floating around.
And that’s why I keep pointing out that Silicon Valley money supporting energy technology projects is not a Communist plot. Far from it. These are wealthy people who see an opportunity in remaking transportation, energy generation, energy distribution, and energy use.
As I have remarked in other places in this key post we naked apes live by the story or the narrative rather than the facts.
Tesla is the fresh and sexy story. The rest of the industry is about as young and sexy as Grandma in the eyes of the rising generations.
Tesla got the auto factory the company is using NOW from GM and Toyota iirc for a few cents on the dollar – an essentially NEW factory filled to the doors with the NEWEST production machinery, all also basically brand new.
When the next oil crisis hits- which will probably be within ten years and likely sooner unless business as usual collapses sooner- Tesla will probably buy ANOTHER nice new manufacturing facility for ten cents on the dollar from some company locked into the existing bau ICE powered car business model.
Of course GM both GM and Ford do have SOME people with their eye on the future and both have muscle enough to build a damned good BEV or plug in hybrid.
It will be extremely interesting to see what Ford comes up with in say five years – Ford might be able to leapfrog both Tesla AND GM by delaying the heavy investment until battery tech matures for a few more years.
In the meantime the Bolt appears to be a basically brand new car, and might do very well right out the door. The Volt is a bastard child born with body shell and chassis designed for ICE propulsion. I would nevertheless buy one if I were in the market for a new car.
Given that I want a big bang out of every dollar I spend, and am too old to want to impress anybody, I would never consider spending more than maybe four or five thousand bucks for a car or pickup in order to just about eliminate the tax and depreciation line items.
Investing the difference has always paid any repair and maintenance costs with plenty left over.
The 2016 Gen 2 Volt will be hitting dealer floors in October. Unlike the Gen 1, it was designed/built from the ground up optimized for its dual hybrid/EV personality.
GM says they cut $10K out of the production costs and it gets better mpg in gas mode and 12 miles more EV range, is 250 pounds lighter, more power and acceleration, quieter, and will sell for less.
Regarding the Gen 1 Volt. My “bastard” Gen 1 Volt is the best car I’ve ever had…sometimes the mutts are better than the thoroughbreds.
I think there’s a critical need to set up a refugee camp system, to place Greeks fleeing from communism. I was placed in such a camp by the UN Refugee system, when I fled Cuba at 14. It wasn’t nice, but it beat the street. We need to set up to provide Greeks decent accommodation, try to keep families together, teach them languages, etc.
I think there’s a critical need to set up a refugee camp system, to place Greeks fleeing from communism.
Oh, for pete’s sake, the Greeks are NOT fleeing from communism!
Do you not understand peak resources on a finite planet? BAU and the financial system that depends on infinite growth is hitting the wall and Greece is just one of the canaries in the coal mine. Communism has absolutely nothing to do with this.
Hi Fred,
Fernando says some stuff that is very interesting and some stuff should be ignored, he is confident enough to say some outlandish stuff. It is a wheat/chaff thing.
Yeah, I know, BIG GRIN!
Read my latest post. I’m hooked up to Greek commie Twitters. I assume you know the Tsipras gang is mostly hard core Marxists?
assume you know the Tsipras gang is mostly hard core Marxists?
And even if they are, so what?! They and communism, continues to be completely irrelevant in the big picture as do most of the major ‘ISMS’
Marxism may have had some appeal when BAU was young. The world has changed and so have the things that should worry all of us. Little thugish gangs like those in Al Qaeda, ISIS, Communists etc… etc… are NOT what any of us should be worried about.
Call me crazy but I do not see Marxists or Communists having a snowball’s chance in hell of consolidating and holding real power. At most they might be minor pains in the ass! They don’t have any clue about what is happening with the global economy or why it is happening. They will not be able to provide the bread and circus necessary to keeping the plebes happy, so they will be kicked out of power almost as soon as they gain it.
The plebes of today are very fickle and they have Google, Facebook, Twitter and Youtube, etc… to keep them plugged into the Matrix. Unless you can tell me how the commies can compete with those kinds of forces I ain’t gonna worry about em!
This stuff is over the reporters’ heads.
There is no such thing as default. Greece can stop paying on the paper, and fund just the primary deficit/surplus, and ignore the debt — but it will still be there.
The banking issue is a different matter. When Cyprus was forced to maintain something like 200 Euros/week maximum withdrawl, it wasn’t declared to be horrible. People ate.
As for bailing in depositors to keep banks solvent, this likely is based on a presumption the banks have to pay external bills — which they won’t if the gov’t tells them not to.
The black swan is the credit default swaps. No one ever knows how much exposure who has to how many of those. This will be the big uncertainty, and after 2011 it’s possible CDS contracts are written to trigger on some other event than an ISDA declaration. If CDS are rendered worthless by EU demands the ISDA ignore all default declaration requests, then that risk management tool is lost and interest rates on Italy, Spain and Portugal borrowings will have to rise. So the new crop of swaps may have different trigger clauses.
As a general thing, ignore pretty much all MSM writings on Greece. If there was ever a time for agenda, this is it.
But don’t Greek banks own a lot of Greek government debt?
That was what is called PSI. Private Sector Involvement. It was semi expunged. By force the banks were required to agree to extension of maturities out to 30 and 40 yrs in 2012. This was done to all private banks in the EU, mostly Greek and Cyprus.
The number is 320 B. The troika are the Official Sector lenders. It is they who face the haircut. They agree to the haircut (losing all that money, or some portion of it) and then face their voters and supervision to explain why they loaned it to begin with.
And then Spain and Italy demand their haircuts. Greece’s number is 320B. Spain’s is 1.1 Trillion.
There is talk of Bank of Greece (their CB) creating electronic IOUs (like California did) and using them as Euros. There are other ways for them to create Euros, too. When a member country does it, it’s hard to call it counterfeiting.
But it does take another step along the path of shining a light on what has happened to monetary policy since 2008, as well as causing more stares across the table at the Kremlin asking . . . why are we giving these people oil in return for these 0s and 1s?
The pom pom boys at CNBC are probably a little freaked out on the Greek vote, and are trying to minimize the consequences.
Here is an interesting graph of oil and gas employment along with oil and gas production over time. Graph data is monthly, the oil and gas production has been set at 100 for 2007, the employment is people in thousands. Not seasonally adjusted.
Dates for above oil gas graph: 1972-01-01 to 2015-06-01
Marble Zepplin,
What strikes me in your chart is that in 1980 a surge in employment did not increase oil production very much. In 2010 the high oil employment did increase production substantially. This tells me that shale and conventional oil are different business models.
Yes Heinrich, I fully agree with your analysis. Throwing a lot of people and money at the problem in the 70’s and 80’s did not find much recoverable oil. The shale oil system does seem very dependent upon employment, production and employment values moving together except for the hiccup around 2008 which was the big recession.
Still, employment again rose steeply along with production into the current overshoot.
in the 1974 to 1980 period we had a lot of new hires in response to the 1973 embargo, but we also had oil and gas price controls. In 1980 Reagan came in an introduced neoliberal economic principles. By then the personnel was better trained but prices started going down.
My recollection was that most of us got promoted too fast. I was pushed incredibly hard and by the time I was 28 I could approve drilling well locations, sign the detailed drilling, casing and mud program and so on. I think I got lucky they couldn’t catch my mistakes because my bosses were also a bit out of their league.
My boss was so out of the day to day work he only demanded we keep a map with pins showing the rigs and a graph showing how much the new wells were producing.
Saudi Arabian production up to 11.70 million bpd according to scuttlebutt:
http://capgainr.com/oil-leaked-saudi-arabia-oil-production-figures-via-saudi-aramco-source/
That’s Total Liquids average for 2014. That’s pretty much what everyone else has their total liquids at also. This is no great revelation.
Isn’t he saying this will be the new monthly in the beginning of the article, and that it is “leaked” info?
Leaked or not, there is noting new in their data. The EIA says they produced slightly more, except for 2014 they agree almost exactly.
Understand this is total liquids, not Crude + Condensate. They don’t say what it is but the figures they give for the USA are definitely total liquids, 12.4 million barrels per day in 2014.
Thanks for the clarification.
What’s more relevant is that EIA + BP data show that Saudi net exports (total petroleum liquids) dropped from 9.5 MMBPD in 2005 to 8.4 MMBPD in 2014, and I estimate that Saudi Arabia may have already shipped close to half of their total post-2005 supply of net exportable liquids (what I call CNE, Cumulative Net Exports).
And this: (is this guy a propagandist?)
http://www.aei.org/publication/bakken-updates-1-williston-as-ground-zero-for-the-american-spirit-and-2-here-comes-shale-2-0/
“Six or eight years ago we were estimating a recovery factor of just 3.5% in the Bakken shale reservoirs from our horizontal wells. With additional work, micro-seismic study, well production history, big data analytics, etc., we’re now estimating that we’re recovering 15-18% of the oil in place. We further estimate, with our current technology, that the technically recoverable oil in the Bakken is 65 to 90 billion barrels.”
Greenbub. On the other hand, note what Chesapeake just did last week.
They had contributed 250,000 acres of leases and all the wells on them to a complex financing structure to raise money for more wells. They raised $1.25 billion to drill the new wells. In January, those who put up the money part of the deal forced CHK to stop all drilling activities.
CHK was allowed to walk away from the whole thing. They are touting this as good for the company. It was in effect a short sale. They lost all the acreage, the wells they had contributed plus the new wells they had drilled, but we’re relieved of further liabilities.
Assuming well head prices are headed into the 30s or 40s, I will be surprised if significant new money is lent for new wells anywhere. Will be interesting in a couple weeks or so to see second quarter 10Q.
Lets call the estimate 78 Gb from the Bakken/Three Forks. This is about 6 times higher than the high end (5% chance that there would be more oil) estimate of the USGS in April 2013 and roughly 7 times higher than the USGS mean estimate. I am not buying it.
AEI is a conservative economics think tank. This article is a compilation of that sort of thought as regards American know how and technocopia. They aren’t geologists.
They get a lot of things wrong. They get some things right.
I believe every person I met in Williston was there to earn a living. They were there for work. They didn’t migrate there looking for a handout. They wanted to find work, they learned there was work in Williston, so they went to Williston. From the tattooed convenience store clerk to the scruffy roughneck, they all shared that common trait.
Good chance that’s correct. Don’t think I’ve heard of any rumors of word spreading in the homeless subculture that living on Williston sidewalks in January is attractive and that’s the place to go, unlike maybe Tampa or San Diego.
They are full of it. Such a high recovery factor is physically impossible unless they produce the zone for several thousand years.
One economist’s take on the Greek situation.
http://www.nytimes.com/2015/07/06/opinion/paul-krugman-ending-greeces-bleeding.html?_r=0
Excerpt:
Imagine, for a moment, that Greece had never adopted the euro, that it had merely fixed the value of the drachma in terms of euros. What would basic economic analysis say it should do now? The answer, overwhelmingly, would be that it should devalue — let the drachma’s value drop, both to encourage exports and to break out of the cycle of deflation.
Yes, they’ll likely devalue and the commies in charge will go on wrecking the economy. This is why I expect lots of Greeks fleeing communism.
Commies everywhere are trying to pump up the Greek commies. You should hear the comments made by Nicolas Maduro praising Tsipras.
As I have said before, the United States has been “fighting” communism for decades. We’ve spent lots of money and lives fighting “communists.” We’ve extensively monitored people in the US and around the world because they might be “communists.”
Our foreign policy and a good chunk of our domestic policy has been driven by the “communist” threat.
So what do you think the US and the world are supposed to be doing that hasn’t been done before?
I simply don’t find fighting “communists” a very high priority these days; and past efforts have likely done more harm than good.
The US and the world economy are overextended enough that even if people wanted to do so, I don’t think there are the resources to rid the world of communists.
And if people think peak oil is going to bring financial and social collapse, then presumably the “communists” will suffer along with everyone else.
It’s kind of like crying wolf. I’ve read about the “communist” threat my entire life. Hey, like going to war in Vietnam to prevent the domino effect was a good idea.
Hi Dennis,
In regard to devaluation of a currency-I know it is a good short term solution, at least in the sense that having a couple of snorts will often enable you to forget your troubles for a few hours or at least long enough to drop off to sleep.
But what I NEVER hear anything about is the FLIP side of the devaluation coin.
Now I am just a literal minded hillbilly but nevertheless unless I am VERY BADLY mistaken, the only reason to engage in international trade is to BUY IMPORTS which are paid for with the money earned by EXPORTING – except in the cases of countries such as the USA of course. We seem to have the world fooled into believing we are always going to cough up the cash in case anybody wants to call in our outstanding debts.
But if country such as Greece devalues so as to sell let us say for example, a thousand tons of feta cheese, then when they change their devalued money into let us say Euros, they are going to get a lot less Euros. So they can buy less. In the real world they are selling their cheese cheaper than before devaluation , obviously enough.
What I have never been able to quite understand is what stops all the other countries with economic troubles involved from devaluing in similar fashion in a race to the bottom.
What stops this from happening?
Literally awash in oil. I would think this would be highly toxic. Link
I reckon NoDak wellhead price is 38ish today. Oil at 53 as Euro weakness is presumed as far as the eye can see.
Flint Hills Resources posted price has been running about $12 per barrel below WTI.
Posted price for today will likely be in $41 range. Big boys get about at $3-4 volume premium, so use
$44-45 in calculations for them.
I have been using between $52-$55 for them, and only Neeson Anticline is not underwater at that level.
Probably need WTI to drop to $40-45 through the end of the year to start clearing the shale guys out, make them pull all rigs out of the field and say uncle.
However, hope we don’t blow through March lows. WTI in 30s or below really puts the wood to us, not just treading water at those levels.
SS,
That is why I asked who the heck is using 640 rig and 72 odd rigs in Canada? and why?
Remember several months ago there was and article from someone that predicts that WTI will be in $85 by end of August or beginning of third quater. I forgot who was it, but after today I think it will break $50 before it goes anywhere. It is so volatile that anybody who thinks that can make a sense of it it will just get burnt.
Listen to the wails of economic woes, and the big cuts to come are not even envisioned, let alone laid in, yet…
http://www.msn.com/en-us/money/companies/the-biggest-and-most-disruptive-layoffs-in-america-are-coming-from-the-military/ar-AAcEJwd
Perhaps some of the people can be retrained to install and service solar PV systems on millions of roofs across the country.
Hey, why not take people out of one subsidized government enterprise and pay them and their employers a considerably smaller subsidy to enter modestly subsidized private enterprise. Enterprises which install and maintain long-term infrastructure to keep the lights on at home. Helping the citizens at home with something they can use day-in and day-out, vice training for, and executing, continual overseas military adventures which dump money down rat holes. Adventures which in fact create blow-back and are actually much more expensive for us in the long term than our usual worst-case estimates which only count pay and fuels and kit and pensions/medical care…how much does it cost us to continually manufacture more potential Osama Bin Ladens?
I’ve done extensive price modeling forecasts on several shale companies and yeah they’re operating costs might put them at $60ish breakeven but when maintenance capex is factored in that quickly goes to $80 & higher. A lot of these companies need $100 to have a realistic chance of paying down any debt.