The new OPEC Monthly Oil Market Report is out with the April Crude only data. No real big movers. Total OPEC crude production was up 131 kb/d but that was after March production had been revised down 148 kb/d.
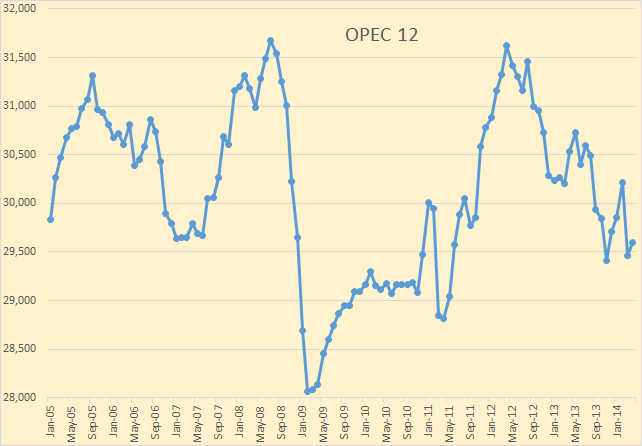
OPEC 12 crude only production stood at 29,593,000 bp/d. That is just over 2 million bp/d from their recent peaks in July 2008 and April 2012.
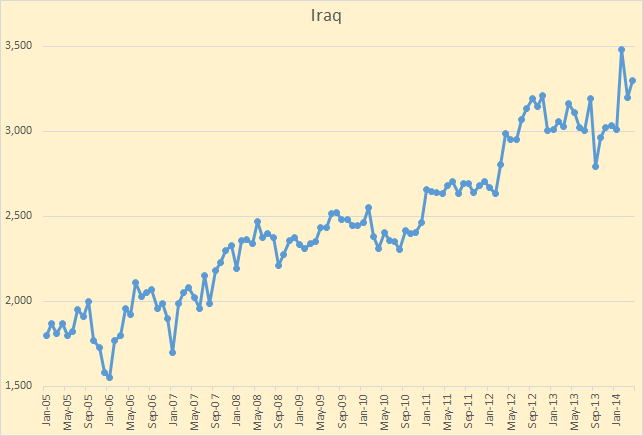
Iraq was the only big mover, up 102 kb/d from last month.
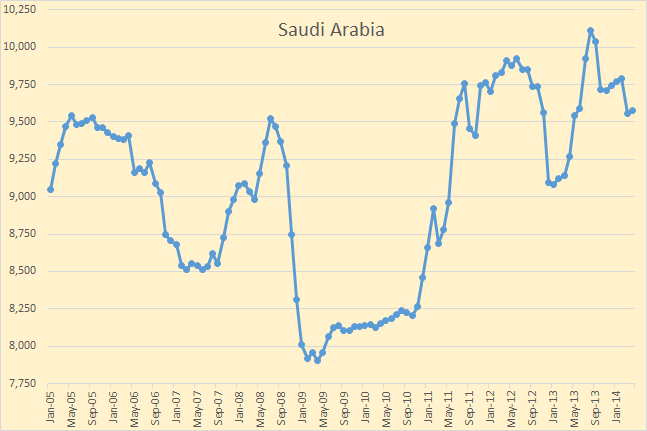
Saudi Arabia was up 23 kb/d but that was after March production had been revised down by 153 kb/d.
Updated Charts of all 12 OPEC nations plus a couple of others can be found on the OPEC Charts page.
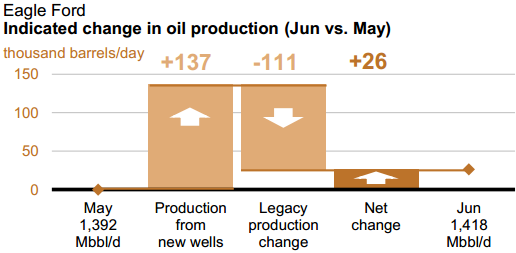
The EIA has just published their latest Drilling Productivity Report. That report tries to guess where all LTO production will be through June. It seems that they have decided to revise their predictions somewhat. Though their revisions of last year’s production was slightly up, their outlook on future production, particularly Eagle Ford is a bit more pessimistic.
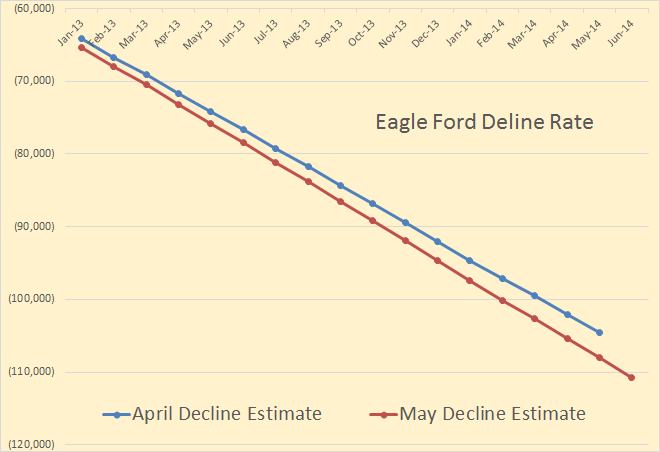
In June they are expecting all existing fields to decline by almost 111,000 barrels per day. That is the amount of new oil they must bring on line just to stay even. They do expect to bring that much on line plus 26,000 bp/d.
I have plotted the change in barrels per day per month. For instance December 2013 Eagle Ford production was up 29,707 barrels per day. The last four months, through June, are the EIA’s estimate.
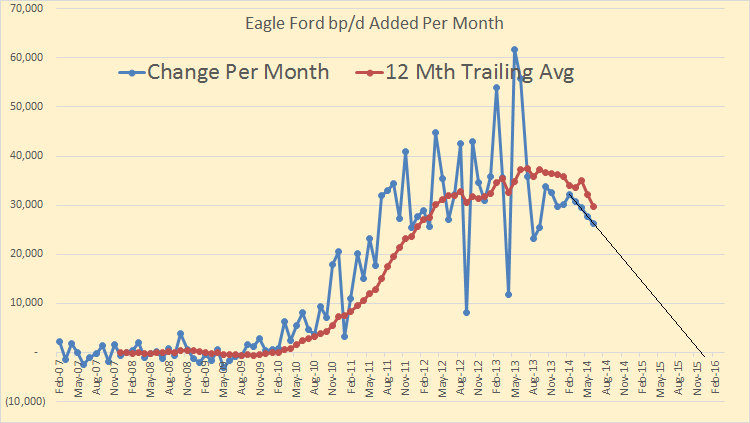
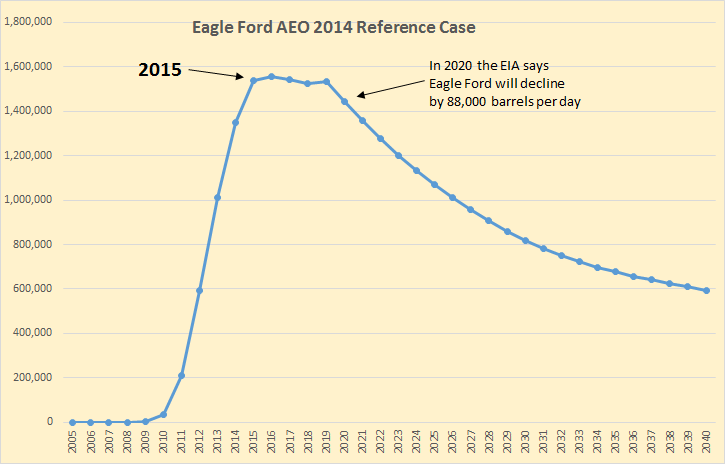
Looks like they are expecting Eagle Ford to peak around the end of 2015. Matches up with what they predicted in AEO 2014.
The North Dakota data just came out a few minutes ago. We go for weeks with no data then it all floods in at the same time.
I will have a post on North Dakota and the Bakken tomorrow.
22 responses to “OPEC Update with April MOMR Data Plus Eagle Ford”
Very interesting! Look forward to the North Dakota graphs
+26K bpd Bakken in March.
Not quite. 25,091 for the Bakken, 24,006 for all North Dakota. That means that North Dakota production outside the Bakken was down just over 1,000 barrels per day in March.
All North Dakota production is still 538 barrels per day November 2013 production numbers.
I will have a post tomorrow on the Bakken and North Dakota production numbers.
Ron:
Not trying to steal your thunder, but Bakken is really slowing:
North Dakota reports March output – Growth slowing dramatically:
March 2013 vs. March 2012
b/d YOY % change YOY
426,468 118.4%
March 2014 vs. March 2013
b/d YOY % change YOY
190,400 24.2%
Despite all the increase in technology and cost, the data keeps indicating a plateau period of oil production. What would interesting to know is how much EOR is being used to maintain this production. With crude prices fairly well stalled, the EOR and fracking must be eating the bottom out of OPEC’s margins. Add to that increased internal demand, and the total take is falling. This has been enough to push the Saudi’s to alternate energy sources for electricity production (solar and natural gas vs. oil).
http://dddusmma.wordpress.com/2013/10/01/saudi-arabias-changing-oil-equation/
Has anybody here seen anything on any of the major business sites or in major paper business sections that honestly reports the decline rates of tight oil ?
That honestly covers the expected near term peaking of the Eagle Ford per the EIA?
No OFM, haven’t seen any. No one mentions decline, ever. Especially CNN. I have sent them emails over and over but they probably just think I am a crackpot by now.
I am amazed to see the same old oil independence theme. The crazy thing is, it wouldn’t matter, anyway. Canada is basically production independent and could substitute imports with redistribution and refinery changes. It could be done. But if we were to do that we would be invaded or ‘sanctioned’, whatever holding your breath and threats are called these days. We pay pretty much world prices and certainly higher than US prices regardless of reserves. It is a planet-wide dilemma.
It matters not what individual regions manage to hold on to beyond regional economics. LTO is keeping the total production levels up, but individual declines will set off Egypt-type unrest or Yemen decline and failure. We can expect Nigeria to disintegrate more rapidly. Prices will rise until economies crash and then we will all be hurting. NA might be able to limp along with oil sands and LTO, strippers, and efficiencies. But this amazing ride is almost over, isn’t it?
Yesterday I had a friend come over with his Case extend-a-hoe. We pounded in 20 8′ posts, dug up 10 6′ blue spruce, transported them and replaced an elk ravaged hedge (they won’t eat spruce), and cleaned up some crap at our wood lot. Total bill….$125 cash. I gave him $140. This would have taken me 3-4 weeks of bull work to do it by hand. As I said to my brother, “God bless diesel powered hydraulics”.
I am getting as much stuff done these days as I can think of; fencing, orchards, new garden areas, wood organized, etc.
Paulo
Keep the pedal to the metal. Even if things don’t go to hell as soon as they might you will be glad you of whatever you can get done now later on.IF you ran that hoe all day your friend did you a four or five hundred dollar favor- nothing to sneeze at.
Hedges are edible -but so are elk.;-)
We don’t have anything bigger than whitetail deer here other than an occasional black bear. I enjoy a little wild venison from time to time.
White tail is about the only meat some of my neighbors eat these days for reasons of economy.
Deer are pretty to look at but in my area they are pest on the same order as rats except they are too big to get inside and they are much cleaner in their habits.
But sooner or later the economy is going to really go down hill- and when it does the deer will all be hunted out in a year or two.Maybe even less time than that.
21.73 kbpd of that Bakken gain came from one county (McKenzie.)
Texas Oil Boom More Sustainable than Prior Cycles
Local citizens in the Eagle Ford region, the Permian Basin of West Texas, and other significant shale plays around the country naturally worry about when the next “bust” will come, which is not an unreasonable concern to have. After all, conventional oil and gas booms in previous decades have almost always eventually wound down into a bust at some level. But there are many reasons to believe that the shale boom will be different, and the Eagle Ford play provides a very good example why.…
The differences between today’s situation and that of prior booms are many. Start with the fact that previous booms, like the oil boom of the early 1980s, came about due to high oil prices driven by restrictions in supply. The restrictions in the 1980s were artificially driven by OPEC, and prior booms came about simply due to a failure by the global industry to identify adequate new resources. In every case, you had rising demand and limited supplies to meet it.
Today’s boom in the United States is different in that we now have rapidly rising domestic supplies meeting rising demand (although domestic demand for some fuels, like gasoline, has actually leveled out in recent years). Where in the past the United States was forced to rely more and more heavily on imports from OPEC countries, today’s shale boom is enabling our country to actually lower its imports on a daily basis, with our imports having been cut almost in half since 2007. In the meantime, rapidly rising demand in China, Japan, India and the rest of the Pacific Rim is filling the void in U.S. imports, consuming all the oil the OPEC countries and Russia can produce. This all ensures the price of oil will remain healthy enough for the U.S. drilling boom to continue, even as the United States continues its path toward energy security, rather than away from it.
Unlike all the plays that in the past peaked, and then declined, the EagleFord will be different?
Aws,
Yeah… just like the Fed, the shale companies are going to print more wells and barrels of oil.
Utilizing the Fed’s business model, the shale players can increase production forever.
Steve
LOL
Crude oil production from the North Slope of Alaska increased by about 2 mbpd from (essentially zero around 1978) to 1988, and the annual net decline rate since then has been about 6%/year. Of course, this primarily reflects the decline of the largest US conventional oil field, Prudhoe Bay. But fundamentally, North Slope production peaked because production from new wells could no longer offset the declines from existing wells. In other words, Peaks Happen–except on Fantasy Island.
North Slope production:
http://www.eia.gov/dnav/pet/hist/LeafHandler.ashx?n=pet&s=manfpak1&f=a
It’s interesting to see what happens to production from tight/shale plays, when we just see a slowdown in drilling. For example, the simple percentage net decline in Louisiana’s marketed natural gas production from 2012 to 2013 was 20% in only one year, which presumably reflects a slowdown in drilling in shale gas plays (the gross decline rate from existing wells would be even higher). As I have noted, Citi Research puts the gross underlying decline rate for US natural gas production at about 24%/year.
In any case, the conventional wisdom is that the rebound in US oil and gas production, built on very high decline rate tight/shale plays (far higher than the North Slope), will result in an indefinite rate of increase in US oil & gas production.
Jeffrey: It is great to see you posting here. It is a testament how useful and important Ron’site is to peak oil students. It would be nice to see Art Berman posting here more often.
Ron: I just wish you had a separate site for global warming dba as climate change. My mind is thoroughly informed on the subject from various sources. My interest is in peak oil.
Hi Coolreit,
For some people the issues are intertwined, you should just ignore comments on climate change that you don’t agree with or you are welcome to convince others of your views if you wish.
If you want a site that agrees with your views on climate change you can visit Euan Mearns blog. Otherwise it is Ron’s blog and he allows discussion on a wide range of subjects related to energy. Most of it like it that way. As far as I can tell, he does very little moderation except when people are abusive and particularly rude (he does not appreciate ad hominem type arguments), and again I think he does that just right as well.
Jeff,
When do plan on updating 2013 ANE & GNE figures and charts?
Steve
Usually the consumption data don’t come out until June, and there are usually some material revisions to the consumption data, so I am shooting for this fall some time, before we do any updated charts.
I don’t expect to see any major changes. Probably GNE remained somewhat below the 2005 rate, and I suspect that ANE fell from the 2012 rate of 35 mbpd (versus 41 mbpd in 2005).
Actual and forecast North Slope crude oil chart:
http://energytomorrow.org/blog/2012/june/~/media/EnergyTomorrow/blog/Annual_North_Slope_Production_and_Contribution_of_Fieldsjpg.ashx
Note that the projection was too optimistic. Actual 2013 production was 0.50 mbpd.
It looks like the 1978 to 1988 rate of increase in North Slope crude oil production, from about 0.50 mbpd to 2.0 mbpd, was about 14%/year.
At this rate of increase, North Slope crude oil production would have been at about 8 mbpd in 1998, and at 33 mbpd in 2008 (when total US crude oil production, or more accurately C+C production) was 5 mbpd. And then to finish the What/If scenario, in 2018 North Slope production would have been at about 133 mbpd, at a 14%/year rate of increase from 1988.
But of course, this kind of extrapolation is what most people are doing in regard to the tight/shale plays.
It’s different this time!
Hallelujah!
http://www.cga.ca/wp-content/uploads/2011/02/Chart-1-Natural-Gas-Storage34.pdf