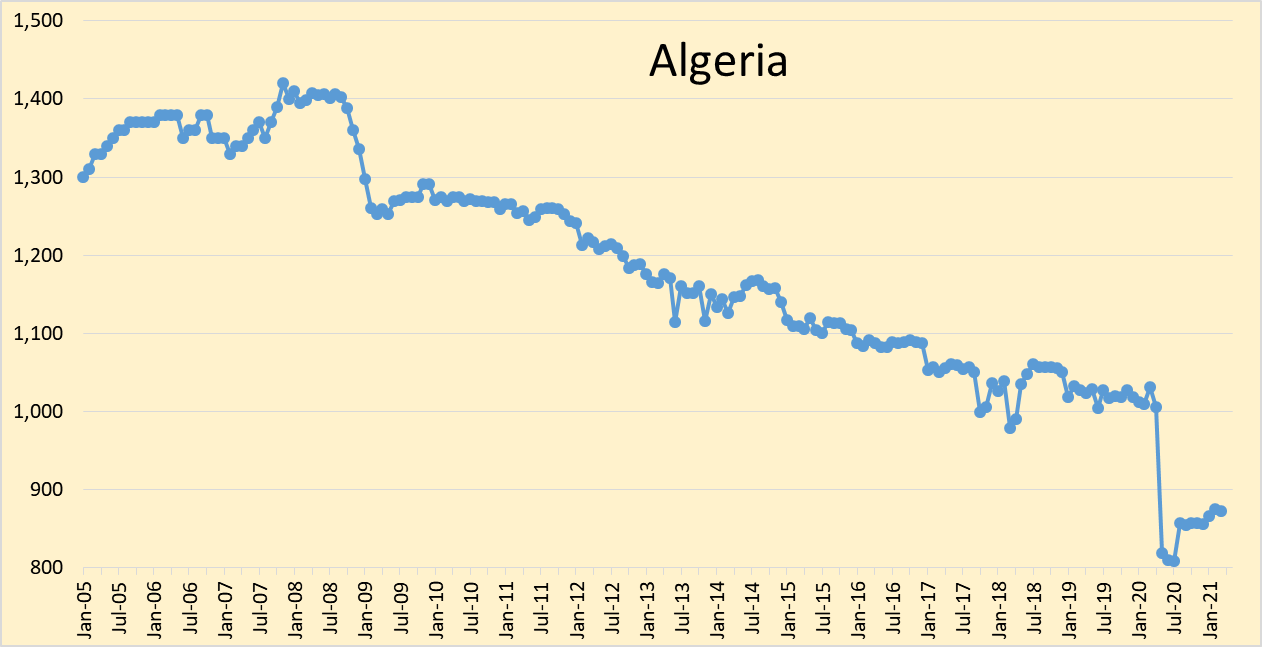
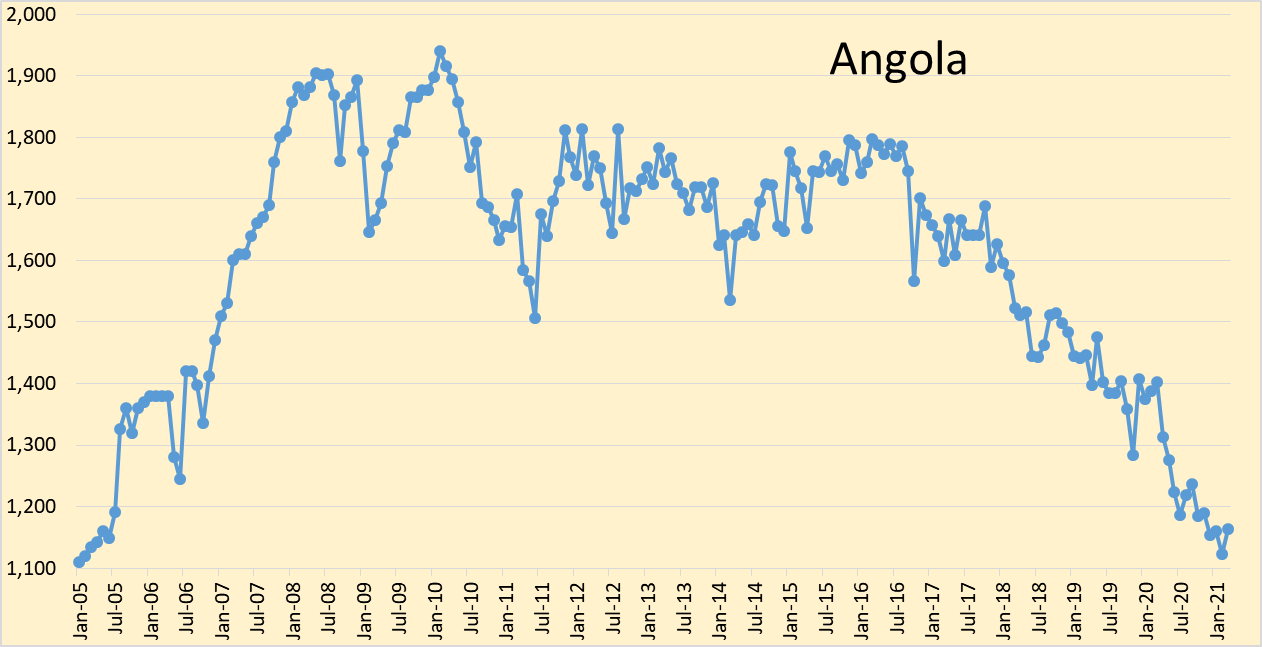
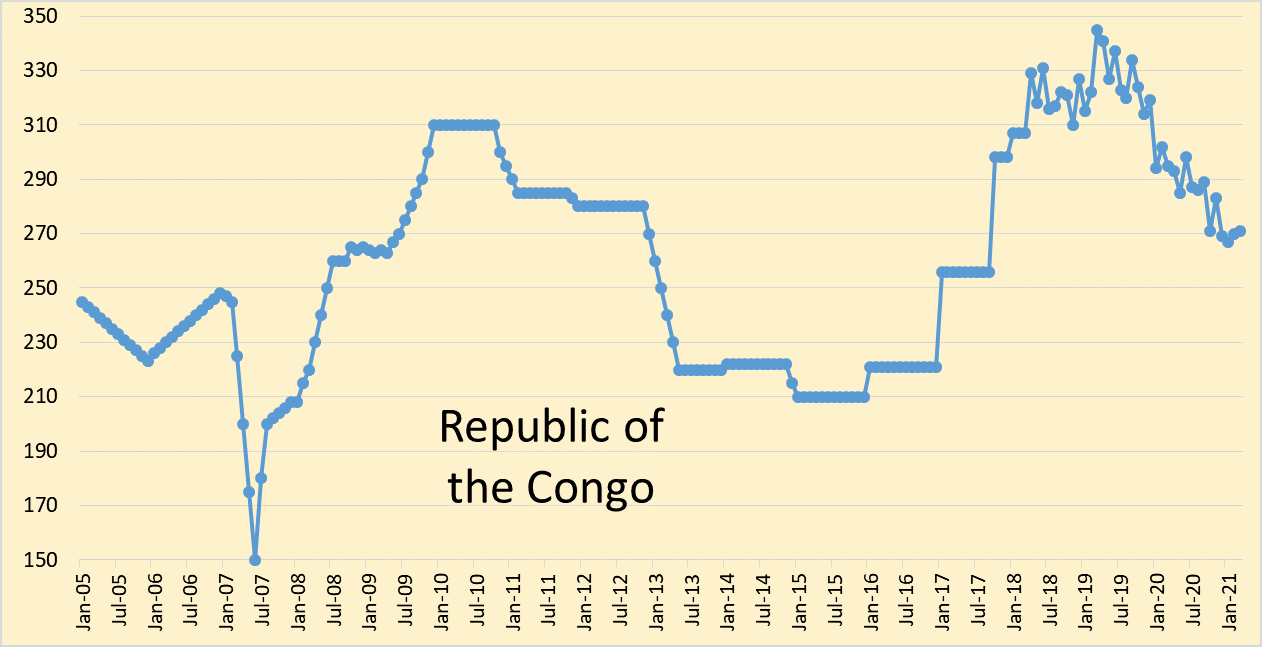
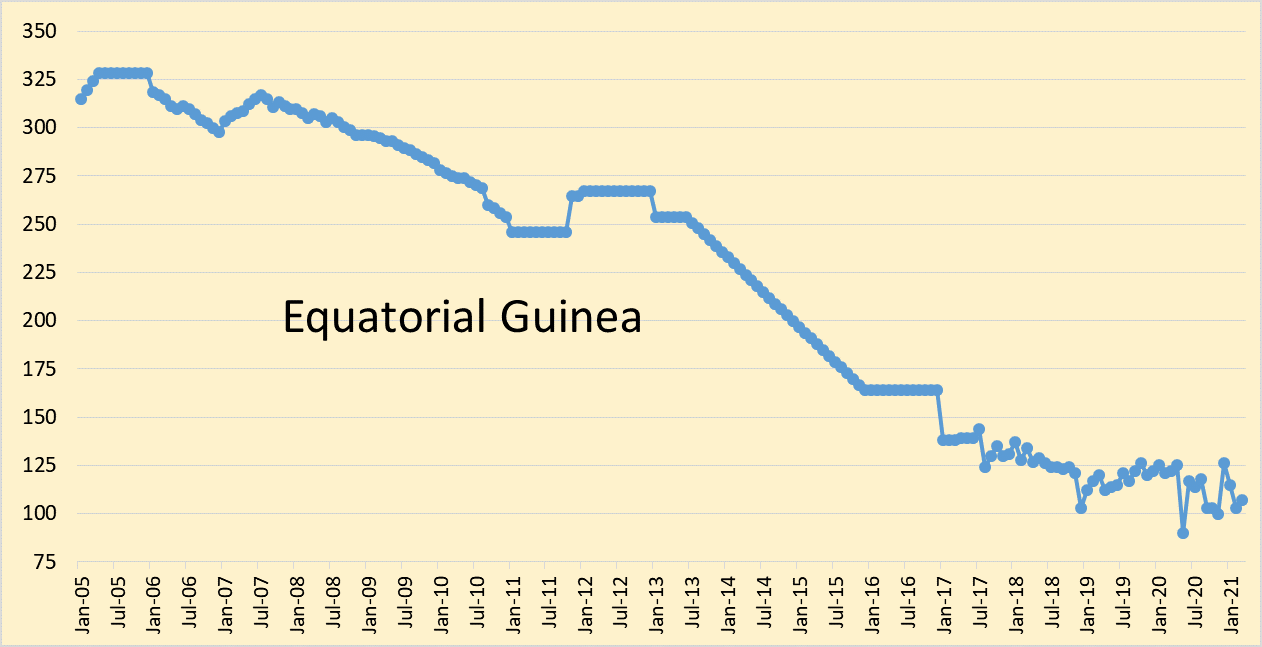
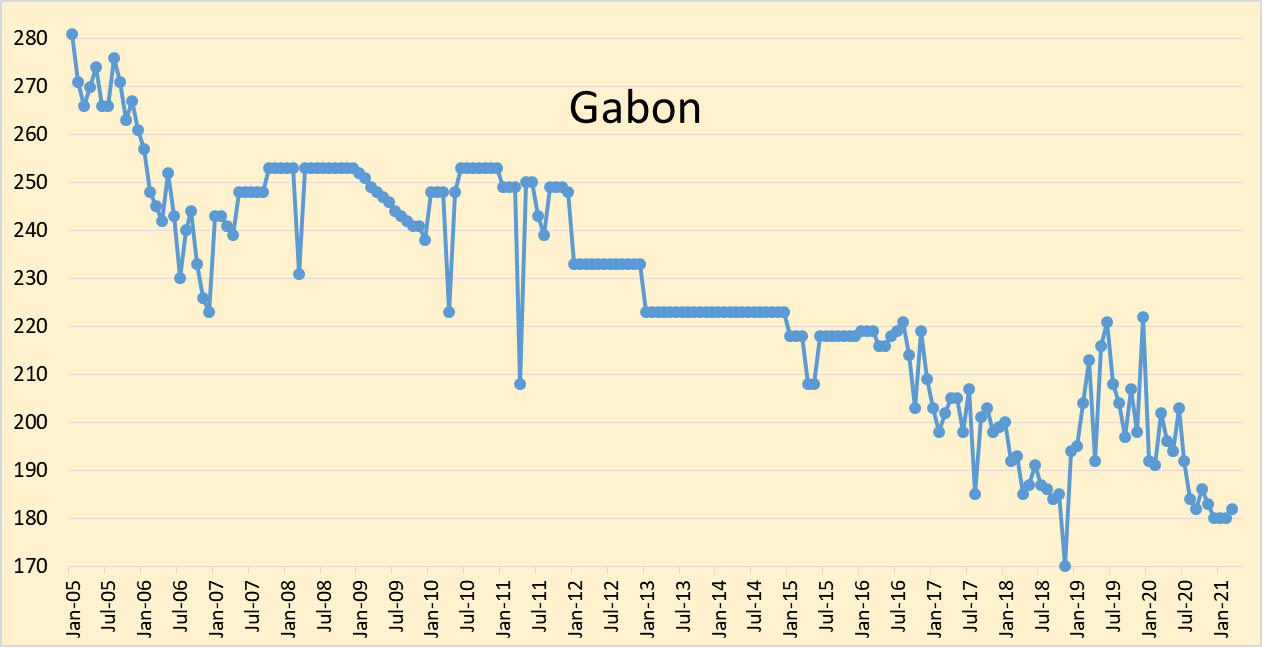
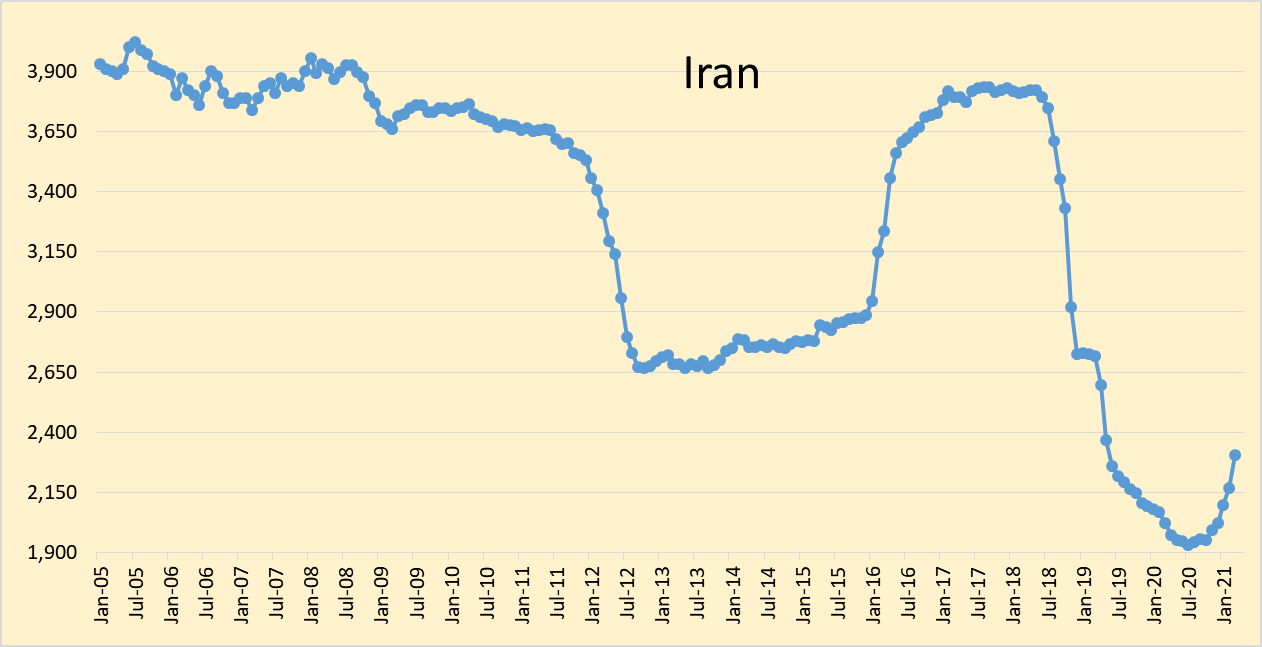
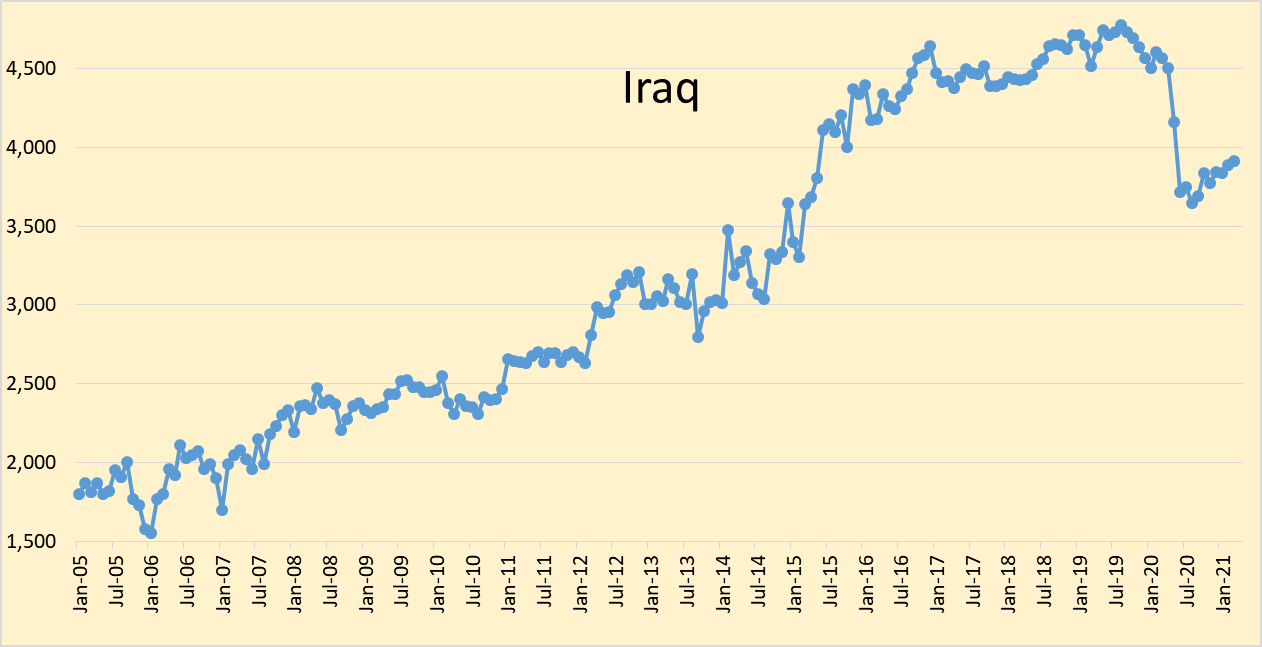
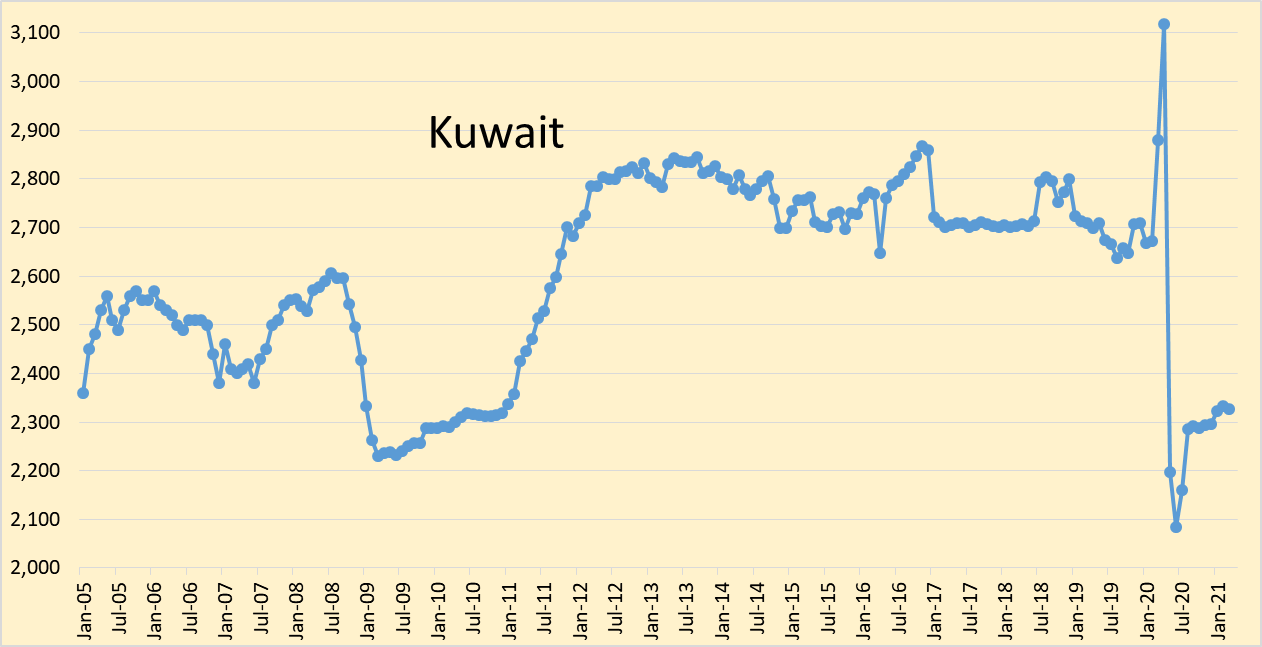
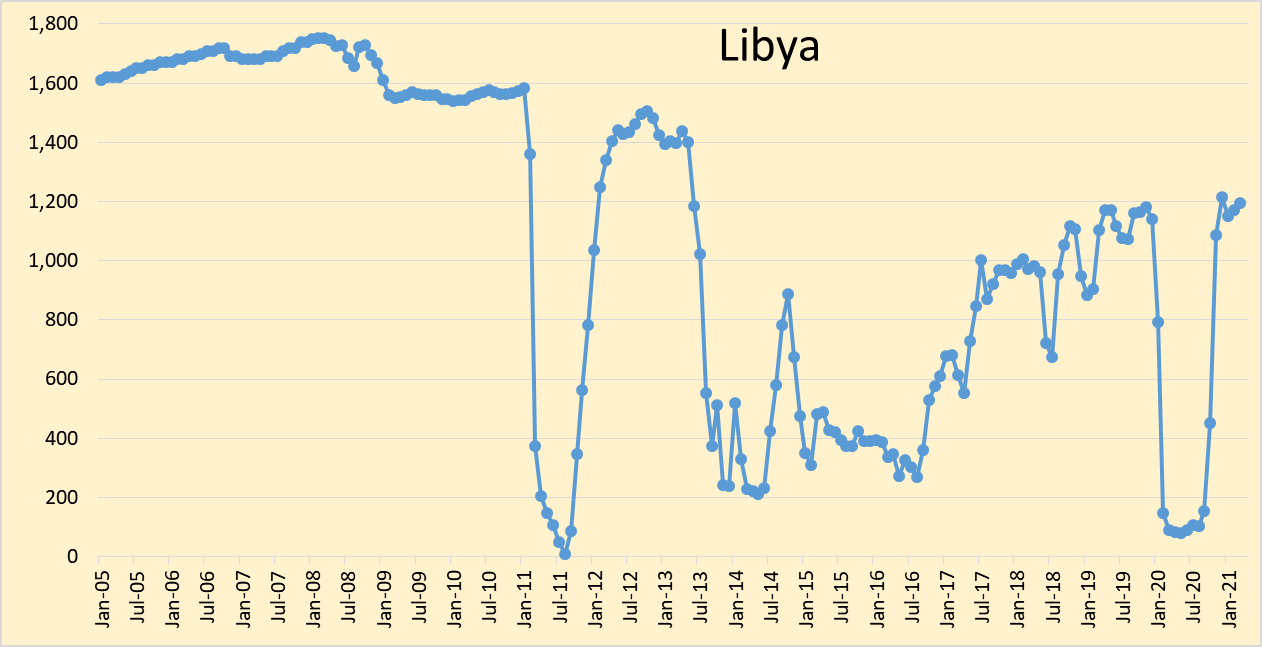
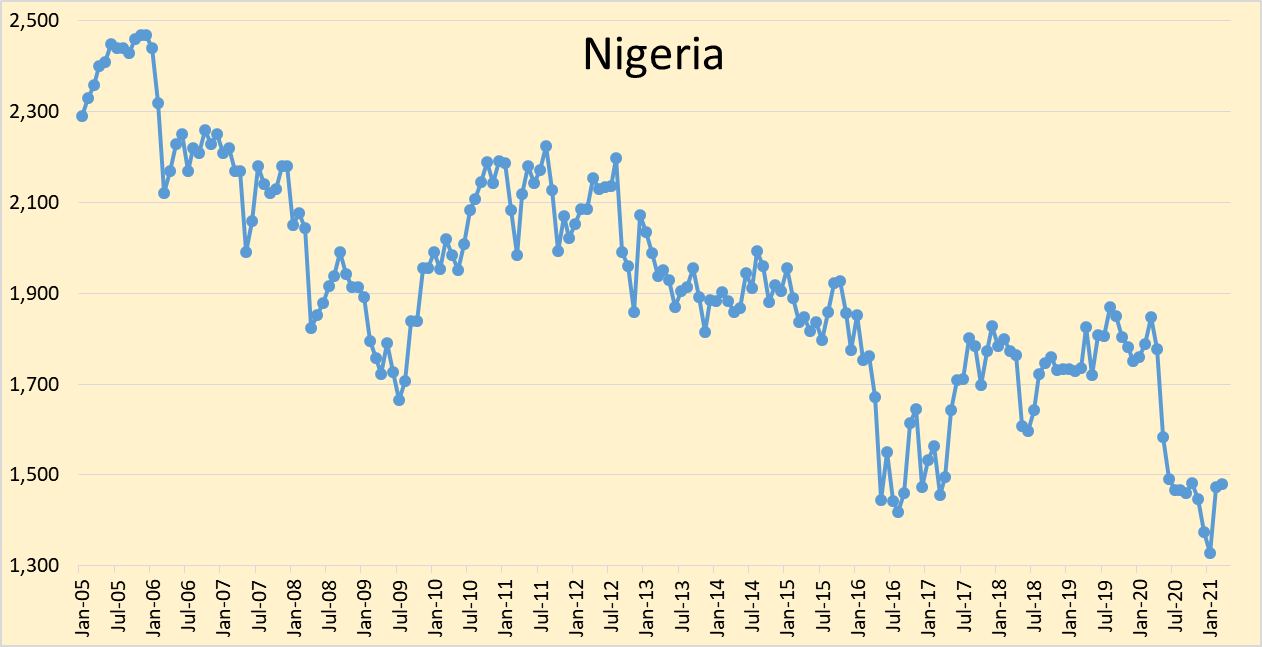
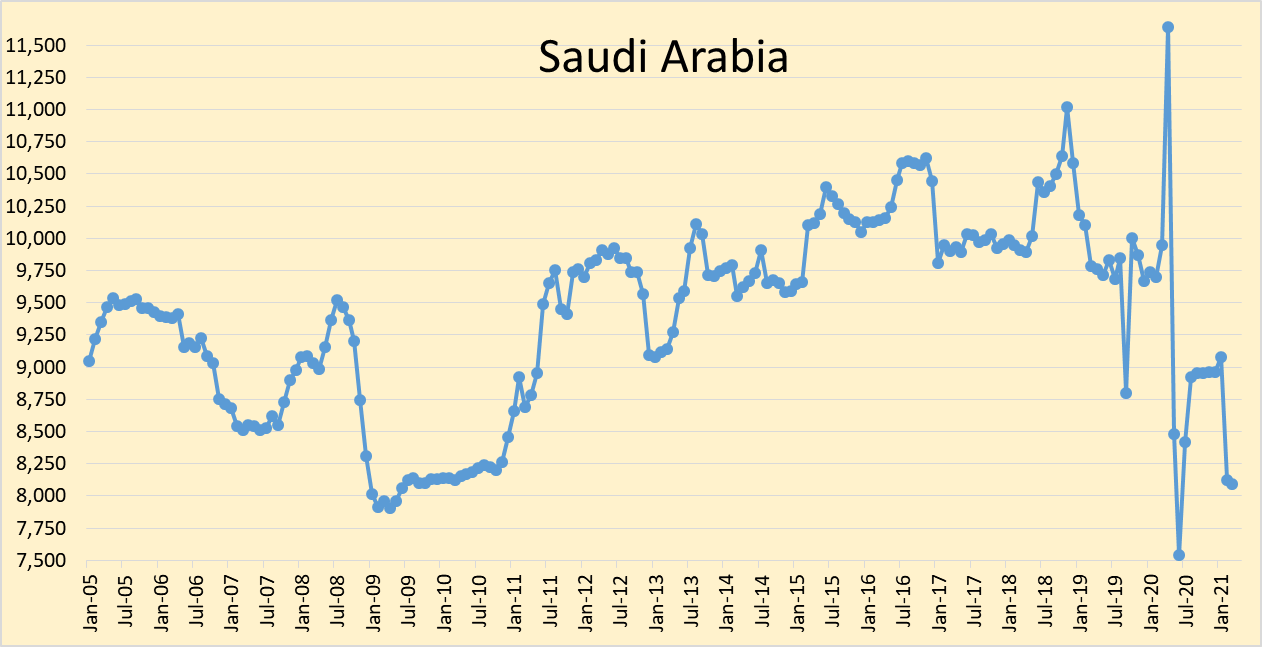
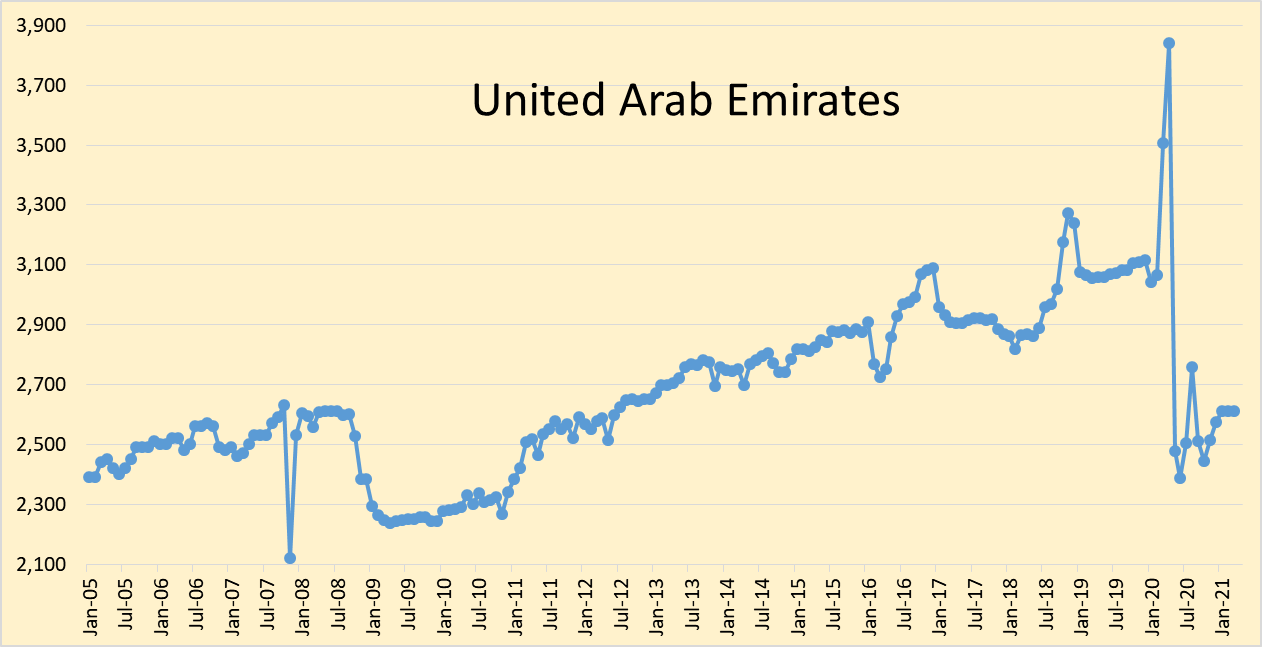
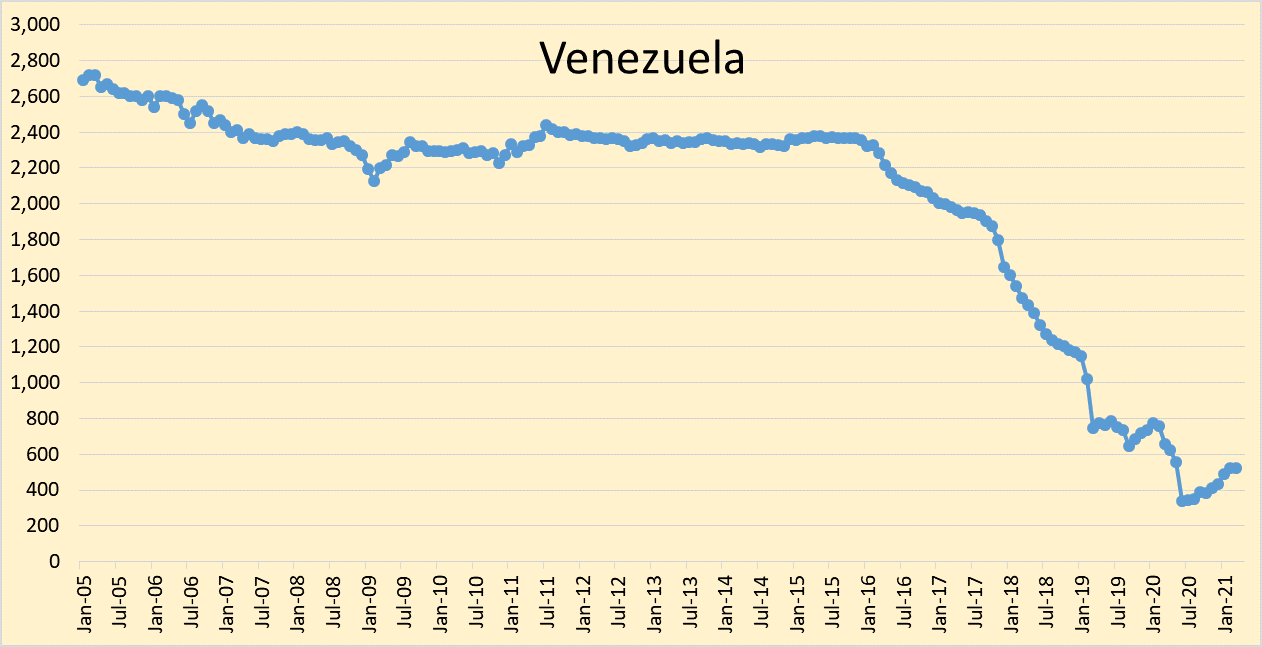
The OPEC Monthly Oil Market Report for April 2021 was published this past week. The last month reported in each of the charts that follow is March 2021 and output reported for OPEC nations is crude oil output in thousands of barrels per day (kb/d).
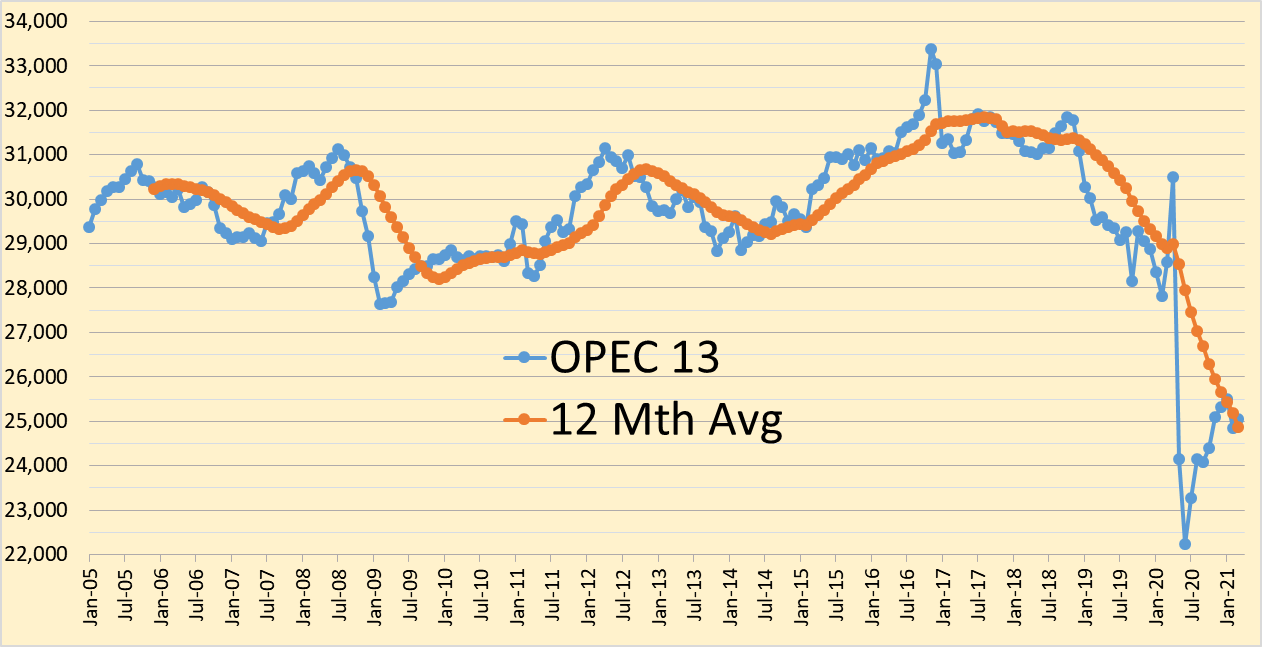
OPEC 12 month trailing average crude output was 24881 kb/d in March 2021.
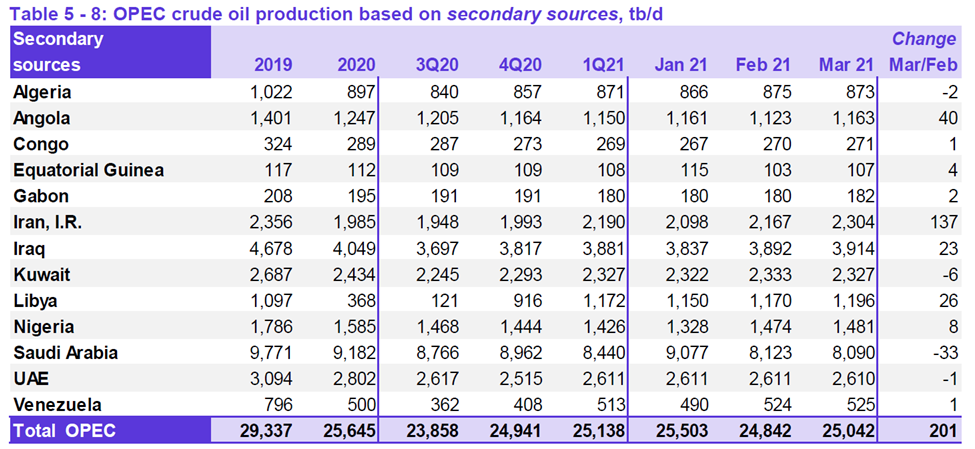
Only a small revision in OPEC output from last month’s February estimate (-6 kb/d), OPEC output was up by 201 kb/d in March. Most of the March increase in output was from Iran (+137 kb/d).
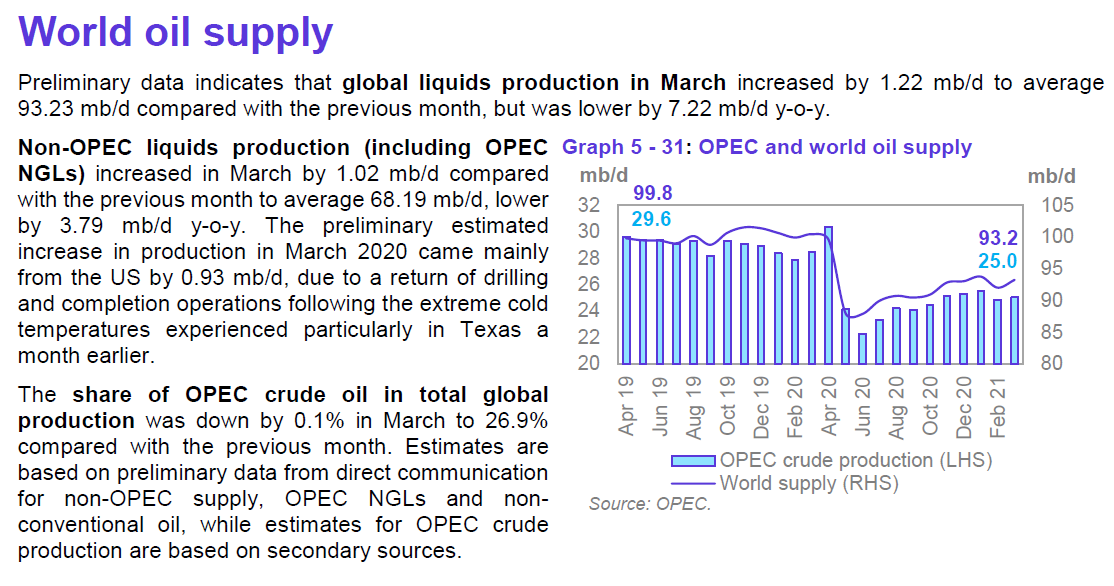
World liquids output decreased about 6.6% in March 2021 from 12 months earlier.
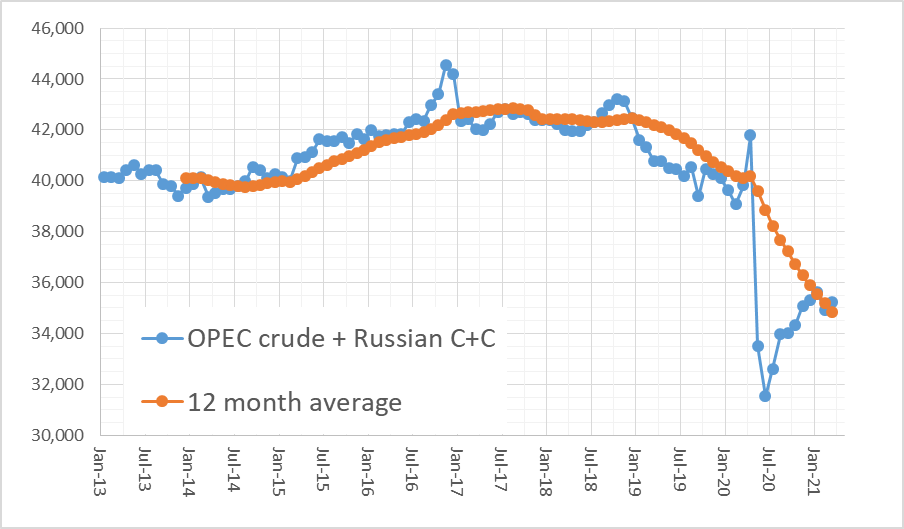
The chart above uses data from the Russian Energy Ministry and converts from metric tonnes to barrels at 7.3 barrels per tonne, the combination is OPEC crude plus Russian C+C output. Russian output increased by 135 kb/d in March 2021 to 10207 kb/d, OPEC13 crude + Russian C+C output increased by 335 kb/d in March 2021 to 35249 kb/d. The trailing 12 month average OPEC crude plus Russian C+C output in March 2021 was 34832 kb/d a decrease of 382 kb/d from the February 2021 level.
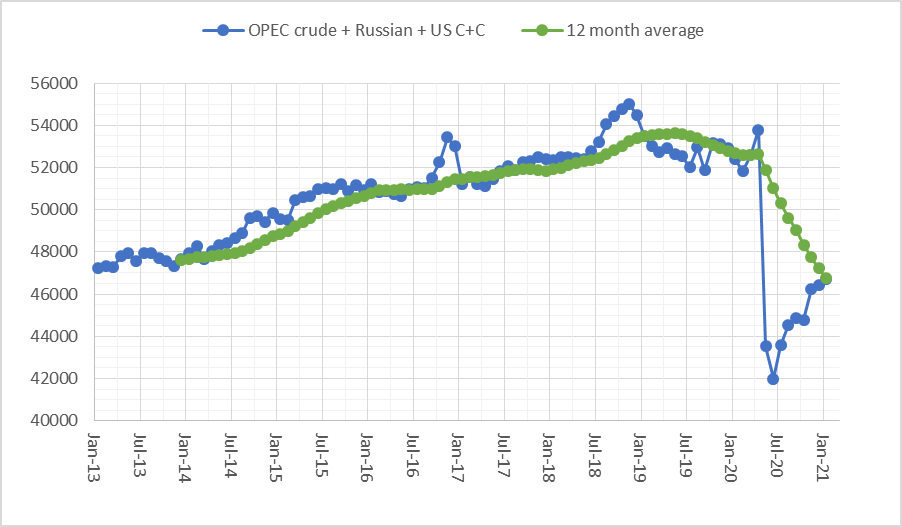
The chart above looks at OPEC crude plus Russian and US C+C output. The peak for the trailing 12 month average was May 2019 at 53624 kb/d, in January 2021 (last data point for US output) the trailing 12 month average output for this group of 15 nations was 46741 kb/d, down 6883 kb/d from the peak. Note that 4845 kb/d of the 6883 drop was from OPEC and Russia and 2038 kb/d was from the US (May 2019 peak to Jan 2021 trailing 12 month average). I contend that these 15 nations are likely to return to the peak level of May 2019 by December 2025, the declining of other nations is likely to be offset by rising output from Canada, Brazil, and Norway, so I expect the World may hit a new peak in the future.
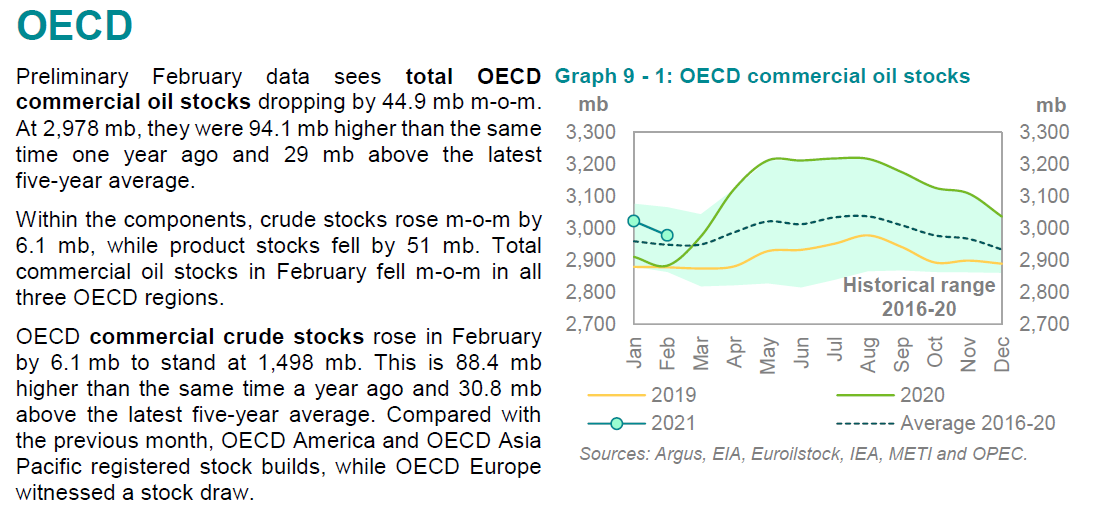
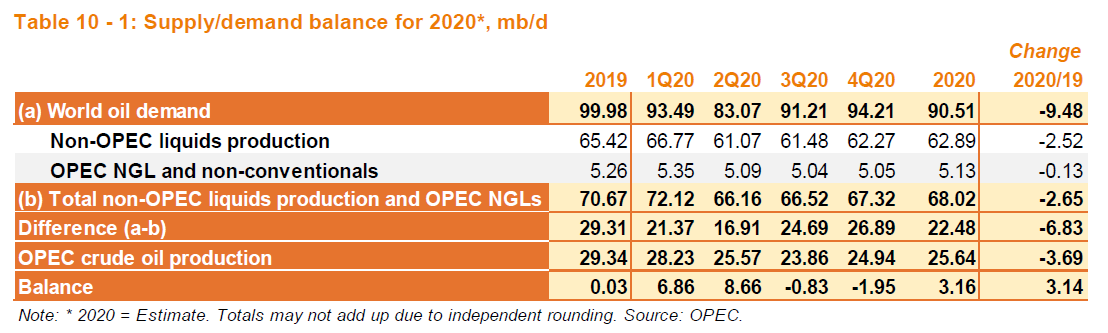
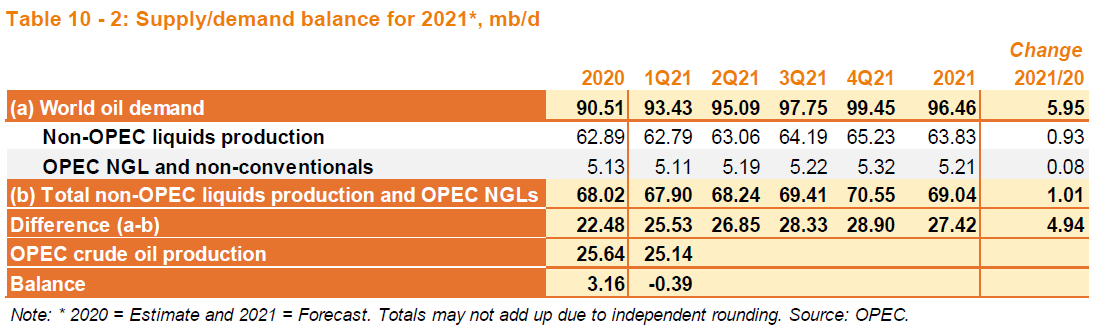
Recent OECD commercial oil stocks were 29000 kbo above the 5 year average (see figure 18 above). OPEC crude output for March was about 25,000 kb/d. OPEC estimates demand for OPEC crude in the second quarter of 2021 will average about 26850 kb/d. If the OPEC demand estimate for OPEC crude is correct and OECD oil stocks roughly reflect the level of World oil stocks, then continued OPEC output at 25,000 kb/d in the second quarter of 2021 would lead to a stock draw of 1850 kb/d during the second quarter of 2021. The total stock draw would be about 166,500 kb (1850 kb/d times 90 days) and at the end of the second quarter OECD oil stocks would be 137,500 kb below the 5 year average. This would likely lead to higher oil prices, though I expect OPEC will raise output quotas within a few months (perhaps April or May). Brent reaching $75 to $85/bo seems likely if the OECD oil stock levels fall well below the 5 year average.
Thanks, Dennis.
Greenbub,
You’re welcome. Sorry it is a bit late, I was aiming for Friday, but I am not as good as Ron (he would have had it posted 3 days ago).
Dennis,
Many of us appreciate your work and I very much appreciate your cool headed thoughts.
Thanks Schinzy,
I am happy you share your perspective. Though it may not seem so, I share your distaste for neoclassical economics, I was a graduate student in economics at UMass-Amherst.
Dennis-
Did you mention that you had Richard Wolff as a prof ? (or am I just using creative memory)
That would of been interesting.
https://www.rt.com/shows/on-contact/520622-american-economic-illusion-projects/
HT, I have been following Richard Wolff from several years . Always interesting to have someone who is not ” all is tops ” in comparison to Krugman and company . Another one I like is Dr Michael Hudson . No nonsense .
Yes I had a few classes with Professor Wolff and the man he wrote a few books and papers with Stephen Resnick.
https://en.wikipedia.org/wiki/Stephen_Resnick
Cool!
We invited Wolff to an event (out of the blue) and he attended, and gave a great talk.
(Marin Peace and Justice)).
I have a great respect for many things economists do. I learn a great deal from economists. But even the economists are starting turn away from equilibrium theory. If you notice prizes in honor of Alfred Nobel in economics are going more and more to empiricists and less to theorists.
I thought a bit about Iron Mike’s comment in the last thread. I agree with him that economics is not a science. Eco means the home. The remainder of the word economics signifies the art or management of. So the economist studies how to design the economy for positive outcomes in the home. However science can be used in the art or management of the home. Just as a basic knowledge of physics helps the architect in her designs, knowledge of sociology, mathematics, and even well technology can help the economist in her task.
Schinzy,
I imagine economists use equilibrium as a simplifying assumption. The system never reaches an equilibrium, it is constantly changing, moving towards some new equilibrium that is never reached. Certainly the system is dynamic, but at the introductory level it is easier to envision a system at rest than in constant motion. Physics is taught in much the same way at an introductory level.
Agreed
Dennis.
Thanks for the post. Always look forward to these and glad you have maintained them after Ron was unable to continue with them.
They do get picked up by several other websites and republished.
Shallow sand,
Thanks. I do my best and appreciate that you continue to participate in the discussion.
“The peak for the trailing 12 month average [of USA+OPEC+Russia C+C production] was May 2019 at 53624 kb/d”
Dennis, the 12-month curve seems to be lagging empiric data. This could be due to the way you calculate the mean (not being centered). Therefore, there is a shift of six months: peak is December 2018. Which corresponds to the world’s historical peak (so far).
Also, I would like to thank you and other people from this website. From a European (French) perspective, it is always interesting to get your insight.
Ganesa,
Thanks. The European viewpoint is equally interesting for those of us us across the pond.
Yes I show the trailing 12 month average to be consistent with the previous presentations by Ron Patterson, the centered average makes more sense to me as it does not have the 6 month lag of the trailing 12 month average, so peak dates that I gave should be moved back by 6 months (so the May 2019 date would be November 2018 and coincides pretty closely with the centered 12 month peak in World C+C output.)
I also wanted to share a news coming from Russia :
https://www.kommersant.ru/doc/4763122?stamp=637540340408712315
The Russian ministry of Energy just released a study that forecasts domestic production should never reach its 2019 level ever again.
The fact that they were close to peak production has been known for several years. Abut 75 percent of their production comes from 5 aging fields. they have been using horizontal wells to cream them.
The link gives several scenarios some of which suggest a later peak in 2025 to 2030. Much will depend on tax policy and prices along with geology. I think a plateau at 11 Mbpd from 2023 to 2029 is likely followed by decline.
Dennis, that scenario is virtually impossible. Russia’s five largest fields, 60% of Russia’s oil production, is in hard decline. For your scenario to be true, massive new finds would have to happen in Eastern Siberia. This does not seem to be forthcoming.
This article was published in September 2009: Alex Burgansky: Russian Oil and Gas Industry Surprises Analysts
There are plenty of projects in Russia, both, new projects and existing brownfield projects. Russia is a very mature producer. If you exclude all the drilling activity taking place every year, then Russian organic decline in production is close to 19%. To compensate for that organic decline, Russia drills somewhere between 5,000 and 6,000 wells every year.
In 2009 they were drilling 5 to 6 thousand wells every year. Most of those were infill drilled wells in Western Siberia. In the eleven and one-half years since that article was published, they have sucked those five old supergiants almost dry. New tax breaks would not help.
To suggest that those tired old supergiant fields will hold a plateau until 2030 is totally beyond the pale. They are already in steep decline despite that very massive infill drilling program. So you must believe Eastern Siberian fields will make up for the massive decline expected in Western Siberia. Vankor, Eastern Siberia’s largest field, and greatest hope has already peaked at just under half a million barrels per day. Eastern Siberian production can in no way make up for the massive decline in Western Siberia.
So Dennis, your 2025 to 2030 Russian peak goes against the prediction of every Russian oil prognosticator out there. I have searched the net and not one is so optimistic. So how do you justify such a prediction? Where will the oil come from?
Many thanks to all of you for your many and great work and your estimations. Only thanks to these services it is possible to make predictions about the peak.
According to our estimation, the world could slowly run out of energy from 2025 onwards. What do you think, what is your estimation?
Best regards from Switzerland.
I agree though it will be hard to tell as demand is likely to fall as the Covid pandemic plays havoc with world oil demand. I believe the peak was in 2018. That was a supply peak, not a demand peak. But demand is likely to fall in the next two or three years due almost entirely to the pandemic. EVs will have a small impact also.
Mike , I am of the same view point . 2025 is the tipping point , If we don’t run into shortage of oil we will definitely run head on into ” Oil available for Export ” or ELM as West Texas calls it . Beste .
From the same article (Kommersant):
“The two scenarios – favorable and moderately favorable – are just based on the size of the reserves according to the project documentation (without taking into account the inventory). “Favorable” scenario assumes that after 2024 the fields will be widely switched from the current fiscal system to the tax on additional income (TAA).
[…]
Accordingly, the inertial scenario, which is considered the most likely scenario, assumes a more conservative estimate of reserves. It is calculated based on the results of the inventory, which was conducted in 2019-2020. According to its results, from 36% to 64% of the recoverable reserves of Russian fields are considered profitable, depending on the macroeconomic scenario.
This is all the more important in Europe since we have 30% of our oil coming from Russia.
Ganesa,
Often best guess scenarios can be wrong. I think the Russians tend to be pretty conservative in their estimates, so unlike the US EIA (which tends to overestimate future output) a best guess by Russian researchers may prove to be on the low side.
Dennis, it is not the Russians who are saying they are headed for a swift decline. It is all the outside analysts who are saying that. The Russian Minister of Energy is saying they will plateau until the end of the decade. It is everyone else who is saying that is total bullshit. The Oxford Institute for Energy Studies is saying Russia will be down to about 8.5 million barrels per day by 2030.
It is everyone except the Russians who say that Russia has peaked and is headed for a swift decline. Russia, well, at least the Minister of Energy, is saying, yes, we have peaked but will remain on this flat plateau for another 8 or 9 years.
Ron,
Use google translate to read Russian Article. The report was done for the Russian oil ministry. The Oxford paper was from 2015, these studies are often incorrect. I am suggesting Russian output may return to the 2019 average output level by 2023 and may remain at that level for 5 to 7 years and then decline. We will see.
Dennis , Opritive Alexander has provided a lot of updated information in the last post on the Russian situation , current and future . All indicated that there will be no future growth . I atleast have not seen better on the Russian situation since this blog began . No reason to discount his update .
hole in head,
Maybe the study has new information, OA would need to comment.
I think he meant we won’t see output higher than the 2019 level, that is consistent with the Oxford study and what I am guessing. Russia may return to previous peak, remain on plateau for a few years and then decline. The lack of demand did not diminish the oil in the ground, if prices rise so that it is profitable to produce, it will be produced.
Russia having passed its peak in 2019 is also forecasted by Rystad as was pointed out in a report published last year :
https://theshiftproject.org/wp-content/uploads/2020/06/%C3%89tude_D%C3%A9clin-de-lapprovisionnement-de-lUE-en-p%C3%A9trole-dici-2030_TSP.pdf
See graphs on page 22
Rystad does not believe Eastern Siberia can bridge the gap of Western Siberia and Volga-Ural. In fact they are even more pessimistic than scenarios released by the Russian administration.
GANESA, I would love to read this article. Unfortunately, it is in Russian or some other language. And the “translate to English” button does not work. Is there another path to read this article?
@Dennis and Ron,
Ganesa put a link to a report by The Shift Project (https://theshiftproject.org/) which is a French think tank advocating a shift away from fossil fuels. The report was made by paying Rystad for access to their UCube database. The main point of the report is that according to pre-pandemic Rystad forecasts, Europe’s current suppliers of crude and condensate will be down by between 1% and 8% by 2030. Furthermore you can see from the graphs (which are in English) that Rystad’s forecasts see LTO continuing its pre-pandemic growth trajectory which the report says could be wrong.
Ron,
I just used Deepl.com to translate the article, it is really efficient.
Please return me the favor: I did not manage to find out how to attach pictures to illustrate my previous comments. Can you explain how Easy files is supposed to be used?
Thanks!
Ganesa , tks for the Deepl .com link . A question : Are you of Indian origin ? Ganesa is a Hindu god often picturized as an elephant head on a human body ,supposedly an omen of an auspicious event or happening . Just curious . You are at liberty not to answer , no offense will be taken .
Images must be small to be attached. 50 KB if memory serves me correctly. There are apps that reduce the size of images.
Ganesa, I don’t know what Easy files are so I cannot tell you how they are supposed to be used.
You can attach a picture or graph from your “pictures file”. It will have a better chance of working if it is a GIF file as those use the smallest amount of data. Also don’t use a lot of colors as this adds to the size of the file.
@Hole in head
I am French, and not Hindu. In fact this pseudo dates back to a comics story drawn during my teenage years. In a way it is a it like Olrik, the famous evil character from Black & Mortimer. Edgar P. Jacobs had a strange relationship with the person who inspired this character and put some of his own personality into this bad guy. For instance, Olrik’s face is Jacob’s autoportrait.
Thank you for the advices to attach pictures!
Ganesa , thanks for your response . Merci .
Dennis et al.
So I’ve done some plots which might be of interest to the people of this blog. Most of the relationships are probably known by the majority of people posting or reading on here.
For people that are unfamiliar, R^2 is basically a correlation coefficient which tells us whether two independent datasets have correlation or not. The crucial point is, just because two datasets might have a high correlation coefficient doesn’t necessarily mean that they are correlated. Further real world qualitative testing must be done to determine actual correlation. But for these datasets the qualitative correlation is, I would argue already determined. So we can be quite confident these datasets are correlated qualitatively. This is more of a quantitative test to see how much they statistically correlate.
So the first one is the plot of GHG emissions (CO2 and CH4 only) and World oil consumption/production. We have an extremely strong R^2 value for both consumption and production with GHG emissions.
We can also see (assuming accurate data) that oil consumption has overtaken production for quite a while which if accurate is interesting.
The next one is regarding World nominal GDP and GHG emissions. There is an extremely strong correlation here. Hence my belief nothing will be done to mitigate GHG emissions.
GDP is an interesting one. One is not sure how much is actual growth and how much is tweaking monetary policy QE/fiscal policies/debt or asset bubbles. Which can sometimes distort real world circumstances.
You can see that starting in about 1990 that GDP has grown faster than CO2+CH4 emissions.
I’m supposing that this is due to inclusion of factors in GDP that do not require as much fuel as more traditional forms of economic activity, such as financial, legal, insurance and other computer activities. These sectors have grown rapidly since about 1980.
Nonetheless, the correlation is a useful one.. and I can’t argue (very hard) with your notion Iron Mike-
“Hence my belief nothing will be done to mitigate GHG emissions.”
The one thing that will mitigate greenhouse gas emissions is fossil fuel depletion. You can bank on it.
And I suspect that both GDP and population will follow that trend.
It would be nice to get ahead of the curve on that one voluntarily , but collectively we are a few decades late to the realization on that one.
The one thing that will mitigate greenhouse gas emissions is fossil fuel depletion. You can bank on it.
Yes i believe that is correct. I wanted to include natgas and coal in the data but I am assuming strong correlations there too. I might do it for fun later on in the week.
Note i’ve only included CH4 and CO2, I haven’t included the more potent GHG gases which are also on the rise, and might slightly change the GHG chart.
I’ve done the population vs other variables charting, but haven’t posted it yet. I might do that later on in the week.
Lastly, debt/GDP figures might also account for the faster rise in GDP. I will also look into that too later on in the week also and report my findings if anything interesting pops up in it charts and or correlations.
Good work Iron Mike. Thank you.
Hickory,
I agree. Excellent analysis by Iron Mike.
Thanks!
If you haven’t already, I’d check Dr. Tim Morgan’s blog to see that correlation. He did an update the other week that tallies everything he researched. It is indeed the case that secular stagnation has led to increasing debt for every unit of achieved growth since the turn of the century.
For these reasons, as you say, climate change and ecological collapse will not be addressed voluntarily.
Iron Mike,
GDP is a flow of money, asset values are a stock of money, they are not the same.
For example there is a difference between income and net worth, often they are correlated, but they are not the same. Real GDP is a better measure than nominal GDP as it accounts for inflation. Also the R squared for population vs oil production is shown below.
Can you tell us where your production and consumption data came from? Often consumption of “oil” includes NGL (which Ron often refers to as “bottled gas”), and other liquids including biofuels. I prefer to consider production because it is the only measure which focuses on C+C output which matches very closely with consumption of liquids for transport.
Dennis,
Wouldn’t you say if an asset is changing hands it is a part of GDP like selling->buying a house. Or buying shares off someone for a higher price etc.
I will redo again with real gdp data from the worldbank. Production and consumption data came from ourworldindata.com. So production is a better indicator. I thought maybe consumption might be a better indicator since it implies the usage of energy which would be used one would assume towards GDP? I could be wrong here.
Iron Mike,
I would need to check our world in data. They base the oil consumption on the BP statistical review see
https://www.bp.com/en/global/corporate/energy-economics/statistical-review-of-world-energy/downloads.html
This is one of the sources I use, there is also
https://www.eia.gov/international/data/world
which has excellent data on a monthly basis.
BP is better because it gives data by mass and energy, EIA uses volume, but one can choose other units at EIA such as MTOE or Joules.
Dennis,
Thanks for the link. I am new to the energy data sources so all the links you send me are invaluable.
I am still not getting the same R^2 as you for population vs oil production. I got the population data from census.gov, i will redo it using your EIA link for oil production instead of ourworldindata. Here is the chart below. Even if i take the 2020 data point out i still get ~ R^2=0.92
Iron Mike,
I did the plot from 1982 to 2019, from 1970 to 2019, I get R squared of 91% for C C production data from EIA. I use UN data for population link below
https://population.un.org/wpp/Download/Standard/Population/
I don’t think the 1970-1981 data is very useful as there were important changes (Wars in Israel and Iran/Iraq, Arab oil embargo, etc) over that period.
I suggested population based on a comment by Shallow sand a few years ago and because hole in head questioned the usefulness of GDP, just an alternative choice.
When I do oil energy consumption in exajoules (BP data) vs population (1970-2019), I get R^2 of 95.5%, EJ oil consumption vs real GDP (1970-2019), R^2=96.5%, and Oil consumption (EJ) vs both population and real GDP (multilinear regression), R^2=96.7%.
So real GDP may be better for 1970-2019 period, I still prefer 1982-2019 as this period was more stable. For the 1982-2019 period the multilinear regression on oil consumption in EJ vs both population and real GDP has a 99.1% R^2. For this last regression, the real GDP has a tstat of 1.4, suggesting population is the more significant independent variable (with t-stat of 7.4). The regression of oil consumption in EJ vs population for the 1982-2019 period has adjusted R^2 of 99.1%.
another source for population at link below (sourced from World Bank)
https://fred.stlouisfed.org/series/SPPOPTOTLWLD
Dennis,
I got the data for World oil production (C+C) (EIA) vs World population (Census.gov).
R^2 ~95.77%, if i take out the last data point it becomes ~ R^2~97% so more or less the same as yours. I think you are right with regards to the dates in question and world instability wobbling the data points.
Next week or so i’ll do a t-stat and p-value calculation. For a few of the variables with respect to population. I’ll do a oil consumption vs rest of the variables as well.
Unfortunately EIA only has up to date data in imperial units. I have already manually converted MMBBl/day to Exajoules. I will post that up tomorrow. Thanks for all your help.
GDP has been trending upwards, and oil consumption has been trending upwards, so it’s no surprise that there is a strong correlation.
All your chart tells us is that oil consumption is increasing and population is increasing, but we knew that already.
Passengers on the Titanic had a low chance of survival. But almost all the passengers with the given name Elizabeth survived.
Does this mean that you should name your child Elizabeth if you are worried he might drown? No. On the Titanic, women and first class passengers both had a much higher survival rate than men and second and third class passengers. Elizabeth was a popular girl’s name in rich English families. If a luxury ship sinks tomorrow, there is no reason to expect passengers named Elizabeth to fare so much better than other passengers.
The connection between oil consumption and GDP is indirect — it is mediated by technology, zoning patterns, attitudes towards pollution and so on, just as the survival of Elizabethes depended on naming conventions as well as gender and class distinctions in the lifeboat assignment process.
If the technology changes, patterns of raw material consumption will change as well.
Alimbiquated,
Correlation is not causation, but one can look at past data propose logical relationships between different variables (for existing technology) and see what the statistical relationships are.
For World oil output vs real GDP one would expect there might be some correlation between the two (subject to technology, social behavior, and an infinite number of other potential independent variables). Obviously there are spurious correlations that exist, but most can see a logical connection between oil output and real GDP.
Note the relationship has changed significantly over time. See
http://peakoilbarrel.com/opec-update-april-2021/#comment-716694
The increase in oil output for each one trillion dollar (2010 US$) increase in World real GDP was about 3 Mb/d from 1960-1973, and only 0.45 Mb/d from 2006-2019. I expect this figure will continue to decrease as the World transitions to electric land transport, coal and natural gas use may increase more slowly as wind and solar output increase and as they are utilized more efficiently. Agree 100% changes in technology are important, but they are difficult to measure except by looking at changes in the relationship between fossil fuel energy use and changes in real GDP.
There is no simple model that mirrors reality that I am aware of, every model is flawed.
Iron Mike,
Sounds good, BP has annual data for consumption in EJ from 1965 to 2019.
EIA data for World C+C production in millions of barrels per day from 1960 to 1972 is below
20.990
22.450
24.350
26.130
28.180
30.330
32.960
35.390
38.630
41.700
45.886
48.518
51.138
So the per capita oil consumption has remained quite constant at 4 barrels/year. I thought it would have started to drop by now. (BP data)
Dennis,
Nominal world GDP has increase by low single digit percentage rate over the past few decades. So have literally tens of thousands of other numbers, probably including sales of inflatable sex dolls, the population of the Eastern bluebird, and the number of buildings over 50m high.
All of them will show a high correlation to GDP because they are growing at roughly the same fairly low rate. Using correlation to show causation only makes sense if you have some strong reason to assume it is true. Using correlation to demonstrate causation is a circular argument, because the only reason to pick this number from the tens of thousands you could have picked is your assumption that this number matters more than others.
So without a cogent theory linking your favorite number to GDP, this kind of math doesn’t help much. The theories I have heard on this topic ignore the concept of efficiency, or the idea that there could be alternatives to oil, so they aren’t worth much.
Alimbiquated,
Seems there is a logical reason why energy would be needed for society to function. I agree correlation tells us nothing about causation. I agree technology/efficiency are very important, but difficult to measure. In fact as I have suggested, the slope of the real GDP vs energy curve tells us something about that factor.
Interestingly if we compare the slope for a multilinear regression on fossil fuel and non-fossil fuel energy we find one EJ increase in non-fossil fuel energy results in a bigger increase in real GDP with a factor of 3 difference. I have yet to break out non fossil fuel energy into wind and solar vs the rest of non-fossil fuel energy, my guess is we would see even a bigger effect for wind/solar vs fossil fuel. Part of this may simply be the low thermal efficiency of fossil fuel energy (typically 66% heat losses on average).
I think we might agree more than you realize.
One way to look at GDP is is in terms of the 20th century.
But now, more and more, elements of GDP have become digital, such as all forms of financial transaction and many forms of entertainment and business.
These elements will use energy differently than more traditional forms of GDP.
Probably more electricity, and less oil.
Same trend for many other industries, for example the shift to electricity for trains is a gradual global trend.
The relationship between electrical consumption and GDP may become more and more relevant over time.
Hickory,
Electricity output is a part of energy output, much of it is produced with fossil fuel, some is produced with non-fossil fuel (nuclear, hydro, wind, and solar,etc).
I agree electricity is likely to become a bigger part of the overall energy mix.
Yes Dennis.
I was making the point that GDP is not just correlated to oil consumption, and perhaps it is more closely to overall energy consumption.
We may find that electricity consumption is even more closely correlated to GDP (and population), than liquid fuels.
And this correlation is likely to become more and more relevant over time.
Hickory,
I agree.
Chart below has Primary Energy (EJ) on y-axis vs Real GDP (Trillions of 2010 US$) on x-axis, the steeper section is the Chinese expansion in 2000-2009, note that the slope has changed over time (the 1965-1979 period, not shown, was also quite steep). I expect this curve will flatten over time as the switch to electric power from wind and solar will reduce thermal losses and overall energy use will be more efficient.
Yes, that curve flattening makes sense.
And the $90T dollar question is, as we all are here to try and discover, will there be enough total energy to keep the GDP from declining?
And if not, as many here have concluded, exactly just when does the crunch time kick in?
Hickory,
The relationship may not continue to hold during a transition, also note that BP upscales wind and solar to make it comparable to fossil fuel, essentially creating phantom energy from wind and solar.
A better way to visualize is to downscale fossil fuel energy and ignore thermal losses, so if on average fossil fuel energy has 65% thermal losses then only count 40% of the total fossil fuel energy as useful energy that performs work, or is used for space or water heating (rather than waste heat).
Wind and solar have been growing rapidly and costs have been decreasing rapidly as well. If those trends continue we will have plenty of useful energy to keep real GDP per capita growing modestly (1.4% per year). As population peaks and declines, total real GDP can become constant or even decline with no deterioration in living standards. There is still a lot of waste in the system, greater efficiency will lead to less need for real GDP growth and the accompanied environmental damage.
Iron Mike,
I agree consumption is better, you can get this data from EIA or BP in joules, probably best measure IMO. GDP measures income and value added. When an asset changes hands and there is a capital gain, then there is some income recognized. Value added is the better measure, but these realized gains that occur when assets change hands is a factor in GDP. Note that the increase in asset values is indeed a factor when they change hands.
Powerful people (who tend to be wealthy) have the system rigged to their advantage. This has always been true and may be difficult to change. In my view, a highly progressive income tax structure is the only way to counteract this in the current capitalist system. That policy will be resisted aggressively by wealthy/powerful people, the middle class has only the advantage of more voting power and simply need to get the message so they can elect people who will represent them rather than the wealthy class.
Dennis- “a highly progressive income tax structure is the only way to counteract this [wealth inequality on a grand scale] in the current capitalist system. ”
Here we disagree, or perhaps I would say that I offer a major qualification to your point.
Much of the great wealth sequestration among the super-wealthy [net worth over 10 or 50 million] is not about income tax rates at all. Its about wealth tax- tax on assets over [10] million say.
Most these people don’t have any earned income. But they have huge asset piles in search of a productive use for it.
I’ll leave the point at that, since this topic can go far and deep.
Hickory,
You are correct, more than just income tax needs to be addressed, but also note that I would advocate that all income be treated equally, whether earned or investment income (no special rate for capital gains or dividends). Also an estate tax that eliminates loopholes would reduce the concentration of wealth. In the US income and wealth inequality became much greater with the tax reform under Reagan, we could go back to the tax code from 1965 and adjust for inflation and have tax brackets automatically indexed to inflation, then we need to tackle estate taxes an the many loopholes written for the wealthy. A good tax lawyer could probably wrote legislation that is air tight.
Of course the wealthy would never let this happen, they would fight tooth an nail, but they have fewer voters so they might lose the battle if the middle class ever wakes up. (which is doubtful)
But if, but if, something can be done and it’s called “ happy sobriety ”, that is to say the fact of sacrificing some of the gadgets that surround us to refocus on the essential by choosing what we want to do without. Perhaps the term “happy” is a bit of an exaggeration. Otherwise, Mad Max will remind us if ever oil production goes down and nothing is done to break out of our economies’ dependence on oil.
This is the last one which is Nominal GDP and World oil production/consumption.
HiH might be interested in this one, as we can see GDP keeps increasing into 2020 while oil consumption and production is in decline (circle). Is this because of money printing and asset bubbles which are included in GDP? Possibly.
We know the middle class got smashed during Covid and the rich got incredibly richer thanks to the fed stimulating the stock market and housing market.
https://www.theguardian.com/business/2020/oct/07/covid-19-crisis-boosts-the-fortunes-of-worlds-billionaires
https://www.visualcapitalist.com/the-rich-got-richer-during-covid-19-heres-how-american-billionaires-performed/
Those articles might only cover the U.S but this happened worldwide thanks to CB monetary policy.
Iron Mike , this is within my grasp . Thanks for making the effort . Appreciated .
You’re welcome. I will do one with regards to Debt/GDP later on, and maybe some forecasting regarding some of these variables.
Sorry i forgot to include oil consumption. Done it in the below chart.
Iron Mike,
Probably best to do these energy things either in millions of tonnes of oil equivalent or Exajoules (use BP statistical review of world energy) because different barrels have different energy content (a barrel of residual fuel has more energy than a barrel of diesel which is more than a barrel of gasoline which is more than a barrel of ethanol which is more than a barrel of ethane, etc. This way each barrel is converted to a common unit of energy which is what we are interested in. Also if you use data in metric tonnes you get pretty close because the heavier fuels have more energy per unit volume and this gets you pretty close. Volume is a poor measure for energy in oil of different types.
Dennis,
Thanks for your input. I will redo this in terms of Exa-Joules.
Which means that if we want to decrease our oil consumption/carbon dioxide emissions, we must decrease our level of GDP. Hence ”Happy sobriety”.
Jean Francois,
The relationship can change with more EVs, wind power and solar power.
Below is World C plus C in Mb/d (y axis) vs World Real GDP (trillions of 2010 US$) on x axis from 1960-1973. On average each increase in Real GDP (in trillions of 2010 US$) of 1 trillion saw an increase of about 3 Mb/d in World C plus C output.
Sure, but the problem is that the last time the global economy was 100% renewable was, for example, at the start of the 19th century. Not the same GDP, clearly. Even though there are enough minerals to make solar panels and wind turbines, there is so much energy going into the various machines that we use that comes from the oil, gas and coal, that converting it to renewable energies will be an impossible industrial effort.
Jean-Francois,
It will no doubt take time, the process will be gradual, it need not happen overnight. There are many impossible things (from a nineteenth century perspective) that have been accomplished. As to impossible things that will be accomplished in the future, these will be unimaginable to you and I today, but will be commonplace in 40 years, or perhaps 80 (I will be long gone, but perhaps my children or grandchildren will witness the impossible. 🙂
Jean-Francois,
Compare chart above with similar chart from 2006 to 2019 where each 1 trillion increase in World Real GDP (2010 US$) results in an increase in World C+C of about 0.45 Mb/d (a rate of increase of about 6 times less than the 1960-1973 period). From 1983-2005 the C+C output increased by 0.7 Mb/d for each trillion dollar (2010$) increase in Real GDP. The relationship changes as we use oil more efficiently.
Iron Mike,
Where did you get your estimate for World GDP in 2020, World bank only has estimate through 2019. A google search gives 83.84 T US$ for 2020 World GDP, in 2019 the World GDP is 87.735 T US$ according to World Bank, where is your data from?
Dennis,
You are right. I need to redo this. I think most of my data came from ourworldindata.com, the GDP figures are definitely wrong. They are overall too low. I will redo them with the worldbank data. And with the IMF estimate of 83.84T in 2020. Thanks for picking this up.
Iron Mike,
Not a problem, I constantly get corrected by people and appreciate it. The GDP increasing in 2020 seemed surprising so I checked, there may be a variety of estimates, I just picked the first result from Google (not always the best source).
I was looking through weekly, monthly, and quarterly charts of US stock markets. And no surprise they are extremely over bought on all the meaningful time charts. We are going to get a correction lower that isn’t bought by the dip buyers immediately. So a correction that last more than a few days or weeks. I think that will translate into lower oil prices between now and years end.
Higher oil prices are based on things returning to normal. Higher oil price are based on monetary policy and political policy. And to be honest those that make policy need a round of bad new and a market correction in order to push through more political policy and more monetary policy.
So, you expect that we are going down pretty soon and then more stimulus and higher valuations (inflate the bubbel further)?
Jeff , that is the only action available for Powell and friends to kick the can down the road . The other alternative which is raise interest rates will lead to an abrupt collapse of the financial markets .
Iron Mike,
Excellent analysis and thanks. And the burning of fuel for work certainly creates byproducts, measurable ones. 🙂 Anyway, I enjoyed your analysis. Thanks.
Hi Paulo,
Glad you enjoyed it. The stuff I covered is probably very well known to most people on this forum. It is always positive to visualise data so we can get a better grasp of the numbers involved.
Great stuff Iron Mike.
Thank you.
JODI data for February is out:
https://www.jodidata.org/oil/database/customisable-charts/jodi-highlights
Saudi Arabia’s domestic crude stockpiles fell to a new 17-year low:
Stocks ended the month at 134,572 million barrels, down from 137.21 million barrels at the end of January, according to JODI. (Source)
Saudi Arabia’s crude exports:
As we say in France, les carottes sont cuites!
Saudi Arabia’s Oil Rig Count (Source)
March 31, 2021: 31
March 31, 2020: 60
Anybody like to explain this reduction ?
OIl output depletion? No need to put money in an already depleted field, I think.
Hole in head,
Low oil demand due to pandemic, the obvious explanation.
Pollux , I have been having a queasy feeling that the continuous decline in inventory bodes that they are using inventory to disguise their decline . Something just does not smell good . Cannot justify why , it is just a whim .
Maybe their great unexpected 1 Mb/d reduction had more reasons behind it than we know.
Dennis,
I done few more charts with a t-test with respective p-values. First one is World oil production (C+C EIA) vs World population (census.gov):
R^2 ~95.77%
t_stat= 42.93
h = 1 —–> implies null hypothesis is rejected
p-val = 1.45e-63, more or less ~ 0 which i think it implies an astronomical small probability that the null hypothesis could be correct. (As we expect)
If you get time see if you get the same/similar values please, possibly to correct any mistakes i have made. Oil consumption of total liquid fuels from EIA has a similar statistical correlation and strongly rejects the null hypothesis as expected. I wont post that chart up because of the similarity to the oil production (c+c).
Libya’s Agoco halts crude production in budget standoff with government
Production in several of Libya’s major eastern oil fields has been shut down, heightening the central government’s budget crisis.
From your link:
A spokesman for state-owned National Oil Corp. subsidiary Arabian Gulf Oil Co. said April 19 that it had halted pumping at its fields due to the government’s failure to send federal funds since September for operations.
The government sold the oil and pocketed the money. They felt no need to send any to the field so they could continue operations. Corruption in government will be a continuing problem in much of the world. It doesn’t seem to be getting any better. This is no better than Gaddafi.
Dennis this is the last chart I will post up. Sorry for hijacking your thread. This is the world oil consumption vs world real GDP. Consumption data came from EIA from total liquid fuels. World real gdp is from the worldbank and a projected drop of ~4% in 2020. (Thanks for both the links for the data)
Once again looking at the statistics:
R^2 = 91.64%
h=1 (rejected null hypothesis)
t-stat = 21.11
p-Val= 1.22e-38. Which again is a very strong rejection of the null hypothesis. We can see world real GDP has overtaken world oil production. Whether the strong relationship will be broken quantitatively (accept the null hypothesis) or qualitatively(electrification etc) in the future remains to be seen. Statistically speaking the relationship is just too strong for there, not to be a causation. I personally think world oil consumption is directly responsible for the lions share of GDP.
I am assuming Dennis you think it might be broken with the movement in electrification of the world. So the possibility of movement away from oil, while maintaining GDP growth is there in your opinion?
Iron Mike,
Note that correlation tells little about the direction of the causation arrow.
When two variables are correlated we do not know which is the dependent variable.
Sometimes a strong correlation means very little. We need a logical theory to underpin the empirical data.
Note that the slope of the C C production vs real GDP curve has changed over time with slope decreasing by a factor of 6 from the 1960 to 1973 period to the 2006 to 2019 period.
I exclude the 2020 data as I view the pandemic as an anomoly, like the 1979 to 1982 period.
Yes I expect the slope will move to zero from 2025 to 2035 and then become negative. Same for fossil fuel perhaps 5 to 10 years later as EVs, solar and wind replace fossil fuels over time.
No worries on highjack, I found it interesting along with others.
Iron Mike, for World oil consumption in EJ (BP data) from 1970-2019 vs real GDP (data from World Bank), I get adjusted R^2 96.5%, t-stat=36.8, p-value 7.5 E-37. EIA data I would use MTOE from 1980-2018, but it looks like there is a change in slope around 2004, so I would use 1980 to 2003 and 2004 to 2018. If one wants to assume oil consumption is the independent variable (this seems to be your take), then we see an increase in slope in the later period.
I expect the slope will approach infinity (vertical) and then become negative as World oil output peaks and declines (this would be a chart with oil output on the horizontal axis and World real GDP on the vertical axis). See below.
Hi Dennis,
Thanks for that. Interesting. You are definitely correct correlation doesn’t tell us about causation. With regards to oil consumption and GDP, the underlying causation would be the movement of goods and services via transportation (consumption of liquid fuels) which would back up the empirical data statistically in my opinion.
Now of course this can change as we move away from oil or shall i say if we move away from oil on a mass scale. But that remains to be seen.
I might look at growth rates next. Cheers
the underlying causation would be the movement of goods and services via transportation (consumption of liquid fuels)
Yes, transportation is economic activity (GDP). That’s the independent variable, which causes fuel consumption (the dependent variable). IOW, no one burns fuel just for the sake of the fuel: they want to move goods, and the fuel consumption is a secondary result. As long as the fuel is cheap, there are no limits on fuel supply and the economy is primarily about hard goods (aka “stuff”) and not services, the correlation between GDP and fuel consumption will be very high.
And, of course, the “fuel” can come from fossils, or it can come from other sources, like renewable electricity. As society begins to realize the true cost of fossil fuels, it will switch from oil & other FF to low-carbon sources.
no one burns fuel just for the sake of the fuel.
https://www.wired.com/2016/10/photo-week-raging-inferno-iraqs-oil-fields/
Of course in a sane world you’d be 100% correct.
And, of course, the “fuel” can come from fossils, or it can come from other sources, like renewable electricity. As society begins to realize the true cost of fossil fuels, it will switch from oil & other FF to low-carbon sources.
This is conjecture. You talk with too much confidence as if this has already happened. I don’t share your views at the moment.
Well, I didn’t say it would come from other sources, I said it can come from them.
There’s no question about that: wind turbines, solar panels, nuclear, EVs, geothermal, hydro tidal: they’re all low-carbon. (hydro is a question about hydro in some applications). How quickly we choose to use them is the question.
I suppose in one sense this is like Peak Oil: oil is a limited resource, so eventually we have to stop relying on it. The question, again, is how soon…
Frac spread count might reach 300 by mid-October if the trend continues, that was roughly the centered 4 week average in early March 2020. Also the Oil rig count has doubled since the recent low in August at 172, the most recent data was 344 for the oil rig count.
“Frac spread count might reach 300 by mid-October if the trend continues…”
I agree…and oil will be about $80/bbl (eye ball extrapolation) if the trend continues.
Someone said this .
https://www.ttnews.com/articles/us-oil-production-has-already-passed-its-peak-occidental-says
HH, your link reads: “US Oil Production Has Already Passed Its Peak, Occidental Says”.
Parsley Energy CEO said the same thing months ago: Shale boss says US has passed peak oil
Shell said the same thing of its own production in February: Shell says its oil production has peaked and will fall every year
Oil Price.com’s editorial department says US peaked: U.S. Oil Production Has Already Peaked
USA has passed peak oil
Russia has passed peak oil
Saudi Arabia has passed peak oil
The World less USA, Saudi, and Russia has passed peak oil.
And yet some still argue, “No, no, no, oil production is going ever upward and will not peak for at least another decade. Yeah, lots of luck with that one.
Ron, what can I say ?? 🙂 🙂 Hope springs eternal .
Ron,
On the internet one can find both points of view. See EIA IEO for example.
Ron,
Much depends on extraction rate and demand, if both are low you will be right, if they increase in the future you will be wrong.
In 5 years we will know the answer.
5 years??? No, we will know a lot sooner than that. Of there will not be a certainty, but we should know within one year from this month.
Dennis , your post of 19 th at 11:05 you wrote “Much will depend on tax policy and prices along with geology. ” Well , tax breaks or any other incentive ceases to increase production once the well is past peak and on the downward slope . Same goes for extraction rate as mentioned in your post above . Ask TRCC ,they should know better than me . Geology prevails . I am in agreement with Ron that we will know in an year or so . What worries me more is the Covid mutations ( see my post on the non petroleum) this could be a wrecking ball and destroy all our arguments and projections . I am witness to a disaster ( too early to call it a collapse) in real time .
Hole in head,
I expect a new peak might be reached in 2 years, but am more certain one will be reached within 5 years (by 2026). In one year we won’t know very much, we may have increasing World C+C output by that time, but it is unlikely a new peak would be reached, so not really clear what Ron think happens within 12 months.
Extraction rate is determined by number of new wells drilled. Prices and profit (and taxes) will determine that, along with geology.
My expectation in chart below. Click on chart for larger view.
Ron,
A better focus would be World C+C less OPEC, Russia, and US. I expect a peak in 2027 (or roughly in 6 years). Possibly it could be later is output is restrained to say 84 Mb/d at peak and we could see a long plateau extending to 2033, lots of possibilities, but not ever upward production, which has never been a scenario I have created. Simply different dates from yours.
hole in head,
October 14, 2020 is the date of that article.
A more recent forecast for US oil output at link below (Feb 2021).
https://www.eia.gov/todayinenergy/detail.php?id=46656
The U.S. Energy Information Administration’s (EIA) Annual Energy Outlook 2021 Reference case, which assumes current laws and regulations through 2050, projects domestic crude oil production to return to 2019 levels by 2023 and then remain near 13 million to 14 million barrels per day (b/d) through 2050.
This should scare both OPEC + and US producers.
Chairman Nadler Statement for the Markup of H.R. 2393, the No Oil Producing and Exporting Cartels (NOPEC) Act of 2021
Washington, April 20, 2021
“The Organization of Petroleum Exporting Countries, or OPEC, is an international cartel whose members deliberately collude to limit crude oil production as a means of fixing prices, unfairly driving up the price of crude oil to satisfy the greed of oil producers. Such behavior, if done by private companies, would be illegal per se under U.S. antitrust law. Because of a series of court decisions, however, our nation’s antitrust enforcers are unable to protect American consumers and businesses from the direct harm caused by OPEC’s blatantly anti-competitive conduct.
https://judiciary.house.gov/news/documentsingle.aspx?DocumentID=4519
Ovi,
Unlikely to pass in the US Senate so nothing to fear.
Road blocks at Argentina’s Vaca Muerta shale deposit slow oil, gas output
Local media reported long lines at gas stations while fuel-hauling trucks were blocked from entering production areas.
Norway’s March oil, gas output lag official forecasts
Crude oil output fell 1.1% from February to 1.773 million barrels per day (bpd) in March, while the NPD’s forecast for the month had stood at 1.785 million bpd.
Norway’s output of natural gas in March totalled 9.81 billion cubic metres (bcm), below the NPD’s forecast of 9.88 bcm and down from 10.72 bcm a year earlier.
It is not rocket science to be fair. One is the price has to be fair (oil & gas) and give an incentive to otherwise expensive production. The second is it’s a long term policy to decarbonise. It is no secret that at least the North Sea is very mature for oil & gas; investments are reduced and more directed towards wind power as it stands (at least in Norway, but also all other European countries it seems). More can be directed towards finding more oil & gas in the future (why?; we have to get used to gradually less oil/gas energy from at least the NS anyway); but everyone knows we don’t really have a new North Sea in resources to rely on.
We are still having a 20% reserve replacement ratio in Norway, with an aggressive production schedule this decade together with discouraged E&P spending. Makes me think the “new” low level of level of production can be maintained for 20-30 years based on new reserves and then I don’t really know. Fossil fuels will not go away, but be on lower levels in this part of the world at least.
There is no demand . More oil for sale will keep prices in check .
https://oilprice.com/Energy/Crude-Oil/Deeply-Discounted-Crude-Becomes-Headache-For-OPEC.html
Hole in head,
I read the article differently. Oil prices are low due to US sanctions on Iran leading to Iran undercutting the prices of others to entice some nations (China and India) to buy Iranian oil because it is cheaper. Without US sanctions on Iran, Iran would be subject to OPEC quotas and this cheap oil would be taken off the market.
See https://www.iea.org/reports/oil-market-report-april-2021
Excerpt:
In its April update of the World Economic Outlook, the IMF raised its forecasts for 2021 and 2022 global GDP growth to 6% and 4.4%, respectively, but noted divergent recoveries and a high degree of uncertainty. Not surprisingly, the biggest upgrade was for the United States, given its swift vaccine rollout and hefty stimulus packages on the way. China was also revised slightly higher. This improved outlook, along with stronger prompt indicators, has led us to revise up our 2021 global oil demand growth forecast by 230 kb/d. Following a decline of 8.7 mb/d last year, world oil demand is now expected to expand by 5.7 mb/d in 2021 to 96.7 mb/d.
Billionaire Trader: Seismic Shift Is Taking Place In Houston Oil Patch
“Three-quarters of discussions now are about wind, solar, batteries, transmission, lithium, cleantech, etc. Even those who are not ideological believers are taking the cues from the financial markets, which have no interest in oil production growth anymore,” wrote Arnold, once dubbed “king of natural gas” by his former colleagues at Enron, and now co-chair of Arnold Ventures.
The legendary trader notes that financial markets are rewarding industries with high growth potential, such as clean energy, at the expense of the oil and gas sector. Moreover, capital for fossil fuels has dried up, Arnold says.
Capital for fossil fuels has dried up, even with WTI at $60?
Another Libyan Oil Firm Cuts Output as Funding Row Worsens
One of Libya’s state oil producers said it would have to cut as much as 100,000 barrels a day of output this week, a further sign that a budgetary crisis is threatening the OPEC member’s energy industry.
Sirte Oil is the second Libyan company that’s had to slow production in the past week because of a lack of funding to maintain fields and pipelines. Arabian Gulf Oil Co. cut output by roughly 90%, or 280,000 barrels a day.
I have revised my opinion on Peak Oil. Yes, I still believe November 2018 will be the peak. But the driver of peak oil will be demand, not supply. And Covid 19, along with EVs, will be the driver of peak oil demand.
The world Covid problem is getting worse, not better. The seven-day average of world cases just hit a new all-time high. And it is likely that only a small percentage of actual cases is getting reported. Covid is playing havoc in India, Russia, and in many other locations, especially in Asia. And who knows what is happening in Africa? South America is being ravaged also, especially Brazil.
Covid is playing havoc with supply. Investors expect new EV technology to limit demand. That, combined with the Covid epidemic will both cause investors to sit on their money. Drillers will go begging. Supply is about to fall because investors expect demand to fall.
Nevertheless, peak oil will still be peak oil regardless of the cause. Goldman Sachs expects peak demand because of EVs alone. (Article and link below.) They don’t even consider the Covid problem. But the Covid problem is the elephant in the room that no one is paying attention to. The Covid problem is about to blow the whole situation wide open.
Oil Markets in Flux, Banks Expect Doomsday Scenarios?
International bank Goldman Sachs seems to have joined the peak oil demand proponents, as the bank has brought forward its forecast for peak oil demand in the transportation sector by one year to 2026. GS analysts even reiterate that automotive demand could even peak before 2026, if accelerating adoption of electric vehicles (EVs) increases. The bank predicts an overall “anemic” pace of global oil demand after 2025. Some optimism is still there, as they see continuing growth in jet fuel and petrochemicals.
Goldman Sachs assessments, next to BP’s market shock statements, will have a detrimental effect on long-term prices, as they belong to a strong market movers groups, which also includes the IEA and EIA. The statements of GS however stand contrary to others, such as OPEC, the latter expects still strong growth. The hydrocarbon sector is expected to face severe risks from the energy transition onslaught, activist investors and government strategies
More information on the state of the pandemic-
The USA has now achieved a 25% vaccination rate, and 39% has received at least one dose.
Less than 5% have been vaccinated in Brazil and India, and
less than 10% have been vaccinated in France and Germany, for example.
Remember that vaccination does not guarantee immunity, Severe infection requiring hospitalization is prevented by over 90% with Pfizer and Moderna , whereas the Sinovac effectiveness in Brazil was just over 50% after the second dose. There are dozens of vaccines under various stages of development.
Health officials, including the chief medical officer of Pfizer, have been increasing their statements of late indicating that boosters will likely be necessary, perhaps annually.
The other wildcard, beside duration of immunity after infection or vaccination, is the emergence of variants that are not covered by prior immunity and/or are more virulent than the original form. Time will tell. The risk is real, but unknowable in severity and probability.
As Ron said, this pandemic is still in the formative stage.
And to the other point, anyone who still hasn’t recognized that vehicles with plugs are a major force in the energy demand equation have failed to digest the industry progress and news over the past years.
Still effective for the T1.
RNA viruses mutate with replication, so eventually this will probably escape.
Viruses are not alive.
Just out today
The good news-
“Among 417 employees at Rockefeller University who were fully vaccinated with either the Pfizer or Moderna shots, [only] two of them or about .5%, had breakthrough infections later, according to the study published on Wednesday in the New England Journal of Medicine.”
The bad news-
“Scientists at Texas A&M University’s Global Health Research Complex say they’ve detected a new Covid-19 variant that shows signs of a more contagious strain that causes more severe illness and appears to be resistant to antibodies.
The new variant, BV-1, named after its Brazos Valley origin, was found during Texas A&M’s routine coronavirus screening…“We do not at present know the full significance of this variant, but it has a combination of mutations similar to other internationally notifiable variants of concern,” said Texas A&M Chief Virologist Ben Neuman. “This variant combines genetic markers separately associated with rapid spread, severe disease and high resistance to neutralizing antibodies.”
appears to be resistant to antibodies.
But not T1
Ron and Hickory,
My assessment is simply different in timing. Yes covid and EV transition will affect demand, on EVs I think the demand falls to less than supply by 2035 to 2040 due to lack of battery supply to ramp more quickly. On covid, the effectiveness of Moderna and Pfizer against a serious COVID case is more like 99%.
For US total population 40.9% have received at least one covid vaccination and 26.9% have been fully vaccinated. For population 18 and older 52% have had at least one dose and 34.4% have been fully vaccinated, for those 65 and older the rates are 80.7% with at least one dose and 66% fully vaccinated.
For the US the 7 day average of new cases is down by a factor of 4 since the Jan 2021 peak. As the US becomes fully vaccinated, the vaccines will be available to the rest of the World as production ramps up. The World curve will then fall as the world becomes vaccinated. Then there will be a lot of pent up demand for travel and as the pandemic recedes worldwide demand for oil will increase to beyond available supply, prices will rise and supply will increase in response to higher profits for oil production. That’s how I see things playing out. Like all guesses about the future this scenario will be incorrect (probability 99.999%).
Dennis, the US is not the world. The Covid pandemic is well on its way to being under control in the USA. It is not even beginning to be controlled in the rest of the world. The seven-day world moving average hits a new high every day now.
No, India will not be vaccinated the way the US is being vaccinated. Neither will Africa, or South America. It will take years, many years before herd immunity worldwide takes effect. Even then we will not return to business as usual. People will still be afraid of travel.
That being said, peak oil supply was hit in 2018. That level will never be reached again. That is not the wild-ass guess that you assume it to be. No, we cannot know the future with absolute certainty. A meteorite may destroy the earth next month. But we can see the obvious trends and make an educated guess that those trends will continue for a short time anyway.
But Pollyanna would see things differently. And so would Dennis. 😉
While we have been hearing and watching Covid in the West and Asia we forgot Africa . A new variant with 34 mutations is already moving in Angola and Tanzania .
https://www.wionews.com/science/scientists-wary-of-coronavirus-variant-from-tanzania-with-34-mutations-379675
Best of luck to all .
Ron,
The future estimates of Henny Penny tend to be too low. We have had peaks in oil output many times in the past. The current peak in 2018 will be surpassed by 2024, perhaps sooner the final peak will be from 2027 to 2030, best guess late 2028 to early 2029 for centered 12 month average output peak.
Wow! This is the craziest shit I’ve ever read from Ron! Peak demand!
Hey, the pandemic changed everything. And my scenario is based on the belief, on my part, that it’s going to get a lot worse before it gets better.
Also Stephen, world oil production peaked in 2018. That was a supply peak, not a demand peak.
Low demand is now baked into the future no matter what IMF ‘, WB ,FED ,ECB says . Don’t believe the latest Chinese figure of 18 % in the last quarter . Not possible because it was closed for a week or so for the Chinese New Year . Further they shut down industry to supply electricity to households during a cold snap which also lasted for 10 days .
Ron,
I disagree on 2018 being a supply peak, supply fell because there was oversupply and falling oil prices, it was a lack of demand relative to oil supply that caused supply to fall. Right after the peak OPEC cut supply to bring oil prices up.
A peak in supply would be accompanied by everyone continuing to produce all out (including OPEC) while oil prices continued to rise with no continued increase in output. That does not describe 2018 and 2019.
I knew you would disagree Dennis. But what you do not realize is that weak demand can occur at the same time as peak supply. When the world is flooded with supply, as it would be when almost everyone is producing flat out, prices will just naturally be low. Only when everyone is producing flat out is it possible for nations to cut supply.
A peak in supply would be accompanied by everyone continuing to produce all out (including OPEC) while oil prices continued to rise with no continued increase in output.
Why would that statement be true? What rule states that when everyone is producing flat out, they must continue to do so? That rule makes no sense whatsoever Dennis. If everyone is producing flat out, and there is a glut, and prices fall, nothing says they must continue to produce flat out.
Ron,
Yes I see what you mean, my point is that 2018 was a matter of oversupply as is clear from looking at the oil price over the 2018 to 2019 period. I tend to think of a peak in supply as a situation where supply cannot match demand at the prevailing World oil price and where oil stocks are becoming very low relative to the 5 year average and oil prices would be rising to reduce the level of demand to match the supply. If oil output then responded by declining in the face of higher oil prices, then I would agree that would correspond with a peak in supply. We did not have that scenario in 2018, we simply overproduced at the prevailing oil price level relative to World demand at that oil price.
I think we are more likely to see the peak supply scenario around 2028-2030 at about 84 to 86 Mb/d, and that a peak demand scenario is less likely. If output was relatively flat at 83 Mb/d from 2024 to 2034, with moderate oil prices at $70 to $80/b for Brent (in 2020 US$) we might see peak demand in 2035 or so and oil prices might start to fall due to lack of demand and an oversupply situation, but odds are lower (1 in 3 roughly) that such a scenario would be correct.
I tend to think of a peak in supply as a situation where supply cannot match demand at the prevailing World oil price and where oil stocks are becoming very low relative to the 5 year average and oil prices would be rising to reduce the level of demand to match the supply.
But why? Why do you think this scenario must take place? Or why is it even likely to take place? There is absolutely no reason that the peak cannot happen when there is a glut and low prices. In fact, that is when it is most likely to happen. It is only
after peak oil when prices are likely to rise. Peak oil will only cause prices to rise when everyone is aware that the peak has passed. Here is my case:
OPEC: OPEC has not contributed much to the increase in the world’s oil supply since 2005. Their yearly average, in their peak year of 2016 was only about one million barrels per day above their 2008 average. I am firmly convinced that 2016 was their peak year. At any rate, even if they are able to increase that slightly, we cannot look to OPEC to save the world from peak oil.
Saudi Arabia, OPEC’s largest producer and one of the world’s top three producers, is obviously having problems. They are desperately trying to raise money, trying to sell some in-country oil acreage that they cannot themselves produce at a profit. This is likely tiny deposits too remote for piping water in and piping oil out. And they desperately trying to wean themselves off oil income with new industry and overseas acquisitions of farmland. There is at least a 90% chance that Saudi has peaked.
Russia, one of the world’s top three producers, has admitted that they are post-peak. And most oil analyses are far more pessimistic than the Russian Minister of Oil.
The USA, the last of the world’s top three. I know how bullish you are on US Shale production. But the rest of the world is not nearly as bullish as you Dennis. Just about everyone except you and the EIA believes shale oil has peaked. And that means the USA has peaked.
And the world less the big three peaked about 5 years ago.
End of story. World oil production peaked in 2018.
Ron,
If all of your assumptions are correct, you may be correct, I think you are wrong on OPEC having reached a final peak, Russia is likely to maintain close to the 2018 output level for many years and yes US will be able to increase output once demand increases. As far as vaccination for the world, wealthy nations will get vaccines then supply will go to less wealthy nations. India is poorly run, citizens there will demand better governance.
Russia is likely to maintain close to the 2018 output level for many years…
Wow! With all their old supergiant fields in steep decline, that statement is simply beyond the pale.
As far as US production goes, check out the link posted by Lightsout below. Here it is again, just for your convenience.:
Struggling to Make a Profit, Fracking Investors are Searching for the Exit
Ron,
Firstly i would like to commend you for changing your opinion. It implies you aren’t stuck in ideology.
Secondly, demand will hurt oil companies and prices. The pandemic is far from over and well no one knows what will happen next because of the variability of the world we live in.
However, on the flip side of that coin, oil prices can easily be artificially inflated with geopolitical tension. E.g. If tensions rise between U.S/Israel and Iran. And Iran decides to close the strait of hormuz for example, oil prices will skyrocket. Probability of that happening is small. However, as many other do, I believe OPEC are a dangerous cartel and they both have the will and capability of sabotage and terrorism, not just through their governments but through proxy groups. If they feel their business is at risk they might go to extremes. Such an event will even out oil supply and demand for a given time.
If peak oil demand actually has happened (2018) we can also expect near zero growth GDP. However China has boasted an 18% growth first quarter of 2021 (I think their highest ever). They will continue their economic expansion and strengthen their power base in the world. The pandemic might have been the catalyst to the ‘rate of change’ of the power structure of the world. We wont know this for sure until a few years from now though.
Also last couple of years while discussing URR with Dennis and his/my scenarios, it occurred to me that there is enough oil in ground to raise the CO2 PPM to ~2000 . And as humans we would continue exploiting this resource if need be. So my stance on peak oil supply was quite softened. But i am still open to the idea IF we continue consuming oil at 100MMbbl/day 5 to 10 years after the pandemic is over.
Finally for my doomer porn scenario. I honestly think there is a reasonable probability of this occurring. I believe China will challenge the U.S/West through a 3rd party, like the invasion of Taiwan, or backing North Korea in a conflict with the U.S etc. They are only waiting for their enemies to weaken and when they feel probability is with them, they will begin to challenge the western power structure of the world. If Russia has their back (and their ambition) they will do it even sooner. What happens next, well who knows, but the possibility of war increases.
Iron Mike- “discussing URR with Dennis and his/my scenarios, it occurred to me that there is enough oil in ground to raise the CO2 PPM to ~2000 ”
I’m surprised by that projection. Didn’t think it could get any where close to that level.
Anyone seen published projections on this.
Lately the CO2 has been going up at 2-3 ppm/year.
Figure 3ppm/yr for 50 years, and add that to the current 418 = 568 ppm at year 2070.
I don’t think the level of current burning will last that long.
Nonetheless, the trajectory of climate change from CO2 is indeed a slow motion catastrophe.
Hickory,
Dennis has URR ~ 3200Gb (not including unconventional sources i believe), from 1969 to 2018, a fifty-year span, the world has consumed 1.306 trillion barrels of oil. With positive feedback and ocean anoxia CO2 levels will go up exponentially over the time-frame and beyond of burning the rest of the URR. This is very unlikely to occur but if it did with high consumption rates, CO2 can easily reach 2000ppm over the next 100 or so years.
I think you are assuming the trajectory will continue to be arithmetic while I am assuming feedbacks leading to more and more geometric growth.
OK.
If we do keep burning fossil fuel like we have for the past couple decades for another 20 years, and I think we can guarantee it, then CO2 (and methane) will be high enough to be very disruptive to the climate (and economy).
If people haven’t acknowledged this yet, they just have not been looking with a straight mind.
Its like being in an elevator with 15 other people, all unvaccinated and unmasked. Except you know that 4 of them have active Covid infection. The rest of the story is predictable.
Hickory,
I agree. But do not agree 2000 ppm atmospheric CO2 is a likely scenario, 500 ppm ( a very likely scenario) will not be good, it will cause a lot of problems and should be avoided (and I would agree that does not look to be a likely scenario, probably less than 1 in 3 odds).
I will link to a previous comment were I make the case that the most important thing to change to avert climate change is agriculture and more generally land use: http://peakoilbarrel.com/brazil-summary/#comment-714858
Iron Mike,
The mainstream climate science suggests perhaps 500 ppm maximum for my medium scenarios with a transition to non-fossil fuel overt the 2030 to 2100 period. It is possible the mainstream science is wrong, but I doubt it is off by a factor of 4. I think we need to do better than this and need to keep it ay 450 ppm or less, this will be a challenge.
Dennis,
I meant if all the URR is used. Then CO2 will go over 2000ppm. That’s what i meant by that statement. All the URR or even ERR on the earth is used.
Iron Mike,
All of the URR will depend on oil, coal, and natural gas prices. They will not be high indefinitely. There are not likely enough resources to result in carbon emissions at the RCP4.5 scenario level, roughly 1500 Pg carbon emissions, which might result in 600 ppm at most.
A more likely scenario has emissions of carbon in the 1000 to 1200 Pg range (1800 CE to 2200 CE) with atmospheric CO2 topping out at about 450 to 500 ppm. As I suggested we need to do better, maybe 800 to 1000 Pg carbon emissions (includes fossil fuel, cement production, and land use change.)
Dennis , Iron Mike etc . We can use all parameters we want URR , ERR , PPM etc . The conclusion is very clear. We have crossed the tipping points on all critical factors for the continuation of IC . ALL means ALL , peak oil ,CC , LTG ,overshoot etc . Good to argue but not enough to change our destiny . You will ask ” What the hell are you doing here? ” . Simple, to understand as to why and how our system collapses and to inform others who are discovering and logging on to this blog for the first time . I assure you that there are twice more silent readers here than those who post . HT , Ron you have done a great job by taking over where TOD left , bereft this blog I don’t see how the serious posters would have been able to get the message of PO and POD ( Rockman) across to the general public . Take care and be well . It is a bumpy ride from here on .
“Nevertheless, peak oil will still be peak oil regardless of the cause. Goldman Sachs expects peak demand because of EVs alone.”
“ GS analysts even reiterate that automotive demand could even peak before 2026, if accelerating adoption of electric vehicles (EVs) increases.”
Ron, you left the modifier “automotive” off with regard to demand. That makes a big difference.
Aramco May Sell Stakes In ‘Non-Strategic’ Oil Fields
Saudi Aramco, which operates all upstream oil and gas assets in Saudi Arabia under a multi-decade concession deal with the Kingdom, is reviewing its upstream business and could decide to sell stakes in some not-so-strategic fields to external investors, Bloomberg reported on Thursday, quoting sources familiar with the matter.
Is Ghawar “not-so-strategic”? 😉
Does this mean that they are buying into the stranded assets theory.
Hello all.
A rather huge bit of news re Russia and Europe. Yet to be 100%;confirmed but it rings true.
You were wondering where China was going to get its 7 Mb/d from? Well Moscow is seriously considering an immediate proposal to redirect ALL feasible gas and oil pipelines currently supplying Europe to … China. All of it. The West’s lies and subversion will finally end up with consequences – total energy poverty. The Empire of Chaos is likely to get more karma than they bargined for.
China apparently will finance the lot, and the few hundred billion USD this project would take is already in place.
https://vk.com/wall578617852_4451
https://asiatimes.com/2020/08/definitive-eurasian-alliance-is-closer-than-you-think/
As I said – massive news if true, with enormous consequences . Would explain quite a bit of the spiralling political insanity we see too. The West has become its own worst enemy. Buckle up.
Thanks so much for the great work. Terrific and underappreciated site.
Thanks for posting this. VK link not working for me. The other link is behind a paywall.
https://oilprice.com/Energy/Natural-Gas/Russia-Eyes-Another-Massive-Gas-Pipeline-To-China.html
from July 2020 though.
https://alethonews.com/2021/04/21/as-demand-for-natural-gas-skyrockets-in-booming-china-russia-says-its-ready-to-meet-beijings-needs/
more recent April 21st 2021
Not surprised by Putin’s action . Just surprised that it took so long to materialize . After all there is only so much stupidity one can absorb . Latest example :
https://www.politico.com/news/2021/04/22/pentagon-russia-attacks-us-troops-484150
US oil, gas rig count drops for first time this year, losing 11 rigs
Oil rigs fell steeply to 404, down 15 for the week ended April 21, while natural gas-oriented rigs gained four to 126.
Pollux,
Baker Hughes has US oil rig count down by 1 for week ending April 23, last week the oil rig count was up by 7 according to Baker Hughes. Not sure why there is such a large difference, but most use Baker Hughes for rig count data.
https://rigcount.bakerhughes.com/na-rig-count
Dennis , not important . It is downhill anyway , we can argue about the speed . Be well .
Hole in head,
A decrease by one is statistical noise. The trend is clearly up for oil rigs and frac spreads.
Still waiting for your $25/bo WTI price. My guess of $70/b for WTI seems a bit closer to reality. OECD oil stocks are falling fast toward the 5 year average. Looks lime oil prices are likely to continue their rise. If so oil output will not be far behind.
Hole in head see rig count charts.
http://peakoilbarrel.com/opec-update-april-2021/#comment-716994
Dennis , I saw these and others posted by Ron . The current rig count is what it was in Nov 2009 . Not going to produce 13 mbpd with this rate of rigs and frac spreads. Of course there are other factors as per the article posted by Lightsout and further supported by Ron which are let us say ” not supportive” for your viewpoint . Guess , both of us are just going to have to wait .
Hole in head,
I agree, but rig count is less important than frac spreads which are at 67% of the March 2020 level and are likely to continue to increase as oil prices continue rising (Brent is at about 66 per barrel as I write). On March 2020 US tight oil output was close to the November 2019 peak, the frac spread count may return to the March 2020 level by late 2021 or early 2022. My tight oil scenario assumes all new wells are financed from cash flow for the price scenario which reached $75/b by the end of 2021 (Brent in 2020 US$, WTI would be $5/b less). There are always companies going bankrupt in a capitalist system, the tight oil producers that are doing well (are profitable) will pick up the best pieces of companies that are broken up and sold in pieces after bankruptcy, a lot of debt will be written off and the strong companies will become stronger financially.
India will eventually get its act together and get its population vaccinated. In the mean time there will be demand from US, China, Europe and many other nations.
And yes we will have to wait to see who is correct.
Dennis , rig count or frac spreads , take any parameter you like , but you cannot avoid ” the red queen ” effect in the shale plays . They will hit the wall very shortly if they haven’t done it by now . As to Vaccines it is also a political decision by Biden because Mr Modi was a great supporter of Trump , openly advocating a second term for Trump in stadium full in both USA and India . Competence and governance in India are absent . It is now a country adrift in the oceans without a steering wheel . By Mid May the death figures will be off the charts . Just some interesting fact ,there is 1(one) oxygen ventilator per 48,000 persons . Overshoot in play and in real time .I have in many earlier posts said that India is a perfect candidate for collapse ,a combination of “overshoot” and ” Limits to Growth ” .
P.S : I want emphasize the bloated and pumped up reserves that the shale players have used to borrow money . Mike S , Art Berman and Steve have mentioned that also . The unravelling is starting . A Ponzi is a Ponzi no matter what the name .
The India growth story is over . The Covid 2.0 is hitting hard . Today known infections 334000 , deaths 3100 per day. Multiply by 20 for an unknown figure .
https://energy.economictimes.indiatimes.com/news/power/sales-of-evs-in-india-fell-20-pc-in-fy21-to-236802-units-smev/82194338
Yes it will be impossible for India to get this under control until they reach herd immunity. That will take 1-2 years probably of vaccinations. Of course the virus will be mutating that entire time and possibly achieve
vaccine escape. Brazil also will struggle mightily for the next 6-12 months. This will suppress two very large economic engines and dampen oil demand growth significantly, likely keeping a lid on oil prices for the medium term. Covid is very far from done disrupting the global economy.
Stephen,
India is capable of producing vaccine, they just need to get their act together. They thought the worst was over and they were wrong, perhaps they will learn from past mistakes.
Dennis , yes India has the capacity for vaccines but some ingredients have to be imported from USA . Biden has banned the export of these on the grounds that they are needed by US manufacturers to make vaccines for the US public first . Further the vaccine in India will be given free to armed forces, police, health workers and of blood sucking politicians . The public price is $ 20 per dose so two doses is $ 40 . If only the adults get vaccinated it is $ 80 , this in a country where income per capita is $2100 per year . Now news comes that 50 % of Calcutta is positive because of the election rallies . Total population 15 million . This will happen in the whole state of West Bengal (Pop 90 million) where the elections are being held .
https://economictimes.indiatimes.com/industry/healthcare/biotech/healthcare/every-second-person-getting-tested-in-kolkata-is-positive/articleshow/82241307.cms
Hole in head,
A mistake for US to not allow exports for those things. Maybe China makes that stuff? Or India could ramp up production of needed supplies, I am guessing the US is not the only supplier, but I am often wrong.
If the Indian government was competent, they would pay for all vaccinations of Indian citizens.
Below is info on Honda’s future plans for EVs. it seems more realistic to me than the goals from some other companies. Their 2030 projection of EV sales of 40% may be more inline with peak oil demand being closer to 2030 than the 2026 that I have seen pop up more recently. I think that Honda has a more accurate and honest outlook for the EV auto market. I often wonder if some of the other auto companies publish a more optimistic/earlier move to EVs primarily for PR reasons.
“Honda Motor Co is aiming to increase its ratio of electric vehicles (EVs) and fuel cell vehicles (FCVs) to 100% of all sales by 2040, chief executive Toshihiro Mibe said on Friday.
The company expects EVs and FCVs to account for 40% of sales by 2030 and 80% by 2035 in all major markets, including North America and China.”
https://www.reuters.com/business/autos-transportation/new-honda-ceo-aims-100-electric-vehicles-by-2040-2021-04-23/
Ovi , I have a lot of respect for your viewpoints but here I just disregard it . No EV manufacturer will talk about the elephants in the room which are batteries , rare earth metals and affordability . My contention is very simple ,” The chain is as strong as it’s weakest link ” . If we do not learn from the recent Suez disaster ,we never will . You are intelligent but in case you have not read or seen David Korowitz’s articles and YT then I suggest you do so . Understand supply chain contagion which we are witnessing right now . With respect, for what work you (and Dennis) do on this blog , there are no word’s to express my appreciation .
P.S : Often quoted ” A small hole can sink a big ship ” . This is from personal experience .
HH
My main point was that I believe that Honda was being more honest in their projections. I did not mean to imply that they were realistic. Considering that in 2020, US sales were close to 2%, the question is, what has to be done and at what rate of increase to get to 40% by 2030. So here is an interesting series to consider to get to 40% of all car sales starting from 2% in 2020. 2021, 6%, 2022 10%, 14, 18, 22, 26, 30, 34, 38, 2030 42%. Considering that current EV sales are increasing at 10% per year, that climb to 40% seems taller than Mount Everest.
I agree the supply chain will be a problem. The EV crowd says batteries will get cheaper. I am sure they will. They don’t mention the cost increases that will start with copper, cobalt and some rare earth metals.
To me the problem starts in California. Many wealthy people who can afford their Tesla’s setting the pace for the rest of the US that require affordable $20 k vehicles.
Below is a link for the plug in RAV4. A sensible hybrid with a range of 42 miles. A smaller battery to keep the cost down and reduce pressure on the supply of resources.
Today this site discusses peak oil. Some day it may start to transition to Peak Copper or Peak Cobalt or the rare earth metals Peak neodymium and dysprosium. Take your pick and note that China is the main supplier of the last two which are used in permanent magnet motors. They could just say one day, no more exports.
There may be more than one small hole around the corner.
https://www.motortrend.com/cars/toyota/rav4/2021/2021-toyota-rav4-prime-first-test-review/
Ramping up plug in vehicles (EV and PHEV) on an industrial/manufacturing basis is going to be very tough for all the auto makers, I suspect. If Honda say 40% in 2030, it is not because the demand won’t be much higher, it will be because they can’t manufacture enough.
People won’t be wanting to buy many vehicles without a plug by the end of this decade.
A solution that may allow Honda and other manufactures to meet demand may be to emphasize plugin hybrid EV.
These vehicles can use less materials (batteries) to accomplish much of the cost/energy efficiencies that people will want. An example currently available- Toyota RAV4 Prime
A person could easily cover half their miles with electricity, or all by electricity if they only go 40 miles a day.
These vehicles could extend the effective life of oil.
https://www.motortrend.com/cars/toyota/rav4/2021/2021-toyota-rav4-prime-first-test-review/
PDVSA’s refining boost leaves crude exports short of blendstocks – sources
Petroleos de Venezuela typically utilizes most of the country’s lightest crude production for blending operations for crude from the Orinoco Oil Belt, one of the world’s largest oilfields by reserves.
…But in mid-April, the Orinoco belt was producing just 190,000 bpd, down from 286,000 bpd as recently as January, according to documents seen by Reuters, a drop which three of the sources attributed to the dwindling availability of diluents.
Pollux , tks . However Venezuela is now beyond redemption . It is now nothing but a footnote in the history of the oil age .
Yemen’s Houthis claim attack on Saudi oil facility, air base
Yemen’s Houthi movement said on Friday it had launched attacks with drones on a military air base and oil facility in Saudi Arabia, the latest indication that diplomacy to end the six year conflict has so far failed to take hold.
Blurb — California says they will stop all oil extraction in the state by 2045.
Sounds about right, geology-wise.
A good summary of shale.
https://www.desmog.com/2021/04/22/struggling-fracking-investors-are-searching-for-the-exit/?fbclid=IwAR2wMGMnA0h6Wbf0wLEfeZLkHybnS2WjzcLYKXm6L_UVPg6r22yYkWa6xZA
Thanks, Lightsout. Fantastic article. Everyone interested in US oil production should read it. From your link:
Like the housing bubble, the fracking bubble continued despite huge losses because companies were able to borrow more money to keep producing oil — that they then sold for a loss.
As Michael Lewis, author of The Big Short, pointed out, to keep a Ponzi scheme going requires a constant influx of new money because there are no profits. When the new money sources dry up — the scheme collapses.
And from a tweet at the bottom of the article:
Shale industry is a Ponzi scheme. It was never profitable, not even @$70/b, & drillers were doomed to bankruptcy as soon as new $ stopped flowing in (ie Covid & ⬇️ in renewables price). US energy indep. will have to come from renewables.
There will certainly be bankruptcies and banks and investors that have not done their research will lose money as loans are written off.
The well run tight oil companies that have been profitable will buy up the better assets as the bankrupt companies are sold off. Then the industry will be in better financial health and well run companies will grow and finance that growth from cash flow with little new debt. My permian model treats the entire Permian basin as a big project run by one company which finances future wells from cash flow (starting in April 2021), the debt is accumulated debt from Jan 2010 to March 2021.
tight oil output for model on left axis in kb/d and oil price (with scenario assumptions after March 2021 for Brent oil price in 2020 $) on right axis. All debt paid back for Permian producers (accumulated since Jan 2010) by Feb 2026. Annual discount rate (nominal assuming 2.5% inflation rate) is 10% and nominal annual interest rate on debt assumed to be 7.4%. Well completion rate for Permian basin is assumed to be 300 in Jan 2021 and gradually increase to 490 by Sept 2022 and then increase more gradually to 540 by Oct 2024 and even more gradually to 600 completed wells in October 2029, then the completion rate is constant at 600 wells per month through July 2035 (end of chart). The full scenario (not shown for those offended by future scenarios) has completion rate falling after Feb 2039 and reaching zero in 2043. Total wells completed in Permian basin for scenario is 176,450 wells with 31,323 wells completed from Jan 2010 to March 2021 and about 145,000 wells completed from April 2021 to August 2043. The scenario assumes average new well EUR gradually decreases after December 2019 from about 400 kbo (December 2019) to 288 kbo for the last wells completed in August 2043. For simplicity I assume well cost (CAPEX) remains constant at $10 million in 2020 US$ over the Jan 2020 to August 2043 period (though cost per barrel increases as EUR decreases over that period).
Note also that the price assumptions are fairly conservative, I think that in reality oil price is likely to rise higher than $75/bo by 2024 to 2035, if that is correct then profits will be higher than this scenario assumes unless well costs rise at a higher rate than oil prices.
Dennis, at that same link posted by Lightsout above, there are three articles. We have discussed only the first one. The second article:
Shale Investors Looking for Greater Fools
An April article by Bloomberg reports that the business strategy for private shale company owners is to now “escape” the industry altogether.
These investor plans to escape the fracking business, however, require willing buyers — or as they are known in this part of the business cycle, “greater fools.” This is the idea that you can make money from overpriced assets because there will always be someone else, the fool, willing to buy it at an even higher, inflated price. However, if there are no willing buyers, these investors will find themselves “holding the bag” — essentially stuck with a worthless investment.
The fracking company owners looking to escape by selling their companies know the financial numbers better than anyone — that explains their urgency to get out. As the Financial Times noted, most of these companies have debts far greater than any future potential income, making bankruptcy a near certainty in the future.
The third article:
The Return of Liar Loans
In January 2019, the Wall Street Journal reported that shale wells were not producing as much oil as the companies had promised investors. That article recounted a story from an oil industry conference where the idea that companies would properly estimate the potential future oil production brought a round of laughter from the conference attendees.
Why were fracking companies consistently overestimating the value of oil wells and reserves? “Because we own stock” was the answer from one conference attendee. This open admission that companies were lying about the value of their oil and gas assets to pump up their stock prices, combined with “lax corporate governance in the oil patch”, as a 2020 Reuters article describes, was a warning sign that the shale business was broken — and actively misleading investors.
Dennis, it’s a Ponzi scheme. The liars are looking for greater fools. And it’s all about to come crashing down around their necks, and very soon. And you are talking about what is going to happen between 2029 and 2043. Well, if there are enough “Greater Fools” out there and there are enough “Liar Loans” to keep those fools afloat then…. Nope, even things will still collapse.
Ron,
I read all of the articles at the link. The point is that for the Permian basin, no loans will be needed. The poorly run companies can go bankrupt and the well run companies (EOG, Pioneer, Chevron, XOM, etc) will buy up the best assets at firesale prices. Going forward, no new loans will be needed, operations and new wells will be financed from cash flow, that is what the model represents. Chart below has debt level from 2019 to 2026 when debt is fully paid. Note that if many of the companies go bankrupt and debt is written off, then the debt is reduced more quickly than this model where all Permian debt is paid back.
As Rons link quoted-
“US energy indep. will have to come from renewables.”
And it will. Sooner or later, that’s all we will have.
And we will come to find that the USA has a tremendous reserve.
More on that soon.
LIGHTSOUT
Thanks for the link. I have added it to my post so viewers don’t miss it.
Putting things in perspective. Below is the Baker Hughes oil rig count since they started counting in July 1987.
The Baker Hughes oil rig count since the shale boom started in 2009.
The Baker Hughes oil rig count since the latest peak in November 2018.
US Horizontal oil rig count (the count that is most relevant for tight oil production) from Jan 2016 to the present. The peak for US tight oil production was November 2019.
Frac spread count is even more important for tight oil output. Data from link below
https://www.aogr.com/web-exclusives/us-frac-spread-count/2021
We are currently at roughly 67% of the February 2020 frac spread level for 4 week centered average (320 vs 213, 213/320=0.666).
Frac spread count trend since minimum for week ending May 15, 2020 (45), currently the frac spread count (week ending April 23, 2021) is 217.
By The Moscow Times: Russia may have passed peak oil output
In the scenario labeled most probable, the Energy Ministry predicts Russia’s oil output will grow over the rest of the decade — but fail to hit the record output of 2019, with production hitting a post-coronavirus peak of 11.1 million barrels a day in 2029 before decreasing to 9.4 million barrels a day by 2035.
SNIP
The Energy Ministry strategy outlines that government tax cuts to high-potential oil fields, such as those in the Arctic region, will be crucial in helping the country maximize the potential of the vast energy resources it still sits on.
The Energy Ministry is fully aware of the steep decline of their giant fields in Western Siberia and the Urals. The Minister believes huge tax breaks will come from the government and then the Artic will give up its bounty of oil, keeping Russian oil on a plateau for almost another decade. At least that’s what they are hoping for.
Hi Ron,
If we focus on 12 month average output for Russia, the peak year was 2019 at 11.2 Mb/d, for 2018 the annual average was 11.1 Mb/d, so if the Russian oil ministry is forecasting an annual output of 11.1 Mb/d in 2029, that would be similar to the 2018 average output when the World was at its peak (to date), and yes the previous peak would not be reached if the forecast is accurate.
I use Russian data for thousands of tonnes and assume 7.3 barrels per tonne giving an estimate of 11205 kb/d for 560.257 million tonnes of oil output in 2019.
Ron,
When did the steep decline begin in Russia’s giant fields? Not apparent when we look at Russian output from 2015 to start of pandemic.
On a zero scale chart, output is pretty flat from 2015 to 2019, about a 5% increase in output over 4 years or about a 1.23% annual rate of increase. I contend that Russian output will continue at roughly the 2018 level of output from 2023 to 2029 (556 million tonnes /- 1.5%) followed by gradual decline (maybe 1 to 2% per year) over the 2030 to 2035 period.
It began in 2019. The decline will likely be even more than 4% as depicted below.
As you can see in the chart below the brownfields go from about 9.3 million barrels per day in 2018 to 6 million barrels per day in 2030. That works out to be about 3.5% per year. Also in this chart, the decline began in 2019.
Dennis, I did a little math after eyeballing the above chart. in 2018 and 2019 brownfields accounted for about 80% of total Russian production. The rest comes from condensate and the Eastern Siberian Arctic. Since much of the condensate also comes from the brownfields, Russia is facing a disaster. It is really wishing for a miracle to expect that their Arctic production can be ramped up to replace the swift decline of 80% of their production.
Hi Ron,
We will see, the Oxford study was done in 2015, the recent report may have a more accurate assessment. which basically says flat output from 2018 to 2029. That assessment is the basis for my guess.
That assessment was made by the Russian Minister of Energy. That has about the same chance of being accurate as the EIA’s projection for US shale oil production. About as much chance as a snowball has in hell. 😉
A new thread April’s EIA Oil Growth projection has been posted.
http://peakoilbarrel.com/aprils-eia-oil-growth-projections/
A new open thread Non-Petroleum has been posted.
http://peakoilbarrel.com/open-thread-non-petroleum-april-25-2021/