Weekly oil shipments by rail can be found on the web at Weekly Carload Reports. And a summation of that data with charts can be found at Association of American Railroads Freight Rail Traffic Data.
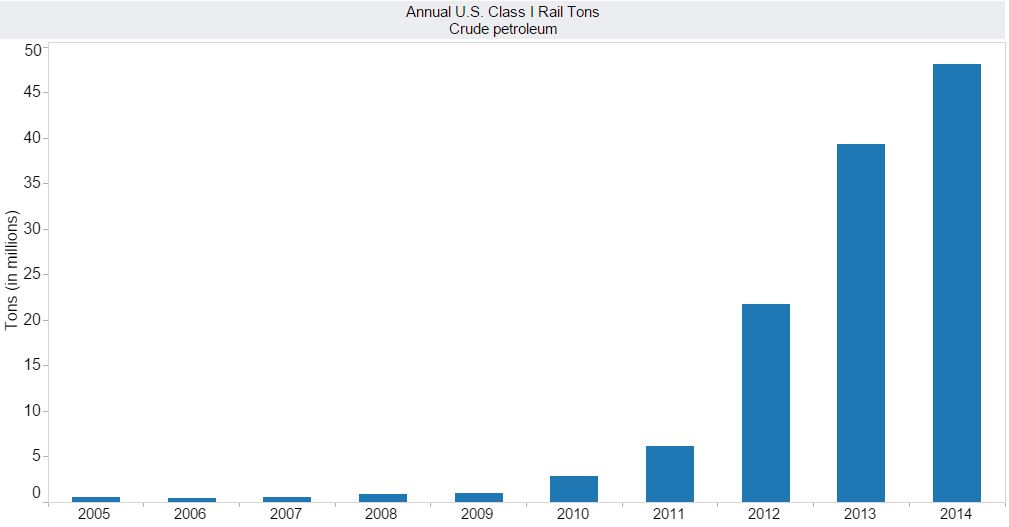
Crude oil by rail basically started with the shale boom. Prior to that almost all oil was shipped by pipeline. Of course a lot of oil was trucked to the pipelines. The EIA says in the first seven months of 2014 8 percent of all us crude and refined products was shipped by rail. It looks like that percentage was increased somewhat in the second half of 2014.
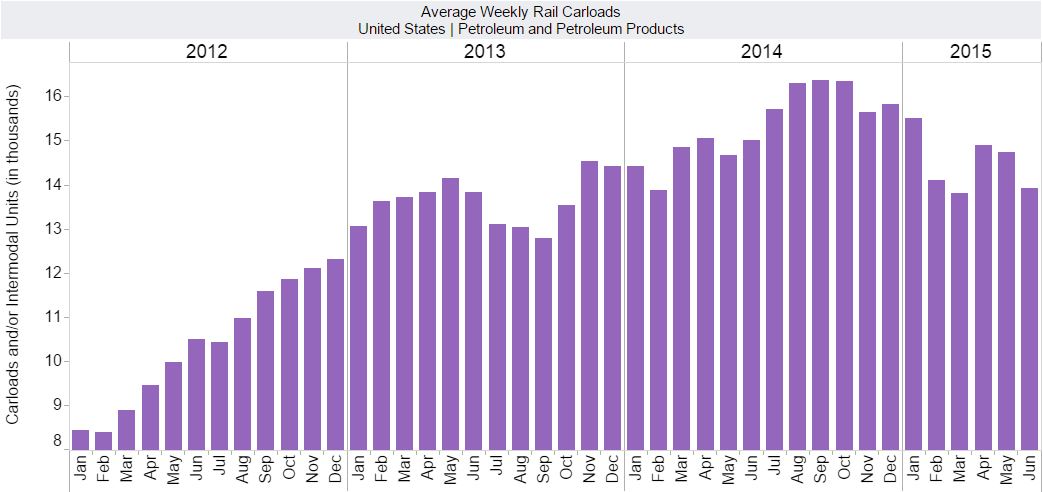
Oil by rail, for the entire USA, peaked in August, September and October of 2014 and has declined since.
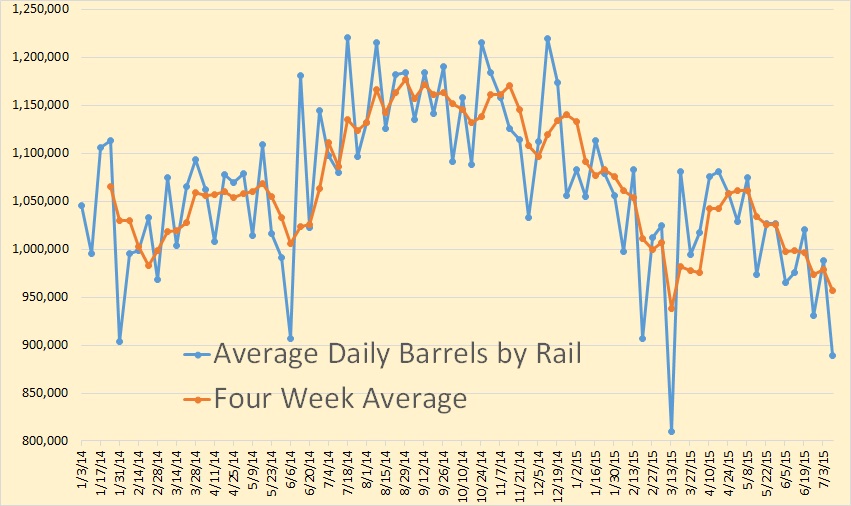
I have converted the weekly carloads to daily then converted carloads to barrels. There are about 700 barrels per carload. That gives us the average barrels per day by rail.
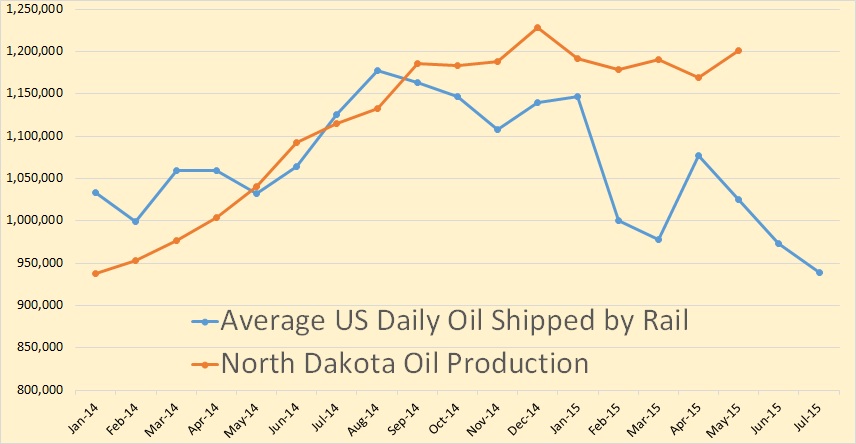
I have converted the weekly “daily average” to monthly “daily average” and plotted it against the North Dakota production. The EIA says: Between 60% and 70% of the more than 1 million barrels per day of oil produced in the state has been transported to refineries by rail each month in the first half of 2014, according to the North Dakota Pipeline Authority.
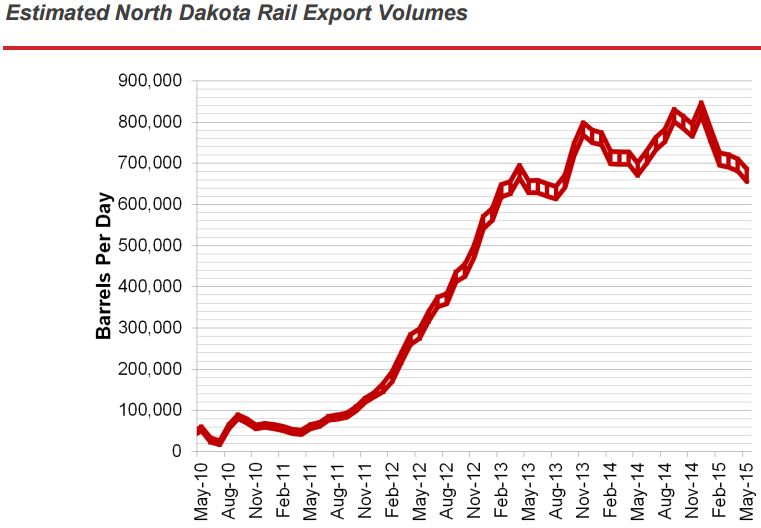
As we can see from this chart the volume of oil shipped by rail changes from month to month. The chart is barrels per day per month. The peak, for North Dakota, is December 2014. Oil by rail for the USA peaked about three months earlier.
Also the percentage of oil shipped by rail drops as production drop. This is because the pipelines are usually at max capacity so as production drops rail traffic takes the blunt of the decline.
The following is Art Berman’s take on the matter.
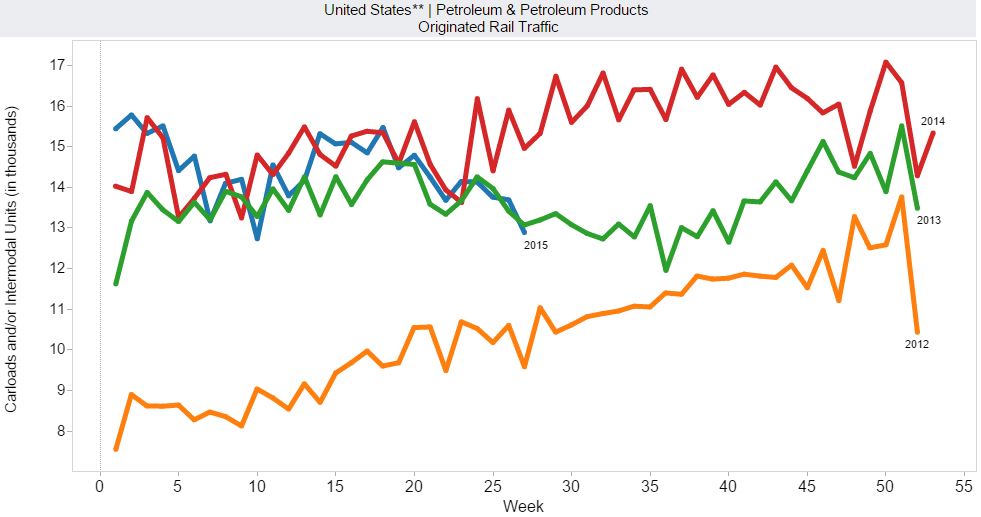
- The AAR data is for Petroleum & Petroleum Products whereas EIA data is for crude oil.
- The AAR data goes through June whereas EIA data only includes April.
- AAR data is in carloads or international units (whatever international units is) whereas EIA data is in barrels.
__________________________________________________________
Note: If you would like to receive an email notice when I publish a new post, then email me at DarwinianOne at gmail.com .
608 responses to “Oil Shipments by Rail Declining”
Remarkable story out of Delaware about the Delaware City refinery now owned by PBF Energy. This used to be Getty then Texaco then Motiva then Valero.
This refinery was close to being mothballed but the new owners made a switch to getting most of their feedstock via rail and now they are booming.
However, the train traffic is insane. These trains are 90-100 cars each and I think the DCR gets 2 per day now. I am in awe of how well they have mastered the logistics of moving and unloading these trains.
Still, there are many other issues.
http://www.delawareonline.com/story/news/local/2015/05/01/delaware-rail-crude/26711265/
Those big trains are unit trains, only carry one product. They offer cost advantages of scale over mixed freight. The mainline near me runs about 25 trains per day, I have seen trains with 200 cars.
Although pipeline operating costs run at about 1/3 the cost of rail, rail transport can come on line much more quickly and it is far easier to get regulatory approval for transport. It costs about $3 a barrel more to transport oil by rail than pipeline from the Bakken region.
If a forty two gallon barrel yields thirty gallons of salable liquids that is only about ten cents a gallon difference. This small amount will obviously add up over time but it is not enough to make or break the business of selling gasoline and diesel.
Plus the rail lines , the tracks and equipment, are going to be kept up better due to having enough traffic and revenue to justify the upkeep. I can see rail taking more and more business over the very long haul from pipelines as the amount of oil available to be sold declines and thus building and maintaining pipelines becomes uneconomic. Railroads are multipurpose transportation.
A LOT of gasoline and diesel fuel in my part of the country is hauled quite a long way from the closest tank farms to retailers. If / when rail comes back strong as expected some of this truck traffic can be switched to rail and the truck routes can be shortened substantially. I don’t see any reason why delivery trucks can’t be loaded directly from a rail tanker, other than petty bureaucratic rules.
Since the shale oil boom will be fairly short lived it doesn’t make economic sense to build large pipelines. Building pipelines to take a portion of the peak production would probably make better economic sense. The pipeline will be kept filled and the railroad will get the variable trade.
The Baker Hughes Rig Count is out. The decline in oil rigs picked up again this week. Oil rigs declined by 7, gas rigs up 1. Eagle Ford down 4, Williston down 2, Permian up 3.
Re the rig count, late in last Ronpost comment thread:
Semi curious question:
There is talk of time constraints on getting wells completed lest, I guess, there are fines.
But there is also talk about not just cheaper but more efficient drilling that is getting more than expected numbers of holes drilled with a declining number of rigs.
I am suspicious of technological miracles that arrive at just the right time. And so:
Question: Is there some tiered layout of development timing requirements. Like so many days after lease signature that you must drill a hole and then on top of that another requirement for oil flow so many days after that.
Meaning, these increased numbers of holes drilled with fewer rigs . . . because companies have gotten efficient . . . is there a definition of “hole” in play? Can they satisfy tier 1 requirement with a 200 foot hole, and call the remaining 1.5 miles “completion”? Versus 2 years ago drilling the hole meant the entire 30 stage length.
Watcher,
As I understand things, the oil company signs a lease with the mineral rights holder.
Within that contract will have a term in which the oil company must drill and produce oil on the first well of that lease to convert it into “Held by production”. The term usually ranges from 3 to 5 years.
On the other hand, the ND govt says that once the oil company drills a well, it has 12 months to complete it. Or penalties apply. Not sure if the 12 months starts at spud or total depth, but I would guess the spud date would the one.
Helms has stated that it is possible to extend this another year, with the correct paper work, and no doubt fees.
Good man. You do see the mechanism I am speculating on. There is an avalanche of absurd stories of total wells drilled seeing no particular decline as drill rig count falls. If you change the definition of well, you can do that.
The vertical rig count is up again by 2 to 123, 24 more than the low point of 99. Horizontal wells are at low point of 650 after dropping another 4. The Lowest since Jan 2010. Any increase in the oil rig that has taken place in the last month has been in vertical wells, not horizontal.
It sounds like conventional oil to me rather than a come back in the shales? Shallow, Mike are you drill a few wells on the quiet?
Toolpush. No. We will wait till price recovers. Everything is HBP.
I don’t have a rig running at the moment, Push. Still on track for 4th quarter. I am, however, thinking of shutting all my production down for a day to throw worldwide oil markets into a panic, kind of a symbolic protest if you will, and I have advised my receptionist to accept calls from anyone with funny accents claiming to represent OPEC. I’ll get back with you on how that goes.
We think down here that BH has the rig count in the EF much higher than it actually is. I have never seen in a half century the number of rigs cold stacked, not even in the early 80’s. Little blips in rig counts are, as you know, not very meaningful, IMO. Conventional/vertical guys I believe are just trying to time the bottom and there are HBP issues, replacement wells, flood maintenance wells and all that to be drilled. Some of those vertical rigs may actually be setting surface casing for shale wells, but permit applications are way down, as someone as already suggested.
Forrest had crap EF acreage and Sabine’s demise is of no surprise. There is more of those coming very soon. Penn Virginia is next on the merger list but the issue I have with mergers are willing buyers, with willing funders. Buyers are going to have to be very strong. For those that did not see this, as I have said many times, the shale oil industry has not made a nickel yet:
https://btuanalytics.com/will-outside-capital-continue-to-prop-up-oil-and-gas-activity/
Mike
Shallow/Mike,
I didn’t expect you fellas to be drilling, just seeing ig if you were awake, smiles.
I realize little blips don’t mean too much, but it annoys me when the MSN catches onto the little blips eg “oil rig going up”, and miss the point that it is in the “low productive” rigs, that are on the increase, and their fabled “high productive” horizontals, read shales, are actually still on the decline.
I really get the impression that a lot of people want to tell a story, and they are not too interested in the facts!
I agree, Push. The domestic oil industry here in the US, especially the shale oil industry, has become like fantasy football to many.
By the way, I drove 2 hours to watch Olympus being towed to sea; man that mama jama was huge!! Too big to keep leashed, I guess, tee hee. What a nightmare that is.
Mike
Here are the Olympus, Lucius, Big Foot, and Jack/St Malo hulls in Kiewit a few years ago.”
Mike-
In an earlier post, I mentioned the failed debt raise by Swift Energy. I think we are at the point where the spigot is turning off for these shale guys. If these guys couldn’t raise senior first lien debt to replace their credit lines, that tells me that the bond world has woken up to the fact that many of these assets are worth close to zero at current prices and probably at much higher prices as well. I will be interested to see what happens in bankruptcy. I think the banks and bond investors will be shocked when they see what the assets are really worth. The banks and bondholders have been relying on Ponzi financing hoping that they will be taken out by a greater fool as the assets will never be able to pay back the debt through production and cash flow. The Swift debacle tells me that the music has stopped.
Ron or others,
The BH rig count for Utica is 22 an increase of 1 from the prior week. However, I recall that the count from the July EIA Drilling Productivity Report was only 11 for June in Utica. This was a sharply declining rig count from prior months: May 13, Apr 14, Mar 18, Feb 21, Jan 26 rigs. Did they actually double the rig count in Utica since the last DPR or is there a screwy inconsistency in what is being counted?
Don, you can pay no attention to the Drilling Productivity Report for the last four or five months of that report. Everything after March for production, rigs and decline rate are totally a guess. The Baker Hughes report has the correct data for rig count and pay no attention to what the DPR says for July for rigs or production.
Note: The data for the chart below for the “NDIC Bakken” is for the entire Bakken, North Dakota and Montana. The data I have labeled “NDIC Bakken” below is for all North Dakota.
Thanks for the reply Ron. This is mind boggling. I went back to the EIA DPR and they said in the footnotes, “3. The monthly average rig count used in this report is calculated from weekly data on total oil and gas rigs reported by Baker Hughes.” The BH data for June was out far before the release of the July DPR. This is just simple minded incompetence. There is no reason for them to be guessing. They should just do what they are claiming to be doing in the footnotes.
In the past I have tried to explain why there is opposition in Nebraska from a group of farmers/ranchers who don’t want the Keystone pipeline to run on their property. This is why.
They believe with pipelines come damaging leaks and they don’t want those leaks on their property.
Pipeline Spill In The Heart Of Canada's Tar Sands Industry Leaks 1.3 Million Gallons Of Oily Emulsion
That is a doubled casing line with leak detection – built a year ago. State of the art leak!
Interesting mention on last post of Swift Energy. Company around since 1979. Looks like they are in trouble. Stock below $1, bond issue failed.
Looks like they got burned in EFS. Anyone know what caused their downfall? Looks like at end of 2014 long term debt of $1 billion, standard measure PV10 $1.6 billion. I’ve seen worse.
Yes, borrowing money to drill shale wells that were not economic at 90 dollar oil, then having prices fall to 45 dollar oil. That will do it every time.
Another long term company that bit the dust was Forest Oil Corporation. They were bought recently by Sabine, who just declared bankruptcy.
Forest was incorporated in 1916 and pioneered waterflooding. We operate some acreage they first flooded around WW2.
How many drill permits did Sabine and Forest have pending?
Don’t know that. Had $2.5 billion of assets and $2.9 billion of debts. Largest oil BK thus far. Mistake appears to be agreeing to buy Forest in March 2014, who had high debt, and then price tanking of course. Bank cut borrowing base, they could not refinance debt, so BK. Read story on fuel fix, which says they have over 1000 well sites, not sure if that means wells or drilling locations.
Bank cut borrowing base
Reserves impairment. haha
Relevant: http://seekingalpha.com/article/3334955-eia-global-supply-demand-forecast-overestimates-production
Back to CHK.
From what I saw on 2014 10K, standard measure PV 10 all categories $17.1 billion.
From 2015 Q1 10Q long term debt at $10.6 billion.
Notice any similarities between ratios for CHK and Swift Energy?
shallow sand,
Considering cash and ST debt, CHK net debt was $8563 mn at the end of 1Q15 vs. $7389 mn in Dec 2014
AlexS. True. I note the 90 day cash burn you mention. Also, net debt is a valid metric, but most of these companies are spending the cash drilling and have no intention of using it to pay down debt principal.
Interesting to look at Chesapeake debt to PV10. Numbers are year end. PV10 is standard measure, effect of income taxes included.
2013. Long term debt. $12.88 billion. PV10. $17.3 billion.
2012. Long term debt. $12.16 billion. PV10. $14.66 billion.
2011. Long term debt. $10.63 billion. PV10 $15.63 billion.
2010. Long term debt. $12.64 billion. PV10 $13.18 billion.
2009. Long term debt. $12.30 billion. PV10 $8.20 billion.
2009, of course, had very low oil and natural gas prices utilized in calculating PV10.
Chesapeake is more gas weighted, and gas has been low for the most part since 2008.
I will say they are a much more complicated company than Continental Resources. Many transactions. Many drilling partnerships and other transactions. They had the Founders Well Participation program, where former CEO received a carried interest on every well drilled.
I note they recently lost about 250K acres and production via a short sale with private equity funding partner. Have read that will cause a $1 billion hit to PV10, but it released them from some major drilling commitments that are presently underwater.
Went back and looked at year end 2002. Long term debt $1.7 billion. PV10. $3.7 billion. They have and will have considerable debt for a long time.
Redundant statement warning. Without all the debt, US shale oil and gas booms never happen. As Mike always says, they have not paid for themselves.
If anyone can suggest a shale oil or gas company that does not have significant debt, that has been able to grow primarily through cash flow, please point the company out and I will look at 10K.
SS: “please point the company out and I will look at 10K”
Could you do for Crescent Point, please? 🙂
In your opinion what their “palm reading” says? 🙂
I’ll look but I have trouble with non US based companies. Haven’t looked at their reports, so I will try when get a chance.
Ves. As I said, not as familiar with Canadian reporting, but on their website I looked at 2014 year end. In Canadian $$, looks like 12/31/14 PV10 for proved all categories was $8,891,498,000
12/31/14 Long term debt. $2,943,074,000
12/31/13 Long term debt. $1,734,114,000
Debt numbers also in Canadian $$, it is based in Canada after all.
Absolutely nothing magic about company info I am pointing out here or elsewhere. It is all public information.
Just pointing out because PV10 has been a common way to value oil and gas reserves. Understand PV10 can be flawed, oil and gas prices utilized make a big difference. Assume data on expenses and production is accurate, companies have liability there.
Also, understand point about net debt, but I do not see companies paying down debt with cash. They are also cash flow negative so not building cash balances. So I just have been looking at long term debt.
I see so many different charts used and metrics used to describe oil company profitability. I readily admit I cannot understand many of them.
I just try to keep it simple and look at long term debt to PV10 and look at whether the company is cash flow positive or negative.
Not giving any investment advice, definitely not one to listen to about stocks or bonds. I’m not good at that.
Just trying to get a sense of shale boom, whether it has been profitable and what will happen to it given it partially brought on much lower oil and natural gas prices.
Due to investment in conventional working interests, have a reason to follow this stuff. Also find it interesting that there is little to no mention of PV10, let alone long term debt to PV10 ratio. After all, valuation of reserves is how banks value company assets for collateral purposes. Also how bank regulators grade loans to upstream companies.
Given the capital intensive nature of oil and gas extraction, think it deserves more attention. Looks like companies will take a hit similar to 2007 to 2008, will be cut in half. However quick rebound appears less likely.
Thanks Shallow.
It is the same story everywhere. So called growth fuelled by Mastercard. The word on street was that they were buying left and right in the oil patch in the last 2 years. There is no secret to that when I talk to oil truck drivers and that they are even “deeply concern” about their extending itself by buying with debt. When even people who don’t know inside-out about the numbers know that something is not right than it is time for reflection. Anyway, was last weekend at oil patch golf gathering, situation in one word: Bleak. Half of the people laid off and layoffs started in other indirect business. So honestly I don’t know where and why these 90 odd rigs in Canada are drilling for. and 640 in US that is even bigger mystery.
Ves Wrote:
“So called growth fuelled by Mastercard.”
LOL! Awsome summariation and perfect assement!
As Mastercard Advertisements alwasy end with the word “Priceless”
Greetings
Now that we have Ron, CrisNelder, and ASPO on record for a 2015 peak, I wonder if someone can help me on decline rates. I’ve seen estimates of 5 – 8%, but Dennis uses a much lower number in his modelling. Can someone help me out?
Thanks
Walter
Geeezus Walter, ain’t that asking a lot? Picking the year is not enough? 😉 Where did you see those estimates of 5 to 8 percent? I would like to have a look at them myself.
Actually I am guessing about 1 million barrels per day by the end of 2016, that’s just over 1 percent. Then I think it will pick up a bit in 2017 and 2018 to 2 to 3 percent. Then there is just no telling what will happen after that. Things might get pretty bad.
Thanks Ron
I doubt I’ve seen anything that would be news to you. I can see that near the peak, wells that are increasing would counterbalance declining wells, so the total decline rate would low. But it seems that as more and more wells went past peak, the total decline rate should increase.
Here’s an interesting paper from 2009, I think.
http://www.postpeakliving.com/files/shared/Hook-GOF_decline_Article.pdf
Land based fields which plateaued in the 1960’s declined at -4.2%, in each succeeding decade the decline rate increased, and by the 2000’s the rate was -10.7%.. see Table 4 The off shore fields were even more dramatic. see Table 5
see also http://surfthepeak.blogspot.com/2015/02/trouble-with-curve.html
(my blog)
Chris nelder uses 5% here: http://www.smartplanet.com/blog/the-take/peak-oil-isnt-dead-it-just-smells-that-way/
“The IEA’s World Energy Outlook 2008 included, for the first time, a study of the depletion rates of the world’s top 800 oil fields. It found rates of 6.7% for past-peak fields, increasing to 8.6% by 2030 (the end date of the report’s “reference scenario”). Averaged across all fields, the rate is 5.1%. Against such high decline rates-up from a generally accepted 4.5% estimate only a few years ago–the agency calculates that the world would need to add a whopping 64 million barrels per day (mbpd) of new capacitybetween 2007 and 2030 in order to meet an anticipated demand growing at 1.6% per year. That’s like adding six new Saudi Arabias.”
from
http://peak-oil.org/peak-oil-reference/peak-oil-data/oil-depletion/
Thanks
Walter
Thanks. Very interesting links. The paper by Höök I have seen before and it contains some really good information. I agree that it seems as if the production curve will be more cliff like. See for example the new big oil field johan Sverdrup in Norway. With a planned production of about 600.000 barrels of oil equivalents per day the yearly depletion rate will be nearly 10%. Smaller oil fields have even higher numbers. It looks like the smaller the oil field, the higher the depletion rate. As we find less oil every year, I just can´t see how Dennis Coyne´s model with 1-2% decline rates will come true. Perhaps we can keep up the production for many more years by using more and more energy for extraction. But that will only make the cliff steeper when it happens.
“I just can´t see how Dennis Coyne´s model with 1-2% decline rates will come true.” You’re forgetting something quite important. Dennis lives in Fantasy Land. 🙂
Haha ok. But it´s allways good to hear other people’s opinions, even if you do not agree with them.
Dennis Coyne doesn’t model anything. Scientific modeling involves developing physical, conceptual, or computer-based representations of systems. Dennis just picks his favorite URR and makes a graph.
Hi Futilitist,
Try reading up on the oil shock model. I use oil discovery data from Jean Laherrere, oil production data and estimates of URR from Jean Laherrere, the USGS, and Hubbert Linearization, my best estimate is essentially the average of the HL estimate and the USGS estimate.
The graph is based on assumed future extraction rates, I use past extraction rates as a guide.
As I do not know what future oil prices will be I cannot predict future ROI. The implicit assumption of the model is that market forces will adjust the oil price so that in the long run oil production will be profitable.
If we assume that oil production will not be profitable at any oil price and any level of production, then clearly oil output will fall to zero.
You think that the assumption of oil production not being profitable long term is reasonable, I do not.
As Mike has said ROI is everything, I agree.
He has not said that he thinks ROI will be negative permanantly and he would not be in the oil business if he believed so. Though I will let Mike speak for himself, as all he has said is that ROI is the most important thing.
If Mike would just tell me what future oil prices will be, I might be able to figure out ROI. It would be rather difficult for the World as a whole, so the model (which is based on the work of Paul Pukite and Jean Laherrere) is far from perfect.
Hi Dennis.
“The graph is based on assumed future extraction rates, I use past extraction rates as a guide.”
So you admit that your “model” is really just an extrapolation of past extraction rates. Okay. But that is not very scientific at all. It certainly doesn’t rise to the level where your graph could be called a model of anything.
“As I do not know what future oil prices will be I cannot predict future ROI.”
Okay, here is where your so called “model” really falls apart. You blindly extrapolate the best estimates of historical extraction rates to estimate future extraction rates. Then you turn around and intentionally ignore exact historical oil prices and refuse to use them to estimate future prices. Why? It makes no sense.
Extraction rates have always been tied to oil prices. A large percentage of current oil production is not economically feasible at the current price. We certainly know that extraction costs are not falling. So, logically, oil prices must rise very significantly to allow your future extraction rate estimate to be even remotely possible.
What happens if you extrapolate rising historical oil prices along with historical extraction rates?
Please make a graph showing this. If you do, you will immediately see the problem. It will be very obvious to everyone.
In order to justify your future extraction rate estimate, future oil prices would have to be so high that they could obviously never be supported by the economy.
In 2008, oil prices collapsed when they briefly spiked close to $150/barrel. Only with extensive bailouts, QE1, QE2, ZIRP, and NIRP were oil prices were able to recover to around $126/barrel. Even with an additional QE and operation twist, by 2014 oil prices had weakened to around $105/barrel. Then, suddenly, they collapsed again to reach today’s price of around $56.50/barrel. So we have a pretty good idea of what maximum oil price the economy is currently capable of supporting. How will the future economy be able to support prices in excess of $200/barrel?! If that is not possible, then your silly extraction rate extrapolation is also impossible.
The basic concept of peak oil theory is that oil prices will eventually rise until they can no longer be afforded. Your “model” completely violates this basic, common sense notion. You have some serious explaining to do there, Dennis.
“As Mike has said ROI is everything, I agree.
He has not said that he thinks ROI will be negative permanantly and he would not be in the oil business if he believed so.”
Wow, Dennis, that is very tacky. Is that the best answer you can come up with? If I think that ROI will remain negative, I am not insulting Mike’s honor or intelligence in any way. This is between you and me. You have to justify your “model” on it’s own merits (or total lack thereof). I don’t think Mike would defend your silly “model” anyway.
Please don’t continue further with this cheap line of unreasoning in your next answer to me. I brought up some very obvious weaknesses in your “model” for you to address. Please concentrate on those points instead of trying to pointlessly bring other people into the discussion.
It’s your stupid “model”. Defend it yourself.
“The implicit assumption of the model is that market forces will adjust the oil price so that in the long run oil production will be profitable.”
How could that ever happen? Your implicit assumption is clearly false. Oil affordability must be essentially infinite in order for your implicit assumption to be true. Therefore, your so called “model” stands in open denial of the most basic precepts of peak oil theory and the laws of thermodynamics. You should just admit you are wrong. That is what a good scientist would do when faced with such basic problems with a hypothesis. I’ll bet it doesn’t stop you, though.
Relax Futilitist, we know no model will be perfect.
Perhaps you should construct your own model?
Hi Futilitist,
Extractionrates tend to follow economic activity more than oil price. In fact oil price doesn’t help predict much of anything. I have actually looked at oil consumption vs oil price and there is little correlation.
My models do not have extraction rates increasing forever, they level off or decline.
The oil price does not predict much of anything it is determined by supply and demand which have too many variables to predict the future oil price.
The oil price has never been infinite and I have never proposed that it will be.
You should read some introductory economics. This is very basic microeconomics. Do a search on perfectly competitive markets and read up so you can ask intelligent questions.
On thermodymamics, the price of oil is not related directly to thermodynamics. Energy can flow from coal, natural gas, nuclear, hydro, solar, wind, and geothermal to the oil industry. A single industry is not isolated thermodynamically from the rest of the economic system. The net energy of the entire economy must be analyzed for a sensible analysis.
Hi Futilitist,
Extraction rates tend to follow economic activity more than oil price. In fact oil price doesn’t help predict much of anything. I have actually looked at oil consumption vs oil price and there is little correlation.
My models do not have extraction rates increasing forever, they level off or decline.
The oil price does not predict much of anything it is determined by supply and demand which have too many variables to predict the future oil price.
The oil price has never been infinite and I have never proposed that it will be.
You should read some introductory economics. This is very basic microeconomics. Do a search on perfectly competitive markets and read up so you can ask intelligent questions.
On thermodymamics, the price of oil is not related directly to thermodynamics. Energy can flow from coal, natural gas, nuclear, hydro, solar, wind, and geothermal to the oil industry. A single industry is not isolated thermodynamically from the rest of the economic system. The net energy of the entire economy must be analyzed for a sensible analysis.
Peak oil theory says oil output will peak and decline. As the supply becomes smaller price will go up to the point that it can be afforded. When it can rise no further the amount will be supplied that is profitable.
I think we actually agree on that.
Your starting premise that extraction rates are tied to oil prices is wrong, extraction rates are determined by GDP and its effect on the supply and demand for oil.
The extraction is influenced by producing reserves and the quantity of oil that will balance supply and demand.
Read up on the oil shock model.
http://oilpeakclimate.blogspot.com/2015/02/the-oil-shock-model-with-dispersive.html
or try
http://www.theoildrum.com/node/2376
“…extraction rates are determined by GDP and its effect on the supply and demand for oil.”
Earlier, you said that the most important thing was ROI.
So what determines GDP? Does it have anything to do with the physics of energy?
Hi Futilitist,
For oil demand, GDP is most important. For oil supply the profitability (annualized ROI) is the most important metric. The two interact through supply and demand to determine the oil price. There are complex feedbacks in the economic system.
Yes physics influences everything, but EROEI is not the sole determinant of oil price and it is not very well measured. One can claim that it is decreasing, but we do not have good data on the EROEI of the oil industry and how it has changed over time.
A more important metric for the oil industry is the cost to produce the oil and the revenue generated by selling the oil (determined by output and price). Then we can determine profitability. If it is profitable to produce the oil, it will be produced, even if the oil produced has an EROEI of 1.
As long as the net energy produced by society from all sources of energy is sufficient to keep the economy functioning there is not a problem.
As energy resources become constrained, prices will rise and less energy will be used and what is used will be used more efficiently. There are huge resources of wind, solar, and nuclear energy that can be tapped as prices of fossil fuel energy rise and alternative forms of energy become more competitive.
The transition will be difficult, but not impossible
Nice cut and paste belief statement. You have said exactly the same thing about a thousand times. It is like a mantra.
You cannot see the forest for the trees, Dennis.
Have you ever heard of the Maximum Power Principle?
“That theory, as it is expressed by the maximum power principle, addresses the empirical question of why systems of any type or size organize themselves into the patterns observed. Such a question assumes that physical laws govern system function. It does not assume, for example, that the system comprising economic production is driven by consumers; rather that the whole cycle of production-consumption is structured and driven by physical laws.”
~Howard T. Odem
Hi Futilitist,
The oil shock model is a physical model based on the discovery of oil, the time it takes to develop the average oil discovery, the physical production of oil to date, and then reasonable projections of future extraction rates based on history.
I do not project very high oil prices, I think price will increase as supply becomes tight and the amount produced will decrease as prices rise due to less demand.
If prices rise gradually to $110/b a lot of oil could be produced, the World economy operated with oil prices around $110/b from 2011 to 2013. As output from LTO plays in the US decreases due to low oil prices, oil price will rise by 2016 to 2017 to $100/b. If peak oil occurs in 2017 or 2018, oil prices may rise to $130/b, but this is likely to slow economic growth which might reduce oil prices. The future extraction rates could decrease, increase, or remain the same, several scenarios have been presented.
You seem to think that oil prices are determined by net energy. If that were true, why did oil prices increase from 2002 to 2008, drop sharply, then rise, plateau(2011-2013) and then fall in 2014.
Was this due to changes in the net energy of the marginal barrel of oil or was it because of changes in demand and supply in the oil market?
I assert that the latter explanation is best, I do not think net energy is a useful concept for the oil market.
Most oil professionals (Fernando, Mike, Shallow Sand, and Rune Likvern) would likely agree with me.
“If that were true, why did oil prices increase from 2002 to 2008, drop sharply, then rise, plateau(2011-2013) and then fall in 2014.
Was this due to changes in the net energy of the marginal barrel of oil or was it because of changes in demand and supply in the oil market?”
Take a step back. The price curve of oil is noisy, but it is not random. If you followed the yearly average oil price, it would show a smooth, exponential rise from 1960-2014. That doesn’t seem quite so random, does it? How do you explain such a consistent rising price pattern if the price was only due to changes in supply and demand? Why did such a longstanding rising pattern change so suddenly after June of 2014? Could it be that the maximum price had been reached and could no longer be sustained by the economy? Is there a maximum possible sustainable oil price? If supply and demand don’t determine the maximum possible sustainable oil price, what does? (Hint–now we are back to the physics of energy)
“Most oil professionals (Fernando, Mike, Shallow Sand, and Rune Likvern) would likely agree with me.”
Yet I’ll bet they won’t defend your “model”.
Hi Futilitist,
No one needs to defend the model, I have not seen many reasonable objections. Most people think it is too complicated to be bothered with, which is why I attempted to simplify so people could raise reasonable objections.
Clearly physics applies, but the physics needs to be done properly. When applying entropy to a system the boundries are important and all energy flows must be accounted for. Net energy concepts must be applied to all forms of energy in the economy, not only oil. Net energy applied to a single energy industry is a flawed thermodynamic analysis.
Here are Real Oil Prices (using CPI data from the Bureau of Labor Statistics and Oil Price Data from BP Statistical Review of World Energy) from 1920 to 2014.
Bullshit. The old adjusting for inflation ploy. The raw oil prices are far more real than prices adjusted using the CPI. Adjusting for inflation is not proper. It is redundant and the CPI is hardly a real measure of anything. You are intentionally distorting the only real data we have. If you look at raw prices, a definite pattern becomes visible. Adjusting for inflation conveniently obscures this. Peak oil deniers have been using this stupid (trick) argument for years.
I have brought up several reasonable objections to your model. You are simply ignoring them.
You object to the application of any physics or physics principles on the grounds that it is hard to do with absolute perfection since the system is so complex. But that is what models are for: To simplify the problem enough to get some useful information. Your model disregards any physics at all. It pretty much disregards common sense.
You can’t even tell that you are losing the argument. I almost feel sorry for you.
Some questions for anyone reading this:
1. Do you think that Dennis’ Oil Shock Model has any validity?
2. Do you think that Dennis has satisfactorily answered my objections to his “model”?
3. Do you think I am being mean to Dennis?
Futilitist, you are badgering Dennis.
Give it a rest! Okay?
Hi Futilitist,
You can claim that I am losing the argument, I disagree. Adjusting for inflation makes sense, not doing so is contrary to mainstream economic thinking.
Yes physics matters, but if you do not do it correctly you can get nonsense.
The boundries of the system are important when doing a thermodynamic analysis.
Future oil prices and the profitability of the oil industry are difficult to predict.
I try to model what has happened to World oil output from 1870 to 2014 based on discovery data, output data, reserve growth, and estimates of 2P reserves through 2010.
What extraction rates will be after 2014 is unknown and I have presented different scenarios for future extraction rates from producing reserves (which peak in 2006 and then decline). The URR for C+C output is also unknown and I have presented different scenarios for different levels of C+C URR (3100 Gb to 3700 GB).
Jean Laherrere’s most recent estimate is 2700 Gb for World C+C URR.
I believe that over time oil prices will rise, you believe they will fall. Time will tell who is correct.
Hi Futilitist,
Graph below shows extraction rate vs real oil price (2014$) from 1960 to 2014. The correlation is very low, R squared is 0.12.
The extraction rate averaged 6% from 1982 to 2014.
We could easily do a model with extraction rates at 6%, but the trend from 2009 to 2014 was an increase in extraction rates of 0.08% per year.
Hi Dennis,
I don’t care about extraction rates and you don’t have a model to explain them anyway.
Please plot the average annual oil price trajectory from 1960-2014. Explain how this pattern could be due only to supply and demand. It seems like it might have something to do with the declining EROEI of a barrel of oil over that time period, doesn’t it?
Thus, the price of oil is determined primarily by physics.
The extraction rates are based on the discovery data, oil production data, proved plus probable reserve data, and US producing reserve and proved reserve data, together with the oil shock model developed by Paul Pukite.
I have attempted to simplify the original model, but I guess some people still do not understand it.
So first you claim extraction rates follow the oil price, and when I refute that, then extraction rates don’t matter. How about oil output, do you care about that?
Here are real oil prices vs World C+C output from 1975 to 2014. R squared is 0.15, still not much of a correlation.
Hi Futilitist,
The real oil price is in a chart up thread, it is a much better metric than nominal oil prices when considering the economy, because it is the percent of income spent on energy that is important, using nominal oil prices doesn’t really tell us much.
We need to differentiate between gross decline rates (the rate of decline from existing wells) and the net decline rate (the rate of decline after new wells are added).
Also, the depletion rate is the rate of consumption of remaining recoverable reserves. Production can increase, stay the same or decline, but depletion is a one way street.
Hi all,
Fernando seems to think the URR I have estimated for my best guess is reasonable. On matters of oil production he is fairly conservative, though not as conservative as Mike.
The USGS estimates a URR for crude plus condensate less extra heavy oil of about 3100 Gb and 1000 Gb for oil sands from Canada and Venezuela (they estimate about 50 Gb of light tight oil(LTO) from the US and I have only seen World estimates from the EIA). For now we will ignore LTO and call the USGS estimate 4100 Gb for World C+C.
My “fantasy land” estimate (thanks Doug) is 3400 Gb of C+C for the World (600 Gb of the 3400 Gb is extra heavy oil).
I have proposed many different scenarios, if there is a major war in the middle east, or a severe depression, decline rates will be much higher during these crises (from 3 to 5%). Only if there are no “above ground” problems in the World from now until eternity would decline rates be 1 to 2% per year. So such a scenario is indeed a fantasy land prediction, the best (or worse for the environment) of all possible worlds.
As several others have said, future oil production rates will depend on the state of the World economy and this is either very difficult or impossible to predict. The low annual decline rate scenarios of under 2% through 2100 are based on an assumption of a growing World economy (maybe 1% real GDP per capita) for the foreseeable future.
In practice, such an assumption seems absurd to any realist.
The Hubbert Linearization method that many defended valiantly in 2005-2008 would suggest that World C+C less extra heavy oil URR will be about 2500 Gb, Jean Laherrere forecasts 500 Gb of extra Heavy oil, so the combination of these two would be 3000 Gb of C+C output.
In the past Hubbert Linearization has tended to underestimate the URR, so my 3100 Gb low end estimate would be a likely minimum World URR for C+C output.
If things turn out very badly (collapse of civilization by 2050 for example) or very well (a rapid ramp up of alternatives for fossil fuels and a move towards sustainability of the World economy), then demand for oil will collapse and the World URR of C+C might be much lower than 3100 Gb.
I do not think either this very pessimistic or very optimistic scenario are realistic, not even in fantasy land.
Dennis I think that you should consider separating the USGS “conventional” oil estimate of 3100 Gb from the “oil sands”. Oil sands production is fairly flat and not subject to decline rates. It is not subject to falling pressures or horizontal vs vertical wells. It may be better described as a production line operation. It is strictly a question of the rate that a company decides to produce each year and how much that are prepared to spend.
One good example I am aware of is Syncrude in Canada, which is note, “a mining operation”. They can mine and process so much each year and plan accordingly. Below is their annual production and daily rate since 2007.
Production Daily Rate
Yr Mbbls kb/d
2007 111.3 305.0
2008 105.8 289.1
2009 102.2 280.0
2010 107.0 288.4
2011 105.2 288.3
2012 104.9 286.5
2013 97.5 267.0
2014 94.2 258.0
2015 103.0 282.0 This year’s target
Their target is slightly over 100 M barrels each year and a daily rate 280 kb/d. There were significant operational problems in 2013 and 2014. Their product is a synthetic crude which is sweet and is formulated to have a higher distillate fraction than WTI. Their plan is to produce at this rate for at least the next 35 years.
At some point their oil sands will run out a probably then shut down.
Below is the projected production rate from current Canadian oil sands operations plus those in construction. Note how flat it is from 2020 to 2030.
Yr Mb/d
2014 2.16
2015 2.29
2020 3.07
2025 3.08
2030 2.97
Hi Ovi,
If you read the posts I have done on the Oil Shock model, you will see that I do what you suggest already.
I have two separate models, one for oil sands and the other for “conventional” oil (I call this C+C less extra heavy oil).
My extra heavy oil model is based on the CAPP (Canadian Association of Petroleum Producers) forecast for Canadian oil sands and the EIA’s AEO forecast for Orinoco.
See
http://peakoilbarrel.com/oil-shock-models-with-different-ultimately-recoverable-resources-of-crude-plus-condensate-3100-gb-to-3700-gb/
OK Dennis. I saw your shock post but did not work thru the details.
The Alberta extra heavy crude oil reservoirs do decline. Not all that extra heavy is mined, a lot is produced using horizontal wells and steam injection.
As a general rule, the projects are designed to have a well stock which uses the steam the boilers can produce, and delivers a liquid volume sufficient to keep the processing plant full. As the wells decline, additional well pairs are steamed and put on production.
I suspect that, in the future, as locations for new well pairs are exhausted , we will see individual projects start to decline. When they do, they’ll decline very fast.
Hi Dennis,
I agree that HL underestimates the URR for a bell curve. But if the curve is more Seneca cliff like, then it may instead overestimate it.
I also want to add that the EROEI for oil sands in Canada is not high enough to support a functional society. I bet that the same is true for at least some of the conventional oil production. So what the curve will look like depends alot on the EROEI of the other energy sources and if they can keep up the average. It´s a very complicated system with lots of dependencies. So it would of course be best with a model that does not look at oil production separately.
Hi FreddyW,
The EROEI is probably not going to be an important effect for oil. The energy necessary can be supplied by natural gas, coal, nuclear, and alternative energy. The energy density of petroleum makes it very desirable and even low EROEI oil will be produced if it is profitable to do so.
The Oil shock model is not the same as a Hubbert curve, the extraction rate is variable, not fixed.
A Seneca curve is possible, but requires unrealistic extraction rates in my view. Possible, but not likely long term.
The EROEI is probably not going to be an important effect for oil.
I don’t know about EROEI but I do know ROI will have a dramatic effect on oil. ROI is what it is all about, especially with shale oil. The ROI, for many companies right now, is negative. It is just a matter of time before they must file for bankruptcy.
A Seneca curve is possible, but requires unrealistic extraction rates in my view.
Err…. I don’t quite understand what you are trying to say here Dennis. I was under the impression that a Seneca curve was all about decline rates, not extraction rates. And if extraction rates are kept level, or near level, via massive infill drilling, for many years, then a Seneca decline curve is very likely. In fact, under those conditions, it is almost a lead pipe cinch.
For instance most old Saudi fields, as well as those in Russia and most other old giant and super giant fields, have been undergoing massive infill drilling for many years now. They have managed to keep the decline rate in these fields to from between zero and three percent or so. It is just a matter of time before these fields hit the Seneca curve. Daqing will likely hit it in 2016. I suspect a lot of other fields will hit it in the next year or so also.
Hi Ron,
I agree ROI is important, LTO is a pretty small part of the story when we look at the big picture, roughly 100 Gb of a total of 3400 Gb of C+C. Note that 100 Gb of LTO is optimistic in my view.
Dennis, actually ROI is everything. And it most certainly does not only pertain to LTO extraction. From 800 foot stripper wells in Kansas to DW wells in 8,000 feet of water off the coast of Brazil, return on investment, profitability, is ALL that matters, period. Extraction costs can not exceed gross income during any prolonged period in the life of a well or it gets the ‘ol cement tombstone.
You seem to have a hard time accepting that. I suspect many other peak oil enthusiasts do as well as their only basis for observation about the oil and natural gas business, in general, is the shale oil business. I understand; it has been hammering away for 9 years and has not made a nickle of profit yet. It is still drilling wells and still losing money. Folks with questionable cranial capacity are still loaning the shale oil industry money. It must be terribly confusing.
Its actually not. Oil exploration and production is a business, even for countries who have nationalized their hydrocarbon resources. Any oil well anywhere in the world must be profitable to drill and complete, then produce. Never in 50 years had I ever heard the ridiculous term “break even” before some people in the peak oil community began playing fantasy football with shale oil extraction.
Its not about breaking even. Its about profitability. Profitability is not just “important,” its everything.
Mike
Hi Mike,
I agree. The LTO is not very profitable and it is what Ron mentioned. My guess is that there are many places where oil is profitable, if not it will not be produced, it is very simple.
Oh and break even includes whatever ROI is required by the investor, it is part of the calculation. The breakeven oil price is the price that will allow some given ROI over the life of the well if prices remain at that level for the entire life of the well.
You can make ROI whatever you want, profits are included.
Mike, your business view has clouded your scientific view of what is happening. The scientific view is of a statistical distribution of reservoirs and a statistical distribution of extractors. There are AVERAGE rates of extraction that we can apply to estimate the historical and projected levels. Why you keep thinking that your anecdotal view means something is beyond me.
Mr. Scope, you are a pompous ass. I have known people like you my whole life; they think they have life figured out thru science, but can’t tie two pieces of rope together to save their life. Reality is that predicting the future of oil extraction without considering if it is profitable or not, without understanding the “business” ramifications of it all, is absurdity. You don’t respect what I do to feed my family, nor do I, you. Lets leave it at that. Your boy, Dennis can take care of himself.
Dennis, I did not know ROI was part of the break even manipulation exercise. Wow. That’s the first I’ve heard of that. What rate of return? I assume you are using EUR and not actual UR. Whatever. It is indeed very much become a game of fantasy shale oil around here.
Mike
Mike
Hi Mike,
Lately I have been using a nominal ROI of 15%, based on your input. I am surprised you were not aware of this.
I was introduced to the idea of a break even oil price by Rune Likvern in his famous Red Queen series. I had always assumed this was a standard metric.
For an LTO well I have to estimate the EUR, I have shown these estimates on many occasions, for the Bakken/Three Forks the EUR is about 370 kb with an assumption that the well is plugged at 7 b/d. We only have actual data for the massively fracked wells (starting in 2008) for about 6 to 7 years.
The average Bakken Three Forks well has a break even oil price of $79/b with a nominal ROI of 15%(inflation rate is assumed to average 3% over the life of the well). This price is at the refinery gate, the ATW oil price is $67/b (transport costs are$12/b).
I do not understand why the drilling continues and agree that at current oil prices it will stop eventually, maybe by September, perhaps sooner.
For the Eagle Ford average well break even oil prices (at refinery gate) are $72/b with a nominal ROI of 15%. The well life is 12.83 years and EUR is 250 kb. We have less data on the Eagle Ford wells, but using oil wells on schedule from the RRC as a guide for the number of producing wells and this well profile, the model matches the output data fairly well, but these wells have only been producing since about 2010, so we do not really know what the tails will look like.
Again, I am just trying to estimate what may happen in the future, it is not clear why more wells are drilled at current prices.
Could it be that each oil company is trying to hold on in hopes that other companies will go bankrupt? You would know better than me.
Dennis, thanks; I was not aware of your definition of “break even,” no. Again, I still don’t truly get the significance of that. The question I believe was the importance of ROI and profitability, which is significant. Your buddy, Paul, pisses me off. He is right, however; for me its all about business. About making money, not posting on a peak oil blog, which I clearly need to stop doing.
Predicting the future is important. I understand that. Predicting reservoir performance and recovery has historically been much different than it is today. To me reservoir recovery in conventional plays use to be credible, and trustworthy. The era immediately following WWII was a time of tremendous growth in world reserves. That growth came from conventional reservoirs where calculations of OOIP were reasonable and extraction rates were not price driven. Conservation practices made predicting easier. Thirty years of stable oil prices made predicting the future a lot easier.
Now, accounting rules have changed, as have definitions. Nobody in the world tells the truth about it’s reserve inventory, not even in North Dakota (Texas either). Unconventional resources are not so predictable, in my opinion. Their development is very much financially constrained. I think in the next 10 months, when bankruptcies occur on every street corner and the money the shale oil company needs to survive becomes very scarce people will understand that better. It is just business.
We all hope for better times. I do. Making business decisions, borrowing money, however based on the hope that prices will go up is stupid. Loaning money to shale companies is even stupider. I am a broken record on that dribble.
Good luck, Dennis.
Mike
Hi Mike,
My main point is that I agree that ROI is the most important metric and was just trying to make clear that when I say the discount rate is 15%, that is the same as saying that the ROI is 15%.
So when someone looks for a break even oil price they are asking the question,
“What does the oil price need to be over the expected life of this well in order for me to turn a X% profit?”
If for Mike’s Oil Company X=15% then we set the nominal discount rate in our NPV (net present value) calculation to 15% and then find the oil price that results in the discounted cash flow being equal to the initial investment.
My guess is that when you have decided that an investment is worth doing at $65/b, that you have essentially done this, you just have a different name for it.
What you must be thinking for break even is the same calculation with the nominal discount rate set to 3% (equal to the average long term rate of inflation) or possibly 0%, where you would be losing money to inflation.
Clearly nobody stays in business for long if they are investing in wells with either a -3% ROI or a 0% ROI.
Does the “Seneca Cliff” scenario for World output seem reasonable to you?
Chart below of a Seneca cliff.
From http://srsroccoreport.com/wp-content/uploads/Seneca-Cliff.png
Hi Ron,
The extraction rate (similar to the depletion rate except it is from producing reserves or developed reserves that have started producing rather than from proved plus probable reserves) determines the decline rate. Below is a shock model for my medium World C+C URR case of 3400 Gb with extraction rates decreasing by 5% each year after 2035. The decline rates are high in this scenario, but it is not clear why extraction rates would decrease unless there is a major war or major economic depression.
This scenario is not realistic in my view unless we explain why extraction rates should decrease.
When I say extraction rates decrease by 5%, that means if the extraction rate is 10% in year 1 it decreases to 9.5% =0.1*0.95 in year 2.
Also Ron,
The fields that start declining are off set by other fields that are on plateau and others that may be increasing output. The all hit the rapid decline phase at different points of time. When they are added together, we do not get the Seneca cliff you anticipate.
Only if extraction rates far above their present level or fall very rapidly below their present level (in the case of an oil shock from a war or recession), will we get the kind of decline rate for World output that you think is realistic (4 to 5% by 2030).
DC Wrote:
“but it is not clear why extraction rates would decrease unless there is a major war or major economic depression.”
You’ve answered your own question!
1. All gov’ts of major industrialized nations have over promised liabilities and have huge unsustainable debt levels. Its why the worlds central banks have pressed for ZIRP and used QE to avoid a fast economic collapse back in 2008. There should be no doubt that without QE and ZIRP the global economy would already been in a severe depression. However QE and ZIRP can only delay a crisis, it can’t solve systemic problems decades in the making.
2. The US/EU has shifted their economies from high wage manufacturing production to low wage service jobs and have outsourced manufacturing\production to Asia. Finacial Gimmicks and massive trade deficits had delayed some of the economic problems, temporarily.
3. US/EU had have declining populations offset by low skill immigrants, who unfortunately do not posse the education and skills need to replace aging skilled workers. For every engineer/craftsmen that retires, he or she is replaced wth 4 to 6 low skill immigrants working low wage service jobs.
4. Increase global competition for depleting strategic resources. The US has mobilized its Armed forces to control the middle east. China is making moves in Africa, South America and the Pacific. The US/EU has sanctioned Russia, which is going have some impact on its Energy Exports. Cold War 2.0 has been created between the US, Russia and China.
4. We seen widespread riots in the EU and through the developing world. We’ve seen the Middle east collapse into anarchy and civil war. Civil ware and foreign troop occupation will continue to grow as the economic problems worsen. I think the next major region to struggle will be Asia, or perhaps the EU as Italy, Spain, Portugal fall in the same situation as Greece has. Should either region get hit with a financial crisis, so will the US and the rest of the industrialize world. I think the US will lose another 20+ million jobs over the next ten years or less.
Its likely that when the Shale Drilled debt problem becomes first page news, its going to be a long time before bankers and investors are likely to loan money to the oil/gas industry. Its taken about 10 years for the Tech Bubble to reappear, so probably about 10 years for another Driller Bubble. By then it likely be too late. Perhaps gov’t’s will step in to bailout the drillers as energy shortages unfold.
Hi TechGuy.
Great post.
Dennis thinks wars and depressions are random events that are unrelated to economic conditions, which are also random and unrelated to energy use.
Hi Futilitist,
No that is not correct. I actually have predicted that a depression might occur around 2035 in response to peak oil, War is also a distinct possibility and the first is more related to economics (with some politics mixed in) and the second is more related to international politics (with economics also having an influence).
I do not have a model that can predict future political and/or economic events with any degree of certainty. So while I have proposed the possiblilty of a major War or major depression and decreasing extraction rates as a result, the point is that peak oil won’t necessarily cause either of these. I do agree that either is likely and think that a depression is more likely.
I am hopeful that the lessons of World War 2 may prevent World War 3, but that might be wishful thinking.
Peak oil would be a minor problem by comparison.
Dennis,
A Seneca curve is possible, but requires unrealistic extraction rates in my view.
I can find two effects which will cause a seneca cliff curve.
-First the massive infill drilling which Ron has written about many times. When you go back to old fields and increase extraction rates it will cause the curve to be asymmetrical. That is more seneca cliff like.
-Second, in the Höök paper we can see that the decline rates have increased over time which is the same as the extraction rates have increased over time. This will also make the curve more seneca cliff like.
If the extraction rate would not have changed over time then the curve would have looked like the curve for discoveries, which is bell curve like. It’s very likely that it will be seneca cliff like as far as I can see.
The EROEI is probably not going to be an important effect for oil. The energy necessary can be supplied by natural gas, coal, nuclear, and alternative energy.
That is the question. The EROEI of coal and natural gas will also decrease over time. Maybe it´s not a problem now, but it will be more so in the future. Perhaps not directly related to EROEI but I was actually quite surprised to that the oil/coal price ratio has stayed about the same even when the oil price sky rocketed. In 2011 when the coal price started to decline you could read about coal companies in economic problems. So it looks like oil and coal will peak together. That is actually not that strange as coal is used to make things and oil to transport them.
It is hard sometimes to get in a comment in the best spot. This time I cannot.
Dennis is right about ” break-even” in the sense the word is used by economists. My old textbooks say that every stable business and industry basically operates at ” break-even” meaning that the people in the industry are making just enough on average to STAY in that industry rather than LEAVE IT and put their capital and expertise into some other business or industry. In this sense the term DOES include a return on investment with the assumption being that this return is roughly constant through out the economy.
This definition of break even involves ”opportunity costs” and has little to do with bookkeeping profits but the bookkeeper WILL be recording some ”profit” in good times.
In a recession or depression a company might actually be losing money according to the bookkeeper but still breaking even in this economist’s narrow theoretical sense if the owner has no better opportunity to employ his capital and expertise elsewhere.
Now when my neighbors talk about breaking even for the year they mean they got back what they spent but nothing for the years labor.
Mike is the sort of guy who would be a well liked neighbor and that is the way HE uses the word and the way BOOK KEEPERS use the word.
Both definitions are commonly accepted depending on context but small businessmen who have not had a college level course in economics have mostly never run across the first definition that includes a profit in ” break-even”.
A lot of the discussion going on is a lost cause based on people using the same word to mean different things.
Mr Telescope may or may not be getting good results with all his modeling but it is possible for him to model the industry without knowing how to tie two ropes together . He is not drilling for oil and selling it.He is a spectator in the high bleachers where he can see the whole playing field. He does not have to possess any expertise in any particular players position to watch the game. He will never be able to hit a home run but after watching lots of games he can tell you almost exactly how many home runs will be hit in the next one hundred games.
All the things that matter so much to Mike , the things that make or break him on a day to day and year to year basis, AVERAGE OUT over all the people in the industry.
Mr. T is not concerned at all with any given company but with the AVERAGE results of ALL the companies in the industry.
In Mike’s world if he loses money for a few years, too many years, he goes out of business.
In Mr. T’s world if the industry loses money for a few years it shrinks as projects are delayed and some companies go broke . The individual companies don’t matter from his perspective.
It is all a matter of where one sits and his point of view.
Thank you, OFM. I don’t like “scientists” looking down their nose at me. I have spent my entire life doing the work that engineers and scientists don’t know how to do, or are too afraid to do. Ten years ago most of the people that now consider themselves experts on oily matters did not even give the subject, or the process a second thought. The internet fixed all that, for sure.
I think you and I are old enough that we know that life is actually very “anecdotal.” Not very much I thought would happen in my life, actually happened, sometimes for the good, often for the bad. Its just life. And to get through it one better be able to roll with the punches and have a sense of humor about it, in my opinion.
Take care, mate.
Mike
Hi FreddyW,
As the prices of fossil fuels increase, other energy supplies will be used such as nuclear, hydro, wind, solar, and geothermal. In addition energy will become more expensive and will be used more efficiently. Eventually growth will need to stop, hopefully population will have peaked before this happens, if not we will need to get by with less stuff. A different economic paradigm will be needed to make this work. I do not know what this would look like.
Wimbi has it right, we really need to focus on finding alternatives to fossil fuels. It will not be easy, but it may be possible.
DC wrote:
“As the prices of fossil fuels increase, other energy supplies will be used such as nuclear, hydro, wind, solar, and geothermal. In addition energy will become more expensive and will be used more efficiently.”
And so will the Jobs become more “efficient” (ie a lot fewer of them). The US has lost about 20 Million jobs since 1999. No need to substitute production when there is no demand growth. As Energy costs rise, consumers will cut consumption leading to fewer workers. Less workers means less people buying stuff, thus a feedback loop. Industrialization was built on cheap and abundant energy.
Nuclear is dead in the West. the US has two new Plants under construction which will be completed in 2019-2022 (depending on delays), yet is closing about 2 nukes every year. Germany isn’t building new Nukes and I think Sweden announced is closing two nukes in the next 12 months. I think France is building 1, and decommissioning 1.
Nuclear appears to be only growing in Asia and parts of the Middle East.
Hydro is pretty much maxed out in the US, and probably is in decline as the drought in the West is impacting output. I believe there are numerous dams in the US that need to be rebuilt due to structure problems, and there is no money to replace them.
Wind and Solar: DOA without a substantial breakthrough in energy storage tech.
FWIW: the time to mitigate for fossil fuel depletion was 30 to 40 years ago. At this point we are in the bottom of 9th, down 50 home runs.
Hi Ron,
Here is the World C+C URR=3400 Gb with extraction rates remaining constant after 2017,
extraction rates rise to 1.9% above 2014 extraction rates from 2015 to 2017. Annual decline rates remain below 1% until 2035,remain under 1.5% until 2055 and reach 1.85% in 2091.
Hi Dennis.
“Fernando seems to think the URR I have estimated for my best guess is reasonable.”
If Fernando didn’t think your estimate was reasonable, would you change your estimate? How did Fernando arrive at his estimate?
“I have proposed many different scenarios, if there is a major war in the middle east, or a severe depression, decline rates will be much higher during these crises (from 3 to 5%).”
How did you arrive at the 3-5% number? What if we have WWIII?
“Only if there are no “above ground” problems in the World from now until eternity would decline rates be 1 to 2% per year.”
How did you come up with that estimate? The IEA is pretty conservative and they think we will see a considerably higher depletion rate.
http://peak-oil.org/peak-oil-reference/peak-oil-data/oil-depletion/
“The IEA’s World Energy Outlook 2008 included, for the first time, a study of the depletion rates of the world’s top 800 oil fields. It found rates of 6.7% for past-peak fields, increasing to 8.6% by 2030.”
“If things turn out very badly (collapse of civilization by 2050 for example)…”
2050? Is that your worst case scenario? Is it even conceivable to you that a collapse could happen a lot sooner than 2050?
“I do not think…this very pessimistic…scenario (is) realistic, not even in fantasy land.”
Wow. Putting off the inevitable collapse of industrial civilization till 2050 sounds hopelessly optimistic to me. But I think that the health of the economy is based on available net energy, while you think the health of the economy is totally arbitrary and not subject to the laws of physics in any way at all.
Hey Ron.
I just tried to edit my comment above and was refused. It said I do not have permission to edit this comment. Why?
—EDIT—
But this current comment is editable.
You have 60 minutes to edit a comment. After that you are shut out. If it had not been 60 minutes then I have no idea why.
Shit happens.
Ron Wrote:
“You have 60 minutes to edit a comment. After that you are shut out. If it had not been 60 minutes then I have no idea why.”
Question: Is it possible to change the timer display to just display the “minutes” left instead of both minutes and seconds.? As the seconds count down it shifts all of the text below up and down a line when the seconds wraps back and forth with a new line. Not a complaint.
Thanks
Question: Is it possible to change the timer display to just display the “minutes” left instead of both minutes and seconds.?
No, I have no control over that. Sorry.
The laws of physics have to be applied to the entire system, thermodynamics has to be applied to the entire economy, not simply to the oil industry. When looking at EROEI, you have to consider all energy flows in the economy.
Whether oil is produced depends on ROI not EROEI.
“Whether oil is produced depends on ROI not EROEI.”
I’m not sure what your point is, Dennis. The only way that ROI can be positive is with a sufficiently high oil price.
The problem with the current situation is that in order for the price of oil to return to a level that that will be more generally favorable to positive ROI, production must fall, causing grave economic damage. That will temporarily raise the price of oil, but lower available net energy to society. The net result will be reduced economic activity, which makes the higher oil price impossible to sustain. Catch-22.
My problem with your so called “model” is that you do not explain exactly how market forces can ever fix the situation I describe above. You just claim they will.
You don’t seem to able to grasp or accept the most basic physics premise that the level of economic activity is completely dependent on available net energy. Thus, the price of oil is not arbitrary. It is indirectly determined by the laws of physics.
There must be an upper limit to the price of oil. This is based on it’s energy content and the amount of economic activity a barrel of oil can produce. It must produce a positive return on consumer’s investments. Duh.
Anyway, I don’t need to know the exact physics formula or all of the energy flows in the economy to know that there is upper limit on the price of oil. We have already experienced this limit. The oil price seems to be physically constrained to a maximum yearly average of a little over $100/barrel.
“The implicit assumption of the model is that market forces will adjust the oil price so that in the long run oil production will be profitable.”
Please present a plausible scenario describing exactly how market forces will produce a situation in which consumers will be able to sustainably afford oil over $100/barrel any time soon. Or any time, for that matter.
If you cannot do this, your “model” is completely invalid (and you should honestly admit it).
Hi Futilitist,
The economy will adjust to higher oil prices over time, just as it has adjusdted to higher prices in the past. The net energy in oil is not of consequence, it is the net energy of all forms of energy used by society that matters.
You assume the world cannot operate on oil that is $100/b, it did so for a couple of years and price came down due to too much oil being produced. When the supply adjusts to demand, the oil price will rise to a level that oil is profitable to produce. Read some microeconomics to understand how this works, generally it works pretty well, though for the oil industry price volatility is a problem and a cartel would allow the system to operate with more stability. This is the reason that the RRC controlled oil output in Texas from 1930 to 1970 and OPEC controlled output from 1975 to 2014. The volatility may result in chaos, if so the EIA, IEA, or RRC may step in to try to balance supply and demand if the free market is unworkable.
The upper limit on the price of oil has very little to do with its net energy, it is determined by the balance of supply and demand. There is no doubt an upper limit, Ron has guessed $145/b or so (I think), this seems reasonable over the medium term (next 10 years). As the economy gets used to oil at $125/b (maybe from 2017 to 2025) and substitute forms of transportation are developed (rail, light rail, buses, plug-in hybrids, and EVs, and generally better fuel economy) higher prices may be feasible.
Oil use per unit of GDP produced has been decreasing and will continue to do so.
“The economy will adjust to higher oil prices over time, just as it has adjusdted to higher prices in the past.”
You keep repeating the same vague invisible hand argument. But market forces are currently lined up to produce low oil prices. The only current way to raise oil prices is to destroy production. I am asking you to describe (in microeconomic terms) specifically how that situation can change in the future so that oil prices can sustainably rise.
In the past, we could count on rising GDP to support higher oil prices. GDP cannot rise if available net energy is falling. Are you trying to claim that GDP is completely independent of available net energy?
“The net energy in oil is not of consequence, it is the net energy of all forms of energy used by society that matters.”
Bullshit, Dennis. The net energy of oil matters because it is our primary energy source. When the net energy of oil declines, the net energy of civilization declines with it.
“The upper limit on the price of oil has very little to do with its net energy, it is determined by the balance of supply and demand.”
You sound like an economist and your position is basically indistinguishable from that of a peak oil denier.
For a good example of what a potentially valid forecasting model looks like, please check out my Futilitist Oil Price Forecast Model down the page.
Hi Futilitist,
The economic analysis is straight forward.
Lower oil prices due to excess supply will have two effects, the quantity of oil consumed will increase (if income remains unchanged), and the quantity of oil produced will decrease because the lower prices make oil production less profitable.
On a traditional supply and demand diagram this can be thought of as a shift of the supply curve to the left, the amount of oil produced will decrease and oil prices will rise, there will also be a lower quantity of demand for oil at the higher prices.
Why would oil supply decrease? Oil companies that are operating at a loss will eventually go bankrupt, these bankruptcies will reduce the supply of oil.
For a “peak oil denier” I tend to create a lot of scenarios that show a peak in oil production. I suppose you could call me a “Seneca cliff denier” as I find that scenario to be implausible unless we assume economic collapse or World War 3 to cause the Seneca cliff. I agree either of those scenarios are possible, but disagree that they are inevitable.
DC wrote:
“You assume the world cannot operate on oil that is $100/b, it did so for a couple of years and price came down due to too much oil being produced.”
FYI:Sorry, not trying to gang up on you, but here is my thoughts:
The Price of Oil came down because people and business could not afford $100/b oil. PoC was above $100 when Credit was easily, ie the housing bubble and during the QE years (2009-2014). Ever since the Fed took the QE punchbowl away the price of Oil has been dropping. If you look at the economic statistics, consumer spending is declining and just about all commodities have also declined (copper, PMs, etc). Car sales are up, but that’s because Subprime is back and car loans have been extended to 7 years. Many of these subprime loans are going to end up in default, just like they did in 2008/2009.
Also Steven Kopits analysis indicates that the global economy would need about ~120 mmb/d to accommodate global population increases and global growth since 2005. It was in his Columbia Univ. video presentation (from 2013 I think)
I am sure will likely see a lot more of QE in the years ahead and oil prices above $100 again, but I also see more and more jobs disappearing. Airlines are due for chopping block as profits decline and they can no longer cut costs to make up for revenue declines. Sooner or later Auto Subprime loans are going to bite back and will see another round of manufacturer bankruptcies and bailouts.
The world is slowly adjusting to oil depletion, just not in a good way.
Hi Techguy,
I agree with much of your analysis in the comment above, except for the part about the economy doing badly. The World economy is growing based on IMF data, oil prices fell because supply growth outstripped demand growth.
Looking at the data and listening to Kopits’ presentations it is clear to me that supply growth increased rather than consumption growth decreasing, but it may have been a bit of both (so both stories may be correct to some degree).
Kopits thinks oil prices will rise and eventually I think he will be correct. I believe his 120 million barrel estimate assumes no further increases in GDP per barrel of oil consumed, if oil prices rise that assumption will be incorrect. In addition, he probably assumed global growth would be 3% in real terms, that will also be incorrect (I expect more like 2 to 2.5%).
For the most part we are on the same page, except I think the World economy will adjust with great difficulty to peak oil and you think that is not possible. Time answers these questions.
DC Wrote:
‘The World economy is growing based on IMF data, oil prices fell because supply growth outstripped demand growth.”
Global interest rates are at historic lows for the industrialized age. What do you think would happen in rates normalized to pre-2004 Greenspan 1% Fed-Fund rate?
This isn’t growth no matter what the IMF or any GFO claims.
Hi Jeffrey,
Absolutely correct. Note that in the oil shock model that the extraction rate is different from the depletion rate. The remaining recoverable reserves are constantly decreasing so at a constant output rate the depletion rate would continuously rise and at a constant depletion rate output would continuously fall.
The denominator of the extraction rate are the producing reserves and these are added to as reserves are developed and start producing and subtracted from as reserves are produced.
My current best guess scenario has producing reserves peaking in 2006, this is the point where producing developed reserves added are just equal to the oil produced that year. After that point if extraction rates had remained at 6% output would have soon fallen, instead extraction rates increased to 6.4% by 2014, which allowed output to increase slightly. If future extraction rates remain at 6.4% or less, then output will fall as Ron has predicted, if they continue to rise at the 2009 to 2014 rate of increase, the peak will be 2023. If extraction rates level off from 2024 to 2032 and then remain flat, decline rates stay below 1.5% until 2032 and annual decline rates are less than 1.9% until 2100.
Chart with peak in 2023 below.
Walter Wrote:
” I can see that near the peak, wells that are increasing would counterbalance declining wells, so the total decline rate would low. But it seems that as more and more wells went past peak, the total decline rate should increase.”
Most wells are well past their peak and rely heavily on horizontal drilling to keep production from collapsing. Really it comes down to how much money Drillers are willing to spend. If CapEx was to hold and or increase, Production declines should remain shallow for a extended period. If CapEx is slashed than the production curve would be considerable steep. Even more steeper than the estimate of 5% to 8% (typical field declines). Its very likely that if CapEx was to be cut, Declines of existing fields will increase substantially.
In my opinion its all about how much money is invested in production that will dictate the decline slope. My gut opinion on near term CapEx spending is bad. The global economy is slipping into recession, which will likely limit demand growth. If another financial crisis unfolds (very possible) that Drillers will find it impossible to borrow for CapEx spending. It appears the Shale drillers are set to enter the banking “doghouse” and will be unlikely to borrow much more. I suspect the for the near future, the Majors will continue to invest free cash flow into stock buy backs and perhaps by up assets of the smaller fish instead of investing in CapEx.
Walter: Dennis’ decline rate is a function of the oil resources and the point at which oil production begins to decline. This estimate implies a significant amount of activity to sustain production (activity one could support if oil prices increase above inflation).
In conventional oil, the oil reservoir’s decline rate is, in a sense, designed by the operator. I know this statement has met a lot of resistance in the past, but to me this was always evident because I was trained to plan field developments without regulatory constraints on well spacing or well rates. The historical ratio between investment and reserves x prices, coupled to tax terms would drive the overall field decline to around 4 to 10 %.
So how do we reduce the decline rate to the low single digits? We invest in two types of projects: 1. Rate acceleration (gets the oil faster, doesn’t increase reserves) and 2. Reserve increase (injecting CO2, drilling wells in unswept spots, extending well life by lifting more volume at acceptable cost).
Most of these investments incorporate both terms, the rate acceleration projects eventually lead to much steeper declines (later in time), the new reserve creation projects can reduce decline, and in some cases they can lead to extremely low decline rates (for example, a project to improve sweep using low salinity water and produce the wells at high water cut).
The eventual answer will depend on the ability of renewables or nuclear power to replace oil, which is in part driven by global warming and country policies. If renewables become more competitive oil prices won’t increase as much and we won’t be able to justify going after those last drops. If renewables fail or we see global warming as a secondary issue we will see a lower decline rate, and the development of gas and coal to liquids to fill the gaps.
“In conventional oil, the oil reservoir’s decline rate is, in a sense, designed by the operator. I know this statement has met a lot of resistance in the past, but to me this was always evident…”
You are absolutely right, Fernando. This applies equally to oil recovery rate.
Oil production in the Ula field in the North Sea
Thanks
That’s very helpful. I wonder if there is any data linking the price of oil and the decline rates? I could see why an operator wouldn’t bother to make the additional investment in a low price period. During the last ten years prices have been rising, and presably so has investment, which may help account for the plateau?
Alex. That is a very interesting graph. Its appears that EOR can completely overcome normal decline, at least at the late stage of production. Very impressive. Could the EOR have been used esrlier, to forstall the peak? (I know nothing about oil well production, I confess)
BTW
I also found this website, which has a general discussion on decline rates. https://grandemotte.wordpress.com/oil-and-gas-5-production-decline-rates/
“The author confirms your view that the decline rate is not fixed.
The Rate of Production Decline in Conventional Oilfields
Whilst it is generally easy to define the decline rate of an individual oilfield, the data is not widely available. As a result, the global decline rate is a matter of genuine debate. With multiple types of field, different Operators, different fiscal, technical, and commercial regimes, and different decline management methods, there are many variables.Can anything be confidently stated about the average rate of conventional oilfield decline?”
And goes on to review the studies.
“A commonly quoted global decline rate is from CERA: 4.5%. This figure was calculated from an analysis of 811 large to giant size fields, covering ~66% of global production.
CERA notes that most production is from large fields, and that these fields tend to produce on-plateau for longer and to decline at a slower rate than smaller fields. Additionally, they state that offshore fields decline faster than onshore fields.
CERA calculate that 41% of modern production comes from fields that are in build-up or on-plateau. They use complex averaging with the 59% of fields that are in decline to create the future 4.5% decline rate.
The IEA 2008 World Oil Report concentrated on defining future decline rates. They published a production-weighted average decline rate worldwide of 6.7% as of 2007. This is predicted to rise to 8.6% by 2030 as more and more old giant fields pass their plateau and start to decline, and the long tail of global production shifts to smaller more rapidly depleted oilfields. As of the IEA 2010 World Oil Report (the latest freely availble) the IEA stood by these predictions.
IEA uses IHS data. Decline rates are calculated for all fields in the database (including 798 “giants”). The overall decline prediction method may over-state decline rates, as pre- plateau fields have an assumed rate.
The IEA differentiate between Natural Decline (9%) and Observed Decline (6.7%), the difference being attributed to field interventions such as infill drilling. In total they calculate a 5.1% decline for 580 fields post-peak, and 5.8% for 479 fields post-plateau. The total is adjusted to account for thousands of smaller fields not included in their dataset to reach the 6.7% number.
IEA observe that Non-OPEC fields, with fewer Giant and Super-Giant fields, decline at a faster rate than OPEC fields. Additionally, offshore fields decline at faster rates than onshore, and deep-water fields decline at a faster rate than shelfal fields.”
Note that the IEA states that the “natural”decline rate would be 9% while with ” field intervention” it could be reduced to 6.7%. I presume that includes EOR.
Hi Fernando,
Thanks. The other thing that happens is that more wells are drilled over time and new fields are developed so that the World decline rate tends to be lower than the national decline rates, national rates are lower than the field decline rates, and the field decline rate will be lower than the well decline rate.
I know that you and most others know this, but there may be some who think that because the average field may decline at 5-8% when it reaches the decline phase and no more wells are drilled, this rate does not apply to the World decline rate as there will be more wells drilled for a long time to come (until 2150 at least).
Dennis,
As everyone except the middle east stops drilling during this slowdown, we may just reach the 5-8% decline rate that everyone talks about as the rigs that have been drilling all of these infill wells get stacked.
Supply and demand will balance one way or the other?
On the other hand, have you traded you Hybrids for Suburban SUVs yet, like everyone else? smiles
Hi Toolpush,
You, Fernando, Shallow sand, and Mike would have a better handle on how this might look in the real World.
I would think that a scenario where every field in the World is declining will not be reached for some time. Different fields will be at different parts of their decline curves and when these curves are added together for a World decline rate it will not be 5% or more as long as continued drilling is profitable. When we reach a point where no wells can be drilled profitably at the prevailing oil price, perhaps decline rates will be 5%.
It would be interesting to hear from the oil men, geologists, and geophysicists as to whether a Seneca cliff is likely without above ground factors (World War 3, or Great Depression 2 with 40% unemployment World wide).
Or an epidémic?
I don’t think we will see every producing region decline at the same time in that fashion. Did you notice Argentina is subsidizing oil producers? That type of reaction is really hard to anticipate, but it happens. I suspect that, in an after peak scenario, with prices unable to satisfy demand, there will be countries easing up on taxes and bureaucratic snags to get some more oil flowing. This will lead to some regions declining and others trying to hang on.
Thanks Dennis
I can accept that the oil companies will not stop drilling just because we have hit the “peak” !! :>) The question is, how successful will they be in reducing the decline rate from the post peak wells
To make the numbers easy – let’s say that peak production is 100 mb/d, and the decline rate is 6%. That 6 mb/d. To bring the decline rate up 2%, we need 4mb/d more production each year.
Where do you expect this increased production to come from. Iraq? Iran? the US? Saudi Arabia?
BTW: regarding new discoveries, I ran across this quote from Pete Stark at IHS
http://www.rmag.org/files/Luncheons/2015%20Luncheons/Stak%20Abstract_RMAG%20January%202015%20Luncheon.pdf
“Global conventional oil and gas discovery volumes have decreased since 2010 and 2013 marked the lowest volume of annual oil discoveries since 1952. Through October 2014, the number of discoveries, oil discovery volumes and total Boe volumes trail 2013. Without a surge in year-end discoveries, 2014 will set a new low mark for post 1952 annual oil discovery volumes – perhaps as little as 4.5 billion barrels. Outside of North America, conventional exploration and appraisal drilling activity has averaged more than 5,000 wells per year since 2009 but the number of discoveries of any size has decreased by almost 50%.”
Without a surge in year-end discoveries, 2014 will set a new low mark for post 1952 annual oil discovery volumes – perhaps as little as 4.5 billion barrels.
4.5 billion barrels for a world that consumes 30 billion barrels per year that just ain’t very much.
I think this is a reason why we see Shell trying so hard in the Arctic, and why EexxonMobil is still active in the Bakken. There aren’t that many reserves left to find.
Hi Fernando,
There may not be much in the way of new discoveries, but I imagine there will be some reserve growth in proved plus probable reserves as possible reserves move into the probable category and contingent resources move into the possible reserve category over time.
I would think that oil prices will rise as output peaks and more of the possible reserves and contingent resources will become profitable to produce.
My guess is that oil prices may not be able to go much higher than $150/b (2015$), but there is a lot of oil that could be produced at that price.
Dennis,
While I respect your work, I have to agree with Doug:
YOU LIVE IN A FANTASY LAND.
steve
Hi Freddy W,
I put a comment about this in the wrong place. Link below.
http://peakoilbarrel.com/oil-shipments-by-rail-declining/comment-page-1/#comment-527662
The decline in output will begin at different times in different places. US lower 48 output declined at about 2% from 1970 to 2005. That might be a better estimate for the eventual World rate once all areas are declining.
Hi Steve,
You don’t think oil prices will ever reach $150/b? Although Doug may agree with you about where I may live, I am not sure he agrees that oil prices will never reach that level. I believe that Ron has suggested that oil prices may get close to that level, but that the economy would crash, perhaps that is correct, I agree with his assessment that $150/b may be the limit, but think $100 to $125/b is certainly possible when oil output plateaus or declines slowly over the 2017 to 2025 period. When oil gets to $150/b or above we will likely see a recession. I expect a depression by 2030.
Probably too optimistic for you, but it seems realistic to me.
Yes, I think we will mostly go sift through non commercial oil we know about. Lots of CO2 injection, and infills, develop very tight zones (not the ‘shales’, but low permeability rock we can’t develop at this time). I think that’s going to contribute more than exploration by a mile.
Hi Walter and FreddyW,
If we look at the US minus Alaska output from 1970 to 2005 the decline rate can be approximated by an exponential with an annual decline rate of 2.2%. The decline rate was lower (1.4%) from 1989 to 2003 and was 2.2% from 1970 to 1988. I will use a 2.2% decline rate, but this is probably too high.
Let’s assume we can divide World output into 10 separate “pools” with each initially on a plateau of 8 million barrels per day in 2015.
Region 1 begins declining at 2.2%/year in 2016 and each of the other regions in 5 year increments (2021,2026,2031,2036,2041,2046,2051,2056, and 2061). The output profile (Mb/d-left axis) and annual decline rate of World output (right axis) is in the chart below.
This scenario is to account for the fact that not all areas will start to decline at the same time, it is not intended to be realistic.
https://drive.google.com/file/d/0B4nArV09d398RUxvQlpaaTdtZ1U/view?usp=sharing
Link to speadsheet with scenario above.
Thanks Dennis
I think that is a useful way to look at it. Might I suggest some modifications? If each pre-peak pool was growing at say 2%, and post peak declining at 5%, one could see the peak and decline of the total. Under this approach, the decline rate would increase, as more and more pools rolled over. But, as you point out the decline rate for the US did not increase, but held steady at around 2%. This “infill” was from reserve growth, and new discoveries, as you indicate. This approach might provide some notion of how much infill will be needed, and how it will grow.
As you are probably aware Robert Hirsch used a 2% decline rate in his report to USDOE. Here is what he said:
“Estimating a decline rate after world oil production peaking is a difficult issue. While human activity dominates the demand for oil, the “rocks” (geology) will dominate the decline of world conventional oil production after peaking. Referring to U.S. Lower 48 production history, the decline after the 1970 peaking
was roughly 1.7 percent per year, which we have chosen to round off to two percent per year as our estimated world conventional oil decline rate.112 It should be noted that other analysts have projected decline rates of 3-8%, which would make the mitigation problem much more difficult.113
113 See for instance Al-Husseini, S.I. , Retired Exec. V.P., Saudi Aramco. A Producer’s
Perspective on the Oil Industry. Oil and Money Conference. London. October 26, 2004;
Hakes, J. Long Term World Oil Supply. EIA. April 18, 2000; and ExxonMobil. A Report on
Energy Trends, Greenhouse Emissions and Alternate Energy. February 2004.
Thus, it appears that 2% is a reasonable assumption, but on the low end.
Some folks have described scenarios where the is a “smooth transition” after peak. People gravitate to hybrids and electric cars freeing up oil for uses where alternatives are less likely – trucking, farming, construction , mining etc. As Hirsch points out, to move from a fleet of SUVs and trucks, to a fleet of hybrids and electrics takers a long time. This only works if the decline rate is very low.
Thanks again for your help
Hi Walter,
The 2.2% decline rate includes offshore oil.
When we exclude federal offshore and Alaska, the US lower 48 onshore decline rate is 3.5% from 1970 to 2005 and 2.3% from 2000 to 2005.
I did a scenario somewhat like you suggested with output rising by 1% per year and then falling at 3.5% per year for each of the 10 regions (one region starts to decline every 5 years). Peak is 83 Mb/d in 2025, annual decline rates stay below 2.1% until 2055. Chart below.
Thanks again Dennis
I note that in the Hook study I referred to earlier, they found that the decline rate of the fields differed depending on when the fields were first developed. Thus fields developed in the 1960’s might decline at 4%, 1970’s 5%, 1980’s 6% etc. (see Tables 4-9) I wonder what this graph would look like if you gradually increased the decline rate as suggested by this study.
This would not represent the total “net decline” , but would give you a better sense of what the size of new discoveries and reserve growth will need to be.
Thanks for you help
Walter
Hi Walter,
Feel free to download the spreadsheet and play with it.
And keep in mind that the majority of the discoveries were the older fields and that fields that were developed earlier may not have started to decline yet so we will have a mix of different fields that were developed in different eras declining together.
So the regime for decline over time is unlikely to follow the pattern you envision. The other piece you do not account for is that new wells will continue to be drilled and new reserves will continue to be developed, this is the reason that the decline is not as high as you think it should be.
See the following post
http://oilpeakclimate.blogspot.com/2014/06/oil-field-models-decline-rates-and.html
Note that for the World, the fast decrease in the number of wells drilled shown in my Bakken and Eagle Ford models is unlikely except in the event of war or depression or when we have found adequate substitutes for oil so that demand and oil price decrease.
Dennis,
Then we have for example Mexico and Norway with a decline rate of about 4-4,5% the last 10 years (higher if I had not included the plateaus). I had a look at why the decline rate in US is only about 2%. It turns out that it´s because the individual states did not start the decline at the same time. For example Texas had a decline rate of about 4% from 1973 to 2000 at the same time as production in California did not start to decline until around 1985.
But yes it sounds reasonable that the world decline will start slowly and then increase as production in more and more countries enters decline. But it´s uncharted territory what will happen when world production starts to decline. When US production it peaked in 1973 oil production was increasing in other parts of the world.
Hi FreddyW,
In the case of Mexico we had one main field that was pushed to the extreme and then crashed. Norway is primarily offshore where decline rates will be higher.
The US onshore lower 48 is much more representative of what the World decline will look like. High decline rate areas will be offset by larger onshore areas that will decline more slowly. It will take above ground factors such as an economic depression, a major war, social chaos, or an epidemic to get a Seneca cliff.
This assumes extraction rates do not rise more than 3% above the high previous extraction rate in 1979.
I tried to create a Seneca cliff by increasing extraction rates slightly above the 1979 level and leaving extraction rates at this high level. Annual decline rates remain below 2%, output is on a plateau from 2018 to 2031.
Chart with scenario below.
Hi Dennis,
Then Texas should be a good example. The production is almost only onshore. If all countries will have a 4% decline when they eventually enters decline, then the world production will eventually decline by 4% when all countries are declining. However, if extraction rates are increasing, then the decline rate will be higher than 4%. And then is of course the question what will happen when world production starts the decline.
I think your new graph show what I mean. In your new graph the start of the decline is delayed because of increased extraction rate. When it eventually start to decline, the average decline rate is a bit higher than in your original graph. So increasing extraction rate means delayed peak which means higher decline rate after it peaks.
Hi FreddyW,
Yes the decline rate is higher when the extraction rate is higher, the question becomes, how high will extraction rates go?
The scenario presented may not be realistic, in that an 8% extraction rate World wide may never be achieved, if it is higher than this decline rates may be faster.
Note that if the URR(3400 Gb) is as large as I have assumed (which is 17% lower than the USGS estimate) and the extraction rates are no higher than I have assumed, the annual decline rate never rises above 2%.
What you are missing is that the 3.5 % decline rate for the US lower 48 onshore over the 1970 to 2005 period is likely an over estimate of the World decline rate.
My simple demonstration of different areas peaking at different times would need to have thousands of different fields of different sizes peaking and declining at different rates at different times.
The Oil shock model builds this all in using a statistical analysis.
A possible problem predicting the future is that the model assumes that the rate that new reserves are developed remains unchanged over time. This is to keep the mathematics simple and can be justified as follows. When the oil industry was first starting the reserves developed were the “best” and “easiest to develop” reserves and our technology was not as developed.
Over time as the best reserves were depleted, more difficult to produce reserves were developed and ceteris paribus would take longer to develop. At the same time technology improved over time making reserves easier to develop due to improved technology. The model assumes that these two opposing forces (better technology with more difficult to produce reserves) balance each other out so that the average rate that newly discovered resources are developed remains constant.
Based on comments from the oil guys, I would think that if anything the time it takes to develop the average newly discovered resource has been increasing due to the types of reserves being developed (Arctic, ultra deep water, etc).
I could attempt to model this, but before doing so would like to see some input by Fernando, Mike, MBP, Toolpush, Shallow sand, Rune Likvern, and Doug.
The question:
“Do you think the average newly discovered resource takes longer to develop on average today than it did 20 to 30 years ago?”
Thanks in advance for any estimates made by the pros.
Hi Dennis
I am defiantly not one of the “pros” but I’ll throw this in for your condiderstion. From the Financial Times ( url too long)
“New finds of oil and gas are likely to have been about 16bn barrels of oil equivalent in 2014, IHS estimates, making it the fourth consecutive year of falling volumes. That is the longest sustained decline since 1950.
Because new oilfields generally take many years to develop, recent discoveries make no immediate difference to the crude market, but give an indication of supply potential in the 2020s.
Peter Jackson of IHS said: “The number of discoveries and the size of the discoveries has been declining at quite an alarming rate . . . you look at supply in 2020-25, it might make the outlook more challenging.”
So far there has not been a single new “giant” field — one with reserves of more than 500m barrels of oil equivalent — reported to have been found last year, although subsequent revisions may change that.
The figures for declining discoveries are particularly striking because exploration activity in 2014 showed little impact from the sharp fall in oil prices in the second half of the year. The last time oil and gas discoveries were around 2014’s level was in the mid-1990s, when exploration activity was hit by a period of weak prices.
Last year, the number of exploration and appraisal wells drilled worldwide was only 1 per cent lower than in 2013. This year, exploration budgets are being cut back across the industry and the number of wells drilled is likely to fall further.
Depending on later revisions, 2014 may turn out to have been the worst year for finding oil and gas since 1952.”
You may also want to look at Steve Kopits presentations. He has a nice graph showing the rising cost of finding each new barrel.
Discoveries of new oil and gas reserves drop to 20-year low
Walter, I fixed your URL.
Hi Walter,
Most of the increase in reserves will come from reserve growth rather than new discoveries. At the end of 2010 Jean Laherrere estimates about 2000 Gb of C+C less extra heavy proved plus probable reserves had been discovered and he forecast another 200 Gb would be discovered after that time. His estimates are very conservative and do not account for reserve growth.
The US 2P reserves grew by 63% from 1980 to 2005. If the 2P reserves plus discoveries in Jean Laherrere’s model (1050 Gb) grow by 60% over 50 years that gives us 600 Gb and 2800 Gb of C+C less extra heavy oil with only 200 Gb of oil discovery after 2010.
Let’s say it occurs over the 2011 to 2100 period, that would be 2.2 Gb/year on average.
Hi FreddyW,
As a first guess at an increased time to develop new reserves, I adjusted the model so the average time to develop new resources increases from 34 years to 50 years in 1967. The 34 year time is used from 1870 to 1966 and the “1/k” constant for the maximum entropy probability distribution is abruptly increased to 50 years from 1967 to 2294.
For this new oil shock model extraction rates must exceed the 1979 level(8.64%) after 2004 and reach 10.4% by 2014. This level is necessary for the model to match the EIA C+C output estimates in 2014.
It is assumed that the extraction rate continues to increase at the 2009 to 2014 average rate of increase until a peak in output is reached in 2017 (78.2 Mb/d) and then extraction rates level off by 2025 and remain at 12% until 2100.
The World annual decline rate peaks at 1.86% in 2025 and decreases to 1.54% by 2029 and remains under this level from 2030 to 2100. Chart below.
Strange……Not a single well has been reported as “Producing Well Completed” or “Confidential Well Plugged or Producing” on the North Dakota Daily Activity Report Index for 5 days. Only 35 for the whole month of July.
https://www.dmr.nd.gov/oilgas/dailyindex.asp
Yes, I noticed that also. They may have just stopped reporting that. Otherwise things are getting pretty bad in the Bakken.
This site shows 95 new wells in The Williston Basin, North Dakota, as of July 17th:
http://themilliondollarway.blogspot.ru/2015/06/new-wells-reporting-3q15-williston.html
I’m not sure if their data is correct
Hi Alex,
For May they had 170 wells, but only 136 were in the ND Bakken/Three Forks, based on NDIC data. So the 95 wells is probably too high, about 75 is probably closer for ND Bakken/Three Forks
Every one of the wells that I checked from that link were wells that just came off the confidential list. I could find none of the “producing wells completed” on that list.
Most of the wells that were on the confidential list came on line at least a month earlier, in some cases several months earlier.
Thank you, Dennis and Ron
I was right to doubt the accuracy of their data
Hi AlexS,
What I have done in the past is use the daily reports (it is pretty accurate).
See https://www.dmr.nd.gov/oilgas/dailyindex.asp
Add up Producing wells completed and Confidential well plugged or producing (most of these are producing rather than plugged) for each day then assume 97% of these wells are in the Bakken/Three Forks and tou will be pretty close.
I haven’t done this since May. For April and May the numbers I got were pretty accurate in advance of the monthly data from the NDIC.
I just confirmed JR’s well count through July 17, 35 wells so far in July and none for the past week or so. We may soon see what 70 wells per month looks like.
Greece is going lumpenproletariat while the oil trains derail in slow-mo’.
While Greek suicides are up.
Matthew Day Jackson’s, ‘Lumpenproletariat (Alive)’. Close up. He’s in a space suit? Why should he be in a space suit on Earth?
Business Cyclemagic. Do you like Boards of Canada? Well then you’ll like Cyclemagic. We are just in a slump.
Not to worry, your government will take care of you…
48 million tonnes shipped by rail and is eight percent of the total in 2014.
.08t=48,000,000
t=48 000 000/.08
t= 600 000 000
7.3 times 600 000 000 equals 4 380 000 000 barrels of oil.
18.9 mi!!ion barrels consumed by industries and car drivers times 365 equals 6 898 500 000.
Closer to five percent for 2014.
Edit: corrected the numbers.
Pennsylvania natural gas data out:
Jan 12.59 bcf/d,
Feb 12.67,
Mar 12.75,
Apr 12.51,
May 12.03
Almost no revisions to past data – #Marcellus
This appears to be a big drop if there are little revisions.
yes, it is. Take into account that the largest revision I came up with was 0.25 bcf/d. Penn data are not subject to big revisions because the number of companies there is quite limited.
ALMOST TOTALLY OFF TOPIC but fun for gear heads and engineers:
Tesla has just come out with the ” Ludicrus Speed” stop light drag racing option and now the electric land yacht can do zero to sixty well under three seconds.
It is very interesting that on the gear head sites the electric naysayers have plenty to say about it taking a while to recharge a Tesla but NOTHING at all about the trip to the tire store to replace the tires on their gasoline powered hot rods every five or six trips down the drag strip.The Tesla doesn’t burn rubber to get traction so flooring it doesn’t eat tires.
In the meantime the attack on the conventional fossil fuel industry continues as the solar pv and battery powered car combination itself is starting to get some traction.
If I were younger I would own a VOLT or LEAF and a good sized pv installation for sure. There are plenty of ways to use any so called surplus power on a farm. I could even build a mini pumped storage unit of my own given my place is hill and valley land. The cost of a turbine would probably be prohibitive but with free juice I could certainly build some small farm ponds in dry hollows not otherwise productive and pump water to them and viola, fish farm!!
I like the fish pond idea. One might even be able to leverage a system of it to treat graywater and at the same time nurture edible water plants, water fowl, and a bit of a pond-based ecosystem and attract other species to it. It may be possible to replenish some ponds with rainwater with judicious swale/contour work that coaxes more of the rainwater into the ponds, perhaps even create a mild river or connected multi-pond system. It is possible that Sepp Holzer has or had something like that.
How does a Tesla get traction without spinning tires?
Ordinary hot rod cars achieve maximum acceleration from a stationary start by means of literally smoking the tires, melting some of the rubber and the surface of the asphalt , and this sticky melted rubber adheres to the underlying asphalt like glue. If you watch a video of high performance cars drag racing, the driver smokes his tires a couple of times to heat them up just before racing. AND when he nails it as the lights go green ( the race starts as a traffic light sort of rig known as the Christmas tree changes colors) he smokes them again going down the track. If he is not skillful this can result in a slower rather than a faster start. This sort of driving incidentally also has a way of busting up engines, transmissions and axle assemblies in what is euphemistically referred to as a “rapid unscheduled disassembly”.
With max torque at zero engine rpm and four wheel drive and a fixed final drive ratio similar to that of a dump truck plus electronic traction control the Tesla can launch with almost no wheelspin at all. The Tesla has the advantage of no shifting gears and low final drive ratio because with no reciprocating engine parts the electric motors can run at up to fifteen thousand rpm without harming them. An automobile sized conventional I C piston engine will explode like a grenade at 10,000 rpm or less.
IF you launch a conventional car without wheelspin this means the engine is not fully revved up and producing a lot less power than it is capable of producing. The ONLY way to launch at full engine speed is by spinning the wheels. As the car achieves forward speed matching the theoretical speed determined by the rotary motion of the wheels, the driver shifts up a gear. Hardly any conventional car has power enough to spin the wheels past the first couple of hundred feet but real purpose built dedicated drag racers maintain wheel spin more than half way down the track which is usually one quarter of a mile long.
The short answer is that an IC engine powered car can best apply its power for maximum acceleration by spinning the wheels. The Tesla can best apply its power by maintaing traction at the borderline of losing its grip and spinning the wheels. If you watch a video shot from behind a hard launched Tesla you will see that it does lay a very little rubber usually starting a few feet down the track. The computer keeps this very small amount of wheelspin from becoming excessive and actually reducing acceleration with COLD tires.
A weekend at the drag strip having amateur fun with your Nissan GTR or Charger Hellcat or Corvette or Shelby Mustang will cost you a thousand bucks in tires alone if you are a serious drag racer. With a Tesla you will need five bucks worth of juice to stay at full charge. A dozen runs will not noticeably wear the tires.
In racing parlance ”wheel spin ” means the wheel is slipping at the contact patch with the pavement.
Actually my two cents is that there is a fundamental difference between electric motors and internal combustion engines. Electric motors have close to if not maximum torque at zero rpm. while ICEs experience peak torque well up above 4,000 rpm for spark ignition motors and a little less for diesels. The challenge for ICEs at launch is how to transfer the maximum torque from a motor revving at over 4,000 rpm to wheels that are stationary, a task that is left up to a clutch or a toque converter. It takes a significant amount of skill or technology, as in computer assisted launch control, to get a car to accelerate as fast as possible when dealing with an ICE. There was a video posted back in January showing a 4WD Tesla streaking away from a Dodge Hellcat that, basically spent half of it’s time going down the track, smoking it’s tires. Epic fail! A more recent video shows the rematch where the Hellcat quickly catches and overtakes the Tesla without smoking the tires. In reality, as long as the tires are skidding, you have very little traction. It is when the tires bite into the track or “hook up” that the real acceleration starts.
By the time you are far enough down the track to get good non slip traction the car is going so fast already and the remaining portion of the track is so short that the car that gets the faster start almost always wins.
And the pros who do it for a living smoke their tires, standard operating procedure.
The sticky hot smoking slipping tires get the job done best – so long as the driver does not OVERDO it- which is easy if the car has ENOUGH power.
Dr
All cars since 2010 have Traction Control. Actually 2 wheel drive with Traction control will get you out of a sand pit where standard 4WD has no chance. The Model S Insane mode was only good to 30 mph since longer acceleration would melt the fuse. Not to fear. Now we have Ludicrous Mode
http://jalopnik.com/the-tesla-model-s-just-got-upgraded-to-ludicrous-speed-1718577723
It’s just not fair.
VERY FEW cars have Tesla quality traction control.The ones that do cost as much or more.
Generally speaking you turn traction control OFF when drag racing unless you are racing a VERY sophisticated high performance car but this is is not the proper forum to get very deep into this sort of thing.
I just wanted to point out that Musk and his pr team are probably the best in the world at getting free publicity for his car and building it into a legend in its own time.
Given the size of his company his team is also probably by far the best engineering team in the automotive world, on a head for head basis at least.
And just to be fair to the electric car naysayers, his accountants and bookkeepers are probably the best in the automotive business at getting freebies handed to them in the form of subsidies of one sort or another.
Yes, its a nice toy for the rich. I know a guy who owns a yatch with its own custom made China and silverware. Another put a waterslide from his second floor bedroom balcony. The rich do things like that.
HI Fernando,
If Musk is selling working mens electric cars for twenty thousand bucks in constant present day money ten years from now are you going to admit he is not just catering to the rich? 😉
Personally I believe there is a very real possibility batteries and electric motors will cost less than I C engines and transmissions ten years down the road. And oil is damned near for sure going to be a LOT more expensive by then.
Mac, he doesn’t have to sell a rich guy toy to build a cheap EV. It’s a gimmick. Read this:
http://21stcenturysocialcritic.blogspot.com.es/2015/03/i-interview-elon-mursk.html
I have read it already and will continue to read your blog just because you are a talented writer with a great sense of humor and quite skillful at poking at sacred cows.
But I disagree with a lot of your positions. In this case I believe the only practical way forward for Musk and his company to build a moderately priced electric car is to use the profits and publicity and momentum and experience gained by building a luxury car. ( The profits may come and likely will come mostly from the price of the stock but profits they still are and some stock can be sold to finance the engineering and production of his cars. )
Virtually every important manufactured product I can think of right down to toilet paper was at one time a luxury product.
The first crude metal spear point or axe head was probably worth at least a couple of virgin daughters to the man who had the daughters and wanted the spear point or axe.
Let me see…the model T? Nope. The AK47? Nope. The Motorola cell phone? Nah. McDonalds? No way. Walmart? No sir.
You see, Tesla is about bulldinky. Subsidized electric purée. It has no technology breakthrough, nothing. And the guy can’t even figure out how to build a cheap one. In ten years the South Koreans will be selling Japanese copies and the Chinese will be selling South Korean copies. As long as none of them come up with the competitive battery they’ll just have the same thing they sell today.
Why require a technological breakthrough?
Seems a bit more genius to me for Tesla to demonstrate what is possible using already developed technologies.
And where is the categorical line between an advancement and a breakthrough anyhow? Is Supercharging technology an advancement, or a breakthrough? Or perhaps, a scam. Nothing like giving your customers lifetime free rapid charging on continent spanning networks to bilk them of their savings.
Musk appears to be doing exactly what he’s always said he is doing. Time will tell of course, but once battery production begins and ramps at the GigaFactory, it should be evident if they have reached an economy of scale which makes the lower cost higher production Model III possible.
And oh what a fearsome specter you raise with the notion of copy cat Teslas flooding the market in ten years. An EV revolution. Quelle horreur. That will prove what a nincompoop Musk is.
And in the mean time, that shyster’s rockets will continue shuttling supplies to space.
Let me see…the model T? Nope. The AK47? Nope. The Motorola cell phone? Nah. McDonalds? No way. Walmart? No sir.
Your examples are crap.
The first cars were luxury items, manufactured by hand and sold to the rich. From Wikipedia: “Automobiles were considered extreme luxury for the common man until the Model T. The first Cell phones cost thousands of dollars. The AK-47 had many predecessors; the Thompson Submachine gun cost $200 when a Model T cost $400; most reports I’ve read suggest that its high price limited its sales. McDonalds and Walmart are not products but business models.
Musk is selling to a market he can survive in: people who buy expensive, low production luxury sedans. He seems (and has said as much) to be trying to build the institutional memory that will allow him to produce lower priced vehicles on a large scale.
Taking baby steps to learn the industry, and setting up production in a way to ensure some cash flow and the development of publicity and brand goodwill is the sign of prudence and humility.
We all know these are problem areas for Fernando.
-Lloyd
Cell phones? In my neck of the woods the first cell phones were so expensive, they were considered toys for the rich! I’m pretty amazed at how blasé some kids are these days about getting toys and other gifts that cost several hundred dollars, think X-box, Laptops and smart phones. When I was a teenager my parents (teachers) couldn’t afford to buy me anything that cost as much as a hundred dollars.
Back to the matter at hand though, Musk has repeatedly stated that his strategy is similar to the development of the cell phone and laptop markets, where early adopters paid high prices for most of the early development. I seem to remember early portable computers selling for thousands of dollars. Was it the Osbourne? Flat screen video displays also come to mind.
Back to the matter at hand though, Musk has repeatedly stated that his strategy is similar to the development of the cell phone and laptop markets, where early adopters paid high prices for most of the early development. I seem to remember early portable computers selling for thousands of dollars. Was it the Osbourne? Flat screen video displays also come to mind.
Yes, early cellphones and early computers were very expensive. They were a niche market when they first came out.
Marketing a powerful EV to the rich first is a great way to change the perception of EVs. They don’t have to be an econo-car. By making it “cool” to have an EV, you create more aspirational demand among a wider audience.
Also, how can selling vehicles to the rich be considered a communist plot?
Seems to refute the idea that people who support renewables are socialists and communists. There aren’t supposed to be rich people in those scenarios, right?
The Tesla? It’s Hollywoodesque electric purée. But hey, there are governments stupid enough to subsidize a toy for the rich. So I guess this proves in this world just about anything goes if properly marketed.
I suggest a trip to the Elon Mosque to get bs reinforcements.
I assume you don’t want us to take most of what you write here seriously.
You think communists are behind everything, but at the same time, when a person develops a product that is marketed to the rich, you have problems with that, too. Musk seems to be the anti-communist as far as I can tell, but because he sells EVs, he’s suspect to you.
Hi BoomerII,
You didn’t know that all environmentalists are just closet communists?
You have to pay attention! 🙂
Show me where I wrote Musk is communist.
Show me where I wrote Musk is communist.
You haven’t said it directly. This is what you have said:
I think it’s the watermelon factor. Lots of lefties are into changing the way the economy runs, using global warming as an excuse.
And this is what Musk has said:
Elon Musk: The Jonas Salk of Climate Change? – Getting to GREENR: On June 12th he took to Tesla’s website and pledged to no longer enforce the patents on his Tesla electric car: “Tesla will not initiate patent lawsuits against anyone who, in good faith, wants to use our technology.” Overnight, engineering developments protected by over 500 patents became part of the open-source movement. Musk wrote that his primary reason is because “it is impossible for Tesla to build electric cars fast enough to address the carbon crisis.”
So therefore, I mentally linked your statement on supporters of global warming being watermelons to Musk’s support of global warming.
As “30seconds” writes on the TMC forum, “I really can’t see how anyone can continue to compare Tesla to any other automaker with goals like this.” Tesla is in another league. On another planet. Its aims to do right by the consumer and the planet have it operating in a completely different way than big automakers, and it is being rewarded as a result. People love Tesla… as they should.
Of course, the other thing Tesla is doing is highlighting the benefits of electric vehicles. With many fewer moving parts and simpler insides, electric vehicles can last much longer than conventional gasmobiles before they are akin to moving trash cans. A gasmobile power train can’t legitimately last for 1 million miles. An electric one? Maybe. And if so, it seems Tesla will be the first to prove it. What’s new?
http://evobsession.com/1-million-mile-tesla-power-train/
Actually a gasoline engine and power train COULD last a million miles if the rest of the car were made well enough to justify the expense. But at twenty thousand miles a year , which is a lot for a car, it takes fifty years to accumulate a million miles.
It just is not worth it to build the drive train to such high standards because the public is not willing to pay upfront NOW for a car that will still be running forty or fifty years from now.
But it is no longer something to write home about when you see a pickup truck with four hundred thousand miles on the odometer with no major repairs to the engine and drive train. Heavy duty trucks occasionally go a million miles on the original engines and transmissions and drive axle assemblies without major repair but it is not unusual for an over the road truck to be driven cross country day after day with team drivers swapping out.
Modern gasoline automotive engines seldom wear out, cars are mostly junked with basically sound engines, all the major components such as crankshafts, cylinder blocks ,pistons ,cylinder heads camshafts, etc still in a one good condition.
Nobody excepting the collector and the owner of an occasional Rolls is interested in REALLY maintaining an old car when new ones are so cheap.
Modern engines do suffer expensive failures of individual components such as head gaskets and water pumps quite frequently and if repairs are not made IMMEDIATELY the engine will be ruined.
If I were a bureaucratic god then I would compel auto companies to build far fewer differently designed engines and drive trains and do a far better job of standardizing the ones built so as to make them cheaper and easier to repair.Back when I was a kid you could stock a dozen electric starter motors that would just about guarantee you could fix every car needing one that would arrive at your shop. Nowadays you would have to stock at least a couple of hundred to have a fair shot at having the right one on hand. And back then you could usually just put in a repair kit instead of a new starter.
But while I enjoy older cars I have no desire to drive an antique on a daily basis. Cars actually do improve so much from one decade to the next that driving a car much more than twenty years old is questionable in terms of your own personal safety and in terms of fuel economy and comfort etc.
My ninety nine ESCORT at least has air bags and disc brakes. If it were an eighty nine it would not have air bags. Some seventy nines still came with drum brakes all around iirc.
http://www.prnewswire.com/news-releases/10-year-vehicle-lifespan-is-the-new-normal-according-to-automdcom-annual-mileage-report-251181521.html
http://www.nytimes.com/2012/03/18/automobiles/as-cars-are-kept-longer-200000-is-new-100000.html?_r=2&ref=business&pagewanted=all
Tesla has, to be grossly oversimplistic, a ‘sub-quantum natural computing-communications system’ that ‘whispers’ (in a realistic synthesized Elon Musk voice) to the ground and informs it in no uncertain terms that it is a Tesla, and therefore not just any car, and indeed, by the grace of its ability to communicate with the universe, the universe– or God, if you will– complies with its demand to allow the Tesla the correct degree of traction.
This comment was composed with the all-new Mom’s Basement™ Keyboard Warrior® version software! When hand-delivered milk and cookies are not enough, now there’s Mom’s Basement™! (A Fox News post-media product.)
While we are on oil by train. I got to see first hand,why the rail companies are having a few issue of keeping their trains upright. While visiting one of my wife’s relatives west of Waukesha Wi, there is a rail over road bridge with a low height clearance of 12′ 6″. even though extensive sign posting stating this in several miles before the bridge, trucks regularly run into it, as one did the night I was there. This happens approx once per month, so I have been told.
Apparently the engineers come out to inspect it after such occurrences, but there was an tanker train passing over it the following morning, they must be quick!
What really shocked me was when we finally drove under the bridge, and found out is was of wooden, looked like pine, construction. Obviously not of the latest era of bridge construction, and with how many recorded, and unrecorded impacts over time.
In my eyes this is an accident waiting to happen, and I am sure this is only one of many weak points in the system?
I know the railways are spending big money upgrading their system, but after many years of being run down, they obviously need to keep the money going into basic rail improvement to keep the oil tankers on the rails.
On an other point, does any know how many road oil tankers crash, leak and blow up compared to the rails?
Tanker accidents resulting in highway fires are not common at all.
They used to be , but the trucks are better constructed these days and less likely to leak if wrecked.
More importantly , the drivers are extremely careful given that they are mostly vetted down to the very best of the best and subject to losing their jobs in the event of causing an accident.
Such trucking jobs are highly prized because they mean good benefits plus good pay and sleeping at home every night with the wife instead of in the sleeper wondering who is sleeping with her while away from home ten days straight. You get to watch your kids play ball.
And the drivers hauling gasoline are well aware that a serious accident may result in their own backsides being burned up.If you have ever had a driving under the influence or reckless driving conviction etc you are extremely unlikely to be hired to haul gasoline or diesel fuel. You will pee in the bottle at random unannounced times.
I don’t know about the guys hauling crude on backroads in places like North Dakota. They might not have caught up yet when it comes to regulating commercial drivers in places with little truck traffic until recently.
OFM,
I am sure it is the bet of drivers that drive oil tankers, but here is a link that shows road tanker accidents may be a little higher than you thought. I have not had a chance to read it all as of yet. It is also a little old, 2009.
http://www.manhattan-institute.org/html/ib_23.htm#.VapqFl-qqko
It would be just about impossible to say how many actual tanker truck accidents occur using this link because it is all in ton miles.
Damned near every drop of diesel and gasoline and home heating oil is delivered to retailers or retail customers by truck on busy highways. Pipeline and rail deliver over long distances without sharing their right of ways with cars.
But given the number of tankers on the road you hear about one being in an accident very rarely and most such accidents do not result in deaths or serious injuries. The vast majority of trucking accidents are like auto accidents- relatively minor ones. So we only hear about the ones resulting in deaths and injuries.
This is not to say you won’t hear about a whole block burnt up occasionally and a few people killed by a tanker truck accident. Some years ago a careless local driver pulled away without disconnecting his transfer hoses from a big propane tank in a small tank farm and the result was the loss of the entire facility as well as property nearby burning as well. This one accident ran into several millions of property damage but fortunately no serious injuries or deaths. People are still talking about it around here ten years later.
Most pro truckers get paid partially or wholly on a piece rate-based on the miles actually driven and the number of stops to pick up or drop off cargo. Tanker drivers are paid almost exclusively by the hour with a satellite connection from the truck that lets the boss know PRECISELY where he is and how fast he is going at any given minute. So there is essentially zero reason for a tanker driver to hustle except when stopped and loading or unloading. Speeding costs him money instead of making him money.
Hi Ron, do you still think oil production will be in serious decline as early as 2017? If so, the Saudi/OPEC game plan seems self defeating. Why not sell (in theory) half the barrels at twice the price? Saudis cannot be helping themselves with $50 oil for an extended period.
More anti-fracking gaining traction in Canada reported in G&M yesterday also.
http://www.theglobeandmail.com/news/national/earthquakes-shake-alberta-towns-faith-in-fracking/article25570082/
“Why not sell (in theory) half the barrels at twice the price?” Or how about saving a bit for your grandchildren? Must be a dumb idea since no one is doing it. Right?
Doug,
Conventional commodity markets are based on high fixed upfront costs. So, most of the money is already spent when production starts (think of oil platforms or infrastructure for copper mining). Therefore operational cost are basically the same if the unit produces or not. Even if then prices fall, it is still more profitable for producers to operate rather than mothball a production site. There is the iron rule that the last ton is the cheapest, which basically means that producers have to produce as much as they can, now matter how deep prices fall. This is especially the case, when prices are coming down after a long period of high prices and subsequent a high level of new capacity on the market. This is also the reason prices can come down to extreme levels as it happened 1998 for oil.
Sigh. No doubt everything you say is true. But, it seems a shame that a country such as Norway ((extraordinarily rich, energy independent (hydro), very well educated)) would be rushing to extract the last drop of oil from its portion of the North Sea. Because, that’s exactly what they’re doing.
Greece is a model.
They voted as follows — “The choice was economic chaos or crushing austerity likely forever”. We choose the latter.
Known horror is preferred to unknown horror.
Norway’s government would be replaced. It was done in Italy a few years ago. Syriza was co-opted last week. Money can buy things.
Doug,
Norway prefers to cash in the oil and save it in a sovereign wealth fund. So they have better control about the national wealth. However, it is also more risky as a sovereign wealth fund can be lost. Oil in the ground of the North Sea will probably not devaluate as fast.
“Norway prefers to cash in the oil and save it in a sovereign wealth fund.” Perhaps. I spend a couple of months of every year in Norway and so witness many debates on drilling vs not drilling. I think the main reason exploitation always prevails is because they prefer the economic activity and employment derived from exploration and extraction.
I for one do not believe that low prices are the result of a GAME PLAN unless the primary goal of the plan on the part of the Saudis and a couple of other OPEC producers has MOSTLY been to put some dry involuntary sex on enemies and perceived enemies such as Iraq, Iran, and Russia. Cutting of an enemies money is as good as killing his soldiers sometimes.
The fact that the low price of oil is killing American tight oil is merely icing on the cake in my opinion, from the OPEC pov. The Saudis have to know that tight oil will be back as soon as the price goes up again.
The low price of oil is in my opinion more the result of a train wreck in the industry than any ” game plan”. Production capacity temporarily outruns consumption. The world wide economy has the flu and efficiency is improving faster than expected by most folks.
The Saudis additionally have a powerful incentive to teach the rest of OPEC to play by the rules as well NEXT time there is a supply glut- If there ever is another supply glut.
Beyond these considerations I believe only a FOOL could possibly think UNCLE SAM is not tickled pink by the low price of oil and doesn’t give a damn, under current circumstances, about the tight oil guys or even Exon having troubles—— considering the overall state of the economy.
And while I am not a conspiracy nut, there is the fact that the Saudis must understand that the only real hope they have of staying on the throne is the backing of our military. Negotiations between ambassadors don’t necessarily have to be converted into publicized treaties or agreements. Nations sometimes do things quietly by making agreements quietly at the very highest levels.
I would not be surprised at all if Uncle Sam has not quietly promised the Saudis that we have their six for another decade or two in exchange for helping keep our own economy afloat and putting the screws to the Russians and ISIS to some extent for now.
Practical people make lemonade out of lemons to the extent they can find a way to do so.
DEPLETION and low upstream capex will solve the oil industry’s low price problem pretty soon. Maybe another year or two at the most.
John, decline rates are extremely hard to predict because so much depends on the state of the economy. If stock markets around the world collapse throwing the world into a deep recession and possibly even a depression, then the decline will be very fast, likely in excess of 5 percent by 2017 and later. But if the economy becomes robust and healthy then the decline will be very slow.
My money is on a slow drop originally but speeding up by the end of 2017. But that is just a guess and it is not even an educated guess.
Anyone who tells you that they know what the economy will do is lying. And anyone who tells you they know at what rate oil production will decline after the peak is lying. But we can make educated guesses. And some educated guesses are more educated than others. I am making an educated guess as to when world crude oi will peak. I do not know but I have a very strong opinion, an educated guess, that we are at peak right now. But I don’t even have an educated guess as to how fast the decline will be after the peak.
I think you are very right in your assessment. Everybody knows that recessions are unpredictable except for the fact that they tend to occur cyclically. On the other hand after peak oil most countries will face a reduction in the amount of oil available to their economies, that will vary in intensity depending on the country. However we do know that past periods of reduction in oil use (lots of examples, the early 80s, USSR collapse, Southern Europe debt crisis) have almost always been associated with recessions. I think it is a safe bet that after peak oil the inevitable reduction in oil availability will cause a recession in most countries. It is a lot more likely that the global economy will do quite badly after peak oil than the opposite. We could even enter into a positive feedback loop: worse economy -> less oil -> worse economy, leading to a collapse.
“It is a lot more likely that the global economy will do quite badly after peak oil than the opposite.”
No. It is a certainty that the global economy will do quite badly after peak oil.
“worse economy -> less oil -> worse economy, leading to a collapse.”
That sounds about right. We are reaching the inevitable end of world economic growth. We can argue about the minor details as events unfold, but the final outcome is certain: Collapse.
This was logically obvious when Limits to Growth was first published. It is even more obvious today. I don’t see why this is surprising to anybody.
re: “the Saudi/OPEC game plan seems self defeating. Why not sell (in theory) half the barrels at twice the price? Saudis cannot be helping themselves with $50 oil for an extended period.”
Perhaps it’s the ruling clans version of scorched earth. To wit, they know they’ll be bugging out for the french riviera soonish and they’d like to leave with as much $ as possible and as well leave as little resource behind as possible for the usurpers to capitalize on after their gone. They don’t seem to interested in husbanding their resource for the long term so I’d suggest perhaps they don’t plan on being around at that location in the long term. What they’re doing makes perfect sense if they know they have to leave before too long and they don’t want to leave anything behind when they do.
Because they need the natural gas that’s produced with the oil to generate electricity and stay cool. If ever there was a place where solar power made sense was the Arabian peninsula. Alas, the oil companies have conspiracies to stop the Saudis from finding out solar power is cheaper.
Below is a short paper on the decline of European freight percentage and the relative rise of American freight carrying percentage. Discussed are reasons for this divergence and why the US depends so much on rail freight transport. Geography and politics at work.
http://link.springer.com/article/10.1007/s11116-006-9103-7#page-2
For the frequently (but not always) delusional Electric guys.
‘MASSIVE LEAP’ WINS ENGINEERING AWARD
http://www.bbc.com/news/uk-scotland-33552037
“….It has developed a digital hydraulic power system that can replace the mechanical gearbox in conventional wind turbines. The “Digital Displacement” system is set to power the next generation of offshore turbines, making them more efficient and reliable. One system has already been installed in a 7MW turbine – double the current average turbine power of 3.5MW – off the Scottish coast…”
As I have said so many times, lots of room for big improvements in wind/solar- higher performance, lower cost.
A gearbox between blades and alternator is absurd, Parker -Hannifin and many others have got good performance from hydrostatic or simple crank.
My favorite- a crank pumping water to an underwater balloon- many wind turbines in, one big hydroturbine out. 24 hr power.
Wimbi ,
This does not quite make sense to me as you describe it but I am not an engineer.
Pumping AIR into a balloon would be workable if you could build a big enough and tough enough and durable enough balloon. But you do not tell us how you intend to use the air pressure to drive a hydro turbine.
I would like to hear how you use the air pressure to pressurize the water that will drive the turbine.
Methinks there is a tough nut problem involved at this step that will require a lot of plumbing on the grand scale.
I wonder if it will ever be economical to build and deploy such a large bladder.
It might be cheaper to build a dam in a steep valley near the seashore and pump seawater into it and use it as a pumped hydro system in conjunction with the wind turbines. Suitable sites are probably available in many places with mountains close to the sea shore. It might also work to just build TWO dams in the same valley and use the wind to pump the same water uphill over and over from the lower one to the upper one.
One thing is for dead sure. If such a pumped hydro system is technically feasible and economically practical then many of them WILL be built as times get tougher and various countries have to import more and more expensive fossil fuels that are less and less likely to be for dead sure available as needed.
The general public will roll over environmentalists like a fast moving truck rolling over a slow moving dog in the road once blackouts start happening.
Personally I can’t see any reason at all why such dry valley pumped hydro will not work if the water is recycled between the reservoirs. Such a system would be useful to help balance not only offshore wind but also onshore wind and solar farm output.
It could also be used to make good use of any off peak nuclear power available.
I wish I could get a patent on the idea, lol.
It seems REALLY strange given the amount I read in so many different places on the net but I don’t think I have seen the concept of a ”dry” valley pumped hydro system used in conjunction with wind farms mentioned before.
Of course there would be a need for SOME replenishment of the water supply due to evaporation and some soaking into the ground but finding that much water ought not be too big a deal. Even a smallish stream running thru a ” not quite dry ” valley might be enough.
http://www.google.com/search?client=safari&rls=en&q=energy+storage+with+air+in+bladder&ie=UTF-8&oe=UTF-8
Lots of action going on.
I read the first four or five links. There are no diagrams but the descriptions seem to indicate using the compressed air to directly drive a gas turbines rather than the air being used to force water thru a hydro turbine.
There will be an ENORMOUS loss of energy due to the air heating up during compression and cooling before it is needed some minutes or hours later- so there will need to be some means of insulating the bladders rather well to avoid this loss.
And keeping a lots of cubic meters of air submerged is going to require some extremely strong and heavy anchors and extremely strong bags in order that they simply don’t rip away from the anchors.
If these practical problems can be solved then the theoretical aspects of such a system appear to be superb. At a few hundred meters down the pressure of the released air will be almost exactly constant no matter whether the bladder is full or almost empty.
Building such a bladder in a pit and covering it with loose sand also appears to be a workable solution and this would also obviously be far far cheaper. But whether the bladder could withstand the wear and tear of sand rubbing it is questionable. You would need a huge pit and a huge bladder and a gazillion tons of sand.
Yep, all that and more is what energy engineers work on to earn a living.
There aren’t any deep mysteries here, all very well understood. Question always is – does it make sense relative to other storage methods?
I was thinking of using the turbines as multi-stage compressors, to get near isothermal compression. Or, pump water as a sort of hydro link between turbine and store. Details, details.
Just do all the arithmetic and find out if and what’s best. SOP.
Anyhow, in-line gear box is most definitely NOT best.
Pumped water is best, by far. Offshore=extremely expensive, using gases=Inefficient.
Rather than rushing into unproven technologies the better solution is to subsidize several renewables options without having the government spell out the answer, like they do today in so many countries.
Mighty hard to think anything new in hydro storage. Been raked over for a century, and all sorts tried.
Sea water near a coast mountain is good. That’s why I go for the Red Sea as a good site for solar, not many places better, except for that little problem of swarms of bad guys rushing hither and yon with incomprehensible motives.
My solution- bribe ’em real good from your factory ship off the coast.
This link tells us essentially nothing about this supposed ” digital hydraulic ” break thru except that it won a respected prize.
If anybody actually has a link to an article explaining how it works in terms comprehensible to a layman please post it.
Digital Displacement. Instead of varying the stroke mechanically, output is controlled by digitally enabling individual cylinders on a stroke-by-stroke basis. Each cylinder is provided with electronically-controlled digital valves, capable to change state in few milliseconds. Each cylinder may be switched from idle, motoring or pumping cycles once every shaft revolution, in a pattern determined by an embedded controller. This results in much faster and more accurate control response compared to variable-stroke machines.
There are clear animations in the linked descriptions.
http://www.artemisip.com/our-technology
Thanks Doug,
I suppose this system is controllable in that it would be easy to keep the alternator at a constant rpm while the rpm of the turbine itself varies with the wind intensity. This would I suppose be a substantial advantage.
Why do gearboxes in wind turbines fail ? Is it not possible to build them strong enough?Are they running to close to the maximum torque limit ? Are the lubricants not quite up to the job? Is it that a good enough gearbox is simply to heavy to mount on the tower along with the rest of the stuff up there?
They are learning. I think this is caused in part by the aim to keep investment low. The other issue is the need to stick the machinery up in the air. I’m pretty sure they have to optimize on weight and not forcing the tower into larger diameter and load resistance territory. I think they got a lot to learn. In 20 years they’ll have something better.
Hi Mac,
If you care enough Google Wind Turbine Failure: But, it’s VERY complex. Premature gearbox failures have plagued the wind turbine industry for decades. Emergency stops are typically the most severe torsional events to occur in wind turbines. Basically, they have large rotating masses in the blades and generator which are subject to a wide variety of transient loads. Conventional torque limiters provide some protection against forward torque spikes where bearing rollers are in position to take a 150% load. However, the same slip torque level in reverse is high enough to damage the skewed and skidding rollers during sudden torque reversals. Even in the modern pitch-controlled turbines there is growing awareness of a link between the frequency of emergency stops and the life of gearboxes and blades: The primary problem. Even MEs don’t pretend to understand all the issues involved.
Thanks again Doug,
Any gear head can tell you all about the RESULTS of sudden starts and stops in machinery. We used to replace clutches, transmissions and rear axle assemblies just about every weekend when I hung out with friends at the drag strip. A sudden stop is as bad as a sudden start.
After reading an hour or two on this subject it appears to me that the large majority of turbine gear boxes to last out the five year typical warranty.
Given that they last that long then beefing them up some more will likely ensure that they last out the life of the entire top assembly. Of course you are right that figuring out just where and how they need to be strengthened is a tough problem.Getting enough steel up on top of such a pedestal to withstand the loads imposed by such long heavy blades being shoved this way and that by the wind WITHOUT FLEXING has to be a damned tricky job.
Gears and bearings don’t give trouble so long as they are lubed and in perfect alignment and not subjected to sudden stops and starts.
I have not yet found out why a turbine should suffer a SUDDEN stop except due to catastrophic failure of some component. A deliberate SUDDEN stop would likely shear the airfoils or the gearbox or whatever.
The more I look at present designs, the more I prefer the kite idea. Nothing up there but a wing, all the heavy stuff on the ground, and no nonsense about wild swiveling and shock loads. The kite cable is an ideal shock absorber.
Sure, has lots of unresolved puzzles. What doesn’t?
Plenty of motivation to put some real effort there.
How can we even begin to honestly discuss (let alone take any action) regarding limits to growth when one of the two major political parties in the United States lie out their asses and encourage ignorance amongst the populace?
http://thinkprogress.org/climate/2015/07/17/3681786/speaker-boehner-blames-california-drought-obama/
Good thing the Going Obsolete Party has a 16-strong portfolio of strong, serious candidates, led by the Donald.
What happened to G.W. Bush’s proclamation that “we are addicted to oil”?
Not that the other major party has been giving the populace the straight dope either…but at least their folks don’t usually speak the kind of idiocy as comes from the other side regularly.
Both of those political parties will lie, cheat, and steal to get elected.
There is a place on this earth for both Republicans and Democrats, but that place hasn’t been dug yet.
“When Republicans stop telling lies about us, we’ll stop telling the truth about them.” – Adlai Stevenson
Not anymore, both political parties need to be swept into the dustbin of history. Neither one of them can be trusted.
America will survive without them and is doomed with those two packs of hyenas devouring everything in sight.
Earth is hanging in there out there in space today. Still the same size, not shrinking in the least.
Beautiful day in Italy, the Mediterranean has clear skies from Spain to Turkey, Greece is doing fine from space, so all is well. The Black Sea is visible and the Caspian, Africa is in full view with few clouds covering the continent today.
http://www.sat.dundee.ac.uk/geobrowse/geobrowse.php?sat=0&year=2015&month=7&day=18&slot=1200&ch=1&grid=0&size=1
Need to be registered, it’s free and worth it.
http://schrts.co/iGbEoJ
The Dow Theory sell signal for stocks occurred earlier this year and is still intact.
http://tinyurl.com/osaodka
http://tinyurl.com/ocmbwl7
US stocks above their 200-day moving average suggest ongoing deterioration of breadth and leadership (dominated by AAPL, biobubbletechs, and “health” (cough!) care, tracing out a similar pattern as in 2011 and 2007-08.
https://research.stlouisfed.org/fred2/graph/fredgraph.png?g=1tiu
https://research.stlouisfed.org/fred2/graph/fredgraph.png?g=1tis
https://research.stlouisfed.org/fred2/graph/fredgraph.png?g=1tiv
https://research.stlouisfed.org/fred2/graph/fredgraph.png?g=1tiw
https://research.stlouisfed.org/fred2/graph/fredgraph.png?g=1tix
https://research.stlouisfed.org/fred2/graph/fredgraph.png?g=1tiL
We’re experiencing a replay of 1985-86, which coincided with the crash in the price of oil from $37 to $16 (2015$), IP mfg. decelerating to ~0%, and the onset of the S&L Crisis (and FSLIC closures).
Canada experienced a mild recession but was not in a MASSIVE real estate and debt/income bubble as is the case today.
However, US real GDP was twice today’s rate; debt to wages and GDP was much lower and we were in the early stage of a reflationary epoch from falling nominal interest rates from 110- to 120-year highs; constant 2015$ oil was $16-$17/bbl and gasoline was below $2/gal; peak Boomer demographics and labor force participation were just ramping up for spending and household formations; today’s “oil” production per capita is 25% below the secondary peak in 1985 and 45% below the 1970 peak; Japan was in their demographics-induced stock and real estate bubbles; and China was a marginal, agrarian, Medieval-like society and economy.
During debt-deflationary regimes (as in the 1830s-40s, 1890s, 1930s-40s, and Japan since 1992), the yield curve DOES NOT INVERT prior to recessions.
Time will tell if the US and world economies are resilient enough to withstand the weakening demand reflected by the energy/commodities sector bust along with unprecedented financial asset bubbles and the trend rate for global real GDP per capita growth of near 0%. I suspect that the risks are rising for another global debt-deflationary recession and stock and real estate market crash; central/TBTE banks panicking again and resuming QEternity to fund $1 trillion deficits to prevent contraction of money supply and nominal GDP; the price of oil making a new low and perhaps falling to the $30s; a decline in US oil consumption resulting primarily from a decline in consumption by the energy- and energy-related transport sectors; decelerating price inflation and into periodic deflation; the 10- and 30-year yields plunging to 1% or below and 2% respectively (Japan- and EZ-like yield structure); and a 1930s- and 2000s-like deflationary collapse in China (and extending to the rest of Asia).
Along the way, I expect trade and diplomatic relations between China and the US and Japan to deteriorate and eventually collapse and US embargoes and blockades against China in the Pacific, Africa, and South America, with China being forced to turn inward from the rest of the world and become violently reactionary to deal with domestic instability.
http://opsweb.phmsa.dot.gov/pipelineforum/docs/Ratemaking%20for%20Energy%20Pipelines%20071111.pdf
http://www.aopl.org/wp-content/uploads/2014/04/Oil-Pipeline-Rate-Index-Summary-Sheet.pdf
Oil pipeline use fee determination. Up for review. Gubmint regulated.
Worked through it. Rail is $10.70/barrel. Pipeline $5.60 after the upcoming index review. Typical distance NoDak/Houston or NY.
For those interested in looking at economics of shale oil and gas production on a case by case basis, might want to look at online auction sites. Much data, really too much at times.
One thing I am noticing, it seems most net revenue interests are below 80%. Many in 74-76% range.
It could be that sellers of these interests are carving out additional overriding royalty interests, or maybe original leases provide for a royalty of nearly 1/4.
I think sometimes here it is easy to generalize and get into the rut of thinking a well completed in the middle bakken will produce “X”. Or a well in the EFS will produce “Y”. Or that all wells have OPEX of $X.XX per BOE.
Don’t get me wrong, I appreciate the great data posted here. However, each well, or lease, is its own economic project, and therefore, each carries a pretty significant risk. It is definitely not like manufacturing widgets.
Given the risk is so high, I think returns are being mispriced in the current environment. Perusing the auction not only provides some useful case by case data, but also gives once a sense of the dangerous place the US lower 48 onshore industry is in.
There are some noteworthy companies who are trying to get rid of stuff that is underwater on an operating basis, for example. Imagine owning 10,000’+ wellbores where the options are to spend $100,000s plugging them out, or keep operating at a significant loss. Makes it much worse if the project did not happen to pay out in the first place.
For every Grail Field or Karnes trough, there are many, many more that have been abject failures, even if oil stayed at $100. Upstream oil and gas is very risky, and if only the very best projects are able to make a modest return, it is going to get very ugly.
Imagine the same situation, but in a far more expensive offshore operating environment, e.g., the North Sea.
I’m a conventional player, Geophysicist, in East Texas. Our NRI is with few exceptions below 75%. Not real sure about shale, but I’ve heard some NRI’s below 67%, 33% to mineral holder. Fee acreage held by majors can be worse. ORRI in addition is a possibility, but can overburden a deal to the point of making it difficult if not impossible to sell. Great posts, really enjoy reading. Thanks.
Richard and Jeffrey, thanks for your posts.
It is interesting that upstream companies give little guidance regarding net revenue interest percentages.
Also, to the point re offshore production, I read where COP terminated a three year deep-water rig contract with Ensco. Unless Ensco is able to mitigate damages, COP is on the hook for $550K day rate for two years, plus another $32 million fee. Amounts to a $400 million write off.
Big Bloomberg article about COP choosing to pay $450 M termination fee rather than drill in GoM. How revealing is that?
There is definitely a shale focus in discussion here because shale was the instrument of salvation from the obvious doom unfolding. Ron has laid out often how global output growth has been from the US over the past several years.
We’re about to shift into reverse, and China hasn’t slowed consumption growth.
Any magical prospects there in East Texas?
An expensive sunset for the Brent Field
http://www.nytimes.com/2015/02/19/business/international/royal-dutch-shell-dismantling-brent-oil-field-in-north-sea.html
I suspect that a fairly high percentage (ballpark guess maybe 10%?) of global crude oil production consists of “Zombie” wells and fields, where the wells and some fields are cash flow negative, just on a Lease Operating Expense (LOE) basis, but the operators are unable and/or unwilling to allocate the capital to plugging and abandoning the wells and fields. Of course, when one considers General & Administrative (G&A) costs, it would look even worse.
Note that net cash flow math is similar to “Net Export Math.” If LOE were 50% of wellhead revenue at $100 oil, then at $50 oil, net cash flow would go to zero, assuming no material change in LOE. And again, when we allocate G&A costs, in both cases ($100 oil and $50 oil) the net cash numbers look worse.
Here is another article on North Sea decommissioning costs:
Oil firms may retain clear-up costs for hard-to-sell North Sea assets
Jul 21, 2015
http://www.reuters.com/article/2015/07/21/us-oil-northsea-m-a-idUSKCN0PV15Q20150721
Oil firms trying to sell aging North Sea oilfields are considering shouldering hundreds of millions of dollars in future dismantling costs to help find buyers, industry sources say.
One of the world’s oldest and most important offshore oil and gas production basins, the UK North Sea faces dwindling output and a growing number of redundant platforms that require decommissioning in a scale and complexity never seen before.
The near halving of oil prices over the past year to below $60 a barrel has forced the industry to slash spending, increase efficiencies and sell or shut down assets that are least profitable or which do not fit their portfolios.
But despite a large rise in the number of assets up for sale in the North Sea in recent months, only a few deals have been completed.
“There remains a very big gap between buyers and sellers and that hasn’t been narrowing the way some expected,” said Christopher Young, director of the Strategy Group at KPMG.
Decommissioning, which involves plugging wells with cement on the seabed and removing obsolete platforms and pipelines, has proved to be a major stumbling block for deals.
As companies come to grips with an extended period of low oil prices, the urgency to sell assets is growing. As a result, boards are weighing up new strategies.
“A lot of companies under stress are now starting to consider if retaining some or all of the decommissioning liability might be an option for selling,” Young told Reuters.
“Our conversations with a number of North Sea operators suggest that others are now considering selling assets while retaining decommissioning liabilities.”
BP and Total are among several field operators considering such a strategy, according to the sources.
“On the big old fields, which is what the majors are selling, decommissioning is a major issue. They have been trying to sell some of those fields for quite some time. It’s unattractive to take on those decommissioning liabilities,” Tony Durrant, Chief executive of Premier Oil told Reuters.
“The others, including BP, are coming around to the view that the only way they can reduce their assets in the UK is by retaining those liabilities.”
Decommissioning costs can reach hundreds of millions of dollars for the larger North Sea assets.
Total decommissioning costs in the UK continental shelf over the next 30 years are expected to reach around 50 billion pounds ($78 billion), according to a strategic industry review by sir Ian Wood for the British government.
BP, which has been selling assets in the North Sea since 1996, said it is considering all options.
“Our preference is to sell assets with the decommissioning liability, however the agreements reached with buyers are deal specific,” a spokesman said.
DE-RISKING
The concept of shouldering the decommissioning costs was used at least once when BP sold to DNO in 2003 the Thistle field, today operated by Enquest.
The oil price drop also offers opportunity for buyers, particularly private equity funds such as Caryle Group, and Riverstone to invest in the North Sea.
Removing the decommissioning costs would make late-life assets more attractive and remove a lot of risk buyers might associate with them.
“The number of potential buyers for such assets will be far higher than is the case in a traditional sale,” a KPMG report said.
At the same time, seller will receive a higher price for the asset which would boost balance sheets in the short-term.
But the risks for sellers are significant as they will have to earmark large sums of money for the future decommissioning. Legal pitfalls may also arise, KPMG said.
We have been doing that for many years. Sell the property but keep the abandonment liability. The company I worked for also had a team doing research on platform abandonment techniques over 25 years ago.
Watcher,
In conventional play the easy stuff is gone. We look for missed hydrocarbon. Better 3D seismic helps. We also look at fracking to open old plays. We usually drill vertical or slightly deviated, almost never horizontally. We tried a horizontal in the Yegua and lost big time. Yegua TOTALLY different than shale. Our plays usually only a few wells but total reserves 20-30 BCF 750k-1mm bbls condensate, in Yegua something like API 45+ grav. Still, IP rates on wells of 9mmcfd on avg and 600-900+ bbls condensate. Usually condensate falls to 70 bbls per million. We make pretty good money on wells.
45+ is exportable. Though Iran is flooding the market with condensate, which doesn’t turn into diesel.
The fracking of old dead conventionals is interesting. Any idea how much oil can free up on average doing that?
I dont think they are dead, they are known plays which failed to produce at acceptable rates and reserves. That’s the real future in most countries.
Fernando,
Some are considered old and dead, believed to have been depleted. Fracking and enhanced recovery can open them up. Geophysical data and processing techniques help assess fields that may have further recoverable reserves, in addition to spotting missed or bypassed pays. We never moved on a prospect unless the risk was acceptable as was the ROI. Majority of prospects usually had ROI over 3:1.
So the pressures are depleted? And you make money by fracturing a pressure depleted reservoir? What do they look like?
Watcher,
I’ll ask my reservoir engineer source and post what I find. We’d use geology and geophysics to determine theoretically what production should be. We’d present maps, logs, etc to the engineers. They’d compare to production, generate models and economics so that we could all decide whether we wanted to pursue it or not.
Richard,
I know a company that wanted to explore sub salt in the Yegua. Is that a legitimate target in your eyes? Have any other companies played around in the sub-salt in the that region?
Toolpush,
Subsalt is considerably riskier. We focused on shallower yegua. 10000-11000 ft wells, unpressured to one-string of pipe. At higher drilling cost, DHC of $6.5-$8MM. Now closer to $5-$5.5MM. Subsalt you’re talking way over $10MM. Data processing just to image subsalt is expensive. Prospects subsalt have to be large to justify risk and deliver sufficient ROI. Our shallower yegua plays could be drilled on cash flow. Subsalt, probably not. We operated on cash flow rather than debt.
Richard,
Thanks for that. Now is certainly not the time be playing around with such ideas, but as you say, even with $100 oil you needed a big budget to dabble around in the over pressured sub-salt.
Toolpush,
You’re welcome. We have deep miocene plays in Louisiana which have been shelved because of risk. Additionally some of these are dry gas, some oil, and require barge rigs at that. We wouldn’t consider them at $100 oil\$6 gas. Some might, but too much risk, too little reward for us.
Hey Shallow,
I always meant to ask you what is that auction sites that you have? I have never heard of that in Canada. Is that some kind a Ebay for individual wells/mineral rights that can be sold and bought?
Energynet.com.
I see that Sandridge Energy hit a new low of 61 cents, losing 1.51 per share. It’s going to hit the ditch, the shtf.
NOG, Northern Oil and Gas, is at 5.56, losing 1.20 per share. It was at thirty bucks a couple of years ago, started out at about 3.85 or so and it looks like it is going to hit the skids and go lower.
Oasis, OAS, is at 11.71, has earnings of 3.19, a price to earnings of 3.67.
That might change and earnings might slow and decline.
The handwriting is on the wall.
Maybe they should consider buying beer and brisket and have a party.
BNSF should consider hauling beer instead of oil so when the beer cars leave the tracks, there will be plenty of help to clean up the mess.
May be of interest for some
”Banks that have been critical to the U.S. shale boom have set aside more cash to cover potential losses after oil fell 51 percent in the past year to about $50 a barrel. This week, JPMorgan Chase & Co., Wells Fargo & Co., Bank of America Corp. and Citigroup Inc. all reported increased risk of losses in their energy loan portfolios.
“Energy will clearly be the driving factor in investors’ minds,” said R. Scott Siefers, an analyst at Sandler O’Neill & Partners, in a note. “Continued negative energy migration potential could be a factor for credit costs.”
http://www.bloomberg.com/news/articles/2015-07-17/comerica-drops-as-oil-crash-pain-spreads-to-shale-boom-bankers
…
Crude oil imports in China, the world’s biggest energy consumer, declined 11 percent in May from a year earlier, according to the Beijing-based Customs General Administration. Some of China’s stockpiling probably came to an end that month, according to Energy Aspects.”
http://www.bloomberg.com/news/articles/2015-07-19/saudi-arabia-crude-oil-exports-fell-to-6-94m-b-d-in-may
Death by Energy
https://www.youtube.com/watch?v=uApxOjZzUdU
After reading many of Shallow Sands comments, and following the matter in the news, it does seem puzzling that money is still being invested into shale companies. But, I have noticed that the banks are backing away, and the hedge funds and private equity seem to be filling the void. I can suggest what might be a reason.
Many private investors have generally tried to hedge some of their investments for a war in the Mideast. But, buying gold, or oil futures, or oil in storage each comes with significant disadvantages. These investors seem to be getting a security interest in the oil in the ground for their loans, which in many cases is putting them ahead of the banks. So, they know that Mideast violence of a significant magnitude will raise the price of oil and hedge their other investments, which would be likely to decrease in value. So, with the new loans, they get a hedge plus 8%+ interest while they wait. If the shale companies do okay and pay back the loans with interest, they have a cheap hedge. On the other hand, if the company eventually fails anyway, they may be better off. They get an ownership interest in a lot of oil in the ground – probably on a per barrel basis at a cost of less than the shale company had. If prices go up, it will eventually pay off. And, if prices do not go up, they still may have kind of a cost-free hedge in place. And, a key point probably is: while they are waiting, they will insist that the shale company uses their money to drill the minimum number wells that it will take so that all of their securitized interest is held by production.
Ron probably has an opinion on this thought.
clueless. This validates the rumor I heard about a private equity company’s involvement with a distressed upstream company.
The PE firm paid off the bank debt in full and took a first lien on all assets. They are requiring continuous drilling, but are allowing expenses on existing production to fall in arrears. They basically won’t pay service companies for operating expenses until legal action is threatened, yet they are still advancing funds timely for drilling.
None of this makes sense, unless you really do not care if the company fails and you are merely trying to obtain as much HBP acreage as possible.
I think we all know $50 WTI or even $75 WTI cannot be a permanent situation unless major world economies go into severe recession/depression and oil demand falls However, the timing of a major price increase could be months or years.
Like KSA, PE thinks they can ride it out. Also, good point about collecting high interest in the interim.
In addition to high interest, another tactic is to require and ORI on all of the company’s production. That can mess things up for any third party buyer, especially as it sounds like the shale leases have high royalty burdens already.
If I loan a company money and also take a big ORI, I have my borrower trapped. They cannot easily sell 1/4 royalty leases that I have now also clipped for a 5%+ of 8/8 ORI. They are forced to do a short shale to me or risk foreclosure.
I pointed out a recent PE deal CHK exited. Look at those terms for an example of the deal structure.
I am not arguing with you, Shallow, but the role private equity will play in bailing out these shale guys is still very much yet to be determined. Paying some vendors, but not paying other’s, doesn’t work in the oilfield I am familiar with; the scenario you present would put just about all of a company’s existing production in jeopardy, quickly, and subject to 90 day cessation terms in the mineral leases covering that production. Nothing trumps the legality of an oil and gas lease, not even a lien; if the lease expires the lien holder has nothing. Filing second and third liens on leases for not paying for services rendered is a piece of cake.
I often have to do lots of courthouse research with regards to curative title work, etc.; I’ve not seen too many ORRI conveyances filed of record to private equity firms. In my opinion the majority of ORRI’s are granted during the leasing process, or shortly thereafter, to people involved in negotiating the deal, or generating the initial prospect or in subsequent sales or assignments of working interest. Burdening an oil and gas lease with liens, or excessive ORRI’s can be fraught with peril if those burdens prevent proper and timely development. I am not saying you did not see a deal like that but holy schnikes, if I was a Lessor under a deal like that I would be getting my oil and gas attorney’s lined up like ducks.
However creative the “deal,” the oil, gas and mineral lease dominates and always, always prevails in the court system. And the No. 1 best selling lawsuit in America is, always has been, against an oil company.
Mike
Edit: Furthermore, many more recent mineral leases taken in resource plays have provisions in them prohibiting assignment to 3rd parties without prior consent by Lessors. Several recent court rulings have upheld those provisions.
How all these mergers and bankruptcy’s shake out is going to have very significant legal ramifications. Lessors will not, should not, stand in the wings and simply watch all this unraveling happen.
Mike. Pretty much all my knowledge about this shale stuff is through Internet reading, so admit I am no insider.
I agree with your post, but I think you will agree the way shale is playing out many times makes no sense. I guess I am on the outside looking in, trying to figure out the bizzaro world.
As to Lessors and lawsuits, most landowners do not want to file suit unless they can find a contingent fee basis arrangement. Further, although I do agree that lessors would not want a burdened with ORI lease, how many of them actually know what happens in that regard? Most don’t do title searches or get ad val statements from the tax assessor to see what is going on after the lease is signed. I am sure the ones in the O & G business might, but many that sign are absentee inheritors that don’t understand.
Also, keep in mind how many of these 1280 drilling units have 10, 100 or more lessors. Probably not going to sue when you own 1/2 x 20/1280 x 1/4 RI?
Maybe all the shale companies and private equity guys have crack legal and land departments. However, given the huge volume of this stuff, I wonder how many things get ignored.
Again, just speculating, but when a bank or PE firm liens up 500,000 acres of leases, do they always have someone review every term of every lease in detail? Hopefully they do.
However, we now live in this Internet world where people do not pay attention to detail and stuff gets halfway done.
Again, just speculating. Keep in mind, we come from the old school, you in particular. There is a lot more cutting corners going on, I’ll bet.
To draw a parallel, look at the horrible due diligence that occurred in the residential mortgage meltdown. There are properties all over the US where title got screwed up. Too much volume.
Well, I am not going to speculate. Everyone has a scenario of how this shale thing is going to shake out and I am not going to get in the middle of that. It’s a waste of time.
I do not believe that lenders, in whatever form they be, loan with the express intent of taking over oil properties in default. I don’t think a company is going to let it’s lender dictate how that borrowed money is spent from an operational standpoint and I KNOW an operator cannot pay OPEX related vendors but pay CAPEX related vendors without the service industry cutting them off completely. Its a small world in the oil patch; word gets around fast. Anybody providing services to a shale company right now, from drilling rigs down to hot oilers, are all on Defcon 5.
I think you might be surprised how sophisticated mineral owners have become the past 5 years, because of the internet. All the information they need to know what is going on with their minerals is pretty much a click a way. They too are on high alert. What scheming anyone thinks might be going on as an explanation for why some money is still being loaned to these shale companies needs to understand the complexity of mineral law and how onerous today’s mineral leases are. I have made some mineral leases with companies I would never in a month of Sunday’s take as an operator.
Mike
When you lease mineral acres for oil drilling and production, you sign to obtain royalities. The mineral owner can participate and share in the costs of drilling and completion. If no oil is found, that is it, if there is oil, the costs increase but you’ll receive payment for the oil not royalties. You can non-participate, not lease, pay a fifty percent penalty fee for not participating, pay the costs of drilling and completion until those costs are satisfied, then you will receive payment in dollars. If there are prob!ems with a well, the participant is also responsible for those additional costs, you pay, per acre basis, if you own 40 acres of a 1280 tract, you’ll pay 1/32 of those costs to repair the well so it can pump oil again.
It can add up to more than a little. Might have to pay through the nose.
The oil company wants to lease from the mineral owners, it costs less in the long run.
It is best to retain earnings to have the money to finance the unexpected costs, if you have been doling out too much of the earnings, it can become a problem.
Best to be prepared when it costs an arm and a leg.
Yes, I too came across the fact that investors are still flocking to oil shale. It probably is very simple, the old method of buying low in the hope of selling high.
The Freakish Year in Broken Climate Records
State of the climate: Broken
July 17, 2015
http://www.bloomberg.com/news/articles/2015-07-17/the-freakish-year-in-broken-climate-records
The annual State of the Climate report is out, and it’s ugly. Record heat, record sea levels, more hot days and fewer cool nights, surging cyclones, unprecedented pollution, and rapidly diminishing glaciers.
The U.S. National Oceanic and Atmospheric Administration (NOAA) issues a report each year compiling the latest data gathered by 413 scientists from around the world. It’s 288 pages, but we’ll save you some time. Here’s a review, in six charts, of some of the climate highlights from 2014.
http://www.ncdc.noaa.gov/news/state-of-the-climate-2014
It’s a strong El Niño year, back to back with a weak El Niño in 2014 (the two year sequence is quite rare). Hasn’t been like this since 1998. It’s really weird, with a very warm North Pacific and a cold Atlantic. Low sea ice extent in the Arctic and record high extent around Antarctica. And an incredible amount of political garbage being flung together with climate information.
So does this mean that we will now start on a worldwide trend to rapidly reduce carbon and other pollution outputs?
Of course, it’s the only logical course of action. Do you think we’re just going to sit around and get fried like hamburgers?
Wow, I feel so much better now. Who would ever think that collective techo-business-humanity would act against long range interests? That is such a relief.
Anyone with a modicum of understanding of planetary science really would see that burning coal as fast as we can is good. More heat in atmosphere = more water evaporated = more rain. The rain waters plants which grow exceptionally well due to the high CO2 levels. So all that carbon that has been sitting dead underground for hundreds of millions of years now can rejoin the biosphere, create more life, and thus more food, more opportunity, and more ecology!
You forgot the little yellow face. Or, you’re a fucking idiot.
You know, Doug, I actually can’t tell if it’s tongue in cheek or Dunning-Kruger in full fragrant bloom.
I think the idea is to stop increasing worldwide emissions as much as possible. Reducing them is going to be a tall order until oil, gas, and coal prices increase. This is why I’ve founded 560.org. Feel free to donate.
Well, I think we all know if this article were about “The coldest year on record for the US”, all the global warming supporters would be eerily silent. That’s the funny thing about how political propaganda works. NOAA is a government agency supported by taxes, so can we really trust anything they say? I can’t, not at all with the current administration in the White House anyway.
But regardless, we on the right do understand how the science works. If the right points to cold climate events that fly in the face of “the sky is falling” rhetoric from the left, it’s all a LOCAL event and not a GLOBAL event, but the left will then point out local and not global HOT weather events and continue telling us all how its “proof of AGW”.
We on the right do get where you’re all coming from – but we still, based on ALL science, think you’re all completely full of it.
And even if AGW had some basis in reality, since the Earth’s norm is mostly ice-ages (research it…), I’ll take a warmer planet with more CO2 (which is fantastic for plant life, meaning better crops = sustainable civilization) than a bitterly cold ice-age with mile thick glaciers and not enough food to feed our children.
The left really needs to figure out that “seeing the other side of the argument” usually helps to understand reality more fully rather than having a tunnel vision focus on something as specific as lockstep paranoia over a controversial theory like the one involving global warming.
‘Responding to your forth paragraph’ In a way you’re right, but I don’t think you’re considering the rate of the trajectory (Of CO2 emissions & warming).
It matters not. Nothing will ever be done to combat climate change – so in a sense, the Right has already won. Celebrate your victory.
That is really COLD Patrick.
Personally, whenever I hear someone attempting to frame a scientific argument in terms of left and right wing politics, I hear only ignorance of the highest order.
Science and reality don’t give a rat’s ass about politics.!
It’s not a scientific argument. It has been politically loaded. If you have any doubts read the Pope’s “climate change” ditty, which mixes the climate change problem with a series of neo Marxist and communistoid statements. I put up a summary in my blog if you want to read it.
http://21stcenturysocialcritic.blogspot.com.es/2015/06/my-readers-digest-version-of-pope.html
As far as I can see we have nearly religious-political movements on either extreme. And both sides are getting more and more extremist. I suspect it’s just like the polarization we see in every political field.
I study this phenomenon as part of my long term studies on the nature of reality, how we are brainwashed, lied to, and driven to fight stupid senseless wars, support idiot causes, and believe in fantasies. It became a field of interest when I lived in Cuba and my parents showed me how governments lied, so I started this investigation over 50 years ago.
Science and reality don’t give a rat’s ass about politics.!
Yes, I see the folks taking on the climate data because they think it will force lifestyle changes on them on the losing end of the battle. The lifestyle changes are coming anyway because we are talking about limited resources.
The weather and climate are going to do what they are going to do. Telling us what the measurements say is of special interest to those who would like as much info into the future as possible, like insurance companies.
“NOAA is a government agency supported by taxes, so can we really trust anything they say? I can’t, not at all with the current administration in the White House anyway.” Right!
So if I say that I believe that the majority of Global Warming (that’s right, I said it) scepticism is a result of pseudo scientific “research” and PR efforts by outfits like The Heartland Institute and other similar organizations, largely funded by Exxon Mobil, Koch Industries and other organizations with some serious skin in the FF game, that would make me a liberal, communist tree hugger? Right!
Lately I’ve been looking more at the NASA RSS data. It seems to be more reliable after the NOAA Karlizing project.
But you know what bugs me? The outgoing long wave radiation is mapped on a daily basis, but they don’t show the plot. Typical government agency.
http://www.esrl.noaa.gov/psd/map/clim/olr.shtml
Looks like business as usual to me. Nothing new or worrisome. The world has been on a maximum global average temperature since 1998. That year and 2003, 2005 and 2010 together with 2014 have been very warm. In 2003 we had a very bad heat wave during the summer over Europe. This year we have another one, but not that bad. It is to be expected that when you are on a maximum you get the highest values.
The thing is that the rate of warming has been very low during the last two decades compared to the previous two. Some people say that the warming will return soon, but they are the same people that predicted a lot more warming by now. Maybe they will be wrong again and maybe we will get some cooling the next two decades. I don’t think they really know what is going on. The climate has always changed and always will.
Of course if you put error bars to their graphs they look a lot less scary. That’s probably why they usually don’t.
This is HadCrut4 with error bars.
Javier said “The thing is that the rate of warming has been very low during the last two decades compared to the previous two. Some people say that the warming will return soon, but they are the same people that predicted a lot more warming by now.”
If we ignore the ocean heating, the large amount of energy going into melting glaciers and ice, the atmospheric heating; I guess there has not been much heating lately.
http://thinkprogress.org/climate/2015/07/17/3681260/june-2015-hottest-year-record/
Yes, I wrote an article about the way data is manipulated and color palettes are used to paint a really ugly picture. That map, as far as I am concerned, is a data manipulation for visual impact.
Here’s a NOAA map room, check the latest 30 day anomaly map
http://www.esrl.noaa.gov/psd/map/clim/sst.shtml
Here’s a NOAA discussion about current conditions:
“The updated (May-June) MEI has risen by 0.49 standard deviations in one month to +2.06, to reach the 3rd highest ranking above the ‘strong’ El Niño threshold possible (upper 10%ile). This is also the highest MEI value in more than 17 years, surpassing the peak of the 2009-10 El Niño by more than 0.5 standard deviations. The current El Niño has ranked above the weak El Niño threshold for five months in a row, and above the strong threshold for three months running. Thus, it has become the first El Niño event since 1997-98 with at least three months registering in the upper 10%ile.
Looking at the nearest 8 rankings (+2/-6) in this season, and excluding cases with declining May-June values compared to earlier in the year gives us five ‘analogues’ to ponder: 1972, 1987, 1991, 1993, and 1997.
All five of them attained strong El Niño status for at least three months, while 1997-98 is generally classified as a ‘Super El Niño’, with MEI values reaching +3 standard deviations (the only other Super El Niño of the last century occurred in 1982-83). At this point, El Niño conditions are guaranteed to persist into the upcoming boreal winter season, most likely at strong levels.
If the MEI continues to rise for another month or two, even a Super El Niño is in the cards.”
http://www.esrl.noaa.gov/psd/enso/mei/index.html
The good news is that by the end of the year California will be getting a LOT of rain, and the Atlantic hurricane season will be a dud. The bad news is lots of Pacific typhoons.
Yes, MarbleZeppelin, I agree. We should ignore the ocean heating because as far as we know it is inconsequential. After all the average temperature of the ocean is 3.9° C and the ocean has been heating since the start of the Holocene.
Regarding the energy going into melting glaciers and ice and the atmospheric heating, as far as we know that energy has been doing that since 1850 when glaciers and ice started retreating. That really doesn’t explain why the energy that was going to heat the surface is no longer available for that. Perhaps it is being returned to space through an increased albedo due to a slightly increased cloud cover. Who knows. It looks like the experts don’t know either.
Nice picture. By the way, I do not argue that the world has been warming for the last 165 years nor that the last decade has been the warmest on record. The problem is that the favored climate change theory is no longer capable of explaining the evidence, so we need a new one.
No, no not the ocean is cold gambit. Not again. Please stop the torture, it’s almost as bad as watching soap operas or those dancing and singing competitions. Please stop!!!
There is no cure for stupid and it’s stupid to argue with crazy people.
There is no cure for stupid and it’s stupid to argue with crazy people.
It also doesn’t change anything. Climate and weather are going to do what they do whether or not we study them or record the data. Those who want to stop the research will only hurt industries that could use the info for their predictions (e.g., insurance industry, farming, ski resorts).
And lifestyle changes are coming anyway.
Weather change patterns are already affecting some places. While some people might want to disagree about the causes, the results remain the same.
Declining resources will force changes.
So people get all caught up in politics when it doesn’t change the realities at all. Some people still want to debate evolution.
Since when insulting those that do not think like you makes you more right than them?
Scientific theories are proposed and discarded all the time. One of these days you will find that you were wrong and you will have to think of all those people that you insulted.
It’s good advice.
You are right Javier, my apologies.
Although the graph you put up does show a continuous increase in temperature with time, just lower than predicted in the lower atmosphere. The ocean heating does count, the turnover time is very large so the surface and near surface temperature is quite a factor in global warming. The ocean is mostly temperature stratified as any submariner or diver will tell you.
One must also understand the negative forcings that occurred in the atmosphere, especially after the late 1990’s. The amount of coal burning increased tremendously as China and other countries became industrially active. This has caused increased global dimming. A similar slowdown in atmospheric temperature rise can be seen in the late 1950’s through the 1960’s when pollution in America and Europe was very high. The air was quite visible in the US then.
So a certain amount of global warming is being masked by short-lived SOx effects. Once those are reduced we will know the full extent of carbon forcing sensitivity in the atmosphere.
However, by then albedo changes and other natural feedbacks will start to predominate. Already the burn-off of forests and vegetation due to droughts is causing a large input of CO2 that will increase. Shading of snow and ice in the northern latitudes due to the migration northward of plants as those region warm is reducing albedo. More methane will be released.
At that point it will no longer matter what anyone thinks about what is happening. We will mostly be along for the ride unless we are capable of planetary climate control by then.
MarbleZeppelin,
I am not very impressed with the ocean warming reported by the Argo system.
First it is a rate of only 0.02° C / decade.
Second, even to assume that such a tiny warming matters you have to believe that it is real. Frankly I do not believe that ocean temperatures can be measured under real conditions with an accuracy of 0.002° C as the Argo system claims. In fact the only study that I am aware that checks the accuracy of the Argo measurements under real conditions reports an error of around 0.6° C, 300 times larger than claimed.
Hadfield et al. 2007. On the accuracy of North Atlantic temperature and heat storage fields from Argo.
http://onlinelibrary.wiley.com/doi/10.1029/2006JC003825/pdf
Some people want to freak out about the oceans warming a tiny, probably unknown amount over decades, fine with me. But scientists trying to justify their theory not working properly on that I am going to call it BS.
All those negative forcings that you talk about are just ad hoc explanations for a theory that does not work properly. It is such a crap that I don’t understand how people buy it. They appear every 60 years only to disappear 30 years later so the theory doesn’t have to face the cyclic natural variability clearly present in the temperature records.
That is simply what you belief. Just go back 20 years and check the predictions. It is clear that we don’t have any clue about what the climate is going to be 20 years from now, and I would not be surprised the least if it turns out to be colder.
Scientific theories are proposed and discarded all the time.
No, that is simply incorrect. Scientific hypothesis’ are proposed and discarded quite frequently. That is not the case at all for scientific theories. From Wiki, bold theirs:
A scientific theory is a well-substantiated explanation of some aspect of the natural world that is acquired through the scientific method and repeatedly tested and confirmed through observation and experimentation.
A scientific theory is not something that is ever just “proposed”. Only a hypothesis is ever merely proposed. Then only observation and testing will determine whether that hypothesis becomes a legitimate theory or not.
I’ve been involved in evolution debates, and here’s some sources I’ve used
http://www.evolution.berkeley.edu/evosite/footshooting/Iterminology.shtml
“A theory is an explanation. The validity of a theory rests upon its ability to explain phenomena. Theories may be supported, rejected, or modified, based on new evidence. Gravitational theory, for example, attempts to explain the nature of gravity. Cell theory explains the workings of cells. Evolutionary theory explains the history of life on Earth.”
And here is a link to a discussion about James Hutton and his theories
http://www.amnh.org/education/resources/rfl/web/essaybooks/earth/p_hutton.html
So which theory are we discussing?. I got lost in the spaghetti.
Which side of the evolution debates were you on?
(I kid)
I was for Kimura’s neutral theory. But I was influenced by my kid sister, who went to the University of Wisconsin for a while and eventually became a microbiologist.
Marble, I think the reference is to the fact that the world ocean is an enormous heat sink. It’s cold, and it can absorb a huge amount of energy without blinking. The only real effect we see when that water warms up is sea level rise (that’s actually the most adverse impact of global warming, but it’s kind of slow and lacks hysteria sexiness). The energy level in the ocean increased. So? Some if it is getting back via El Niño, its radiating to space and will do it over the next couple of years. Some energy won’t, most if it will be absorbed by the ocean.
What I focus on is the disconnect between the models and the data. Thus far the models can’t account for the current temperatures. That may be because they have a slightly miscalibrated cloud feedback. Most models can’t model the heat transfer into the ocean, except for the Russell model. And that model predicts much less future warming.
To me it’s likely the ocean is taking it quite nicely. The heat is going down to warm deep water. And that’s fine with me.
Here is the reality. No belief, no politics, just the average global temperature rising since early 1900’s.
MarbleZeppelin,
1° C is well within Holocene natural variability. Nothing to get hysterical about.
Javier, are you Fernando?
.
You apparently have little knowledge of analysis and are just being an obstinate troll countering every bit of evidence and not supporting it with any valid research.
I am Javier, and I am the only one in the discussion that is bringing peer-reviewed scientific papers and links to their pdfs to support the arguments. Just check my posts again. I would say then that I am the one that brings supported evidence which would make you the troll in the discussion, as it is the second time that you bring insults to support your opinions.
You confuse the accuracy of measuring an extended field (large area of an ocean) that has a finite number of probes at specific locations with the accuracy of the probes themselves.
Fields:
https://www.rsmas.miami.edu/users/mocha/mocha_pubs/hadfield_etal_07_jgr.pdf
Probes:
http://www.seabird.com/technical_references/LongtermTSstabilityAGUDec08Handout2Pages.pdf
Hi MarbleZepplin.
“Javier, are you Fernando?”
Ha ha.
Ask him for his CV.
I’m not Javier. I don’t do original research other than in social sciences, in fields such as the methods government leaders and ruling elites use to lie and convince people to support their causes.
Hi Javier,
Some serious cherry picking there. Let’s see 1950 to 2015, or , better yet, 1900 to 2015.
Hi Dennis,
It doesn’t matter where you start. You always end with two decades of increasing CO2 and no warming. That alone tells you that CO2 is not, cannot be, the primary driver of Earth’s climate. Something is telling the Earth not to warm despite the CO2 increase. That something is a more important driver that CO2.
Javier, When people in this community say “there is no cure for stupid” they do not and should not be trying to say that you as a person are stupid. The fact is that there is an enormous amount of crackpot right wing propaganda out there and some very bright people can be caught up in the onslaught of that stupidity. Recent corrections to the world wide record now show continuing warming which is very consistent with the models. The mechanics of CO2 are understood with great precision. There is no possibility that it is not the global warming gas that the climate scientists say that it is. I don’t think anyone here wants to insult you. They just have overwhelming evidence that you are wrong on every critical point.
“Recent corrections to the world wide record now show continuing warming which is very consistent with the models.”
That’s just it — the scientists have to keep making “corrections” in order to get their faulty models to fit!
Using latest available data as just checked with latest available month, with data source files linked, the following are the global decadal warming rates of the last 15 years:
UAH (satellite, lower troposphere), from Jul 2000 to Jun 2015
+0.010°C/decade
Also ZERO warming from Mar 1997 to Jun 2015.
RSS (satellite, lower troposphere), from Jul 2000 to Jun 2015
-0.007°C/decade
Also ZERO warming from Jan 1997 to Jun 2015.
GISTEMP (surface, land+ocean), from Jun 2000 to May 2015
+0.08°C/decade
Also warming rate low was +0.04°C/decade between Oct 2001 and May 2015.
HadCRUT4 (surface, land+ocean), from Jun 2000 to May 2015
+0.075°C/decade
Also warming rate low was +0.033°C/decade between Nov 2001 and May 2015.
Amazing how the satellite data show there basically was no global warming for at least the last 15 years, and, in fact, one dataset shows cooling, yet the frequently-adjusted surface data somehow found a stronger signal of about +0.8 degree per century.
GISTEMP from Jan 1950 to Dec 1999 (last half of 20th century)
+0.11°C/decade
That is +0.03°C/decade more than the rate of the last 15 yrs.
HadCrut4 from Jan 1950 to Dec 1999
+0.082°C/decade
That is +0.007°C/decade more than the rate of the last 15 yrs.
GISTEMP shows the rate of the last 15 years is 27% slower than the last half of the 20th century. HadCRUT4 shows the rate as being 9% slower.
Quote: “Also ZERO warming from Jan 1997 to Jun 2015.”
This is THE most extreme case of selective misuse of data that is endemic in the crackpot extreme of the denialist camp. Of course with this mentality you will be able to suggest global cooling while the world gets royally cooked. Please learn something about how to fairly represent data. For example, use a 10 year moving average of yearly temperatures to show the monotonic increases over recent decades. Also, note that data acquisition must be repeatedly refined to make it more consistent and reliable. The gross assertion that scientists are scammers who are correcting their data to misrepresent the truth is offensive and grossly ignorant of what happens in the field.
In Europe the climate change debate is certainly not as politically polarised as in the US or Australia. I certainly do not consider myself to be on the right wing and my skepticism is science motivated.
Recent corrections to temperature data are bullshit. You cannot adjust the data to fit the theory which is what some are doing.
I understand quite well that CO2 is a GHG that produces warming. Just how much warming is the real issue. Scientists disagree profoundly about the values of equilibrium and transient climate sensitivity. This is far from settled science and so there is no overwhelming evidence that I am wrong. However there is overwhelming evidence that the projections that we were told about the Earth’s climate in the late 90’s were wrong. In science if your theory has no predictive value it has no value at all.
I like the RSS plots. They seem to be very professional, and lack the political bias we see in some groups. They are very politically correct (they work for NASA):
http://www.remss.com/research/climate
“The reasons for the discrepancy between the predicted and observed warming rate are currently under investigation by a number of research groups. Possible reasons include increased oceanic circulation leading to increased subduction of heat into the ocean, higher than normal levels of stratospheric aerosols due to volcanoes during the past decade, incorrect ozone levels used as input to the models, lower than expected solar output during the last few years, or poorly modeled cloud feedback effects. It is possible (or even likely) that a combination of these candidate causes is responsible.”
The real science is saying something completely different than NOAA bearucrats. Looks like were in for a lengthy global cooling period with the low # of sunspots. Researchers in UK discovered it, reported last week.
CNN picked up the news, they are members of the mainstream media. That’s pretty significant if even they are going to stray from NOAA’s official “consensus” version of the science.
Scientists: Sun’s irregular ‘heartbeat’ could mean future freeze
http://www.cnn.com/2015/07/13/world/sun-irregular-heartbeat-ice/index.html
The real science is saying something completely different than NOAA bearucrats.
But it doesn’t matter.
Scientists will have to sort it out. And they will discuss amongst themselves what to study.
For the rest of us, whatever lifestyle changes we make will happen no matter what the climate debate.
The politics of the science really doesn’t change anything for any of us day to day and really isn’t worth all the concern.
Are fossil fuels going to be phased out? Yes, whether or not the world gets warmer or colder. They will be phased out because oil will run out and coal pollutes.
In other words, to all the non-scientists who are giving us your opinions on the matter: so what? The changes you think will be forced upon you by colluding governments and the Pope are happening already. And they are happening because of economics. A combination of income inequality and resource depletion.
The very things you fear will accelerate because of increasing income inequality and resource depletion.
Thank you for the link!
Real science gets peer-reviewed and published. From the same article:
CNN meteorologist Brandon Miller says the study looks intriguing, but it has not been peer reviewed, or subjected to the scrutiny of the larger scientific community.
“This isn’t published research yet,” he said. “Our ability to forecast the specifics of a solar cycle is incredibly poor. It’s worse than forecasting in a hurricane season.”
By all means, apply the same level of skepticism to sunspot forecasting as you would to
climate models.
Steve in CO,
Actually Zharkova’s model has already been published in Sepherd et al. 2014.
http://computing.unn.ac.uk/staff/slmv5/kinetics/shepherd_etal_apj14_795_1_46.pdf
It is a pretty good model that builds on research by other authors like Livingston and Penn, 2006 and 2009.
The evidence coming from several solar researchers is pretty solid that we are headed for a grand solar minimum that will gradually develop until it starts around 2032. Actually solar minima are pretty common. According to Inceoglu et al. 2015, during Holocene grand minima take place on average every 250 years and the Sun expends 27% of its time in solar minima (and 16% in maxima).
It has been estimated by Feulner and Rahmstorf 2010 that the contribution of a grand solar minimum to XXI century climate would be in the order of -0.1 to -0.3° C.
A grand solar minimum is a significant cooling driver, although any alarmism that it may cause a Little Ice Age is unfounded and unsupported by current scientific evidence.
What it means is probably that we have very little to fear from global warming for many decades to come, as the average duration of a grand minimum is 70 years.
I have a NASA document somewhere which discusses a model run to match the Maunder. It shows very strong cooling at a regional level. Regions in North America, Europe, and western Siberia drop as much as 5 degrees C.
And I have a match of the 32 solar grand minima identified during 8250 years (from 6600 BC to 1650 AD) by Inceoglu et al. 2015 with the corresponding temperatures from Greenland GISP2.
While 60% of them are associated to (coincident or followed by) cooling, 31% of them are actually associated to warming. To me this suggests that although solar grand minima are a cooling factor, they are not a very strong one, and they can be superseded by other factors.
If the world is still in warming mode for the rest of the XXI century, I doubt the Eddy grand minimum will do much more than moderate it.
Since we have zero experience with solar gran minima in modern times, I don’t think we can put a lot of faith on those studies.
I have come across a research paper that shows we are all wrong. Not about the fact that GHG’ s cause warming or the sun is variable, but about what is the major controlling factor in the heating or cooling of the earth. It is a factor far more powerful than GHG’s, sun variations, , irradiance variations and ice albedo put together.
When I am finished reading it I may disseminate it.
“I may disseminate it” May?” Not fair man, out with it.
Here’s the link. I had a typo in my comment. I meant .5 degrees C (my eyesight is getting bad, I’m wearing contact lenses AND reading glasses at the same time).
http://earthobservatory.nasa.gov/IOTD/view.php?id=7122
OK, Fernando. That sounds better. -5° C as a global average means a return to glacial conditions, but -0.5° C means a return to 1940.
The problem that most people have with the Maunder minimum is that they forget (or don’t know) that it took place at the bottom of the 1150 year cycle, so it was cooling at the coldest time, while now we are near the top of the 1150 year cycle so it will be cooling at the warmest time.
This sunspot speculation is not supported by the current solar science community. Beyond that even if it were totally correct the magnitude of the expected cooling from reduced sunspots will have an extremely minimal effect on the warming of the planet in coming decades. I was hoping that we will have some reprieve from the hothouse conditions of the future but that will just not happen. Sorry!
You could be wrong. Too much SKS?
The largest immediate variable is SOx input to the atmosphere causing increased cloud albedo. Once that is reduced heating will advance quickly with greater loss of weather stability.
As to the “break even discussion above”.
It seems to me break even might make sense on existing production, in the sense Jeffrey Brown describes above. Once the well is plugged, it is done. Yes, plugged wells are drilled out, but that is not a preferred thing to do in my view. It is better to run at a break even, or even a small loss in hopes that prices improve. OFM has touched on that many times re other business and same applies to upstream oil and gas.
What makes less sense is drilling wells that have a high decline in low price environment. Many of those are permanently doomed.
However, note discussion above with clueless. Sometimes the ones in charge may want failure.
ROCKMAN pointed out that many oil and gas wells in the US do not pay out for the initial driller, but do for subsequent buyers. May very well see that with a lot of shale wells, especially if low prices continue into 2017.
For example, there was a time around here in 1998-1999 when you couldn’t hardly give an oil lease away. Oil was $8, almost all OPEX per barrel was higher, and this was following a long period of low to mediocre prices.
People gutsy enough to buy leases then, who then held onto them, came out pretty good.
There a major risks though. How long till prices rebound, how low will they go? And always in the back of my mind, at least, is this time different?
Hey Shallow Sand Man,
The more things change the more they stay the same. Until they don’t. 😉
But how long ? Differences of opinion are what makes horse racing possible.
On one side of the balance beam scale we have the fact that rust and depletion never sleep. On the other we have the possibility that the world economy will still remain on life support.
The economy MIGHT pick up a little or a lot. Depletion is dead sure to continue apace.
Take yer choice.LOL.
If the economy DOES decline world wide at say one or two percent annually e and oil is depleting at four or five percent … well sooner or later the price of oil will go up again.
It’s all as simple as the turning of the seasons. And as impossible to predict as next years weather.
I really don’t hear much about the Utica shale, much of which lies below the Marcellus. Does anyone here think that the Utica will ever be the next Marcellus? Say after the Marcellus fades and prices up to compensate for the deeper drilling.
http://www.naturalgasintel.com/uticainfo
Zep,
I believe the following extract sums things u pretty well, and until the pipeline/processing constraints get out of the way and the price of Nat Gas can approach that of Henry Hub, we will not know the true potential.
Activity within the Utica could have been even higher thus far, were it not for a series of headwinds facing the play. According to remarks made by Sterne Agee analyst Tim Rezvan at a June 2014 industry conference, the biggest of those obstacles “is natural gas processing and takeaway; they continue to be limiting factors for growth, especially for companies that are well capitalized. They could be running higher rig programs right now.”
MarbleZepp, Toolpush,
Go to Marcellus.com and search for West Virginia U, Utica. A two-year study involving the USGS and the geological surveys of states within the Utica was released a few days ago. Technically recoverable reserves of oil and NG have been doubled or more. Note that that’s technically recoverable, and all that that entails.
Thanks Synapsid,
I was aware the Utica had been upgraded, and I am sure there is plenty of gas there. The point will be as production is increased can producers survive financially in the longer run, unlike what Shallow is showing us about the Oil players.
I just ran across this article at the Economist which makes a good clear argument in favor of higher fuel taxes as opposed to higher fuel economy standards in order to reduce oil usage.
It is the best one I have seen and quite convincing, very well written.
Of course our reflexive rejection of higher taxes makes it rather unlikely we will raise fuel taxes as opposed to raising fuel economy standards piecemeal. But as they say, politics is the art of the possible.
http://www.economist.com/blogs/freeexchange/2015/07/reducing-carbon-emissions
I have been waiting around for a real price on carbon, or an increase in the gas tax that never comes.
The twenty percent improvement in the F150’s fuel economy was because of a mandated increase in fleet fuel efficiency.
Most people don’t put much, if any, emphasis on the efficiency of their major purchases, vehicles and homes, so the only way you are really going to see an improvement in efficiency is if they are mandated. That way the car manufacturers and home builders/developers are forced to design energy efficiency improvements into their products. And it is at the design stage that we see the biggest improvements in energy effficiency. (Let’s face it the average consumer doesn’t have the chops to evaluate the energy efficiency of a prospective purchase)
The only way we get ourselves out of our predicament this late in the game is with mandates. Pricing carbon and increasing gas taxes at this point is an unhelpful distraction.
Hello AWS,
I agree with you about the energy efficiency of houses being improved is mostly the result of mandated improvements. Houses are built one at a time mostly by smallish builders who can change their ways in a month as the regulations change – and some change every day of the year someplace.
But cars and trucks are different.Researching and designing and building a new vehicle takes a rather long time and I do believe that the auto industry is AWARE of peak oil. As I see it the bosses know and understand peak oil but they also know and understand that gasoline is apt to be cheap for a while yet and they just don’t have the luxury of spending megabucks on efficiency improvements any sooner than necessary.
But imo the management at Ford understands that their new pickups are going to retain resale value extremely well as gasoline and diesel inevitably go up- not to mention rust being a near non existent problem in these new Ford trucks.
Ford COULD have met the mandate other ways , by downsizing for instance. GM could have met the mandate by other means than building the VOLT. Nissan did not have to invest megabucks in the LEAF.
Top management at the big auto companies have to operate with tied hands due to having to make a profit NOW but I will never believe anybody who is a top level guy at any top level auto company believes in cheap oil forever. Unless maybe he holds his job because Daddy owns enough stock to make him a present of the job.
Not many stupid people make it to the penthouses of management.
I do believe that the fleet average economy is substantially higher than it would be otherwise without economy mandates. So I am in favor of them but I do not credit them with ALL the improvement in fuel economy that has come about in recent times.
Economists, the people who wear blinders and helped build our present imaginary money system.
Now they think they know energy? Haven’t they done enough harm already?
The article is written at high school level and has quite a number of erroneous statements. I will not even waste time discussing the article further. Patchwork and band-aids that really don’t address the problem are stupid.
Let’s look at the real problem and try to solve that. The real problem is carbon dioxide pollution and other pollutants put into the atmosphere (and soil, and water) by using and burning fossil fuels.
So lets directly remove the use of fossil fuels. Stop subsidizing all fossil fuel activities. Encourage and subsidize solar and wind power. Encourage and subsidize power storage systems. Require the replacement of ICE vehicles with electric wherever possible. With that plan much of the coal , a large amount of natural gas and a lot of the oil has been eliminated. Now that addresses the problem.
Then let the economists loose on the remaining ICE’s, natural gas and coal uses. Actually would be better to let the scientists and engineers loose on those too, they will actually do something useful that will work.
Bravo, Zepp, thanks for all that.
So,in the world according to Zepp, us engineers get to instruct the econ types.
Econs, here’s the rules for the economy, you guys go figgure the best way to get it.
1) Makes the world a better place
2) Keeps everybody and thing as happy as consistent with 1.
That’s it. End of rules. Now, go do it or you don’t get your oatmeal.
Wimbi, best to give the econs busy work so they don’t get in the way. Please don’t get them involved in the mainstream.
I agree, just like Jehovah’s Witnesses, send them next door, or ideally, to another planet.
Right, what I said would keep them busy awhile, and after all, a big heavy econ report is good for crumpling up page by page and starting the wood stove.
And, who knows, one or two of them might have a good idea once in a while.
“…. one or two of them might have a good idea once in a while.” Sorry, sounds a bit like the infinite monkey theorem, you know, that cute monkey hitting keys at random while we wait for a definitive unified field theory. Think I’ll pass on that one.
Same probability that they will evolve into something useful.
Houston-based Milagro Oil & Gas seeks bankruptcy protection
Posted on July 16, 2015
http://fuelfix.com/blog/2015/07/16/houston-based-milagro-oil-gas-seeks-bankruptcy-protection/#31510101=0
HOUSTON — Small U.S. producer Milagro Oil & Gas and several affiliates have filed for Chapter 11 bankruptcy protection, the latest oil company to restructure amid low crude prices.
Milagro said in court papers Wednesday it had $1 million to $10 million in assets and $500 million to $1 billion in liabilities and that it couldn’t pay back its debt because its business became unprofitable as crude prices fell.
The Houston firm, which has 1,200 wells in South Texas, along the Gulf Coast and in Louisiana, said it plans to sell its oil and gas properties and related liabilities to the private, Houston-based White Oak Resources VI for $217 million in cash and equity. White Oak drills for oil and gas in southern Louisiana and South and East Texas.
The oil market bust has taken out a few other producers and credit rating agencies expect more to come. A day before Milagro filed, Sabine Oil & Gas Corp. filed for bankruptcy protection in this year’s largest American oil company bankruptcy with $2.9 billion in debt, according to data compiled by Bloomberg.
Sabine, Milagro and five other U.S. producers that have filed for bankruptcy protection this year employed a combined 745 workers at the end of last year or before filing for bankruptcy, according to the latest available data for the companies.
==============================================
Milagro Oil & Gas Seeks Bankruptcy Protection
Rigzone Staff 7/16/2015
URL: http://www.rigzone.com/news/oil_gas/a/139668/Milagro_Oil_Gas_Seeks_Bankruptcy_Protection
Houston-based Milagro Oil & Gas joined more than half a dozen smaller-cap exploration and production (E&P) companies to succumb to precipitously low oil prices in a prolonged downturn Wednesday.
Court records show the company has assets estimated between $1 million and $10 million in assets and between $500 million and $1 billion in liabilities owed to up to 49 creditors.
According to The Deal Pipeline, Milagro in January failed to make good on a missed interest payment on its second-lien notes after a 20-day grace period, which led investors to speculate the company could be heading toward bankruptcy.
Just two days ago, Sabine Oil & Gas filed for bankruptcy. In June, it had, too, deferred millions of dollars in interest payments.
In operation since 2007, when Milagro acquired Petrohawk’s Gulf Coast division, the company took on the drilling, workover and recompletion of those assets. Three years later, Milagro added North Texas and Oklahoma assets to its portfolio. All told, Milagro owns interest in about 1,200 wells, has 100 employees and operates roughly 80 percent of its net production.
============================================
Company Overview
http://www.bloomberg.com/research/stocks/private/snapshot.asp?privcapId=131226001
Milagro Oil & Gas, Inc., an independent oil and gas company, engages in the acquisition, exploration, exploitation, development, and production of oil and natural gas reserves. The company primarily holds interests in properties located in the onshore Gulf Coast region in Texas, Louisiana, and Mississippi. As of December 31, 2011, it owned interests in 864.8 net wells; and had estimated net proved reserves of 37.3 million barrels of oil equivalent (MMBoe) consisting of 136.8 billion cubic feet of natural gas, 9.2 million barrels of oil (MMBbl), and 5.3 MMBbl of NGLs, as well as proved undeveloped reserve locations totaled 14.5 MMBoe. The company was founded in 2005 and is based in Houston, Texas. On July 15, 2015, Milagro Oil & Gas, Inc. along with its affiliates filed a voluntary petition for reorganization under Chapter 11 in the U.S. Bankruptcy Court for the District of Delaware.
Alex,
It seems like everyone is lining up at the door before they have to fess up in their quarterly reports? Amazing what a little daylight can do! The next 2 quarters are really going to be interesting.
I agree. Oil price (WTI) at low 50s, hedges gradually expire, further cuts in oil services rates more difficult …
So they have 500-1b in liabilities and sell fictional reserves from their properties for 217 mil to another group of “oil knife catchers” and than file for bankruptcy? So what the creditors get? Rights for their company name (Milagro) for new Vegas Resort? 🙂
And there we trala trala. Lotsa BKs.
AlexS,
Thanks for sharing. This is becoming both sad and interesting.
I have for some time been a fan of shallow sand’s postings, which I privately has nicknamed….. “shallow moments”. 😉
What follows is admittedly simplistic, but hopefully useful to better understand the dynamics in play.
The key to understand what is now taking place in the shales is IMVHO to understand the equation:
EQUITY = ASSETS (PV10) – DEBT/LIABILITIES ……..(net worth)
And within that equation the key is ASSETS or PV10.
I have seen from others that the SEC regulations for estimating Proven Developed and Proven UnDeveloped in shales has been described as “generous”. This allows the assets to grow fast as acreage becomes developed (wells drilled and put into production).
The higher the (estimated) assets, the more debt the company may (thoretically) hold and growth in debt and growing operational cash flow the higher the CAPEX for well manufacturing becomes which grows physical extraction.
A high oil price is like the tide which lifts all boats and allows for high leverage (more debt). This is good as long as the oil price remains high and stable.
DEBT/EQUITY RATIO, is a measure of financial leverage.
As the oil price collapsed (declined from $100/b to $50/b), the assets will shrink, debt/liabilities remains (some may cancel rig contracts to reduce liabilities) and equity also declines while financial leverage goes much higher.
Wait, there is more.
Write downs/impairments reduces assets and increases financial leverage and this may leave an incentive to defer these hitting the books, but the accounting rules are such structured that at some point these will also see sunlight.
So there you have it, PV10 represents the future, any write downs/impairments is the past catching up from behind.
Financials are virtual and thus highly responsive.
Rune, to take it a step further, for bank collateral purposes, proved developed producing (PDP) PV10 is the relevant metric. As Mike and others (including me) have noted, in the past banks did not put a high value on proved undeveloped (PUD) or other non-producing reserves.
With us, they put no value on non-producing PV10. We were told by the banks that they generally loan 50% or so of PDP PV10, using the banks’ price deck, which is a derivative of the current NYMEX WTI Strip, adjusted slightly for the bank’s outlook on futures pricing.
As I have also noted previously, the Office of the Comptroller of the Currency (OCC) has guidelines in rating upstream energy loans that banks are required to follow. Those can be found online.
As I have also stated previously, OCC guidelines are that banks may loan an upstream company from 50-65% of the company’s PV10. If the reserves are PDP, no ADDITIONAL discount is required. However, if the reserves are NOT PDP, banks must ADDITIONALLY DISCOUNT the non-producing reserves in a manner satisfactory to the OCC. If they do not, loans will be deemed substandard, and banks must then increase their loan loss reserves, which negatively impacts the BANKS’ EARNINGS. There are recent stories that banks are increasing loan loss reserves for energy loans. I presume they are either voluntarily or because the OCC has required this action.
I have some trouble getting to sleep from time to time. Therefore, I read public upstream 10K and 10Q and jot down some notes. Here are my notes for the North Dakota Bakken US public companies that are still drilling, with regard to long term debt to PV10 all categories, as stated in 10K as of 12/31/2014. Please note I use standard measure PV10, which takes into account income taxes. I use those because income taxes are an expenses that have to be paid.
Also, please note that the WTI price used to determine PV10 for the period ending 12/31/14 was $94.99 and the natural gas price used was $4.30.
Denbury. PV10 $5.90 billion. Long term debt $3.53 billion.
SM Energy. PV10 $5.70 billion. Long term debt $2.37 billion.
Whiting. PV10 $10.84 billion. Long term debt $5.63 billion.
ConocoPhillips PV10 $83.21 billion. Long term debt $23.38 billion.
Hess PV 10 $17.00 billion. Long term debt $5.92 billion.
Continental PV10 $18.43 billion Long term debt $6.00 billion.
ExxonMobil PV10 $207.59 billion. Long term debt $11.65 billion
.
Halcon PV10 $3.26 billion. Long term debt $3.57 billion.
WPX PV10 $3.88 billion. Long term debt $2.28 billion.
Newfield PV10 $6.21 billion Long term debt $2.89 billion
Oasis PV10 $3.98 billion. Long term debt $2.70 billion
QEP PV10 $5.34 billion Long term debt $2.22 billion
Abraxas PV 10 $0.51 billion. Long term debt $0.08 billion.
Triangle PV10 $0.82 billion Long term debt $1.07 billion.
Marathon PV10 $16.56 billion. Long term debt $5.3 billion.
EOG PV10 $27.9 billion Long term debt $5.9 billion.
Per my notes, this is where standard measure PV10 and long term debt stood for each company as of 12/31/2014. Feel free to see if I wrote anything down wrong.
As we know, many added significant long term debt the first 90 days of 2015. Soon we will see how much more is added the second quarter.
Also, as we know, Continental stated in its 2014 10K that if February, 2015 pricing were used instead of $94.99 and $4.30, PV10 all categories would fall by 61%. I do agree, CLR was not using standard measure. Newfield showed similar issues using oil at $60 WTI and gas at $3.50, in that PV10 fell by almost half under that pricing scenario.
We cannot know how much PV10 has fallen for each company without their data and reserve report software. Further, each has a different ratio of PDP PV10 to all other categories of PV10. However, we can generalize, I suppose.
So, to generalize, lets say PV10 all categories drops by 1/2, due to price crash. Lets also say that 1/2 of PV10 is PDP. Now that may be too much, but look what happens if one halves each of the above PV10, in order to account for PDP only, then halves again to account for 50+% drop in product prices.
If we divide PV10 by 4, only ExxonMobil, Abraxas and EOG would have more PDP PV10 than long term debt.
BIG DISCLAIMER, I have not looked at the ratio of PDP PV10 to non producing PV10 for all of these companies. Maybe I will do that sometime. Feel free to yourself and point out which have more PDP.
Bottom line, it would appear that almost all bank borrowing bases must be cut. However, I could be missing something here.
If the future cash flows will not pay the debt, it would seem companies are in serious trouble. Given most have little cash, and continue to be cash flow negative, it seems to me things are serious for even some notable, long term, giants.
To me, having more debt than PDP PV10 is similar to owing more on a building than it appraises for. Granted, economics can change the dynamic. However, an investor who pays more than PDP PV10 has to hope for product prices to increase, OPEX to decrease, and/or hope to drill new wells that are economic.
Again, drilling is inherently risky. Even in a resource play, such as the Bakken, productivity rates vary, even for wells in the same drilling unit. To me, this risk requires a return premium. I do not see a return premium out there to justify drilling and completing shale oil wells at sub $50 WTI and shale gas wells at sub $3 Henry Hub. But I am just reading, I’m not in the shale industry.
Maybe someone in the shale industry could explain what I, and others here, are missing in terms of debt to PV10. It seem to me the only hope is much higher oil and gas prices in the near future.
Shallow,
I will not for any reason whatsoever assume any responsibilities for your sleeping habits. 😉
Thanks for sharing (I for one is very grateful) and back to business.
I take it what you describe to be accurate.
You list long term debt, am I correct to understand this as it does not include other liabilities like pensions, rig contracts, P&A, other?
However, I hold it to be differences how PUD is treated with regard to the size of the oil companies (quality/size of collateral) and big greenfield developments (offshore North Sea, West Africa, Brazil) that spans several years from sanction to production and that requires some portion financed with credit/debt.
Such projects/developments, that are sanctioned, may be described as its reserves are in the twilight zone of PDP and PUD.
The clock starts running as the project/development is sanctioned (the owners have committed themselves) which includes a ton of documentation describing how the development will be carried out, what technical installations will be used, start up, drainage strategies and a best estimate on the production profile (all with baseline price assumptions and sensitivities, various risk analysis etc).
The development plan is also through extensive verification processes by (several) third parties, all remains confidential, but of course, lenders get access to whatever they need to do their due diligence.
If I had time I would like to have dug further into the rules for how PUDs in shales are treated. The company may in covenants (covering debt) have committed to a development plan for undeveloped acreage which to my best understanding has to account for something for assets evaluations and may explain the activity in drilling/completion.
Who owns companies while they show negative equity? (It is a rhetorical question.)
FWIIW, let me also illustrate this with how the Norwegian Petroleum Directorate (NPD; which has one of the best and honest resource classifications in the world) treat this.
A sanctioned development, which is not in production (thus not technically PDP) will be categorized as reserves and included in the reserve base for developments in production.
For instance the giant Johan Sverdrup discovery (estimated recoverable 2.2 Gb, present NPD estimate) was not sanctioned as per end 2014, but is now in the development (last I checked the Ministry was authorized to approve it (such a big investment needs parliamentary approval). There is a dispute about owners distribution. Johan Sverdrup is estimated to require about $15B in investment and is scheduled to start flowing during fall 2019.
At end 2015 Johan Sverdrup will move to a different category and be included with reserves in production.
Rune. In long term debt I am only including the outstanding bank lines plus the outstanding notes and bonds. There are many other liabilities which are not included, such as environmental, plugging and abandonment, pension, deferred income tax, etc.
Also, I want to make it perfectly clear that I am mixing SEC PV10, with bank reserve valuations, which take into account numerous factors, such as discounts for different classes of reserves, hedging, other outstanding debt besides the borrowing base, bank price decks, etc.
I highly recommend reading articles in the Oil & Gas Financial Journal regarding these matters. A very good article was authored by Jason Fox, Dewey Gonsoulin and Kevin Price, titled, “Reserve Based Finance” published in that publication 3/14/14. It walks through a borrowing base determination.
Rune, under most jurisdictions Johan Sverdrup reserves would move to proved un developed. If a well is drilled and completed but has to wait on production facilities completion it’s proved developed non producing.
I don’t know about the Norwegians, but in most cases I’ve worked in the project is sanctioned with documents showing proved plus probable as the most likely outcome.
Believe or not, about 30 years ago I convinced management to install a platform to appraise a discovery after we drilled the exploration well. That project was sanctioned using the discovery well’s hypothetical reserves and the risked exploration resources we could tap from that platform. I sure wish I could describe what we had, it was a very funky trap.
Shallow,
Is there a difference of PUD between lease #1 which has one well producing, and therefore HBP, with 10 more potential wells locations, and Lease #2 which is next door, with the same reserve/resource potential, but no producing well.
In other words if a lease is not HBP, is it held part of PUD?
My point being, if these leases that are not HBP, never get their first well drilled, they will expire, and depending on how reserves are currently counted, will depend on future impact.
Toolpush. Good question. I’ll try to answer, but keep in mind I’m self taught and would gladly defer to anyone who has or does this stuff for a living, such as petroleum engineers or oil and gas finance specialists.
For SEC purposes, I believe there are P1 reserves, which are proved; P2 reserves, which are probable and P3 reserves, which are possible.
Companies can only book proved reserves, or P1. These are defined as those quantities which can be estimated with reasonable certainty to be economically producible from a given date forward, from known reservoirs, and under existing economic conditions, operating methods and government regulations prior to the time the lease is set to expire. There has to be a high degree of confidence they will produce as much or more as booked. I have seen that probability be rated at 90%. Such as P1 have a 90% certainty, P2 50%, P3 10%.
PUD does not have to be on HBP acreage. Once PUD is booked, it must be developed within 5 years or it must be removed from proved reserves for SEC purposes. Furthermore, if there is a change in plans, such as removal of rigs, such that it is not expected the PUD will be developed within 5 years of being booked, that PUD must also be removed.
All of the 10K I read explain this better than I just did. Please also note that I have been mixing SEC PV10 with bank reserve calculations, which are much more complex and take into account many factors. See reference to that in a reply to Rune above.
The reason I use SEC PV10 is that is all that is readily available.
Keep in mind SEC PV10 is determined by an engineering firm or firms, hired by the oil and gas company, for that purpose, in close consultation with the company’s internal staff and the board of directors, who must approve the report. It is not determined by a governmental agency for the SEC.
Similar to how bonds are not rated by a governmental agency, but by private companies such as Moody’s, etc.
Once a lease expires, it cannot be included in PUD reserves.
I know it is boring, but read a shale oil 10K. You can learn a lot.
Thanks Shallow,
The one thing I don’t understand about the Shale plays and Proved reserves. I thought under SEC rules, proved reserves were what oil was accessible from the current drill wells. As the shale is impermeably and therefore the oil can’t travel from one location to another, I am surprised the Shale companies can book reserves for un-drilled areas.
So to sum up PUD reserves,
PUD will decrease due to current drilling plans have been cut back and delaying previously counted wells to outside the 5 year window.
PUD will decrease as leases, lapse due to not drilling of first well on lease and leases expire.
PUD value will fall as the current oil price catches up the average oil price that is used.
Toolpush. PDP and PDNP are reserves from existing wells I believe.
I’m not a professional in this area, would like to hear from some on how much leeway there is with PUD reserves.
I believe in the USA they are limited to one spacing unit. Say you have 640 acre spacing units. You can draw squares around that unit to cover nine spacing units (the original plus 8 others). The geology and seismic as well as well performance have to provide the support.
Anyhow, that’s the way we did it when I was signing off on the reserves submissions, which always got approved and passed the audits, so I assume it was kosher.
Release of the Monetary Policy Report – Opening Statement
Stephen S. Poloz – Governor, Ottawa, Ontario, 15 July 2015
Since our last [Monetary Policy Report (MPR)] in April, global economic developments have been quite disappointing, and these have led to a significant downgrade of our estimate of Canadian economic growth for 2015.
Anyone who is still talking about global economic growth at this particular juncture in our civilization’s history is either delusional, lying through their teeth because of their agenda or ideology, or a moron of the highest order! It’s time to call a spade a spade and tell all these people to take hike.
BTW, for those who somehow didn’t get the memo, THE FOSSIL FUEL ECONOMY IS ON LIFE SUPPORT! It is time to prepare for a significantly different reality.
Hey Fred, you and others may have noticed I’ve been absent for a couple of weeks. Well it started when I asked college batch-mate of mine who holds a senior civil service position in our equivalent to the DOE, how much solar PV is installed in Jamaica and more specifically connected to the grid? His answer was that he just did not know and that “the ministry” was looking into commissioning a survey to establish what the numbers were. It occurred to me that the way the wheels of government turn around here, it could be two years before the results of any such survey are released. I was also slightly concerned that, there are Wikipedia pages for “Solar power by country” and “Growth of photovoltaics” that have absolutely no information on Jamaica, giving the impression that nothing is happening here, when there is actually more installed than some of the countries included in the page, “Growth of photovoltaics”.
As a result, I decide to take it upon myself and create a Wikipedia page: Solar power in Jamaica, my first attempt at editing anything at Wikipedia and I must thank some more experienced people for jumping in right away and adding some stuff and tidying it up a bit. I included a table of some installations that have made the news here or have other online references that I could cite and the total comes up to over 4 MW!
Out of curiosity I used an online map site’s satellite view to do a virtual flyover of parts of the island, especially around installations have made the news or that I have seen while driving around and I now have a spreadsheet with over 140 installation more than half of which I have been unable to obtain any data for! For those that I have manged to find data for, the total now stands at over 7.4 MW with over 3 MW having been commissioned or installed and not yet commissioned in 2015! What’s more, the list of organizations that have taken the plunge, reads like a “Who’s who” of Jamaican businesses, some organizations with some serious influence in the local economy, Seems like the cat is out of the bag where the viability of using solar PV to offset the cost of daytime electricity use for businesses is concerned.
If the amount of solar PV installed were to double every year and energy conservation kept consumption flat, more than three quarters of the island’s peak mid day load would be satisfied by PV alone by the end of 2020! Note that the only incentive that renewables get in Jamaica is that approved renewable generating equipment does not attract import duties or sales tax. Feed in tariffs for solar PV here are currently at about 50% of the retail electricity rate so, the smart money is sizing their systems to cover their peak mid day consumption and not generating any excess to supply the grid.
In addition, ground was broken on July 9th for a 20 MW utility scale plant that has a 20 year PPA with the local grid operator. So yeah, somebody got “the memo, THE FOSSIL FUEL ECONOMY IS ON LIFE SUPPORT! It is time to prepare for a significantly different reality.” Now we’ve got to figure out what to do about transport!
Great to hear! I just arrived back in Brazil last Friday and have been a bit busy myself. Will give a general report soon.
Cheers!
Fred
Monetary Policy Report – July 2015
producers worldwide contribute to the glut in oil market:
Norwegian Production Figures Rise
7/16/2015
http://www.rigzone.com/news/oil_gas/a/139653/Norwegian_Production_Figures_Rise
The Norwegian Petroleum Directorate’s (NPD) preliminary production figures for June 2015 have revealed that the average daily production (ADP) of oil, NGL and condensate rose three percent from May 2015.
Figures showed that the ADP of oil, NGL and condensate was 1.948 million barrels, which is around 49,000 barrels per day more than in May. The average daily liquid production in June was 1.57 million barrels of oil, which is 10 percent above the oil production in June last year and around 5 percent above the NPD’s prognosis for the month, 353,000 barrels of NGL and 25, 000 barrels of condensate.
Final production figures from May 2015 show an average daily production of about 1.519 million barrels of oil, and 380,000 barrels of NGL and condensate.
On July 15th 2015, (video)
Darn Canadians are so polite. The Americans would probably have maced them and cuffed them, starting a war.
The old folks will hold out for a while , maybe a long time.
But the industry will inevitably bribe the youngsters with new cars trucks highways washing machines vacations in the sunny south etc ad infinitum . The only real question is how long it will take to negotiate and structure the bribes. Maybe a couple of years given the heavy hand of the government coming in on the side of the industry, maybe a decade or two.
Demographics are going to determine the future in Canadian politics just as surely as demographics determine politics here in the USA. We are moving leftward more or less steadily as the old folks die off and the youngsters take over..
After a while the youngsters in Canada will realize that they can have the goodies for no more than a hundred yard wide right of way thru their lands. You can bet your last can of beans that they will take the lemonade goodies as they will soon enough figure out the lemon is going to be forced down their throat if they don’t accept the lemonade.
This process might take a long time to play out, maybe a decade or longer but probably less.
If they can hold off a decade or more, they just might stop it completely. Otherwise it will be a huge ecological disaster. One of the most dangerous places to port oil tankers in the world and amidst an amazing array of wildlife. Recipe for disaster.
Looks like the pipeline has the approval of the 15 band leaders. They also incorporated an outfit to work clearing the pipeline right of way. So this may end up seeing a bunch of natives taking the scalps of outsiders who went recruited their own small native group (looks like it’s a mix of outside agitators with locals). I wonder, do they use hunting rifles or will they have it out with axes and tomahawks?
Happy Moon Landing Day.
Ronald W.
That is sheer lunacy. 🙂
http://www.theinvestorspodcast.com/episodes/44-how-to-invest-in-oil.html#sthash.eVUiQelS.dpbs
Morgan Downey podcast
Saudi Prince Threatens ‘Military Action Without American Support’ Against Iran
http://www.mrctv.org/blog/saudi-prince-even-after-deal-military-action-against-iran-still-table-or-without-us
The Saudis would get whipped hard if they tried that. Rest of the world would hate them even more than they already do, too.
What does that mean? Does it mean someone will buy 1 barrel less than they were going to?
The Saudis have a minority shiah population, most of which happens to live near the largest Saudi oil fields. I think they are scared.
Well, that’s exactly what the Saudis have been doing for decades now. No wonder they are afraid someone might do the same to them.
FOR ALL
I noted from several discussions about the term “break even”.
To me break even is a number associated with a discount (return) rate, why I normally denote it as a break even price of $xy/b at z%.
Some refer to break even as the point where their investment is fully recovered, every red cent of it.
And they want to reach break even or pay out and from there earn a profit.
It is all about profitability.
Example:
$65/b at 0%
$65/b at 7%
$65/b at 10%
Describes three situations and the most profitable one is $65/b at 10%, which describes at which price, over the lifetime of the project, the investment is fully recovered with an outlook for a return of 10%. It is profitable.
$65/b at 0%, no one would go for a project which outlook is to recover “only” its investments, but offer no return (some will refer to this as a break even or reach payout).
A project with an outlook for $65/b at 0% is not worth the effort, the money could as well keep the dog bones in the backyard company.
Then there is talk about fiscal break evens related to what oil price some countries need to balance their budgets. This is a different animal.
Rune,
Here’s a summary of some of the many definitions of “break even costs” by Evaluate Energy. Their
preferred definition of Breakeven cost is “Full Cycle costs including WACC.”
How to Calculate the Break Even Cost of Oil & Gas Production
Evaluate Energy’s Methodology for estimating the “Full Cycle” cost of oil and gas production and development
http://cdn2.hubspot.net/hub/312313/file-2262672865-pdf/breakevencosts-evaluateenergy2.pdf?submissionGuid=01cbbc2c-43c2-4fab-9c8a-51bca79ff383
“Over the long term, the oil and gas industry must incur certain costs in order to find, develop and produce oil and gas. This full set of costs the industry needs to incur in order to sustain or grow production is known as “Full Cycle costs”.
If crude or natural gas prices are generally persisting above these Full Cycle costs, the industry has an incentive to sustain investment and activity in the sector. However, if the margin between Full Cycle costs and prices is squeezed for prolonged periods, the industry finds, before too long, that investment is not sustainable and capital spending, production and reserve replacement will begin to fall off as a result.”
My definition of the breakeven price of oil projects is full cycle costs (including finding and development costs, production costs, taxes, transportation costs, selling, general, and administrative expenses) + IRR (internal rate of return).
IRR should be greater than WACC and is usually between 10 and 15%.
That’s a very informative paper, thanks.
It mentioned that royalty costs are provided by the companies to the SEC. However, I have not seen these in the company reports.
I also couldn’t find the amount of royaties paid in company accounts.
Probably, the phrase below from Cheasapeake 10-k report explains why:
“Revenue from the sale of oil, natural gas and NGL is recognized when title passes, net of royalties due to third parties”
I think we should ask shallow sand about roaylty accounting
AlexS. Thanks for the post. I note the statement to the effect that companies must obtain at least a return of capital over the medium term or they are destroying shareholder value. Cannot have negative cash flow every year.
As far as royalty accounting, the US is about the only country that has private mineral ownership. I am posting a very simple example, which you may know already.
If I own a tract of land and lease it to an oil and gas company, I sign a contract (lease) with them which includes a fraction or percentage of the proceeds from the sale of oil and gas, free of cost.
As the mineral owner, I pay none of the CAPEX or OPEX. I only pay any ad valorem taxes assessed by the county, severance taxes assessed by the state, and income taxes to the federal and state governments, attributable to the proceeds I receive.
The county sends a tax bill once per year, to be paid in one or two installments. The state requires the severance taxes to be deducted from the royalty check. I report the net income on my federal and state income tax return annually, and pay the tax with the returns.
For many years, a commonly negotiated royalty was 1/8, or .125.
So, if the lease had sales proceeds of $100,000.00 for the month, I would receive $12,500.00, before taxes, and pay none of the CAPEX, nor OPEX.
The oil company would receive $87,500 before taxes, and pays all expenses.
As a royalty owner, I do not go under water in any circumstance.
My point is that the amount of royalty burden varies widely in the US shale boom areas. Richard from East TX posted that it many times is 1/3 to 1/4.
The royalty burden is of prime importance to stripper well producers, who during times like now, operate on very tight margins.
Of course, it is important on every project. During the rush to lease, it appears many companies in the US not only paid mineral owners very high amounts up front, sometimes over $20,000 per acre, but also agreed to very high royalties.
Just one of the many variable that affect profits/losses.
I have been using a 20% royalty in my simple calculations. Maybe that should be higher?
Thanks, shallow sand, that’s very helpful.
My question is: are revenues in company’s P&L accounts shown net of royalty payments?
They are shown that way in SEC reports.
They are not shown that way in company internal lease operating statements.
Thanks
AlexS,
Thanks! And you are right, it is also important to point out if these are full cycle, point forward etc.
Full cycle are the ones that counts.
AlexS is giving some useful help, so I will try to move to the next step, while trying to keep it basic.
DEFINITION of ‘Return On Investment – ROI’
The formula to calculate ROI is;
ROI = (gain from investment – cost of investment) / cost of investment.
The subsequent result is expressed as a ratio or a percentage.
DEFINITION of ‘Net Present Value – NPV’
The difference between the present value of cash inflows and the present value of cash outflows. NPV is used in capital budgeting to analyze the profitability of an investment or project.
”Determining the value of a project is challenging because there are different ways to measure the value of future cash flows. Because of the time value of money, a dollar earned in the future won’t be worth as much as one earned today. The discount rate in the NPV formula is a way to account for this. Companies have different ways of identifying the discount rate, although a common method is using the expected return of other investment choices with a similar level of risk.”
From Investopedia.
Now let me illustrate with an example.
An investor is faced with making a decision of investing in well A or well B and the wells is presented with the following economic data and analysis.
Both wells are in the same shale play and have a CAPEX of $8M. Both are full cycle estimates, including taxes, royalties, OPEX, G&A, financial costs (same interest rate and portion of debt financing), plugging and abandonment.
Both estimates are based on an oil price of $80/b during the lifetime of the wells.
(The oil price is lower now, but that is not the point I set out to demonstrate.)
It is all there.
WELL A
Shows a Net Present Value (NPV) of [plus] $0.53M with a discount rate of 7%.
WELL B
Shows a Return On Investment (ROI) of 137.9%.
(Edit: I harmonized the ROI to be in line with the definition at the start)
That is a nominal profit of $3.03M.
Which of the wells do the readers think the investor will choose and why?
Rune, how many years is the life of well B?
And what is the net cash flow each year over that well’s life?
You probably meant an ROI of 37.9%?
It looks like the wells will have the same return if well B reaches an age of 25.8 years (discounting a return of 3.03 with 7% over 25.8 years yields 0.53). If the well life of well B is longer than 25.8 years, well A gives a better return. Assuming that well B will get older than that (I guess the average well gets a bit older?), and assuming a 7% discount is enough for me(a big if), I would go for well A.
Hi Enno,
You cannot assume the well profiles of well A and Well B are the same, so we cannot really make a judgment on well B without more information.
Hi Dennis,
I did not make any assumption on the well profiles. I determined that for well B to be for sure more attractive than well A, its well life had to be shorter than 25.8 years. Without that information, I can assume (without knowing for sure) that the well life (and also the return) may be longer, and go for the sure bet (well A).
Yes, the information about the well life of, and cash flow from the wells will be valuable, and can allow us to make a better decision. If it is just not available, we can still make a decision. If I give you the choice between
A) I give you $5 or
B) I give you the dollars I have in my closed hand
Would you also tell me you can’t make the decision without more information? 🙂
Enno,
”Would you also tell me you can’t make the decision without more information?”
Also one of the points I want to demonstrate. From observations people on POB is well informed/educated about energy, shale etc.
Now imagine a person that has less insights and how that person will form an opinion by navigating through the bombardments of information from MSM?
Hi Enno,
You are correct. In most cases a well with the well life you suggested would be the better investment in my opinion without more information because generally we would not expect to see all of the cash flow at year 25.8. So your method for evaluating well B was very conservative. The point I take away from the lesson is that ROI is a very poor metric unless it is annualized ROI (which is always what I am thinking of when I use the term).
Although your definition of ROI is correct, like NPV, in reality it has a huge time component to it. Earning 5 on a cost of 10 over a month is very different from earning 5 on a cost of 10 over 10 years. Generally people tend to use annualized returns to adjust for that.
rgds
WP
I would also favor using NPV due to the time involved.
I would not pay much attention to ROI for shale wells due to their expected life time (20-30 years)
Hi Rune,
Thanks. I have been using ROI incorrectly, thanks for correcting me. I have been using annualized return interchangeably with ROI. I always think in terms of annualized returns when comparing investment opportunities as time is important.
ROI information without any information about how long the term of the investment is is not enough to make a decision.
We do not have enough information to make a decision about well B because that return might be over 60 years, NPV is much more useful.
For example Well B might pay back the initial investment in nominal dollars over the first 30 years and then earn the $3 million nominal dollars over years 31 to 60.
If we discount $3.03 million at a 7% discount over 30 years it is worth only $343,000 in today’s money, since the $3.03 million is earned over 30 to 60 years the NPV would be considerably less than $343k.
No decision could be made without more information.
WELL A = WELL B
It is the same well described with different metrics.
What I am trying to demonstrate is that depending on what terms/concepts people are familiar with they may describe the same thing, but still talk past each other due to their familiarity of terms.
Enno, thanks you are right.
(I should not have edited something that was right from the start).
Hi Rune,
Thanks for the lesson.
For me, the NPV @ some discount rate is a more useful metric, YMMV.
http://www.bloomberg.com/news/articles/2015-07-19/history-shows-iran-could-be-about-to-surprise-the-oil-market
Lets give Mr Blas at Bloomberg the following tips:
1. Venezuela’s post strike production numbers are fake. The true numbers are about 700,000 BOPD below what they showed.
2. OPEC countries tend to have spare capacity. This means the productivity decline can’t be measured by looking at a pre and post peak production rate. Lybia may have had some spare capacity, when they returned to production they may have had no spare at all. Hard to tell in that mess.
3. When an operator is forced to cut back (as is done in OPEC countries) there’s a tendency to postpone repairs and well drilling we usually do to sustain capacity. Different operators use different shut in logic schemes. And these schemes can harm a reservoir or well.
We don’t know in detail what the Iranians have done, but if we go by standard operating practice they will have deferred well repairs, and some of these deferrals can harm a well’s capacity.
In conclusion, I wouldn’t be using Venezuela (anybody who knows anything about Venezuela understands they fake their figures). I don’t know for sure about Lybia. But experience shows getting back on all pistons takes time. How much time depends on the field and well age, well type, etc.
2. OPEC countries tend to have spare capacity. This means the productivity decline can’t be measured by looking at a pre and post peak production rate. Lybia may have had some spare capacity, when they returned to production they may have had no spare at all. Hard to tell in that mess.
That is the second biggest myth about OPEC. The largest myth is that they have 1,206 billion barrels or 81% of the world’s of proven reserves. No OPEC country has any spare capacity. Saudi Arabia may have had a little a few months ago but they are now producing flat out.
That may be true now. But I’ve worked in OPEC countries and seen reports by other business units reporting they couldn’t meet production forecasts because they were cut back under OPEC quota clauses.
You see, in some companies the business units get bonuses for meeting goals. But a business unit in the OPEC environment had to cut when given the orders and increase spare capacity. This gave them a special exception so they get their bonuses even if the production goal isn’t met.
However, I don’t keep track of such things since 2009. This is why I wrote I knew for sure about Venezuela but I wasn’t sure about Libya. Venezuela had spare capacity prior to 2002. After the strike capacity AND production dropped to 2.3 million BOPD.
There is an excellent new post up at ENERGY MATTERS which summarizes the various pros and cons of the proposed new generation of nuclear reactors. It is about as good as anybody is apt to find short of reading a well balanced book.
I know a lot of regulars here are bitterly opposed to nukes but personally I am open to the possibility that a new generation of nukes can be both reasonably safe and reasonably clean. They will still be dangerous but on the other hand being without them might prove to be even more dangerous. There is no telling what people and countries might do if the lights go out and the toilet won’t flush.
We are going to need every watt we can get of power both nuclear and renewable as fossil fuels deplete and the climate heats up. If people were totally rational Spock Star Trek style we might manage without nukes.
Unfortunately we are not altogether or even mostly rational.
Remember than as energy supplies become more critical, decreasing as fossil fuels deplete, every last marginal kilowatt hour is going to be more important than the one previous to it. There is not in my estimation any real hope of building out enough renewables and storage capacity to take a chance on not building the next generation of nukes. Fourth generation nukes, as I see it, are safer than wide scale blackouts and brown outs which will lead to very bad political decisions such as building even more coal plants and starting wars to get fossil fuels which can no longer be bought.
http://euanmearns.com/molten-salt-fast-reactor-technology-an-overview/
I read the article and generally agree with your statements. However, note that Euan Mearns posted on 7/20/15 at 10:47 am that it sounds like an MSFR reactor would not be ready for 100 years. So, I would say that no money should be spent on it for 50 years. By then [maybe earlier], computing power will be able to design and fully test such a reactor in the “cloud” [just to borrow current terminology] using simulation technology before spending any money on actually trying to construct one. I think that aircraft designers can now essentially design an aircraft by computer and simulate “flying it” using a computer, before actually constructing the aircraft.
I know a lot of regulars here are bitterly opposed to nukes but personally I am open to the possibility that a new generation of nukes can be both reasonably safe and reasonably clean.
I used to be anti-nuke, but now I am open to the idea as a way to generate electricity while burning less carbon.
And that’s always why I think the political conspiracy theories of climate warming data don’t make sense. Who better than the nuclear industry to benefit by convincing people to move away from carbon-based fuels? So if there is a conspiracy going on, the nuke industry would seem to be the most logical culprit.
Nuke power plants aren’t my first choice for energy generation, but I think we have to consider them if CO2 is a huge problem.
read this:
http://www.remss.com/research/climate
Look at the graph comparing the temperatures versus the models (the model results are the yellow shaded area. I assume you do agree there’s a mismatch).
Given what we see in this webpage, do you ever wonder why is it they keep insisting on keeping the SAME model set up, when its so evident these models can’t hit the side of a barn from 20 meters? Why do they insist on running the same bs, and create such a huge political machine to back this bs? I think they know we are running out of fossil fuels, want to reduce dependence on the Arabs, Russians, Venezuelans, and other assorted “bad guys”.
I think they know we are running out of fossil fuels, want to reduce dependence on the Arabs, Russians, Venezuelans, and other assorted “bad guys”.
It would be a lot easier just to say that than to “fake” climate data which won’t be at its worst for decades.
Yes, we’re running out of fossil fuel. That’s why the politics of climate change is irrelevant. The economic changes are coming anyway.
Yes, we’re running out of fossil fuel. That’s why the politics of climate change is irrelevant. The economic changes are coming anyway.
And now, everyone who is a climate change denialist and still believes this is some massive hoax perpetrated by left wing watermelon scientists, who are getting filthy rich on government grants paid for by the poor right wing tax payers, should march themselves over to the black board and write 100,000 times!:
The politics of climate change is irrelevant.
I am not sure where the sarcasm begins or ends in your comment, but it did make me laugh. Anyway another massive hoax that denialists love to expose is the idea that Electric Vehicles are clean. I posted a couple of comments about this in the last few weeks. Well now the watermelon scientists have printed a rebuttal.
Are Consumers Being Manipulated By Anti-Electric Car Propaganda?
see – http://www.hybridcars.com/are-consumers-being-manipulated-by-anti-electric-car-propaganda/
I have a website by a whisky bottler showing ethanol is good for your sex life. That website is a lot better than yours.
Good question. They don’t “fake” the climate data. The political game seems to be to use the RCP8.5 as the “business as usual” case, project temperatures using a model ensemble which runs slightly hot, and build on those two by doing some cherry picking, using hot color palettes, and using a Mannian technique to confuse the readership.
The difference in the approach is very noticeable, the Japanese are very professional. Hadley unit is ok, so is Berkeley. NASA can be good to awful. NASA RSS seems to be gold plate. NOAA is uneven. After the Karlizing event, and looking at their color palettes, I think NOAA has to be scrutinized carefully before believing anything they interpret. It’s s very politized agency. If I were in congress I would do something about it, can’t have a government agency producing propaganda like they do.
And if you doubt whether agencies do politics, look at the crap that went on in the Pentagon during the run up to Iraq 2003. They had people cooking up information in cooperation with the media to fake out congress.
They don’t “fake” the climate data. The political game seems to be to use the RCP8.5 as the “business as usual” case, project temperatures using a model ensemble which runs slightly hot, and build on those two by doing some cherry picking, using hot color palettes, and using a Mannian technique to confuse the readership.
I keep saying that I don’t see a motivation to do this and you discount my skepticism. I’m open to whatever scientific discussions there are about climate. The same way I am open to whatever scientific discussions there are about the origins of the universe.
The climate discussions don’t concern me directly, so I don’t get upset about them one way or another. What I have yet to be convinced about is that there is a political plan in misrepresenting climate data. If the goal is to change lifestyles, (1) it isn’t working very well and (2) there are better ways to change lifestyles than to talk about threats that won’t hit full impact until after we’re all dead.
You don’t see the motivation for government employees to please political appointees who boss them…
You know, I couldn’t believe what I saw when the pentagon lied so much about the Iraq WMD. But eventually I realized they were run by Rumsfeld, Wolfowitz, et al. Political appointees have a lot of power, you know. So there you are.
You know, I couldn’t believe what I saw when the pentagon lied so much about the Iraq WMD. But eventually I realized they were run by Rumsfeld, Wolfowitz, et al. Political appointees have a lot of power, you know. So there you are.
All you have said is that you believe government employees lie.
You haven’t made a good case why anyone would go to so much trouble to manipulate climate data. As I keep pointing out, it’s a very poor way to get people to change lifestyles. The threat, as it has been described, isn’t going to be at its worst for decades.
If government employees are going to concoct a scenario to take over the world, they can do better than global warming.
There is a simpler explanation, Fernando. IPCC and associated climatologists have painted themselves into a corner. By attributing all global warming to man in the hope of sounding more certain that they are and push for political action they have left no room for natural variability in the global warming. If they now come out and say that part of the warming is natural they would lose their reputation and damage “the cause”. They would open the Pandora’s box of non-settled science and non 97% agreement.
That’s why they are so much at odds with the warming stasis, that has to be explained outside of natural variability, which is obviously an almost impossible task, although their supporters are really gullible. Because if the warming stasis is due to natural variability, then the warming necessarily had to be due in part to natural variability.
And more importantly the climate sensitivity, that after 17 years still has the same degree of uncertainty for them, between 1.5 and 4.5° C, after years of intense research and billions spent. Not having been able to reduce that uncertainty is the definition of scientific failure, except that of course that uncertainty has been reduced in the measured climate sensitivity, but due to the warming stasis it has been reduced to the lower side, so they do not accept that and keep the climate sensitivity in the models inflated. So here we are paying them to delay scientific research into climate sensitivity.
All this situation is going to become untenable if come 2017 the world starts to cool as some scientists are proposing. Once the “Los Niños” of 2014-15 end we will start with “Las Niñas” so they will have an excuse. But the cycles are very clear and both AMO and PMO are going to be negative and on top of that, solar activity is going down to help temperatures go down. By 2020 IPCC position is likely to be very weak and with a lot of excuses, and by 2025 if the world doesn’t have more dramatic issues to handle, AGW theory is likely to be seriously challenged by former mainstream climatologists, if this scenario comes true.
If they now come out and say that part of the warming is natural they would lose their reputation and damage “the cause”.
How are they at any more risk than any scientific hypothesis that is revised as more information is available?
There is scientific research done all the time. Some of it is revised as more evidence becomes available. Medical practice recommendations and nutrition recommendations are constantly evolving.
I still don’t buy the idea that somehow climate science is any more “political” than any other science.
still don’t buy the idea that somehow climate science is any more “political” than any other science.
It isn’t! Granted both Javier and Fernando are hell bent on giving the impression that it is! However their aguements don’t hold water.
The argument that climate science is flawed because there is a political game that uses the RCP8.5 as the “business as usual” case, projecting future scenarios is absolutely irrelevant bullshit!
There is mounting evidence from many fields of science practiced by scientists who have never even read an IPCC executive summary! I can’t really opine much about actual climate scientists because that is not my area of expertise though I tend to give most of them the benefit of the doubt.
However I know a little bit more about biology and ecology and it is the work of these scientists in the field today that provide most of the incontrovertible evidence that climate change is real, it is happening today and is having profound impacts on ecosystems the world over!
http://blogs.plos.org/blog/2014/08/12/ecologists-worried-right-now-5-emerging-trends-climate-change-ecology/
What Ecologists are (Most) Worried About Right Now: 5 Emerging Trends in Climate Change Ecology
So please spare me the fucking politicized bullshit, IPCC, right wing, left wing, communist, greenie weenie crap! It is completely irrelevant and doesn’t, at all, address current scientific knowledge about climate change!
Straw man fallacy. I am not hell bent on giving such impression. Climatology is more public than most sciences in the sense that you can make it more easily into the headlines of the media if you are alarmist enough. I bet most people in this forum can name more current climatologists than current biologists, despite climatology being a much smaller field.
And there are plenty of biologists and ecologists who are worried about the climate!
Excessive worrying may have co-evolved with intelligence
“Scientists found that high intelligence and worry both correlate with brain activity measured by the depletion of the nutrient choline in the subcortical white matter of the brain.”
Don’t give too much issue to their worries. Science tells us it is normal.
Mr. Magyar,
Consider this, present day Progressive Republicans and Socialist Democrats have the same objective. Growth of a bigger government with the accompanying loss of our rights & freedoms. The Global warming meme is nothing but a means to accomplish this growth through a new perpetual revenue source and control of the people through pure energy starvation.
First science does not support their founding principle that the world global temperature is controlled by the CO2 content of the atmosphere. And even if we can finally put this idea where it belongs they’ll try to come up with yet another as they try to convince us uneducated simpletons to buy into the agenda. Second our government has become just too bloated to control itself as evidenced by the current congress, executive, and judicial branch inability to function together. It’s time to downsize it altogether and unleash more of the awesome prosperity creating potential of free markets.
If this makes me a radical right wing extremist, in your eyes, then so be it. But don’t think that opposing this hoax for political reasons invalidates my denial of the meme or reverses any of the honest science that proves there is no such thing as global warming.
Dr. Pucciarrelli,
If this makes me a radical right wing extremist, in your eyes, then so be it. But don’t think that opposing this hoax for political reasons invalidates my denial of the meme or reverses any of the honest science that proves there is no such thing as global warming.
For the 1,100 th time! I don’t give a fig about anyone’s individual political leanings! If you self label as a right or a left wing sympathizer, that is completely irrelevant to me and to the fact that climate change is a scientific reality with real consequences right now! And again, I really don’t care who does or does not accept IPCC projected scenarios based on business as usual scenarios due to a continued use of fossil fuels, which supposedly are peaking now and therefore do not support the projections. I’m much more interested in the data from the field and despite what Javier suggests is normal, and we shouldn’t worry about it. I have a different opinion. Granted the fact that extinction events have happened in the past and life has continued and the fact that we are in a mass extinction event now, might be considered normal by some, I do not personally subscribe to that notion!
The data from direct observations in the field are telling us that fauna and flora, are being impacted now and the ecosystems in which they have thrived for thousands of years are changing too rapidly for most organisms to be be able to adapt in what would be considered a normal evolutionary time frame. And I’m not even talking about the fact that we are undergoing what seems to be a massive global biological extinction event.
And I’m sorry to disagree but the so called ‘Honest Science’ does not ‘PROVE’ that there is no such thing as global warming, in fact it is showing the exact opposite.
I suspect it won;t change your mind much but perhaps a reading of some of these papers will at least give you an understanding as to where I’m coming from.
http://www.ploscollections.org/article/browse/issue/info:doi/10.1371/issue.pcol.v01.i17
Cheers!
Fred Magyar
It is the same in any scientific field. Max Planck famously said that “Science advances one funeral at a time“. When somebody has made both a career and a reputation out of a theory he/she will resist admitting that he/she was wrong to the death. In the case of climatology it is worse only in the sense that Hansen, Mann et al. are now worldwide famous and so the fall would be a lot more public than for most scientific disciplines.
Max Planck famously said that “Science advances one funeral at a time“. When somebody has made both a career and a reputation out of a theory he/she will resist admitting that he/she was wrong to the death. In the case of climatology it is worse only in the sense that Hansen, Mann et al. are now worldwide famous and so the fall would be a lot more public than for most scientific disciplines.
And why would you think that? There are famous scientists in lots of fields. You think other scientists are propping up the famous ones in other fields so the famous ones can save face?
Common on. If there is reason to revise climate science, it will be revised.
You just aren’t making much of a case. Whatever happens in all sciences will happen with climate science. It is not unique. If research indicates that ideas need to be corrected, they will be corrected. I see no reason to believe there is collusion or extreme face saving being done.
You would be surprised:
Most Americans Can’t Name a
Living Scientist
I have no doubt of that. The scientific method has a built-in corrector mechanism. But sometimes it takes an awful lot of time to revise a theory. For example from Arrhenius to acceptance of CO2 as a significant agent for climate change was seven decades.
I suppose you are aware that unlike most other disciplines, climate science has become divisive. You just have to read this forum and count the number of times the word democrat or republican is in the same post as climate.
You would be surprised:
Most Americans Can’t Name a
Living Scientist
And they are even less likely to be able to name a climate scientist. That’s my point. Publicity isn’t dictating what scientists say.
But sometimes it takes an awful lot of time to revise a theory. For example from Arrhenius to acceptance of CO2 as a significant agent for climate change was seven decades.
So? Are you suggesting that you have insight that others don’t and that in time they will come around to seeing it your way? The very fact that a lot of scientists are accepting the data suggests that over time they came to see it this way. If there will be changes, those will come in due course as well.
I suppose you are aware that unlike most other disciplines, climate science has become divisive. You just have to read this forum and count the number of times the word democrat or republican is in the same post as climate.
I’m not the one who keeps injecting politics into the data. You, Fernando, and others who drop in here do that. I keep saying that I’ll treat the info about climate science the same way that I treat info about the origins of the universe. It’s interesting, but doesn’t dictate how I run my life.
I have no reason to think climate science is political.
I don’t think you are making much of a case as to why I shouldn’t accept the climate science at face value.
You just have to read this forum and count the number of times the word democrat or republican is in the same post as climate.
Yes, democrat usually means “science” and republican usually means “anti science”. Perhaps you can explain this strange predilection.
No. You keep attributing words and intentions to me that I don’t recognise as mine.
It is a common fact that two scientists examining the same data will come to a different conclusion. Time and more data will tell who is right and who is wrong. The number of scientists that come to the same conclusion says nothing of the validity of the conclusion. Science has never been democratic. One can be right and many wrong as it often happens.
I don’t care about american politics or their opinion on climate science. Yet I think it affects the way people chose their beliefs about climate change. I find it interesting and I am amused that so many people guess my political affiliation (and fail) based on my climate change opinion.
Again you attribute an intention to me that I don’t have. You should accept climate science at face value. That is what I do myself. I have examined the evidence and concluded that the current favoured theory on climate change:
-Does not explain satisfactorily the current climate data
-Lacks reasonable predictive capacity
-Has a problem with being falsifiable, as any climate phenomena in any direction is seen as confirmation
-Does not seem to be significantly different from the null hypothesis.
Just make sure that you get the real face value of climate change, and not some watered down version.
I don’t care about american politics or their opinion on climate science. Yet I think it affects the way people chose their beliefs about climate change.
When you and Fernando stick with discussing climate data, I’m not going to question it because I don’t know enough about it. I’ll read what you guys have to say and what others have to say.
But when each of you starts talking about the motivations of scientists to promote theories you think are wrong, then red flags go up for me because your reasoning suggests that scientists in general can’t be trusted. But why should I believe that? And why should I trust the data you provide but not trust the data that others, with opposing viewpoints, provide?
I’ve told you already twice but we keep bumping into the same problem. You keep attributing me things that I do not say. Why don’t you just stick with what I say?
I could not possibly say that scientists in general can’t be trusted since I am a scientist. But I would say that trust in scientists is not required at all. Science is about evidence, not trust in scientists. The data speaks for itself.
Published data is always assumed to be correct unless there is proof that there is something wrong with it, or it is retracted, or it is superseded by newer/better data.
Often there is conflicting data, or even incompatible evidence. This indicates issues that need to be resolved. Very often you will find that the same data is used to defend a theory and the contrary. This is because that data is neutral to the differences between both theories.
Until sometime ago I was accepting AGW as the best current knowledge. What changed was that I started looking into it. I always research quite thoroughly and read from all the sides of the debate. I was very surprised to see that the evidence, according to my best judgement, fails to support AGW enough to convince me.
Of course others are convinced by the same evidence and we both cannot be correct. To me the important thing to transmit is that holding a different opinion to IPCC is not unreasonable and that the available evidence does not support the level of confidence that the IPCC claims.
In general I find that people don’t care about evidence or alternative views and get very upset when somebody with my level of knowledge, clearly superior to most non scientists, dissents.
You keep attributing me things that I do not say. Why don’t you just stick with what I say?
I have been responding to comments like this:
When somebody has made both a career and a reputation out of a theory he/she will resist admitting that he/she was wrong to the death. In the case of climatology it is worse only in the sense that Hansen, Mann et al. are now worldwide famous and so the fall would be a lot more public than for most scientific disciplines.
And this:
There is a simpler explanation, Fernando. IPCC and associated climatologists have painted themselves into a corner. By attributing all global warming to man in the hope of sounding more certain that they are and push for political action they have left no room for natural variability in the global warming. If they now come out and say that part of the warming is natural they would lose their reputation and damage “the cause”. They would open the Pandora’s box of non-settled science and non 97% agreement.
There is a simpler explanation, Fernando. IPCC and associated climatologists have painted themselves into a corner. By attributing all global warming to man in the hope of sounding more certain that they are and push for political action they have left no room for natural variability in the global warming.
This is another grotesque misrepresentation of the IPCC. The IPCC very elaborately discusses natural variability and gives a probability distribution for the extent that observed variance can be attributed to human action. A question for this forum.: When is it reasonable to look at the nature of posts from an individual and deduce that the misrepresentations are maliciously intended to deceive? We are not mind readers. All we have is the text that people post.
Before reaching the conclusion that more than 100% of the observed variance can be attributed to human action and exactly zero to natural forcings and natural internal variability. Good luck with that, as if there was no climate change before the industrial revolution emissions. They are going to fail epically.
Javier : Let me get back to yoy on this. I’m researching something you may like.
OK
Radionuclides safely underground 1st, then talk new reactors.
Many of us are downwind of “unprotected” Spent Fuel Pool(s)
outside containment at every plant located across the US. None of commercial spend fuel has been relocated to a safe location in the US. Reactors are not such a concern when the majority of the radionuclides is outside containment.
” I did not know that was even possible” Chancellor Merkel – referring to the Fukushima triple meltdown.
I am not overly concerned about a resurgence of nuclear power plants because the economics don’t favor them.
I’m not saying they are my first choice. But I have gone from being anti-nuke to being willing to consider them as a no-carbon possibility.
However, I think distributed generation is going to be the favored solution because it gets us away from being tied into a grid. Nukes are too 20th century.
I’m more in favor of downsizing energy consumption than I am in finding ways keep our current lifestyles going.
Distributed generation- the obvious way to go. Has huge advantages:
Cheap, fast, no terrorist problem, resilient, goes anywhere, modular, —–.
I sit here in my standard american middle class house, outside, 9kWp of PV, cranking out all I need to run everything, as well as an EV for wife and another from my shop assistant.
The PV creates as much fuss and takes as much care as so many window panes. It pumps kW-hrs back into the grid-3-4 times as much back as from, averaged over the year.
Cost, not near as much as does my neighbor’s BAU stuff.
And, yes I know that I am still importing ff’s when I go to the store, but not near as much as my neighbor, especially since I never buy any gasoline or beef.
So, do I need nuclear? No, because I already have it- and thermonuclear to boot, in that nicely sited gravity-stable reactor guaranteed to last forever with no maintenance.
Wimbi,
It is not that renewables can’t be made to work. We COULD go renewable if we were all well informed thinking machines. The problem is that the small portion of us who are even WILLING to do a little thinking- never mind sufficiently knowledgeable and intelligent enough to be ABLE to think- are not in charge.
Cats and tailless monkeys are not easily herded.
So – as I see things we have to take a LOT of chances and run a lot of risks in order to avoid taking even bigger chances and running even worse risks.
IF–IF we were to get the ” Pearl Harbor wakeup” bricks I often mention soon enough and in great enough quantity, then I believe we would have a fairly decent shot at turning the fossil fuel to renewables corner without resorting to nukes.
But as I see things we are approaching that corner at a speed that guarantees a fatal crash – a general collapse.
Some nukes just might make the difference between the lights staying on and the toilet flushing for hundreds of millions of us. No lights no toilet means war in the streets.
So I am basically reluctantly advocating building a new generation of nukes as well as advocating a pedal to the metal effort to build out renewables and improve our energy efficiency across the board.
SOME of us can pull thru the more or less baked in collapse if we stay after it and don’t suffer any major bad luck but you and I are not likely to be here when the crisis hits. Old age has us by the belt and the back of the neck. 🙁
OFM. As nearly always, I’m not making any generalities about us, I’m just talking about me. I’m the only one I can do anything about.
I’m pretty happy with my own situation, and my thought is: I’m not unique.
Start with one, and let the rest take a look. Some might follow.
And some might follow them, and so on.
And might not. Out of my hands.
People are fungible. Me or not-me — absolutely irrelevant.
“The future cannot be predicted, but it can be invented.”
How is a “distributed generation” fish warehouse going to work? How about a cement plant?
How is a “distributed generation” fish warehouse going to work?
They are planning to do it with data centers, which are more sensitive to power distributions than a fish warehouse.
Microsoft Sees Data Centers Transforming the Power Grid: “This is one of our first major research partnerships to use data centers as a laboratory for next-generation energy technologies, but it certainly will not be our last,” Janous in blog post. “Distributed generation will be an important part of how we power our datacenters as we continue to pursue Microsoft’s energy strategy of transforming the energy supply chain.”
“Fuel cells fed by garbage dump methane”. I definitely don’t want to live next to one of these “distributed power centers”. They’ll make the surrounding real estate prices nosedive.
I definitely don’t want to live next to one of these “distributed power centers”. They’ll make the surrounding real estate prices nosedive.
That’s what the anti-frackers have been saying in their fight to stop fracking next to houses, schools, parks, and so on.
If we can stop distributed power centers from lowering real estate values, presumably we can use those same arguments to stop fracking.
Yes, people should be able to say what they want or don’t want to go in next to their homes.
I’m sure the Indonesians, Congolese, and Peruvians will love getting help building nuclear reactors to reduce the global warming problem.
I think the NDIC has simply stopped reporting “Producing Wells Completed” in their Daily Activity Report Index. None were reported today. The last one reported was on July 10.
I have no idea why they stopped reporting new wells.
Note ND rig count at 70 today.
Also note WTI front month futures below $50.
Just checked it a minute ago and it now sits at 68.
It looks like Statoil drop 2 rigs from 5 to 3.
Hi Ron,
Not sure what is up with the July reports since July 10. I checked June daily activity reports and 133 wells were completed, if all the “confidential wells plugged or producing” were producing rather than plugged. I would expect a small drop in output from the ND Bakken/Three Forks (8 kb/d) if all 133 wells are Bakken/Three Forks wells, if we fall to 65 new wells in July, output will drop by 40 kb/d in July and if 65 new wells per month continue to be added through Dec 2016, output will fall to under 1000 kb/d by Dec 2015 and to under 890 kb/d by Dec 2016.
Merger activity is warming up!
Noble Energy Closes Acquisition of Rosetta Resources – See more at: http://www.noodls.com/viewNoodl/29141377/rosetta-resources-inc/noble-energy-closes-acquisition-of-rosetta-resources#sthash.nx8PWgAo.dpuf
Chesapeake, axes dividends, and sells Oklahoma leases.
Chesapeake Energy Corporation Updates Financial Strategy – See more at: http://www.noodls.com/viewNoodl/29148287/chesapeake-energy-corporation/chesapeake-energy-corporation-updates-financial-strategy#sthash.JLHW0CEf.dpuf
A couple of more companies to keep an eye on.
http://oilprice.com/Energy/Energy-General/Oil-Price-Plunge-Raises-Fears-for-Indebted-Shale-Companies.html
Oil Price Plunge Raises Fears for Indebted Shale Companies
Posted on Thu, 09 July 2015
Bonds due in 2020 for Energy XXI, a driller in Louisiana, are now trading at 84.5 cents on the dollar, and Oklahoma-based SandRidge, has seen its debt fall to 87 cents on the dollar.
edit:Another article on the same subject, with a few more companies mentioned.
http://www.bloomberg.com/news/articles/2015-07-07/energy-junk-bonds-deemed-silo-of-misery-as-oil-resumes-plunge
Chesapeake Halts Dividend as Energy Slump Squeezes Cash Flow
July 21, 2015
http://www.bloomberg.com/news/articles/2015-07-21/chesapeake-energy-eliminates-dividend-as-gas-prices-slump
Chesapeake Energy Corp. halted its quarterly dividend for the first time in 14 years as slumping energy prices crimped cash flow for the second-largest U.S. natural gas producer. The shares dropped to a 12-year low.
Ending the 35-cent annual payout beginning with the third-quarter payment will save $240 million a year, Oklahoma City-based Chesapeake said Tuesday in a statement. The company will avoid another $75 million in annual preferred dividends by selling a portfolio of Oklahoma fields.
Chief Executive Officer Doug Lawler has been auctioning assets, cutting overhead and dismantling complicated financial commitments he inherited when he succeeded Chesapeake’s ousted co-founder Aubrey McClendon two years ago.
Chesapeake is expected to post a net loss of $3.18 billion this year, based on the average of eight analysts’ estimates compiled by Bloomberg. That would be the company’s steepest annual loss since 2009. Chesapeake has posted a cash shortfall in 22 of the past 24 years, according to data compiled by Bloomberg.
Chesapeake fell 9.5 percent to $9.29 at the close in New York, the lowest close since Aug. 5, 2003. The shares are down 65 percent in the past year.
The company’s $1.1 billion of 5.75 percent notes fell 1.5 cents to 86 cents on the dollar to yield 8.3 percent, after touching an all-time low of 84.88 cents, according to Trace, the price-reporting system of the Financial Industry Regulatory Authority.
“This decision is prudent,” Lawler said in the statement. “We continue to invest and redirect as much capital as possible into our world-class assets.”
The company has $2 billion in unrestricted cash and a $4 billion line of credit, Lawler said.
The suspension stops quarterly payouts that Chesapeake began in 2002. It’s the first time the company halted dividends since a previous energy market slump in 1998.
“This does not come as a surprise,” Scott Hanold, an analyst at RBC Capital Markets LLC, wrote in a note to clients Tuesday. “We view this as prudent to improve financial liquidity.”
There is a chart showing that Chesapeake has reported positive cash flow only twice in the past two decades
The oil company stocks are experiencing a bloodbath theses days. RIG at a low, STO at a low.
Royal Dutch is looking at a thirty dollar decline in price of their shares.
Oasis was 17 and change not too long ago is hovering at 11.
Edwin Drake died broke, it’s looking like he is going to have a lot of poor slobs joining him. Har
I tried to visualize the “conflict” between growth in new production and decline in old production in North Dakota. Most of the growth comes from new wells, as most of them peak within 2 months since first flow.
In the below chart you can see these 2 forces:
1) (in green) The sum of monthly growth in oil production from new wells in ND, flowing in their 1st or 2nd month
2) (in red) The sum of monthly decline in oil production from older wells in ND (flowing more than 2 months)
The difference between the green and red lines determines whether production in North Dakota is advancing or declining per month. What I found interesting is that this makes pretty clear that over the last year the decline in old wells has increased, and the growth in new production in the 1st half year of 2015 has declined. What made May remarkable is not the growth in new production (as Helms mentioned) as can be seen from just a small increase in the green line, but that the decline in old production was significantly halted (a major drop of the red line). I suspect that this came because of higher WTI prices during May, and that many wells were no longer choked back.
Very interesting, especially how much old wells fluctuate. Due to re fracs?
I think it is mostly due to people like Mike, who don’t smooth their well production, so we don’t get great looking data charts. 🙂
I would not read too much in the monthly fluctuations, as their are timing, weather and many other factors in play. Unfortunately it appears not trivial to see in the data whether refracs happen.
I guess other explanations could include down hole failure rates and down time for changing lift methods. I think many times the wells go from natural flow, to submersible, jet pump or rod pump, and there is a pick up when the artificial lift is installed.
Maybe not as much artificial lift installed during ND winters?
Enno, and everyone else. To make the smiley face app work you need a space between the last character of the sentence and the first digit of the smiley face. You had a period then no space between the period and the smiley face. As in.:-) But if you insert a space it comes out. As in. 🙂
I edited your post and inserted the appropriate space.
Clear, thanks Ron. 🙂
This is the smiley face in my keyboard 😐
Thanks Enno.
Nice work!
Enno
That may be one of the more informative charts you have posted for several reasons.
The operators have postponed completing numerous wells for economic reasons.
The wells being drilled/completed these past six months are virtually all situated in the most productive areas.
The efficiency of production is at its peak via latest/best completion processes.
When ATW prices fluctuate from $30 to $40 to $50 as they have these past several months, operators can and have been regulating output from these most productive assets on a micro level to maximize revenues.
Your excellent graph above displays this.
Thanks for your comments Coffeeguy.
Very good piece of analysis on US shale from the UKs Guardian:
http://www.theguardian.com/business/2015/jul/21/falling-oil-prices-fracking-us-iran-saudi-arabia-opec
From memory, the Texas monthly numbers came out about the same time as the Bakken number, give or take a day or two. The last couple of months the Texas numbers seem to be a week or so later than the Bakken?
As the Texas numbers build over time, could this be to allow more time for the number to look a little better than if they had been released during the previous week?
The Texas numbers have normally come out a few days later than the Bakken numbers. Last month they came out on the 19th of June. I am expecting them today or tomorrow. But yes, every day they are late gives them another day to add the constantly incoming data to the total.
Hi Ron,
You may want to see if Rockman will post the Texas C+C numbers from Drilling info (I can e-mail him if you want) after the RRC updates the numbers. I have read that the Drilliong info data includes the “pending” data where all reports are not yet complete and so is closer to the full production. It might be interesting to add this to an RRC post.
Yes Dennis, please do what you can.
Sent him a note, will let you know what I get.
Some ASPO-USA guys had a chat with the RRC a couple of years ago, and the gist of it was that if the RRC included their crude data + condensate + pending C+C production–for which they had data, but for which RRC numbers had not yet been assigned–their values were, at that time at least, pretty close to EIA numbers for Texas.
Hi Jeff,
I have read that the pending file is no longer included in the RRC data, but they do provide this to Drilling Info(DI) and it is included in the DI data.
I do not have access to DI.
Up thread Dennis asked:
“Do you think the average newly discovered resource takes longer to develop on average today than it did 20 to 30 years ago?”
On average I would say yes. Most projects, for the majors at least, tend to be “mega projects” now. Deep water GOM, the artic, offshore South America and Africa, offshore Australia, etc. Unconventional production is an obvious contradiction to this, since those wells take far less time to PoP, but overall the focus of the larger players has been on the mega projects. A “mega project” 20-30 years ago was a shallow shelf well or converting a field to CO2 injection. Now those are just drops in the bucket. With the bigger deep water fields, there is years of lead time before a single drop of oil is produced. So yea, I would say it takes longer now to develop projects. There just aren’t many small, easy projects left.
Exploration started in Prudhoe Bay in the 1960s and the field was discovered in 1968. Because of its location, first production did not begin until 1977 after a pipeline (TAP) was built across Alaska to Valdez and extensive oilfield facilities were installed. This was considered slow but it was mainly the pipeline construction that was responsible for delays. So, say ten years. I’d bet the same process would take double that amount of time today – probably a decade plus for the pipeline permitting alone.
Thanks Doug.
Even in fantasy land developing oil reserves takes time. 🙂
Please don’t get me wrong Dennis. It must joyful dwelling in Fantasy Land. I’m jealous. You see, I’m stuck in Massive Infill Drilling Land (no exit visas) where we’re forced to keep an eye on that dreadful Depletion Gauge: Depressing, very depressing.
Hi Doug,
At one point you claimed that maybe the infill drilling may not be as much of a problem as you once believed. Perhaps you believe that oil prices will remain at $50 to $60/b long term. If they do, extraction rates will undoubtedly fall along with oil output. Generally when this happens the oil prices can only remain low if there is an economic depression, or prices are fixed due to government intervention.
A depression could occur at any time, this is impossible to predict accurately, but typically low oil prices do not cause a recession, though they may be the effect of a recession.
If the market is allowed to work, falling oil output will increase oil prices and the higher oil prices will tend to increase the oil supply.
The depletion of oil resources is built into the oil shock model.
My “fantasy land” estimate of World C+C less extra heavy(XH) oil URR of 2800 Gb is between the Hubbert Linearization estimate of 2500 Gb (which has tended to be low in the past) and the USGS estimate of 3100 Gb for C+C-XH, it seems reasonable to me. The 600 Gb estimate for extra heavy oil is close to Jean Laherrere’s estimate of 500 Gb, the USGS estimate is 1000 Gb. World C+C URR is 3400 Gb by my best estimate.
What World C+C URR estimate seems reasonable to you?
Yeah, yeah I know Dennis. I’ve spent 35 years underestimating the effectiveness of EOR and consequently learned to distance myself from predictions. Meanwhile, as we all know, virtually every significant oil reservoir has had more and more and more straws inserted: It can’t go on.
But, just this once I’ll bet you 10 bucks that the “final” decline curve looks steeper than yours, perhaps a lot steeper. But I’m more-or-less on death watch now myself so the odds of you collecting are grim, either way. 🙂
Hang in there Doug, I think the next few years are going to get very interesting.
Hi Doug,
Would you venture a guess on “final” decline rates, if there is not a major war (either WW3 or all middle east countries engaged in all out war for 10 years) or a severe economic depression between now and 2050. Note that I have presented scenarios that show that decline rates will be quite steep (4 or 5% in my scenarios) if either of those things occur, it is hard to predict it could be worse than that.
The 1 to 2% decline rates assume no “above ground problems”.
We have put a lot of straws into US lower 48 onshore and decline from 1970 to 2005 was about 3.6%. This is for the most mature major production area with the most aggressive oil industry, so this would be the upper end of my estimate, but if my URR estimate is correct (which I note you haven’t specifically disagreed with) and extraction rates cannot rise above 8% or so, then decline rates will mostly be 2% or less. For those that think oil prices will tend to be lower, then extraction rates are also likely to remain at present levels or decrease.
A simple model with extraction rates remaining close to present levels (assumes oil prices remain low, less than $75/b) in chart below.
OK Dennis,
Let’s look at one area I know well. Three companies, ExxonMobil, ConocoPhillips, and BP, control Alaska’s North Slope, where 97% of the state’s production is pumped. They have managed this area well. The basic fact is, under their control production has seen a 74% decline in production since 1988. And, over the last four years, the North Slope’s annual oil production declined at an average rate of 5.85% (as calculated in April/2014). At this pace, the state will reach that infamous 350,000 bbl/d breaking point by 2020 — not relevant to this discussion but interesting. (Incidentally, Alaska’s remaining proved reserves fell by 500 million barrels between 2011 and 2012. In my opinion, this is a scenario being copied around the world and the last gasp 5-ish % decline rate is the new normal (to my mind). So, that would be my guess on “final” decline rates. And it is just a guess.
My guess is the state will cut taxes as much as required to keep people working.
I wonder if they ran GTL economics including the ability to keep the oil flowing?
“My guess is the state will cut taxes as much as required to keep people working.” Done. Tax credits in this fiscal year in Alaska will exceed the total production taxes by about $100 million. And, the gap is expected to climb to $400 million in the fiscal year that begins next summer.
Hi Doug,
I think for a lot of the World things will be more similar to the US lower 48 onshore where decline was 3.5%, oil sands will be developed more slowly and tend to reduce overall decline rates. Have decline rates remained relatively constant in Alaska or did the decrease over time?
Yes, over the last decade decline rates have remained relatively constant in Alaska.
Thanks Doug.
Thanks MBP.
MBP is answering this comment (link below).
http://peakoilbarrel.com/oil-shipments-by-rail-declining/comment-page-1/#comment-527841
I will post the chart here so it is easier to see (it was very small in the original comment).
The time to develop reserves was increased from 34 years to 50 years in 1967 in this Modified oil shock model (more details at linked comment). 1/k=34 from 1870 to 1966 and 1/k=50 from 1967 to 2100, where 1/k is the average time in years from discovery to first production for the average oil discovery.
I read a comment at anothe r blog site today posted by a woman who lives on a farm in Divide County. There would be sixty trucks per hour a year ago, today she doesn’t encounter a single truck on her 28 mile drive to work.
In a world of obfuscated data, it’s amazing how useful anecdotal comments like that can be.
A chart from the most recent presentation by Adam Sieminski:
EIA’s new data series on crude-by-rail (CBR) provides direct estimates for crude oil movements
Source: Association of American Railroads (AAR) RailTime Indicators and U.S. Energy Information Administration, based on Surface Transportation Board and other information
HOUSTON — The U.S. Energy Information Administration is trying to make its oil production estimates faster and more accurate. That will mean going around Texas’ top industry regulator and straight to the producers to get the numbers.
Recent price swings in crude oil markets have necessitated the shift, said Gary Long, an EIA petroleum engineer, as production has swung faster during the downturn than it did at any point during the long buildup of the shale oil boom.
“We were basically just using a ruler and adding 50,000 (barrels) a day, and that worked pretty well for a while,” he said. “But after the downtown and the talk of the (production) rollover… we thought ‘Our methodology isn’t going to see that.’”
The Lone Star State produces the most oil in the U.S. The EIA’s most recent April figures put its total bounty at about 3.71 million barrels of crude per day. But that figure uses the methodology that the EIA is moving away from, and it isn’t perfect.
http://fuelfix.com/blog/2015/07/20/how-much-oil-does-texas-really-produce-the-eia-now-says-it-has-a-better-way-to-count/#26983101=0
surprised no one has commented on this
ez
Their change in methodologies makes sense, considering the well-reasoned criticism their numbers have received on this site (and elsewhere). I laughed when they described the ruler plus 50,000 barrels projection method, which is about what Ron (IIRC) correctly surmised they were doing some months ago. Very data intensive work (sarcasm).
I don’t think it was much of a surprise to most here, maybe ironic, and definitely worth a wry smile.
Thanks for posting it.
Jim
http://www.zerohedge.com/news/2015-07-21/us-shale-industry-about-run-out-lifelines
“As we’ve outlined previously, thanks to SEC rules on how drillers are required to value their reserves, producers are effectively forced to overstate the value of their O&G businesses by nearly two-thirds, which can lead unsophisticated investors who don’t bother to read the 10K fine print to believe that the businesses are healthier than they actually are.”
What shallow has pointed out
Factoid of the day I just heard on CNBC. Super high end luxury apartments in NYC are trading at about $7,500 per square foot, with one property owner asking $8,7000 per square foot, for a total of $79 million.
“We don’t even know how far we’ve gone, or if we’ve gone over the edge,” Brown said.
Brown criticized politicians and business leaders who are skeptical of global warming and its effects as “troglodytes” who have a vested interest in “bamboozling” the public about man-made climate change.
“We are talking about extinction.”
http://www.huffingtonpost.com/entry/jerry-brown-takes-on-climate-change-denying-troglodytes_55ae7c42e4b08f57d5d29c55?utm_hp_ref=politics
California leads the country again. If you fail to plan, you plan to fail.
You can lead a republican to the facts, but you can’t make em think
Mr. Moonbeam is directly referring to the raptors that are being picked off by California wind turbines. He holds a fortune in oil money inheritance, so he really should be a Republican. Another ‘do as I say, not as I do’ hypocrite, just happens to be a clueless Democrat, no big surprise there, they all are.
A requiem for Ca!lifornia golden eagles. Another idiocracy lead by kakistocrats.
There is no gravity, politicians suck… All of them.
The only extinctions needed immediately on planet earth would be all Democrats followed by all extra stupid even more clueless Republicans, whatever they are.
He holds a fortune in oil money inheritance, so he really should be a Republican. Another ‘do as I say, not as I do’ hypocrite, just happens to be a clueless Democrat, no big surprise there, they all are.
Just because a person has a lot of money don’t necessarily make them a dumb ass republican. I don’t know how Warren Buffett votes but he is forever agreeing with democrats on just about everything he talks about. And there are a number of other very rich democrats. Just because you have money don’t mean you can no longer think rationally when it comes to the nation’s economy.
I don’t live in California but everything I read or hear about Jerry Brown says that he behaves like a true democrat.
I am sure there may be a few “clueless democrats” around but I don’t know of one. On the other hand I can name dozens of “clueless republicans”.
“clueless”
Kind of a red herring, but that’s ok.
Clueless Republicans begin with Donald Trump rivaled by Walker, they should become apostates and save the soul of murica, not be stupid Republicans.
Al Gore is the prime example of a clueless Democrat, but then so is Bill Clinton and Hillary, then the rest of them, too long a list to name them all, the end of time will arrive much sooner. Not too difficult to conclude by logic and reason.
Jerry Brown has a fiduciary interest in the oil industry by proxy, whether or not his wealth influences his politics doesn’t matter, he is excluded from those criteria. He can be a Democrat and rich both, it means he is even more clueless, that’s all.
Suffice it to say that the damage that is/has been done by those clueless numbskulls has been a great burden to bear.
The sooner they are all gone, the better. Good riddance.
Ronald, you can’t get rid of them by throwing them in the ocean or rivers.
The Democrats would never sink, they are smart enough to use those full of hot air Republicans as personal flotation devices.
And now for equal time
You Might Be A Republican If…..
1.You think “proletariat” is a type of cheese.
2.You’ve named your kids “Deduction one” and “Deduction two”
3.You’ve tried to argue that poverty could be abolished if people were just allowed to keep more of their minimum wage.
4.You’ve ever referred to someone as “my (insert racial or ethnic minority here) friend”
5.You’ve ever tried to prove Jesus was a capitalist and opposed to welfare.
6.You’re a pro-lifer, but support the death penalty.
7.You think Huey Newton is a cookie.
8.The only union you support is the Baseball Players, because heck, they’re richer than you.
9.You think you might remember laughing once as a kid.
10.You once broke loose at a party and removed your neck tie.
11.You call mall rent-a-cops “jack-booted thugs.”
12.You’ve ever uttered the phrase, “Why don’t we just bomb the sons of bitches.”
13.You’ve ever said, “I can’t wait to get into business school.”
14.You’ve ever called a secretary or waitress “Tootsie.”
15.You answer to “The Man.”
16.You don’t think “The Simpsons” is all that funny, but you watch it because that Flanders fellow makes a lot of sense.
17.You fax the FBI a list of “Commies in my Neighborhood.”
18.You don’t let your kids watch Sesame Street because you accuse Bert and Ernie of “sexual deviance.”
19.You scream “Dit-dit-ditto” while making love.
20.You’ve argued that art has a “moral foundation set in Western values.”
21.When people say “Marx,” you think “Groucho.”
22.You’ve ever yelled, “Hey hippie, get a haircut.”
23.You think Birkenstock was that radical rock concert in 1969.
24.You argue that you need 300 handguns, in case a bear ever attacks your home.
25.Vietnam makes a lot of sense to you.
26.You point to Hootie and the Blowfish as evidence of the end of racism in America.
27.You’ve ever said civil liberties, schmivil schmiberties.
28.You’ve ever said “Clean air? Looks clean to me.”
29.You’ve ever called education a luxury.
30.You look down through a glass ceiling and chuckle.
31.You wonder if donations to the Pentagon are tax-deductable.
32.You came of age in the ’60s and don’t remember Bob Dylan.
33.You own a vehicle with an “Ollie North: American Hero” sticker.
34.You’re afraid of the liberal media.”
35.You ever based an argument on the phrase, “Well, tradition dictates….”
36.You’ve ever urged someone to pull themselves up by their bootstraps, when they don’t even have shoes.
37.You confuse Lenin with Lennon
If Hillary is elected president, she would ignore it if ISIS blew up an American Embassy and killed our Ambassador. As she already did. But, what difference does it make?
Clueless, Which of the above Republicans are you ?
Clueless that is absolute bullshit and you know it. Please don’t post such bullshit on this blog.
And please don’t reply to this post.
“politicians suck… All of them.”
Ronald, then you should blame yourself. It’s your government. Quit being a cry baby and say something meaning full. You make politicians look good.
AJ
The whole deal is, I posted a comment on the problem of golden eagles in California that are being slaughtered by wind turbines. It has clearly become a troublesome problem, yet is ignored. Wind turbines do collateral damage to avian species worldwide.
A blind eye is turned and it happens all of the time.
Bashing politicians is a digression, pay no attention to it.
Watch Republican presidential candidate Carly Fiorina (of California, mind you) lay Kate Couric out on a “Dinner’s Done” platter, explaining exactly how global warming is political currency to Democratic politicians like Jerry Brown. To date, I don’t think I’ve seen a single candidate lay the issue out in this concise a manner.
http://www.youtube.com/watch?v=ZZ6t7m5RlnQ
Here we go with the clean coal thing again. Been there. Doesn’t work. Many times more expense than solar and NG. She’s just looking for a VP spot with El Jeb and that horse is dead also.
Oh yes, the clean coal trick again. Straight out of West Virgina. It worked for a while the first time.
Carly is ignorant in a great many ways. First natural gas is now producing more electrical power than coal, over 30%. Her assertion of coal at 50% might have been correct decades ago. China is now investing far more than we are in renewable energy. Her assertion that they just don’t care is bunk. The trick of saying that any giving state will make no difference is just another case of extreme denialist propaganda. We all need to do our part and just because each small part of the whole would make no difference is not a reason to say that nobody should act. Others have noted how bankrupt the “clean coal” idea is.
Notice: I had hoped the Texas RRC data would be out by now but no such luck. It will very likely be out tomorrow, Wednesday July 22. As luck would have it I have some very important business tomorrow that cannot be put off. So if the data comes out, say mid morning, it will still be late afternoon before I can get a post out.
Sorry about that…. Ron
FYI: The First Half of 2015 Was The Hottest Ever
It’s been a hot one
The average temperature around the globe was 1.58°F (88°C) higher than the 20th century average during the first six months of 2015, making it the hottest start to the year in the era of modern record keeping.
The announcement, from the National Oceanic and Atmospheric Administration (NOAA), is the latest news showing record temperatures across the planet in recent years. The 2015 record easily surpassed a record for high temperatures in the first six months of the year set last year. The record highs occurred on both land and in oceans.
Ya know, I think I can detect a trend.
Extrapolating from any part of a sinusoid that doesn’t include several cycles will never give you a correct projection.
That trend that you detect could very well be just part of a more complex pattern. The following figure is from Humlum et al. 2011. Identifying Natural Contributions to Late Holocene Climate Change.
http://klimarealistene.com/web-content/11IdentifyingNaturalContributionsToLateHoloceneClimateChange%20%20HumlumEtAl%20%20GlobalAndPlanetaryChange%201012pdf.pdf
Please note were we are placed in this graph and how a completely different projection is reached compared to yours.
“Ya know, I think I can detect a trend.”
It’s called Ronald and Javier Koch Brother Trolls
And I detect the trend that when climate alarmists run low on arguments they resort to insults. I have already been insulted thrice in this forum for defending my point of view. But insults do not make an argument and only reflect on a lack of argument.
When it looks like a duck, quacks like a duck and walks like a duck. The duck is proud that you recognize him as a duck. I don’t understand why your insulted. Your in the denier camp. It’s your choice. If your view is that humans can burn 95 million barrels a day of oil plus a shit load of coal & NG and not change the environment. I’ve got some ocean front property to sell you that comes with a large boat. Which you will need to reach your newly purchased property soon. It’s not about you. It’s about the well fair of humanity. That’s humanity, not Hannity.
Am I in the denier camp? Curious that without knowing anything about me you have already judged me and decided I am a duck even if I don’t quack. You are full of prejudice, sir. You judge people very lightly, sir. You are likely to be superficial and make a lot of mistakes. You probably don’t like people that hold different opinions to yours. Are you in that camp? That is not a camp where I want to be.
You show some ignorance about current and historical sea level rise rates, yet you show a lot of arrogance that despite your ignorance you know where the well fair of humanity lays. There is nothing more daring than ignorance.
The well fair of humanity doesn’t benefit in cooking mother earth. AJ
“We are talking about extinction.”
I hear a lot of quacking. But you haven’t make me wrong and said your not a denier of modern mans current climate change.
I guess I was right
de·ni·er
dəˈnīər/
noun
noun: denier; plural noun: deniers
1. a person who denies something.
de·ny
dəˈnī/
verb
1. state that one refuses to admit the truth or existence of.
As far as I know I have never refused to admit the truth.
The problem appears to be that there is no truth in science but knowledge. I have been a scientist for over 35 years and not a single time I have been asked to believe in anything. Scientists do not hold faith in anything. They reach conviction based on current evidence. That’s all.
Am I convinced that CO2 is a GHG whose increase in the atmosphere leads to warming according to an exponential function where a doubling of the concentration causes an increase of approximately 1° C on the average global temperature of the Earth? Yes.
Am I convinced that the global average temperature of the Earth has been on the rise in a non-uniform way since about 1850? Yes
Am I convinced that the increase in CO2 in the atmosphere measured since the mid-50s has contributed to that warming? Yes
Am I convinced that the warming caused by the CO2 is going to multiply several times due to improperly specified and measured feedbacks to the point of being dangerous to life on Earth? No
Am I convinced that all the warming that has taken place on Earth since the 50’s has been due to human action? No
Am I convinced that the temperatures on Earth are going to continue increasing for many decades to come? No
So what is it that I deny? I am convince of the hypothesis that have enough evidence supporting them, and I am unconvinced of the hypothesis that do not have enough evidence or where the evidence runs opposite to the hypothesis.
Do you deny that there is insufficient evidence and lack of rigor for many of the claims made by climate alarmists? Because if you do then you are a denier, because you are denying the truth that we don’t know so many things that we cannot possibly make those claims.
So what is it that I deny?
“Am I convinced that the warming caused by the CO2 is going to multiply several times due to improperly specified and measured feedbacks to the point of being dangerous to life on Earth? No”
Explain that to the Polar Bears. Human-caused global warming is causing the Arctic sea, the bears’ habitat and hunting ground, to melt and decline. If the trend of sea ice decline continues as it has done, at the rate of about 13 per cent a decade, then polar bears would suffer a loss of habitat, and consequently food.
“The best estimates we’ve got indicate that we’ll probably lose somewhere around two-thirds of the world’s bears somewhere around mid-century, just based on the simple fact that we’re losing sea ice,” says Andrew Derocher, a professor of biological sciences at the University of Alberta and past chair of the International Union for the Conservation of Nature’s (IUCN) Polar Bear Specialist Group.
http://www.bbc.com/earth/story/20141107-will-polar-bears-become-extinct
You also help others deny it’s time for man to change it’s ways of BAU.
AllenJeffery,
So you are just jumping from the general to the specific and since you cannot demonstrate the existence of those feedbacks you just pick an anecdote, the danger to polar bears, and try to make it a rule.
I object to your methods, but since you want to talk about polar bears, let’s talk about polar bears. There’s probably a lot about polar bears that you don’t know.
1. Polar bears originated about 400,000 years ago
Liu et al. 2014 Population Genomics Reveal Recent Speciation and Rapid Evolutionary Adaptation in Polar Bears
Since that time they have gone through 4 interglacials before Holocene, all of them warmer than present and survived to them.
2. Polar bears are hunted because they are not considered an endangered species. Canada alone issues 600 hunting permits yearly, and for all the countries around the Arctic it is estimated that 1000 polar bears are killed yearly from a total population of 25,000.
It looks like the main threat to polar bears is us, not climate change, yet we are not very concerned about that or we would stop the killing.
3. 13% of decadal ice loss in the Arctic? Where do you get your cherry picked data? NSIDC says that the decline is 3.6% per decade. Almost four times lower than your ¿truth? Arctic Sea Ice News & Analysis
So the situation is about four times less severe than you think.
4. You have to distinguish between scientific predictions and the predictions from a scientist. From 2015 to 2050 is 3.5 decades, or a reduction of 12.6% in Arctic Sea Ice extent. What is the rationale to predict a 50% loss in polar bears over a 12.6% loss in Sea Ice extent, when a similar loss since 1980 has barely made a dent in polar bear’s populations?
Polar bears are an iconic image not of the dangers of global warming but of the dangers of public manipulation. In a 2010 a letter published in the journal Science signed by 255 scientists lamented the assaults on climate science and was illustrated by a disturbing image of a lone polar bear adrift on a small patch of ice in open ocean. Too bad that the image was a fake photoshop composite, but hey, no animals were harmed in the faking of the photo.
This is the NASA RSS plot:
http://www.euanmearns.com/wp-content/uploads/2015/01/clip_image002.png
The NOAA data has been “Karlized” in recent months. This has caused a significant drift between NOAA and the satellite measurements. I understand the NOAA Karl effect is caused by their decision to change the Argo buoy data in a massive fashion. But I can’t find the details, NOAA had the work put behind a paywall.
Javier, you are being keelhauled once again. You can lead a bull to the whatchamacallit, but can’t make him stampede.
From the graph.
“The overall declining linear temperature trend during the last 4000 years is −0.0052 °C per decade, and is assumed to continue when plotting the forecasted
data beyond 1855. ”
That is one huge assumption to make considering the current circumstances and knowledge.
With the earth warming at 0.08C per decade now I see why they stopped the data at 1855. That warming is far greater than -.0052 C per decade (which I take was the slope headed toward the next glaciation).
You think you know but in reality you don’t. 1855 is the last year present in the GISP2 ice core registry according to Richard Alley who provided the ice core analysis.
Actually you don’t know what I think. Just one more false assumption, like the model you presented.
And why is that figure that I posted false? I provided the link. It is in a peer-reviewed scientific publication. That means that at least two referees that know a lot more than you or I about the data and the methods to construct that graph believe it was worth publishing and did not find anything wrong with it.
I don’t think you know enough about paleoclimatology to judge that graph and you simply reject it because you don’t like what it says and what it means.
The graph is meaningless guess work that makes the EIA and weekly estimates look like an accounting genius. Next think you know, there will be a senator from Oklahoma holding up a snow ball and saying “This is proof there is no global warning”.
We are killing ourselves and the planet. Get Real
How do you know it is meaningless guess work?
The assumption is false so the modeling is false. When conditions change, those conditions must be included in the modeling. Conditions have changed.
The graph itself (generated by Richard Alley) is generated from field observations, which I will assume is correct within an error range that is not shown.
What is the assumption that is false?
The analysis does not include any conditions, so it should not include any change of conditions.
The data is from Richard Alley and it is generally accepted and very widely used in climatology. His paper “Ice-core evidence of abrupt climate changes” has been cited 161 times.
The graph is from Humlum et al. You have a link to the pdf above.
But atmospheric conditions have changed since 1855, ones that effect temperature. So to extrapolate forward assuming not change in conditions is a waste of time.
If volcanism increased by a rate of 100 times after 1955, would you also argue that a model that assumes no changes has relevance or is not based on false assumptions?
You still have not read the paper yet you strongly argue against it. That is a very unscientific posture and more proper of a religious acolyte defending a faith against heretics.
I’ll put the link once more:
Identifying natural contributions to late Holocene climate change
I know you have not read the paper because you keep talking about extrapolations and changing conditions.
The model is simply a mathematical composite of three cycles of fixed duration. It is a mathematical curve. It assumes nothing. It takes into consideration nothing. It extrapolates nothing. It incorporates absolutely no climate knowledge.
It doesn’t care about vulcanism. There has been vulcanism during the past 4000 years, yet the deviations of the temperatures from the model have been quite limited.
If the same cycles that have been operating for the last 4000 years continue to operate our future temperatures should not deviate very much from what the model predicts.
Of course you might be tempted to take recurse of exceptionality and say that “this time is different”. But you should know that the golden rule of forecasting is be conservative i.e. assume that the same principles apply. Following this golden rule of forecasting errors are reduced in a 45%, The model from Humlum et al. that produces the presented graph is very conservative, and thus has a better chance of a good forecasting.
Quote from the paper you say I did not read “The overall declining linear temperature trend during the last 4000 years is −0.0052 °C per decade, and is assumed to continue when plotting the forecasted
data beyond 1855. ”
There is the assumption. That is what makes it irrelevant, it does not take reality into account during the time period it extrapolates.
More than likely you did not read it. I am done with your convoluted shenanigans.
Javier – The problem is you thing you get to have an “opinion” on human induced climate change, YOU DON”T!
The science is in, it is a fact, it has been understood for over a 100 years, there is virtual consensus throughout the entire scientific community, billions of dollars in state of the art technology throughout the biosphere and in space confirm it.
A hand full of people like you think that you get to decide whether or not you want to believe in it or not and that is somehow proof that it is not settled, BS!
Whats your point of view on gravity?
Jef:
1. The transient climate sensitivity isn’t settled. The temperature projections are usually based on RCP8.5, a case many of us believe is baloney.
2. Einstein’s theory of general relativity is incomplete, and may be replaced by a better theory. It’s possible dark matter doesn’t exist.
Fernando – You better watch your back. Ron is convinced that I am a dumb ass because, along with other things, at this point I do not believe that dark matter/dark energy exists. [Which is all being “theorized” to explain away some of the problems with the big bang theory.] I guess that if it made up say 5% of the universe, I might feel better about it. But, almost 90% – well, not credible in my view. And, there are alternative theories that do not require the dark stuff in order to work.
Clueless, dark matter and dark energy was not “theorized” to explain away some of the problems with the big bang theory. They were , as you put it, theorized to explain the behavior of the universe as it currently behaves.
Stars, rotating around the center of the Galaxy, are moving much too fast. All stars, except those at the very center of the Galaxy, should be moving much slower, like the planets rotating around our sun. The further out the slower they should be moving, But they do not. The stars in the outer reaches of the Galaxy are moving at the same speed as stars near the center of the Galaxy.
This is exactly how the stars would behave if there were a lot more matter in outer reaches of the Galaxy than what we can see. So that matter simply has to be there even though we cannot see it.
And you are simply wrong… there is no other explanation, the matter simply must exist or the laws of physics are simply not working. End of story.
Dark Matter is a hypothesis to explain an observed gravitational effect without visible (emitting) mass. It is not a theory, in fact it is merely postulated. Back when I was studying to be an astrophysicist we used to call those things fudge factors. Reminds me of the old phlogiston. It’s just a name to cover a completely unexplained phenomenon.
However this turns out, the fact that dark matter and dark energy had to be invented to cover observations is truly exciting. It shows a huge gap in our understanding of the universe and thus a tremendous opportunity to improve our knowledge.
Of course why has dark matter not coalesced like ordinary matter. Scientists say it is everywhere and has a gravitational effect, so that it should be integrated with regular (light? glowy?) matter. Or as large dark matter bodies. Why is it so distributed?
Well, the calculation is based on how much electromagnetic radiation from a galaxy reaches us and how we interpret it as mass and therefor gravity. Maybe we are just not seeing all the normal mass that is there or we are miscalculating the mass of stars from their light output.
Yes clueless, people hang on to dark matter like a kid to a teddy bear. It’s nice to know we got so much dark matter keeping things together. I prefer to modify general relativity.
https://theconversation.com/new-theory-of-general-relativity-casts-doubt-on-dark-matter-16446
It fits better with a vision of quantum gravity which may emerge within the next 20 years.
You have a very naive view on how science works and absolutely no knowledge of the scientific method. Every phrase in your paragraph is wrong.
Your response is the very definition of denier.
I have a full and intimate understanding of of the scientific method and all of what I said is fact.
Jef, Javier really does have a better handle on things. The approach you use will probably raise your blood pressure and make you pop.
You demonstrate your lack of knowledge with every word. Scientific theories are never factual, but congruent with available data.
If you have lived through the 1870’s you would have said that Newtonian mechanics was a fact and understood for over 100 years and that there was virtual consensus throughout the entire scientific community. You would have defended with passion the existence of aether as the only way that light could travel through space. Of course you would have been very surprised in 1887 when the Michelson-Morley experiment failed to produce the expected results, indicating that Newtonian mechanics was not capable of explaining the movement of light and putting an end to the existence of aether. It became thus necessary to develop the special relativity to overcome the limitations of Newtonian mechanics.
You don’t even realize the absolute contradiction between the first part of your phrase and the last. It’s comical.
Javier,
You have a very naive view on how science works and absolutely no knowledge of the scientific method. Every phrase in your paragraph is wrong.
Regarding scientific theories in general:
http://undsci.berkeley.edu/article/0_0_0/howscienceworks_19
Over-arching theories
Some theories, which we’ll call over-arching theories, are particularly important and reflect broad understandings of a particular part of the natural world. Evolutionary theory, atomic theory, gravity, quantum theory, and plate tectonics are examples of this sort of over-arching theory. These theories have been broadly supported by multiple lines of evidence and help frame our understanding of the world around us.
Such over-arching theories encompass many subordinate theories and hypotheses, and consequently, changes to those smaller theories and hypotheses reflect a refinement (not an overthrow) of the over-arching theory. For example, when punctuated equilibrium was proposed as a mode of evolutionary change and evidence was found supporting the idea in some situations, it represented an elaborated reinforcement of evolutionary theory, not a refutation of it. Over-arching theories are so important because they help scientists choose their methods of study and mode of reasoning, connect important phenomena in new ways, and open new areas of study.
Obfuscation.
Hi Javier,
Central Greenland is not representative of the planet for temperature.
You are correct, Dennis. The model reflects central Greenland atmospheric temperatures. That doesn’t make it less right. Any extrapolation should be done with due care, but I point to you that GISP2 temperatures correlate generally well with most salient features of other Northern Hemisphere temperature proxies.
I should remind you that global average temperature is also a very bad metric for climate change, as temperature changes are quite different between Northern and Southern Hemisphere, so the average does not accurately represent any of them. As you can see this is a widespread problem and not particular to this analysis.
Here is the graph from the climate research unit at UK for both hemispheres:
It does look like global warming is not so global after all.
Hi Javier,
The land is warmer than the Ocean and most of the land mass is in the Northern Hemisphere. There can be local effects and Greenland is not representative of the Northern hemisphere.
True, but the opinion of the scientific community is that “ice core records provide the most direct, detailed, and complete measure of past climate change. Further, they document not only a wide range of environmental parameters that are both measures of and responses to climate change (e.g., atmospheric chemistry and circulation, temperature, precipitation) but also many of the causes of climate change (e.g., solar variability, volcanic activity, greenhouse gases). Because of their high resolution (sub-annual), long time span (several glacial cycles) and precise dating (annual), they also provide a framework for interpreting other records of past climate.
Evidence for the presence of millennial scale climate fluctuations has been extended beyond the North Atlantic and polar regions. Marine cores from the Santa Barbara Basin reveal that perturbations in the ocean circulation patterns of the East Pacific region (Kennett and Ingram, 1995; Kotilainen and Shackleton, 1995; Behl and Kennett, 1996;) correlate with ice-rafted debris events in the North Pacific and with the Greenland ice core records. Abrupt changes in atmospheric circulation patterns and precipitation regime are recorded over eastern Asia in a thick sequence of wind-deposited loess from central China (Porter and An, 1995). Records of alpine glacier fluctuations, mountain snowlines and paleo-vegetation in the Andes reveal climate fluctuations that are similar to events in the Greenland ice cores (Lowell et al., 1995).”
from: Ice Core Contributions to Global Change Research
As you can see the information from ice cores both from Greenland and Antarctica goes much further than local conditions and many researches use them as proxies for at least hemispheric climate. In fact our knowledge of Holocene climate comes primarily from ice records.
Javier,
That information is then applied to climate models, which you don’t seem to believe. I see some inconsistency in your thinking here. Temperature in Greenland is of little consequence to Northern hemisphere or global temperatures, the ice core data for well mixed greenhouse gases is useful, if one believes the physics in the climate models, if one thinks greenhouse gases are of minor importance (as you clearly do), the ice core data is also of minor importance.
You cannot have it both ways, you need to be logically consistent.
I vividly disagree with that. Temperature changes in Greenland show all the known principal changes in Northern Hemisphere paleoclimatology, as Greenland cannot isolate itself from climate changes in the Northern Hemisphere.
Greenland records show cooling during the Little Ice Age and warming during the Medieval Warm Period, again cooling during the dark ages and warming during the roman warm period.
Greenland ice cores are one of the most important temperature proxies in paleoclimatology and almost every author recognizes it. Your opinion that because it is a local measure it is of no consequence for global temperatures is not shared within the scientific bibliography.
Apparently when CHK eliminated its dividend, not only did the share price drop below $10, but the bond yields spiked and the credit default swaps did also, trading double what they were 6 months ago.
Market cap has fallen to $6.8 billion.
I am worried the smart money sees oil staying here or lower for awhile.
Even Jim Cramer said he blew it on Whiting. He can’t understand why no one wants to buy them out as they hold the largest position in the Bakken. We know why, and we did when Jim bought his stock.
I wonder if the cash burn is going to be bad again in the second quarter? I think maybe some earnings info getting leaked, and it looks like Q1. Cash burn city. Likely also latching onto banks reluctance to lend further.
Lets say oil trades between $40-50 through year end, gas doesn’t rebound at all, and borrowing bases are slashed. How many are in Chapter 11 come 2016?
How much carnage will OPEC need to see before they cut?
I have not seen any recent operational updates this quarter showing further cut backs in Capex, except BHP where they dropped from 16 rigs to 10, and Statoil where they seem to halved there number of drilling rigs, but I am waiting to see the first update that reads, “cut drilling to zero, maintain oil production targets”. It is technically possible, but it will mean they will be consuming the highly quoted “frac log”, that were saving for higher prices!
If this happens, I feel it will the final nail in the coffin.
Hi Shallow sands,
All drilling may stop eventually in the LTO plays and OPEC won’t need to cut, the cuts will come from US output.
For the Bakken if no new wells are added from August 2015 to Dec 2017, output will fall to 600 kb/d by Dec 2016, if we assume something similar for the other LTO plays then US output falls by about 1.5 Mb/d (probably more because decline will be steeper in the Eagle Ford, though the Permian is unknown). Bakken chart below.
Jaw-Dropping News in the Solar vs. Fossil Fuels Debate
Mike Jacobs, senior energy analyst, Climate & Energy Program, Union of Concered Scientists, July 20, 2015
I worked with very expensive and advanced computer systems involved in the real-time collection of physical data from various probes. The line voltage coming into the facility was very dirty, filled with spikes and drops as well as general voltage swings up to 15 volts. It was necessary to put smoothing and stabilization equipment to provide a good source of power. This was before any PV or wind power was in the system. The power grid is not the serene stable system that is touted by those who say PV and wind will destabilize it. It already wanders and varies.
Sounds like liquid metal batteries can come to the rescue to supply power while the systems get up and running.
So, aws,can you give us a few first hand examples of where this has happened? Do not cite the 2 or 3 famous outages that were not the result of a lack of generating capacity. And, do not cite the local lightning strikes/tornados that hit local stations/generators.
I mean, why did everybody have a “speechless, open-mouth expression” if they had dealt with this problem first hand as supposed experts that attended? Really – “a thousand gas-fired power plants built in the U.S. do not operate properly in white knuckle emergencies.” Maybe it is millions. And, nobody noticed!!! Am I a denier again?
But, thanks for letting all of us know about a problem that we never knew that we had.
If utilities are getting turbines they can’t accelerate from spinning reserve they just need to pay closer attention to their overall kit performance. I think this guy may be worried because turbines may have trouble picking up the slack from wind turbines going limp wristed. Typical bs we get from that outfit.
Somewhat off topic but it did cause me to raise an eyebrow
Excerpt from a comment on Slashdot:
http://ask.slashdot.org/story/15/07/21/1555222/ask-slashdot-do-you-use-a-smartphone-at-work-contrary-to-policy
By: by RobinH (124750) on Tuesday July 21, 2015 @03:27PM (#50154755) Homepage
Not long ago I was doing searches for industrial equipment manufacturer names on Shodan [shodanhq.com] and ended up connected to one of those big wind turbines, somewhere in the middle of the US. No authentication. It was a monitoring dashboard and I didn’t poke around, just closed it, but there were suspicious links/buttons on there to access the industrial controls, such as the PLC.
Ironically today I tried to get my own money from an ATM in Brazil from my Brazilian bank and they had changed security procedures which made it impossible for me to do so. Today I had to go to the bank to have my palm scanned because my ATM now requires that… Frankly up until now I was perfectly happy with just a damn pin number…
Some more 2014 10K reserves that I find interesting.
Whiting Petroleum
PDP reserves 50%
PDNP reserves 3%
PUD reserves 47%
Estimate of future CAPEX required to develop Whiting Petroleum’s proved reserves $7.9246 billion.
Continental Resources
PDP 53.5%
PDNP 1.5%
PUD 45%
I cannot find that Continental discloses the estimate of future CAPEX to develop the reserves.
ConocoPhillips
COP does not appear to separate reserves categories. However, they do provide more expense information as to how those components affect PV10. Below are company wide, including affiliates, in millions of dollars US:
Future cash flows $528,957
Less
Production expenses $200,408
CAPEX $73,115
Taxes $96,010
10% discount $76,207
PV10 $83,217
Future cash flows assumes $94.99 oil and $4.30 gas, subject to local adjustments. Product mix is close to 50/50 oil/gas.
So what happens to COP PV10 with $50 oil and $2.75 gas?
BOE above is estimated at $60.40 for 2014.
Using my hypothetical, BOE for 2015 is $33.25.
So, that reduces future cash flows to $291,189.
Assume 10% reductions of OPEX and CAPEX. Those two combined would be $246,171.
Net cash flows before taxes becomes $45,018.
Taxes become $16,921
Undiscounted cash flows after taxes become $28,097
10% discount $13,425
PV10 $14,672.
COP has long term debt of over $22 billion.
Could COP all categories PV10 fall this much?
Would like comments on my errors.
I may not be far off. I assume if oil is $50 and gas is $2.75 indefinitely it is correct the mighty COP goes bankrupt.
Well, for sure PV10 is an arbitrary discount rate. Look at the average interest rate that COP is paying on its $22 billion debt. If it is 5%, then discount the future cash flows by 5% to get a more reasonable idea.
Even at PV5, COP will eventually go BK, as I am not including things such as abandonment costs, which I am sure are tremendous, pension liabilities and other liabilities.
$50 WTI (went sub $50 today) is not sustainable at all, and only makes sense in the event Great Depression II is around the corner.
CRB index at lowest level since 2002? Canary in coal mine for collapse, or manipulated markets?
In regard to trying to buy producing properties, I would think that the problem with trying to do bottom fishing with shale play wells is the very high decline rate, combined with relatively high operating costs.
I would think that low decline rate conventional production, with lower operating costs, especially with developmental opportunities, makes a lot more sense than buying shale play producing assets.
If I am anywhere in the ballpark on the COP calculation, no way the current futures for oil and gas can be accurate. Unless an economic collapse is coming soon and COP and almost all other US and Canadian based production will not be needed.
“Relax Futilitist, we know no model will be perfect.
Perhaps you should construct your own model?”
~Dave P
Okay. Here is the Futilitist Oil Price Forecast Model.
It is based on the Etp model. I made this graph because I was curious to see what the model would look like when graphed over weekly oil prices. I was amazed.
The oil price trajectory clearly follows a rising exponential curve that smoothly averages the noisy weekly oil price. The exponential rise seems to be limited by the maximum price curve. And those curves don’t have to be derived from the Etp model. I could just as easily have drawn my own version of the Etp model curve with a simple curve fit. And the maximum price curve could be estimated from the where the exponential rising price trend failed.
This forecasting model has a perfect fit over historical oil price data back to 1960, and the current oil price continues to track perfectly. The model is based on physics. It is consistent with peak oil theory and the declining EROEI of oil (which it connects quite sensibly with the price). And currently, the market forces of supply and demand would naturally tend to push the price in the same direction as the model predicts. This is what a robust model looks like.
I submit this in answer to Dennis’ contention that oil prices have nothing to do with the laws of physics.
Hi Futilitist,
Very impressive coincidence. What does it look like with real oil prices from 1975 to 2015? Have you cherry picked a little?
Do you really expect oil prices to be zero in 2020? That seems to be the conclusion one would draw from your chart. Does that seem realistic? What happened in 1975 to 1988? How well does that data match the ETP model?
Real oil prices in chart below. Using BP Oil price data and Bureau of labor Statistics CPI data to convert nominal oil price to real oil price in 2014$.
Ha ha. I like how you take actual historical oil prices and arbitrarily distort them with a measure as fictitious and unreliable as the CPI and then call the result the “real” oil price!
Peak oil deniers have been using that old saw for years. You have not made any real case for the need to use the CPI adjustment to “correct” actual oil prices.
Hi Futilitist,
The CPI is used all the time to compare periods. Income was much lower in 1960 so $1.90/b was a considerably higher proportion of income.
We account for this by adjusting for inflation, income was about 8 times lower in 1960 than in 2014, using nominal prices ignores this effect.
There is a proper way to do these analyses, using nominal prices is incorrect due to inflation.
“There is a proper way to do these analyses, using nominal prices is incorrect due to inflation.”
Kenneth Deffeyes says adjusting for inflation is redundant. So does BW Hill.
We have a genuine disagreement about whether to use the CPI adjustment. I am not trying to hurt your feelings by disagreeing with you. I hope you are not offended by this answer.
Hi Futilitist,
Deffreyes, Hill, and you are wrong on that point.
Do you disagree that there has been price inflation?
I remember when a Coke cost a nickel (only a 10 ounce bottle).
When my Dad got his first job his income was about $5000 per year and oil was $1.71 per barrel in nominal terms. Today a person with similar skills a Bachelors degree in electrical engineering would be paid about $80,000 per year. So relative to income the real price of the oil in todays dollars would be 16 times higher or about $27/b.
This is very basic stuff.
“Deffreyes, Hill, and you are wrong on that point.”
According to you.
“Do you disagree that there has been price inflation?”
Of course not.
I said that correcting for inflation was not the correct approach for this particular analysis, and I think you know that.
Your answer is just a repeat of the same opinion you said before without really addressing my point at all.
“This is very basic stuff.”
Yes, it is.
The problem with Hill’s analysis is that he assumes the value of a good is determined by its energy content. The assumption is incorrect. The price of a good is related to its energy content, but is not the sole determinant of its price.
Oil can be an energy carrier in the same way that electricity is. As long as it can be sold for more than it costs to produce in monetary terms with a reasonable return for the producer, oil will be produced.
It really is that simple.
“The problem with Hill’s analysis is that he assumes the value of a good is determined by its energy content.”
No, he does not. He makes no such economic generalization.
Oil is not just another “good” in the economy. And the Etp model is not an economic analysis. It is a physics model derived from the first and second laws of thermodynamics, and it predicts the price trajectory of oil perfectly. How do you explain that? Coincidence?
“Oil can be an energy carrier in the same way that electricity is.”
Sure, but if oil declines to the point that it is just an energy carrier and no longer our primary energy source, there won’t be much of an economy left. Does your Oil Shock Model foresee oil ever reaching the point where it is just an energy carrier? When?
My model forecasts that oil will reach the zero state as an energy source around 2021. If the model is correct, there is no way in hell that alternatives will make up for the loss of oil in that kind of time frame.
It really is that simple.
“Very impressive coincidence.”
Thanks. If you look closely, even the small price moves echo the trajectories of both curves. You say it is a coincidence. Wow. I say it is a pattern based on the underlying physics, since it is completely consistent with rational expectations drawn from the laws of thermodynamics.
“Do you really expect oil prices to be zero in 2020? That seems to be the conclusion one would draw from your chart. Does that seem realistic?”
I don’t expect oil prices to smoothly reach zero. I expect the economy will fail between now and 2021. That seems very realistic to me.
“Do you really expect oil prices to be zero in 2020?”
Dennis, that was close to the same question I asked of shortonoil from BH Hill’s website on peakoil.com. Their similar graph has the value of a barrel of oil to the world economy in 2020 of $18 dollars a barrel. I never could get a satisfactory answer to my question as to how that was possible.
Hi Stilgar Wilcox.
You are basically making the argument from astonishment. What makes you think it is impossible for the price of oil to decline to $18/barrel? WTI was recently almost $1o8/barrel and now it is around $49/barrel. If I had predicted that price drop, you would have thought it sounded ridiculous. Yet, here we are.
“What makes you think it is impossible for the price of oil to decline to $18/barrel?”
Well, Futilitist, I didn’t say impossible, but it does seem improbable. At 18 bucks a barrel and dropping it’s all over as soon as 2020 because that’s not enough for exploration or producing most non-conventional sources. It presupposes economic contraction on a huge scale, but it doesn’t provide the supporting information to sell it.
Hi Stilgar.
Economic contraction on a huge scale is practically inevitable. If oil were to rise to a level that could support current production plus the cost of exploration for future production, it would be well over $100/barrel. Yet consumers cannot afford that now. The price continues to fall. This leads to a generally slower economy, meaning that consumers will be even less likely to afford $100/barrel oil as time goes on. Eventually the economy will fail.
I think this will all be a lot easier to visualize once the world stock markets begin to fall. I don’t think we have long to wait.
Futitilist, I agree with the basic premise of what you wrote there, but just think the timing is too abrupt. But like you wrote in one reply it won’t take long to find out if it’s accurate or not. So let’s see what happens.
Thanks for keeping an open mind on this, Stilgar. I am glad you can recognize that the basic premise is sound. Maybe I will be wrong and it will happen slower like you say.
Hi Futilitist,
So you are saying that EROEI for oil will be 1:1 around 2020? I don´t believe that. Also why would a barrel of oil cost less just because an oil company has higher costs? I makes not sence. The consumer still get the same amount of energy in that barrel. Lastly you are forgetting that the energy sources are not priced equal. People are willing to pay more for oil for it´s properties.
“So you are saying that EROEI for oil will be 1:1 around 2020?”
More like around 2021.
Hi Futilitist,
So the price of oil should be about zero at that point and no more oil will be produced? Do I have that right?
BW Hill says the oil price will approach zero (not actually reach it) by 2021 and very limited oil production might continue for a while. That sounds a little too optimistic to me. I think the economy will shatter sometime between now and 2021. I don’t think any significant oil production will exist on earth after 2021.
Did you forget your smiley face?
“Did you forget your smiley face?”
No.
My prediction may seem hard for you to personally believe, but that does not make it wrong.
(Is it okay for me to say that?)
Hi Dennis.
I don’t want to add to your astonishment, but I should point out that the model predicts only the maximum oil price. It is a best case scenario. It is entirely possible that the oil price decline could be even steeper.
Provide documentation and rationale for that claim. (EROEI for oil around 1:1 around 2021)!
“Provide documentation and rationale for that claim. (EROEI for oil around 1:1 around 2021)!”
I already did.
Fututilist I did not mean your fantasy, but from some reliable and reputable sources.
Are you trolling?
“Are you trolling?”
Absolutely not. Are you?
Hi FreddyW,
Your point about the consumer is a good one, when someone buys a gallon of gasoline, diesel fuel, jet fuel, or kerosene, they don’t know what the net energy of that fuel is and they don’t care. Likewise most people in the petroleum industry could not tell you what amount of net energy is contained in the oil and natural gas that they produce. The concern of the oil company is profits, the consumer is interested in the energy in the fuel they purchase and want to get it for the lowest price possible.
A consumer is not “investing” in a gallon of fuel, they are simply consuming it so they can get their car or truck down the road.
The energy density of liquid petroleum makes it very desirable for transportation, people will pay more per unit of energy for liquid fuel because of its convenience.
Physics is certainly important, but I do not believe net energy plays a primary role in determining the price of oil or in determining the supply and demand for oil.
Futilitist,
A model describes relations/interdependences between two or several variables.
Would you elaborate on how the Futilitist model describes the relations between the oil price and thermodynamics.
After all I take it you have applied a scientific method/approach and not merely done some simple curve fitting and the method should thus be made available for any scientists to do an assessment of your groundbreaking works.
Hi Rune.
“Would you elaborate on how the Futilitist model describes the relations between the oil price and thermodynamics.”
Sure. The price of oil is proportional to it’s energy content. The rapidly declining EROEI of oil has caused the price to rise. But that price cannot rise infinitely because at a certain point the price exceeds any possible economic benefit that could be gained by the purchaser of the oil.
“After all I take it you have applied a scientific method/approach and not merely done some simple curve fitting and the method should thus be made available for any scientists to do an assessment of your groundbreaking works.”
This is not ground breaking science. It is common sense.
I did not originate the Etp model. I independently noticed the same price pattern that the Etp model describes. My original Futilitist Collapse Challenge was generated before I ever heard of the Etp model. I used a simple curve fit and got basically the same result as the Etp model! The economist Steve Ludlum also independently came to the same conclusion. You and Dennis want to claim all of this is a mere coincidence.
We are on track to confirm the Etp forecast for the 2015 yearly average (under about $75/barrel). Current market forces are driving the price down just as expected.
By the way, the WTI spot price just hit $49.04. My model is performing perfectly.
One of the greatest advantages of my model over, say, the Oil Shock Model is that we don’t have to wait 50 years to see if it is right.
Hi Futilitist,
What has changed to make the “economic benefit” of a barrel of oil so much lower in June 2015 compared to June 2014? The ETP model tracks nominal prices, but does not track real prices well at all. Real prices are a better metric for the importance of oil in society. One way to look at the economic benefit of a barrel of oil is to consider the World GDP produced per barrel of oil consumed, this level has been increasing so the economic benefit of oil has been increasing rather than decreasing.
Data for chart below from link below for GDP data and EIA C+C production data.
http://www.ers.usda.gov/datafiles/International_Macroeconomic_Data/Historical_Data_Files/HistoricalRealGDPValues.xls
“What has changed to make the “economic benefit” of a barrel of oil so much lower in June 2015 compared to June 2014?”
What a silly question. Of course the economic benefit of oil did not decrease drastically between 2014 and 2015. EROEI has been declining at a steadily accelerating pace. Look at the graph. The oil price temporarily exceeded the Etp maximum price curve. By the time the price began to fall, that theoretical maximum had already declined to around $89/barrel.
What happened was simply the price discovery you are so fond of. Market forces are trying to find the “right” price. But that “right” price has to be based on physics.
Maybe you got it right for 2015 by chance. What does your model predict for 2016 and subsequent years? Will the price ever exceed $100/barrel again?
Suyog
Hi Suyog.
The basic prediction is that oil prices should generally not exceed the Etp maximum price curve on the graph. If some kind of drastic supply shortage suddenly causes the price to rise above the theoretical maximum, it will only be very temporary. There will be severe economic damage. The price will then likely overcorrect proportionally to the downside until it settles back into it’s former trajectory toward zero.
I cannot predict how high any future spike might be. But the higher it goes, the less time it will be able to stay there, and the further it will drop when it inevitably corrects.
Futilitist,
”Sure. The price of oil is proportional to it’s energy content.”
Last time I checked the volumetric energy content of a barrel of (crude] oil has not changed as much as its nominal (or inflation adjusted) price.
Your argument thus suggests that the oil price increase in late 70’s/early 80’s was due to increasing volumetric energy content.
”The rapidly declining EROEI of oil has caused the price to rise.”
That is a claim. You need to provide evidence which quantifies “rapidly declining” from so-called reliable sources.
Your claim runs contrary to the recent collapse in the oil price.
”But that price cannot rise infinitely because at a certain point the price exceeds any possible economic benefit that could be gained by the purchaser of the oil.”
Yes, but there is something called rationing by price. As prices goes up a growing number of consumers will afford less use of oil.
Your “model” shows the exact opposite, in other words it is not related to the real world which also should include the financial system (as a minimum).
Oil at even $1,000 – $2,000/b will provide more benefits to society than its price suggests.
If you do not believe that, try a life for you and your family for one year without any whatsoever use of inputs from oil. Then report back how that turned out.
”This is not ground breaking science. It is common sense.”
No, it is nonsense (look further up).
”I did not originate the Etp model. I independently noticed the same price pattern that the Etp model describes.
I used a simple curve fit and got basically the same result as the Etp model!”
So a curve fitting is all it takes to describe the dynamic behavior for a complex non linear system with a multitude of feedback loops.
”The economist Steve Ludlum also independently came to the same conclusion.”.
Two wrongs do not make one right! So when did economists become experts in thermodynamics?
Can you list/link all peer reviewed papers Steve Ludlum has produced on this subject and his CV?
”You and Dennis want to claim all of this is a mere coincidence.”
Dennis may speak for himself.
Correct, it is not only coincidence, I shall be blunt: IT IS BULLSHIT!
Futilitist, do you expect that people will take some curve fitting that is in no way related to the real world at face value?
”We are on track to confirm the Etp forecast for the 2015 yearly average (under about $75/barrel. Current market forces are driving the price down just as expected.”
Further up Futilitist claimed;
”The price of oil is proportional to it’s energy content.”
Will you maintain your claim that the price decline is due to a steep decline in the volumetric energy content for crude oil? So a halving in price reflects a halving of the volumetric energy content for crude oil.
Which of course is BS in the real world.
”By the way, the WTI spot price just hit $49.04. My model is performing perfectly.”
Fine, now provide the WTI price for the following dates:
August 27 th 2015
April 16 th 2016
September 3 rd 2016
January 31st 2017
June 2nd 2018
…for starters.
”One of the greatest advantages of my model over, say, the Oil Shock Model is that we don’t have to wait 50 years to see if it is right.”
Futilitist, so far you have failed to provide documentation for any model, all you have produced is some “simple” curve fitting with no predictive power (because the feedback loops to the real complex world subject to multiple non linearities are missing), nothing scientifically about that.
Rune,
“Last time I checked the volumetric energy content of a barrel of (crude] oil has not changed as much as its nominal (or inflation adjusted) price.”
I obviously meant it’s net energy content.
“Your argument thus suggests that the oil price increase in late 70’s/early 80’s was due to increasing volumetric energy content.”
No, it does not. The oil price increase in late 70’s/early 80’s was the direct result of the price perturbation caused by supply shortfalls due to two oil embargoes.
“Your claim runs contrary to the recent collapse in the oil price.”
No, my claim does not run contrary to my own prediction. And the evidence is the price itself. The cost of production keeps rising due to entropy. By definition, EROEI falls as the price rises.
“Yes, but there is something called rationing by price. As prices goes up a growing number of consumers will afford less use of oil.”
When the price goes up and consumers use less oil, the economy will shrink.
“Oil at even $1,000 – $2,000/b will provide more benefits to society than its price suggests.”
If $100/barrel is too high, how will anyone afford oil at $2000/barrel? That is just silly.
“So a curve fitting is all it takes to describe the dynamic behavior for a complex non linear system with a multitude of feedback loops.”
In this case, yes, at least for the upward part of the price trajectory.
After 2013, the oil price is limited by the maximum price curve. You will have to ask BW Hill exactly how he derived that one. I just noticed that it seems to be very accurate so far. Perhaps it is just another coincidence. We’ll see.
“Two wrongs do not make one right! So when did economists become experts in thermodynamics?”
Are you an expert in thermodynamics?
BW Hill is an engineer who is an expert in thermodynamics. Steve Ludlum is an economist. I am an expert in neither thermodynamics nor economics, though I have a good general understanding of both. All three of us came to the same conclusion independently. I think that sounds like consilience.
“Can you list/link all peer reviewed papers Steve Ludlum has produced on this subject and his CV?”
You can look that up yourself, if you really want to know.
“Futilitist, do you expect that people will take some curve fitting that is in no way related to the real world at face value?”
I sure hope not. They should look at the model, try to understand it, and then make up their own minds. My model is pretty easy to understand. You are making the argument from authority, combined with the notion that complex phenomenon can’t be explained with simple models. And I suppose we should just take your word, since you claim to be some sort of expert.
“Will you maintain your claim that the price decline is due to a steep decline in the volumetric energy content for crude oil?”
No, because that was not my claim. It is just your silly attempt to put words in my mouth. As I said before, I meant net energy content, not volumetric energy content.
“Fine, now provide the WTI price for the following dates:
August 27 th 2015
April 16 th 2016
September 3 rd 2016
January 31st 2017
June 2nd 2018
…for starters.”
I can’t tell you the exact price on any particular date. No one can. I am predicting the price trajectory. The price of oil will generally not exceed the Etp maximum price curve. If you want to get an idea of what the maximum price might be for a particular date, just look at the graph.
What are your predictions for the dates you listed?
I am sorry my model lacks the kind of complexity you seem to need, being the big shot expert that you claim to be. I’ll let the readers decide if your arguments are more convincing than my model.
In the meantime, the Futilitist Oil Price Forecasting Model is still making very accurate price trajectory predictions.
Futilitist,
”I obviously meant it’s net energy content.”
Wrong again, net energy content of a barrel of crude oil has basically remained stable, what you possibly mean is net energy available for society. Thing is this may grow by increasing gross energy and/or substitutions.
”No, it does not. The oil price increase in late 70’s/early 80’s was the direct result of the price perturbation caused by supply shortfalls due to two oil embargoes.”
So political and economic forces may also influence the oil price.
”If $100/barrel is too high, how will anyone afford oil at $2000/barrel? That is just silly.”
No it is not silly. Oil IMVHO has been priced too low relative to its utility.
“So a curve fitting is all it takes to describe the dynamic behavior for a complex non linear system with a multitude of feedback loops.”
”In this case, yes, at least for the upward part of the price trajectory.”
And the downward part?
”After 2013, the oil price is limited by the maximum price curve. You will have to ask BW Hill exactly how he derived that one. I just noticed that it seems to be very accurate so far. Perhaps it is just another coincidence. We’ll see.
OK, you still do not understand the etp model, your claims are thus faith based.
We went through this last time, nothing new here.
Are you an expert in thermodynamics?
”BW Hill is an engineer who is an expert in thermodynamics. Steve Ludlum is an economist. I am an expert in neither thermodynamics nor economics, though I have a good general understanding of both. All three of us came to the same conclusion independently. I think that sounds like consilience.”
For what it is worth I hold a MSc, majoring in combustion engineering, which is all about thermodynamics. Add to that several decades for several major oil companies. Last time I checked there had been no revisions to the Laws of Thermodynamics.
Futilitist, what is your formal background?
Yes, I (and likely many others as well) would very much like to take the etp model (which you apparent does not understand) apart, matter of fact started the work last time we had this discussion about the etp model and it would not take long.
“Can you list/link all peer reviewed papers Steve Ludlum has produced on this subject and his CV?”
“You can look that up yourself, if you really want to know.”
You are certainly in no hurry to support your own case, do you mean Steve Ludlum of Economic Undertow? I understand he is a photographer.
Yes or no? (See I make it easy for you, just to help you.)
“Futilitist, do you expect that people will take some curve fitting that is in no way related to the real world at face value?”
”I sure hope not. They should look at the model, try to understand it, and then make up their own minds. My model is pretty easy to understand. You are making the argument from authority, combined with the notion that complex phenomenon can’t be explained with simple models. And I suppose we should just take your word, since you claim to be some sort of expert.”
Just describe your model (with its equations)?
You have been encouraged to do so several times, failure to do so suggests there is no “model”, just something in Futilitists imagination.
What you are suggesting is that the global economy may be described by a simplistic model (with no equations).
I am sure a lot of people reading this would like to learn more about this “model”.
”I can’t tell you the exact price on any particular date. No one can. I am predicting the price trajectory. The price of oil will generally not exceed the Etp maximum price curve. If you want to get an idea of what the maximum price might be for a particular date, just look at the graph.”
Key word is cost for the incremental barrel which has been in an upward trajectory. At some point in time the remaining consumers who can afford oil for what it costs will be willing to pay it due to the benefits oil provides.
I do not project (in the public domain) any figures for future oil price, simply because long time ago I acknowledged all the complex (financial) feedback loops that shape the oil price. It is IMO far more than simplistic supply/demand equations which still are much more to go by than the Futilitist “model”.
”In the meantime, the Futilitist Oil Price Forecasting Model is still making very accurate price trajectory predictions.”
You mean the chart you included up top (what you refer to as a “model”…with no equations).
Time will show, but I for one would just ignore it and describe it as nonsense and noise. And we need less noise.
“…what you possibly mean is net energy available for society.”
Yes, that was clear 3 posts ago.
“Thing is this may grow by increasing gross energy and/or substitutions.”
Really? How will gross energy grow while net energy is shrinking? That makes no sense. Are you suggesting that alternatives will save the day?
“So political and economic forces may also influence the oil price.”
Yes. I never suggested that political and economic forces couldn’t influence the oil price. It happens every day. But if the price gets too far outside of it’s physics envelope, it will eventually revert back to the mean. That is what is happening now.
“Oil IMVHO has been priced too low relative to its utility.”
You claimed that the price of oil could reach $2000/barrel. I said that sounded silly. You now say $2000/barrel would be affordable because the current price doesn’t fully reflect oil’s utility. That also sounds silly, and I don’t see how that fact will help people afford $2000/barrel oil.
“OK, you still do not understand the etp model…”
Yes, I do understand the Etp model. You don’t seem to, though.
“For what it is worth I hold a MSc, majoring in combustion engineering, which is all about thermodynamics.”
Awesome.
“Futilitist, what is your formal background?”
I have a BS in Biomedical Visualization from the University of Illinois.
“Yes, I (and likely many others as well) would very much like to take the etp model (which you apparent does not understand) apart, matter of fact started the work last time we had this discussion about the etp model and it would not take long.”
If it is so easy to take apart the Etp model, why didn’t you finish taking it apart last time?
“Steve Ludlum of Economic Undertow? I understand he is a photographer.”
Interesting. I have never even seen his website. The reason I thought he was an economist is because someone told me he was. I don’t see what difference it makes, though.
You seem very fixated on everyone’s formal background.
“Just describe your model (with its equations)?”
I am not going to try to do a formal defense of the Etp model again. We have been through all of this before. People are welcome to read that discussion. This time, I am trying to emphasize a more common sense, conceptual approach.
“What you are suggesting is that the global economy may be described by a simplistic model (with no equations).”
My model does not directly describe the global economy, just the oil price.
“I am sure a lot of people reading this would like to learn more about this “model”.”
BW Hill has a thread on the Etp model on peakoil.com.
“At some point in time the remaining consumers who can afford oil for what it costs will be willing to pay it due to the benefits oil provides.”
So, rich people will still be able to afford oil. Will they be able to support the entire oil industry?
“Time will show, but I for one would just ignore it and describe it as nonsense and noise.”
So far you have done a fine job of describing it as nonsense and noise. I’m now looking forward to the part where you ignore it.
“And we need less noise.”
Finally, something we agree on.
PS—If you do decide to continue the present discussion with me, I would appreciate it if you could stick to one or two points per post. It is too big of a hassle to answer your mile long posts, especially when they are so full of intentional misunderstandings and semantic tricks.
Futilitist (Loren Soman)
I wrote
“Oil at even $1,000 – $2,000/b will provide more benefits to society than its price suggests.”
That was not a prediction, it is a viewpoint. So do not try to twist things.
One barrel of oil contains about 5.8 Giga Joules of energy which gives about 1,600 – 1,700 kWh or about 11 years (22,000 – 23,000 hours) of manual labor. That is about $0.03 for one kWh (with oil at $50/b) or about $0.01 for what amounts to about one hour of manual work.
Is anyone prepared to do manual work for the same hourly pay as oil?
At $2,000/bbl that grows $1.25/kWh or about $0.10 per hour of manual labor.
”Really? How will gross energy grow while net energy is shrinking? That makes no sense. Are you suggesting that alternatives will save the day?”
You may have growth in gross energy and net energy may decline.
Do not try to put opinions in my mouth, I have not mentioned anything about renewables, this thread is not about that.
Stay on the subject and thus help yourself.
You are not going to get away without presenting documentation for your “model”.
”Yes, I do understand the Etp model. You don’t seem to, though.”
That is why I encouraged you, dear Loren, to explain it, on several counts. I never asked you to defend it, but how can one explain something one does not understand.
Enlighten us!
”My model does not directly describe the global economy, just the oil price.”
The oil price affects the global economy. So how is it possible to separate those?
I will continue the discussion with whatever number of points required until you come up with good answers.
Loren, remember it was you that got it started, I just want to be enlightened in a scientific way.
““Oil at even $1,000 – $2,000/b will provide more benefits to society than its price suggests.”
That was not a prediction, it is a viewpoint. So do not try to twist things.”
I asked you: “If $100/barrel is too high, how will anyone afford oil at $2000/barrel?”
You answered: “Oil IMVHO has been priced too low relative to its utility.”
How am I twisting things?
“Do not try to put opinions in my mouth, I have not mentioned anything about renewables, this thread is not about that. Stay on the subject and thus help yourself.”
You said: ““Thing is this (net energy) may grow by increasing gross energy and/or substitutions.”
I am not trying to put words in your mouth. You are the one creating confusion here. Substitutions sounds like you might be referring to alternatives. Sorry. What exactly does it refer to, and how can we increase gross energy while net energy is declining?
“You are not going to get away without presenting documentation for your “model”.”
I did present documentation for my model.
“That is why I encouraged you, dear Loren, to explain it (the Etp model), on several counts.”
And I did, dear Rune. I don’t feel like rehashing that discussion with you. The readers are welcome to review the whole thing if they want to.
“Enlighten us!”
I’m trying.
“The oil price affects the global economy. So how is it possible to separate those?”
It may seem counterintuitive to you, yet the model accurately tracks the oil price trajectory. How do you explain that?
“I will continue the discussion with whatever number of points required until you come up with good answers.”
And I will continue to try to answer all of your questions no matter how disingenuous they are.
“Loren, remember it was you that got it started, I just want to be enlightened in a scientific way.”
No, it was Futilitist who got this started. If you really just wanted to be enlightened in a scientific way, you would kindly refer to me as Futilitist. You are intentionally trying to piss me off.
”I am not trying to put words in your mouth. You are the one creating confusion here. Substitutions sounds like you might be referring to alternatives. Sorry. What exactly does it refer to, and how can we increase gross energy while net energy is declining?”
Substitutions could also be natural gas, coal and nuclear.
I was not specific for a reason. And now Btus from coal and natural gas are cheaper than from oil.
”It may seem counterintuitive to you, yet the model accurately tracks the oil price trajectory. How do you explain that?”
Getting the direction right does not guarantee that what caused it is right.
”No, it was Futilitist who got this started. If you really just wanted to be enlightened in a scientific way, you would kindly refer to me as Futilitist. You are intentionally trying to piss me off.”
To me Futilitist = Loren Soman.
Hi Rune,
Probably not worth your time, but BW Hill has a thread at peakoil.com where he answers questions.
http://peakoil.com/forums/the-etp-model-q-a-t70563-20.html
see page 2
There is also
http://www.thehillsgroup.org/depletion2_020.htm
and
The Maximum Consumer Price curve was also developed from the ETP model. It represents the maximum price that the end consumer can pay for petroleum. It is based on the observation that the price of a unit of petroleum can not exceed the value of the economic activity that the energy it supplies to the end consumer can generate. Bold is mine from link below.
http://www.thehillsgroup.org/depletion2_022.htm
The part in bold seems very suspect to me.
Your background would probably allow you to debunk BW Hill’s analysis easily.
In my mind the idea that the price of oil will be proportional to the usable energy in a gallon of oil after we deduct all the energy used to extract, refine, and distribute that gallon of fuel seems absurd.
As you may have pointed out before, the consumer is only interested in the energy content of that gallon of fuel and its price.
Dennis, thanks!
Some time back I looked at the socalled etp model.
I saw no reason to spend much time with it due to lack of feedback loops to the economy.
But it is easy to pull apart, given a little time.
Good luck with that, Rune. I look forward to reading your thoughtful analysis.
The 2014 Keeling Lecture features UCSD School of International Relations and Pacific Studies Professor David Victor, an internationally recognized leader in research on energy and climate change policy. He is the Director of the school’s new Laboratory on International Law and Regulation, and author of numerous books including his most recent, “Global Warming Gridlock: Creating More Effective Strategies for Protecting the Planet.” Series: “Jeffrey B. Graham Perspectives on Ocean Science Lecture Series” [7/2014] [Science] [Show ID: 27846]
[youtube http://www.youtube.com/watch?v=ERqGMQsihm4?list=PLHstxRrh0Makp0Ha12U6aRZ9cfh8h7GAN&w=560&h=315%5D
Anecdotal. Could someone tell me if Cherry Creek Field is considered to be in the Bakken core?
If so, explain how there is low risk drilling in the core with a well like 27886. As a whole, assuming wells cost $10 million each there, check out the economics on the 23 wells there, not pretty. Some massive produced water on some wells.
Shallow,
Here is a bit of info I found on the Cherry Field. Very small, 12 sq miles an run by Hess.
http://themilliondollarway.blogspot.com.au/2014/11/cherry-creek.html
Cherry Creek oil field is a small field, only 12 sections, 3 x 4, in northeast McKenzie County which has seen moderate activity during the boom. It sits in/near one of the sweet spots in the Bakken. The field is “owned” by Hess. It looks like all units are held by production.
Thanks Toolpush. Says the wells which are not making much are “way choked back” The one I pointed out has made about 4,500 bbl of oil since placed in production in January. Another placed on last year has made 35,000 since last fall.
Mentions this is in a “core area” Found these when looking at a RI that is for sale.
RI is a 3/16 RI, so if no ORI, NRI for WI owners would be .8125
I did some quick math on the wells in this field at $45 and $2.50 and it looks pretty rough for the WI owners.
I suspicion if we had the time, we would find a lot of this going on.
I am thinking oil could drop to $40 WTI or below for awhile, primarily to BK as many US producers as possible.
There will likely be a tremendous run back up over $100 once there is a supply squeeze. Or the Great Depression II will drop demand like a rock.
$50 or less, even $75 or less WTI is simply not sustainable. Most US based public companies simply cannot weather it based upon my view of the numbers.
Shallow,
It appears the shales companies have been hiding behind their hedge books and the average price of oil from last year. As both of these protective measures unwind, unless there is a massive recover in oil price, then a heap will be going out the back door for sure.
Everybody else in the oilfield that can, have shut down drilling, except the middle east. The reason the shales have not shut down, is because they can’t afford to. It is double down and gamble, or stop drilling and bleed slowly.
With the big banks putting money aside in preparation for bankruptcies, then other have started to smell blood.
Why don’t you ask them to give you the well test data with the flowing tubing pressure? That should give you an idea if they are choked back. Are you buying those wells?
Well search at NDIC. Cherry Creek Field, click submit. Hessbakken investments has 33 wells there, if the count is correct.
Weekly oil inventory report is out.
Crude Inventory is up, and oil goes below $50.
Does the fact that nearly half a million extra barrels per day were imported make a difference?
On the other hand the American car driver is making the most of the cheaper fuel.
Happy motoring!
http://ir.eia.gov/wpsr/wpsrsummary.pdf
Summary of Weekly Petroleum Data for the Week Ending July 17, 2015
U.S. crude oil refinery inputs averaged about 16.9 million barrels per day during the
week ending July 17, 2015, 45,000 barrels per day more than the previous week’s
average. Refineries operated at 95.5% of their operable capacity last week. Gasoline
production increased last week, averaging over 10.1 million barrels per day. Distillate
fuel production decreased last week, averaging about 5.1 million barrels per day
U.S. crude oil imports averaged over 7.9 million barrels per day last week, up by 587,000
barrels per day from the previous week.
snip
Total products supplied over the last four-week period averaged about 20.0 million
barrels per day, up by 3.4% from the same period last year. Over the last four weeks,
motor gasoline product supplied averaged over 9.6 million barrels per day, up by 6.9%
from the same period last year. Distillate fuel product supplied averaged 3.8 million
barrels per day over the last four weeks, down by 1.5% from the same period last year.
Jet fuel product supplied is down 2.6% compared to the same four-week period last year.
What kind of play is Permian? Somebody is drilling 242 holes, the biggest number among all basins in US. It was over 550 rigs just 12 months ago!
Any data on who are the oil producers, smaller or bigger companies? anything oil economic specific about that basin in comparison to other basins?
Here is some information from DrillingInfo:
http://info.drillinginfo.com/midland-basin-vs-delaware-basin/
http://info.drillinginfo.com/permian-basin-geology-midland-vs-delaware-basins/
http://info.drillinginfo.com/permian-basin-production/
http://info.drillinginfo.com/general-overview-of-permian-strata-of-the-delaware-basin-and-nw-shelf/
Thanks Alex.
Kemp: North Dakota Oil Well Completions Slow Sharply
That no new well completions have been reported since July 10 has been brought up before in other comments to this post. I have the link in the new post that will be out in about an hour or so. I hope to see some more discussion there.
Ron, I assume you saw TX May numbers have been released.