Second Update: I am still waiting for the Texas Railroad Commission monthly update. I had hoped it would be out today. However I will have a new post out tomorrow evening, March 21, whether they update tomorrow, or not. I have some good graphs from Jean Laherrere and one from Roger Blanchard that I will post.
Okay Another Update: Dennis Coyne has just posted me the numbers and link for Texas Condensate production. Now we can finally figure out what is going on in Texas.
More tomorrow
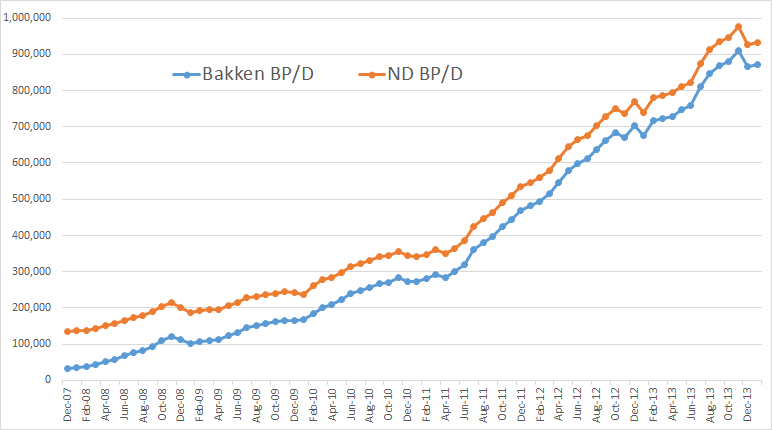
The North Dakota January production data is out for The Bakken and All North Dakota. Bakken production was up by 6,031 bp/d to 871,672 bp/d. But that was after December production was revised up by 2,744 bp/d. All North Dakota production was up by 6,446 to 933,133 bp/d. But that was after December production was revised up by 3,460 bp/d.
From the Director’s Cut
The drilling rig count was down from Dec to Jan and the number of well completions
dropped from 119 to 60. Days from spud to initial production decreased 10 days to 122.
Investor confidence appears to be growing. There are over 100 wells shut in for the Tioga gas plant conversion in an attempt to minimize flaring, but the biggest production impact story continues to be the weather. January temperatures were only 6 degrees below normal with only 3 days too cold for fracturing work, and there were no major snow events, but 12 days had sustained wind speeds too high for well completion work.
At the end of Jan there were about 660 wells waiting on completion services, an increase of 25.
North Dakota wells increased by 59 to 9,734 while Bakken wells increased by 92 to 6,926.
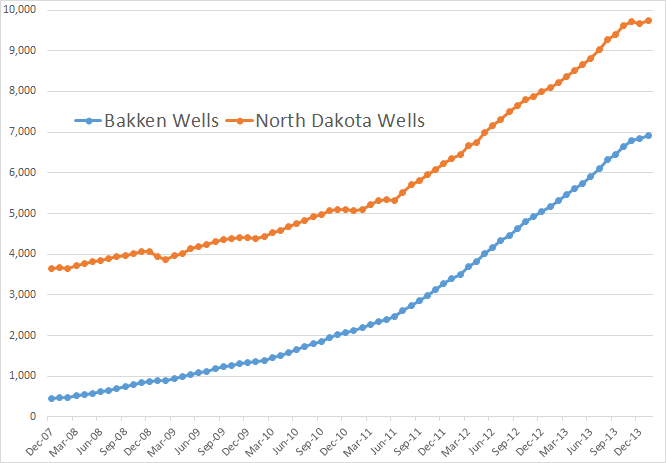
Perhaps it is just bad weather but there is definitely a slowdown in number of wells.
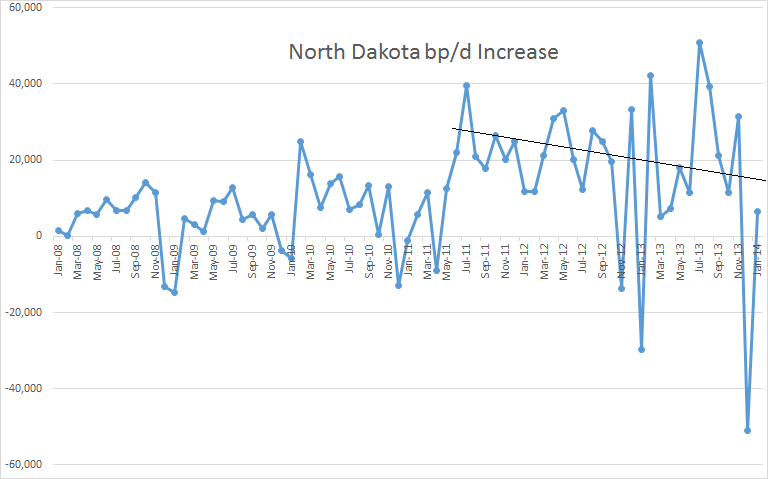
Is there a trend here?
If not there is definitely a trend here.
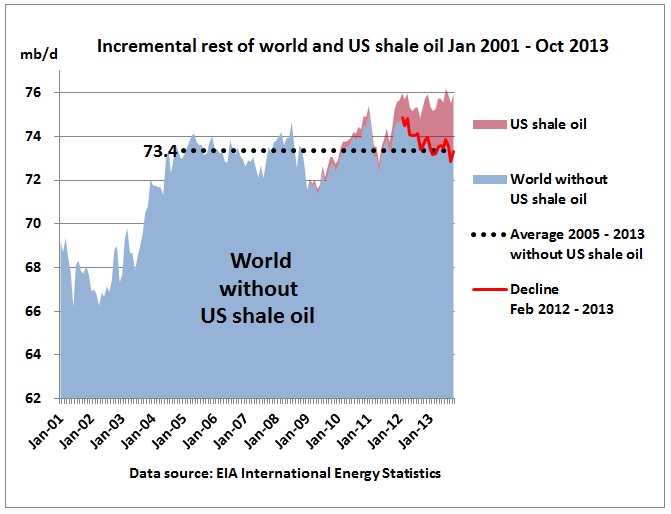
The Crude Oil Peak blog put up a great post yesterday with this graph.
Talk about hyperbole: A billion-dollar daily shot in the arm for the American economy
Given that this technology is just beginning to unlock the state’s vast resources – perhaps 12-20 billion barrels (or 60 years’ worth) of recoverable oil in western North Dakota – Jenkinson dismisses the idea of a regional “oil boom.” That term is inadequate. “It’s an industrial revolution.”
Note: I send out an email notification to about 110 people when I have published a new post. If you would like to be added to that list, or your name removed from it, please notify me at: DarwinianOne at Gmail.com
261 responses to “Bakken Update with January Production Numbers”
Ron, great analysis. Thanks for the headpost, to support discussion.
1. I am leaning (Bayesian gut) to thinking the slowdown is weather. (a) Huge amount of uncompleted wells. (b) It really was bad weather. (c) Rig count is actually up from 2013 (but not down from 2012). And this has been a steady trend. ~200 rigs in 2012, 180 in 2013, 190 in 2014. (d) the comment on investor confidence.
2. I think the key KPI is average IP of new wells. Even more so than number of wells. When we start seeing this drop, then it means we are running out of sweet spots, downspacing is proceeding faster than completion improvement.
3. I don’t think the oil per well is concerning since we know the cause (fewer new wells completed, old wells more a portion of the total).
4. Actually even with no weather slowdown, but just with steady addition of new wells, we will eventually see oil/well go down (just a mathematical necessity). Of course, average decline will also go down. It’s just a result of new wells becoming a smaller portion of the population.
5. I do agree that things have slowed down (lower rate of increase) from the blistering pace of late 2011 to 2012. Even without the winter slowdown, you can see that just comparing 2013 to 2012. Perhaps not peaking, but an inflection point. Although even that I don’t know, given the rig increase.
6. I hear that FEB is coming in flat also. And March has road load restrictions (spring melt) so will be flat too. April should start turning up and then there will be a lot of work through July or so, getting caught up on uncompleted wells.
7. A time series of uncompleted wells would be very interesting. What is the capacity to catch up. What are typical winter backlogs.
8. People are waiting for the results of the CLR 14-well pad experiment with baited breath. Because it will indicate the limits to downspacing. Have heard some shale boosters worried that the delay in announcing something indicates poor results. That said, CLR is doing another 14 well pad, so it looks like the results are good enough to keep going. (Don’t know for sure, just throwing ideas out.)
9. Thanks for highlighting the DEC numbers change. It’s the kind of thing I miss.
P.s. Go little Bakken, go! Starting to be noticeable in terms of world oil picture. Amazing, when you think mid 2000s it wasn’t even on the radar.
what would be interesting to know if the lateral length has increase from 09 while production has been pretty much stagnant.
Agreed. Good analysis.
Um, but you must mean well IPs. Not overall production. That is up just a bit since 2009. 😉
330 feet per stage. 30 stages is the CLR standard now. That’s 9000+ feet.
30 stages was not the standard in 2012.
1. Do you have any data?
2. I think you MIGHT be right that there could be an element of increasing sophistication of completion (and added cost for the production). This is not necessarily some sneaky aha (“wow, the oil is running out, look what they have to do”). We’ve talked about how this is a dynamic that helps counteract the effect of running out of sweet spots/downspacing.
Companies say they are “learning”. In shale gas in Barnett in mid 2000s, this actually happened to the extent of not just keeping pace, but actually increasing the type curve year over year for several years. Obviously more stages and more sand cost more, but then some things like multi-pads, developed infrastructure, etc. help reduce costs/well also. You may think there is some nefarious thing the producers are doing (increasing stages, sand, laterals, etc.)…to foil the peak predictors or bamboozle investors. A simpler explanation is that they are rationally trying to optimize investment for risk/reward.
Same thing applies to downspacing. For sure, it is possible to downspace too little and leave money on the table. Or to downspace too much and spend too much on wells for not enough additional production. And it’s not even about optimizing the individual wells, but of optimizing the acreage (a small reduction in per well EUR is worth it because what you care about is total production/total spend.) There’s actually a massive amount of testing going on to try to decide this aspect of development: CLR has 6 sites testing different amounts of spacing. EOG has at least one test. KOG does, Oasis does. Whiting has several also. They even watch each others tests (see CLR March investor presentation, map of industry testing).
“The Charlotte 3-22H flowed 953 barrels of oil equivalent per day (Boepd) at 1700 psi on a 28/64 choke in its initial one-day test period. Located in McKenzie County, North Dakota, it was drilled to a total depth of 21,324 feet, including a 9,701-foot lateral section, and was completed with Continental’s standard 30-stage fracture ”
Operative word is “standard”. 9701 / 30 = 323 feet/stage
You seem concerned that stages are increasing while production/well is flat. Even making a remark about now, versus 2012. Do you have any time series data on this? I know there was a big change from 2008, but I don’t know if any recent changes are significant. you seem suspicious and raise an interesting confounding factor. the way to resolve it is with data.
Nothing concerns me. The point of change in technique is pointed at the model people. It’s not all about you.
Hi Watcher and Nony.
I am well aware there has been a change in technique over time. I am unaware of any data on lateral length, frack stages and production for a large number of wells.
Since 2010 there may have been two separate trends at work, increasing lateral length and/or number of frack stages which would tend to increase well productivity and a possible decrease in available area in sweet spots and/or downspacing which would tend to reduce well productivity(new well EUR).
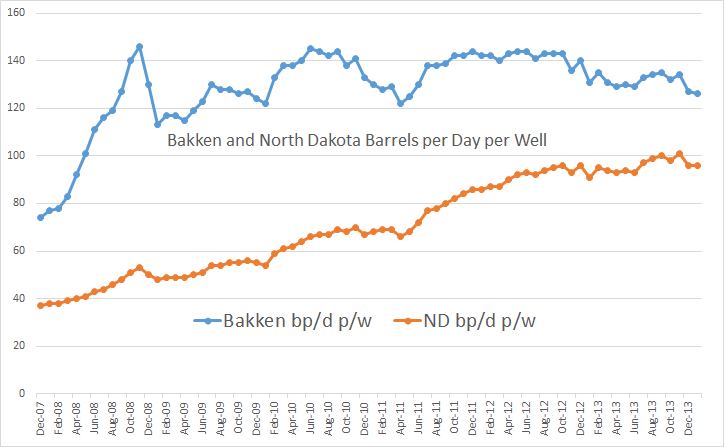
The overall effect has been for a relatively steady overall well productivity from 2008 to 2013 in the Bakken/Three Forks. (see chart below.) Note that 2009 was lower than average and 2013 a little higher than average (dashed line is the average 2008 to 2013 well), but other years fall fairly close to the average.
The model is a simplification to get a rough idea of what might happen in the future.
In addition there would be no point in trying to convince Watcher because any data is not to be believed.
There is no perfect data, nor are there perfect models.
Well, I believe data that confirms my preconceptions.
But since I have none of those, I’m denied all data.
1. c. Cut the “not”. Dyslexia.
Bated breath, not baited breath. Probably other mistakes too. 🙁
More in relation to the last post from crude oil peak, but the West’s crude oil stocks are looking very low based on the five year average as per the following chart:
More great and timely work!
Thanks!
Shell’s American Woes Highlight Difficulty of Cracking Shale
Shell’s new boss, Ben van Beurden, said bets on U.S. shale plays haven’t worked out for his company. Its North American performance was already hit by pessimism over offshore Alaska, but its latest move shows Big Oil hasn’t quite mastered how best to capitalize on the U.S. oil boom. Shell just can’t catch a break. I though the shale stuff was down to a science.
Van Beurden said it was bad management policy to commit close to $80 billion in capital on its North American portfolio and still lose money. Now, he said, it’s time to cut the loss and slash exploration and production investments by 20 percent for 2014. Yeah, I guess you could say that losing money on an $80 billion bet was a bad policy. I guess they just need to change their policy.
Shell’s new boss made big waves earlier this year when he said he wasn’t ready to commit any more capital to drilling in the arctic waters off the coast of Alaska. Now, the company said its profitability has been impacted by losses in U.S. shale basins in the Lower 48. Wait a doggone minute. Shell is losing money in shale basins? Are they the only ones? I mean it’s not like Shell just got into the oil game.
In January, he warned things weren’t going as he expected. Fourth quarter upstream earnings, he said, were hit by high exploration costs and lower production volumes. Its upstream business in the Americas, Shell warned, was expected to incur a substantial loss this year. High costs and lower production. Who could have possibly foreseen that? And it also snowed in the winter! Life is just not fair.
His disappointment comes as the U.S. Energy Information Administration said strong growth was expected from the Bakken, Eagle Ford and Permian basins in the country. By the end of this year, EIA said crude oil production should reach 8.4 million bpd and hit 9.2 million bpd in 2015 thanks in part to shale.
Shell, however, said it may have to unload its stake in the Eagle Ford shale play in Texas to keep its corporate checkbook balanced. Either Shell is really badly managed or something is going on in the shale world that we aren’t being told. At least Shell is publicly discussing it.
The tendency would be to blame Shell for its poor management team. While Marvin Odum, the boss of Shell’s U.S. division, wasn’t discussing how the cut backs would hurt business at his Houston office, he still has a job, however. Whew, I was worried there for a minute.
Onshore North America is different from offshore North America. Offshore, there are no private landowners to negotiate with, though from an engineering standpoint, onshore is much easier. BP last week acknowledged the challenge and decided to spin off its onshore business to better focus on the “unique characteristics” of U.S. shale. WOW! Offshore is DIFFERENT from onshore! Who knew? So the private landowners are the new whipping boy. Damn those landowners! Don’t they care about the oil companies’ profits? But then offshore is kind of expensive and difficult, too, right? So, what’s his point?
Shell, by its own admission, said it hasn’t quite figured out the do’s and don’ts of the shale boom. While credited with exponential growth in U.S. oil and natural gas production, Shell’s problems say more about the difficulties of shale exploration than they do about the company itself. The shale boom, for all its glory, has yet to spread much outside North American borders. BP said its new spin off “will be designed to adapt” to onshore problems, where shale still proves to be a tough thing to crack. So they are saying “It’s not us, it’s those damn rocks. And landowners.” I think Shell is giving us a window into the world of shale production that the smaller players can hide. It also may indicate that there just aren’t that many good plays left that haven’t been claimed already.
Calhoun,
Thanks for posting that article. Art Berman said that Shells biggest ERROR was that it chose its Shale Assets poorly, especially in the Eagle Ford. Looks like Shell bought up a lot of leases in areas that weren’t located in the sweet spots — something the industry is finally realizing.
Ron… something else about the “Continued Hype” about the NEW OIL REVOLUTION. Funny how the “Earth Is Flat Mentality” still seems to persist even today.
As I have stated many times, the HYPE regarding energy independence is important to the United States because it gives the illusion that we can continue BAU – Business as Usual for several more decades. Unfortunately, if word got out that we are about to hit peak oil, well then it could be devastating for the financial markets and a way of life here in the states.
Lastly, the U.S. economy stays alive by the continued DELUSION that the U.S. Dollar & Treasuries are assets. They are not… they are tremendous liabilities. We in the precious metal community always knew at some point in time the Ponzi would end.
According to ZeroHedge:
http://www.zerohedge.com/news/2014-03-14/it-begins-past-week-foreigners-sell-record-amount-over-100-billion-treasurys-held-fe
This may indeed be kicking into high gear. Foreigners sold over $100 billion in U.S. Treasuries last week. This U.S. funded stunt to try and overthrow the Ukrainian Govt may be the straw that finally breaks the camel’s back.
Silly U.S. politicians.
steve
Steve, the source of this story is here:
Nobody Just Sold $100 Billion Of US Treasuries
I cannot make heads or tails of it. Perhaps that is because it is late and I have had one too many on a Friday night. But someone please tell me what this means.
It means someone bought $100 billion in Treasuries from someone else.
Ron,
It looks like the Russians are pulling out a lot of their money from the West. I believe this huge drop in U.S. Treasuries is due to the Russians removing their U.S. Treasuries from the West before possible trade sanctions including the freezing of their assets in the West.
The Russians did the same thing when the West went after the Banks in Cyprus. Cyprus was a big banking center for Russia & Gazprom.
This is all Geopolitics at work here. Anyhow.. I don’t blame the Russians for removing their funds before the West (U.S.) does something really stupid.
We must remember, the U.S. has disrupted Libya, Syria, Egypt, Iran, Iraq, Afghanistan, Pakistan, Yemen… and the list goes on.
At some point in time, the European countries better wake up and realize the new BOSSES are going to be the Chinese and Russians… I know the Germans are getting ready to go with the BRIC nations on their new trade settlement system in the future.
The U.S. has put its BOOT on the NECK of one too many countries.
steve
10 yr yield down sharply ytd, down 1 bp yesterday in response to this story.
That’s the wrong direction if you believe Treasuries are being divested.
Watcher,
I don’t think the Russians sold any real amount of Treasuries, they just removed them from the Western system. Also, I believe the Fed is buying up much more in the way of Treasuries then its stipulated “Official QE” amount.
The U.S. Treasury days are numbered… as well as the Dollar. It’s actually going to be up to the Chinese well they want to PULL THE PLUG. I believe this will be when they feel they have enough gold.
As I mentioned in a previous comment, they imported 418 metric tons of gold in just the first two months of this year.
steve
Steve,
How does a government go about removing their Treasuries from custodial holdings at the Fed without selling them and how would this make a difference since the Fed knows exactly what bills and bonds were held?
I agree with the comment about the Fed buying up more then advertised. They have already been caught doing that in the past.
Woody
The overall point is you can’t sell unless there is a buyer, and given the decline in yield the buyers are anxious to buy and bidding them up.
Just depends on who the buyers are. With 2T sitting on bank balance sheets and an unlimited Fed backup, rates can be pushed around quite a bit.
Watcher Wrote:
“The overall point is you can’t sell unless there is a buyer, and given the decline in yield the buyers are anxious to buy and bidding them up.”
The Fed would purchase them. A sale of $100 Billion in a week would be enough to send interests soaring if the Fed didn’t purchase the majority of it.
Its possible that Russia did sell a big amount of US Treasuries ahead of santions. But China has also been a big seller. Its possible that China is selling off its UST to bailout Chinese companies that are defaulting on loans. The Credit Bubble in China has popped. I am sure the truth will come out in a week or two.
Sure, the Fed can buy, though hmmm maybe not.
Most don’t know that the Fed may not, by law, purchase treasuries from the Dept of Treasury. They are not permitted to bid at auction.
They may and do then certainly buy from the Primary Dealers who do bid at auction, but I’m not sure . . . I vaguely think there IS a law that limits their transactions to member banks and PDs. In which case they cannot buy from Russia or China unless a bank or PD bought first.
Shell got in late. The acreage has been bid up. Doesn’t mean it’s a bad play, just means there’s no free lunches for those who come late. The drilling is still happening and oil is still flowing and volume still increasing. They’re also a big major and don’t have the same skills in terms of managing lots of small wells.
So it’s a Ponzi then: Those late to the game lose their shirt.
Nope. You didn’t think through what I wrote. Those are good assets with valuable product coming out of them. The issue is that their value is already realized in the open market, so late comers will not get any deals.
Nony, think about the concept of Shell being a “latecomer” to oil extraction from shale. Here is a company that has been in the business of oil production all over the world for decades. They are used to going wherever possible to find oil. If Shell was indeed late to the shale party and ended up purchasing leases that were not so sweet, that must mean the ‘party’ is not really big enough to accommodate many IOCs like Shell, if any.
One can only conclude that if Shell can’t make money in shale oil, it will end up being a very tiny part of world oil production, just a flash in the pan. Shale may be “good assets” for some, but there just aren’t enough to go very far.
EOG and CLR seem to be doing pretty well with shale. And the oil is flowing. Those are good assets. Problem is everyone knows it and Shell overpaid to sit at the table. But it doesn’t mean the overall development is bad. That’s just doomer wish fulfillment. Like Piccollo/Gail predicting 200 K bpd Bakken peak and Rune predicting 650 k bpd (both blown away within a few months of them making them). Now, you guys want to play conspiracy theory and imagine investors are dumping all that capital in the prairie for no reason.
You gotta rise above what you want the story to be and just be objective. Don’t be Art Berman saying shale gas would amount to nothing in 2009 and now refusing to face the music with it being 40% of production (and overall prices low, and marketed gas volume up).
Joe Clarkson wrote:
“One can only conclude that if Shell can’t make money in shale oil, it will end up being a very tiny part of world oil production”
Shell could have always got into the game by buying drillers that where already drilling. This is fairly common for the big fish to buy the smaller fish if they can make money. Last year Shell bought Repsol LNG.
Shell was a very very early player, when it started investing in shale oil projects back in the 1980s. If I recall, Shell was an also a pioneer with horizontal drilling. Its seems very odd that Shell and most of the other major oil companies are completely absent from LTO drilling. What do they know, or don’t know that preventing them from joining the game?
My guess is that the profit margins, if any are razor thin. A big Oil company with dividends to pay isn’t likely to bother unless there is a good expectation of good profit margins.
I think there is a good chance that it make be a scam, using very low interest rates to secure billions capital that will eventually be defaulted on.
On an interesting note, Exxon cuts its Shale reserves in half:
http://energypolicyforum.org/2014/03/06/exxons-shale-reserves-drop-dramatically/
““Reserve additions from the liquids-rich Woodford, Bakken and Permian plays in the United States and the Montney and Duvernay plays in Canada totaled more than 300 million oil equivalent barrels.”
In 2013, Exxon claimed 750 mBoe:
http://fuelfix.com/blog/2013/02/19/exxon-builds-reserves-largely-on-us-oil/
“The Woodford shale in Oklahoma and the Bakken shale in North Dakota added more than 750 million oil-equivalent barrels of the new reserves, according to Exxon Mobil.”
Sounds like it that Exxon is putting its capital to work away from shale plays for reserve replacements.
Oil company valuation leans on book value as much or more than P/E. Reserves owned, even unprofitable ones, can matter.
Note that Exxon bought XTO a few years ago for billions of dollars. XTO is a nat gas company. The deal had an escape clause that if fracking were made illegal, the deal could be broken and cash restored. XTO certainly thought they knew how to frack, and probably do. But Exxon is divesting themselves of shale anyway.
If the reserves are unprofitable, then they are not reserves. Or at least not next year when the new 10K comes out. 😉
That’s not the SEC rule for declaring reserves. I don’t think you understand 1P, 2P etc.
“Reserves estimation is one of the most essential tasks in the petroleum industry. It is the process by which the [b]economically
recoverable[/b] hydrocarbons in a field, area, or region are evaluated quantitatively.”
https://encrypted.google.com/url?sa=t&rct=j&q=reserves%20estimation&source=web&cd=1&cad=rja&uact=8&sqi=2&ved=0CCQQFjAA&url=http%3A%2F%2Fwww.spe.org%2Fjpt%2Fprint%2Farchives%2F2007%2F05%2FJPT2007_05_DA_series.pdf&ei=2IwkU7DjK8TC0QHpm4DoCg&usg=AFQjCNGRXIPBBDQyQiKy_VEj_g7x04Mkyg&bvm=bv.62922401,d.dmQ
The rule is the rule. The SEC is the arbiter.
Oh btw your link is not valuable. It’s dated 2007.
The SEC rules were redefined in the 2009 timeframe. FASB has worked with the SEC on interpretations.
They decide what is reported. Their criteria is strict.
Watcher wrote:
“Oil company valuation leans on book value as much or more than P/E. Reserves owned, even unprofitable ones, can matter.”
I think you misunderstood what I was trying to explain. Its not on Exxon proven reserve gains. Its that Exxon is choosing to invest overseas to expand its reserves than to invest LTO. Thus I believe that Exxon isn’t making much money on LTO and will eventually pull back or sell its LTO assets, perhaps at a loss. If LTO was a money maker, why would they switch by investing in Africa and other unstable regions?
I think Exxon bought into the hype and purchased XTO and Denbury on the assumption it was going to be a game changer. Only later deciding to stop expanding and invest overseas in some not-so-nice regions. LTO may become Black Sunday part duex.
This sounds credible.
If I were making the XOM investment decisions, I would want reserves on my balance sheet that are worth more than other reserves. A billion barrels of LTO is worth less money than a billion barrels in most parts of West Africa.
Nah, that never flies.
If skill decides things, you buy it. If they lack someone, they hire them.
Albany Orders Moratorium on Bakken Crude
Authorities in Albany County, New York have issued a moratorium on Bakken crude oil processing at the Port of Albany pending a public health investigation.
The moratorium applies to Global Partners LP and its plans to increase the processing at the port of crude oil from North Dakota’s Bakken region, which authorities are concerned may pose a threat to public safety due to its extreme volatility and flammability.
This could be a huge issue in the making. There are only so many rail routes to bring the Bakken oil to east cost refineries. The issue could be public safety, or that could just be the fig leaf for finding a way to extract some coin from the oil company.
I don’t know what the state government can do that won’t run afoul of interstate commerce rules, but I don’t underestimate the cleverness of politicians when it comes to exacting a tax on a business with few choices. And if it works in New York, it could work anywhere.
And corporate misbehavior doesn’t help:
A recent investigation by the Federal Railroad Administration found that shippers sometimes misclassified the oil they were offering for sale, loading it into tankers that weren’t stout enough to safely carry materials in the highest hazard category.
Government investigators found crude oil being transported from the Bakken region was misclassified in nearly one in five samples of truck shipments en route to rail loading stations.
This sets up some obstacles for Global Partners LP, which is seeking to build several boilers to heat crude oil before it is loaded and shipped for refining. Global Partners has the capacity to transport up to 160,000 barrels a day of crude by rail to its Albany terminal.
Here’s just one way to get some money out of them: The Transportation Department said the order is aimed at Bakken crude but will cover shipments from anywhere. The testing requirement goes into effect immediately with a stiff penalty for noncompliance.
In any case, this kind of moratorium has to have a chilling effect — just one more thing for the oil companies to contend with.
“A recent investigation by the Federal Railroad Administration found that shippers sometimes misclassified the oil they were offering for sale, loading it into tankers that weren’t stout enough to safely carry materials in the highest hazard category.
Government investigators found crude oil being transported from the Bakken region was misclassified in nearly one in five samples of truck shipments en route to rail loading stations.”
BOOM. As it were. It’s not all oil. The numbers are bogus.
20% is definitely substantial, thanks Watcher.
I wonder how much this effect has to do with transport rather than “cheating the refiners”. I would think the refiners do an assay or just now what they get when they transport. There is always some C1-4 within crude oil, so they’d just be getting a bit more. And they can just price for it. But for a supplier who would have otherwise had to flare the gas, perhaps leaving more of it in the oil, allows more $$ to end up finding a market rather than being burned.
Also, wonder if there is any pattern of certain operators or well types or separator types. Is there some sneaky deliberate fluffing going on? Or would we see this type of variability even with WTI?
20% off-spec oil is definitely substantial. But “it’s not oil” and “the numbers are rigged” is going overboard. Even if 20% of the oil has 10% fluff, that would only reduce the total by 2%. Important, sure. But sure as heck not “the whole thing is not oil”. And for that matter, I’d like to know for the 20% of cargoes that were off spec, how much were they off spec by?
There’s nothing evil. It’s systemic in an inevitable way. You can’t get rid of the NGLs unless you book a truck, and you have to pressurize them to make them liquid, so the truck has to be pressurized.
No one wants to pay for that, and they also don’t want to pay to have that truck jam up the dirt road to the well when it’s not going to make much money.
Anti flaring imperatives are being pushed, so flaring it off is reducing. So where else do you put the stuff? Obviously, into the crude truck and let it be someone else’s problem.
The refineries see it, and pay less for the railcar.
“Shell is losing money in shale basins? Are they the only ones? I mean it’s not like Shell just got into the oil game.”
The Bakken Play, on the upslope of the production profile, is showing an average production rate of a little over 100 bpd, with a median production rate of less than 100 bpd. I have a hard time believing this will work in higher cost areas like Siberia and the Middle East, especially when some major oil companies can’t make the economics work in the US.
The key is the trucks. This is not your grandfather’s oil.
Costs are far higher than for conventional fields. I see quotes here and there and they are believable. 2.2 million pounds of proppant per well at 100,000 pounds per stage. Wow. 2000 truck trips, round trip, for year 1 of a well. Another wow. When these things are producing 20 barrels/day, that’s $2000 at $100/barrel that day, and you have to man it, pay the truck to come pick up your 20 barrels, pay for separation and disposal of water, and amortize the upcoming cap and abandon concrete. These wells are going to die fast. The inability to route pipelines to each pad is a cost spiker on both the front end and back end.
At this point the key issue for the Bakken is these reports of choking. If companies are choking new wells, we have entirely uninformative IPs about to emerge. There is another consequence of choking. The economics of these plays was to pay the price tag with the initial surge of oil. If they are not going to permit an initial surge, then they MUST be expecting huge price increases in the future. This is hedging at its ultimate.
I can’t see any way that a considerable permanent rise in the price of oil is not baked in given the decline rate of the legacy fields and the lack of success on the part of the industry as a whole in finding new conventional oil.
The tight oil is wonderful so far as it goes but there is no way it is going to be produced in the near future in quantities adequate to offset the declines of all the old conventional fields.
The only way oil is not going up is that the economy is going down.
There is a possibility that the well owners are going to choke wells for other reasons. All I know about producing oil is what I have learned following blogs such as this one.
But I have read that it is often necessary to choke a conventional well in order to get the greatest total amount of oil out of it. Maybe choking some tight oil wells will result in lower initial production but higher production down the road.
This practice might prove to be the most profitable way to manage a tight oil well especially if the owner is betting on a higher price later and wins that bet.
There may also be other reasons for doing so having to do with taxes and when they are due and how much they will be in total.
And maybe the owners are expecting to save some money shipping their oil in the next couple of years by pipeline rather than by truck and maybe the savings is worth waiting for a pipeline to start operations.
I don’t know what typical rates are but if a pipeline saves the owners ten bucks a barrel and the price of the oil also goes up another ten bucks delaying some production could be quite profitable.
And maybe only a handful of wells will be choked. There are at least a few wells in the Bakken that produce like a conventional well.
I suppose this is because there a few s spots that are basically just ordinary conventional reservoir .
There are comments in the discussions with things like “if it’s on my land, I want a free flowing 5000 bpd with low pressure after a month more than I want my well choked to 900 bpd and declining to zero over a few years. Why? Because I don’t pay for the pumps and I don’t gamble on price.”
I will try to find the link that said CLR would choke all its new wells from now on.
The wells have always been choked. I think a few operators may flow freely, but that’s a small minority. The question is how much to choke, not some aha to start choking. And decisions on choke approach seem to differ from operator to operator and even within an operator from well to well. And yeah perhaps even over time as well. Tradeoff is when artificial lift is added versus getting more $$ faster (thus higher NPV). Maybe there is some EUR, well management impact too, but that’s far from clear.
There are a lot of different factors in the well: lateral length, choke, proppant type and amount, stage number and length. Different operators seem to try different approaches and even for individual operators, they do different things in different areas (geologies).
Personally, I would bet that decisions on how to frack the rock matter more than choking in terms of affecting the overall economics. [Sure 24 hour IPs are dramatically affected, but that’s just a flawed metric…looking at first year cums is probably more relevant.]
http://www.investorvillage.com/smbd.asp?mb=4288&mn=117097&pt=msg&mid=12897974
Went through that link. It’s not very useful. Filled with inconsistency re frack extension into rock. In one place they say the distance is short and this is a good thing, and later they say the distance is longer extended, and this is a good thing. Most investor stuff is worthless in this regard.
The advanced conclusion of improvement derives from well results of one company vs another with no geological evidence presented in porosity measure or milli/microdarcies of permeability that the rock was identical.
How many free flow vs how may choke . . . the discussions from actual land owners suggest this is a significant mod, and these folks have nothing to sell anyone else. They actually own the land.
If the world ever hits 70 mbpd, then we will know we are into ‘transition time’. It may be another 25 years until that happens, so we have time to prepare.
Of course, there is the post-2005 decline in the volume of Global Net Exports of oil and of Available Net Exports of oil, and more importantly, the rate of depletion in post-2005 Global and Available Cumulative Net Exports (CNE).
Great comments today!
Speaking of over hyped shale, can someone tell me what’s up with the EF and Permian oil production growth rate? Hint: It is virtually nil!
So, I keep accepting that the EF and the Permian are growing gangbusters because everyone says so. So I finally take a look at the data: http://www.rrc.state.tx.us/data/production/ogismcon.pdf
That’s a big LOL. Texas oil production is below year ago levels??? Are you kidding?
Furthermore, the EIA keeps saying we are up 1,000, 000 barrels in YOY production:
From where. The Bakken is up not even up 200k and total Texas is down ( You can argue Dec is not final, but it won’t change much if it is up to November levels when complete). Even if I compare Texas November 2013 production to December 2012 production, you are only looking at a 67k b/d YOY increase. That leaves a Bakken plus Texas YOY oil production increase of 300k. That includes EF, Bakken and Permian “shale” plays. That’s it? Is the EIA lying again. On page 23 of http://www.investorvillage.com/uploads/13230/files/PetroleumStorageCharts12-March-14.pdf, they show US oil production up over 1,000 b/d YOY.
So, 700k of missing oil production growth from non-shale based plays? Where? Alaska? LOL; NY? LOL
These kinds of disparities are usually all liquids vs crude. Give it another look.
The link I provided (http://www.rrc.state.tx.us/data/production/ogismcon.pdf) clearly distinguished ng from oil!
True, but the RRC’s definition of crude oil does not include condensate.
In the file you referenced, the Texas RRC only counts crude oil as production (not C+C), while the EIA counts C+C. Also, the RRC does not report production for wells and leases which have reported production, but which have not yet been assigned RRC numbers. But the biggest difference is crude versus C+C.
Of course, as noted in the prior thread, based on Texas and OPEC data, I strongly suspect that we have not seen a material increase in actual global crude oil production since 2005 (crude oil with an API gravity of 45 or less).
Jeffrey:
What percentage of condensates can be used as a subsitute for vehicle fuel derived from oil?
Thanks!
Condensate is basically natural gasoline, but it’s not of much use for refining distillates.
Jeffrey:
Here are the condensate #’s. They have been declining in 2013 to a December monthly average of 262k b/d. So if I add this 262k b/d for condensate to the 300k b/d for Texas crude plus Bakken crude YOY increase, I still only total 562k b/d from essentially all shale oil (or tight oil if my vernacular is wrong) increase in liquids production. The EIA and IEA are reporting 1,000k+ b/d YOY crude and condensate production increase. What happened to the nearly 500k b/d unexplained increase being reported? Who produced this increase or are the EIA’s and the IEA’s data bogus? Furthermore, what percentage of condensates can be used in motor vehicle production. I thought it was a small #?
Texas Statewide
Monthly Totals, Jan 2013 – Dec 2013
Thank you!
As said it is “natural gasoline”. In the 1930s it was called “drip gas”. It lacks octane. Octane’s purpose is to prevent a vapor of gasoline in a cylinder from detonating from just the compression of the piston BEFORE the sparkplug sparks. Timing is off and performance suffers and damage occurs.
Condensate likely has no diesel or kerosene in it (gotta look into this). So that means won’t push trucks or airliners around, to say nothing of ships.
Condensate is mostly, but not all, pentane. Pentane is the lightest hydrocarbon molecule that is not a gas at sea level pressure and room temperature. It has five carbon atoms, C5H12. Butane, C4H10, a gas at sea level pressure and room temperature, has four.
Texas had an extremely cold winter, so a large amout of production was shut in from November to January. Outside of that the trend is still increasing, I don’t really see what your’re getting at.
Is the drop in crude from 62 M bbls in August to 57.5 M bbls in December 2013 significant?
Question: Is the December 2013 in that Texas RRC PDF final or will that be revised as more data comes in? I have heard that producers in Texas are often very delinquent in reporting their production numbers.
It could be revised up, but it will still probably be lower than November because statewide there was a pretty long period of sustained cold weather and a large amount of production was shut in. I’m not sure if the RRC gets metered production or sales but there is always the possibility for some changes.
1000 k b/d not 1,000 b/d
“The drilling rig count was down from Dec to Jan and the number of well completions
dropped from 119 to 60.”
Remembering our discussion of last year for finding a completion count whose IPs would yield zero growth/breakeven on production, it’s clear we were all out to lunch (including Helms). Fewer completions here yielded a production increase from December. haha
The trucks told the tale in December. They could not roll. They could not carry oil.
The other text here about wind preventing completion work . . . I cry silliness. He said 12 days. Good for him. Completion time is 120 days — 4 months — some of that is waiting, but hell . . . if even 2 months of it is pouring that 2.2 million pounds of proppant down the hole, 12 days out of those 2 months are not going to be decisive.
I think we’re seeing the effects of truck traffic (did everyone see that vid of a line of 100 tanker trucks sitting parked along the roadside waiting to get into the railhead?) and well IP choking. The Bakken is going to peak and the claim will be correctly made that it is an artificial peak and they could produce more if they voluntarily unchoked.
From the Director’s Cut: Investor confidence appears to be growing.
Does anyone other than me find it strange that Lynn Helms would mention investor confidence? Does Bakken production depend on individual investors?
I thought that comment odd. Particularly in relation to the previous and following sentences. It just seemed random, as though he couldnt think of anything else to say.
I didn’t find it odd and having looked at CLR, Whiting, EOG, and Oasis, I agree with Lynn. Production is dependent on investment. Which is funded by debt. And you need to have the stock price up to hold more debt. Right now, the market is buying into this as a good use of capital.
Note, the remark is just an impression. I wouldn’t read that much into it.
Also, rig count is a sign of drilling activity, which is essentially (once completion catches up) a sign of interest in continuing development. Rig counts being up slightly (over 2013, but under 2012) shows people are willing do invest in sticking more holes in the ground.
Completion is not going to catch up. It’s 120 days. Even if some is waiting, it’s maybe 90 days. Drilling is 2 weeks. It won’t catch up unless drilling stops.
It takes apparently 2.2 million pounds of proppant to frack a multi stage well. That is what takes so long. They aren’t going to catch up.
And now if they’re going to choke IP, they are going to have a difficult pitch to whomever — unless they KNOW oil prices are going sharply higher.
They’ll catch up because long term it makes no sense to drill a well and not complete it. EOG actually has a policy of not completing any wells until spring. Other companies still frack, but their rate is reduced.
I’ve heard EOG and Whiting have been doing 3 million pounds of sand on a short lateral. It can be even more extreme than what you say, in terms of the proppant quantity. Jury is still a little out on if that is right approach. I have seen one analysis that showed EOG has higher first month IPs, but then drops below others’ type curves.
http://seekingalpha.com/article/1253231-bakken-update-eog-resources-completion-technology-is-a-game-changer
CLR standard 30 stage fracking is over 9200 feet horizontals.
That’s obviously 300+ feet per stage and the quote is 100,000 pounds per stage. X 30 = 3 million pounds.
A proppant carrier truck is typically 23,000 pounds, if the roads can endure that. Less if not. That’s 95 trips just to carry proppant and more if the roads won’t take it.
Nothing changes any games if the trucks can’t get there very fast. Note also that the initial well of a 4 well pad has no water on site. Gotta truck that in, too.
I think everyone knows truck trips are extensive. Couple thousand round trips for a well? That said, the multi-well pads probably do help with some aspects of gathering.
P.s. Read this about “going with the truck flow”
http://themilliondollarway.blogspot.com/2014/02/16-million-downtown-williston-project.html
It’s not odd. I think you guys didn’t parse the paragraph layout.
He’s talking about nat gas and the gas plant about to resume or begin operation. He’s not talking about oil. The investor comment leads that para.
He was quoted as being disappointed in the month. That’s not a mind set that yields upbeat phrasing — if you’re talking about oil. Further reason to suspect he wasn’t talking about oil.
Libya looks to be a few steps away from out and out civil war:
http://www.theguardian.com/world/2014/mar/13/libya-ali-zeiden-threat-civil-war
Sort of a big deal from a comment I posted to the previous Ronpost. It went something like this:
“It takes 3 barrels of Saudi oil to yield the same amount of diesel as 1 barrel of Libyan oil.”
I saw the eastern militia leader being interviewed by Amanapour. Dude was actually pretty impressive. I wonder why we are backing Tripoli? It’s the Benghazis who beat Kaddafi anyhow. Plus they have oil…
Haha, the only thing that beat Gaddaffi was NATO jets authorized to protect civilians (authorized by the Russians, btw) who spent 6 months doing that and losing, as well as paying for $120 Brent for all those sorties.
Then they sat down and had a caucus and decided “protecting civilians” included bombing purely defensive Gadaffi emplacements.
And btw that was the last time Russia or China will ever authorize ANYTHING from the UN. No cooperation from Russia on Syria? The US has only itself to blame.
The Med is an American Lake. (The Black Sea is a Russian armpit.) Sixth Fleet is very ready for and knowledgeable about (the operational aspects of) conflict in either Libya or the Levant.
Don’t see how that is relevant. The US flew no combat missions in Libya. They just orchestrated the UN resolution and provided recon from afar.
Watcher Wrote
“The US flew no combat missions in Libya.”
Thats incorrect:
http://www.cbsnews.com/news/crisis-in-libya-us-bombs-qaddafis-airfields/
The US Attacked Ammo Dumps and other Gov’t Miltary and gov’t assets during the civil war.
I’m prepared to stand corrected, but my recall is those early otherwise high risk missions to suppress air defense were US and UK cruise missile strikes, though certainly a few stealth aircraft attacks would make some sense. EW aircraft would be involved as standoff missions (not really combat mission). An F15 did crash from mechanical failure but overall, the point would evolve to be American combat involvement ended within a few days and if the Med is an American lake it doesn’t really make sense to have . . . the vast majority of missions flown by NATO aircraft French ( 35% of total mission), British and Italian. This wiki isn’t rebuttal, but the text is vague about specific US missions, while French activity is laid out. Note that even vague mention of US missions stops after those few days in late March, but ongoing sorties continued thru October. But I note my error about “no”, as opposed to “almost no”.
http://en.wikipedia.org/wiki/2011_military_intervention_in_Libya
This quote is from the billion a day link that Ron posted:
Given that this technology is just beginning to unlock the state’s vast resources – perhaps 12-20 billion barrels (or 60 years’ worth) of recoverable oil in western North Dakota – Jenkinson dismisses the idea of a regional “oil boom.” That term is inadequate. “It’s an industrial revolution.”
Maybe that sixty years worth is a typo.
But a billion barrels is only enough to run the world about twelve days or so and only enough to run the US about a couple of months in rough terms.
Latest USGS estimate is 7 B.
Hi Watcher,
The USGS estimate is for undiscovered technically recoverable resources (TRR) and the 7.4Gb mean estimate is for all of North Dakota and Montana, 79% is in North Dakota for 5.8Gb of undiscovered TRR. To this we need to add proven reserves of 2.2 Gb (at year end 2011) for about 8 Gb plus another 0.4 Gb produced from 1953 to 2011 for a grand total of 8.4 Gb for the TRR.
Link for EIA proven reserves for North Dakota is below, I used 2011 minus 2007 for my estimate of ND Bakken/Three Forks proven reserves:
http://www.eia.gov/dnav/pet/pet_crd_pres_dcu_SND_a.htm
Hmm I know the number I quoted was from they update from a 2008 estimate that needed an increase. I’ll look for it. Does the EIA use the USGS number?
Hi Watcher,
http://www.usgs.gov/blogs/features/usgs_top_story/usgs-releases-new-oil-and-gas-assessment-for-bakken-and-three-forks-formations/
“On April 30, 2013, the United States Geological Survey (USGS) released an updated oil and gas resource assessment for the Bakken Formation and a new assessment for the Three Forks Formation in North Dakota, South Dakota and Montana. The assessments found that the formations contain an estimated mean of 7.4 billion barrels (BBO) of undiscovered(bold mine), technically recoverable oil. The updated assessment for the Bakken and Three Forks represents a twofold increase over what has previously been thought.”
Also the 2013 Bakken Three Forks Assessment slideshow can be found at the link below (large pdf):
https://drive.google.com/file/d/0B4nArV09d398cDZMNW5yRWxVM1k/edit?usp=sharing
slide 18 shows the North Dakota part of the play is 78.5% of the total undiscovered technically recoverable resource (TRR) or 5.8 Gb. Remember that proven reserves and oil already produced need to be added to undiscovered TRR to get the TRR.
See the following article by Robert Rapier, which is where I first realized that we need to add the proven reserves and oil produced to the undiscovered TRR.
http://www.energytrendsinsider.com/2013/05/07/estimate-for-williston-basin-oil-resources-is-doubled/#more-13934
If you read the linked newspaper article, the 60 years is explained. Assumes 20 billion total production at 1 million per year. They are not talking about world or US demand.
http://bismarcktribune.com/news/columnists/clay-jenkinson/it-s-not-just-an-oil-boom-it-s-an/article_17f93572-cb75-11e1-a78b-001a4bcf887a.html
P.s. That story is old (AUG 2012), so the 7 billion USGS survey was not out. Just the 3.5 billion survey which excluded Three Forks. I think the 12-20, they use in the story refers to CLR estimates, which are just based on Price paper versus a percentage extraction. USGS has a better methodology. (Doesn’t say their number is right but more thinking in how they did it.)
I mean at 1 million barrels per day…
So the teaser quote is click bait and self contradictory . I just took it for a typo since the same sentence says it is not a regional boom but rather an industrial revolution.
It is clearly a regional boom it terms of a sixty year supply which as you point out is probable only half that anyway.
Coolreit, What is your formula for converting Casinghead Gas MCF to Condensate Barrels?
Does anyone know the formula for converting Casinghead Gas MCF to Condensate Barrels? The best I can find on the web is 6 barrels per MCF but it looks like Coolreit is using something close to 11.
Thanks, Ron
Ron, is there a credible update to the Bakken decline rate data, or is EIA deriving it from their model?
As far as I know there is no credible source for the Bakken decline rate. The EIA apparently is using their own model. David Hughes said, a few months ago, that the EIA’s decline rate was too high. However from what I can glean from the numbers I work with the EIA is pretty close. I believe it is about 5.9% per month.
The reason I ask is the whole purpose of increased IP choking is to address decline rate.
Ron:
I didn’t know or intend to use 11:1. It should be 6:1.
Based on the following link, looks like about 4.7 MMBTU per barrel of gasoline. Diesel is 5.4 MMBTU per gallon of diesel. Crude oil is about 5.8 to 6.0 MMBTU per barrel of crude oil.
http://www.afdc.energy.gov/fuels/fuel_comparison_chart.pdf
http://www.eia.gov/forecasts/aeo/pdf/appg.pdf
Dry processed gas usually has a heating value of about one MMBTU per MCF of gas.
EIA numbers for gasoline and diesel are slightly different (5.0 and 5.8 respectively). Of course, the energy content of gasoline is lower in the winter than in the summer (winter blend versus summer blend).
Based on EIA numbers, one BCF of dry gas (one MMBTU per MCF), would be equivalent to about:
200,000 barrels of gasoline, or
172,000 barrels of diesel, or
167,000 barrels of (imported) crude oil.
Edited 3/18/14 to correct “on …” to “one BCF of dry gas”
Should be:
one BCF of dry gas
FYI my rule of thumb has always been 5.6 million BTUs / generic barrel (the barrels do vary, aka Libya’s 3X more diesel than Saudi’s).
And nat gas of the same 42 gallon volume as room temp/pressure is 1/1000th that amount. You have to compress and freeze to get the LNG 75% number.
You can count on another 1200 plus wells to be added to the count for North Dakota this year, the total will probably be 11,300 by year’s end in production.
At 90 bpd per well, the monthly production totals should be in the 1 million barrels per day range.
Bakken oil will be purchased and shipments will continue. Clearly, if there was no oil, the drilling would come to a screeching halt. It would be game over.
Instead, it is game on. The BNSF is equipped to deliver the oil and it will. It makes them money. What Warren collects per barrel to get the product there on time and on schedule, I don’t know, but the BNSF doesn’t do the job for free.
If you think that a 30 mile per hour wind in temperatures approaching minus 35 degrees Fahrenheit doesn’t have an effect on diesel motors and contributes to how effectively a job can be done, you’re out to lunch.
A 1280 acre spacing with one well that produces 80 barrels of oil per day is the norm for the Three Forks. Not enough, and more wells can be drilled on a 1280 spacing.
That’s about what a well in the Three Forks is going to produce after 3 years with an initial production of 400 bpd. It declines, but the depletion is very slow, so the well should produce oil for 60 plus years.
40,000 wells times 80 bpd times 365 days times 60 years equals 70,080,000,000 barrels of oil, so the estimates are probably based on such a prediction of totals. 1951 to 2011 is 60 years and wells have been producing for that long of a time period. When all is said and done, it will be more.
If a guessing game is accurate, the projection would be a total of 280 billion barrels total expected estimated recovery.
The oil is there and will be there for a long time to come. Nobody is going to refuse it, nor few will.
Just like that good ol’ mountain dew, them that refuse it are few.
It is still Peak Oil, nothing can stop that.
Misunderstanding. They have wind velocity shut down regs apparently for fracking equipment. There is no challenge to that being a required regulation. That wasn’t the issue.
The issue is that it was 12 days out of the 120 days to complete offered as a reason for a poor production report. The question would be how many wells during that month were within 12 days of full completion and held up by the regulation. 12 days is only 10% of the total frack time.
Re this:
“January temperatures were only 6 degrees below normal with only 3 days too cold for fracturing work, and there were no major snow events, but 12 days had sustained wind speeds too high for well completion work”
It wasn’t too cold. It was too windy. Shrug. Regardless, 12 days out of 120.
A question for any Texas oil men, please!
I can’t reconcile what the RRC reports as oil production (and condensate production) with what the IEA reports as Texas production. I show a very substantial shortfall. What don’t I understand? Thanks!
For example, the RRC reports November, 2013 crude oil production as 58,090,560 Source: http://www.rrc.state.tx.us/data/production/ogismcon.pdf
Separately, the RRC reports 2013 condensate production as 8,373,494 Source: http://webapps.rrc.state.tx.us/PDQ/changePeriodAction.do from the RRC oil and gas data query system.
Combining oil production and condensate yields 66,464,054 barrels. (The RRC rep told me yesterday that I have to use the query system to obtain condensate data and then add it to oil data).
However, the EIA reports 84,080,000. Source: http://www.eia.gov/dnav/pet/pet_crd_crpdn_adc_mbbl_m.htm
That is a 17,615,946 difference or 587,000 b/d over reporting by the EIA. That is a huge difference.
I also checked North Dakota oil production reported by North Dakota: https://www.dmr.nd.gov/oilgas/directorscut/directorscut-2014-03-13.pdf
I found a minimal discrepancy between ND reporting and the EIA for December, 2013
Is the EIA massively overreporting Texas oil production? I didn’t compare the unfinished December results. I used the RRC’s November 2013 results, so it should be final or very close.
Thank you!
Coolreit, sorry about the delay of your post but all posts with over 2 links must be approved by an administrator and I just overlooked it. However I think I have the answer to your problem.
Go here: Texas Field Production Of Crude Oi (Barres per day), then click on “Download Data (XLS file). Then for the 2013 data subtract the December data from the November data and so on for each month. Here are the results. The data is in thousand barrels per day.
As you can see the EIA has Texas C+C increasing by exacty 50 kb/d every month for the last nine months. They are guessing that Texas will increase production by 50 thousand barrels per month every month for the last nine months of the year. So the answer to your question is yes the EIA is massively overestimating Texas production.
Great Ron!
Thanks for the confirmation! As you can see, Texas is not delivering on the EIA lies. The EIA #’s as I suspected are pure propaganda. How can OECD inventories keep dropping counter cyclically for 4 months if shale oil is a savior? Shale oil is a hoax!
Ron:
Don’t you think you are being too diplomatic even using the word “overestimating” to describe the EIA reporting. I call it a fraud. Like you, I call it massive. Think about it. Our energy policy is based on it. Now, even our foreign policy is based on it vis a vis Russia. The news media has promulgated this story for at least a year.
By my elementary analysis, I think the EIA reporting reflects a potential false reporting of up to 900k b/d. The story line is that the US is adding a million b/d production last year and this year as well. It appears to be a huge lie. The tell is that 1) Bakken oil production is up not even 200k b/d YOY January 2014, and 2) Texas crude PLUS condensate oil production is essentially flat YOY as of December 31, 2013: Here is the Texas data direct from the Texas RRC (please help me with the formatting):
Statewide Statewide
Monthly Totals, Dec 2012 – Dec 2013
I know that December 2013 data is not final, but I update my excel spreadsheet with Bakken monthly data each month and the changes are immaterial. I find it hard to believe the changes for Texas are that great either. Remember, Texas has been reporting oil and gas data longer than the feds. Even if I am wrong, the eventual changes won’t be big in the scale I am talking about.
This is an amazing story.
Yes but the EIA will eventually have to post the Texas RRC data. It may take them several months. But I think this may be the turning point. There is no reason that South Texas should have the weather problems that North Dakota had. Let’s give it a couple of months.
Texas December 2012 oil production was originally reported on February 27, 2013 as 43.8 mb/month. Twelve months later the original estimate has risen to 56.0 mb/month, an upward revision of 12.2 mb/month or 28%.
If the December 2013 oil production is revised upwards at the same percentage rate, it would be 73 mb/month in twelve months. Add in similar revisions for condensate production and it is fairly close to the current December 2013 EIA estimate of 88 mb/month.
Texas reports a Production Adjustment Factor of 1.15. The adjustment factor has been materially understated for over 2 years.
Coolreit,
Marmico has this right. Although Ron is correct that the EIA numbers are merely an estimate of Texas production (where they are guessing that Texas C+C production has increased approximately 50 MMb/d each month since March 2013), historically the EIA estimates are much better than the reported Railroad Commission (RRC) of Texas numbers. I looked at this a while ago
http://oilpeakclimate.blogspot.com/2013/08/eagle-ford-shale-may-soon-reach-1.html#more
see the chart at the bottom of the post and the chart below.
Note that over time the EIA estimates have changed much less than the RRC data. The EIA estimate is much closer to actual output than the RRC numbers. If you go back to Jan 2013 and look at the EIA and RRC data estimates for Jan 2012 EIA estimated 1.74 MMb/d C+C for TX and the RRC estimate was 1.55 Mb/d.
Currently the EIA estimate for Jan 2012 is 1.72 MMb/d for TX C+C output and RRC of TX estimates 1.71 MMb/d.
So Ron is absolutely correct that the EIA overestimates TX C+C output. The EIA estimate in Jan 2013 for output one year earlier was 2% too high.
The RRC estimate in Jan 2013 for output one year earlier was 10% too low.
Also note that the RRC estimates move up a lot more over time than the EIA estimates move down. The EIA estimates are much better, though clearly they are imperfect.
2% differential equals severance tax evasion.-:)
Beautiful analysis and chart. Kudos, big guy.
That’s why Dennis will win the “Bakken” award for closest to the peak. He has stepped up his game. He can now visualize 1.5 mb/d (his shark fin decline is debateable with enhanced recovery).
There is no need for Dennis to piss around with 2% differentials in RRC and EIA Lone Star state estimates.
He should just let morons like me deal with those minor issues.
Hi Marmico,
I wonder whether EOR will be profitable in the LTO plays. The “shark fin decline” that you speak of is mostly a result of my economic assumptions (well costs can only fall so far my guess is $7 million per well in 2013$), if oil prices rise more than the EIA’s AEO 2013 reference scenario, then there might be a more gradual decline and the USGS mean estimate could be too low (I doubt it, I think they will be approximately correct 8.5 Gb TRR for the North Dakota Bakken/Three Forks +/- 1 Gb). I think my most recent estimates for the USGS mean estimate scenario using Enno Peter’s data for the well profile are about 1.2 MMb/d for peak in about 2017, how quick the decline occurs depends on oil prices. I am not sure if the USGS accounts for EOR in their estimates.
Using Enno Peters data for Bakken/Three Forks wells, I updated my scenarios for the Bakken.
The average well profile has an EUR of 353 kb over 30 years. I have used a lower annual discount rate of 7% to calculate the net present value (NPV) of future revenue from well output.
A lower price level for oil of $80/barrel in May 2013$ is assumed which is in line with the futures market through Dec 2019. (I simplified by assuming prices drop to this level immediately, though prices are not a constraint until 2016 in the low (4.3 Gb) case). The results are not very different than if the EIA’s AEO 2013 low oil price case was used. See chart below.
The three cases coincide with the USGS F95(6Gb), F50(8.4 Gb), and F5(11.4 Gb) cases for TRR with economic assumptions added to find the economically recoverable reserves(ERR).
Peak is between 1.1 and 1.35 MMb/d from 2016 to 2021 where the lower and near term peak is for the F95 case and the higher and later peak is for the F5 case.
Note that F95 means there is a 95% chance the TRR will be 6 Gb or higher and similarly F5 means there is a 5% chance the TRR will be 11.4 Gb or higher.
Also note that the USGS assessment talks about mean undiscovered TRR for North Dakota of 5.8Gb. TRR adds 2011 proven reserves (2.2 Gb) and oil produced to Dec 2011 (0.4 Gb) to the undiscovered TRR for 5.8+2.2+0.4=8.4Gb.
I love me some Bakken. 😉
I am reading the Price manuscript:
http://www.undeerc.org/News-Publications/Leigh-Price-Paper/Default.aspx
Thanks for your detailed response, Dennis.
My assumptions are that the Bakken recoverable will be greater than Prudhoe Bay based on:
1. The USGS will do another flyby upwardly revising the mean TRR;
2. Mason’s paper;
3. Hamm of Continental insisting for almost 3 years of 24 billion TRR and 50k-100k wells.
1. You’re using a prediction to support a prediction. 😉
2. Read it. Not impressed by the sociologist’s work. Just different numeric scenarios starting from estimates of the EUR of the overall field.
3. There’s some good stuff in CLR and I agree that you should take their comments as grist for the belief mill. However those estimates are just percentages times the Price paper numbers. (read the footnote on those slides). We have a lot of drilling info now that Price lacked, so the USGS approach should also be considered.
***
Last few days, I’m leaning more to optimism. Rig count is up, showing investment. Also world price remains high (the whole thing shuts off if we crash back to low price regime). Also, EOG made some comments about renewed interest/promise there in most recent call.
Really hard to know how the decline curve will be have in far out years (just don’t have data, gas shale not a perfect proxy since the molecules so different in size). We don’t know if refraccs will work, be justified, or other CO2 or the like. Given the oil in price, there’s a huge prize, but it’s just uncertain how methods will evolve and if solutions for higher output are devised.
I’m thinking FEB/MAR will be flat or slight up. April and May will be very strong months. Could cross the 1 MM bpd (Bakken, ND only) in May (reported in July). That’s when the state is estimating. Will be some sort of celebration then.
I’m kind of leaning towards more of a plateau. Things will fight each other and there will be distributions of wells worth drilling. So…something like DC’s model, but with the upside more on the extending of the peak rather than a higher peak.
(Just guessing based on readings though.)
1. You’re using a prediction to support a prediction. 😉
True enough. What does Patterson do? Post another dot on a data chart that others collect!
I’m so excited about the RRC EIA post. I’m gonna lose control and like it!
Nony wrote:1. You’re using a prediction to support a prediction.
Marmico replied: True enough. What does Patterson do? Post another dot on a data chart that others collect!
No, I never use a prediction to make a prediction. I do, however, say something to the affect “I think this prediction is correct”, or wrong, or too high, or to low.”
But posting charts of EIA data or OPEC data or whomever’s data is not even a prediction let alone a prediction based on a prediction.
Your Pointer Sisters video link has nothing to do with anything ever posted on this site. Please don’t post unrelated crap.
Listen I collect data and post charts from that. To expect me to go into the field in North Dakota, Iran, Venezuela or Texas and collect my own data with my own money is just down in the dirt stupid.
I never claimed that my data was original. If it was original then it would be data I created myself. And since I don’t produce any oil I cannot possibly create my own data.
All data posted by anyone on the net must be data collected by someone else unless it is posted by the oil companies themselves. Even the EIA does not post original data.
And don’t call be bud and drop your smart ass attitude.
The Adam Siemenski video is relevant. He talks about drilling productivity and about lagged numbers for Texas.
youtube: mWKRSxUMTIw
What Adam Siemenski video? Sounds like I would like to see it. Your youtube thingy is not a link.
Nony, this is indeed very relevant. However you only get half the picture due to the cropping by the “comments program”.
I have replaced the video with the Youtube link:
CGEP: Adam Sieminski, U.S. Tight Oil and Shale Gas Outlook
http://www.youtube.com/watch?v=mWKRSxUMTIw
However I can only get the first four seconds of the video to play. Is anyone else having a problem?
Hi Marmico,
Please be more respectful, I will do the same.
I believe that Nony was talking about Mason’s paper, which is just a different opinion than my own. I actually used Mason’s well profile and the NDIC new well data and it did not match the actual NDIC output data very well. See
http://oilpeakclimate.blogspot.com/2013/04/bakken-model-suggests-7-billion-barrels.html#more
In the chart below you can see Mason’s model is a little on the high side, he also assumes that the EUR per well never changes, so he assumes there are no sweet spots, which is unlikely.
The CLR estimates are likely to be too high.
Nony’s criticism of my model is valid, we do not know what the decline will like be in the out years. My well profile is at the high end of the USGS estimates. You are correct that the USGS estimates may be revised in the future. I would say that it is a coin flip as to whether future estimates will be revised up or down. I like the mean estimate, but I could be wrong.
Coolreit,
You said,
“By my elementary analysis, I think the EIA reporting reflects a potential false reporting of up to 900k b/d. The story line is that the US is adding a million b/d production last year and this year as well. It appears to be a huge lie. The tell is that 1) Bakken oil production is up not even 200k b/d YOY January 2014, and 2) Texas crude PLUS condensate oil production is essentially flat YOY as of December 31, 2013…”
You need to look at annual totals not year over year monthly data (which can fluctuate quite a bit), the Texas RRC data is much worse than the North Dakota Data (I have no idea why) especially for the most recent months (you need to go back about 18 to 24 months for reliable data from the RRC).
EIA estimates are much better, for annual data see:
http://www.eia.gov/dnav/pet/pet_crd_crpdn_adc_mbblpd_a.htm
Here you see that about 800 kb/d of the 1000 kb/d annual average increase in C+C comes from North Dakota and Texas, the rest comes from Oklahoma, Kansas, New Mexico, Wyoming, Colorado, Utah, Montana, and so forth, small amounts of 60, 9, 40, 14, 34, 13, and 7 kb/d add up to 177 kb for a total of 977 kb/d increase in 2013 over 2012, this is pretty close to the 967 kb/d annual increase (difference due to declines elsewhere).
A separate question for all oil men, please!
I compared total oil production reported by the DOE with that reported by the EIA and found that the DOE appeared to over report December 2013 oil production by roughly 380k b/d. What am I missing?
DOE is reporting~ 8,200,000 as of December 31, 2013: Source: http://www.investorvillage.com/uploads/13230/files/PetroleumStorageCharts12-March-14.pdf
EIA is reporting 7,864,000 (243,771,000/31) Source:
http://www.eia.gov/dnav/pet/pet_crd_crpdn_adc_mbbl_m.htm
It looks like the DOE is reporting 336k b/d more than the EIA. What am I missing?
Thank you!
Disparities are common. Ron is usually all over them. The usual reasons are labeling what is being reported Crude or Crude+Condensate or All Liquids and sometimes just delayed reporting that has to catch up.
It is really the EIA versus the EIA. I wrote about it right at the top of the post here:
EIA’s Petroleum Supply Monthly by State, Texas Reporting Problems
The Monthly Energy Review says December production was 8,101,000 barrels per day.
The Petroleum Supply Monthly says December production was 7,864,000 barrels per day.
I have no idea what the problem is but they both are talking about C+C because if you go back two years their numbers match exactly. The near months are the farthest off.
Thanks Ron:
I see the discrepancy got much bigger in December. Is it propaganda? I also see a major difference in Texas original data vs. the EIA. Your post about Texas reporting issues was excellent. I still think that the discrepancies are way too big to ignore. The feds lie about inflation and GDP. See shadowstats.com for the details. I see a very large discrepancy based on what the DOE reports vs. what should be true data. I see Texas as the very big difference. The storyline that we will add another 1 million b/d in the US in 2014 is very dubious. They may report a 1 million b/d increase on paper, but Texas and North Dakota data doesn’t support it in the least!
I am going to do another post on Texas in a week or so using mostly the Texas RRC data. It really looks like the EIA is way off in their predictions.
It looks like the Texas RRC updates their data around the 18th. I will have something the day, or the day after they update.
Reminder to folks that the Bakken data of this Ronpost is from January, and late February is when truck testing/inspecting caused a railhead shut down for several days of late in the month. At that time my tentative numbers were a 14,000 bpd reduction from whatever would have flowed absent the shutdown — provided it held up production anywhere (no way to know).
Here’s an article about a boom in domestic shipbuilding due to the tight oil production.
The ships are being built and flagged and crewed domestically because of the Jones Act.
Being an American merchant marine sailor is good work if you can get it.
http://www.npr.org/2014/03/14/289849961/a-boom-in-oil-is-a-boon-for-u-s-shipbuilding-industry
I suppose we may hear more stories such as this one within a few more years.
I can believe an aircraft can slip thru the radar coverage once in a while and be lost at sea or even on land because it takes only a little while for a jet to go hundreds of miles and there is no definitive reason why anybody should be actively looking for it in the first few minutes if it goes off course or crashes.
But a large ocean going ship loaded with crude oil and at the center of a hot dispute is another matter altogether.
I would bet my last can of beans that the Pentagon knows where this tanker is within a few hundred feet.Ditto the Chinese and the Russians too more than likely.
All those spy satellites and recon aircraft aren’t up there for the fun of it and a ship of that sort can’t possibly make over about twenty five knots or so and probably not even that.
And being that it was a North Korean flagged vessel it was probably pegged for surveillance no matter what. The fact that the NK govt has revoked it’ registration is an enigma inside a mystery.
Maybe the oil was supposed to go to NK and the crew defected with both the ship and the oil supposing it was crewed by North Koreans but that is only pure speculation on my part.
http://qz.com/188170/the-other-mysteriously-missing-vessel-this-week-a-north-korean-flagged-oil-tanker/
Latest report is off Cyprus.
Dunn County has been Down for 3 months in a row, and Williams County is producing below the Oct., 2012 level.
It’s starting to look like the Bakken “boom” is down to 2 counties, now.
Yum, yum in October Kum. 🙂
🙂
Yeah, I’m thinking about leaving the country. 🙂
Don’t count your chickens yet, Bakken naysayers. April numbers (reported mid June) will be up. Need good weather to grow the oil.
I’m glad the Libyan rebels are supplying the NKs. I want more oil on the world market, not less. Want price lower. Leave the tanker alone.
Several counties have load restrictions for trucks in March (melt destabilizes the ground until it warms up and dries out a bit).
Several. There are only 4 counties producing significant oil in North Dakota.
I suppose that if North Korea sent the tanker they must have sent along something to exchange for the oil and you can bet it wasn’t a check for Uncle Sam’s dollars!!
Small arms and ammo seem most likely. North Korea probably has more than enough of those two items to export some.
Nah, I looked into N Korea some time ago to figure out how that works.
Bottom line, their oil comes from Russia and China and they pay for it in coal. They have coal.
This oil probably would have been marketed by China for them. N Korea’s domestic consumption is about 15,000 bpd. There is a 38K bpd refinery there, too, connected to rail lines.
Here’s a story about wind farms and coal and gas in Pennsylvania.
It is much better balanced than most such stories.
http://triblive.com/business/headlines/5415886-74/wind-pennsylvania-energy#axzz2w8OGAk8h
The one really important thing that is missing in my estimation is a reference to the possibility that natural gas will be exported in bulk and that it therefore will no longer be relatively cheap compared to coal and may even cost considerably more than wind juice in the not so distant future.
That ole international market price is gonna play hell with the business as usual dreamer’s plans for cheap gas from here on out–assuming of course that the gas is really there and can be gotten out of the ground cheaply in the first place.
It goes without saying that energy prices are going up in the long run and that unless they go up so fast that the economy collapses (which may well eventually happen!) that many ways will be found to stretch the energy supply and lower it’s cost.
This article is about the utilization of the enormous amount of wasted heat we generate in this country and some ways we may be able to change things to make use of some of it in the future.
http://www.popsci.com/article/science/waste-heat-free-energy-so-why-arent-we-using-it?dom=PSC&loc=topstories&con=waste-heat-is-free-energy-so-why-arent-we-using-it
Europe is well ahead of us as would be expected since Europeans are already paying much higher prices for fuel than we are.
It appear to be the case that if our regulations involving such matters were more rational we could make some pretty rapid progress in this area.
unless they go up so fast that the economy collapses.
The economy can collapse because of high oil prices even if they go up very slowly, and indeed that is very likely to be the case. However there is a chance of a shark fin collapse in oil production. In that case prices will likely spike suddenly, bringing down economies around the world.
True without a doubt. But if they go up very slowly collapse as the result of high oil prices is probably decades away in my opinion.
People adapt faster than pessimists give them credit for and while the Invisible Hand is not on the end of Superman’s arm it is nevertheless capable of working near miracles given time.
Every body I know with only a couple of exceptions switched to CFL bulbs a long time before incadescents were removed from the store shelves and just about every hillbilly I know who has two vehicles owns a compact car — the sort of car he used to laugh at when gasoline was still a buck a gallon.
Old folks who have never spent a dime upgrading their houses are putting in new triple layered windows and nobody even installs new oil furnaces around here any more. If you want one you have to order it a month in advance.
It’s heat pumps all the way.
I am personally very concerned indeed about a shark fine collapse occurring in the next few years.
I just read a piece on another site about the critical importance of recognizing changing new circumstances that may result in a disaster. I will post a link to it shortly.
If a shark fin happens we will be knocked flat on our butts and we will not likely ever get back on our feet again– at least not during our own lifetimes.
But if oil prices go up slowly we may stumble along for a long time yet before overshoot finally shoots us down for good or at least for several generations.
I suppose regulars here know already that I believe that electric cars are going to be far far more popular in the next five to ten years than almost anybody else other than electric car nuts.
But I am an old semi pro gear head world class rolling stone with an all around background in the skilled trades and I know beyond a shadow of a doubt that a well made electric car will last more or less indefinitely except for the battery.
And I have spent enough time around car dealerships and the people who work in them to know that dealers are not making their money primarily on the sale of cars but mostly on routine service and warranty work and the occasional out of warranty repair job and set of new tires.
Most people who own nice cars and trucks spend a thousand bucks or more a year keeping them up above and beyond taxes, insurance, depreciation, and gasoline.
Once battery costs come down the case for electrics is going to be ironclad in terms of dollars and cents so long as the owner or driver can live with the range limitation and the charging time.
Most people who own two or more cars will be able to drive an electric almost every day without worrying about either range or time to recharge.
Hence the day to day go to car will be the electric and the long trip car will be the conventional gasoline fueled car- and it will last for decades because it will be driven only on days when the electric is not up to the job.
This link has a hyped up title but it is still a useful read and throws some light on why electric cars are going to become mainstream faster than expected.
http://www.wired.com/business/2014/03/car-dealers-fear-teslas-plan-end-oil-changes-forever/
If I were in a position to buy a new car it would almost for sure be either a Leaf or a Volt for now but in another year or two it might be a Ford or other electric model.( When you expect to keep an expensive item for many years it is prudent to buy a model with an established track record.)
By planning my trips in it since I am now retired I could just about keep a Volt charged up with a few thousand bucks worth of pv panels and hardly ever buy gasoline again except when the old farm trucks have to roll.
No tuneups, no oil changes, no antifreeze ,no muffler, no fuel pump, or water pump, or radiator, or radiator hoses, or timing belts, or transmission all adds up to very little left to go wrong.
Gasoline is going up unless we are all idiots here.
My personal guess is that gasoline will cost seven to ten bucks nominal per gallon within ten years.
Grid juice will go up too but probably not so fast and a dollar’s worth of juice will still be worth three or four dollars worth of gasoline.
True Cost to own for Leaf (counting tax credit):
$28,000, 37¢ per mile, assuming 75,000 miles over five years
http://www.edmunds.com/nissan/leaf/2013/tco.html?style=200459702
True Cost to own for Honda Fit*:
$34,000, 45¢ per mile, assuming 75,000 miles over five years
http://www.edmunds.com/honda/fit/2013/tco.html?style=200429042
*Total estimated fuel cost over five years: $8,400
For comparison, GMC Yukon:
$72,000, 96¢ per mile, assuming 75,000 miles over fie year
http://www.edmunds.com/gmc/yukon/2014/tco.html?style=200480736
What does a battery replacement cost for a Leaf?
$100/month —
http://m.green.autoblog.com/2013/06/20/nissan-leaf-battery-replacement-will-cost-100-month/
Just looked at the Edmunds methodology. No battery replacement is included, which means their depreciation number is bogus. The Leaf has a $100/month battery replacement insurance policy, so add 3600/year X 5 to that cost of ownership. That’s 28,000 + 18000 = $46000.
Why not compare properly to an identically sized vehicle? Like the Nissan Versa.
http://autos.yahoo.com/nissan/versa-sedan/2013/1-6-s-plus/cost.html $28,000 same number of miles driven
sorry KC was in research as you posted haha
ack that’s wrong. 1200 not 3600. Add 6000 not 18000. Total 34000. Still beaten by the 28K Versa. BTW not sure about identical size. Just judged photos.
The versa appears to be larger at least for hauling. 38 cubic feet of cargo space with the rear seats down. Leaf is pathetic. 30 cubic feet with the seats down.
This is not even in the same league.
That last eight cubic feet of cargo space may come in handy for the average owner of a car once or twice in six months or a year.
Plenty of people never haul anything more than groceries and laundry for the dry cleaner and maybe a couple of suitcases in their car for as long as they own it.
You’re probably right, but that wasn’t the point. The point was to find a similar size vehicle to do the TCO comparison.
A LARGER vehicle was superior.
Even without the battery replacement cost, I didn’t think there was big difference between a Leaf and a similar subcompact (subject to what happens to fuel and electricity costs over the next five years). The huge difference is going from a new large SUV–at about a dollar per mile total cost–to a subcompact, either gas powered or electric.
A better choice, IMO, would be to live in a walkable community along a mass transit line, perhaps supplemented with an hourly car rental service like Zipcar, which would all be consistent with my “ELP Plan” recommendations from seven years ago:
http://www.resilience.org/stories/2011-08-08/elp-plan-economize-localize-produce
That’s values imposition.
Folks in Wyoming live their lives as they want. Folks in Iowa do, too. You want to save fuel, why not move NYC to surround Iowa and shorten food transport? Stack those NYers in shoebox sized apartments around the boundary of Iowa and have them come down each morning to scoop gruel out of a bucket the Iowans ship to them.
Inconvenience them and destroy their desired life rather than destroy someone else’s. This is never going to be the path anyone will take. It’s inhuman.
What is much more human, and therefore likely, is use weaponry and suppress competing consumption by a manufactured enemy by killing them off. That gets oil use down just as, or more, effectively.
The Leaf battery has a warranty for the first five or six years and or sixty or so thousand miles so that much is covered before you get to the hundred a month replacement plan.
Further more the battery will almost for sure outlast the warranty by a good sized margin.
If I were still working and commuting I would take that hundred a month deal in a heartbeat given the absence of so many other maintenance expenses such as tune ups and oil changes and the long term likelihood of the need of both a new engine and a new transmission in a conventional car.Either of these inevitable long term repairs runs well into four figures whereas an electric doesn’t need a transmission and an electric motor will last more or less ”forever”.
People just don’t seem to realize that the battery industry is still in short pants in terms of the sort of batteries used in cars and that as patents expire and expertise in the manufacture of them grows the price of them is going to come way way down.
Futhermore even a Leaf with a ”worn out ” battery that will reliably go only say forty miles is suitable for ninety percent of most people’s daily needs. Other days there is always the conventional car in the two car household and if it is a one car house then there are rental cars to be had by the day or week or month.
Most of my friends drive older cars to save money on depreciation, insurance, and taxes.The ones of them who can afford an occasional jaunt around the country usually rent a nearly new car for a month or two in order to be free from worry about a breakdown and to take advantage of the improved fuel economy which really adds up if you are touring the country with the family.
My personal guess is that most Leafs will not actually need a new battery in less than 125,000 miles on average.
And while it may not be the case at the moment in the future car batteries are going to be modular and it will be possible to switch out only bad cells which will dramatically extend the life of the battery at a relatively minor cost.
Jeff is right about mass transit and all that sort of thing but as I see it we are not going to give up on suburbia and the Mcmansion without a fight to the finish and people faced with the choice of an expensive apartment and no yard versus the existing house with a yard are going to bite the bullet and pay whatever is necessary to get to work and to the store so long as there is any possible way to do it.
And an electric car will get it done from Monday to Friday in the vast majority of cases.
Further more the better sort of employer is going to start providing some charging stations as soon as a few more electrics are on the road because it is great publicity and a good way to attract young talent.
Ditto upscale retail and professional offices- charging may be free or it may require swiping a card of some sort but it is coming because it doesn’t really cost all that much in terms of the potential for attracting extra business in the future.
You are seldom more than a couple of hundred feet from high voltage grid juice in any city or town or office or retail park or factory campus.
Every measurement I’ve seen had green agenda in it. Heaters turned off. Not too cold (which doesn’t do batteries any good even without heaters). Not too hot, so no aircon. And they report that result.
Maybe 2% of the US population lives somewhere that doesn’t need 4 months of heat and 4 months of aircon.
Let’s do a fair test. Let’s drive them at 15 degrees ambient with the heaters on, and compare that to a gasoline powered car doing exactly the same thing.
”In the second quarter of 2012 during the Finnish springtime, Finnish car magazine Tekniikan Maailma tested the Leaf in city driving at the temperature of −15 °C (5 °F), they achieved range of 59 kilometres (37 mi), this was with cabin and battery heaters on.[62]”
This does leave a lot to be desired but the performance is steadily improving both in terms of battery capacity and the need for cabin heat.
But when you can’t buy gasoline because it is rationed one of these days and you don’t have a ration due to you… even twenty miles may look pretty good and you can always bundle up and leave the heat off.
My old tractors don’t even have cabs on them and I still drive them in zero weather when I have too.
And many people are getting mileage better that the rated miles.
I am not saying that pure electrics are going to rule the roads anytime soon but rather that they are going to be a whole lot more popular a whole lot sooner than most people think they will.
At eleven cents per kWh the fuel cost of running a Leaf is less than four cents per mile.
We have had both a Leaf and a Volt for a couple of years now. Great cars. It doesn’t get that cold in central Texas, but it does get plenty hot, and we use the air conditioner (both cars have a good A/C). We get 4.2 miles per KWH including heating / air conditioning, less than 3 cents per mile.
My favorite figure for these cars: for less than the cost of 3 years’ gasoline at current prices, you can buy solar panels that will power a Leaf or Volt for the same number of miles per year for the rest of your life.
Al Capone used to light his cigar with a $100 bill. Most of us would not do that, but we readily plunk down that $100 every week to fill up two cars, and that burns the $100 with more carbon emissions. It astonishes me that people keep saying that electric cars are too expensive. No: burning fossil fuel is too expensive, in many ways.
A proper vehicle air conditioner draws 60 amps on the 12 volt system, almost 1 horsepower, or 720+ watts. After 1 hour that’s almost 1 KW Hour, so I guess that 4 miles was traveled on just 300 watts for an hour?
This is what I mean. The comparisons are always shaky. The reply would be typically “Well, I don’t need that much air conditioning so just a 50 watt fan is enough, so yes, the car did that with the air conditioning on.”
That’s not a proper comparison.
Original proper car heat came from radiator coolant in coils over which air was blown. The only electric consumption was the 50 watt fan. With no coolant to get heat from ( I presume there’s none?) you are looking at numbers like a space heater for a small room or about 1500 watts. So 1.5 Kilowatt-Hrs just to heat the car. Probably more than that because a house is better insulated than the car and will hold the heat better.
This is just not even debatable.
Again, “I don’t need that much air con” or “just wear a sweater” is not proper engineering comparison.
Crimean Oil
ZH ran this last night :
http://www.zerohedge.com/news/2014-03-15/crimeas-economy-summarized
The front page map quotes “oil production capacity” of 7 million tons per year. That’s not trivial. It also apparently isn’t true. Mazama says Ukraine zero. Besides which, yah, capacity, but who quotes production capacity before any rock is drilled. Reserves maybe, not production.
“The turnout for the referendum in Crimea at 5.p.m. local time was 70%. The vote will be closed at 8.p.m. Fabrizio Berto, a member of the European Parliament, who came to Crimea to monitor the referendum, said: “I have seen no violations there. People have been voting as usual. Nothing out of the ordinary. Everything is like at elections in Italy. The way it should be everywhere.”
@ Mac and others
re: leaf, etc
If the range is that minimal, but the cost is that great, it seems to me a bicycle or small motorcycle would suffice. In terrible weather a beater Yaris, Civic etc…let’s say under $5,000, simply cannot be beaten by a $30-40,000 car. Plus, you simply get liability insurance because if you crash it you walk away from it, or pull out the dent and continue on. The insurance savings would pay for your fuel for occasional use. If I had to shell out 25-30-40,000 dollars for a new car I don’t think I would. I sure wouldn’t buy one on time. It simply doesn’t make sense. I could afford to buy one but my heart would say “NO”. Transit, bikes, MC, walking looks pretty good by comparison. What about a diesel Smart Car? At least then a person might be able to make his own bio-diesel in a pinch. If someone needs a car to get groceries once in awhile it sure is a lot cheaper to car pool or have them delivered.
Regards…Paulo
I am with you when it comes to spending my money on cars.
I have never owned a new one and never will.We have a fleet here; a 97 Buick currently not tagged and insured , a 99 Escort currently not tagged and insured, two pickup trucks, a 91 Chevy and a 92 Ford currently in use , all bought used cheap.
I parked the Escort which was the go to cheap transportation because I wasn’t driving it enough to justify the insurance. The Buick was reserved for family affairs and should be sold now that there aren’t any family affairs any more but it isn’t in the way on a farm. My ancient Daddy doesn’t want to leave the house any more and when he has to he is happy in a truck.
If the trucks were newer I would strongly consider getting rid of one of them but the Chevy is a 4×4 gas hog and I need it on a mountain farm off road and on road when we have snow and ice which is often. So I drive it very little. The Ford suffices for everything else.I used to keep a big truck sixteen tons gross but need one only occasionally now and swap backhoe time for truck time with a neighbor.
I paid less than eight thousand bucks for all four of these vehicles combined and they have served us faithfully for close to two decades and will probably outlast me now that I don’t drive much.
I bought a rolled over Chevy just like the one I drive with a new set of tires on it for five hundred bucks and if I ever need any of it I have a complete spare drive train, lol. So far I have robbed the battery and tires and the light bulbs and alternator.
There is very little I can’t fix myself on any of them other than the electronics and if I can’t I have a fully qualified mechanic friend who is retired who will fix it for me. He needs a little help here and there too.
So I understand the cost of vehicles!
But most people don’t have any maintenance skills and can’t depend on a beater and there just aren’t enough of them to go around to everybody.
Somebody has to drive new cars so folks like you and me can drive old ones for next to nothing except gas and insurance and routine maintenance.
Now ” that minimal” range may seem pretty short to you but that is for a pretty cold winter day and it would be extended to fifty miles or more without using the heater.
I have ridden a bicycle and a motorcycle on sub freezing days and it just isn’t any fun at all !!
The bike kept me warm enough for a couple of miles which is as far as I ever normally rode it.
But with a fairly decent ski suit bought to fit loose and plenty of warm clothing under it and looking like a mummy full helmet with ski mask and face shield and insulated boots and mittens over gloves a forty mile ride on the motorcycle on a ten degree F day left me so nearly frozen I could just barely dismount and get from the street into the house.My girl had to help me get undressed because my hands were too stiff and numb to use them on buttons and zippers. I couldn’t even feel my feet but I didn’t get frost bit.
That once was enough!! I never rode it more than ten miles one way again on a really cold day. We managed both our schedules after that with one car in really cold weather.
Unfortunately most of us live where mass transit is something we have heard of but never experienced. There were buses in Richmond which is the only city I have ever lived in but they were so inconvenient and went so few places I wanted to go that I hardly ever took one.
If you already had a car gas didn’t cost any more than a bus ticket anyway.It still doesn’t if it is a cheap running car. The only time I took the bus was when I knew parking would be a problem.
We lived near the university downtown and a twenty mile range in a car would have been adequate to conduct our ordinary business on a day to day basis at that time.Five miles or so round trip to campus and back, restaurants and stores within a mile, big mall within a couple of miles. Job within five miles one way.
Even living in the country as I do now a Leaf would be adequate for my ordinary needs other than hauling at least three hundred and twenty days out of the year.The last forty five days might be a problem due to the short range in cold weather.
I have just bought an electric assist bicycle. My daily commute is six miles on flat terrain and mostly off-road paths, and climate is rarely extreme here, but I am not getting younger and the constant storms this winter just became too tiring.
It is a great compromise in that it looks and rides like a normal bike, but it takes all the work out of hills, acceleration and headwinds. EU regulations limits power assist to 15 mph, so if I want to go faster I have to do all the work. Now I can continue to get as much exercise as I want, and know I can ease off and let the bike take over if I get tired.
Putting in my usual level of effort I get about 40 miles out of the battery. At present a day’s riding is costing me about $0.10 a day in electricity, and saving me about $1.00 in food not eaten.
The alternative, to buy a second hand electric car, would have cost 6 times as much up front, and most of the overheads of owning a second car. Also, I would be constrained by the usual traffic congestion, and I wouldn’t be getting exercise.
Bicycles aren’t much fun in icy conditions.
2 wheels good; 4 so 20th Century.
I have a pair of studded tires for one of my bikes. They are GREAT! I’ve ridden when it’s very icy, and those tires grip. I also put those “slip on” things on my shoes with spikes on the soles. I thought that this would be the second year in a row with no need to install the snow tires. We has snow the first week of February, which became ice about three days later. During the worst ice day, I went shopping, pulling a trailer behind my bike. No problems. As an added bonus, I had the streets largely to myself.
My wife has an ebike, which has been a blessing for her. In her 60s, she hadn’t biked in years – and then she met me. After riding a regular bike for a few years, the ebike has made the difference between her riding or not riding often. Sure, good ebikes are expensive. But much cheaper than a car.
I had just about made up my mind to buy a used 50 cc Honda scooter from a neighbor which is adequate but just barely on the local roads to run some errands.
But the state just changed the rules and now such scooters will have to be tagged and insured and the potential savings in gasoline are not adequate to cover that expense since I would not be using it often enough.
I will not consider an electric bike until the prices of the ones with brand names, readily available parts, and warranty service come down from the sky.I know lithium ion batteries are expensive but the rest of an electric bike is essentially just another bicycle with a small electric motor on it.
I am happy to take a chance on throwaway power tools that cost only peanuts but a couple of thousand bucks and up is another matter altogether.
Does anybody have strong opinions on how long it will take for electric bikes to become commonplace in small town America?
My guess is that it will be another five years minimum before there are dealers selling recognizable brand names and more likely closer to ten that to five.
But if there is a shark fin decline in oil supplies and prices spike fast and hard and rationing is instituted…… electric bike dealerships will pop up like mushrooms in a warm spring rain.
Now another thing that puzzles me is why small motorcycles cost so much. I know the volume of manufacture of any given model is not that large but the amount of materials and engineering that goes into a small motorcycle is very small compared to a subcompact car and all the associated expenses such as shipping it are small as well.
But a half decent motorcycle costs at least half as much as a cheap car that has countless extra parts and features from a heater and a roof to a trunk. And it obviously has only a quarter of the materials and labor involved in it.
And like cars motorcycles can be sold in many different countries so the volume question should not be the real answer in my opinion.
I have Tidalforce 1000 watt electric bikes. Great bikes when they work, but the company went broke and service is iffy. I need the high power because my commute has big, steep hills.
If your travel is relatively flat, a 500 watt motor would probably do, and there are a number of options. There are multiple E-bike dealers in Austin.
E-bikes are great, and China makes tens of millions of them, but Americans don’t seem ready for them yet.
Everybody should have a way to get to work and essential shopping with zero gasoline. Some of us could do that with a regular bike. An E-bike is a cheap backup for the rest, 1/10 the cost of an electric car.
Now we know what happened to the rogue tanker.
http://www.nytimes.com/2014/03/18/world/middleeast/libya-oil-tanker.html?_r=0
Is this the first direct US military intervention in Libyan affairs recently? It sets an interesting precedent, in light of situation in Crimea. Are we edging towards a state where oil tankers need armed escort ships even in ‘friendly’ waters like the Mediterranean Sea? I’m taking my kids on holiday to Cypress next month.
I wonder if the Israelis were acting with government backing.
I’m sure the configuration was that the ship was stateless. NKorea withdrew its flag.
It was puzzling from day 1. NKorea didn’t need that oil. This is just the rebels trying to fund themselves. They won’t stop. They’ll probably truck it somewhere.
The US and EU at this point probably don’t care who is in control there. They are just desperate for some Russian offset flow.
I’m leaning towards being more optimistic about Bakken production:
Rig count seems to be steadily slightly higher in 2013 than in 2012 (3-4% higher). Also new oil per rig is staying high or increasing:
http://www.ogfj.com/articles/2013/11/bakken-oil-production-forecast-to-top-1mmbpd-in-december.html
Then in April and through November, there will be a lot of catch up for all the winter hurdles. They’re not drilling unless they expect to eventually complete the wells. We won’t see April increase reported until June, because of the reporting delays, but could be a nice stretch of increasing numbers during that time. Also, the price of oil has remained high (more than it was projected) and this is incenting development.
“They’re not drilling unless they expect to eventually complete the wells.”
>>At the end of Jan there were about 660 wells waiting on completion services, an increase of 25.
Of course you don’t drill if you’re not going to complete. Why would anyone drill if they aren’t going to complete? How many oil wells have ever been drilled in the history of mankind with no intention to complete?
Discovery well in the East Texas Field. The last thing in the world that Dad Joiner wanted to do on the well was to run pipe.
haha I stand corrected. haha
Actually, a lot of deepwater wells are drilled with no intention of completing – almost all deepwater exploration wells, and, a lot of appraisal wells. If a discovery has been made, and successfully appraised, a development concept is selected (such as platform type, number of development wells, etc), then, after perhaps a billion or so $$ being spent, development wells will start getting drilled. The deepwater Gulf of Mexico fields that are set to see 1st production in the next 6-12 months all fall into that category (Jack-St. Malo, Big Foot, Tubular Bells)
I would rephrase my comment a bit – actually many appraisal are kept as producers, but virtually all exploration wells are abandoned (unless the well is testing a very small prospect that would probably be tied back to a bigger established facility).
What is the process of naming fields? Who gets to do it- just Mike Oldfield?
Deepwater GOM fields are usually named by the operator. Every now and then, they come up with a name that needs to be changed. The first deepwater subsalt discovery was made by Exxon in the early 90s and they named it Mickey (the bathymetric expression of salt feature they drilled through, and 2 adjacent salt features, looked like Mickey Mouse). Apparently Disney did not like this, and now it is named Mica.
Parenthetical, there’s a great story . . . a 3D graphics consultant was chasing a contract with Disney executives. He gave his pitch and did some demos. He had the deal all but closed.
And then he finished with “I know there are documents I have to sign about non disclosure. There’s always legal mickey mouse that takes up time, but I am Mr. Compliance, so no problem.”
He lost the win. No contract.
I did a search for the 3 oil fields you mentioned and found some very good technical details at Offshore Technology.
The link goes to the article about the “Jack/St.Malo” discovery, you just need to perform a “search” on “Big Foot” and “Tubular Bells” to read the articles about those oil fields.
The Jack / St Malo deepwater project comprises the joint development of the Jack and St Malo oilfields, which are situated in the Gulf of Mexico. The fields are located 40km away from each other. The total recoverable resources of the two fields are estimated at over 500m oil-equivalent barrels. The fields will be developed by a massive floating semi-submersible production facility, which will be installed at a depth of 7,000ft. Its topsides will weigh 33,000t and the facility will have a capacity of 170,000bopd and 42.5mmscf per day of natural gas.
The Big Foot oilfield is situated on the Walker Ridge block 29, about 362km south of New Orleans in the Gulf of Mexico, US.
The field lies at a water depth of over 1,500m and is considered the eighth biggest deepwater oilfield in the Gulf of Mexico. It is estimated to hold oil and gas reserves of over 100mboe. The ETLP proposed for the Big Foot field will feature dry trees and top-tensioned risers. It will have full drilling capabilities and workover and sidetrack capability on the topsides. The ETLP will operate in depths of 1,585m and have a production capacity of 75,000 barrels of oil and 25 million cubic feet of natural gas per day.
Tubular Bells is a deepwater oil and gas field located in Mississippi Canyon Block 725 of the United States Gulf of Mexico (USGoM). Tubular Bells oil and gas field is estimated to contain recoverable reserves of more than 120 million barrels of oil equivalent. Once operational, the field is expected to produce 40,000 – 45,000 barrels of oil equivalent each day during peak production.
A trip down memory lane . . .
Remember the discussions on The Oil Drum about the THAI tar sands process and Petrobank Energy, at least in one case helpfully facilitated by an investor in Petrobank?
In any case, interesting stock price chart for Petrobank (click on five year scale):
http://www.stockhouse.com/companies/quote/t.pbg/petrobank-energy-and-resources-ltd
Here is a news article on the reorganization Petrobank shares drop 91% after reorganization
Shares in Petrobank Energy and Resources Ltd. are down 91 per cent in the first trading day since the company completed a major reorganization.
The stock was at $1.14 on the Toronto Stock Exchange on Wednesday, a drop of $11.26.
The company, now referred to as New Petrobank, announced on Monday it had completed the spinoff of its 57 per cent stake in PetroBakken Energy Ltd., a light oil-focused company.
But that’s not the whole story because Petrobank stockholders received stock in the new company, so there was no actual dilution of equity, which is why the stock maintained it’s general price level in the months leading up to the reorganization. It seems that PetroBakken was the company that had some value and it was subsequently rebranded as Lightstream Resources. Unfortunately for those shareholders, Lightstream has not done so well, dropping from around $10 on 1/1/2013 to $5.44 today. Overall, not a stellar performance.
Well I guess it didn’t work as advertised. It seemed a good idea at the time, does anyone know what went wrong? Was it the technology or the financial side that fell down?
Now onto the next bright idea, lol
Petrobank set back
“Petrobank wrote down reserves at Kerrobert and the value of its THAI patents to zero earlier this year because of performance issues”.
Merger spells the end of Petrobank Energy
“In November, Petrobank said it will suspend THAI operations at its Saskatchewan project unless they begin paying for themselves by mid-2014. The Kerrobert project produced only 152 barrels of oil per day in the three months ended Sept. 30, a decline from 305 bpd in the same period of 2012.
Petrobank estimated the project had to have output of 500 to 1,000 bpd to begin making money.”
Hi gang, I had hoped to have a post out today on Texas production from this site:
Railroad Commission of Texas As you can see the crude oil production data was updated on February 18. So I naturally assumed that the next update would be on March 18. But Noooo, that did not happen. But perhaps tomorrow. If so I will have a post a few hours after the update. It will take me that long to copy and paste the new data, compare it with the previous update, and to create new charts. So hopefully there will be a new post tomorrow…. hopefully.
As I have stated before I am a data hog. I post when, and only when, I have new data from which I can produce charts. I do not do a lot of just talking and theorizing, though I do have strong opinions on the subject. That is the subject of peak oil and the consequences thereof. But that will come later. Right now I am just post the data and what I think it indicates.
Ron
From: ‘Waves’ detected on Titan moon’s lakes by Paul Rincon science editor, BBC news website, dated, 18 March 2014.
“…The vast majority of Titan’s lakes and seas are concentrated around the north polar region. Just one of these bodies of liquid – Ligeia Mare – is estimated to contain about 9,000 cubic km of mostly liquid methane, equating to about 40 times the proven reserves of oil and gas on Earth…”
Now, as I see it, since these deposits are located on surface no drilling is required and, obviously, nothing has to be fracked. Also, you should all note, the reserve figure only refers to ONE of many lakes. I’m not babbling on off-topic here; this is Natural Gas they’re talking about, isn’t it?
Really Doug, just what are you suggesting? What has lakes of methane on Titan have to do with anything on earth. That is Titan, this is Earth.
It is a 7 year one way trip to Titan but only if you can slingshot around Jupiter. And conditions for that happens only about once in 200 years. Otherwise it takes a lot longer. And the escape velocity of Titan is about 3 kilometers per second. Soooooo????
Common Ron, It’s not like I was being serious. Christ, I’d bet Earth will be fried to a crisp long before we manage to harvest a spoonful of methane from Titan.
Of course, if we assume warp drive, the economics would look better.
Sorry Doug but you would be surprised at how many people actually believe that we can harvest the methane from Titan. Or, that we will one day travel to other solar systems.
This one earth is all we have. The bottom of the ocean is far more habitable than any other planet in this solar system. And we will never travel beyond this solar system.
“This one earth is all we have.” You’re talking to the choir man. I’m so utterly negative on what we’re doing (have done) to Earth it makes me sick — because I have grandchildren. And, for the record, anyone who thinks salvation will come from rockets jetting here-and-there… no, never mind, the Titan thing was just a bad joke. Sorry!
My theory is oil runs out for everyone before they have warp drive. All civilizations decline and fall and become remote from one another. Since oil is the engine of population, it starts to fall
You either get to warp drive, or you eventually go extinct. We didn’t get there. Neither did anyone else. That’s why no visits.
Carl Sagan and the Drake calculation about how many intelligent species would exist given 0.001% of this and 0.001% of that down the chain of reasoning . . . that’s all potentially accurate, but none of them got to warp drive before their oil scarcity began to choke them off, and because they lost transport they all went extinct from individual regional natural disasters.
Thanks Ron, we all appreciate your efforts. I’m guessing most here particularly value your data focus as we are clearly a long way shy of Peak Theory.
The French have a saying to about foolish ideas that goes something the effect ” Only a fool or an intellectual would believe …. insert here the foolish idea.”
There does not seem to be any shortage of intellectuals who know about as much about the oil industry as I do flying a jumbo jet which is to say I know the pilots sit up but nothing else at all for sure.
Here’ a link to an intellectual talking about using our petroleum reserve to punish the Russians by forcing down the price of oil.
But at least the readers have more sense that the authors at the Financial Times. The comments are just about 100 percent what you would expect to read here about such a scheme.
The scary thing about such articles is that either the authors have to be utterly without a clue or else willing to say anything at all no matter how ignorant it might be for political reasons. This guy used to be a high official in Washington and he is currently a professor and teaching graduate level classes more likely than not.
Given that he says stuff like this in public there is no telling what he is teaching his students.
http://www.ft.com/intl/cms/s/0/35d6ae10-ab9a-11e3-90af-00144feab7de.html#axzz2wLduysbQ
An indication for February/March North Dakota oil production could be the AAR railfreight index for petroleum which shows just a 7 % cumulative increase for the first 10 weeks of 2014 over 2013. In 2013 the indicator has been growing 70%. This dramatic change of rail freight implies a Bakken oil production of below 800 000 bbl per day for February. The Keystone pipeline reversal was compensated by a reduction of Cushing inventory reduction.
”The Keystone pipeline reversal was compensated by a reduction of Cushing inventory reduction.”
I don’t get it probably because I am interpreting this remark in a way different than it is intended.
Any clarification will be appreciated.
End of January the Keystone pipeline reversal started up. http://www.businessweek.com/articles/2012-05-16/unlocking-the-crude-oil-bottleneck-at-cushing.
So the reduced flow through rail freight might have been due to the reversal as more oil flows out of the region. However at the same time Cushing inventories fell over the last four weeks by over 10 mill barrels,which is around 300 000 barrels a day and has very likely compensated for the reversal. Therefore the fall in rail freight is completely due to lower production. February has been a very cold month in the Bakken region and the fall in production is also attributable to the weather. However, the production plunge is in my view quite big and is partly due to legacy rates. This could be now a very important turning point for Bakken production.
Heinrich
Heinrich,
Just to keep the facts straight, Keystone from Cushing to the coast that opened in January 2014, was a new build, not a reversal. The Seaway pipeline mentioned in your attached link dated 2012 was a reversal, and a duplicate 30″ Seaway is currently under construction and due to come online anytime soon.
I don’t think this changes the premise or your Bakken argument, but you did confuse me with Keystone reversal and your dated 2012 reference.
Thanks for your correction about the Keystone. I knew there are some major stock movements which could have an outcome for rail freight. However the rail freight change is very big. Today there is another report out and it will be interesting to see the development.
Heinrich
Note that 2-3 days of late February are alleged to have had no rail shipments at all because of the requirement to test for NGL content. After a few days the testing reqmt was relaxed.
Three days at 800K bpd is a lot.
Oil Price Stability
EIA has an interesting article on the tightening trading range for Brent crude.
In 2013, North Sea Brent crude oil, the most important global benchmark for waterborne light sweet crude, traded in the narrowest price range since 2006 and exhibited the lowest magnitude of daily price movements in more than 10 years.
Years ago many, if not all, peak oil experts predicted higher price volatility as time progressed. Here we are in 2014 with C&C production stagnating for nearly ten years while production costs skyrocket, yet world crude prices are historically stable. My opinion is that this reflects what Kopits described in his presentation — that the world’s inability to absorb higher prices is keeping a lid on how much oil prices can increase and, in turn, is putting huge pressure on oil company profits. Now the companies are scaling back their investments and increasing their target oil price for future development.
The big question is how long can this price stability continue? Many stock and commodity traders view a tightening trading range as a sign of an impending break out. I believe this will happen as the dual forces of depletion and reduced investment start to kick in. Yes, I understand that higher prices dampen demand as we have seen over recent years. But demand can only dampen so much and once production decline accelerates those who can will pay more. And those who can’t will do without.
The Goldilocks zone can’t go on forever.
Following is my essay on the progression in year over year declines in average annual Brent crude oil prices, i.e., higher average annual price lows. Also, note that monthly Brent prices were above $100 for six months in 2008, whereas monthly Brent prices have been above $100 for 35 of the past 36 months (through February, 2014).
Recent Global Annual Crude Oil Prices
We have of course seen a cyclical pattern of higher annual highs and higher annual lows in global (Brent) crude oil prices in recent years, but I think that the rates of change between successive annual price lows, or troughs following annual oil price peaks, is very interesting.
Peak to Trough Annual Brent Crude Oil Prices, 1997 to 2013
1997: $19
1998: $13
2000: $29
2001: $24 (1998 to 2001 rate of change: +20%/year)
2008: $97
2009: $62 (2001 to 2009 rate of change: +12%/year)
The 11 year 1998 to 2009 overall of change in trough prices was 14%/year. And then we have 2012 to 2013.
2012: $112
2013: $109
The four year 2009 to 2013 rate of change in the trough price would be 14%/year ($62 to $109).
The long term 15 year 1998 to 2013 rate of change in trough prices would also be 14%/year ($13 to $109).
If the (+14%/year rate of change) pattern holds, and we were to see a year over year decline in annual Brent crude oil prices in 2017, it would be down to an annual Brent price of about $190 in 2017.
Following is an an excerpt from a recent OECD study which forecasts sharply higher global crude oil demand (and potentially) much higher oil prices:
“A return to world [economic] growth to slightly below pre-crisis rates would be consistent with an increase in the price of Brent crude to far above the early-2012 levels by 2020. This increase would be mostly driven by higher demand from non-OECD economies – in particular China and India. The expected rise in the oil price is unlikely to be smooth. Sudden changes in the supply or demand of oil can have very large effects on the price in the short run.”
“Based on plausible demand and supply assumptions there is a risk that prices could go up to anywhere between $150 and $270 dollars per barrel in real terms by 2020 depending on the responsiveness of oil demand and supply. These projections account for a negative feedback effect of higher oil prices on economic growth.”
Source: http://www.financialsense.com/contributors/joseph-dancy/oecd-study-forecasts-sharply-higher-global-crude-oil-demand
Another trip down memory lane . . .
http://www.economist.com/node/188181
The Economist, March 4, 1999: The next shock?
The price of oil has fallen by half in the past two years, to just over $10 a barrel. It may fall further—and the effects will not be as good as you might hope
Excerpt:
“We may be heading for $5. To see why, consider chart 1. Thanks to new technology and productivity gains, you might expect the price of oil, like that of most other commodities, to fall slowly over the years. Judging by the oil market in the pre-OPEC era, a “normal” market price might now be in the $5-10 range. Factor in the current slow growth of the world economy and the normal price drops to the bottom of that range.”
And that same old self congratulation is back:
“Thanks to new technology and productivity gains”
Matt Mushalik at crudeoilpeak looks at an interview with Saudi Aramco’s Al-Husseini who is basically saying that LTO has pushed out the supply crunch but only to 2016/17:
http://crudeoilpeak.info/ex-saudi-aramco-geologist-dr-husseini-predicts-oil-price-spikes-of-usd-140-by-2016-17-graphs
Sustained tight price movements do seem rather like pressure building up for a blow out, regardless of futures market which seems to be reflecting back its own industry’s PR.
The world is still building old school transport infrastructure that is dependent easily affordable oil products; looks like a whole lot of stranded or at least poorly utilised assets to me, which will constrain our ability to switch to more appropriate kit.
It looked nice and tight in 2006 as well right before everything went boom some years later. Thanks for the graph!
Tightening Supply of Natural Gas Next Winter
Here is a headline that isn’t getting attention “Natural Gas Supply Expected Down 8% Next Winter” You need to scroll down to the graph that shows Working Natural Gas in Storage. Here are the maximum’s by year (in trillion cubic feet):
2010 3.8
2011 3.8
2012 3.9
2013 3.8
2014 3.5
2015 3.5
Now we are all aware that this winter has been severe so it’s not entirely surprising that it would be difficult to get the storage levels back to normal. But EIA is expecting the same reduced level for 2015! That indicates something else, doesn’t it? If we can’t get NG storage back to the 2010-2013 baseline in two years, that’s a trend, not an anomoly.
So how big a deal is an 8% reduction in maximum NG storage? I’d say it’s a huge deal especially given the trend towards NG from coal and oil for electrical generation. And pretty much any home owners who could do so have switched to NG from oil. So, yes, an 8% reduction in a tight energy resource is a big big deal.
Of course, the EIA could be wrong. Maybe they are underestimating the NG industry’s ability to refill the storage, but EIA is not generally known for erring on the pessimistic side. Or we could have a couple of mild winters which would help. But to me the bigger question is this: What does the EIA know about NG production that we aren’t being told? They must know something or they wouldn’t be forecasting lower NG storage.
It appears that the EIA downwardly revised 2012 dry processed natgas production numbers, so that dry US natgas production was (as revised) flat from 2012 to 2013. If we see a similar downward revision for 2013, it would mean that we actually saw a decline in production from 2012 to 2013.
In any case, I suspect that a decline in US natgas production is contributing to the rapid decline in US natgas storage volumes. And of course, Canadian natgas production has been declining for several years (through 2012). And as I frequently note, given the high decline rates from existing production, the US is facing enormous challenges, in just maintaining a dry processed natgas production rate of about 66 BCF/day.
The time that energy returned on investment and energy returned on energy invested are terms that seem to be used interchangeably by some folks and as distinctly different animals by other folks.
Given the increasingly tight supply of gas and rising gas prices this is a good time to ramble on a bit about how and why this matters.
(This will be oversimplified for most regulars here but there are always kids and newcomers who will see this site and others of similar nature. THIS IS FOR ANY NEWBIES AND KIDS that happen to see it.)
A typical business man concerns himself with the return of MONEP on his money invested and if his business is energy then this effectively means that he is looking to spend his money putting his hand on any fuel he can sell at a profit. He will not give a hoot about how much energy may be used up or wasted in his work so long as he makes MONEY.
So if he can make enough gasoline to run a car fifty miles out of enough natural gas to run the same car a hundred miles –if it were designed to run on natural gas- he would care less so long as gasoline is expensive enough and natural gas is cheap enough for him to make a profit.
He has in this example managed to manufacture energy in the form of profitable liquid fuel by using more but less valuable energy in the form of a vapor or gaseous fuel-energy that is less valuable in terms of money AT THIS TIME.
So for now we can get away with such business practices as burning huge quantities of natural gas to distill moonshine and to manufacture fertilizer to grow corn to make the moonshine.The profits in MONEY can be large but the ”profits” in energy may be very small or even non existent.
There is probably a small overall energy profit in the corn to ethanol to gasoline industry but if so it is a very small one.( This profit is possible duetto the fact that the corn plants capture a lot of energy from the sun.)
Now in terms of the second way the term is used ”Energy returned on energy invested” we are looking at some potentially very very serious problems.
Right now we are burning up a lot of natural gas that could be used to heat homes and businesses to process tar sands oil.This is ok from the businessman’s point of view.
But from the home owner’s point of view it means that he has to pay more for his gas.
And at some point it becomes a fool’s game because if it takes a barrel of oil to get a barrel of oil out of the ground it is obviously more efficient and profitable to just ignore the barrel in the ground and use the one in hand.
Natural gas will become ever more expensive over time because it comes out of holes in the ground and at some point it will be worth too much to use it to process tar sands oil or to make fertilizer to grow corn to make ethanol to make ersatz gasoline.
We do not have enough energy available in the form of natural gas to use it too many more years in such wasteful fashions as processing oil for gasoline and making fertilizer to grow corn to make moonshine to make fake gasoline.
We will have to get by with less gasoline so as to have more gas for other needs.Food and electricity are more important than gasoline.
And in the end food is more important than electricity and natural gas will be more valuable as the input we use to make fertilizer than it is as fuel to make electricity.
So we will need to get by with less electricity so as to have more food–unless we get our electricity some other way of course.
Jeff,
You say the EIA revised 2012 dry gas production… what was the original figures? I see the total for 2012 is now 24.05 Tcf, what was it prior to the revision? So, you think the 24.28 Tcf figure for 2013 will be revised lower as well?
steve
The International Energy Statistics website shows a dry (processed) production rate of 25.3 TCF for 2012 (of course, 2012 is a leap year by the way, when you calculate daily production). I assume that this is the original estimate:
http://www.eia.gov/cfapps/ipdbproject/IEDIndex3.cfm?tid=3&pid=26&aid=1
In any case, rounding off, we appear to have gone from a preliminary estimate of 25 TCF in 2012 to a current estimate of 24 TCF in 2o12, with the preliminary number for 2013 also being about 24 TCF.
The Citi Research estimate (that existing US natgas production is declining at about 24%/year, or about 6 TCF per year) implies that, in the next four years, the US has to replace the combined productive equivalent of the 2012 dry natgas production from Canada, Norway, UK, Iran, Qatar and Indonesia, just to maintain a dry natgas production rate of about 24 TCF/year.
Or, at a 24%/year decline rate from existing natgas production, the US has to replace the productive equivalent of all of the 2012 dry natgas production from the Middle East, in a little over three years (3.3 years), in order to maintain a dry production rate of 24 TCF/year. Over a 10 year period, we would need to put on line three times the 2012 production rate from the Middle East.
Or, assuming annual production from the Marcellus of about 2.9 TCF in 2013, we have to put on line the productive equivalent of the 2013 production from the Marcellus Play, every six months, in order to maintain a dry production rate of 24 TCF/year. Over a 10 year period, we would need to put on line 20 times the 2013 production rate from the Marcellus Play.
What’s your point?
U.S. natgas marketed production has risen from 18.9 TCF in 2005 (your gibberish all liquids petroleum baseline year) to 25.6 TCF in 2013 or 31%.
http://www.eia.gov/dnav/ng/hist/n9050us2A.htm
Are you saying that U.S. natgas marketed production will be materially less than 25.6 TCF in 2014? If so, how much on a volume basis!
The problem with using the marketed natgas production number is that it’s a form of double counting, since it counts NGL’s (which have not yet been extracted) as gas production. Processed NGL’s are also counted as part of total liquids production. Dry (processed) natgas production is the best measure of gas delivered to consumers, and it does not result in double counting of hydrocarbons.
Current EIA data show that dry processed natgas production rose from about 18 TCF/year in 2005 to 24 TCF/year in 2013. Note that even with a constant decline rate, the annual volume of gas lost to production declines increased by 33% from 2005 to 2013. However, a reasonable estimate is that the decline rate from existing production easily doubled, from about 12%/year in 2005 to the Citi Research estimate of 24%/year in 2013. In turn, this would imply that the annual volume of gas lost to production declines rose from about 2.2 TCF/year in 2005 to 5.8 TCF/year in 2013. To put 5.8 TCF in perspective, 2012 dry natgas production from Canada was 5.1 TCF.
I would also note that virtually all of the dry processed US natgas production put on line since late 2011 has only served to offset declines from existing production, keeping us on a production plateau of about 66 BCF/day. As noted above, given the apparent revisions to prior estimates (and given some very large regional declines in production, e.g., Louisiana and the Gulf of Mexico), it’s entirely possible that 2013 and 2014 dry processed natgas production will be below the 2012 production rate.
Are you saying that U.S. natgas marketed production, as previously linked, will be materially less than 25.6 TCF in 2014? If so, how much on a volume basis?
I will repeat this exercise annually, if you are insistent.
marmico,
I was going by marketed production, but as Jeff pointed out, it has NGLS in it. Dry gas production in the U.S. increased from 24.05 Tcf in 2012 to 24.28 Tcf in 2013.
This was a paltry 0.8% increase YOY. This is by far the lowest annual percentage increase since 2005. We had a 7.8% increase in 2011 and 4.8% increase in 2012.
I believe 2014 Dry gas production will be less than 2013…. probably the year the U.S. peaks in natural gas production.
steve
Lotsa vacant houses out there. Consumption might be down — though I had it pointed out to me the other day that to prevent pipes freezing and water damage, even vacant houses have to be heated.
Given how hard it is to export gas, looking at volumes only doesn’t tell you much. There’s nowhere for the extra gas to go, so you can’t just track it like how you track the Bakken. What is happening is that Marcellus shale gas is essentially displacing conventional US and Canadian gas.
Watching US price is more relevant to judging the sustainability of shale gas. [Yes, volume matters too, somewhat, just not as much as price.] Based on the long term futures being under 5$, looks pretty solid.
Wait. What? I thought the Fed is printing $55 billion every month. How can the price of anything mean anything?
I the world that I live in, the price is very meaningful. If I pay $10 for something rather than $20 then the price is $10 less. Perhaps you live in a place where there are no prices, or you just don’t pay attention, perhaps you are wealthy and prices are unimportant.
I don’t look for a lot of meaning in prices. If a barrel of oil costs $400 nominal US$ tomorrow, that would be expensive, if it were $25/barrel it would be cheap.
A country road I used to drive for many years is now flooded by water and is marshland. What is now cattails and tall grasses was once a good pasture with a small creek running through it.
It is now impassable.
The weather was so inclement this past winter, temperatures so cold, the frost line was at 7 feet and water froze in a bucket in my basement at my farmhouse.
Never have I seen that happen in all of my born days.
I sold my Volvo in 1973 and swore I would walk, bike, or make good use of public transportation. But that was a long time ago and reality set in, work became a priority, business came first, so a vehicle was needed.
I finally broke down and bought a new vehicle instead of a used vehicle that was always going to break down, so it is a wash in terms of dollars, imo.
Increased my consumption several fold since the days of no car. Everything changes. Within the next year, the hope is to reduce the gasoline use by some 80 percent. I will use it once per week instead of everyday. The only new car I ever owned and I won’t sell because you can’t make me. Much thought in the choice.
A lot of work is being done to pump out 1/100th of the world’s daily consumption of oil. The Bakken will have to be drilled to full functional capacity now, a completed oil megafield, the investment is too great to make it go any other way.
No point in inconveniencing yourself to save oil so some Chinese person can burn it.
It looks as if the Koch brothers have had their eye on peak oil websites and got into the tar sands in a very big way.
http://www.washingtonpost.com/blogs/wonkblog/wp/2014/03/20/the-biggest-land-owner-in-canadas-oil-sands-isnt-exxon-mobil-or-conoco-phillips-its-the-koch-brothers/
Hi Ron,
Go to RRC website here:
http://webapps.rrc.state.tx.us/PDQ/home.do;jsessionid=J4ZQTr7DWT1wpc0nGtz22tRsRRbYnJZL9cnwLws61r45tmstCWgT!-2136608688
then click on general production query and under district put statewide:
Thanks a million Dennis, this will be a great help.
No Problem.
Dennis:
Please consider my process when you do your analysis. When you compare the data that Dennis supplied you and that I also used, please do a November comparison of RRC data with EIA data, use November 2013 and not December as December is not final. RRC is recommending a 15.4% addition for December which may or may not yield the actual final result. November RRC data appears final as I understand it. Also, the RRC rep said to add condensate (column 4) #’s to oil #’s (column 1). You will see a huge disparity. Why doesn’t the Texas RRC challenge the EIA’s Texas data?
Hi Coolreit,
The only RRC Data which is final is data which is 18 months old or older.
See my posts at Ron’s Texas Data and Eagle Ford post.
So your assumption that the Nov 2013 data is final is incorrect, you have to go back to June or July 2012 to get RRC data that will remain unchanged, it takes that long for all the RRC data to come in and get finalized, maybe they still use punch cards, I have no idea why North Dakota NDIC does such a good job relative to the RRC of TX. I have data downloaded from Dec 2012 and 6 other months up to March 2014 (I didn’t do it every month).
Canadian natural gas storage from cga.ca/resources/gas-stats/ (pdf of graph)
March has so far been cold and it looks like it will stay that way.
Here’s another take on withdrawals from underground storage in Canada from energyevidence.blogspot.ca
Gas stats are here.
It’ll be enough work for Canadian production to get Canadian underground storage back up let alone export southward for U.S. underground storage injections. And there is that increasing industrial demand in Alberta for melting bitumen out of the tar sands.
Welcome to your low EROI world!
And at least 2012, Canada showed a multiyear decline in production.
The Climate Reanalyzer is a pretty fun tool. You can loop through the Northern Hemisphere temperature anomaly for the next seven days. (choose Northern Hemisphere and Temperature anomaly at the top)
Topsy-turvy!
The latest AAR weekly rail freight report file:///mnt/sda3/Investments/railfreight/2014-03-20-railtraffic.pdf confirms the recent trend for much lower oil rail freight – year over year just 2,9% higher. This implies a Bakken production of a little bit over 700 000 barrels per day which would be a substantial fall from the end of 2013. So far there has been a close correlation between rail freight and oil production. In 2013 rail freight increased from 25 m bbl to 42 m bbl per month or 1m bbl per day to roughly 1,5 m bbl per day (8500 weekly carloads versus 14000 weekly carloads in 2013). This was basically inline with official data for oil production growth. Unless there has been a substantial shift from rail freight to pipeline transport there should be a big surprise coming for February/March oil production data. The Texas Railroad Commission report confirms this trend as well. Although oil production has been up by 100 m bbl for the whole year 2013, the production for the month December actually declined year over year.
Hi all,
More data comparing monthly Crude plus condensate data in kb/d from RRC (Railroad Commission of Texas) and the EIA (US Energy Information Administration) from March 2013 and March 2014
The Data below can be downloaded (open document spreadsheet) at the link below:
https://drive.google.com/file/d/0B4nArV09d398YW9sRThscDY0ejA/edit?usp=sharing
I forgot the Chart for the Data above see below.
What I take from this is that RRC estimates from 18 months ago and earlier are pretty good, but the most recent data (past 17 months) gets progressively worse and the EIA estimates (though maybe 2 % high) are much better estimates.
Perhaps a rough rule of thumb would be 98% of the EIA estimate for Texas C+C (for the most recent 18 months) will be pretty close to the actual output. Prior to that an average of the EIA and RRC values would work pretty well.
The EIA video I linked to from the director, he mentions the Texas numbers in passing. Says their reports are always low because of the reporting lag by all the little producers. Get adjusted for 2 years. So, they model it until they get the final numbers.
Hi Nony,
That makes sense, there are a lot of Mom and Pop oil operations (old stripper wells) in Texas, likely much more than North Dakota.
From what I have read, the EIA takes a sample of production data from the largest producers (covering a large percentage of total data, maybe 70%, a guess on my part), then if these producers had produced x% of total output in the past, the EIA assumes they continue to provide x% of the total at present and they scale up their estimate appropriately.
Currently (since March 2013) they seem to be doing things differently. This may be because the EIA budget has been slashed and so they seem to just be guessing that output is increasing at about 50 MMd/d each month.
As Ron has pointed out, at some point the EIA will adjust their data to match the Texas data and the EIA estimates might be pretty far off, we are really in the dark on this, hopefully someone at the EIA will look at the sampling data and correct the model.
The Petroleum Supply Annual is released in August, perhaps the preparation of that report results in better numbers.
http://www.eia.gov/todayinenergy/detail.cfm?id=8290
The article linked above talks about EIA revision policy as of Oct 2012.
I suspect that budget cuts may have changed this policy from monthly to annual revisions to reduce man-hours.
I am personally convinced that peak oil is either here or no more a couple more years away although a series of political miracles in places like Iraq and Venezeula might result in couple more years grace beyond that time frame.
And once it is here then the question of price moves to the top of the list.I personally cannot bring myself to believe that a shrinking supply will cause such a hard crash that the price will come down except in the short term. I remain convinced that the price trend long term is up with short term meaning maybe a year or two at the most of falling prices in the event of severe recession.
When this happens the switch is going to be on in a big way to electric cars but the manufacturers are going to be caught short of capacity to build them as fast as they can be sold because they are planning on gradually ramping up sales a few percent a year.
This is not the forum for it but there will be some small companies making a killing by making critical electric car parts.
I wonder who the big winners will be.
And the stock of companies mostly engaged in wind power will probably get a big boost too since the public will finally have to face up to the finite nature of fossil fuels.
It looks as if wind has finally made it to the top of the price parity mountain.
http://www.nytimes.com/2014/03/21/business/energy-environment/wind-industrys-new-technologies-are-helping-it-compete-on-price.html?_r=0
Now if the oil supply declines slowly …. there will be time for considerable adaption.People can pay off their F250 beer haulers and start making payments on Volts and Leafs.But I am still glad I won’t have any money in the stock market.
Hi Old Farmer Mac,
I agree.
From 1998 to 2013 real oil prices rose an average of about 12% annually (though they bounced above and below this trendline.) If we assume real oil prices continue to increase, but at half this rate we get the chart below.
Many argue that such a rise in prices will be the end of growth. If C+C either remains on plateau (by increasing extraction rates to Norwegian levels worldwide) or declines slowly, then we will see a slowdown in growth, but it might not stop altogether. The transition you speak of (to electic transport both private and public and to wind and solar power) will require labor and capital to move to these sectors and may entail some growth. It will be neither smooth or easy, it will be difficult and maybe impossible, but I remain cautiously optimistic that a transition to something better than the Mad Max scenario that many envision is possible. It will not be business as usual it will be a new reality.
Is there an adjustment for global quantitative easing in that currency denomination?
My chart showing the GNE/CNI Ratio* versus total global public debt for 2002 to 2012. My premise is that QE in the developed net oil importing countries is at least partially a response to the decline in the percentage of GNE available to importers other than China & India.
*GNE = Combined Net Exports of oil from the (2005) top 33 net exporters (EIA)
CNI = Combined Net Imports into China & India
When governments issue debt and interest rates are low, it is not really a big problem. It is only a problem if too much debt is issued. When the economy is doing badly, governments run deficits, and that is a good thing. Austerity policies in the face of an economic down turn are counter productive. As far as the United States Federal Debt, it is projected to rise slowly after decreasing slightly over the next few years, see chart below from the CBO.
http://www.cbo.gov/publication/45010
Hi Watcher,
No it is based on the CPI. For those that trust shadowstats I used the inflation index from shadow stats to find real oil prices in 2012$ and compared to real oil prices using the CPI as an inflation index. See chart below. It may just be me, but I don’t think the real oil price in 1981 was $350/barrel in 2012$.
For a different take on inflation see the billion prices project (link below),
which agrees pretty well with the CPI.
http://bpp.mit.edu/usa/
The billion prices project gives us about 1.7 % annual inflation over the past 5.5 years and the CPI about 1.2% over the same period. Shadowstats 1980 based inflation shows about 10% inflation over this period. I trust the data out of MIT.
Once at the destination, the student has to consider the best way of travelling
around. As this kind of, it may be wise to avoid sun exposure among 11 AM to 3 PM,
otherwise use sun protection. Taking a campervan rental as your transportation for your roadtrip holds
within a promise to be free from limiting itineraries and a chance to follow your dreams.
Hello would you mind letting me know wich webhost you’re working with?
I’ve loaded your blog iin 3 completely different browwsers and I must say this
blog loads a lot quicker then most. Can you suggest a good hosting provider at a reasonable price?
Thank you, I appreciate it!