North Dakota just released their production numbers for the Bakken as well as for all North Dakota
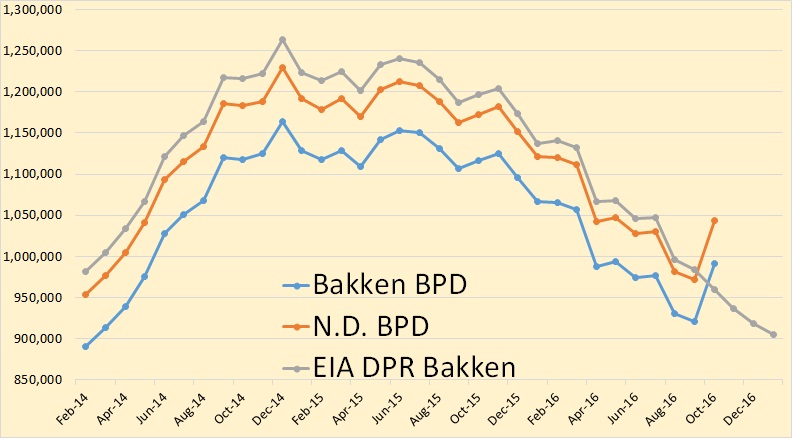
The numbers are shocking. The Bakken is up 70,798 bpd to 991,722 bpd and all North Dakota was up 71,447 bpd to 1,043,207 bpd. The EIA’s drilling productivity report really missed the ball on this one.
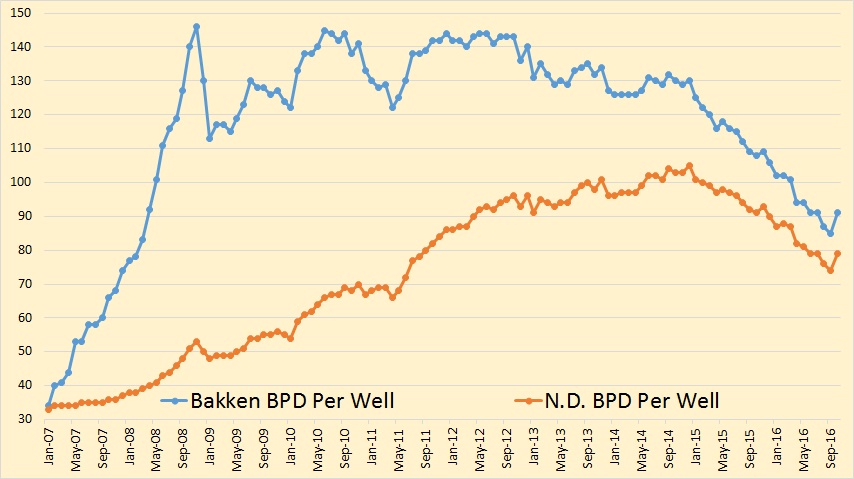
Bakken bpd per well was up 6 to 91 while North Dakota bpd per well was up 5 to 79.
From the Director’s Cut
Oil Production
September 29,152,805 barrels = 971,760 barrels/day
October 32,339,403 barrels = 1,043,207 barrels/day
(preliminary)(all-time high was Dec 2014 at 1,227,483 barrels/day
Gas Production
September 48,356,772 MCF = 1,611,892 MCF/day
October 53,180,102 MCF = 1,715,487 MCF/day (preliminary)( NEW all-time high )
Producing Wells
September 13,378
October 13,457 (preliminary)(NEW all-time high)
Permitting
September 63 drilling and 1 seismic
October 82 drilling and 1 seismic
November 76 drilling and 2 seismic (all time high was 370 in 10/2012)
ND Sweet Crude Price
September $32.98/barrel
October $39.31/barrel
November $34.58/barrel
Today $40.50/barrel (all-time high was $136.29 7/3/2008)
Rig Count
September 34
October 33
November 37
Today’s rig count is 40 (all-time high was 218 on 5/29/2012)
Comments: (Bold mine)
The drilling rig count decreased one from September to October, then increased three from October to November, and is currently up three from November to today. Operators are shifting from running the minimum number of rigs to incremental increases throughout 2017, as long as oil prices remain between $50/barrel and $60/barrel WTI.
The number of well completions dropped sharply from 73(final) in September to 45(preliminary) in October. Oil price weakness that is the primary reason for the slowdown is anticipated to last into the second quarter of 2017.
There was one significant precipitation event, eight days with wind speeds in excess of 35 mph (too high for completion work), and no days with temperatures below -10F.
Over 98% of drilling now targets the Bakken and Three Forks formations.
Estimated wells waiting on completion2 is 860, down one from the end of September to the end of October. Estimated inactive well count3 is 1,503, down nine from the end of September to the end of October.
Crude oil take away capacity remains dependent on rail deliveries to coastal refineries to remain adequate.
Low oil price associated with lifting of sanctions on Iran, a weak economy in China, and the Brexit are expected to lead to continued low drilling rig count. Utilization rate for rigs capable of 20,000+ feet is 25-30% and for shallow well rigs (7,000 feet or less) 1520%.
Okay, in September well completions were 73 and production fell by over 10,000 bpd. In October well completions fell by almost 40% to 45 while production increased by over 70,000 bpd. Would someone please explain how this is possible?
The following data from the EIA’s Drilling Productivity Report which came out Monday. The actual data is through September while their projections are through January 2017.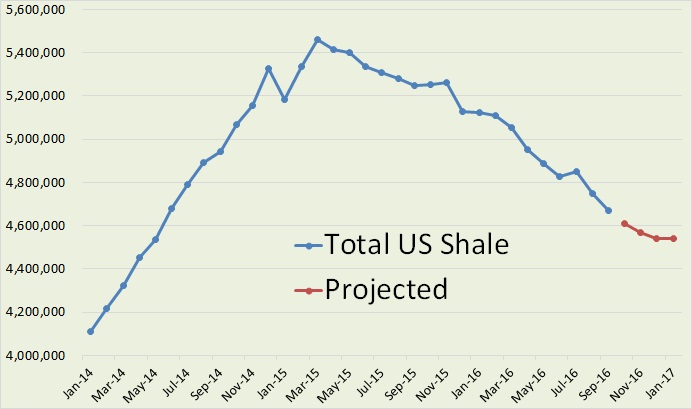
The EIA believes Total US Shale production will level out at about 4.54 million bpd in January. That will be down just over 900,000 bpd from its peak of 5.46 million bpd in March 2015.
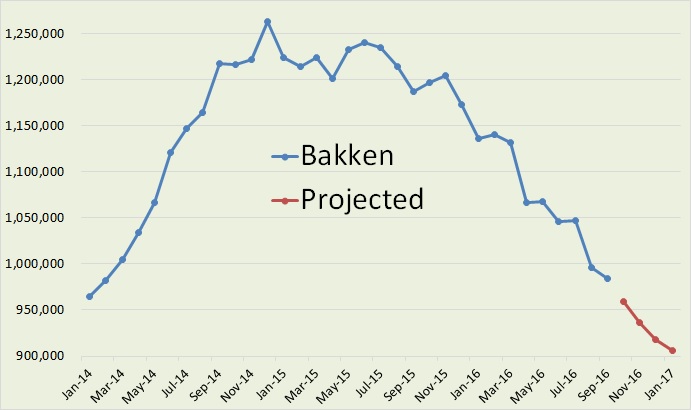
As you can see they missed the Bakken October production by a country mile.
The EIA counts the Bakken as all North Dakota plus the Bakken area of Montana. Though all North Dakota production is not all Bakken, it is all within the Bakken area. That is, conventional wells within the Bakken area is counted as Bakken production even though North Dakota separates the two.
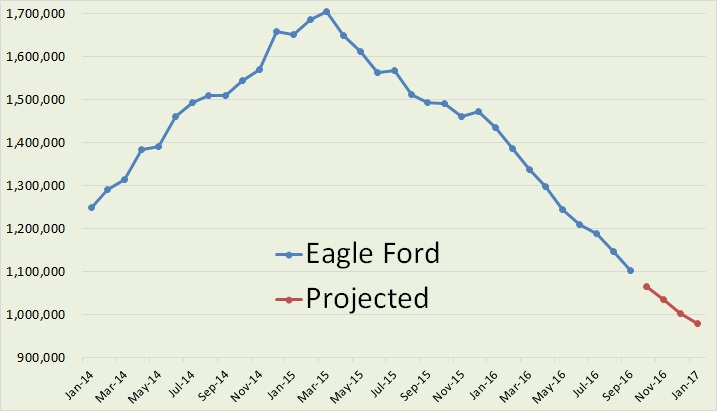
The big shale loser is Eagle Ford. The EIA says they will drop below one million bpd in January to about 980 thousand bpd. That, if correct, will put them down over 724 thousand bpd since the March 2014 peak.
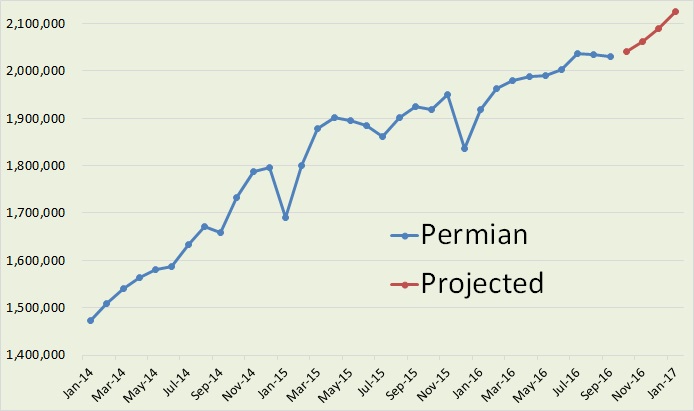
But the Permian saves the day as far as shale is concerned. The EIA has the Permian increasing by over 37 thousand barrels per day in January and up almost a quarter of a million barrels per day since total shale peaked in March 2015. Of course the EIA is counting all production within the Permian ares, conventional as well as shale production.
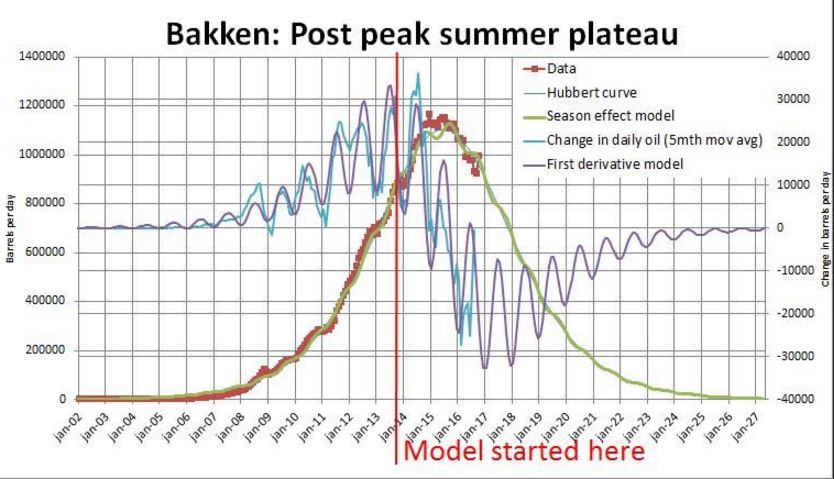
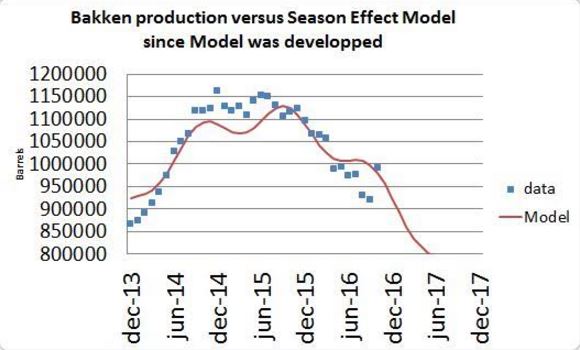
Bruno Verwimp just posted me the following two graphs. As you can see his latest data point, October, still falls on his predicted decline curve
193 responses to “Bakken Oil Production Up Over 70,000 BPD”
Are we 100% sure somebody did not screw up in mr. Helms department. The numbers seem bizzare
Could it be that shut-in wells were re-opened or that wells can be throttled back temporarily? In that case it wouldn’t count as a completion.
Dirty EIA
Sorry to post off this eyebrow raising topic, but BP just replied to me, after saying they don’t.
I inquired about KSA’s oil consumption data they published. Here is the reply:
Thank you for your email.
We’ve always had slightly different figures to the IEA (and particularly JODI) as we use different primary source information to them (and in the case of JODI, appear to cover more products). We can not comment on their data. But the change relative to the previous BP Statistical Review of World Energy 2015 concerns LPG/Petchems additions. Saudi Arabia has been ramping up its petrochemical facilities significantly in recent years and demand for petrochemical inputs – particularly LPG – has risen rapidly. Previously, some of this LPG demand was missing from our dataset, but we have now captured it and this additional demand accounts for the bulk of the upward revision you see in the tables this year.
Best regards
Leaving her name off. Economist was the title.
KSA listed 5% growth in consumption for 2015. She I think was focused on my noting they varied from IEA and JODI, and was pointing out they capture things the others don’t, but my perspective was not particularly that, but merely the slope of the black line on mazama. They may have captured more last year, but that slope has been in place for years and years. KSA is burning a LOT of per capita oil.
WTF! Nothing against you Watcher! But, on previous thread I posted that KSA cannot be consuming as much oil as stated unless their chemical plants/refineries are considered KSA consumption [knowing that much of the refinery/chemical plant output is exported]. Respondents posted that chemical plant/refinery exports were in an export number and NOT considered consumption. But, if I read your post correctly, BP attributes increased KSA consumption to demand for petrochemical inputs.
A multi-trillion $ world-wide industry and “apparently” there is no consensus on what the hell is being reported. Caution – I may be senile and do not understand.
I think her focus is the feedstock for those exports. It is the feedstock that is consumption, not what ships. Might even be like refinery gain, where what comes out is more barrels than what goes in. That would thoroughly confuse your point.
Also, she seemed to be thinking in terms of revisions in the most recent year, versus the long term slope of the curve.
Regardless of all this, that per capita number is real. They are burning/using oil like you can’t believe, and more every year. Population 31 million and about to be the #4 consumer of the world.
One of the reasons peak oil export happened in 2005.
“Regardless of all this, that per capita number is real. They are burning/using oil like you can’t believe, and more every year. Population 31 million and about to be the #4 consumer of the world.”
The real tragedy is that a lot oil is used for the generation of electricity for air conditioning. This could easily be substituted with PV at lower costs.
With an oil price of more than 40 USD/barrel it makes much more sense for SA to build PV and export the oil instead of burning it for electricty.
When the 73 wells were fractured in September, nearby wells were shut in, possibly on both sides and possibly for several weeks duration.
The lower number for October would not have ‘closed off’ as many nearby wells as Sept’s 73.
Additionally, the new September wells would have high output.
Final point, the added formation pressure from the new fracs would significantly enhance output from the older nearby wells, as I bet Enno’s and Freddie’s work would show.
That alleged effect would have been seen July to August and August to September. It wasn’t. Nothing magical about September to October.
Watcher
Good point, which is why the locations of the wells matter.
Care to spend s couple hours tracking all this down?
Final point, the added formation pressure from the new fracs would significantly enhance output from the older nearby wells,…
I don’t see how this is possible unless there was some of the fractures penetrated the older wells. I was under the impression that this was something they wanted to avoid.
Understand that the Bakken is not a reservoir that you can pressurize like a conventional reservoir. The rock is just too tight for that.
This is one of the few times I must agree with Watcher. 😉
Just nosed around for any trucker strikes or road blockages previous month(s).
Nada.
Mr. Patterson
This is a contentious issue that almost no operator seems to discuss.
In fact, the nearby wells almost certainly will show a spike in produced water as well as oil and gas.
This spike tapers off after 6/8 months or so on the 100 wells that I’ve checked and seen this effect.
Tonight, I’d be more than happy to get into this using the Gis map and production history if you, or anyone, posts a permit # from any new October well.
I’ll post my findings tonight or tomorrow.
coffee. Maybe we have discussed this before, I cannot remember.
Could at least part of the halo effect be that the surrounding wells are shut in for 60-90 days, and the well bores of the shut in wells are merely filling up.
We have to shut in low volume wells in the winter. I am thinking of a one well lease right now that will be one we shut in soon.
Currently the well is producing 6″ per week in a 115 barrel tank, or 4.5 BO per week. We will likely shut it in for 2-3 months. When we reactivate it in late Feb., early March, it will make 6-12″ in first 24 hours, and after about a week or so taper off to 12-14″ per week, then gradually drop to the present level. It is still in primary production, makes about 3 BW per day.
So, is what I have described really all the halo effect is?
SS
Yes, to an extent the shutting in must contribute some, but there have been way too many wells that were only offline 3/4 weeks and then came back online with a doubling/quadrupling output that stayed elevated above pre-shutin levels for almost a year.
The biggest “tell” to me – and maybe you can weigh in on this – is the usually huge increase in produced water.
Seems the produced water regularly goes from 20/40 bbld to 250/300. or some such ridiculous figure.
Normal shut in (3 to 6 weeks) wouldn’t do that, right? Especially if there were minimal water for years prior.
Someday there will public discussion of this by some operators.
Just mighty curious that no one outside of Bruce Oksol talks much about it.
Maybe some of the new well fractures work their way towards the pre-existing fractures. The pre-existing fractures create a low pressure environment, this in turn allows the rock to expand a tiny amount, which in turn lowers the stress field. And fracture tips usually head towards the lower stress they can reach. Even if the connection is limited, this allows the fracture fluids to flow into the older well. It seems like a reasonable outcome.
Fernando
That is almost the exact description used by a frac engineer who posted a comment on a Seeking Alpha article last year.
He also did not elaborate as he said his company was treating the entire topic with high confidentiality as no one yet clearly understood what was happening.
I agree with Coffeeguyzz. There are many examples of this. Note that the wells are close enough for comunication in many places. Some study showed that comunication start when they get closer that 2000 feet (http://info.drillinginfo.com/well-spacing-bakken-shale-oil/). So really it should be expected. I think most cases where old wells has got a boost in production is because of this phenomena.
It is interesting, how the wells interference could affect ultimate recovery in particular parts of the shale plays.
Good call Coffee. If every existing well produced the same amount as the previous month, and if every additional well produced 896 barrels per day [which would be 1,792 barrels per day, assuming each had an average of 15 days production], that easily explains everything.
What is the API of Bakken oil and where is it actually used? How much for which US refineries? How much for export, if any? How much into inventories?
The media assume US shale oil can make good OPEC production cuts.
9/12/2016
OPEC’s 2017 production cuts: a confusing numbers game (part 2)
http://crudeoilpeak.info/opecs-2017-production-cuts-a-confusing-numbers-game-part-2
The official Bakken API is suspiciously 39, and they bristle at the word suspiciously. 39 is WTI.
A partial explanation for the Bakken variation is in four sections operated by Whiting in the Twin Valley Field. Sections 3,4, 9 & 10. The wells were spud in 3 & 4, and the laterals were drilled south into Sections 9 & 10 based on my review of the map.
Whiting completed 13 wells in these two sections, and therefore had to shut in the 16 active wells already there.
In August, all wells were completely shut in, production was 0 BOPD
In late September, some of the wells were activated, production was 3,359 BOPD
In October, all 29 wells were active, production was 20,361 BOPD.
This is an example of an operator “pounding” a sweet spot. 29 wells crammed into Sections 3, 4, 9 & 10. I am assuming one half of the new wells are TFS and one half (approximately) are Middle Bakken, as that is the mix for the original 16 wells.
Furthermore, this area is where Whiting did the “monster” fracs, I think one earlier was over 100 stages. So, I suspect these wells are not only in a “sweet spot” but also will likely decline at an even faster rate due to completion technique. Admittedly, these are still very productive wells, likely among the best acreage Whiting has left in the Bakken. The cumulatives for the 16 original wells are very impressive.
I assume maybe all 13 new wells are shown as being completed in September, even though the first full month’s production was in October.
I figure the 13 new wells cost Whiting and their JV partner (assuming they have one on this, which I think they do) around $100 million. Add to that probably about $150 million for the first 16 wells. So, would not surprise me if Whiting and partners have around $1/4 billion sunk into this particular 2,560 acres. Folks, that is $100,000 per acre.
I suppose there could be some other areas where similar things happened, so the sudden spike?
One thing very interesting, they had to shut in all 16 of the “older” wells when they fraced the “new” wells. So, clearly, they crammed a lot of wells together in tight spacing.
Finally, I made light of the $100,000 per acre spent to drill, complete and equip these wells. I presume Whiting paid some amount for the land, I am not including that. Then keep in mind, in the Permian, prices of $40,000-$60,000 per acre for the LAND ONLY. And then, they say in the Permian they are going to drill up to 8 different zones. Easy to see getting over $1/2 million per acre sunk into something of that nature.
My calculator may not have enough zero’s to keep track of the shale guys! LOL!!
Shallow
There is a fault in that area that makes TF1 and TF2 very productive.
They may have a few wells targeting TF3 by now. Will check
Nice detective work Shallow.
It’s significant that 70,000 barrels of oil is significant.
Can’t wait until 10,000 barrels is significant.
Heh, that’s quite a good point, isn’t it.
70,000 barrels PER DAY is >7% of total Bakken ND production.
And this is a very significant monthly increase.
This was actually the biggest monthly increase in ND Bakken’s history
Monthly change in ND Bakken oil production (kb/d)
Hi,
Yes the data looks really strange this month. I have the number of new wells put on production at 53 (vertical + horizontal) in October compared to 73 in September. So why did production increase that much? The initial production from the October wells were very high and the September wells produced quite a lot too in October. If we look at the legacy production in the graph bellow we can see that production actually increased for all years except 2007, 2010 and 2013. For 2014-2016 the increase was quite large and for those wells we would have instead expected high declines considering how new they are. So it appears they are pumping like crazy. The oil price increased quite a lot in October. So it would make sense that they took the opportunity to increase production as it could be temporary. Note that most of the Twin Valley wells Shallow sand talked about are still confidential and not yet included in my data.
But then gas to oil ratio must have increased quite a lot too? Lets see..
So here comes the really strange part. GOR actually decreased for all years and quite a lot too in many cases. How can this be? If they pump like crazy then shouldn´t the GOR go up?
Lets have a look at water cut too…
… Think I spotted a couple of angels thereabouts.
In this case I suspect the oil was being held in tankage within the leases. Do they have enough storage to hold an extra 2 million barrels? They may have been watching the OPEC meeting gyrations and simply delayed sales for 30-60 days.
The other option is that a significant amount of LPG is being metered as oil because the weather is colder. Did the sales API increase?
Fernando
The production/storage numbers are available for each well on a monthly basis, but it would be pretty laborious to start tracking if not already incorporated into Freddie’s (or Enno’s) models.
The last year or so, as operators continued their infrastructure build out, large Central Tank Batteries were erected that were fed from numerous pads in the areas, but – with 1 MMbbld production – I don’t know how much was held back from sales.
As per API number, I’ve only encountered that on completion forms, but it is obviously obtainable.
Just wouldn’t know where to track it down.
I kinda think this whole thing stems from localized increase in formation pressure stemming from massive fracturing from all the new wells.
Pretty common to use quarter million barrels of water per frac nowadays.
The data contains both production and runs. So I think unless companies are not reporting correctly, then production is production.
Here you can see the water cut. So now it start to make a bit more sense at least. Water cut increased for all years, but especially for 2008 and 2009. So refracking and/or increased procuction because of newly fracked closeby wells could explain some of it. But it´s hard to see that this could explain that most years saw an increase in production and especially the 2014-2016 wells.
Some theories. Could it be that some companies are cheating with the flared gas reporting? I found this article:
http://www.eia.gov/todayinenergy/detail.php?id=23752
So new targets came during 2016. This happens at the same time as many companies have economic difficulties. If we look at the GOR graph again we can see that the GOR increase started to level out and then decline during 2016…
Another theory. I´m not a geologist, but perhaps some areas are starting to run out of gas? The oil and gas volume that can be extracted is less than in a conventional well. GOR has increased very fast and there is only a certain volume of gas that can be extracted. If that is the case then the pressure must have decreased a lot and that would mean bad news for future production.
That’s a possibility, but when GOR starts to drop we also see a drop in oil (because pressure drops very fast).
Yes that sounds reasonable. Maybe it could be temporarily mitigated by pumping harder. But this has been going on for some months. So I´m leaning towards the cheating theory.
Given the record of fracking companies of scamming landowners, I’d expect them to be cheating on the gas flaring.
I also just published my take on the data, here.
Enno,
Thanks for the update.
Some observations based on your data for the Bakken wells that started production in 2016.
• There are huge variations in monthly incremental production from the wells started in 2016 (from 5-7 kb/d in April and August to 65 kb/d in October 2016.
• Based on your data, oil production from the wells started in 2016 increased by 64.7 kb/d in October.
Meanwhile, total Bakken ND oil production increased by 70.8 kb/d. That means that the wells started in previous years (that theoretically are in decline) have added >6 kb/d to Bakken’s output in October.
Could it be due to restart of temporarily shut-in wells; massive refracs or something else?
• In your production chart you also show the number of producing wells. I have calculated monthly increases in this number, which exactly match your data for the wells that started production (“first flow”). Does that mean that all wells started in 2016 remain active and none was shut-in, at least temporarily?
• It is interesting that your numbers for “first flow” wells are very close to NDIC’s numbers for well completions (from Director’s Cut). Note that NDIC’s number for October is preliminary and their preliminary data is always lower than the final number (by 1 to 7 wells).
Bakken wells with first production in 2016
Sources: Enno Peters’ shaleprofile.com; NDIC data for well completions.
Enno and AlexS. It appears to me that monthly production for almost every year was higher in October than in September per Enno’s data.
I had commented earlier that a number of wells were being produced just a few days per month in recent months?
Can either of you tell if that changed, did average production days per well increase in October?
Based on Verwimp’s curve this month is back on track and it was the previous two or three month’s data that was off.
The ND DMR don’t give out the production figures by well for August and September for any year – I don’t know why, maybe vacations, but whatever the reason it may also mean overall production figures are less accurate those months. Also I don’t know, therefore, how Enno gets his numbers.
I took the “oil” numbers and the “run” (sold) numbers for June, July and October this year. For June and July there was a 2.3 and 2.4% increase, for October it was 6.2% (oil fell but run increased overall over the 5 months). This is something to do with how confidential (tight hole) wells are treated – I think Enno is the only one outside the DMR who might know the secrets.
I don’t know what all that means exactly but I think looking for big technology or geology explanations might be premature. The Verwimp graph would predict a big weather related drop for November through January, and it has been extremely cold there for a few days now. Let’s see how that plays out.
Possibly related (or not – maybe to do with the pipeline demos.), new permit issuing has completely stopped for the past week. I expect permits to run down as prospective drill sites get fewer (and that has been happening slowly over the past 6 to 12 months – both fewer numbers issued and fewer overall open licences as cancellations and spuds exceed new permits), but I don’t think it would drop to zero just like that. Maybe the drillers are waiting for Trump rescind all such rules so they can go and drill wherever they feel like at any time.
“Based on Verwimp’s curve this month is back on track and it was the previous two or three month’s data that was off.”
I like the seasonal model provided by Verwimp. However, I don’t have a grain of doubt that his overall model will turn out to be completely wrong, in the coming years. This should be obvious by the end of next year, when it will be at least 100 kbo/day off. I’m open for any bets on this belief 🙂
“The ND DMR don’t give out the production figures by well for August and September for any year”
All states that I cover provide individual well production numbers on a regular basis, except Texas. Getting individual well production data is therefore not difficult at all, and I don’t know what you mean with the above. ND does so both in pdf, and Excel, here.
It also provides annual reports, with detailed well production info for all wells in the past years (per month, per well).
The site you reference gives me “not available” for August and September, both pdf and Excel, and is the same for all years.
George,
Very weird. I suspect a caching problem in your browser. Can you try on another device? I am pretty sure everyone else will see that only Nov and Dec 2016 are not available, while the other months are.
Hi Enno,
“This should be obvious by the end of next year, when it will be at least 100 kbo/day off.”
If 3 years ago someone out of the future would have said to me: “By the end of 2016 your model is 100kbo/d off.” I would have said: “O.K. Close enough.”
In a certain sense much to my own surprise for 35 months now the model still stands. Maximum deviation in plus: around 7%. Maximum deviation in minus: around 7%. Mean deviation: a whopping 0%. 🙂 (0.3% in fact.)
But, no. In case you were pointing at me to take the bet: Thanks but no thanks! As I said many times before: there will be a day, and that day might be when the next datapoint comes out, that my model turns invalid/obsolete. But until now, month after month, my model is more or less spot on, so the basic thoughts on which the model was built might give explanations on what is happening.
In the case of last datapoint: the biggest gain Bakken ever experienced on a monthly basis. Strange. But my model says this month is more normal than the previous two. If we assume that makes sense in the real world: Enno, is it possible that, when a lot of rigs operate, the completion dates of all wells are randomly (and equally) spread over the days of a month (and a year), but, if only 30 rigs operate, the completion dates may, by chance, more or less coincide within the first week of a month (October) and therefore generate a peak in the production after a short period of lower production?
Shallow,
As noted in my post, indeed the number of productive days raised significantly in October. On average, wells had 1.2 days less downtime, so that should by itself already lead to an increase in production of about 4% (1.2 / 28) .
Alex,
“Could it be due to restart of temporarily shut-in wells; massive refracs or something else?”
I made a series of observations that I think further explains the increase in production (Shallow Sand & Coffeeguy were already in the right direction). You’ll find them here.
“Does that mean that all wells started in 2016 remain active and none was shut-in, at least temporarily?”
In the “Total production” overview on my site, the well numbers shown are for all wells that have already started production, and even if they didn’t produce in a certain months. That is, also inactive wells are included in these numbers. For a closer look at the status of all wells over time, I recommend the “Well status” overview; you can filter also on specific statusses, e.g. “first flow” to see how many wells first started flowing in a month.
“Note that NDIC’s number for October is preliminary and their preliminary data is always lower than the final number (by 1 to 7 wells).”
I’ve found that this preliminary number from the NDIC is not very accurate. I don’t look at the completion date of wells, but only at the month that a well has its first oil or gas production reported (“first flow”). Of course, this should roughly match the actual completion numbers, which it does. Note that I only include horizontal wells, which causes a very small difference with NDIC numbers.
Thanks Enno,
So this record monthly growth was due to a combination of several one-off factors.
“In the “Total production” overview on my site, the well numbers shown are for all wells that have already started production, and even if they didn’t produce in a certain months. That is, also inactive wells are included in these numbers. For a closer look at the status of all wells over time, I recommend the “Well status” overview; you can filter also on specific statusses, e.g. “first flow” to see how many wells first started flowing in a month.”
What I have noticed is that monthly change in all wells from the “Total production” overview = the number of “first flow wells” from the “Well status” overview.
That is correct Alex, those numbers should always match.
Hi Enno,
Thanks. So the Twin Valley wells are responsible for about 20 kb/d of the increase, and less down time per flowing well (1.2 days less down time), which accounts for about 35 kb/d, also CLR wells contributed about a 10 kb/d increase so these three observations account for about 65 kb/d of the 70 kb/d increase or roughly 93% of the anomoly.
Very nice work!
A lot of fiscal years end Oct 31. Maybe this is all NoDak crapola and nothing to do with geology — especially given Freddy says this was happening with all year wells, presumably flowing all over the place and nowhere near a new frack.
A Precarious State of Affairs
Oil: Oil is an amazing substance not just for what it does, but for the fact that there really isn’t anything else like it. Can you think of anything else that packs tons of energy in a small volume, stays liquid at room temperature, not volatile, and be used in almost everything we have today? In fact, unless you’re sitting in the middle of nowhere odds are that you can look in any direction and see a product made from oil. Plastics, paints, resins, and many more all come from this nonrenewable resource; it’s no stretch of the imagination to say that oil is the center of our very civilization. I’m sure a lot of users here have heard about ‘Peak Oil’ which to most translates ‘we’re running out.’ This is not case; in fact I don’t think we could exhaust our supplies if we tried. Peak oil is about oil either being too expensive to extract, or the EORI being so low that there’s no point. What happened in the United States in the 1970s provides a great example of what I’m talking about. When oil was first being harvested and utilized the EORI was about 100:1, so that means for every hundred barrels of oil they extracted, the cost was 1 barrel (or the equivalent). As oil was harvested a hard ceiling was hit where demand was in place production couldn’t be scaled up to meet it, this lead to shortages and panics. If you look at a graph of the output of an oil well across its entire lifespan the peak occurs at the center. See below from The Economist:
Great article, this is just a tiny portion of it. You should read it, especially the part on “renewables”.
lol: “unless you commute to work in a nuclear submarine”
Most of the renewables and nuclear technologies are no substitutes to oil. They are products of oil.
That statement is silliness. You could just as well claim that all oil technologies are the product of coal, or that all coal technologies are the product of hydropower, and you’d be equally correct. It’s not a useful thing to say and it’s misleading.
There was massive effort made to “close the nuclear cycle” so that nuclear stuff could be produced with nuclear power. It failed; nuclear power is too damn expensive, and there are other problems. Once you include the cleanup, which seems to go on forever, the EROEI is less than 1. The fact that valuable minerals are rendered permanently unusable for a million years is particularly problematic.
By contrast, we’ve basically closed the cycle on solar power already, it’s just a matter of completing implementation. The solar panel factories don’t need petroleum. The battery factories don’t need petroleum. The machines used in them don’t need petroleum in their manufacture. The raw materials can be mined without petroleum using electric mining equipment (yes, it already exists, it’s for sale). The broken or obsolete batteries and solar panels can be recycled using electricity. The primary necessary input is, well, a lot of sunlight. (OK, we haven’t quite eliminated coal, which is used for making steel, from the supply chain. But oil is simply not necessary and can be eliminated from the supply chain easily.)
. The solar panel factories don’t need petroleum. The battery factories don’t need petroleum. The machines used in them don’t need petroleum in their manufacture.
I don’t believe that for one goddamn minute.
The raw materials can be mined without petroleum using electric mining equipment…
They can be mined using electric mining equipment… But at present they are not mined using only electrical equipment. And until they are your declaration rings hollow. Just a promise of what can be done with no evidence whatsoever.
You were saying….
Canada’s Goldcorp to make Borden an all-electric mine
http://www.mining.com/canadas-goldcorp-to-make-borden-an-all-electric-mine/
and…
http://www.directindustry.com/industrial-manufacturer/electric-mining-shovel-97858.html
also there are now electric mine haulage trucks run off trolley lines. A diesel engine turns on for complex turns and unloading operations off the trolley line, but at this point the hauling is done fully electric.
http://www.e-mj.com/features/617-electric-truck-haulage-in-north-america.html#.WFCv2LdSPow
So mining, of which much of the operation was already electric as is the crushing, processing and off-loading, is moving toward full electric use. It reduces pollution and has a cost savings.
Gone Fishing,
Electric equipment for under ground mines makes perfect sense. and relatively easy to install. Roof spaces makes logical place to carry catinery wires, as well as less of a problem with explosive gas levels. 2 of your references are for underground mines. Most mines are in remote areas, it appears the Bordon mine must be relatively close HV wires. Most are not, and even if they use underground electric equipment, it will most likely produced by diesel or Nat gas.
Oil and gas drilling equipment has been electric since the 60’s, but they are all powered by diesel or gas turbine engines.
Your third reference, is for an electric shovel for above ground work. This does seem to be powered by a HV power supply, but interesting when you look at the any of the photos in the cataloge or sales material, it is very hard to see any external cables, except one i see a insulated cable running across the ground. Surely this is not how they power the shovel with a 13kv supply! Also I thought cable controlled shovels went out of style in the 70’s. Of all the pictures of modern mines I have seen, all have hydraulic controlled shovels.
Nearly all mining trucks these days are electric driven, just powered by a diesel engine, just like a diesel electric locomotive. Any mine that runs from external power supply will be heavy backed up by fossil fuels. Mines are all 24/7 operations. They don’t stop when the sun goes down
Your arguments are like Swiss cheese, full of holes.
^ Which isn’t an argument. ^
All interesting points.
In surface mining there are about 30,000 mining trucks in the world, all diesel powered. Electric trolley assist exists but I think it is only actually used on a few hundred trucks if that. And it is assist, there are zero trucks that run full electric. The flexibility and cost savings of diesel are just too large even if in remote areas diesel is $5 or more a gallon….setting up electric wires in remote areas is also hard. There are conveyors which can be electric as well but the flexibility of trucks moving around is hard to beat.
In shovels mines still use the electricly power supplied rope shovels as well as the newer hydraulic excavators. However in most mines opened up in the 2000’s or 2010’s or even 1990’s the diesel powered hydraulic excavators win. This is often because new mines are more remote and would require a large (maybe even oil fired) electric power plant be built, and it is cheaper and more efficient to use the large diesels powering the machines.
Surface mines might in some theory be electrified but I would WAG that they would instead always be diesel even if you had to biodiesel it
So, Wake, you realize that you just made a price argument. You said that they’re using diesel powered hydraulic excavators instead of electric-powered excavators because *diesel is cheap*.
The obvious point is that if diesel gets more expensive, they will switch to the electric-powered excavators. Which already exist and can be bought off the shelf.
Now, at a site where everyone believes Peak Oil is happening, do you really think diesel will stay cheap forever? You can look at the price of biodiesel and see whether it’s cheaper to operate off electricity than biodiesel (spoiler: it is).
On underground mines we should separate coal vs other minerals.
In coal long wall mining is the most efficient method and t is an electric one
In hard rock mining as for copper or gold they somewhat surprisingly still use diesel powered low trucks for haulage very often, maybe the majority of the time. This necessitates huge fans and energy cost to ventilate, or at least accentuates that need
Maybe shifting to battery powered vehicles there is conceivable owing to the ventilation energy cost. Without knowing I would bet that there would be an oil fired plant outside the mine though since Natgas transport is so hard. Maybe coal but that is I think less flexible
Thanks Wake,
Nice to see someone around here talking sense, and feet base in reality. I was surprised rope shovels lasted so long, but you confirm by base point. Rope shovels are old tech.
*Sigh*
Yes, many mines are still using diesel backup. It takes a while to do the full conversion. The shift is happening, though, and it’s happening pretty fast.
One reason is that for remotely located mines, diesel must be *imported*, while the sunlight *arrives on its own*.
Here’s a copper mine which installed 10.6 MW of solar and 6 MW of batteries.
http://www.energy-storage.news/editors-blog/in-pictures-australian-copper-and-gold-mines-solar-diesel-storage-hybrid-pr
Yes, this is only 20% of the mine’s current energy usage. This is basically due to availability of capital. As they get more capital they’ll build more and displace the diesel completely. Technically speaking it’s completely straightfoward.
The solar panels get cheaper each year, the batteries get cheaper each year, the diesel tends to get more expensive each year. The financial decision is obvious.
“I don’t believe that for one goddamn minute.”
Is that a faith-based statement? Because I can lay out in detail exactly how to operate a factory without petroleum, and I can tell you which manufacturers are shifting over to do that, and what steps they’re taking to do so. But is evidence irrelevant to you? Perhaps it is.
I don’t argue with people making faith-based statements. It’s a waste of time.
“Most of the renewables and nuclear technologies are no substitutes to oil. They are products of oil.”
From a chemical point of view that is to at least 80% nonsense.
From a energitical point of view it is almost 100% nonsense. One has only to check energetical pay-back times and doubling times of REs.
“That statement is silliness. You could just as well claim that all oil technologies are the product of coal,…”
First: that statement is a knockdown argument, I know. I shouldn’t have used it here. It can serve as a wake-up call to the unknowing but it is way too oversimplified to use in a context with informed people.
Second: Oil technologies are a product of coal… If you look at things in the really long run, that statement might indeed be just as true! ‘We are all standing on the shoulders of giants.’ That is the way human civilisation has improved during centuries. Add the finiteness of fossil fuels (coal being the first one used on a significant scale) and think about these giants. They might have feet of clay.
https://en.wikipedia.org/wiki/Standing_on_the_shoulders_of_giants
Verwimp: Yes! Exactly! This is why I phrased it the way I did.
We did use hydro to bootstrap coal, and coal to bootstrap oil, and oil to bootstrap solar. This is certainly true.
But we aren’t using coal for oil production now. And we won’t have to use oil for solar production in the near future; this shift is already happening.
Until renewables meet all the criteria that oil meets described above they cannot be a viable replacement for oil.
The criteria listed are a long string of bogus strawmen!
Renewables are NOT now nor will they ever be a replacement for oil! Especially since oil is a FINITE nonrenewable resource.
Renewables are a completely different paradigm so arguing that they should function like, or be a substitute for oil just doesn’t make any sense.
The only question that makes any sense is whether or not renewables by themselves can sustain some form of advanced civilization for the majority of humanity. If perchance the answer is no, then we are all fucked anyway because oil, or any fossil fuels for that matter, can’t and won’t, be able to do the job long term, for lot’s of reasons, that I don’t feel are necessary to list, because the readership of this site already knows them quite well.
My personal opinion, is that the new world order coup being attempted by Trump, Rex Tillerson and Putin will fail miserably because they are trying to maintain a system that is simply no longer viable.
Furthermore, I have ample reason to believe that a completely different paradigm based exclusively on renewables is possible. Whether or not any of us actually sees it come to fruition, that I can’t say. Obviously the new triumvirate will do everything within their considerable reach to make sure it doesn’t happen. I say fuck them and the horses they are riding in on. They are simply on the wrong side of history!
“I have ample reason to believe that a completely different paradigm based exclusively on renewables is possible”
By 2100. Probably.
AlexS, It is possible today! At least from a purely physical and technological point of view. I have a hunch it will happen long before 2100, if it doesn’t, then it probably won’t matter anyway and this planet will be a very miserable place for humans to try to live on. If you want a preview of the misery you can visit Aleppo right now.
If you want the other side of the coin you can start here:
https://www.thinkdif.co/headliners/dif-live-launch
There are very few days left to see these talks from this year’s Disruptive Innovation Festival. You do need to open a free account.
There are about 370 sessions of examples of what the other paradigm might look like.
If you miss the deadline then go to:
https://www.ellenmacarthurfoundation.org/
“purely physical and technological point of view” means nothing without economic point of view.
Besides, it is not possible today even from “purely physical and technological point of view”, as there are areas where fossil fuels cannot be currently replaced by renewables.
Yes, and man will never fly. An oft quoted statement right before they did.
If you are talking lubricants, they can be synthesized from other feedstock. If you are talking jet planes, synthetic fuels can be made.
The most valuable features of fossil fuels are in the chemical and pharmaceutical industries. Burning them is a waste of good material.
As far as I know, aircrafts can use blends of biofuels with jet fuel, not pure biofuel.
https://www.washingtonpost.com/news/energy-environment/wp/2016/03/11/united-airlines-is-flying-on-biofuels-heres-why-thats-a-really-big-deal/?utm_term=.912b084c8446
And do you really think that producing huge amounts of biofuels is harmless for the environment (pesticides, etc.)?
And what area of land and volumes of water will be required to produce all those biofuels?
I said synthetic fuels not biofuels.
Anyway, jet aircraft are getting steadily more efficient and light aircraft can easily be made more efficient.
Sure, and we can send a manned mission to Mars by the year 1980… no, wait, make that 2000… Ok, fine, then how about 2024?
…Wait, what? I have no real say in the mission anyway?
…But yet you still want me to fund it?
List of Manned Mars Mission Plans
Just because a lot of things can be done, doesn’t necessarily mean they will be done, done on time, or done properly. In fact, given what we know, many likely won’t be.
See also.
means nothing without economic point of view.
Certainly not within the current economic paradigm, which is why I started my entire discussion by talking about paradigm change. Now if you can’t envision any other paradigm other than the one we have than I guess there is no point in having a discussion, is there?
Yes, nothing like a ‘new paradigm’ run by cartels, monopolies, corporatists, industrialists, and assorted elites. Deja-vu, only greener.
Who or what are the ‘global partners’ of the Ellen MacArthur Foundation, incidentally? Well, they include Unilever, Renault, Google, Nike and Philips.
Conflict-of-interest anyone? Renault? A car company? Nike? An outsourcing and (former?) sweatshop company? Google?…
Caelan who are these cartels and elites that you speak of?
Is this guy someone who strikes you as a member of either? Bren Smith. He works within the ideas of CE and is a participant in the Ellen McArthur Foundation.
http://greenwave.org/3d-ocean-farming/#
I could post a thousand other names. Not that it matters, because you are not the slightest bit interested in examining any facts. You seem to think that anything that even remotely resembles a business is automatically a bad thing.
Who or what are the ‘global partners’ of the Ellen MacArthur Foundation, incidentally? Well, they include Unilever, Renault, Google, Nike and Philips.
So what? I don’t see those corporations moving away from BAU as a bad thing.
Besides, it is not possible today even from “purely physical and technological point of view”, as there are areas where fossil fuels cannot be currently replaced by renewables.
Simply not true!
https://biomimicry.org/janine-benyus/
Again if you are incapable of thinking in a different paradigm then there is no point in having a discussion and we can all just accept Trump Tillerson and Putin’s world views. I for one am not willing to do that.
Maybe somebody can explain to you why grabbing your belt and pulling hard won’t get you off the ground.
Agreed, oil is very energy dense. But maybe approx 6,000 BOE (barrels oil equivalent) of solar energy per square mile per day might help?
Its winter, the sun comes out at 8 am, and it’s fairly dark by 6 pm, it has been fairly cloudy, we are getting much more rain than average. The good side is that it’s as high as 18 degrees in the middle of the day and nights are warm, the temperature only drops to 10 degrees.
Yes oil is very energy dense, but 40 percent of it was used elsewhere just to get the products made and distributed, while once in use it has efficiencies of about 20 percent in vehicles. So it’s really not as energy dense as one thinks, thinking useful energy. Making excess heat is it’s main output.
Let’s keep in mind the maximum power principle, (and ELM, [highest] EROEI, geopolitics, energy resource competition, etc.) insofar as what may actually transpire WRT ‘the downslope’ (and oil use & FF ‘replacements’, pseudorenewable & lithium uptakes, etc.).
Why don’t you jump off a really tall building and I’ll watch and see what happens. Who knows maybe you will just float away…
Fred. So biofuels will power the mining of phosphorus and the manufacturing of nitrogen via the haber bosch process to fertilize crops to make biofuels to mine phosphorus etc etc and as well create surplus power for our appliances and food requirements. Sounds like a perpetual motion machine to me. If you think solar power can replace oil (power our industrial civilization) and have enough surplus power remaining to mine the elements needed for the manufacture of solar panels, manufacture solar panels, and maintain solar panels then I think you’re living in a dream world. Magical thinking at its finest.
Solar energy strikes the earth at 10,000 times current energy use. Panels payback energetically in less than one year.
Fred. So biofuels will power the mining of phosphorus and the manufacturing of nitrogen via the haber bosch process to fertilize crops to make biofuels to mine phosphorus etc etc and as well create surplus power for our appliances and food requirements. Sounds like a perpetual motion machine to me.
Who said anything even remotely as ridiculous as that?!
Anyways, there isn’t much point in discussing with people who make stuff up and then ascribe it to others.
BTW, my definition of magical thinking is looking at the world at large and seeing that every single system both natural and those created by humans are at their limits and basically on the verge of failure and still thinking that we can continue on our current path.
As Einstein said “The definition of insanity, is doing the same thing over and over again and expecting different results!”
I think it is past time to try doing things differently and there is nothing in the laws of physics that says we can’t.
There is a limited supply of fossil fertilizer. This is in fact an actual issue, but nothing to do with energy.
A bunch of you dorks don’t seem to realize that oil does NOT power our industrial civilization. It’s basically used for cars, trucks, and airplanes. The rest of industrial civilization runs on electricity already.
Much of it has done since before oil became popular. Most of the rest shifted after the 1970s oil crises. We just had some difficulty shifting transportation, but that’s happening now.
Hi Alex S,
For those energy uses that cannot be run on electricity (perhaps you are thinking of ships and air transportation), biofuels might be able to substitute for fossil fuel, along with wind or nuclear power for ships. Other than that it is technically feasible (over say 30 years) to replace all fossil fuel energy use with wind, solar, hydro, geothermal, and nuclear power. Backup could be pumped hydro, batteries, vehicle to grid, and fuel cells. Variable electric pricing depending on supply and demand can allow quite a bit of demand adjustment. Every residence or business would have a meter which gives current electric power pricing and consumption will be adjusted accordingly.
“Other than that it is technically feasible (over say 30 years) to replace all fossil fuel energy use with wind, solar, hydro, geothermal, and nuclear power.” Technically feasible?
“China currently has over 900,000 MW of coal-fired capacity, the equivalent of about 1,300 large coal-fired units. Mapping shows that in the two months after the policy was introduced, new coal power plants projects started construction at a pace of two per week, with new projects started in ten different provinces. Furthermore, six new ‘coal power base’ projects in Shaanxi and Inner Mongolia – with over 9,000MW of capacity – applied for environmental permits immediately after the policy was published, making May the busiest month of 2016 for new applications. However, even without any new permits for conventional coal plants, there is still enough capacity under construction or allowed to go to construction for China to keep adding one GW of coal-fired capacity per week for four and a half years, until the end of 2020. This massive over-investment in coal-fired power and the resulting overcapacity is exacerbating the problem of ‘wasted’ wind and solar power, as grid operators too often fail to prioritise renewable energy sources over coal.”
http://energydesk.greenpeace.org/2016/07/13/china-keeps-building-coal-plants-despite-new-overcapacity-policy/
Technically speaking, you can build anything out of sand; it doesn’t mean you do it. Eric Bana
Hi Doug,
Of course, but those that look closely at future trends will soon realize that investment in coal fired power plants is a bad economic decision as the investment will be stranded as wind and solar power fall in cost while the price of coal power rises and is driven from the market. The economics will make new coal power plants obsolete within 20 years, smart countries will see it as a wasted investment.
Dennis, the maximum power principle would seem to factor into a kind of paradox for empires and wannabe empires (and how they operate)…
It might also explain why small island States like Jamaica may be able to go more alternative (thus, less) energy more rapidly and with greater security. In doing so, they may also compete less for the remaining higher-power energies for the bigger fish. For all we know (who knows what?), politically, some bigger fish are in the process of leaning in this regard on the little fish and pushing them that way.
Maximum power is ‘now’ and probably not so-called renewables yet, depending on context (or lower power sources in general unless they can be used to swap out some drains on higher-power sources) when other Powers are currently running on higher EROEI, like maybe oil, gas, and coal, is it? (What kind of EROEI does who/where have underground and who wants/gets it?)
So in order to figure out, with maybe better insight and even some semblance of accuracy, what ends up happening, it might be prudent to turn our attention, at least more often, simply to the maximum power principle vis-a-vis EROEI vis-a-vis energy-access, which would seem to govern how States view and exploit energy.
I mean, how much power and Power is contained in ‘cheap’ power tomorrow and Who or What outfit wants to know?
Russia, for example, would seem to have lots of arable land, lots of sources of energy, a good sized population without being too big like China’s, and lots of decent energy and military technology and economic stability. It’s also much closer to the Middle East and its resources and increasing destabilization.
“The petroleum industry in Russia is one of the largest in the world. Russia has the largest reserves, and is the largest exporter, of natural gas. It has the second largest coal reserves, the eighth largest oil reserves, and is one of the largest producer of oil.” ~ Wikipedia
‘Maximum power’, da?
Hi Doug,
As the cost of wind and solar continue to fall, the coal fired powered plants already built will produce electricity that is more expensive than that provided by other power sources. When that occurs, coal will no longer be used to produce electricity. This is likely to be the case before 2040. At that point the coal fired power plants will quickly be replaced, within 15 to 20 years with wind, solar, and hydro.
Why does that sound a lot like one of your future oil price predictions Dennis? 🙂
Hi Doug,
Costs of wind and solar have been falling and the cost of fossil fuels have been rising. I suppose it is possible that each of these trends will reverse, but not very likely.
I expect oil prices will rise in the medium term (until 2025), then may level off from 2025 to 2030 and then either a depression or falling demand due to a transition to non-fossil fuel energy will drive fossil fuel prices lower, at this point we may see the Seneca cliff in fossil fuel output, but eventually (2040 when the depression is over) fossil fuels won’t be able to compete and market share will fall to zero by 2060 (possibly 2070) as alternative forms of energy take over.
We’re seeing *PPA contracts* on solar farms which are comparable in price with the *fuel and operations costs* of *existing coal plants*. THIS YEAR.
In all these discussions, energy conservation is very seldom mentioned. Because FF are so powerful, and have been plentiful and cheap, we’ve learned, step by step, how to use them very sloppily. We often assume that any new world will need the same quantities of energy. This is BAU of another form.
We can, and probably will need to reduce our energy use in buildings by 80-90%. Other types of energy use offer different levels of opportunity for reductions. If undertaken systematically, these efficiency improvements will make transitioning to renewable energy much more possible.
Ships can be run on electricity. I could design plans for a battery-powered freighter right now. It just isn’t economically reasonable at the moment. Probably will be soon.
Airplanes are a technical problem, but biofuels are sufficient for airplanes, if the airplanes are kept efficient.
” as there are areas where fossil fuels cannot be currently replaced by renewables.”
Lets be optimistic and assume that 5% of the fossil fules are used as chemical feedstock. These can of course be substituted with REs.
You either convert biomass into methane and longer alkanes or you use P2G (water, CO2, electricity) to produce the same stuff.
A windturbine would only be 3% more expensive and would have only a few days longer energetical pay-backtime in the P2G scenario.
From a purely physical and technological point of view, these are the areas where fossil fuels cannot be currently replaced by renewables using existing technology:
Steelmaking
That is all. Yes, I’ve looked into a hell of a lot of highly specific areas to prove this. I can give you a substitute in any other area. I can even give you substitutes for chemical feedstocks, athough those are not technically fossil *fuels*.
Obviously, economic questions are the most important ones. So watch this documentary:
https://www.youtube.com/watch?v=mmyrbKBZ6SU
A Critical Look at RSA and TSB’s ‘New Designs for A Circular Economy’
The Challenging Shift to a Circular Economy: The Relevance of Social Ecology in Effective Transition
Circular Economics: Innovation or Reiteration
“Whereas the CE report articulates the issue of waste, the narrative is in essence a complex version of the German ‘recycling’ model of the post-World War Two period that was greatly influenced by economic factors…
Sorry, but no, it isn’t that at all!
A technologically advanced civilization that is not ecologically informed simply has no long-term prospects; it will not even understand the ways in which it is destroying itself. Businesses are keen to project the image that they are working towards a circular economy and dramatically lowering both pollution and quantitaties of natural resources needed in the industrial cycle. Are these flashy claims an honest representation of progress, or simply a new front for business as usual?
If you or anyone else thinks that basing an economy on concepts such as prosperity without growth is business as usual than you haven’t looked very deeply at what CE is about. CE is about systems reset at a very deep level. At the level of education, society, government, etc.. It is the absolute antithesis of business as usual.
One of the ideas underlying CE is biomimicry, learning from and incorporating knowledge from nature.
https://biomimicry.org/janine-benyus/
To argue that someone like Janine Benyus doesn’t understand ecology would be a rather interesting position to take.
Janine is a biologist, author, innovation consultant, and self proclaimed “nature nerd.” She may not have coined the term biomimicry, but she certainly popularized it in her 1997 book Biomimicry: Innovation Inspired by Nature.
So at the end of the day the criticisms made against CE are a bunch of strawmen by people who haven’t taken the time to even try to understand what it is.
CE is is a different paradigm from BAU and the people involved in making it work understand that at the most fundamental of levels.
They also understand that getting there from here is not a one step process.
Apparently from one of circular economy’s own:
Social sustainability, the missing element in the circle?
A system that doesn’t account for the ‘social dimension of sustainability’ seems rather absurd and practically pointless.
Has the sociopathology of the system gone this far already? That it has produced some larger number of people who can’t seem to fathom that an adequate system composed of people needs to actually have a ‘social dimension’?
Janine Benyus, if recalled, runs off some corporations in that video you had previously linked to, and biologists can of course work for Monsanto. Does that make Monsanto ‘understand ecology’? Maybe Ellen MacArthur can include Monsanto as a global partner in her circular economy.
But why biomimic (as if)? Why not actually work (and play) more with (and in) nature, and nurture it, rather than try to emulate or work against it? Integration? Symbiosis?
“…the circular economy framework lacks an elaborated description of the social dimension of sustainability… Social benefits are often lacking… Moreover, people’s basic needs at a global level may still be further undermined by abuses of power, unhealthy or unfair labour and living conditions or a disrespect of human rights. As such, the circular economy framework does not necessarily fulfil all the
dimensions of sustainability.”
As I have said many times you are not even wrong! I have absolutely no idea where you come up with your arguments but they lack any basis in fact. What you describe is quite far from what is being proposed and done.
I’ll post a link to case studies from the Ellen McArthur Foundation site:
https://www.ellenmacarthurfoundation.org/case-studies/policy
Pioneer Universities
https://www.ellenmacarthurfoundation.org/programmes/education/pioneer-universities
One from the DIF: Douglas Rushkoff: The Rise of Digital Technology
https://www.youtube.com/watch?v=uDvFakoI-n8
Education:
Creativity expert Sir Ken Robinson
https://www.youtube.com/watch?v=mCbdS4hSa0s
But I’m pretty sure you are not interested in any kind of intellectual exploration.
And probably this discussion should be taken to the non petroleum thread so my apologies to Dennis.
Posting a whole bunch of links ‘with little meat on the bone’ isn’t a reasoned argument, synthesis, support for your case, or elaboration (etc.), Fred.
It is not really for me or others to run after your links (even though I have) to help you substantiate them and your anorexic comments. That’s your job.
So, yes, if or when you are up to the task, then you can enlighten us on the appropriate thread.
By the way, the snotty pretense of the title, ‘Creativity expert Sir Ken Robinson’, forms a peculiar sensation of laughableness and nausea (while feeding into my previous comments a little).
It would not be unusual to see a month to month increase in production, while the overall field is decreasing. It has to see an eventual decline.
Go out on a limb here, and say since August, Texas production will decline by, at least 100k barrels from August to 12/31. Even if it shows an occasional increase. That is a 100k a day decrease. That is based upon what is ultimately recorded on the RRC site, not on EIA numbers or mathematical projections.
Tldr
Venezuela update: yesterday the National Asembly voted to declare Maduro politically responsible for the ongoing mess. The regime answered tit fir tat by having the Supreme Court usurp Assembly rights to designate electoral authorities, and named two Chavistas, thus perpetuating dictatorship control over the electoral processes.
On Sunday Maduro ordered the closure of all borders, and declared the 100 bolivar bill (the largest denomination) would be outlawed within 72 hours. The 100 is worth 2 1/2 cents, so most people carry wads of this paricular currency. Maduro claimed he was doing it because Mafias directed by the USA were stealing the bills and shipping them to European warehouses.
Thanks for the updates Fernando. The mess down south is colossal. Somehow I feel like Alice in the looking glass, peering into some dystopina future that will be the US in four years.
Nah, Venezuela is dealing with peak lead poisoning from leaded gasoline.
They pumped their kids full of tetraethyl lead — until 2000 they didn’t even sell unleaded gasoline. I can’t find a record for when they actually eliminated lead from gasoline, but it seems to have been between 2007 and 2009?!??
https://www.thenation.com/article/secret-history-lead/
Rick Nevin finds a 20-to-23-year lag between lead exposure rates at birth and the violent crime rate. Things will get worse and worse in Venezuela until then (at least 2020, perhaps as late as 2025). After that they will probably slowly start to get better, as less-lead-poisoned kids grow up.
Here in the US, our peak lead poisoning birth year was around 1970, so our peak for crime was around 1993. (There’s an earlier pair of peaks due to lead paint.) As a result, we’re going to be OK.
http://www.humanimpact.org/from-the-hip-blog/lead-poisoning-and-crime-why-the-pipeline-to-prison-is-running-dry/attachment/screen-shot-2015-08-13-at-10-13-46-pm/
Venezuela was putting more lead in their air than any other country in South America.
https://books.google.com/books?id=XSUS234DhEsC&pg=PA75&lpg=PA75&dq=leaded+gasoline+ban+venezuela&source=bl&ots=HiTz_Wg1rP&sig=NOJdq4FlpwuMnAyla34SGFj_LJk&hl=en&sa=X&ved=0ahUKEwis1c2F1f_QAhVEw4MKHepGDOIQ6AEIIzAB#v=onepage&q=leaded%20gasoline%20ban%20venezuela&f=false
Now, the violence in Venezuela is being driven by somewhat older people. Born in a period when they put even MORE lead in the gasoline…
Additional rigs in Colombia have had rapid impact on production rate which has flattened out – though still down 11% y-o-y.
From their ministry:
“The increase in production is mainly due to the start of production of new wells in the Quifa Suroeste and La Cira fields and the reactivation of operations in La Cañada and Guarilaque fields.”
They may have limited overall options onshore though, a lot of the recent talk from there has been of the need for offshore exploration and development.
They do have limited options onshore. And the offshore has low oil potential. The South American continent has the Caribbean plate shearing from west to east not too far offshore, everything north of the shear is very non prospective, south of the shear the sediments are gas bearing. The coast line has no potential, this increases gradually to the south. I’m generalizing.
Read this
http://www.kcl.ac.uk/sspp/departments/warstudies/research/groups/eucers/pubs/strategy-paper-13.pdf
It’s an interesting overview of the oil industry
How many more Bakken wells will be completed before the doubting Thomases are finally convinced that the production will be greater than the predicted 317,000 bpd from the old oildrum days?
It’s a rhetorical question. The increase in production surprised everybody, I guess. I was taken aback.
How are you gonna fly a hot air balloon using electricity?
Have a battery on board supplying the energy to a heating element? A mile long electric cord? Didn’t think so.
You need a propane tank filled with propane and a propane burner to get that ballon floating in the air. Gonna burn hot enough to float it in the air a mile high.
Or helium. Life is a gas, and sometimes you need some laughing gas, for everybody.
ron or everyone else
what do u think about that?
https://cfpub.epa.gov/ncea/hfstudy/recordisplay.cfm?deid=332990
this is why the “Green” goobers are justifably going down.
http://www.worldoil.com/news/2016/12/14/epa-distorts-science-in-hydraulic-fracturing-study-api
make america great again??
That info isn’t the reason people here are talking about the future of oil.
1. Is there any point in opening up more areas for production when prices are still too low?
2. If frack fields decline quickly, how long with they be a reliable source of gas and oil?
I think most “greens” welcomed the increases in natural gas to wean utilities off coal. Now there will be a transition to wean utilities off of natural gas, in time.
Fracking in populated areas isn’t embraced for reasons other than water impact. There’s the noise, the traffic, extra demands on public services to accommodate workers, etc. And when we have too much oil right now, there is no real reason to force drilling on communities that don’t want it. And bit by bit individual communities are passing zoning laws to restrict drilling within their borders.
There’s also the issue of water. When water has to be divided up between housing, agriculture, and fracking, individual communities may decide they don’t want to give water rights to drillers.
Sounds like you might be an investor who is trying to pump up your portfolio. But the issues are complex and people here discuss those.
The American Petroleum Institute WOULD lie about that, just like the Tobacco Institute claimed that the FDA was “distorting science” about smoking (they were lying).
Seriously, API is not a credible source when it has THAT BIG an ax to grind.
Jean Laherrere just posted the below charts with the comment that the Bakken November increase could be short.
Hi Ron,
At the end of 2015, Williston basin proved reserves were about 5 Gb and cumulative production was almost 1.6 Gb, I would expect the URR to be at least 6.6 Gb, probable reserves would typically be about half of proved reserves so 9.1 Gb is probably a better mean URR estimate, with 6.6 Gb as an F95 URR estimate for all US Bakken/Three Forks output (including Montana and North Dakota).
Hi all,
An alternative scenario that assumes oil prices rise to $90/b by 2018.
Really Dennis? I estimate Bakken URR will be less than 3 GB. Over half of Bakken production is already in the can.
Ron,
You say Bakken URR is 3 GB.
Meanwhile, the EIA’s estimate of the Bakken proved reserves as of year-end 2015 is 5 GB.
These are not TRR, but proved reserves
Estimated proven reserves? Isn’t “proven estimate” a contradiction in terms?
I don’t doubt that there are 5 billion barrels down there. However there are only about 3 billion barrels… or less… of economically recoverable reserves. Of course that is just an estimate, nothing proven. 😉
Ron,
proven reserves are economically recoverable by default.
That’s why their volume changes with the change in oil prices (unlike TRR).
Yes, I know that Alex. But referring to an estimate as “proven” is nothing but Orwellian newspeak. Estimates change all the time but the proven never changes.
But an estimate by the EIA is kinda official. If there are changes they should be very small changes, never a drastic cut in one of their estimates….
U.S. officials cut estimate of recoverable Monterey Shale oil by 96%
Just 600 million barrels of oil can be extracted with existing technology, far below the 13.7 billion barrels once thought recoverable from the jumbled layers of subterranean rock spread across much of Central California, the U.S. Energy Information Administration said.
Ron,
There is a big difference between EIA’s “kinda official” “guesstimate” of Monterey shale TRRs, which was actually prepared by an obscure private consultancy INTEK, and official estimates of U.S. proved reserves, based on SEC rules.
However Orwellian it sounds, these are still “estimates of U.S. proved reserves …”. And they change with the change in oil price.
The quote below is from the EIA’s annual report called “U.S. Crude Oil and Natural Gas Proved Reserves, Year-end 2015”
http://www.eia.gov/naturalgas/crudeoilreserves/
“This report provides estimates of U.S. proved reserves of crude oil and lease condensate and proved reserves of natural gas at year-end 2015. The U.S. Energy Information Administration (EIA) starts with the data filed on Form EIA-23L, Annual Report of Domestic Oil and Gas Reserves, which was submitted by 450 of 467 sampled operators of U.S. oil and natural gas fields. EIA then estimates proved reserves for the U.S., states, and state subdivisions.
Proved reserves are estimated volumes of hydrocarbon resources that analysis of geologic and engineering data demonstrates with reasonable certainty are recoverable under existing economic and operating conditions. Reserves estimates change from year to year as new discoveries are made, as existing fields are more thoroughly appraised, as existing reserves are produced, and as prices and technologies change.
………………………………………………
The 2015 reporting period represents the seventh year companies reporting to the U.S. Securities and Exchange Commission (SEC) followed revised rules for determining the prices underpinning their proved reserves estimates. Designed to make estimates less sensitive to price fluctuations during the year, the SEC rules require companies to use an average of the 12 first-day-of-the-month prices.”
Hi AlexS,
Ron doesn’t believe in proved reserves. I guess Jean Laherrere doesn’t either. In the past Jean Laherrere has argued that reserve growth in the US is an artifact of reporting proved reserves rather than proved plus probable (2P) reserves. This implies that he believes a higher reserve estimate makes more sense.
If we make the very conservative estimate that probable reserves are one third of proved reserves, then we get a 2 P estimate of 6.7 Gb for the Bakken/Three Forks. If we also make the very conservative estimate that there will be no future increase in 2P estimates as oil prices rise in the future, then we would expect a mean ERR of about 8.3 Gb. This would be a minimum estimate, I expect future oil prices will be higher and a 9.5 Gb URR to be more reasonable.
The scenario I presented assumes very slow drilling rates (125 new wells per month maximum after 2016), in the past average new wells completed on a yearly basis were over 150 new wells per month when oil prices were high. A scenario like that would have a higher peak with steeper decline.
Dennis,
Ron said “Bakken URR will be less than 3 GB.”
Proven reserves are part of URR, and, according to the EIA (based on SEC definition), proven reserves of the Bakken are around 5 billion bbls.
2P reserves should be higher than 1P.
TRR and ERR should also be higher that 1P.
But I am not able to make my own estimate of ERR ot TRR, because it should be based on very detailed information on:
1) potential number of wells in each subplay of Bakken-TF complex;
2) average EUR by well for each subplay;
3) area of each subplay.
Two important unknowns are: future oil prices and potential technological advances.
Ugh. I really need to run a proper scenario which models the full boom and bust cycle, with the substitution effects. Pretty damn complicated though.
You need to do it in an iterative fashion. Predict, in the following order:
— 2017 production,
— 2017 demand,
— 2017 oil price,
— 2017 investment in new drilling,
— 2017 substitution by switching to electric cars etc.,
— 2018 production,
— 2018 demand,
— 2018 oil price,
…and you get the idea. Big pain to model.
hi Ron
Where can i donwload the laherrere completed article of december 2016?
Thanks you
Caroline, there was no article. I always post URLs when there are URLs to post. But in this case there were none. The charts were an attachment to an email from Jean Laherrere to Art Berman and was CC to me and others. The entire text of the message:
Dear Art
Bakken ND November increase could be short as you say,
as others.
That’s it. Nothing more. Sorry about that. 🙁
Mr. Laherrère has reached the respectable age of 85 years. I’m more than happy he is still producing graphs.
The EIA just released its estimate of the U.S. proved oil and gas reserves for year-end 2015.
http://www.eia.gov/naturalgas/crudeoilreserves/
From the report:
– Between year‐end 2014 and year‐end 2015, U.S. crude oil and lease condensate proved reserves decreased
from 39.9 billion barrels to 35.2 billion barrels—a decrease of 4.7 billion barrels (11.8%).
– The average price of oil in 2015 dropped 47% compared to 2014, causing operators to postpone or
cancel development plans and revise their proved reserves of crude oil and lease condensate
downward. As a result, U.S. proved reserves declined by 11.8% (4.7 billion barrels) in 2015.
Proved reserves of tight oil are estimated at 11.6 bn barrels, down from 13.4 billion in 2014
Table 2. Crude oil production and proved reserves from selected U.S. tight plays, 2014‐15
million barrels
The GoM doesn’t look too good: only about 1% reserve addition and a bit more for discoveries, P/R is about 8 years and falling quite quickly.
On the shale it doesn’t seem the price has made that big a difference to plans with only about a 10% reduction, and I remain to be convinced that it is all to do with price – I think they are including revisions to previously overly optimistic recovery numbers, and will continue to do so.
I think 10% revision is mostly due to lower oil prices.
Note that estimates are for 2014 and 2015, and the drop in price between these years was very significant.
Back to why 70K bpd increase in Oct.
Drawing attn to Freddy comment above:
“If we look at the legacy production in the graph bellow we can see that production actually increased for all years except 2007, 2010 and 2013. For 2014-2016 the increase was quite large and for those wells we would have instead expected high declines considering how new they are. So it appears they are pumping like crazy. The oil price increased quite a lot in October. ”
Shooting down oil price in Oct. Oil has been those levels before Oct.
The issue with Freddy’s comments is it suggests things SS above was noting about Whiting having to shut down an area then being drilled for a few weeks — is not the smoking gun because Freddy finds upticks in output for years of drilling that likely were nowhere near those particular locales — and they should have been declines.
This smells like data artifact overall. There was no techno miracle implemented in Oct to cause this because those previous year wells upticked. There was no increase in output of old wells because of nearby fracks, because fracks have been going on for years and this wasn’t seen.
I smell artifact. Maybe above ground — like Fernando’s suggestion tanks were drained in Oct — maybe on a change of schedule for such things.
Hi Watcher,
Check out the comments at
https://shaleprofile.com/index.php/2016/12/13/north-dakota-update-through-october-2016/
About 65 kb/d of the 70 kb/d increase (93%) is explained in the comments section at Enno Peter’s site.
Enno and other knowledgeable people at his site ( as well as Shallow sand and Freddy W) have pretty good explanations. There might be a small data artifact as well (maybe 5 to 10 kb/d).
Enno has some very good info about what happened to cause the October jump in production.
I might note CLR has reported for Q3 that they had voluntarily curtailed about 12K BOPD. I assume wells that were reactivated had some “flush” as I have described our primary production wells do when reactivated in the spring.
cool clickable graphs, but 1.2 days shut in time stuff . . . . you don’t have to explain just why it was above Sept. It’s also above all the way back to March. Supposed to be in decline all year. All those months were shut in the extra day?
Are we sure of this?
Of Interest ? Inside the Mind of “We are all losing our shirts” Rex Tillerson
http://www.forbes.com/sites/christopherhelman/2012/07/03/exxons-tillerson-speaks-some-convenient-truths/#246c51e42497
Been scoping around for photographs of Bakken wells to see what sort of tanks are there.
Like so: http://www.oilandgasphotographers.com/data/photos/1297_1r20100711_FidBak_0751.jpg
http://www.castagra.com/wp-content/uploads/2014/04/Bakken_Tank_Manufacturing_Lo.jpg
10 ft diameter and 20 feet tall is pi X 5 ft^2 X 20 = 1570 cu ft X 7.5 gallons/cu ft = 11780 gallons / 42 =
280 barrels. That photo of 5 of those guys — 1400 barrels.
Older wells flowing under 50 bpd . . . yup, they could fit a month’s output. And I suspect they are taller than 20 ft. When those wells first started flowing they flowed big numbers. The installed tanks would be bigger.
Bottom line — looks pretty possible for there to have been a storage release event in October. Something special about October that gets lots of old wells to release storage from Sept. Shrug.
Hmmm this sound familiar. I think Mike once said production is measured at the well head, not the truck loading from the tank, in which case ignore all that, unless that’s wrong.
According to OPEC Monthly Oil Market Report for December, the group’s crude oil production rose by 150 kb/d from 33.72 mb/d in October to 33.87 mb/d in November. These estimates are based on secondary sources.
http://www.opec.org/opec_web/static_files_project/media/downloads/publications/MOMR%20December%202016.pdf
The IEA’s estimate from its Oil Market Report shows an even bigger growth: by 300 kb/d to 34.20 mb/d, led by increases from Angola along with Libya and Saudi Arabia. The group’s output stood 1.4 mb/d higher than a year ago.
https://www.iea.org/oilmarketreport/omrpublic/
According to a Reuters survey, in November, OPEC produced a record 34.19 million barrels per day (bpd) from 33.82 million bpd in October.
https://www.rt.com/business/369348-oil-russia-budget-opec/
OPEC countries are pumping oil at the highest rate for the past several years, ahead of the announced output cuts in January 2017.
OPEC crude oil production, 2014-16
Source: OPEC Monthly Oil Market Report, December 2016 (secondary sources)
China’s crude oil production increased 3.6% in November from the previous month to about 3,915 kb/d, the highest since July.
Output was down 382 kb/d (8.9%) from the same month last year.
Crude production has fallen 294 kb/d (6.9%) in the first 11 months of 2016 to 3,984 kb/d.
Comment from Bloomberg:
“China’s output has declined this year as state-owned firms shut wells at mature fields that are too expensive to operate at current prices. The country needs oil above $50 a barrel to stabilize production, according to analysts at Sanford C. Bernstein, as well asFu Chengyu, the former chairman of both Cnooc Ltd. and China Petroleum & Chemical Corp. Production is forecast to drop 335,000 barrels a day this year, followed by a further slide next year of 240,000 barrel a day, the International Energy Agency said Tuesday.
“November’s output pickup is probably just a blip, which won’t likely persist,” said Gao Jian, an analyst with Shandong-based industry consultant SCI International. “For the next six months, unless oil prices stay above $50 a barrel, we we won’t see solid recovery.”
The rise in production last month was in anticipation of higher crude prices amid OPEC meetings, said Amy Sun, an analyst with Shanghai-based commodities researcher ICIS-China.
China’s annual crude output is seen falling to 200 million tons this year (about 4 million barrels a day), down roughly 7 percent from nearly 215 million tons last year, according to estimates from SCI International and ICIS-China.”
https://www.bloomberg.com/news/articles/2016-12-13/china-oil-output-rebounds-from-7-year-low-on-opec-led-price-gain
China’s crude + condendate production (mb/d).
Source: China’s National Bureau of Statistics
China’s C+C production in 2002-2016 (mb/d)
AlexS,
It could be also a clever strategy to buy cheap oil from the market and leave China’s oil in the ground as a strategic oil reserve.
I agree. It was a rational decision to cut output from high-cost fields, which was loss-making at low oil prices, rather than maximizing production.
I think that, with oil prices at $50-60, China will be able to temporarily stabilize output
Yes, the US clearly needs some kind of energy policy, and I think one thing that highlights how badly this is needed is the ability of anyone who can raise the money to be able to drill 96 horizontal wells in one section of land (two if the laterals are the two mile variety).
But, I guess any mention of conservation in the US industry these days is heresy.
I would not be too critical of Chinese production falling. Seems to me they are buying up all the cheap oil they can from overproducing nations, and storing it. Makes sense to me.
I’ve never understood the urgency of using up US oil so quickly. Better to buy someone else’s at a cheap price and save ours for a time when it is depleted elsewhere.
Burn America First
I was going to type deplete America first, LOL.
Its’ not only the USA. KAS, Iran and Russia are doing the same. There are a lot of short termism obsessed politicians besides Obama administration…
Especially KAS in 2014-2016. Who were instrumental in the current oil price crash.
But behavior of the Iran and Russia was also deplorable. Iran decided to get back its former market share at all costs. But they like KAS are governed by religious fanatics, so what we can expect?
At the same time Russia, which theoretically should be a rational player and have enough space and steel to build huge national oil reserves, using it as alternative currency reserves, did nothing. Instead Russia also increased oil production selling its national treasure left and right, while prices were hovering below $50.
Another bunch of short termism obsessed suckers. So much about Putin as a great statesman. And what he got in return for his stupidity ? Only additional sanctions and allegations that he fixed elections for Trump. Such a huge payoff.
IMHO of big oil producing nations only China behaved rationally.
Oil is not renewable resource and burning it in large SUVs and small trucks carrying one person to commute to work is a suicide. That’s what the USA is doing on the national scale. Add to this all those wars for the expansion of the US neoliberal empire, the USA is fighting, which also consume large amount of oil and the situation looks even worse. See
http://www.ucsusa.org/clean_vehicles/smart-transportation-solutions/us-military-oil-use.html
So out of the total US oil consumption (let’s say 20 MB/day) around 0.3 MB/day is consumed by military. I think that the figure in reality might be twice larger that cited as it is not clear how consumption of planes operating in Iran, Syria, Libya, Yemen (and generally outside the USA) is counted. But even 0.3 Mb/day is approximately the same amount that Greece, or Sweden, or Philippines are consuming. The latter is a country with over 100 million people.
In twenty-forty years this period would probably be viewed as really crazy.
And to top it off, we have politicians who want to beef up the military and do nothing to increase renewable energy. So they have the illusion of power, but are hastening our decline by wasting resources and doing nothing to prepare for the future.
If China is smart, it will use this to establish itself as the sanest global power.
It’s not wasting so much money on the military, it is lending money to other countries, and it is planning to take the lead on climate change.
They can wait it out. Wait it out until the US power declines globally.
The correct number is 380K bpd. Less than 2% of the national total.
China is an oil importer.
It was a wise decision, for Chinese oil companies, to cut output from high-cost fields with breakeven prices above current price. Note that they did not reduce output from the fields that remained profitable.
KSA, Iran, Russia and other oil exporters is a different story. They did not cut output in 2015-16 as they aimed to retain market share.
For oil exporters, output cut is a rational decision only if it is supported by large majority of them (like the recent OPEC-NOPEC agreement).
What’s important, in KSA, Iran, other OPEC countries, Russia, Kazakhstan, etc. oil production remained profitable
I would say something, but Boomer II and likbez have said everything I would have said. Thanks y’all.
Wait, what?
The leave it in the ground for later concept . . . means trade deficit NOW. not later. NOW. If you import it, you have to pay in foreign currency reserves. If you pump domestically, you pay for it with internally printed renminbi that OF ALL COUNTRIES has no real relationship to the outside world, since they peg yuan by decree.
Also, the leave it in the ground concept is not really supposed to be about money. It’s supposed to be about future generations. Or wartime logistics when a blockade prevents imports.
Watcher,
To me this looks like China has embraced a strategy to de-hoard dollars towards hoarding oil.
China has sold over USD 130 bn of Treasuries over the the last six months.
http://ticdata.treasury.gov/Publish/mfh.txt
Your comment about China selling US treasuries counters the argument against buying oil because it creates a trade deficit.
China has plenty of room to import stuff. It doesn’t need to worry about a trade deficit. It’s smart planning to buy cheap oil from elsewhere, stockpile it, and conserve your own.
BoomerII,
The Chinese trade surplus fell in Novmber 16 by USD 15 bn to USD 44 bn from November 15.
China has a dollar surplus with the US of around USD 300 bn per year, which is currently spent for commodities and other dollar imports. So, technically China does not have a dollar surplus anymore as the surplus is with other currencies only.
In my view this is the main reason for the recent rise in interest rates.
Not a believer in the crowd who likes to scream panic over Chinese sale of Treasuries.
Because of the inevitable question of . . . to whom. They can’t sell unless someone buys.
China and Russia are selling US treasuries; Japan is buying
U.S. Bond Market’s Biggest Buyers Are Selling Like Never Before – Bloomberg: “The custodial data add to evidence that the retreat isn’t simply a one-off. Separate figures from the Treasury Department showed that China pared its stake to $1.22 trillion in July, the lowest level in more than three years. Others, like Japan and Saudi Arabia, have also reduced their holdings this year.
Big holders of Treasuries are selling for a variety of reasons, but they’re all tied to each country’s economic woes. In China, the central bank has been selling U.S. government debt to defend the yuan as slumping growth leads to more capital outflows. Japan, the second-biggest foreign holder, has swapped Treasuries for cash and T-bills as prolonged negative rates in the Asian nation pushed up dollar demand at local banks.”
“Homegrown demand has helped pick up the slack. Excluding short-term bills, U.S. money managers have snapped up 45 percent of the $1.1 trillion in Treasuries sold at government auctions this year, the highest share since the Treasury began breaking out the data six years ago. In 2011, it was as low as 18 percent. U.S. commercial banks, for their part, have also added to their investments of government debt, boosting stakes to a record $2.38 trillion at the end of August.”
Saudis, China Dump Treasuries; Foreign Central Banks Liquidate A Record $375 Billion In US Paper | Zero Hedge: “So who are they selling to? The answer, at least until last month, was private demand, in other words just like in the stock market the retail investor is the final bagholder, so when it comes to US Treasuries, ‘private investors’ both foreign and domestic are soaking up hundreds of billions in central bank holdings. As we said last month when we observed this great rotation in Treasuries out of official holders into private hands, ‘we wonder if they would [keep buying] knowing who is selling to them.’ Well, this month it changed, and after private investors had been happily snapping up bonds for 4 straight months, in September ‘other foreign investors’ sold a whopping $31 billion, bringing the total outflow between public and private foreign holdings to $76.6 billion, the second highest number on record!”
Are they selling US Treasuries or buying less than those having expired?
Look, this is silly.
This is supply and demandism applied to something that cannot be subject to it.
If people are “dumping” treasuries, driving the price down and yield up . . . well, no they aren’t, because someone is grabbing them greedily with both hands, driving the price up and yield down. See? This is what happens when English is involved.
Analagous to oil, which the Russians can sell at a lower price than that offered, regardless of how much, if a lower price is what they want — to inflict pain.
Besidesssssssssssssss which all this dumping crapola is data from the whole year, and yields were falling all the way to Brexit about Julyish. The current yield spike began 1 hour before the markets even opened November 9th. Remember that? During Election night when you were told Dow futures were down 700 pts? Yields were at 1.75% that night. But ALL of that reversed 1 hour before the markets even opened in NYC. ALL of it, equities and bonds both.
Probably HFT driven. This is all silly. The narrative about Trump stimulus was manufactured DAYS later. Those futures guys overseas can see alleged stimulus just like NYC guys can, and they said Dow -750. The whole night was undone before the market opened.
There is no market.
The natgas market is going wild.
http://www.naturalgasintel.com/articles/108743-brrrrr-its-cold-eastern-cash-natgas-soars-futures-post-gains
Transco Zone 6 NY up 14.89 USD per mcf in just one day to close near USD 20 per mcf. The price is now up a staggering 1282 % year over year.
http://www.naturalgasintel.com/data/data_products/daily?region_id=northeast&location_id=NEATZ6NY?region_id=northeast&location_id=NEATZ6NY
As this is probably short lived, it demonstrates the leverage of the market. As HH stands still relatively low, natgas from all over the US will follow as long as the winter stays cold. I expect also massive freeze offs in Canada and the US which will tighten the market even further.
There are also freeze offs reported from the Bakken. It will be interesting to see how this will impact oil production.
Yeah, I should have switched my house away from natgas to electricity last year Doing it in 2017 though. I expect more crazy price spikes.
Mr. Leopold
What a difference a few pipelines can make, huh?
One of the mantras of the anti pipeline folks in New England was “Make sweaters, not pipelines”!
They sure are getting opportunity to do that now.
Today’s ISO Express site shows 15% power supplied by coal, 3% oil (!).
2,000 Mwh this AM from coal plants.
1,500 Mw coal burner – Brayton Point – is permanently shutting down in a few months.
Those sweater-knitters may soon follow in the footsteps of Madame DeFarge.
Coffee,
It will be interesting to see how much electrical capacity comes back on line during high nat gas episodes. As to the oil usage, I know a lot of the gas turbine electrical units were built as duel fuel, ie nat gas /diesel. This was due to the known nat gas capacity restraints in the system.
Push
Yeah, the dual fuel is not only kicking in, the ISO folks guaranteed payment to the operators if they committed to buying bokoo amounts ahead of time so as to ensure prompt generation in times like, right now.
One consequence, spot juice price right this moment is $122/Mwh (($128 in eastern Connecticut).
Normal is 30 bucks.
One of the tragicomedy aspects to this situation is the owner of the 100% oil-fueled plant in Maine (Wyman?) provided a great deal of the “talking points” to the politicians and media in their successful efforts to block natgas pipelines.
Engie, owner of LNG terminal in Everitt, did the same thing.
Big time lessons unfolding in real time.
1,500 Mw coal burner Brayton Point permanently shuts down in a few months.
Coffee,
People in Pennsylvania and Ohio will fight any pipeline expansion ferociously. This reminds me to the situation in Europe where shale has little chance to expand. The reason is property prices. People sitting in million country houses will not allow the depreciation of their property prices. And these people are lawyers, politicians and well connected business man.
In addition, there is also some disappointment with the development of the market share in US solar and wind electricity generation (see below chart). As the year over year solar and wind growth rate slowed down considerably over the last years, it looks like that the future market share of wind generation will not go over 10% market share in electricity generation. From my data I can see that solar generation will not go over 3% in electricity generation leaving much room for gas and coal.
Mr. Leopold
The opposition to major pipeline build out in the northeast US, especially, has been intense and contains many twists and turns.
The Mariner East 2 is slated to carry hundreds of thousands of barrels of liquid methane and propane to Marcus Hook when it is eventually built.
Opposition is fierce.
However, many people in the western suburbs of Philadelphia are clamoring for residential hookups – via connecting lines – to natgas for hugely economical heating and appliance (dryers, hot water, stoves) applications.
Cabot has creatively come up with a way to somewhat bypass these issues by contracting to directly supply fuel to several of the newly built power plants coming online in Pennsylvana.
The states of Ohio, Virginia and Pennsylvania are apt to have exceedingly low electric prices for decades to come, making them attractive locales for manufacturing, due to the massive build out (about 2 dozen) of state of the art Combined Cycle generating plants.
A second cracker, to be located in eastern Ohio, is on track for official approval this coming spring.
The current situation in New England is in very sharp contrast to all of this and a cold winter may greatly exacerbate their situation.
Already a few politicians who led the anti pipeline fight are now clamoring for local distributors to quickly build LNG infrastructure (???).
The political situation in the US is very volatile and polarized.
Economic factors may loom large going forward in how this all plays out.
We’ve hit the point where electricity is as cheap as gas for dryers. For heating, it is rather complicated and depends on the local temperature patterns, because heat pumps are more efficient in warmer weather; so it’s a very complex calculation. But basically anywhere in Virginia, a heat pump is cheaper to operate than natural gas heating, and in *some* parts of Ohio and Pennsylvania the same is true.
I’m not sure when people will notice this. But you can bet they’ll notice in New England.
Article in Reuters explaining Saudi Arabia’s shift from output maximization / market share defending to price support policy.
There are also estimates of Saudi oil production capacity.
Cost of pump-at-will oil policy spurred Saudi OPEC U-turn
Thu Dec 15, 2016
http://www.reuters.com/article/us-saudi-oil-capacity-exclusive-idUSKBN14417X
Saudi Arabia has long said it could produce as much as 12 million barrels per day (bpd) of oil if needed, but that pump-at-will claim – which would require huge capital spending to access spare capacity – has never been tested.
Sources say the kingdom may have stretched its current limits by extracting a record of around 10.7 million bpd this year, which could be one reason why Riyadh pushed so hard for a global deal to cut production.
…………………………..
With tight resources, Saudi Arabia found itself weighing the prospect of investing billions of dollars to raise oil output further if it wanted to gain more market share under a strategy adopted in 2014.
Instead, cutting production amid a global glut and low prices to take the pressure off its oilfields, secure better reservoir management and save itself unnecessary expenses, seemed the perfect deal.
“You invest in raising your production when prices are high, not when they are low,” a Saudi-based industry source said.
“Choices are tougher now. The question is, would the Saudi government with its tight budget put huge investment in raising production or put it somewhere else where it’s needed more?”
………………………………
Under the deal, Saudi Arabia, de facto leader of the Organization of the Petroleum Exporting Countries, will from January cut output to around 10 million bpd – well below the 12 million bpd that the state has affirmed it can produce.
Saudi-based industry sources and market insiders say the kingdom cannot sustain historically high output for long. State oil giant Saudi Aramco has never tested 12 million bpd and would find it hard to keep the needed investments flowing with current low oil prices, they said.
Aramco, responding to a Reuters request for comment, said only that the company does not comment on current production levels.
One source familiar with Aramco production management said the firm’s capacity stood at 11.4 million bpd and it was still working to boost that figure to 12 million by 2018.
“Twelve million bpd has been planned since 2008-2010 and every annual budget worked towards that goal,” the source told Reuters on condition of anonymity.
To achieve that goal, the company has annual operating expenses (opex) of $20 billion and capital expenditure (capex) at around $40 billion, the source said. “When the 12 million bpd plan is achieved by 2018, the overall capex will fall to $20 billion,” he added.
Aramco does not disclose its opex or capex figures.
SHIFT IN THINKING
In a note to clients in May, U.S. consultancy PIRA estimated Saudi Arabia’s instantly available capacity at that time at 10.5 million bpd, after tracing expansion plans since 2008 and calculating an annual decline rate of 4 percent.
“Saudi Arabia could produce more but it would likely come at the expense of optimal reservoir practices. They could certainly bring on new fields but this is a lengthy process (years) and expensive as well,” PIRA wrote.
“So far the kingdom is not adding any significant new producing capacity based on project announcements and rig activity but rather replacing the aforementioned 4 to 6 percent annual decline rate.”
Saudi oil officials have said they can produce up to 12 million or even 12.5 million bpd if needed, particularly in the event of a sudden, global supply disruption.
Some say it is not a question of whether Saudi can do it, it is a matter of how soon.
Former oil minister Ali al-Naimi had said that to reach 12 million, Saudi Aramco would need 90 days to move rigs from exploration work to drill new wells and raise production.
Saudi Arabia has been working for most of this year towards boosting prices, rather than leaving that job to market forces, a shift from the strategy it had championed since November 2014.
The pain of cheap oil was enough to bring other producers to the negotiating table, but industry sources said the kingdom was also keen to seal a deal as it plans to offload a stake in Aramco by 2018.
————————————————-
My comment:
According to OPEC agreement, the Saudis pledged to cut supply by 486 kb/d from a reference production level of 10,544 kb/d to 10,058 kb/d. According to Saudi official sources (shown as “direct communication’ in OPEC’s monthly report), the country’s crude output reached record level of 10,720 kb/d in November. According to the IEA’s estimate and Reuters survey, Saudi output was also higher in November vs. October. By contrast, estimates from “secondary sources” (also shown in OPEC’s MOMR), indicate a slight decline to 10,512 kb/d.
In any case, important to note that in 2016, unlike the previous years, KSA’s output has stayed at elevated levels in 4Q despite the usual seasonal decline in winter when domestic consumption of crude burning for power is less. Saudi crude exports have also been high in recent months. Earlier this month, KSA cut January oil price to Asia to four-month low to keep market share.
It seems that the Saudis are trying to sell as much crude as they can before the planned cuts.
Meanwhile, Saudi Arabia has informed its clients in North America and Europe that their crude oil deliveries in January will be lower, to reflect the country’s compliance with the production cut agreed by OPEC members.
https://www.bloomberg.com/news/articles/2016-12-09/saudi-aramco-makes-good-on-opec-promise-to-cut-january-supplies
Furthermore, Saudi Arabia said it is ready to go above and beyond its pledge for the OPEC deal and cut production to below 10 mb/d.
http://oilprice.com/Energy/Oil-Prices/Can-OPEC-Send-Oil-To-70.html
As the chart below shows, in the past 2 years Saudi Arabia increased oil production by about 1 mb/d. The country was the main contributor to the current oil glut over that period. Now the Saudis pledge to remove from the market about half of this incremental supply.
Saudi Arabia oil output and agreed production quota (mb/d)
source: OPEC Monthly Oil Market Report, December 2016
Some confirmation of what many people here suspected for some time: KAS behavior might be destructive or at least damaging for long term future of their own reservoirs:
http://oilprice.com/Energy/Energy-General/The-Oil-Mystery-Behind-Saudi-Arabias-Production-Cut.html
There might be Seneca cliff for KAS lying ahead although Seneca cliff for natural gas in the USA is even more plausible… See also older discussions
http://peakoilbarrel.com/world-cc-decline/#comment-565480
http://peakoilbarrel.com/eias-annual-energy-outlook-seneca-cliff/#comment-571013
http://peakoilbarrel.com/big-trouble-at-exxonmobil/#comment-586023
http://peakoilbarrel.com/world-oil-reserves/#comment-583137
above your post is my post with a link to the original article in Reuters
Concerning the OPEC report, I don’t know if it’s because I read the report in a bit more detail or maybe there have been budget cuts, but there seemed to be more few errors than usual. For example here: “…production at the Kårstø oil field going offline for maintenance…” – Kårstø is a large, onshore gas plant that feeds Europe, they might just mean Åsgard , which feeds it, but if the plant was shut in then offshore fields would have had to be taken offline as they wouldn’t have had an outlet for their gas – and here: “As of 2017, Brazil’s Petrobras will begin seeking offers for the construction of seven new offshore oil platforms envisioned in its current investment plans. Oil production is expected to increase by 0.25 mb/d to average 3.40 mb/d when these projects materialize next year.” – really? Seven multi-billion projects, one year schedule and only 250 kbpd new production? – and here: “…oil supply is projected to grow by 0.3 mb/d, despite initial projections in July 2016 for a contraction (Graph 2). This is mainly due to higher price expectations for 2017. The main contributors to non-OPEC supply growth are Brazil with 0.25 mb/d, Kazakhstan with 0.21 mb/d, and Canada with 0.17 mb/d.” – all the quoted growth comes from projects sanctioned several years ago and that have been completely unaffected by the price changes, up or down.
I’ve had another look at Iraq. In 2010 twelve contracts were awarded for development of fields there, consisting of brown-field projects on fields already producing: Rumaila, West Qurna 1, Zubair and the Misan group (the Buzorgan, Abu Ghraib and Fawqa); and green field projects on discovered but undeveloped fields: West Qurna 2, Majnoon, Halfaya, Gharaf, Badra, Qayara, Nahr Umr and al-Ahdab.
Before 2010 most Iraq production came from Rumaila in the south and Kirkuk in the north. PeakOilBarrel had a post concerning depletion in giant fields (http://peakoilbarrel.com/jodi-data-and-giant-field-depletion/) with data from Horn and Associates for depletion on giant fields. They had Kirkuk at 11.9%% remaining, Zubair at 17.75%, Rumaila at 19.2%, West Qurna at 29.57% and Majnoon at 32.56% and Nahr Umr at 17.4%.
By OPEC statistical bulletin this year Iraq had produced 40.1 Gb by year end 2015. For the fields listed in the study the total oil produced was 74 Gb based on the recoverable oil and estimated remaining, so something doesn’t add up. I think the numbers for Majnoon and Nahr Umr must be questionable as they were greenfield projects. Without them the production would be 60 Gb – still too high, so back to square one. I think really only Kirkuk and Rumaila are highly depleted, the Horn and Associates figures give their production at 46 Gb – which is closer, and supports my thought.
Most of recent production (80%) comes from the southern fields (i.e. not Kikuk in the list above), with sixe dominant: Rumaila, Zubair, West Qurna 1, West Qurna 2, Majnoon and Halfaya. These fields all (I think) have at least three reservoirs, in different ratios: Zubair, Mishrif, and Yamama. Most production to date is from Zubair in Rumaila, this is API 35, sour with 0.9 to 4.5% Sulphur. It has aquifer support so does not require water injection, although I think there has been some taken from the Tigris and Euphrates rivers (this is a supply at the limit currently). Mishraf is heavy oil, API 25 to 28 and sour, Yamama is sweet and API 35. Neither Mishraf nor Yamama have aquifer flood and need water injection. Mishraf produces 1000 to 3000 bpd per well initially; Yamama produces 2500 to 15000 (a bit less than Zubair).
The new fields with service agreements with IOCs have majority reserves in Mishraf and Yamama and therefore need water injection and produced water treatment facilities. The centralized facility for 12 mmbwpd water (which could support 6 to 8 mmbpd oil production given typical design water cuts) was originally planned with ExxonMobil as lead. They either got kicked off or left, depending on who you read, and nothing much has happened since. Last year the Iraqis indicated the projected would be completed in 2020 (which seems aggressive given the size required( since then nothing has happened so 2021 would be the earliest but I’d guess not before 2023 for the full plant. There have been articles indicating Eni and BP are looking to develop local, smaller systems – but I have seen nothing to say these were approved for budget from Iraq and have been developed. Without water the fields cannot be produced at high rates without damaging the reservoirs.
Overall for the southern fields I’ve seen figures of 200 to 300 OOIP with 45% Mishraf, 26% Zubair (23% Yamama, and 6% others (approx.). Zubair is but probably 60 to 70% depleted, I have also seen numbers that the Rumaila field, which produces mostly from Zubair, although depleted, currently has 17% decline rates (i.e. needs continuous in-fill drilling just to maintain plateau).
Therefore a big issue may be the expected recoveries on the less depleted reservoirs.
The heavy Mishraf field is about 45% of original OOIP but maybe 60% of what remains. Assuming recovery factors of 15 / 25% for Mishraf up to 30 / 35% for Yamama and 45% for the remaining in Zubair would give URR of 45 to 70 Gb (there may be options for another 10 to 20% with EOR applications). If the fields were treated with the same care that Saudi has used, with detailed modeling extensive drilling and monitoring, options to rest sections to allow the water contact to stabilize etc. then the higher recovery might be possible. However that doesn’t seem the current route.
Given development in production sizes of around 250 kbpd increments those reserves would support 6.6 to 10 mmbpd. Currently the south produces 80% of Iraq’s oil or (say) 3.6 mmbpd, allowing an extra 3 to 6.4 mmbpd from new developments. The original plateau expectation for the seven main fields was 11.25 mmbpd, which was early on reduced to 7.15 mmbpd, and current production target for 2016 is about 3.1. Therefore it looks unlikely the 7.15 can be achieved and definitely not before there is enough water handling available after 2021 at the earliest. But there may be another 2 to 5 mmbpd to come eventually (although there may be decline in existing fields during the development period, which may be starting soon: the rig count has dropped from an average of 90 in early 2014 to around 40 for the last six months).
The only IOC that has announced new production developments is Lukoil for West Qurna 2, for 150 kbpd increase in 2021. I don’t know whether this is from Zubair reservoir or they need injection water (and if so where it would come from). Even with aquifer support they would need to be able to treat and discharge or recycle any produced water. Probably the field with the worst options is Majnoon, operated by Shell, which is at least 60% heavy oil. The original plan was to reach 1.8 mmbpd, amended down to 1 mmbpd and now held at 200 kbpd. Shell recently announced they would like to exit their contract their.
From all the currently known, but non producing (i.e. under construction or appraisal) conventional oil fields I think there is no more than 20 mmbpd of production available. With the present low discovery rate this could at best climb by about 350 kbpd per year (and eventually zero). In a recent article Kjell Aleklett gave the figure at 15 mmbpd available from discovered, undeveloped plus 5.8 for projects under construction, if I understood what he said correctly (his new book should confirm when available in English), so I think I’m in the right area – I was surprised how close we matched, I thought I’d be 20 to 40% under estimating. There is XH oil in Canada and Venezuela, and LTO (maybe a lot outside the USA – remains to be seen), and Iran is a possible unknown (but it has far fewer greenfield reserves than Iraq and it’s older fields are heavily depleted). But even given all that, Iraq is probably the largest single potential contributor over the next 5 years.
No matter what the capital cost for significant development would be high, maybe more than elsewhere onshore (even shale?) given the need for security coverage, so say $65 to $90 billion per mmbpd. Currently Iraq are expecting the IOCs to pay, with an increasing delay in pay back, and maybe also an increasing awareness of the risk of asset seizure if things go wrong again over there. For example Trump may not have the will or means to intervene; I can’t really follow what his exact policies are but the always seems to be a nebulous, post-imperial theme of making the USA into an autarky, which would be incompatible with investment in foreign owned fields (Tillerson may have other ideas); Russia is increasingly a wild card (maybe theyand China will be the ones running and protecting the fields), Isis or whatever else comes along will continue to agitate and destroy; and I think Iraq is still in the top ten countries for corruption issues etc.
With the Fed increasing interest rates this week and the potential for more rate rises in 2017, I am surprised not to see any discussion on how this will effect shale drilling. Everybody on here agrees, the shale revolution is built on cheap money. As money get more expensive, that means higher cost or just less money for shale.
Most of the shale drillers have survived the oil crash, due to the ready supply of cheap money. It may not depend on how expensive oil can go, if that easy money just drys up.
One year ago the Fed executed an interest rate increase, and loudly projected several additional rises in 2016 on the path to “normalization.”
There was one. This week. A year later.
Go find the articles from last year.
Thanks Watcher,
So you ate saying the market doesn’t fully believe the fed will follow through with more rises, and we will have to wait until the fed shows their hand a little more?
Good point, Watcher. I too have noticed the manipulative strategy of the Fed to induce a mindset in the business world by claiming coming action, irrespective of their true intent. There is a major difference between what they say they will do and what actually occurs.
But I also like Yellen’s claim of multiple int. rate hikes to come in 2017 to offset inflation from Trump’s stimulus plan, because it was Trump that claimed she was acting on behalf of Obama to keep rates low. However, higher rates would nullify much of any stimulus, so Trump is caught in a web of his own making. As an aside, McConnell has said there will be no stimulus, as I am sure most on Capital hill are aware that higher rates risks loan defaults on those shiploads of debt.
How many military installations are located within 600 miles of the Bakken oil mega field?
One in Cheyenne, Wyoming, one in South Dakota, one in Nebraska, two in North Dakota, there is one in Montana.
There are also several coal-fired power plants in those states. Air force bases need a reliable power supply, the power plants can do that for sure.
All of those air force bases are going to use oil and all will be using electricity to keep it all going.
The costs of drilling 20,000 oil wells to keep those air force bases on the go are small in comparison to the investment required to maintain six air force bases. It is better to have the wells drilled and ready to produce oil than not to have them at all. There are oil storage facilities in Wyoming up the wazoo.
The Bakken is a strategic oil producing region, costs don’t matter, the oil does.
I’ve a new post on LTO production from horizontal wells in the states I cover: here.