Rystad Energy has published an interesting article claiming that the US has more oil reserves than Saudi Arabia… if you include shale oil.
A new independent estimate of world oil reserves has been released by Rystad Energy, showing that the US now holds more recoverable oil reserves than both Saudi Arabia and Russia. For US, more than 50% of remaining oil reserves is unconventional shale oil. Texas alone holds more than 60 billion barrels of shale oil according to this new data.
I will not quote the entire article for copyright reasons but would invite you to go there and check it out. Their final total, their 2PCX reserves, includes undiscovered fields.
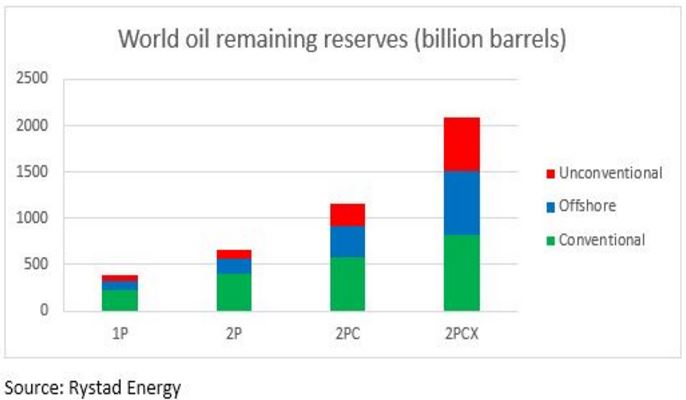
The devil is in the details, or rather the legend at the bottom of the above chart. First I do not understand their 2PC reserves “existing fields and discoveries”. If it has been discovered then I would think it is an existing field. Their difference between 2P and 2PC is almost half a trillion barrels. That is 497 billion barrels! Does that mean discovered but not yet drilled? Naaw… I just don’t think so.
But fields not yet discovered number a whopping 940 billion barrels! Almost a trillion barrels of oil out there just waiting to be discovered. And that does not even include the 497 billion barrels they just label as “discoveries”.
Give me a break!
Bloomberg has a slightly different opinion:
Oil Discoveries at 70-Year Low Signal Supply Shortfall Ahead
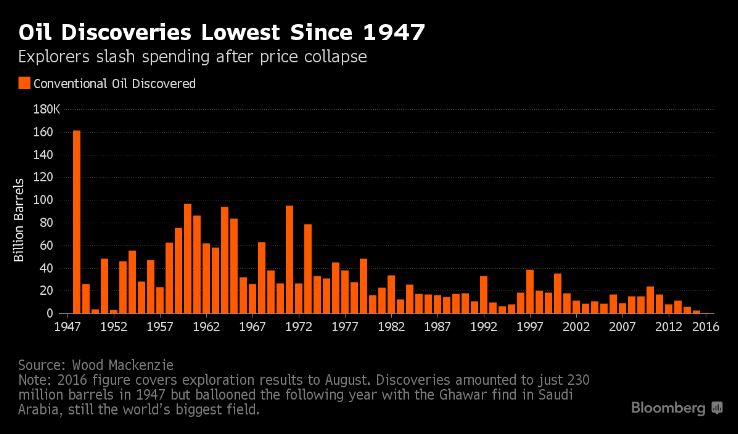
Explorers in 2015 discovered only about a tenth as much oil as they have annually on average since 1960. This year, they’ll probably find even less, spurring new fears about their ability to meet future demand.
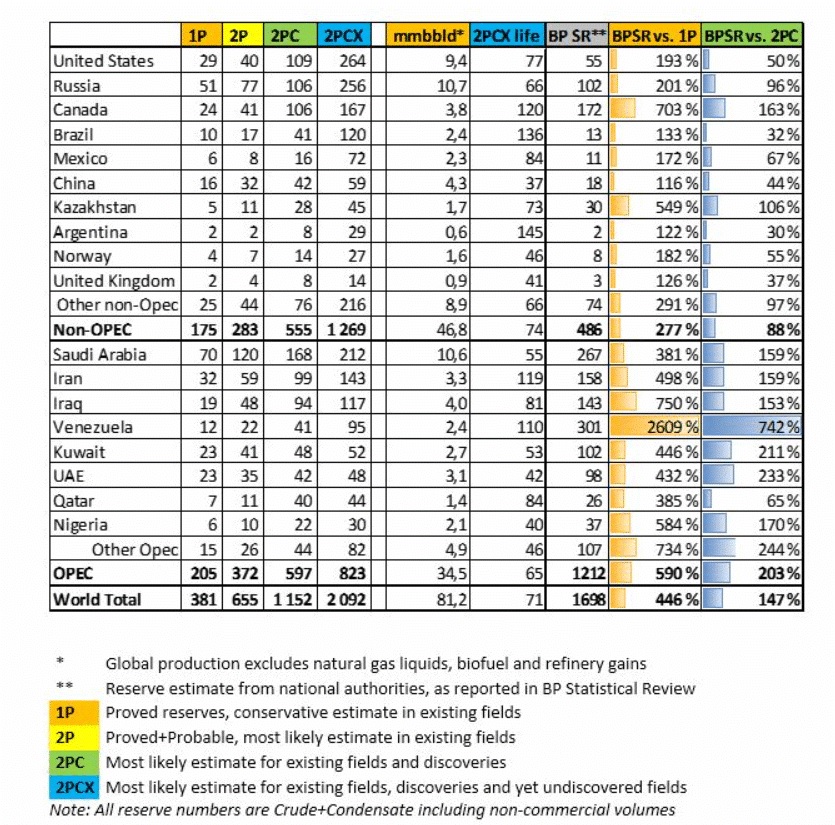
However let me give credit where credit is due. At least, in my opinion, Rystad does get their 2P reserves right, or very close anyway. They have OPEC 2P reserves at 372 billion barrels and Non-OPEC 2P reserves at 283 billion barrels for a total of 655 billion barrels. That is very close to the number I have been quoting for years.
The EIA has stopped giving production numbers for all producing countries. Instead they have changed to a report that just gives production numbers for the major producers.
EIA World Oil Production Their data is only through June 2016 and is in thousand barrels per day.
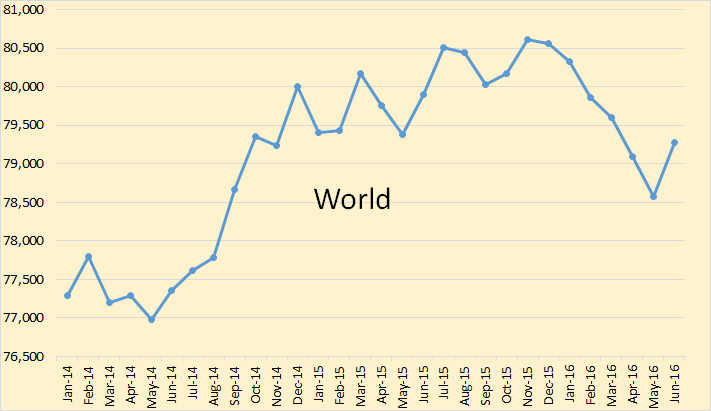
Production was up in June but still way down for the year.

OPEC saw a huge jump in June. Every OPEC country is producing flat out, trying to reach maximum production before a “freeze” is proposed for OPEC.
I will have a post based on the OPEC Monthly Oil Market Report on Friday. That report will have the OPEC crude only production numbers through September.

The decline in Non-OPEC production far more than offsets any increase in OPEC production.
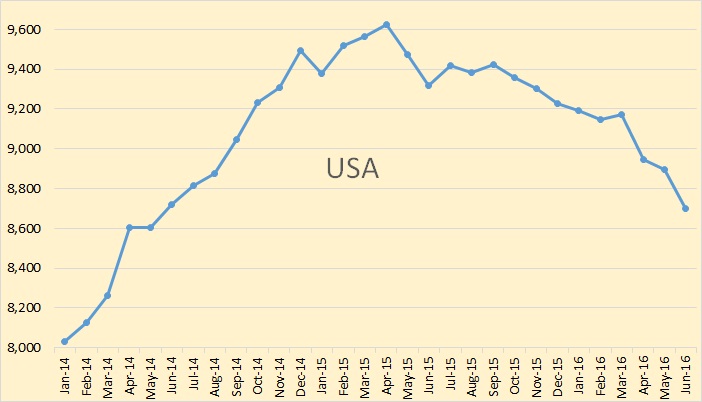
I look for US, and Canadian oil production to level out at about the level they were at in September but for the rest of Non-OPEC to continue to decline.
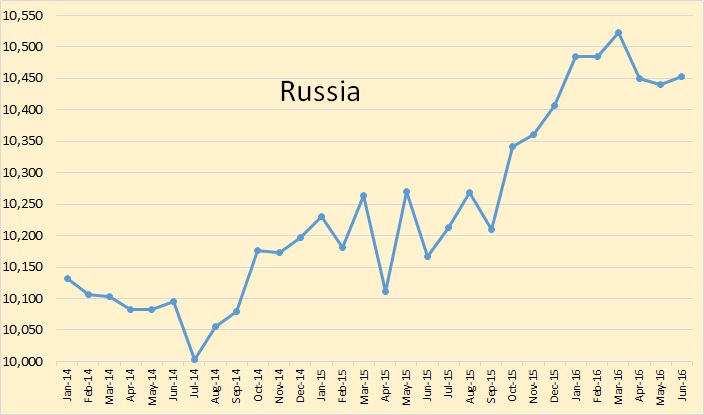
I am unsure about Russia. I will have more to say about Russia when I get the EIA report on Russian production in a couple of months. The difference between what the Russian Oil Minister reports and what the EIA reports Russian oil production to be is quite large and I am unsure why.
174 responses to “World Oil Reserves”
Interesting article by Art Berman
Wow!
http://oilprice.com/Energy/Crude-Oil/The-Billion-Barrel-Oil-Swindle-80-Of-US-Oil-Reserves-Are-Unaccounted-For.html
My unicorn is better looking than Rystad’s and besides … it can beat your unicorn at checkers!
This is how silly the entire Rystad article is … as per all the other articles it is about ‘supply’ (available to extract) with nothing at all said about what is done with the oil after it is pulled from the ground. Trillions of barrels of oil; trillions of useless words because they all carefully dance around the consumption issue … the absence of top-line return on waste of all that fuel.
Those trillion-plus barrels that have been already squandered: what do we have to show for them? A trillion barrels plus of the easiest to obtain oil, the closest to the surface oil, the oil that squirts out of the ground under field pressure, oil that is easiest to refine … most of it gone.
Not quite exactly: all of it is circling over our heads in the atmosphere like an avenging god, waiting for the chance to destroy us all … by poisoning or burning out our agriculture.
What’s left is under the ice or the middle of the ocean or part of cap rock; impossibly expensive to extract. Oil that is more corrosive than usual; that rots the pipelines and field equipment … oil that is more toxic or more explosive, more difficult to process, is not oil at all but more like asphalt or tar … what costs a lot more to pump, refine, distribute; costs that cannot be met with our ongoing, precious waste regime but only with more and more loans.
What do we have in our hands for all that oil wasted? Some potholed freeways and rusty/dented used cars, obsolete suburbs of biodegradable tract housing, concrete cities that begin to decay before they are finished … self-annihilating military, corrupt government, lying analysts, finance run amok all the way past insolvency into liquidation, poisoned water, poisoned land, depleted topsoil, super-bugs and super-weeds … that’s it. No ‘wealth’ to share, nothing to pay for lifting what remains, only unicorns dancing and losing at checkers.
What do we have in our hands for all that oil wasted?
About 5.5 billion more people. None of them would say that is a waste.
But they’ll be going away soon, quickly, violently, as flow does.
Not really. North America is mostly empty, despite the vast waste of oil. It may fill up in the coming century, but that will be frugal Asian or African immigrants.
North America exports a lot of grain, but it isn’t nearly enough to explain its ludicrous oil consumption.
When Europeans came into America, they displaced the natives by vastly more efficient land use. If there is another big pulse in population in North America, it will be are replacement of the current development pattern with much more efficient energy and land use.
Places like the lower Mississippi valley are emptying out — America as we know it has failed there. Bangladesh isn’t much bigger than Mississippi, but has 50 time the population, and is booming economically and demographically. By 2050 Bangladesh will have the population of the entire US.
I can’t wait to live like the average Bengali. In fact I won’t wait, fortunately I’ll be long dead before that’s likely.
I wonder where all of the nitrogen, potash and water is going to come from to populate the North American continent with those billions of people.
Arguably, hunter gatherers lived better than the agriculturalists that replaced them.
I recall reading studies showing that tooth decay, stunted growth and infectious disease increased dramatically in the Near East when agriculture was introduced. I think I got that from Jared Diamond.
It doesn’t really matter what any specific individual wants. The question is what works, and what doesn’t. The development pattern of port war America is definitely failing, and has started changing.
Peak oil is only part of a much larger trend.
Well, I’m going to quote Gone Fishing here (with whom I totally agree),
“As long as we continue to disrespect the natural world, acting as if it’s just resources, something to be owned and used for our purposes without extreme forethought, then we are destroying our own foundation.”
What we have is everyone and most every creature near a deadly precipice covered in oil, coal and a wind of methane and carbon dioxide. That is why so many are working hard on finding new energy sources and transport, new ways to do things, taking the risks to do so.
A lot of what you said rings true, we can only walk the edge for so long. We either turn away on a new path or follow the slippery oil covered slope over the edge.
BTW I didn’t know that unicorns played checkers, they seem better designed for ring toss.
“Well, ok, but do you know where the invisible pink unicorn herds are?” Indeed I, for one, do Fred. And it’s certainly not for checkers: they’re massing for a Great Unicorn charge, the Final Assault on all climate change deniers.
In looking for a header image for my microarticle entitled, ‘Fermi’s Paradox, Solved?‘ (sort of echoing in a small way Steve’s sentiments), I ran into some research sort of by accident that I’ve thought about and suspected; that the insides of black holes may be the buds of new universes.
Speaking of unicorns and strange interiors, might pulsars, like Earth, have a creamy nougat center of oil? And could those ‘lighthouse jets’ actually be high-energy ejections of the nougat in a plasma state?
Anyway, how’s your pulsar reading going, incidentally? Anything significant to report in that regard? I just found out about ‘magnetars’.
Excellent comment, Steve.
Mr. Patterson
While scanning through production files of Upper Devonian wells in western Pennsylvania – this to better understand its emerging importance for that area’s potential – I stumbled across a permit issued to Shell (SWEPI), in 2013 targeting the Black River Limestone. (No drilling yet with that permit).
What the heck is the Black River Limestone?
Well, as of this moment, there are producing wells targeting the Trenton Black River in Ontario, New York State, Kentucky, West Virginia, and Michigan. (Continental had a small Michigan operation a few years back).
In north central Pennsylvania, in Tioga county, SWEPI currently runs about a dozen successful Utica wells, with a handful including the deeper Trenton Limestone on the permit application. This continues to fuel speculation that data gathering is occurring in regards to the TBR while normal production activity targets the Utica).
Point of all this, Mr. Patterson, is that wether it is Rystad, Blomberg, any person or outfit that professes to know what is out there is in unknown territory
“Point of all this, Mr. Patterson, is that wether it is Rystad, Blomberg, any person or outfit that professes what is out there is in unknown territory.”
As a retired exploration geologist/geophysicist I disagree. We know well, very well, “what is (and isn’t) out there.
Gotta go with Doug on this one. At this point it’s diminishing returns. Small, hard to get to and extract oil discoveries at best for the private companies.
“In a competitive market the rational strategy for Western oil companies would be stop all exploration, while continuing to provide technology, geology and other profitable oilfield services to the nationalized owners of readily-accessible reserves. The vast amounts of cash generated by selling oil from existing low-cost reserves already developed could then be distributed to shareholders until these low-cost oilfields ran dry. This strategy of self-liquidation could be described euphemistically as “running the business for cash” in the same way as tobacco companies or closed insurance funds”
And then there is the carbon problem. Stranded assets.
“But what of the first condition? The Saudis would surely want to stabilize prices at some point by limiting production, but the target prices may now be considerably lower than previously assumed. The Saudis seem to have realized that by ceding market share to other producers they risk allowing much of their oil to become a worthless “stranded asset” that can never be sold or burnt. With the global atmosphere approaching its carbon limits and technological progress gradually reducing the price of non-fossil fuels, the Bank of England warned this week that some of the world’s oil reserves could become “stranded assets,” with no market value despite the huge sums sunk into the ground by oil companies, their shareholders and banks.”
http://www.reuters.com/article/us-kaletsky-oil-idUSKCN0JK01N20141208
Currently booked reserves won’t become stranded assets. The variables in the ultimate recovery is price, and that in turn depends on demand. Demand will depend on the ability of some sort of replacement energy source to gradually replace oil.
Since there’s a vast difference between proved and ultimate, which includes a very large amount of speculative resources, the idea that current proved oil reserves will become stranded is fairly ridiculous. On the other hand, it’s possible that coal will lose attractiveness if nuclear power technology becomes more competitive and popular.
As a retired exploration geologist/geophysicist I disagree. We know well, very well, “what is (and isn’t) out there.
Well, ok, but do you know where the invisible pink unicorn herds are?! 😉
There is no such thing as an IPU herd. They are just the one, oscillating in time and space giving the non-appearance of a herd. Often not seen near the holy hay bale and sacred grain.
Hah! I’ll take your one oscillating IPU and raise it to my top secret perpetual motion wheel powered by multiple IPUs. It’s like a combination hamster wheel with Heisenberg’s indeterminacy principle applied to IPUs constantly popping in and out of existence as you try to measure the power they produce.
.
You win Fred, I give in. Looking at that is like listening to a presidential nominee debate, except the positive feedback part.
But thinking about it further, I think that is a great model for the way civilization un-works. Needs some cows though.
Damn you, thermodynamics.
Anybody notice the “stimulus” of low gasoline prices didn’t improve GDP?
http://www.tradingeconomics.com/united-states/gdp-growth
Offset by the lack of oil field activity. The USA was becoming very tied into the oil field sector.
Somewhat, but these things are global. A chart of global GDP has a similar look. No uptick, and QE globally has been about constant — with Japan and the EU taking over from the Fed.
Lower gasoline prices did not goose GDP.
Imagine that.
Lower gasoline prices did not goose GDP.
Which only makes sense for the whole world. Higher or lower prices: they just transfer income from one country to another. If oil prices rise, oil exporters have more money, and importers have less. If oil prices fall, then importers have more money, and exporters have less. It’s a zero sum game.
Expecting oil prices to affect overall GDP is a very US-centric point of view. And, in this case, Fernando is correct: the decline in oil spending was offset by the decline in oil-patch investment and employment. Of course, that’s a short term effect. At some point after the oil patch stabilized at a lower level, continued low oil prices (admittedly, an unlikely thing) would help the US.
Oil and Gas costs are a smaller percentage of our budget and have been shrinking over the decades. I am not surprised that shrinking prices have less impact.
This isn’t 1973. The economic importance of oil has been steadily falling for a generation.
Wake up old timer, a new day has dawned. The kids don’t need gas to run their smart phones.
Interestingly, the 73 oil crisis coincided with the beginning of the end of absolute poverty.
https://ourworldindata.org/grapher/world-population-in-extreme-poverty-absolute
Come mothers and fathers throughout the land…
Oil and gas fields are anomalies.
We have studied very known producing basin in the world; we know the source beds where hydrocarbons originated, the depositional environment of sediments in those basins, how oil migrated into those sediments and the trapping mechanisms where fields exist. We have mapped them, flown them with magnetics, cored them for soil chemistry, shot them with 2D, drilled them, logged them, tested them, mapped them again, shot them with 3D and mapped them again. They have been pricked, probed, analyzed and proven, or disproven plumb to death. There are very few secrets left, Doug is correct. Shale oil is a nothing more than a costly, unprofitable dribble. What is left that might be of social significance is in very deep water or under ice and we have no idea when or if that will ever be profitable enough to explore for. Trying to predict unproven, yet undiscovered oil reserves in the world is kinda silly; we can’t even get the truth on proven developed reserves. Not from KSA or CLR.
There are some areas we really haven’t tested. Alaska has some unknowns, and the same applies to say the Chukchi and the Kara Seas. I think there’s some unknowns offshore West Africa, below the salt. And I always wanted to risk wells in Paraguays Chaco below the volcanics. Not a lot, but there’s a little bit here and there.
and then there’s always hope for that abiotic oil those Russian fellas found out about………………….;>)
Mr. Hightower
You, certainly, recognize the specifics needed for hydrocarbon formation over geologic time.
What was the thinking a few years back on the pre-salt resources? That, BTW, is a sincere inquiry, not smart ass.
How many organic bearing shale formations exist in the US alone, in stacked array?
Was it only five years ago that the two Oklahoma unconventional plays were virtual unknowns?
The few people that seemed to take Wrightstone Energy’s study seriously last year (EQT, apparently, being one of those), when the claim of 100 Tcf recoverable from the PA Upper Devonian formations was made, are now seeing output far exceeding original prognosis.
How long did operators trip over Anadarko’s west Texas find and see little?
Pre Colonel Drake’s well in 1859, there was oil production across the border in Canada. Has the source rock been identified and exploited? Could this be more evidence of the TBR?
Oil and gas fields are certainly relatively uncommon, to put it mildly. But this incredibly disruptive application of various technologies … 3D seismic, 1,500 HP, top drive, AC rigs that routinely drill over a mile a day, walk 40′, and do it again, bits that can make 18,500′ in one run, rotary steering systems that have one foot vertical, one foot horizontal deviation in 20,000′ TMD wells, pumping 20 million, 25 million pounds of sand into 2 mile long laterals, and on and on … all this has changed our lives forever.
All this and more has opened up potential development in areas heretofore considered non viable.
Mr. RT
The biggest disruption yet barrelling down the pike for the oil focused people in particular is the Adsorbed Natural Gas breakthroughs of this past year.
The day is not far off when Mr./Ms. Homeowner will be filling up their formable tank with low pressure natgas right from their own residential supply.
It is already technically possible to do.
Dood, why do you keep on with this after you’ve been shown time and again how much money these techno miracles are losing?
They may have changed our lives forever. They may get the industry nationalized.
I was trying to get presalt drilled offshore West Africa in the 1980’s (I had looked at the Gulf of Suez, where 99.9 % of production is from below Miocene salt). The problem we faced was lousy seismic, but we knew it had to be there. Unfortunately oil prices simply didn’t allow taking the risk.
By the way, organic shale isn’t the only ingredient needed to make a “shale” play. This is why the industry failed to find anything viable in Poland, and thus far tests in Australia, China, California, and other areas are fairly disappointing.
I am sure you could get a position in the Cline shale at a good price. Monterey shale as well. There is no technology in the world that can substitute for quality porosity and permeability. It is capital intensive and regardless of the IP’s, they are not covering their costs. I would consider the shale play an economic miracle, defying all the normal laws of economics, more than anything else.
There are others on this board way more qualified than me who can elaborate on if/when shales in other basins throughout the world will or can be exploited (Fernando for one), but if I had to guess, I would say for the most part, NO. And it has more to do what is going on above the surface than below the surface.
The Trenton -Black River type reservoirs are I believe wild cards in the prediction game. They are conventional reservoirs of dolomite replaced limestone that are nearly invisible to present day seismic imaging. This type of reservoir awaits the followers of the old geologist, Pratt, I believe, who said, “Oil is first found in the minds of men”. Of course we never admit how many fields we just found by accident while drilling toward another objective!
Hi Ron,
I wonder if you are of the opinion that production is generally falling off faster in small producing countries than in the larger ones?
Where will you be going for production data from the countries that are no longer included in the EIA reports ?
I will always be a peak oiler, as there is no other rational choice, if you happen to know oil comes out of holes in the ground and doesn’t grow back like potatoes, lol.
I suppose it is possible that there really are hundreds of billions of barrels of shale oil in the ground, within the USA, but getting it out of the ground is going to take some sort of new techno miracle, since most of it will come out only in small quantities per well at enormous expense using current technology.
Given time, I also suppose we could collectively adapt to oil that costs two hundred bucks in current day money at the refinery intake pipe. But that would require that the price of oil rise gradually over many years, thus allowing us to learn to live with very little oil per capita. We could if we were forced to do so learn to live with short range electric cars, all essential long distance freight moved on trains, railroads again going to every little town, etc. We could learn to get by without throwaway junk, and buy only quality stuff, which would last five or ten times as long and require a fifth or a tenth of the shipping.
We could manufacture enough synthetic oil from coal to run such trucks and cars as are actually ESSENTIAL – trucks needed by the electrical utilities, police, construction companies, etc, and cars for cops, etc.
But something in my gut tells me there is an oil supply crisis headed our way, sometime within the next decade or so, due to the combination of depletion and population growth, because I just don’t see electrified autos, etc, scaling up fast enough to outpace depletion.
I intend, if I am still able, to have a couple of thousand gallons of diesel stashed properly, and plenty of the bulky things that can be easily and cheaply stored indefinitely on hand well before such a crisis arrives. My guess is that the price of such stuff will double or triple, whereas the banks wants to pay me only one or two percent on any spare cash I can afford to loan to them on their terms, lol.
For those in a position to do some hands on prep along these lines, I suggest storing some or all of the following stuff.
Diesel fuel, bulk lime, fertilizers, various sorts of hardware, lubricants, pesticides, salt, gravel, masonry block and brick, roofing shingles, damned near anything you WILL need that can be put in a large mostly empty barn located in a place where theft is unlikely.
The salvaged steel I bought the last time the economy took a nose dive is now worth at least ten times as much as I paid for it, not as scrap, but as building material, even though WHOLESALE steel is cheap right now. Retail steel is thru the roof.
I bought my backhoe at the same time, and have been using it quite often ever since, and was offered more than I paid for it recently. A good bit more.
The price of new pickup trucks will probably double in terms of cash within the next ten years, because of mandated fuel economy, tougher safety standards, tighter pollution controls, etc. If you are going to need a truck, but don’t expect to drive it very much, now would be the time to buy one that is a few years old with a hundred thousand miles on the odometer.
What it will cost to maintain it thru your old age will be peanuts compared to the cost of buying a new one later, especially considering the opportunity cost of the money.
Except for the lack of air bags, my old ninety one Chevy will last another ten of fifteen years, four or five thousand miles a year, for less in repairs and maintenance than taxes, insurance and maintenance on a new truck. The thirty grand difference will be invested in permanent fencing, fish producing small lakes, a new stand of planted white oak timber, gravel for permanent roads, etc, on my place. All of these things are extremely likely to be worth more in cash or barter than money in the bank , and far less likely to be lost than money in paper investments.
Ya don’t want to get caught in Egypt, or making payments on an unneeded F250 when the next oil crisis hits, lol.
Of course with LUCK there might not BE a crisis. Maybe Elon Musk and his buddies will save us from the down side of peak oil.
But maybe they WON’T- at least not in a timely fashion.
I wonder if you are of the opinion that production is generally falling off faster in small producing countries than in the larger ones?
Yes, of course it is. Small fields just naturally decline much faster than large ones.
Where will you be going for production data from the countries that are no longer included in the EIA reports ?
Nowhere. I will just have to do without that data. JODI produces data for many, but not all, of the small countries that the EIA no longer follows. But their data is spotty and, in many cases, not accurate.
Saw more railcar loads of fracking sand headed up into northeastern Pennsylvania. Still fracking up there.
According to the Rystad article:
The new reserves data from Rystad Energy also distinguishes between reserves in existing fields, in new projects and potential reserves in recent discoveries and even in yet undiscovered fields.
So it does seem that 2PC in this article is defined as discovered but not yet drilled. But it does seem crazy that discovered fields containing half a trillion barrels haven’t been drilled yet. Maybe they’re talking about the Orinoco belt and parts of the Canadian oil sands?
It’s interesting to note that Saudi 2P reserves in this article are only 120 billion barrels, which is only 45% of official Saudi reserves of 268 billion barrels.
There are some large discovered fields we haven’t developed. Some are in Alaska, Canadian Beaufort, Sakhalin, Othosk, and other areas in Russia, Falklands Basin, Mexico’s Chicontepec, and so on.
PUTIN AND ERDOGAN PLEDGE DEEPER MILITARY CONTACT AFTER GAS DEAL SIGNED
“The two countries have signed a deal to construct two pipelines to send Russian gas under the Black Sea to Turkey…. One pipeline will be for Turkish domestic consumption, the other will supply southeastern Europe, bypassing Ukraine.” Earlier Mr Putin told the gathering he supported moves by the oil producers’ group OPEC to cap production.
http://www.bbc.com/news/world-europe-37613273
And so ends any reason for interest in Syria. GAZPROM will maintain their monopoly in Europe.
Rystad’s 2P reserves is their most likely remaining recovery from existing fields. Their 2PC reserves is 2P + discoveries. I interpret what they call discovered reserves to be fields that have been discovered, but the fields are at least not on production, or the projects maybe not even sanctioned. This is the case for most deepwater projects. Now – is there 497 billion barrels worth? (225 Opec and 272 non-Opec). That seems to me to be quite a stretch.
According the their numbers, the US has 69 billion barrels of discovered reserves that have not been put on production (109 – 40). Again, that seems quite high to me. I wonder which category unproduced oil from US shale plays falls into – is it in their “discovered” category, or their “remaining recovery from existing field” category?
It still makes no sense whatsoever. 2P id proven + probable. Probable is, by definition, undiscovered oil. Discovered but un-drilled is not even probable, it is proven, that is 1P reserves. None of this 2PC or 2PCX makes any sense at all. What they should call it is 3P reserves, proven + probable + possible. However that many barrels of oil above 2P reserves, 1,437 billion barrels, is not remotely possible.
Hi Ron,
Jean Laherrere’s estimates are usually pretty conservative. His most recent estimate for URR for C+C is 3000 Gb. At the end of 2015 about 1280 Gb of C+C had been produced, this suggests there are about 1720 Gb of C+C left to produce (this includes oil that is “yet to be discovered”.) Jean Laherrere’s estimate coincides with my “low” scenario for C+C output, my “medium” scenario matches Rystad’s estimate.
http://aspofrance.org/files/reservesUS_SA_%20Ru_UK-JL2016.pdf
See page 16 at document linked above which also considers the Rystad estimate.
If high oil prices leads to relatively rapid substitution of other energy sources (including wind, solar, nuclear, and other non-fossil fuel energy) for oil, then the low scenario is more likely, but I am not that optimistic. 🙂
Thanks Dennis. Here is the chart from page 16:
I have defective color vision but as near as I can tell, Jean is predicting that C+C is at peak right now. As I have said, I have defective color vision so please correct me if I am wrong.
Hi Ron,
You are correct. The line that peaks around 80 Mb/d is the C+C line (C+C+NGL is the highest scenario). Jean Laherrere’s C+C scenario with a URR of 3000 Gb (3 Tb) is very similar to a scenario I did in April 2016 with a URR of 3300 Gb (including 500 Gb of extra heavy oil). Compare chart below with the green line (80 Mb/d peak) in Jean Laherrere’s chart above. In 2040 and 2060 output is almost the same in both scenarios.
Jean Laherrere corrects me:
Ron you are wrong
2P is for discovered reserves
undiscovered is reported as prospective resources not reserves
Okay you are correct, but that just puts them into the 2P catagory, discovered reserves, not 2PC.
Just to expand on Jean Laherrere’s table above on the difference between 1P, 2P and 3P reserves – these apply to a discovered field that is either on production, or at least been sanctioned. At that time, a company can book reserves. Whether reserves are booked as 1P, 2P or 3P depends upon the confidence you have (and that you can convince the SEC of) as to whether the reserves will be produced.
1P reserves mean you believe, with about 90% certainty, that you will be able to produce those reserves. 2P reserves are those additional reserves between your 1P estimate and your most-likely estimate, and 3P reserves are those additional reserves between your most-likely estimate and your upside estimate.
The main inputs that go into the calculations are low, mid and high estimates of both original oil in place, and recovery factor.
The table below shows how reserves might be booked for a hypothetical oil discovery with a most likely oil in place of 100 mmbo and a most likely recovery factor of 25%, but each of these parameters would have a range around them. In this case I have made the OOIP range from 80-120 mmbo, and the R.F. range from 20-30%. From the table below, you can see the resulting ranges in EUR, and then, how these ranges in EUR get broken out into 1P, 2P and 3P reserves.
Hi SouthLaGeo,
I had thought 2P refers to proved plus probable and 3P to proved plus probable plus possible.
In your chart above 2P seems to be probable reserves and 3P is possible reserves, is that correct?
I may misunderstand the terminology or it may not be used consistently in the industry. I don’t really know, just trying to learn.
Thanks.
Dennis,
Very good question. First of all, I am not a QRE (Qualified Reserves Evaluator). My understanding is that the way I described 1P, 2P and 3P is technically correct. That is the way I have been taught, and, I believe, how the SEC describes reserves.
In other words, 1P = proven = high confidence reserves. 2P is, technically, not probable, but, the difference between “most likely” and high confidence/proven. And 3P is not possible, but the difference between “upside” and the sum of 1P and 2P.
Now, I believe, most publications define reserves as you did, Dennis – 2P reserves = most likely reserves = the sum of proven and probable. But again, technically, I don’t think this is correct.
This is why, in the chart above, I intentionally included both “high confidence”, “mid-case” and “upside” and 1P, 2P and 3P.
One reason reserves may be defined this way is if you consider how reserves might be booked over the history of the development of a field.
If you consider the example from my chart above – at project sanction, (or first production) the reserve distribution might be as I show – 1P=16, 2P=9 and 3P=11.
After a few years of production, you are able to perform decline curve analysis on the production profiles from the producing wells. Let’s say that when you complete that exercise, you end up convincing yourself (and the SEC), that the recovery from the existing wells is going to be at least 20 mmbo. At that time, you would move 4 mmbo from 2P to 1P. ( You want to book 1P reserves as early as you confidently can, because the more 1P reserves a company has, the greater it’s value).
Say you do this again a few years later, and convince yourself you can move an additional 4 mmbo from 2P to 1P – you do so, and your company thanks you. You may need to move some reserves from 3P to 2P to ensure you have enough 2P reserves for possible future 1P reserve adds.
If there are any QREs out there, perhaps you can weigh in on this.
Dennis,
Since me previous comment, I have searched online to clarfiy the definitions of 1P, 2P and 3P and everything I’ve come across supports your definitions, not mine.
I know, within the halls of where I work, we define 1P, 2P and 3P as I did.
I’ll chat with some QREs tomorrow and get clarification.
To the best I can tell, there is a difference between 2P reserves and P2 reserves (and 3P and P3):
2P = probable reserves
P2 = proven + probable
3P = possible reserves
P3 = proven + probable + possible
(P1 = 1P)
In my example above I should have been using the P2 and P3 labels, not the 2P and 3P labels.
Hope this clears things up.
Hi SouthLaGeo,
Did you get those terms reversed? Maybe Wikipedia has it wrong.
Also in your chart, based on your comment above, you did it correctly in the chart where you called probable 2P and possible 3P.
I think you meant to say
P2=probable
P3=possible
P1=1P=proven
2P=P1+P2
3P=P1+P2+P3
or I could be wrong (it would not be the first time 🙂 ).
Thanks for the clarification.
Hi Southlageo,
Thanks. I think Fernando also uses it the way you do, so I figured I had bad information.
In any case it was clear what you meant in your chart.
To beat a dead horse a bit more:
1P = P1
2P = P1 +P2
3P = P1 + P2 + P3
Dennis,
Your comment at 10:12 am is correct.
Dennis,
Your comment at 10:12 is correct.
Sorry for the confusion.
Thanks.
I had missed your 7:40 pm comment on 10/11/2016, sorry.
Perfectly clear now.
Probable isn’t undiscovered. Depending on the company and country norms, proved plus probable is the P50 reserves case.
Discovered but undeveloped can be classified as proven. Outside the USA, if you have high quality 3D and a nice clean sandstone play with hydrocarbon indicators, a single well with a good test, nice oil quality and sufficient pressure data can prove 100 plus million barrels.
The numbers are even harder to understand looking at some of the other individual countries. China and Mexico are in rapid decline at the moment but are supposed to have respectively, contingent 10 and 8 Gb and undiscovered 17 and 56 (!) – that has to be assuming a big shale resource for Mexico I’d guess. China has more rigs relative to its production than anywhere and this year is probably going to drill the most wells of any country. And yet they haven’t found a new oil field for many years (quite a bit of gas though) and have only bought on a couple of small offshore fields recently. Mexico has decided they need help from outside IOCs to find and develop all that resource.
Norway and UK combined have developed a lot of their older contingent fields over the last few years, at very high cost and in some cases are now losing money on the investment. Exploration success is now very low, reserve are being downgraded and yet they are supposed to have 7 + 4 Gb contingent and 13 + 6 Gb undiscovered. The 13 Gb for Norway includes frontier territory in the Barents Sea, but I think it’s turning out that there is more gas there (TBC).
It will be interesting to see the final discovery number for this year from IHS, Richmond Energy Partners, Rystad and Wood Mackenzie. I doubt if they will include the recent Alaska discovery given that the test well wasn’t flowed – the announcement looks to be more of a ploy to get some tax break and/or outside money into the private company. The other supposed monster find by Apache in Permian shale is 3 Gb equivalent oil in place, I’d expect it to be at the lower end for shale recovery, say 3 to 5%, so that could be only around 75 to 125 mmbbbls oil.
In GoM Fort Sumter was 125 mmbbls (equivalent) but it cn only be developed through Appomatox so might be many years away before there is processing capacity for it. Anadarko announced Caisco, but with no numbers which is usually a bad sign. On the other hand Hopkins looks to have been downgraded maybe 50%, so it is only a tie back option. Kaskida has gone quiet (HTHP and high sand), Shenandoah/Coronado (very HTHP probably needing 20 ksi wellheads) looks like it might be relatively smaller as a development than expected (or a series of smaller projects) , Freeport MacMoran projects (such as Horn Mountain Deep) are all on hold while it tries to sell up. Next year there is only Thunder Horse extension (27,000 bpd) and the year after Stampede (75,000) and Big Foot (80,000) ramping up in late 2018 through 2019.
A couple of highly anticipated and expensive frontier wildcats have been dry (Total offshore Uruguay and Shell offshore Nova Scotia – still drilling a second well there though). The Bight Basin in Australia is delayed because of environmental concerns.
The biggest two confirmed finds are gas offshore Angola and Senegal (400+ and 800+ mmboe respectively), both probably need to be developed through LNG so might be years away given the current glut and normal schedules for such projects).
In the North Sea reserves have been downgraded, not only because of price but also as some of the smaller finds no longer have options for tie backs because the possible hubs are coming to the end of their lives an new finds are in the 20 to 50 mmbbls range and heavy (also a number of dry wells there). I’d say it will likely be significantly worse than last year (which was the worst for 70 years) for both oil and gas discoveries.
At some point soon there’s surely going to be realisation, maybe starting with the investors, that oil and gas industry BAU as it’s been for the past 40 odd years is over and isn’t going to come back the same no matter what the oil price does. I don’t know what comes in it’s place though.
Coal to liquids comes in its place.
CTL is dead in the US. It’s alive and well in China, but I’d be surprised to see it grow a great deal, as it has the same pollution problems as coal generation.
I don’t know what comes in it’s place though.
Electrification: EVs for transportation, heat pumps for space heating. That covers at least 75% of current uses for liquid fuels. It will be a while before oil production drops to 25% of it’s current level, so we have quite a while to figure out what we’d use for aviation, lond-distance water shipping, seasonal ag, etc (which, in theory, are pretty straightforward to solve).
Anybody know the latest from Kashagan?
By coincidence, this morning: “BP dumps plans to drill for oil in the Great Australian Bight”
http://www.smh.com.au/federal-politics/political-news/bp-dumps-plans-to-drill-for-oil-in-the-great-australian-bight-20161011-grzjzv.html
That Alaska test may be for real if they took a full log suite, sidewall cores, measured pressures with a wireline tool, and the geology is fairly straightforward. The key is to have two wells, measure the pressure gradients in each well, and plot the gradient between wells. I have done it to prove a 300 plus meter oil column, and nailed it really good.
I did this post on Rystad’s oil reserves:
19/8/2016
Oil reserves and resources as function of oil price
http://crudeoilpeak.info/oil-reserves-and-resources-as-function-of-oil-price
On US inventories:
8/10/2016
U.S. Storage Filling Up with Unaccounted-For Oil
http://crudeoilpeak.info/u-s-storage-filling-up-with-unaccounted-for-oil
Thanks Matt.
Great job. Both pieces are excellent in my opinion (which has been the case for everything I have read which you have written).
Hi Matt, thanks for the interesting posts. I sent a comment to Art Berman to both his websites (artberman.com and forbes.com) about the post dealing with the unaccounted oil storage and I report it below (the comment is not yet visible there):
“Hi , Art
I agree with most of your article, but I would like to point out your attention to a possible explanation which can account for part of the unaccounted oil storage.
In the last 4 years, I have developed a methodology to re-construct the “real” Texas oil and gas production data using the data published by the Texas RRC: as it is well known, these data are only preliminary and it may take up to 2 years to have the final estimates. My method has proved to be reliable over time, providing estimates of Texas oil production very close to the final data and much earlier than the latter are published. Moreover, these estimates proved to be closer to the real data than the official EIA data for Texas: for example, on the 31/08/2016, with more than a 1-year delay, the EIA revised its Texas data for 2014 and 2015 and aligned it to my corrected Texas RRC data.
See below for more details about my methodology,
https://sites.google.com/site/deanfantazzini/nowcasting-texas-rrc-oil-and-gas-data-ongoing-project
and here for the latest update and additional comments on my methodology:
http://peakoilbarrel.com/texas-oil-and-natural-gas-update-sept-2016/
Having said that, if we compare my corrected Texas RRC data with the EIA data, it is visible that the EIA has started to increasingly underestimate Texas crudeoil production data since July 2015, and the cumulative sum of this discrepancy is approximately 46 million barrels.
Of course, this does not explain all unaccounted oil storage, and I agree with you that the real inventories are probably much lower than what is reported. However, one (minor) reason is the underestimated EIA production data for Texas. Thanks”
I would imagine the reserve numbers by Rystad Energy are likely to be more FICTION than REALITY. I spent a few hours talking to Bedford Hill of the Hills Group on their “Thermodynamic Oil Collapse” model, and the more I find out about it, the more I am convinced the reserve numbers shown in the table above are completely out of touch with reality.
The reason the Hills Group decided to design the software model to forecast the Thermodynamic oil Limit was due to one of the members losing money when a shale oil company overstated reserves by a wide margin. Thus, these engineers were tired of the crapola put out by either the EIA or the companies themselves.
It took several years and about 10,000 hours to create this ETP Oil price model as well as the Thermodynamic Oil Limit model. After they hit “ENTER”, it took several hours before the results came out. From what Bedford told me, the results were so shocking, that they decided to sit on them for a few years before publishing.
From what I understand, a small team of oil engineers helped design the program. I asked Bedford how many of the engineers DID NOT AGREE with the results. He replied by saying, “Not one disagreed.”
Furthermore, The Hills Group sent their report to dozens of professors in leading colleges (mostly professors teaching Thermodynamics), and none of them disagreed with the results, even though some had questions on the data or inputs used.
There is this notion that SUPPLY & DEMAND will continue to be the leading driver in controlling the price of oil in the future. However, the rapidly falling EROI is destroying the remaining net energy, thus leaving very little supply. Thus, Thermodynamics has been and will be the leading economic driver of human economies, not supply and demand.
This new story of a huge oil discovery in Alaska is just more WHITE NOISE in a sea of worthless chatter. I wrote about this in my newest article, Delusional Mainstream Media Distorts The Disaster & Reality As We Head Over The Cliff: https://srsroccoreport.com/delusional-mainstream-media-news-distorts-the-disaster-reality-as-we-head-over-the-cliff/
I gather I will see replies suggesting that I am completely insane on this issue. That’s fine. Nothing wrong with a little debate.
steve
Steve,
Would you care to elaborate more on the claim below and illustrate it by some numbers and real world examples?
”However, the rapidly falling EROI is destroying the remaining net energy, thus leaving very little supply.”
Rune,
According to the Hills Group Thermodynamic Oil Limit model, they took the total amount of energy in a barrel of oil and subtracted the waste heat. They then programmed into the software all the inputs from the oil industry.
Bedford stated that according to the second law of Thermodynamics the amount of energy consumed in the production of oil continues to increase.
Their model predicted the oil price collapse and forecasts that within a decade (+/- 4%) there will be no more net energy from a barrel of oil by the oil industry.
There is this notion that SUPPLY & DEMAND or CREDIT & DEBT have distorted this thermodynamic oil limit. While these factors have changed the oil production graph, the Hills Group model suggests this has not changed the date. What has changed is that we have pulled future oil production forward which will make the Seneca Cliff much steeper.
With Chevron, ConocoPhillips and ExxonMobil losing $18 billion in the first six months of 2016 after CAPEX and Dividends were paid reveals just how bad the situation has become in the Major Oil Companies.
Furthermore, the U.S. Energy Sector interest on the debt consumed 86% of their operating income in the first quarter of 2016. The situation is much worse than the market has realized.
Anyhow, I will be interviewing Bedford Hill and Louis Arnoux in a few weeks on their ETP Oil Price Model and Thermodynamic Oil Collapse.
steve
”According to the Hills Group Thermodynamic Oil Limit model, they took the total amount of energy in a barrel of oil and subtracted the waste heat. They then programmed into the software all the inputs from the oil industry.”
And the explanation in English is? Burning oil will ultimately lead to some thermodynamic losses.
Hint oil is about 30-33% the worlds total energy consumption.
“Their model predicted the oil price collapse and forecasts that within a decade (+/- 4%) there will be no more net energy from a barrel of oil by the oil industry.”
Was the oil price collapse due to thermodynamic reasons?
If that is so [no net energy from a barrel of oil within a decade (2026)], then there should already be several real world examples to support this with.
What portion of present global oil production (C+C) is consumed by the oil industry? Surely the Hills Group must have the estimates for that as they have projected the development for the next decade.
“With Chevron, ConocoPhillips and ExxonMobil losing $18 billion in the first six months of 2016 after CAPEX and Dividends were paid reveals just how bad the situation has become in the Major Oil Companies. ”
Are you confusing losses/profits with cash flows?
Using figures for only Q1 16 does not justify a trend and certainly not justify a conclusion or projection.
Rune,
Yes, I was referring to the companies Free Cash Flow minus Dividends. While one quarter does not justify a trend, the Hills Group forecasts the price of oil to fall to $12 by 2020. This is due to what a net barrel would be worth to the Global Industrialized World.
Rune, they have calculated the waste energy of a barrel of oil to be one-third. So, what remains is net energy. However, the energy cost to produce this energy has continued to increase since the world started producing oil.
The waste energy of a barrel of oil is missed by most economists or analysts when forecasting price.
Rune, you are more than welcome to check out the Hills Group work at the site here: http://thehillsgroup.org/
steve
I am getting 40.7% for oil (in 2012?) and electricity is a secondary energy source, so I am wondering if the 40.7% includes some oil for that.
Even so, how does that reflect the utility of oil, compared with the rest on that list? How well can the projection of political/military power and control be run on them?
In any case, money/price, as a symbol, is a detachment from reality, along with too many human detachments from reality to list, so whatever the price of oil is, once thermodynamic reality and reality in general really start to kick in, the price of it, among a litany of other human detachments, won’t matter anymore. I guess that’s when things will be considered increasingly in the process of collapse or decline.
Steve, I am unsure about gold or silver by the way, since they are still mere symbols for reality (that rely on some sort of ‘trust’ of some system that may be dubious). Maybe they are more ‘pegged’ to it, but still symbols nonetheless, and so woefully-limited in their peg, their ‘visceral tangibility’.
Also, as gold and silver are hoardable, would those who have and hoard more of it, such as governpimps and the elite, etc., be able to control it more, such as at the expense of those who have less of it?
I say, ‘gift economy’. A real economy.
Electricity is NOT an energy source – it is an energy carrier like hydrogen.
BP SR 2016 has oil at about 33% of global energy consumption in 2015 which does not include biofuels and biomass.
Electricity is considered a SECONDARY ENERGY SOURCE derived from whatever (nuclear power, wind, etc.). Of course, strictly speaking, electricity is just an accumulation OR motion of electrons. Therefore, a battery or a capacitor (accumulation of electrons) is a potential energy carrier.
I should have specified primary energy sources.
Lumping together primary and secondary sources confuses the issue.
Where in nature is there free electricity (apart from lightening)?
Follow the flow and all energy is solar. 😉
Well, I’m not sure if radioactive decay (or geothermal power) is solar energy or not. I suppose it is if you go back far enough. 🙂
Don’t forget tidal power, which taps the momentum of the moon.
Don’t forget tidal power, which taps the momentum of the moon.
Well, not exactly. The moon causes tides. But tidal power comes from the rotation of the earth. Tidal drag slows down the earth’s rotation. Any power derived from the tides comes directly from the slowing down of the rotation of the earth. That is, the earth’s rotational momentum, or the slowing of it, is transferred into tidal power.
In fact it is the tides that has been slowing the earth’s rotation down for hundreds of millions of years. During the Cambrian period, 510 million years ago, the earth rotated 424 days per year.
Earth’s Rotation Changes and the Length of the Day
So the earth’s rotation is defiantly slowing down due to tidal drag, but not enough that you would notice during your lifetime.
Agreed, guys, that’s why I was unsure about the chart posted (credit, Wikipedia) that included electricity. I also figured that Rune might have had an alternative source/time for his oil statistic. (Looks like we may be using less of it because less of it is becoming available.)
I guess energy, if followed back far enough in time, leads to an infinite line of universes and maybe through those ‘torsion tensor’ things, and/or related, I recently read about.
So I guess in black holes is where one can find the paradox of more energy (and eventually matter) created out of less and where thermodynamics falls apart and into the realm of ghosts riding unicorns on perpetual-motion carousels.
Pure thought.
This is the real perpetual-motion machine, which solves the problem of how more energy is acquired from less: It is simply thought up at the ‘quantum’ level… and/or acquired from other universes, since they are all infinitely-connected anyway.
(You can’t see the riders because they are all ghosts, so don’t ask me that question.)
Dream Within A Dream
That’s pretty cool, Ron… Perhaps eventually– and I guess it can be calculated precisely as to when– the earth’s rotation will be locked with the moon’s orbit.
I once heard that the Moon is slowly moving away from the Earth– maybe something like 2 centimeters per year? That’s quite a bit.
To some degree costs acts as a proxy for EROI. The general trend is for costlier oil.
Low priced oil => Higher (composite) EROI (Unprofitable oil is shut down)
High priced oil => Lower (composite) EROI
This article by Ron is about stocks and flows.
Thermodynamics is about flows.
– If net energy from oil move towards zero during the next decade, this implies that the oil companies would morph into giant heat engines and become bankrupt long before this (net energy becomes zero) happens.
Are there now any signs of this happening?
– If EROI declines at the rate referred and estimated by the Hills Group, net oil (energy) would enter a steep decline and prices would move significantly and steadily up to reflect this.
It could be useful to present estimates at what EROI (based on flow) a well or field becomes shut in and later P&A ed.
Hi Rune,
‘Cost’, to me at least, is real and is different from ‘price’, which is symbolic, and ‘Energy Returned on Energy Invested’ is different than ‘Energy Return On Investment’, but I suppose it is treated the same to some.
Right now, from what has been read and understood at least, the ‘money/finance/banking/BAU-cum-government-as-usual’ clusterfuck of ‘establishments’ are looking very strange/bizarre/weird/crazy/etc. to the clusterfuck of many ‘analysts/experts/pundits/etc.’. This seems indicative of an overlying symbolic/sociopolitical/socioeconomic (denialistic/extend-and-pretend) ‘formative’ response to an underlying thermodynamic issue/problem and maybe other problems as well, some as feedbacks/perturbations in/from the system.
Syria, Ukraine, ISIL, Brexit, national bankruptcies/debt crises, guaranteed income, refugees, etc….?
Along with the ostensibly-increasing and increasingly perverted financial smoke-and-mirrors, I wonder, in part, what the statistics are on company bankruptcies, takeovers and cannibalizations these days, as well as investments in so-called alternative energies.
Where’s this stuff going?
Steve apparently says ‘gold and silver’, yes?, but I don’t buy it (pun intended too) from a fundamental-problem-solving standpoint and neither should he.
Gold and silver seem just part of the same or similar scams, but just operate a little differently.
Steve, if you’re reading this, I noticed, under one of your articles on Zero Hedge, you arguing with some of the ‘commentgentsia’…
Well, of coure, they know ‘nothing’, I know ‘nothing’, you know ‘nothing’ and Rune knows ‘nothing’. Of course we know things, but we are all ‘insignificant’ cogs in this machined clusterfuck with limited autonomy and spending too much of our industrially-derived/putrified food energy and internet energy arguing about known unknowns and unknown knowns and what we and ‘the others’ know, don’t know, think they know and want everyone to know, even if it’s not true– whatever that means.
Alas, ‘Leviathan’, as Oldfarmermac has put it, will do what it has to to survive, come hell or high water or the puny little humans that it squishes along the way– maybe in its death throes. Why, there appear to be purveyors of Leviathan, or aspects thereof, right here on this very blog.
I just wish that I was not on the same ship, as I really dislike being dragged along for the ride.
Caelan wrote;
”Where’s this stuff going?”
That is something I observe a growing number of people wants to inform them about.
As we come to learn something we discover it is just a small piece of the BIG puzzle. We all have blind spots and are delusional.
Sometime ago I watched some (BBC) documentaries about Keynes, Hayek and Marx and a very interesting interview with Bank of England’s former director Sir Mervyn King (this appears to be a man of integrity and good moral compass).
There is one common message from all these;
“It is not possible to accurately predict human behavior.”
Therein lies a very important bit of information.
I hear you, Rune.
(That BBC piece might be on You Tube.)
Alas, it is of course impossible to predict anything with 100% certainty. If we could, then there would no consciousness, maybe no universe. And what fun would that be? ‘u^
Yes, the BBC 3 part series (from 2012) “Masters of Money” is available on YouTube
First episode below
https://www.youtube.com/watch?v=nZNRfzkiies
As Nate Hagens put it in one of his speeches:
“Embrace Uncertainties!” 😉
Thanks for the link. While it is uncertain, I might have already seen it, as it rings a bell, but will check it out, just to be sure. ‘u^
” … within a decade (+/- 4%) there will be no more net energy from a barrel of oil by the oil industry.”
EROI is falling for new sources of oil but I don’t know that it would count as “rapid” yet and it doesn’t change much for already developed fields as they age – in fact if energy for the development stage is taken out then the EROI increases during operations.
If no more wells were drilled starting today then world oil production would fall at around 5%. So in a decade there would be 60% of current supply. The EROI on that wouldn’t have changed much from today – there’d be proportionally a bit more water and gas to handle, but equally it could all go to the most efficient refineries. Therefore for the overall net energy to be zero would imply all new stuff bought on line is hugely negative. No such project would be even considered at conceptual stage and it would stand out a mile. The closest anything gets to that is Tar Sands where there is arbitrage from energy in natural gas converted to energy in synthetic oil, but while energy in gas is cheap this still makes sense (or made sense rather – as soon as the economics became bad, partly as a result of the net energy issues, the projects were stopped). So if new projects are so bad don’t do them – the world might be in a mess at that point but the remaining oil would be a much sort after entity.
Also the shale reserve that initiated the study wasn’t overstated because it’s net energy was incorrectly estimated, it was because someone in the E&P company lied, or rather let’s say ‘dissimulated’.
George Kaplin,
The reason much of the damage of the rapidly falling EROI is not made its way into global oil industry and the world financial-economic system is due to the massive amount of debt.
The Hills Group model calculates that the second law of Thermodynamics says that the amount of energy to produce oil has continued to increase since we started producing the liquid over 150 years ago.
They have developed this model showing the average increase in energy cost in terms of a barrel of oil. They remove the waste heat which is approximately one-third of the barrel. They model shows that within a decade, the Thermodynamic limit for oil will be reached, thus no net energy will be available.
Again, the massive amount of debt has distorted the global oil production curve, not the ultimate date of the thermodynamic collapse. So, we experience a much higher on violent SENECA CLIFF due to the massive amount of debt that has brought forward production.
You can check out their work here: http://thehillsgroup.org/
steve
Worth noting that EROI isn’t that profound an issue if the input is non oil. For example, if all the drills were solar powered, it would not matter how much energy was required to get transportation fuel out.
That’s not how it is, but not wise to worship at the altar of that God too very much.
And of course:
“If no more wells were drilled starting today then world oil production would fall at around 5%. ”
Whilst consumption rises with population and even if the pop were flat, with GDP growth.
If you laid that out in front of the average citizen of any developed country of the world, he’d be pretty sure he was not going to be the one with an unfilled order.
By the way, Caelus Energy LLC said that they could ultimately recover 3 billion barrels of that 10 billion barrels the claim they found. I doubt they will be able to pull one barrel out. But for KICKS & GIGGLES, lets assume they are able to extract those 3 billion barrels of oil.
How much would that be?
Well, it turns out to be less than a half a year’s oil supply for the United States and about a month and a half of annual Global Oil consumption.
Basically, peanuts…..
steve
Hi Steve,
The thermodynamics of the entire economy is what matters, not that of a single industry. Most thermodynamics professors would see this right away.
My question is, if ‘civilization’ that was built and operates on an EROEI of, say ~60:1 needs to do a transition to an EROEI of, say, ~8:1, in the process, would it knock out/undermine its own capacity to do so, to make that transition, since it cannot function properly in many ways on an EROEI of ~8:1?
Perhaps it’s a bit like trying to build a much smaller house to get out of the bigger one, but also using the bigger one’s materials to do it, while still having to live in it. It’s gradually being eaten away– windows, foundation and all– with you in it, as you’re trying to build the smaller house.
The smaller house isn’t done yet, you started it late when you were already weak and tired, and you’re getting increasingly weaker and more tired and starting to become ill…
Hi Steve,
Well, 3 billion barrels isn’t really peanuts. If memory serves, 500 million barrels of recoverable oil = a Giant. Prudhoe Bay will ultimately produce say 13 billion barrels with much related to EOR and including massive gas handling facilities. However, your pessimism may be warranted. Talking to one of the players involved, besides all those normal handicaps associated with the Arctic, there are some serious geological obstacles facing Caelus.
Doug,
While it is true that 3 billion barrels is a GIANT FIND, when we compare it to annual U.S. and world consumption, its not that exciting. And this is above and beyond whether any of this oil will be commercially viable.
steve
Lack of continuity? Too many sand lobes?
Lack of continuity owing to fault offsets — I think.
What does that do? Interrupt permeability?
Leads to isolated oil pools that must be individually accessed. Of course they can be seismically mapped out fairly accurately these days.
So multiple wells? How many per square mile? I guess you’d need the seismic to know.
This is one of the big issues in the Arctic which is partly why the oil discoveries there are lower than anticipated. Repeated compression and expansion from ice build up and melt through the ice age cycles has led to a lot of faulting. Where this has occurred the most happen to be areas that would otherwise be most prospective for oil. The faulting may lead to complete drainage of the reservoir or just a lot of compartmentalisation, meaning either oil flow is slowed down a lot by the faults or that drainage volumes are completely isolated. Seismic can show a lot but not whether there is oil present for certain and not enough about the faults to know how the oil will flow with much confidence. The optimum number of wells required and expected recovery factors are difficult to predict in advance. Wells have to be drilled and flowed and there is a high chance of poor results, which given the costs involved up there and the limited drilling season, makes for a not necessarily very attractive investment proposition.
Arctic in a nutshell, perfect explanation (once again). Thanks George. The only thing I might add is that a number of seismically attractive “oil” prospects (structures) turned out to contain mainly gas, especially in the Canadian Arctic.
Doug – agreed, quite a lot of gas, but how the hell do you develop it? You need pipelines or FLNG – and you have to protect them from icebergs and sea ice. You need a way to protect against hydrates at all stages of production from the well bore through the xmas-tree, the riser, the production facility and the export system. You need to be able to drill and complete all the wells in 6 months from an external rig, or you have to drill horizontal wells from shore or deviated wells from purpose built islands. It is really expensive – think Alaska LNG and multiply by 2 to 5.
so clarification:
I had thought the faults locally were supporting the general concept that you don’t find oil where there have been millions of years of earthquakes.
But you guys are saying it’s much younger Ice Age(s) derived faulting?
Watcher,
Faults do not necessarily mean an area is earthquake prone. The Gulf Coast is riddled with faults, and many of these faults play a critical role is creating hydrocarbon traps, yet it is a passive margin and certainly not earthquake prone. Many of these faults are “growth faults”, which mean they are normal faults that are contemporaneous with deposition. So if Miocene section is faulted, the faults are at least that old.
George above explained the Alaska faulting to be different than Gulf Coast faulting, but again, not earthquake related.
Earthquakes are generally, but certainly not always, associated with active tectonic margins, like the “Pacific Ring of Fire”.
holy smokes Watcher, just google California, lots of oil… lots of earthquakes over millions of years. You can and do get fault movement that allows previously trapped oil/gas to again migrate often times leaving heavy oil behind. This migration may occur up the fault line or where a previously non permeable formation is partialy displaced leaving the oil and gas zone juxtaposed against a more permeable formation.
On a completely separate note I found this interesting:
Clinton Talked About “Phony Environmental Groups” Funded By The Russians To Stand Against Pipelines And Fracking. “We were up against Russia pushing oligarchs and others to buy media. We were even up against phony environmental groups, and I’m a big environmentalist, but these were funded by the Russians to stand against any effort, oh that pipeline, that fracking, that whatever will be a problem for you, and a lot of the money supporting that message was coming from Russia.” [Remarks at tinePublic, 6/18/14]
…
Read more (from the attachment file): https://wikileaks.org/podesta-emails/emailid/927#attachments
this may explain some of the more ridiculous comments a few posters have made on this blog over the years. I must say the level of discussion on this post has been markedly improved?
George Kaplan,
I have to wonder about the effect of ice mass on faulting in Alaska because most of it was ice-free during glacials–glacial ice is compacted snow and it was very dry everywhere. There was a large ice cap on the Alaska Range and a smaller one on the Brooks Range (central and eastern parts mostly) and that was pretty much it. Ice on the high mountains, grass and sagebrush most everywhere else. There were valley glaciers coming out of the mountains, of course, but that’s not a whole lot of ice.
With sea level low sources of moisture were far away from most of Alaska–what’s now the Bering Sea was dry, for a start–and the lower temperatures caused low rates of evaporation from the ocean so there wasn’t as much moisture in the atmosphere anyway.
Hmmm.
Odds are fault offsets are there because these guys (Doug and George) have probably seen some imagery. But we have doubts about causation?
What goes on up there tectonic plate-wise?
This is about the Barents Sea:
“Glacial climate changes over the last million years have influenced the distribution of oil and gas reserves, mainly in high latitude and arctic basins. Hydrocarbon exploration in the Norwegian part of the Barents Sea has been rather unsuccessful so far; numerous glaciations during the last 3 million years are regarded to be a major cause for this.
Rapid erosion and subsequent differential uplift and tilting is commonly envisioned to have led to spillage of hydrocarbons, phase transition from oil to gas, expansion of gas, seal failure, and cooling of source rocks. In addition to glacial erosion, repeated ice and sediment loading had great influence on and the temperature history, i.e. hydrocarbon maturation hydrocarbon and migration routes. Detailed control on the glacial history, glacial erosion and sediment deposition is therefore an important factor for identification of the remaining hydrocarbon resources in the Barents Sea.
The effects of glaciations on the temperature regime in a sedimentary basin can be significant. Glaciations affect the thermal conductivities of the sediments and the surface temperatures. Both will also influence the reservoir temperatures. A typical glacial period cycle lasts for 100 000 years, which is sufficient time to lower reservoir temperatures to depths of 5 km by reductions in mean surface temperatures. Ten glacial periods could lower the reservoir temperature by up to 10°C. Increased thermal conductivities due to frozen pore water will also contribute to the cooling of the subsurface. Subsurface temperatures during a cold (permafrost) glaciation could be as much as 25°C lower than the subsurface temperatures in a non-glaciated case.
Glaciers, sediments and erosion act as loads on the Earth’s surface – positive or negative. Both glaciers and glacial erosion will lead to significant isostatic tilting of the reservoirs. Glacial erosion leads to significantly lower sub-surface temperatures, and will thus deactivate source rock hydrocarbon generation. Changes in local stresses and associated fluid pressures in petroleum reservoirs generated by glaciers and/or rapid glacial erosion may reactivate or initiate faults and other fractures, allowing oil and gas to escape from reservoirs.”
There is another paper about Canadian Arctic that covers similar ground which I can’t find now (or might have been by USGS). I was talking about the Arctic in general. You may be right that this Alaska area is different. I have no first hand knowledge there and maybe extrapolated a bit too far.
Cool.
As it were.
George Kaplan,
Both northern Europe (out to far beyond modern shorelines in some areas) and the Canadian Arctic were covered by continental ice sheets but Alaska was not.
I don’t question the article on the Barents, but I will add that most of Russia east of Novaya Zemlya was also unglaciated, again because of extreme dryness. The pollen record is dominated by grasses and wormwood (which is what Europeans call sagebrush for some reason.) That’s why unglaciated northern Eurasia and Alaska were inhabited by all those big grazers: wooly rhino, wooly mammoth, horses, bison…all those critters would starve to death on today’s tundra.
Some are waking up to the Magnitude of the Challenge:
“At the same time, the engineer in me cannot be blinded by the physics of logistics underlying the quintessential challenge posed by oil: how to replace the 560 exajoules of energy that is required every year to keep the world turning. That’s 5.6 followed by 20 zeroes, whose magnitude was explored in my previous post hocus pocus. 80% of the world’s energy requirements are supplied by hydrocarbon combustion.”
http://oilpro.com/post/27823/to-147-and-beyond?utm_source=DailyNewsletter&utm_medium=email&utm_campaign=newsletter&utm_term=2016-10-10&utm_content=Article_4_txt
This guy is goofy. He says:
80% of the world’s energy requirements are supplied by hydrocarbon combustion. The vast majority of this 80% is devoted to the production of electricity.
That’s not true. Roughly 40% of FF goes to electricity.
To those who clamour for the wholesale adoption of electric motors in cars, buses, trucks, trains, boats and planes, I point out that this electricity has to come from somewhere. The fraction of the oil that is not used in electricity and heat production makes no difference to the energy balance sheet of the world. Any electrical conversion must address the inevitability of this 560 EJ scenario. Solar, wind and geothermal solutions cannot under any conceivable scenario tally up to this number. This is a physical fact, not an opinion or an embrace of the status quo.
Completely untrue.
http://www.tsp-data-portal.org/Breakdown-of-Electricity-Generation-by-Energy-Source#tspQvChart
70% of electricity comes from it. Different phrasing re proportion of combustion devoted to it. Given coal and nat gas and oil are 67% of electric power — the 40% number don’t sound right.
The vast majority of this 80% (from hydrocarbon combustion) is devoted to the production of electricity.
He’s saying that the vast majority of FF combustion is used to generate electricity. That’s badly inaccurate.
In the US, about 40% of the roughly 97 quads of primary energy are used to generate electricity. IIRC, another roughly 40% is transportation and 20% is other: residential space heating, industrial/commercial consumption, etc.
If about 2/3 of electricity comes from fossil fuels, that means that FF electricity is only about 27% of the overall primary energy input. About 13% is non-FF electricity, and the other 60% is FF other: transportation, etc. So, divide 27% by 87% (60%+27%), and you get about 31% of FF is used for electrical generation…not the “vast majority”.
Don’t know what primary energy is. Don’t care much, either.
Primary energy mostly applies to FF electricity: it’s the fuel input used to generate power. Secondary energy is the electrical output.
When you compare coal to wind power, you have to adjust for the difference. Same thing when you compare coal to oil.
If you don’t know about the difference, you’ll be hopelessly confused about energy issues.
I watched a YouTube video entitled ‘Orgins of Oil’. The expert asserted that oil companies can synthesize hydrocarbons and oil will never be depleted to not enough.
That settles the argument, no need for renewables because oil is a renewable.
The peak will never arrive.
Of course I didn’t believe a single word of it, but some people do.
Oil will be there no matter what.
har
He’s absolutely right.
Now, synthetic liquid fuel is likely to be more expensive than fossil petroleum: perhaps around $1-$1.5 per litre. That’s more expensive than electric transportation (though not more expensive than the total price of fuel in Europe, including taxes), so it will eventually be used only for premium applications like aviation, long distance water transportation and seasonal agriculture.
I suppose in 100 years or so batteries and fuel cells will take over completely, and the idea of burning fuel will seem quite primitive – kind’ve like running a gasoline motor in the kitchen to power your blender.
Synthesize oil from what exactly?
Well, sugar works. Basically, if it contains carbon, we can convert it into gasoline: to hell with the planet.
After the world does that for a while, will there be anywhere worth travelling to?
No. That’s why we’re going to Mars isn’t it?
If they vote for Trump, they get a free ticket.
Yo, sugar is even easier to convert to alcohol. I was already driving 100% ethanol powered cars down in Brazil in the late 70s. Ironically I was working as a saturation diver on oil rigs for Sub Sea Oil and Petrobras at the time. None of which did much to benefit the planet…
Why not produce ethanol and make whisky?
DougL,
You can’t make whisky unless you’re in Scotland.
(You do not want to encounter the enforcement agents the Scotch industry can dispatch to your door. Believe my words and pray for my soul.)
Synapsid,
“You can’t make whisky unless you’re in Scotland.” That ought read: “You can’t make REAL whisky unless you’re in Scotland.” I do understand the things of which you speak but, fear not, I’ll pray for your soul:
“Almighty Thor…………..
“You can’t make REAL whisky unless you’re in Scotland.”
So fer shits and giggles I went and googled “Best Whiskeys in the World”,
And now methinks that might be the epitome of the ‘No true Scotsman Fallacy’ 🙂
The best Whiskey in the world, drum roll please…
Black Nikka. The list starts with a Japanese whiskey brand, headquartered in Tokyo, it registered encouraging sales growth of 13% in the year 2012.
LOL! I’m sure that just for posting that I will be visited by the Scottish Black Ninjas later tonight.
TOKYO PIPE BAND – Bagpipes band
https://www.youtube.com/watch?v=MGxZLXX1-lY
Cheers!
After Doug’s previous mention of ‘single malt’, I looked it up, including the malting process. I was somewhat familiar with both, as I’d taken bartending way back when, but it was nice to get quite a bit of bonus refreshment.
There’s a fundamental beauty in the hand and the malted barley that transcends ‘manmade forms…
And it occurred to me that maybe some kinds of technology should be mostly only for the ‘outside’– for outer-space, (like for getting from one nice Earthlike planet to another), where the human will always be detached. So maybe it makes the most sense that, where technology might seriously threaten unacceptable levels of human detachment from the ‘inside’– from nature and each other– that it be reconsidered, and by all involved, such as only for the ‘outside’.
Maybe fusion, if it is ever successfully achieved beyond the lab, could be considered one of them, such as to power those vessels to get from point A through the ‘outside’, the ‘ether’, to point B.
Incidentally, and if this isn’t a sacrilegious question, what would a single malt go best with, aside from ice and/or water, for someone who prefers the hard unsweetened stuff, mixed?
Ice with single malt is most definitely sacrilegious; a splash of water is OK… anything else and it’s straight to the firing squad. …shambles away muttering
Fair enough… How about if I put it in the freezer then? No ice, but nice and cold.
Incidentally, if recalled, and in the same way cognac is to brandy; all scotch is whiskey but not all whiskey is scotch.
From CO2 in the environment, making it carbon-neutral. You can pull it from the atmosphere, but it’s likely much easier and cheaper to extract it from seawater, where the concentration is much greater.
And, of course, the H2 comes from electrolysis of seawater, using cheap surplus wind, nuclear or solar electricity. There’s likely to be a lot of surplus electricity, given that overbuilding generation is one of the cheaper ways to deal with natural variation in output.
As you can imagine, the US nuclear navy is quite interested in this option: nuclear carriers could fuel their non-nuclear support ships.
Eventually, of course, you’ll want to power things directly with clean power, and sequester the carbon.
Why not just tap the CO2 from the electric power industry? Very concentrated.
You could. I suppose I figured that by the time we’ve reduced our oil consumption/production by 75%, we’ll have eliminated almost all of our FF power generation.
Even now, the percent market penetration of wind & solar is higher than the market share of EVs, and wind and solar are growing much faster.
Have been persistently arguing on this blog that Russia’s oil reserves (also Iran/Iraq/Kazakhstan) are far greater than generally acknowledged.
http://www.bloomberg.com/news/articles/2016-09-28/russia-smashes-post-soviet-oil-supply-record-as-opec-weighs-curb
Russia & Kazakhstan the main drivers of global oil growth supply in September:
http://oilprice.com/Energy/Oil-Prices/Oil-Falls-As-OPEC-Production-Hits-Record-In-September.html
Kashagan: The October (now) flow date is now November.
“We are expecting to produce nearly 35,000 tons in December 2016,” he said.
Isn’t that 8000 bpd?
There are a little over 7 barrels of petroleum in a metric ton so you can do the arithmetic. Oops, sorry Watcher, you already have. 🙂
Kashagan in currently producing 90 kb/d and ramping up output
(from local source: http://ru.sputniknews.kz/economy/20161012/818262/bozumbaev-rasskazal-o-hode-dobychi-nefti-na-kashagane.html )
“Work to bring onstream the giant Kashagan oilfield in Kazakhstan is going to plan and some crude has already been processed and put in storage, the country’s energy minister said on Wednesday.
Kashagan will increase the country’s oil production and Energy Minister Kanat Bozumbayev reiterated that reducing oil output in line with OPEC plans was “not on the agenda” for Kazakhstan, Central Asia’s biggest crude exporter.
Four wells were already producing at Kashagan with a total output of 90,000 barrels per day, he told reporters. ”
“Kashagan is initially expected to produce 75,000 barrels per day (bpd) in October, rising to between 150,000 and 180,000 bpd in November and December this year. ”
http://www.reuters.com/article/kazakhstan-kashagan-idUSL8N1CI1CX
This is where I got it:
http://www.rigzone.com/news/oil_gas/a/146546/Kazakhstan_To_Launch_Kashagan_Oil_Production_In_November
http://www.offshore-mag.com/articles/2016/09/conflicting-reports-surround-kashagan-re-start-date.html
Previously, in June, Kazakhstan’s Minister of Energy Kanat Bozumbayev said only to expect production to resume in late 2016. “We are expecting to produce nearly 35,000 tons in December 2016,” he said.
ASTANA CITY, Kazakhstan – The Kashagan oil field will achieve commercial production in November, rather than the previously reported October, Reuters has reported KazMunayGas CEO Sauat Mynbayev as saying.
That was a month ago.
The bigger numbers are out in TODAY’s update on Reuters. Let’s look at that date and recognize detailed (there was a brief query “what’s happening at kashagan” earlier) mention of this in the comments here was 18ish hours ago. The update from Reuters 8 hours ago. One time can be coincidence, but the odds aren’t bad this blog’s comments get read.
On EROI
The Norwegian Petroleum Directorate (NPD) has a lot of excellent statistics.
One of these is annual CO2 emissions from combustion for power generation at the production installations.
This makes it possible to derive estimates on flowing EROI, both for all petroleum activities on the Norwegian shelf, but also for some individual fields.
Varg is an installation in the North Sea that is now being closed down and P&Aed and this happens as it produced about 8,500 boe/d (of which about 4 500 bo/d was crude oil and condensates).
Using data from an earlier year it was estimated that Varg used about 600 boe/d (primarily natural gas) to produce about 8,500 boe/d which results in a flow based EROI of 14.
The reason it is being shut down is that it has been running with a financial loss for about a year.
For all production in 2015 on NCS (about 4 mboe/d) it was found the flow based EROI was just above 30 for 2015.
The EROI for NCS has been in a slight decline.
EROI is a lot more than the natural gas used to pump the oil – it’t the steel of the platform, the special ships that towed it there, the pipes, the prospecting, the seismics, the driling, the Porsche the CEO drives (in fact all the people working there) and lots I forgot.
the Porsche the CEO drives (in fact all the people working there)
Well, probably you don’t want to include the cars driven by employees. The boundaries of EROEI calculations are always difficult to draw, but…employees are people, and they’re “ends”, not “means”. If they’re not driving to this job, they’ll be driving to another, or to the unemployment office.
Here’s another way to think of it: commuting isn’t part of the job. Employees could walk, bike, take the bus, live in an adjacent dorm (like in China) or drive an EV.
Eulenspieigel,
That is correct, but I was clear that this was about what is flowing and that is what matters in the near term.
My point was also to show that a well/field is closed down long before its flowing EROI reaches a level were it not delivers net energy.
The portion that takes the biggest portion of energy inputs of field developments is operations. When a discovery is developed the energy input for that is sunk.
And what is wrong with using natural gas (and occasionally diesel) for the operations?
Varg is operated by a floating process and storage vessel, and the ship Petrojarl may be used for other developments.
If I include helicopter transport of operators that would add an estimated 1 bo/d, which is well within the uncertainties. Transport of oil, the vessel has storage facilities for 470 000 barrels, which suggests the frequency of offloading. Recent production levels suggests offloading every 100 days.
I am willing to include other energy inputs if you are able to come up with good data.
Do you have references to other estimates that are more comprehensive?
The cars of the employes add to EROI – they could mine coal (perhaps with a better EROI), or create Holywood films (then they are on the consuming side).
All ships(building and operating), helicopters, 100.000 tons of steel needed for operating and creating the wells + platforms + pipelines, the tanker fleet have to be added, if you want to compare the oil complex with coal, natgas, nuclear or solar for energy creating.
Coal you need other ships, with nuclear you need mines and safety personal and almost no ships, + electric wires + lots of police – or with wind building the thing, not much for operating, but hydro pump storage and wires. And all the people maintaining this.
So it’s complex – I don’t have numbers here, I think everyone can only guess.
I don’t think oil has good numbers (besides Gulf oil), but is needed for transportation at the moment.
”I don’t think oil has good numbers…”
So enlighten us what you think EROI is for oil.
(Both flowing and for undeveloped discoveries)
About 3.
I’ve seen sub 4 oil sands numbers.
Everyone guesses except the Hills group, which gives the time we are going to go phht to within +/-4% apparently. If you are going to include the cars for the workers why not the trams used by the nursemaids who look after the babies of the workers who provide the machines that grind the flour that makes the bread that feeds the workers who build the cars for the workers on the oil rigs. EROI is meaningless at that level. If you include all externalities then it is surely always going to be zero – all energy produced is used by the world: the end
If you are going to include the world then you must subtract out the useful energy provided by the sun, meaning we are running negative net energy.
The cars of the employes add to EROI – they could mine coal (perhaps with a better EROI), or create Holywood films (then they are on the consuming side).
US tax law may be helpful here: it defines an employee expense as a business expense when it is *mandated* by the employer. So, if an employer requires a uniform, then it’s a business expense. If the employer requires you to drive to work, perhaps so you can inspect distant locations during work time, then it’s a business expense.
Otherwise…it’s your personal choice whether and how to commute, and it’s not a business expense. Like that Porsche mentioned above: that’s a purely personal choice.
Hi Rune
Thanks.
I think the Hills group deducts thermal losses when the oil is burned and also includes transport, distribution and refining. So the 30 to 1 eroei would be reduced.
I don’t have the data to estimate closely, but maybe 15 to one or less using a more comprehensive eroei analysis.
Dennis,
In the estimates I presented the output is the ratio of gross produced on gross invested.
Yes, there are thermal losses as the producers and consumers spend their products so this ratio could change depending on who uses the energy most efficient. If thermal losses are equal, the EROI remains.
As you point out there are other looses further downstream in the value chain, like (for the North Sea) helicopters, supply and stand by ships, work done in workshops on land, facility modifications, energy used for transport, refining, distribution to name some of the big ones
For transport (oil and gas, North Sea) the losses are about 1%, not sure for refineries (and distribution), but when I started to add those that was easy to check I found it hard to get the total losses above 10% (post the production installation), meaning that EROI based on NPD emissions data shall come down as we move down the value chain.
The point with the exercise is to demonstrate that wells/fields are shut down while they still have a “high” EROI.
We could take this further and also show how price moves the EROI.
Rune,
I think one puzzling question is why the Hill group thinks that falling EROEI would reduce the sales price of oil. If EROEI falls, then producer costs rise. If producer costs rise, that can only increase the price of oil.
To put it another way: producer costs are the business of producers, and are invisible to consumers. They won’t affect demand.
Now, if consumers aren’t willing to pay enough for producers to make a profit, then eventually oil production will fall. Falling supply is likely to raise the price.
Unless, of course, consumers have better and cheaper alternatives, like hybrids, EVs, car sharing, etc. Then oil prices would stagnate, production would fall, and eventually the oil industry would go away. Which would be a good thing assuming, again, that consumers have better alternatives.
And if they don’t? Oil prices would rise…
Further up I said that a high price allows for a lower EROI to become financially profitable.
In general costs for new oil (discoveries and developments) are on an upward trajectory. Growing unit costs acts as a proxy for lower EROI.
A declining EROI decreases surplus energy available for society which and all things equal would increase the price.
”If producer costs rise, that can only increase the price of oil.”
Yes, if the pricing power is with the producer. The collapse of the oil price was supplies running ahead of consumption temporarily shifting pricing power to the consumer.
”Now, if consumers aren’t willing to pay enough for producers to make a profit, then eventually oil production will fall. Falling supply is likely to raise the price.”
I agree and we are moving into this territory.
Hi Rune,
Your numbers are very helpful. I have difficultly finding all the wonderful details at the NPD website. I assume you know far more about what is available there than I do. I was not sure if other information such as the average CAPEX per barrel produced is known or other energy inputs for electricity (although it may all be generated on site). If most of the C+C output is used for land transportation and the average vehicle gets 33% of the energy as work turning a shaft, the 30:1 EROEI is reduced to about 10:1. For natural gas some is used for heating (about 95% efficiency) and some for producing electricity (maybe about 50% efficiency), if we assume for simplicity it is split 50:50 for heat vs electric power, the EROEI would be about 20:1 for natural gas. Not sure on NGLs, a lot of those may be used in the chemical industry so EROEI is not relevant for that portion, the rest would probably be used for heating and might be close to 30:1.
I agree refining, distribution, and transport for North Sea oil probably doesn’t change the picture very much, and you would know much better than me what is happening in Norway.
The other point that the Hills Group seems to miss is that net energy has very little to do with the price of oil. Even if net energy was zero or negative, if consumers need liquid fuel to use their cars, there will be a demand for oil and the price will depend on both the cost (in money) to produce the oil and the price that consumers are willing and able to pay.
What I have presented is gross energy output on gross energy input (no thermodynamic adjustments).
Should adjustments for thermal efficiencies be used to estimate EROEI that requires it is also applied with the producers. The producers may obtain/suffer from efficiencies of scale as natural gas/distillates can both be used for electricity generation and process heat from the exhaust gases.
Further natural gas exported from the installations goes mostly to heating (90+% thermal efficiencies) and power generation with thermal efficiencies as high as 60+%, depending on process/technology used.
Not sure how the average vehicle is defined, but if that means a normal household ICE car it gets a thermodynamic efficiency of about 25-30% when running at its best operational point, so the average is much dependent on the driving conditions (idling the car get a thermodynamic efficiency close to zero, but produces heat which may be useful when cold).
How the products are used by the end users (and their sizes) very much dictates how efficient oil and natural gas is used.
Short story you need to find the average weighted thermodynamic efficiencies for all the products used by the end users.
NPD lists nominal investments (CAPEX) for each field and by year. NPD also list production numbers (for crude oil, natural gas, NGL and condensates) both monthly and annual.
What I presented is EROEI on gross returned on grossed invested.
With good data on annual CO2 emissions (in tons) it is possible to estimate gross (and net) input at the field.
Assuming stochiometric combustion simply divide the CO2 emissions in weight by the specific weight of CO2 and out comes the volume of natural gas (Sm3) or diesel (litres) used in that year to power the production installation. It even includes gas flared as this is part of normal operations to produce oil and gas.
In Norway there is a CO2 tax in place which makes it possible to keep account of CO2 emission and SOX, NOX, methane etc.
It is in theory possible to financially profitable operate a system with no or negative energy return due to price arbitrage simplistic illustrated below.
6 Mcf (1 boe) of natural gas is required to produce 1 bo (of some oil) and nat gas price is very low relative to oil.
So assuming the nat gas (used in the process [supplying both electricity and process heat]) with about 90% thermal efficiency, that is it gives 0.9 boe net energy.
The extracted barrel of oil (just assuming all of it becomes transport fuel) yields 0.25 boe of net useful energy (the other 0.75 boe becomes waste heat not used).
Gross input 1 boe (6 Mcf gas), gross output 1 bo.
Net useful input 0.9 boe, net useful output 0.25 boe.
I don’t think it makes sense to include the efficiencies of consumer applications. What matters for EROEI analysis is the ratio of inputs to outputs, and the outputs are at the point of delivery to the consumer. If the consumer wants to burn it, or bathe in it, it doesn’t matter.
Here’s another way to think about it: from the point of view of a physicist, the efficiency of transportation is zero. Transportation moves (aka translates) an object from one point to another, but all of the energy is turned into heat of friction. No energy remains, so efficiency is zero. The output is the increased value to the user of having the object in a different place, but that value is completely subjective. Physically, it’s a complete waste.
That is one of the reasons I found it useful to look at EROEI ex the installations (alternatively at distribution).
Ex installations gives a good baseline.
I will continue with Varg, as this is a very god example supported with good data to illustrate how wells/fields are shut down while they still have a “high” EROI.
Using NPD data Varg had an EROI (flowing) somewhere between 14 and 15 (ex the installation) as it was shut down.
Having looked at some data for transport, refining and distribution (reaching end consumers) I found that about 6% (look upon that as an average number as there will be differences due to geography, modes of transport (trucking assumed with 5 mpg), distance from refinery to distributor etc) of the energy leaving the platform became unavailable to the consumers due to downstream “losses”.
This results in an EROI (based on flow) of about 8 (from the Varg reservoir to consumer; 7 boe of 8 boe is surplus energy). Higher oil/gas price could have kept Varg in operation at a lower EROI.
Chart below shows development in estimated EROI ex installations in Norway and for consumers.
Note how slowly EROI declines (I am not sure of the reason for the step down in 2007).
NOTES
1) NPD reports CO2 equivalents which also includes methane emissions (makes the EROI slightly lower) and for 2015, 95% of the emissions was CO2.
2) Some of the installations uses hydroelectricity (makes the EROI estimates somewhat higher).
These effects will to some degree cancel out each other.
Thanks.
Very interesting analysis, as always.
I have been saying and M.King Hubert has said that too that we should trade energy instead of money. Money and debt is a completely outdated system.
For example, let’s say one barrel of oil contain 10 BTU. Let’s say that it takes 10 BTU to produce one pound of potato. So one barrel of oil buy 1 pound of potato. You exchange energy credit instead of money. Moving into an economical BTU based system of energy will also allow the see where the energy goes and where to cut useless stuff. Net energy credit get deposit into country central bank.
Something like that, just some thought I had thinking about how to change the trade system.
Anyway, I think it is too late now, the depletion is to advance to do that. It should have been done during 1970.
OPEC MOMR is out
OPEC up 220,ooo barrels per day.
Iraq up 105,000
Libya up 92,000
Nigeria up 95,000
Iran up 21,000
Kuwait up 16,000
Saudia down 87,000
Venezuela down 18,000
Angola down 14,000
Gabon down 10,000
How is Ecuador maintaining production? They must have some really good pumps or something.
How is Ecuador maintaining production?
Maybe their pumps are being powered by hydro, wind and solar 🙂
http://www.irena.org/DocumentDownloads/Publications/IRENA_RE_Latin_America_Policies_2015_Country_Ecuador.pdf
Ecuador’s 2008 Constitution explicitly states
that the government will promote the use of
clean and alternative energy sources, in
addition to energy efficiency, while providing
access to public services, preserving the
environment and maintaining food and water
security, among others.
…The regulatory framework for electricity is the
Electric Law of 2015, which explicitly states the
objective of promoting renewable energy
sources, including solid-waste biomass. This
law establishes that the Ministry of Electricity
and Renewable Energy (Ministerio de
Electricidad y Energía Renovable – MEER) is the
governmental entity in charge of the
regulation and planning of the entire power
sector of the country, and hence carries the
responsibility of renewable energy promotion.
The law provides for preferential regulations
for renewable energy, which are still under
development by the newly created electricity
agency (ARCONEL) and expected in the second
half of 2015.
Perhaps Correa has seen the writing on the wall and unlike Chavez and Maduro in Venezuela understands that hitching the economy exclusively to oil is sure way to political turmoil and strife and not conducive to his long term maintenance of personal power. I guess time will tell but I have a hunch that diversifying Ecuador’s energy portfolio will only give Ecuador and its people a better chance at weathering the future storms of economic collapse due to ‘Peak Oil’. If it works, the people of Ecuador may look the other way as Correa continues to consolidate his personal political power.
Ron/Dennis.
I note EIA is no longer including crude lease stocks in inventory.
What is your take on this reporting change?
Really, all that matters is *economically recoverable* reserves, where *economically recoverable* is determined by the price of alternatives. Which means all these numbers are way too high.