Annual Reserve Revisions Part V: Oil Sands

A guest post by George Kaplan

Over this century the oil sands business has consolidated into three main players: CNRL, Suncor and Cenovus, all of which have shown considerable organic and total growth in reserves and production (and presumably debt). After this growth period it looks like things are plateauing at the moment. Oil sands projects have longer life cycles than conventional (e.g. 50 versus 20) and hence slower decline and depletion rates and longer plateaus. Most of the other companies have pulled out in the last five years, Shell has downsized and ExxonMobil’s assets are susceptible to price swings and it has put new developments on hold

Husky was a fourth Canadian company with significant interests, though less than the others, but the data and some news stories don’t show it to have been a particularly well-run company and it was taken over by Cenovus last year.

Canadian companies present annual data on SEC form 40-f (and a Canadian equivalent) and it is extremely detailed, in particular it is the only remaining readily accessible source for a Company’s probable reserve data that I know of. All SEC filings can be difficult to follow before 2009, especially Canadian ones as Bitumen mining could not be listed as part of oil and gas operations, in-situ SAGD could, but companies chose to list the product either grouped in with heavy oil or as separate entities (raw bitumen or synthetic oil). As further examples NGL was originally listed separately then it wasn’t and then it was again; reserves were listed as net only then net and gross and then gross alone and the layout of the forms changed every year until 2011.
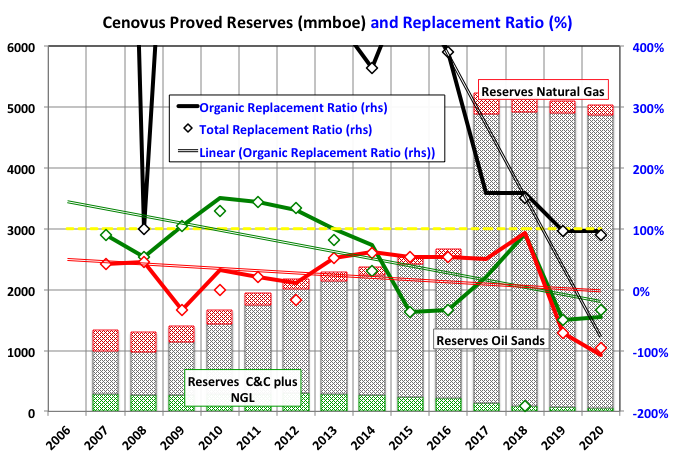
Cenovus

Cenovus was created in 2009 when it was split off from Encana taking the oil assets, while the gas business remained with the original company, which has since been renamed Ovintiv. I couldn’t find data for 2006 but it is probably somewhere in the Ovintiv filings. It grew significantly in 2017 when it acquired ConocoPhillips’ assets in Western Canada. It is now exclusively an Oil Sands company. Its debt load must be quite high.

The oil sands replacement ratio has plummeted in the last decade but may be stabilizing at around 100%.

Read More

Annual Reserve Revisions Part IV: Shale Producers

A guest post by George Kaplan

EIA Liquids Reserve Estimates

This follows on from Part I, which looked at EIA reserves and revision estimates for US as a whole and the GoM, and concentrates on the on-shore tight oil and (below)gas producing regions.

The EIA issues revision data by whole states or state districts rather than by basin, so some of the reserves and production, but a small proportion, will be from conventional reservoirs. It does give total reserves for each shale basin but not the changes, and I didn’t go to the trouble of pro-rating everything against that. Its data only goes through 2019; the 2020 update will be out in December or January.

The regions for each basins used are Permian – Texas Districts 7C, 8 and 8A and East New Mexico; Bakken –  North Dakota and Montana; Eagle Ford – Texas Districts 1, 2, 3 and 4 Onshore; Niobara –  Colorado; Marcelus – Pennsylvania and West Virginia; Utica –  Ohio; Haynesville – Louisiana South Onshore and Texas District 6; Barnett – Texas Districts 5, 7B and 9; Woodford – Oklahoma ; Fayetteville – Arkansas.

Read More

Annual Reserve Revisions Part III: Larger Independents

A Guest Post by George Kaplan

The story here is of a gradual decline in the size and importance of most of these (once) large independents. Their combined reserves and production is not sizeable compared to the super majors and majors but their history may be indicative of what is coming the way of the larger companies. All but one of these companies is American owned. Most have or had holdings in shale or oil sands but many have sold off most of these and chosen to concentrate on a shrinking core business. There is probably a fuller picture to see if their financial performances, such as debt loads or share buy back schemes, were also considered but that’s a bigger job than I’m prepared for or capable of.

Read More

Annual Reserve Revisions Part II: International Major IOCs

A guest post by George Kaplan

There’s not much revelatory here, more a completist’s list showing reserve changes for seven IOCs, with more to come over the next months, but it gives me an excuse for a rant at the end.

There are a few general trends but exceptions to each one. As discoveries have dropped production has been maintained, presumably through in-fill drilling and other brownfield activities – this can’t be construed from the data shown, although deeper analysis of the annual reports such as looking at drilling activities and financial details might be able to give further insight. Therefore remaining reserves have fallen as have reserve to production (R/P) ratios. Replacement ratios have been at or just below 100% and seem to be dropping faster – i.e. depletion is accelerating and actually seems to be particularly pronounced in recent years (acceleration of acceleration is called jerk or jounce I think). Looking at individual companies doesn’t give the full picture because of purchases and sales, but there is less of that than I expected for the companies shown here. A fuller picture might come when combining all the larger companies but even then it will not be complete. The recovery ratios are show for the organic numbers (i.e. without the net trades) as solid lines and trend lines with overall ratios shown as marker points. 

Read More

Annual Reserve Changes Part I: EIA and Super-Majors

A guest post by George Kaplan

EIA US Reserve Estimates

The EIA publishes reserve data for the USA, usually in December of the following year – so that the figures presented here are for 2019. Only proved category reserves are shown and the numbers are based on companies’ annual reports and 10-k or 20-f filings (so that last year’s numbers are now being addressed as most companies have filed). Not every company is included, otherwise the net acquisitions and dispersals (the yellow bars) would surely have to sum to zero, but most are and all the big players. Net adjustments include revisions (which may be technical or economic) and other adjustments, which are fiddle factors to make the numbers add up but are usually zero or small; improved recovery is here included as discoveries and extensions. The yellow dashed line shows the net change.

Read More