A guest post by George Kaplan
Over this century the oil sands business has consolidated into three main players: CNRL, Suncor and Cenovus, all of which have shown considerable organic and total growth in reserves and production (and presumably debt). After this growth period it looks like things are plateauing at the moment. Oil sands projects have longer life cycles than conventional (e.g. 50 versus 20) and hence slower decline and depletion rates and longer plateaus. Most of the other companies have pulled out in the last five years, Shell has downsized and ExxonMobil’s assets are susceptible to price swings and it has put new developments on hold
Husky was a fourth Canadian company with significant interests, though less than the others, but the data and some news stories don’t show it to have been a particularly well-run company and it was taken over by Cenovus last year.
Canadian companies present annual data on SEC form 40-f (and a Canadian equivalent) and it is extremely detailed, in particular it is the only remaining readily accessible source for a Company’s probable reserve data that I know of. All SEC filings can be difficult to follow before 2009, especially Canadian ones as Bitumen mining could not be listed as part of oil and gas operations, in-situ SAGD could, but companies chose to list the product either grouped in with heavy oil or as separate entities (raw bitumen or synthetic oil). As further examples NGL was originally listed separately then it wasn’t and then it was again; reserves were listed as net only then net and gross and then gross alone and the layout of the forms changed every year until 2011.
Cenovus
Cenovus was created in 2009 when it was split off from Encana taking the oil assets, while the gas business remained with the original company, which has since been renamed Ovintiv. I couldn’t find data for 2006 but it is probably somewhere in the Ovintiv filings. It grew significantly in 2017 when it acquired ConocoPhillips’ assets in Western Canada. It is now exclusively an Oil Sands company. Its debt load must be quite high.
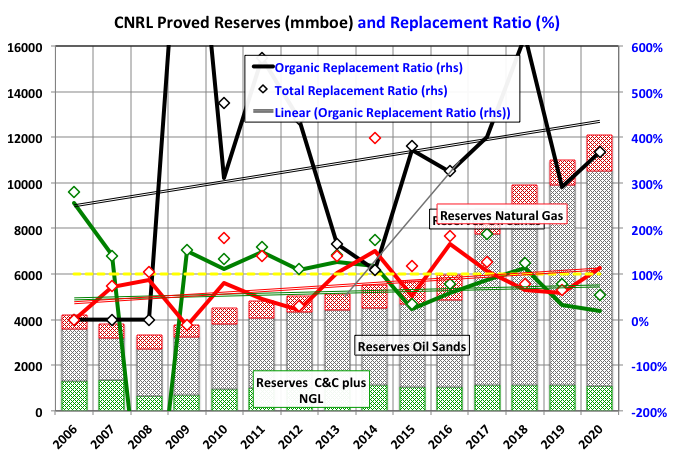
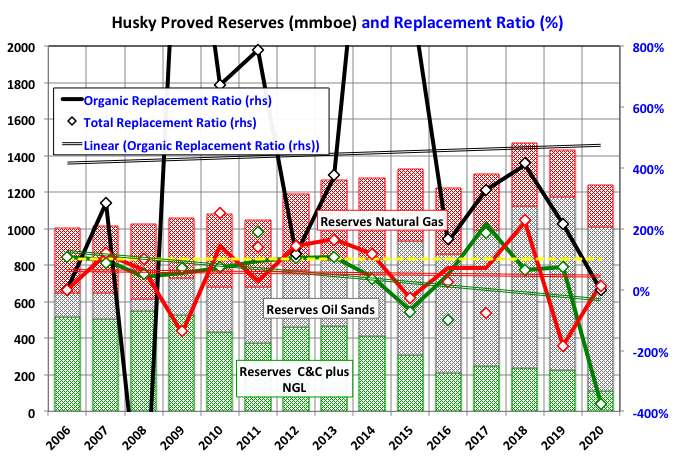
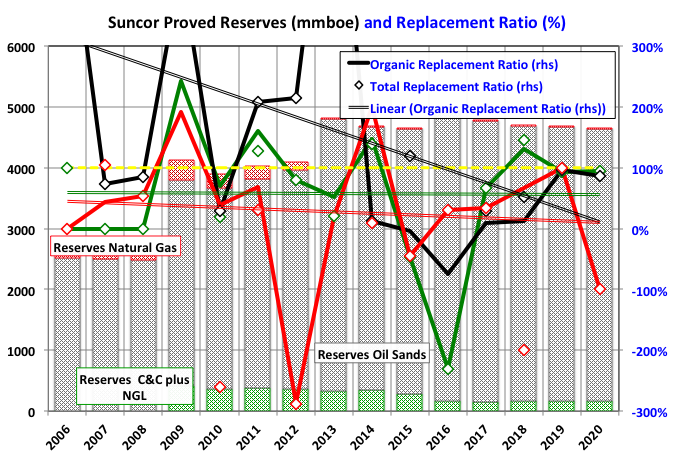
The oil sands replacement ratio has plummeted in the last decade but may be stabilizing at around 100%.
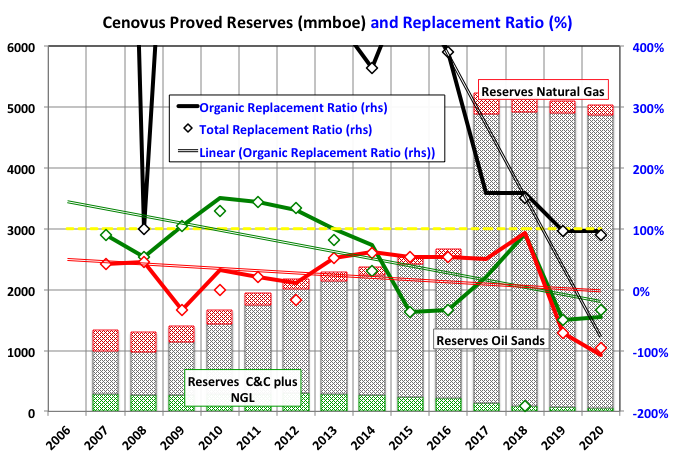
Conventional oil and gas have virtually disappeared, but have always been of minor relative importance.
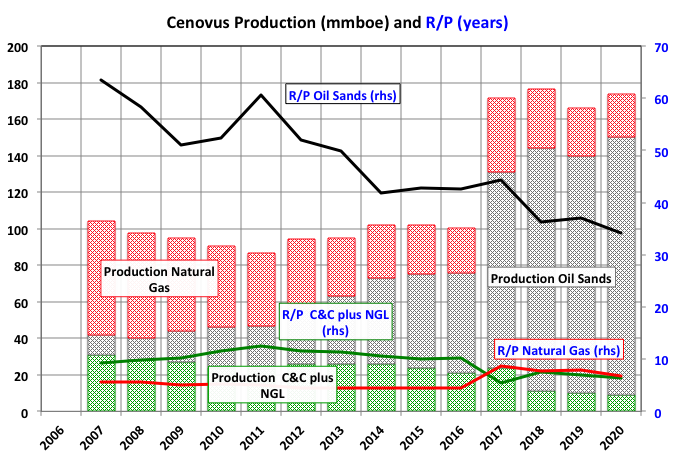
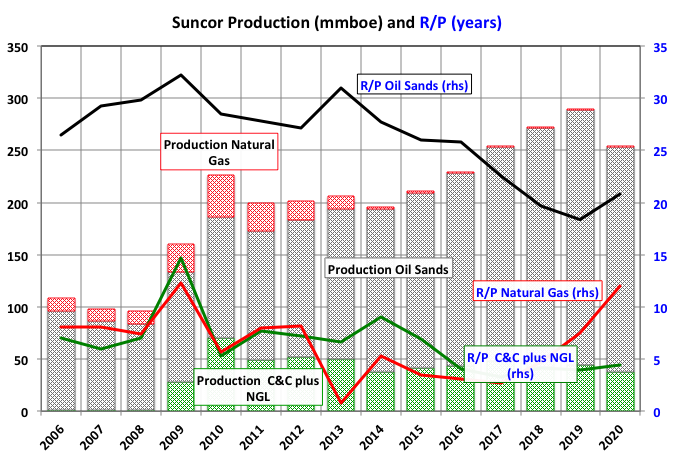
Oil sand projects are built for lifetimes up to fifty years so an R/P of 30-40 years is about right, but if it continues falling as it has been there would be concern.
CNRL
CNRL has more diverse holdings than the other big two. The major oil sands producers used to be referred to as the big five to include Husky, now gone, and Imperial, a part of ExxonMobil and with the recent asset right downs and lack of development activity possibly no longer worthy of inclusion in the group. There has been talk of a CNRL / Suncor mega-merger, which would take it down to a big pair (snrf-snrf) but that will now probably require another oil price crash.
Since 2017 CNRL has vacuumed up assets from Shell, Cenovus, and Devon in recent years.
Husky
Replacement ratios for conventional oil and gas have rarely exceeded breakeven point and the company has had to switch to oil sands. Some conventional assets owned by Husky on the Canadian East coast have had poor performance with two major long term enforced operational shutdowns for safety infringements and a multi-billion dollar development paused, and possibly cancelled, midway.
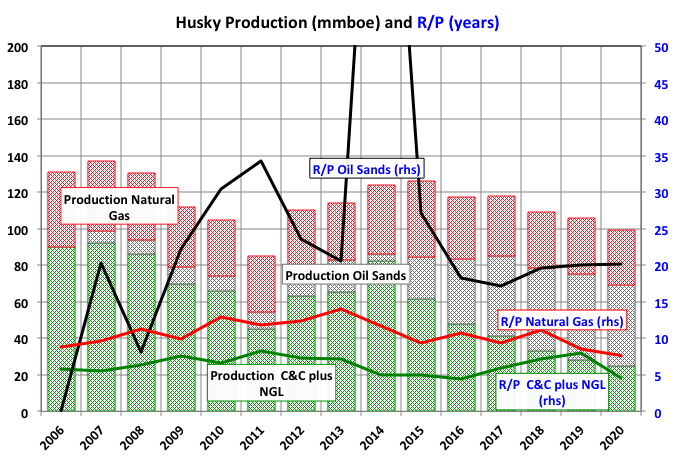
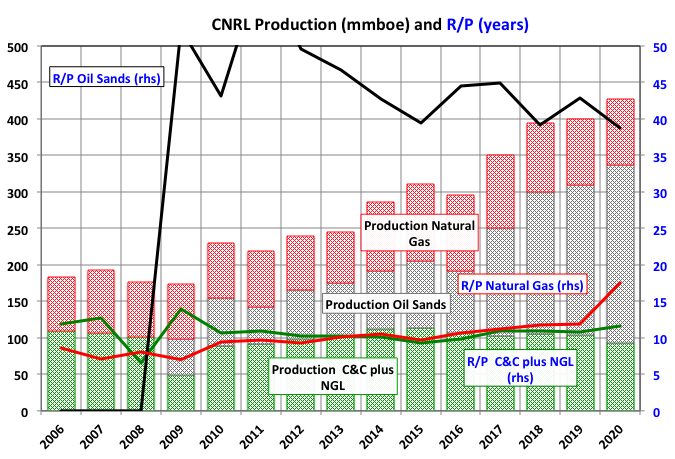
The R/P values have been holding up fairly well, but really only because production has been dropping faster than proved reserves.
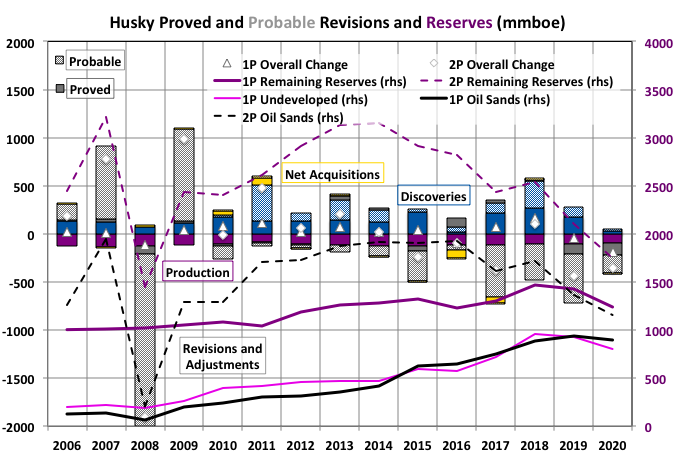
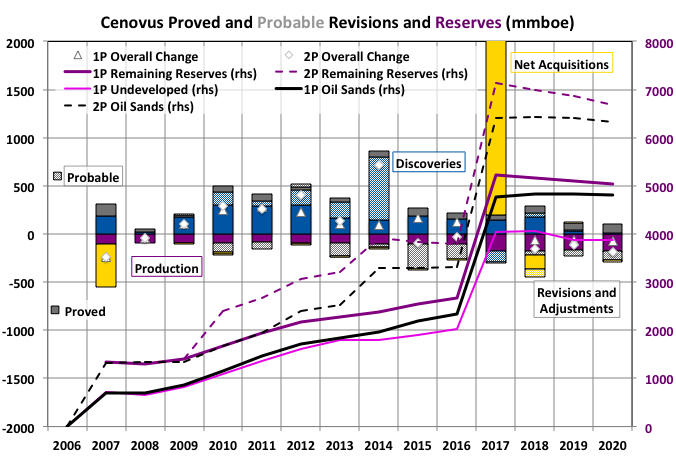
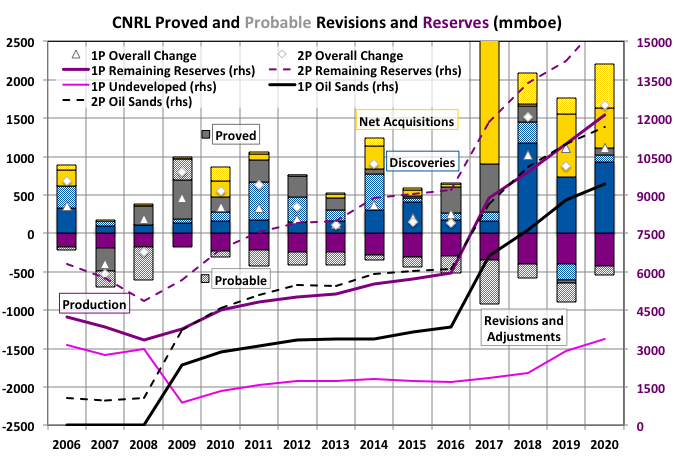
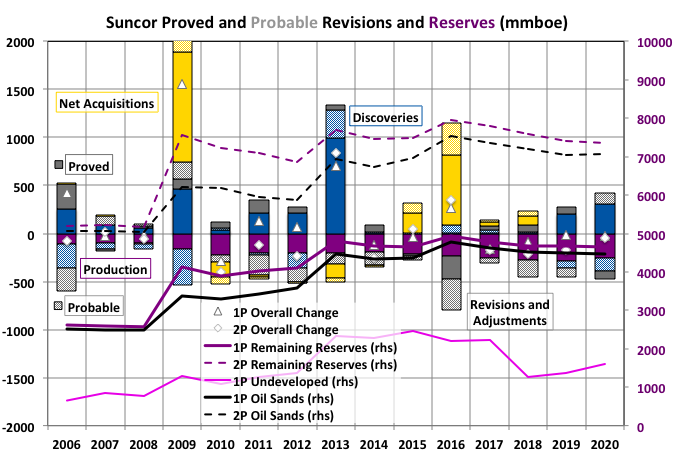
There’s something a bit dodgy about the large adjustments, mostly negative, of the probable reserves. These are not transfers to proved reserves as the adjustments there have also been predominately negative. The kindest interpretation might be that some of the reservoir team were rather naïvely optimistic with their initial estimates.
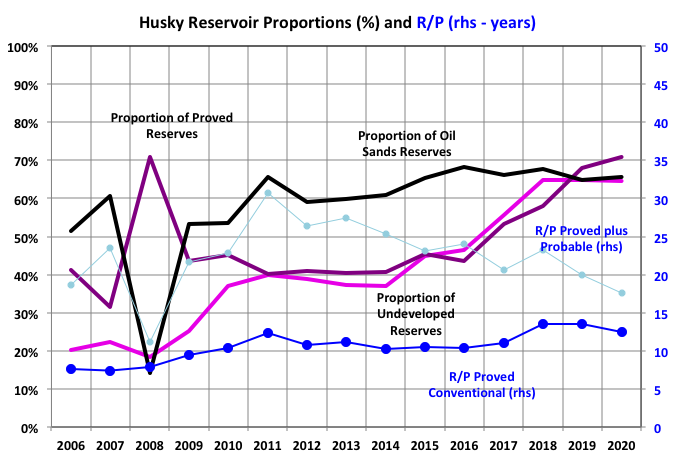
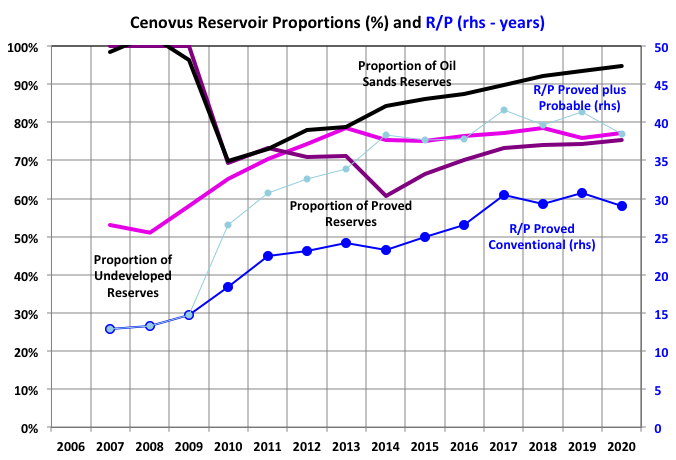
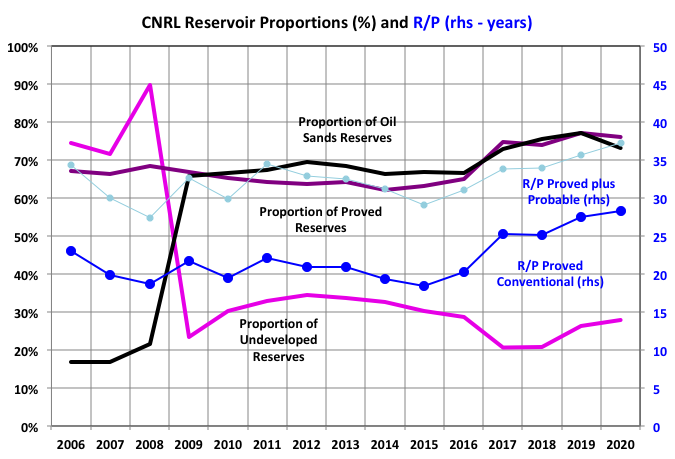
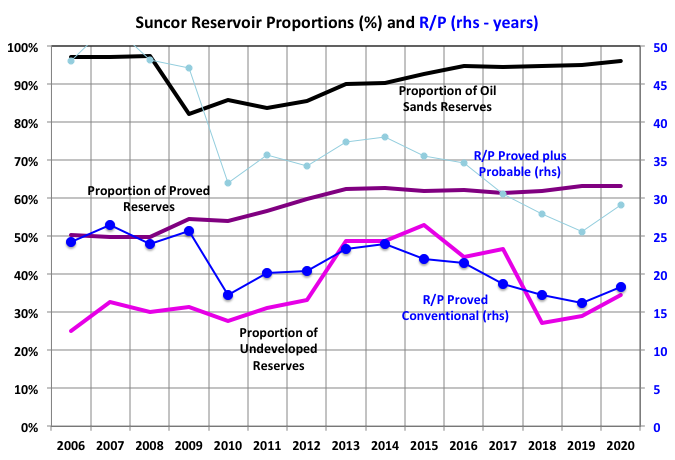
The proportion of proved reserves has risen by 30% in the last five years, which is indicative of mature assets. Undeveloped reserves have grown to 60%, also fairly rapidly, which may indicate a lack of access to capital or disinclination towards risk.
Suncor
Like Cenovus the small amount of conventional oil and gas that Suncor originally had has depleted to almost nothing. Oil sands replacement ratio seems to be levellin of around the 100% mark.
Suncor acquired Marathon’s and Murphy’s Canadian oil sand assets in 2016.
Synthetic Oil and Bitumen
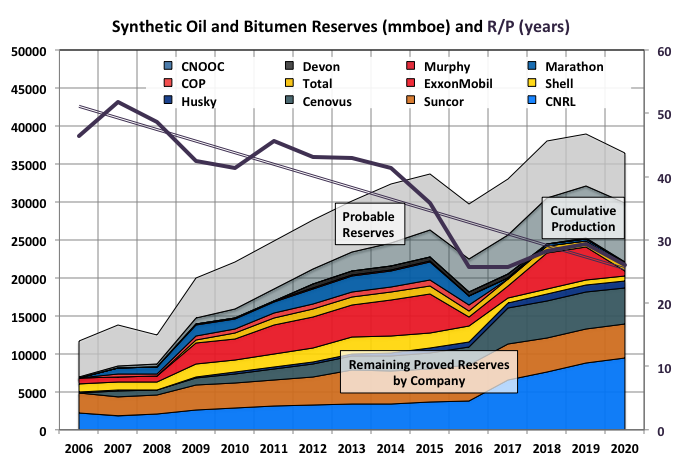
Ultimate reserves have plateaued for the time being, it will be interesting to see whether remaining reserves continue to decline as production is likely to remain fairly steady barring some major disruptions. I have covered some of the lesser oil sands producers in previous posts but there are a few others with low contributions (but possibly with big dreams and so far undeveloped resources) like MEG, Japex and Brion; getting data for these is not as easy as for those I have included here . PetroChina and Synopec have part ownership in Syncrude and some undeveloped holdings but they do not report bitumen and SCO separately from C&C, however I may do a future post just on the three Chinese componies as they all do report to SEC standards.
Off Topic Finish: The Rothko Room, Tate Galleries, London
At the height of his fame Mark Rothko, along with other important abstract expressionists including Pollock and Miro, was commissioned to provide artworks (which he called “murals”) for the tony Four Seasons restaurant in New York. A place according to him “… where the richest bastards in New York will come to feed and show off.” As he worked his stated intent became “to ruin the appetite of every son of a bitch who ever eats in that room and make those rich bastards feel that they are trapped in a room where all the doors and windows are bricked up.” Maybe this was partly exaggeration to impress his interviewer or as an attempt to reconcile his decision with his personal philosophy, but nevertheless it was heartfelt because in the end, after eating in the newly opened restaurant, he withdrew the commission and returned his fee (“anybody who will eat that kind of food for those kind of prices will never look at a painting of mine”). Instead, because of his admiration for J. M. W. Turner, he donated them to the Tate in Britain along with other works, some of which were turned down, possibly because he was very demanding in how his work could be displayed – I’d he was right to do so as explained below.

His withdrawal, or maybe the original decision to proceed, marked the beginning of decline both professionally and personally, and the next decade didn’t go so well. On the day the paintings arrived at the museum he finished his last piece, sat in front of it and slashed the crooks of his elbows.
The paintings can be rather sinister and claustrophobic but are deeply emotional on many levels. They are, in part, based on blind windows and doors used in Italian Renaissance architecture – these are really just ornamentation on the walls but look like frames, lintels, mantels and sills, but with bricks instead of openings and glass. However the influences go back further, at least to the Villa of the Mysteries’ frescoes in Pompeii, taking in Rembrandt, Turner and other old masters along the way, and maybe further still to ancient cave art. Despite this, and also knowing its history, the small room in the Tate where they are displayed is one of the most relaxing places I’ve been. The Rothko Chapel in Houston is similar, perhaps more so as it was designed specifically to be a place for contemplation.
Rothko considered himself to be painting moods and emotions and is a clear evolution from, for example, Ernst Kirchner, another favourite of mine who painted great, uplifting art and died tragically by suicide, though for different reasons. He was a more traditional and figurative type of expressionist but I think they’d both have rejecteed precise labeling.
Whether by design or instinct Rothko’s techniques show many factors that have direct links between our perceptions and out feelings such as RGB and hue-saturation-lightness (e.g. multi-layering of paint to create translucence), fractal effects, symmetry and asymmetry, complexity versus simplicity, the use of the golden ratio etc. It could not have all been calculated as much of it is still at the forefront of psychological study today.
He was a deep thinker and wrote pieces collected by his son in The Artist’s Reality: Philosophy in Art, and I think the painter best presenting the emotions and uncertainties heading our way. Here are some other quotes.
“Silence is so accurate.”
“You’ve got sadness in you, I’ve got sadness in me – and my works of art are places where the two sadnesses can meet, and therefore both of us need to feel less sad.”
“If you are only moved by color relationships, you are missing the point. I am interested in expressing the big emotions – tragedy, ecstasy, doom.”
“For, while the authority of the doctor or plumber is never questioned, everyone deems himself a good judge and an adequate arbiter of what a work of art should be and how it should be done.” – could go for climate scientist’s work with some bozos these days.
207 responses to “Annual Reserve Revisions Part V: Oil Sands”
George
In the post you note “There has been talk of a CNRL / Suncor mega-merger”. There was talk of that many years back. I have not heard any talk of that over the last five years.
Both companies have been focused on increasing their oil sands assets. CNRL has bought a big chunk of Shell’s oil sands and shares the ownership of the Shell Scotford upgrader.
“Shell still operates the upgrader despite retaining only a 10 per cent ownership stake followed the transaction in 2017 that gave Canadian Natural a 70 per cent stake. The arm of Royal Dutch Shell kept 100 per cent ownership of its nearby refinery and chemicals facilities.”
Suncor has focused on increasing its ownership of Syncrude to more than 50% and will take over the operation of Syncrude from XOM at the end of the year. They have a joint project with Teck on the Fort Hills operation. Not sure if the Joslyn project is still on the radar.
Both companies are focussed on debt reduction, share buy back and dividend increases.
I have sent you the latest analyst reports on SU and CNQ.
Analyst have to continually justify their existence and their reports are really only about the next quartery report. If and when the next oil collapse occurs, presumably once the next global recession/depression hits, then they’ll be about merger talks again.
Hi George
I know you keep a keen eye on the North sea as do I, and will have noted how the Hurricane fractured basement saga has played out. The latest start up listed on the AIM market last week with the intent of developing the Pilot field.
I remember Pilot from back in the day as being heavy oil but they claim new tech blah blah. Could be interesting to watch if it’s on your radar.
Thanks for your continuing contributions.
L/O – I’d seen that they were looking at steam flood, which seemed like a hiding to nothing offshore, let alone somewhere as hostile as the North Sea, but now they seem to have switched to polymer flood. Chevron started this on Captain in 2018 but I can’t see it made a huge difference, maybe prolonged production fot some time but didn’t add any really. The production plan for Pilot only has a life of 10 years with s/u in 2023 – they’d need to find a suitable FPSO to refit to even get close to this but in reality I’d think they are a good few years away yet and need to find some investors prepared to take on the highish risk.
Hurricane was a blow to a lot of people in the industry i think but fracturing granite (was it?) is pretty speculative. I don’t know if the UK North Sea has much left to give now, except for the decommissioning industry.
George
Yes Hurricane was naturally fractured uplifted basement rock charged with oil. The oil is in the fractures not the rock. Analysis of the experience with similar plays in Vietnam should have raised risk awareness. There is an investor fund currently increasing their holding amid court cases and threats of abandonment. It will probably end in tears.
This is the latest Pilot blurb for what it’s worth.
https://youtu.be/XFn-mmJ_t7I
Apparently the field will be powered by a floating wind turbine, spilled my coffee on hearing that.
George and L/O . Going by the latest link by Pollux that the production is down by 28% my call is that the operators are working to kick the can down the road for decommissioning as they are all broke and pass the liability to the sovereign as has been happening in the mining industry in the past . No, nothing new , just confirming that both you gentlemen are correct in your assessment of the situation . Now the question , how many such projects worldwide , flying below the radar ?
Saudi Aramco has been hacked and many of their secrets can be had on the dark web for $50 million. Should we start a fundraiser? Would be really interesting stuff!
https://oilprice.com/Energy/Crude-Oil/Middle-East-Oil-Giants-Grapple-With-Cyberattacks.html
Saudi Arabia’s Strategic Energy Initiative:
Safeguarding Against Supply Disruptions – November 9th, 2006
Water Cut in Saudi Oil Fields
• Aramco’s current water cut (the ratio of water produced from a well
compared to the volume of total liquids) is about 29%.
• The water cut in Ghawar, the world’s largest field, which has a
sustained production capacity of 5 mb/d has declined from a peak of
35% to just 32% because of advances in technology and continual
improvements in field management. If past years are any indication,
this trend will continue.
In 2006, Ghawar had a water cut of 35%. But by closing off their vertical wells and creaming only the top of the Ghawar reservoir with horizontal wells, they got the water cut down to 32%. And, at the time, they could maintain 5 million barrels per day production. Three years ago, that production capacity had declined to 3.8 million bp/d. That was stated in their IPO. But their IPO did not state the current water cut. Of course, they were still producing the same amount of liquids or perhaps much more than they were in 2006. But they were producing a lot more water and a lot less oil.
The current Ghawar water cut is a closely guarded secret. Does anyone care to make a guess as to just what it is?
Ron
I guess you did not see my question to you in the previous post. My guess/calculation is close to 50%. Note that my calculation shows the water cut in 2006 is 30%.
For 2006: Oil 4,894 kb/d. Water 2,106 kb/d.
https://peakoilbarrel.com/opec-update-june-2021-2/#comment-721814
Sorry Ovi, I completely overlooked that post. But I love it. I think you are very close. But I would guess the Ghawar water cut to be quite a bit higher. Your method of calculation has a slight flaw. You wrote:
Many years back, I recall reading an article in which the author said that Aramco was pumping 7.0 Mb/d into Ghawar and were recovering 4.6 Mb/d of oil and 2.4 Mb/d of water.
In that scenario, the amount of liquids recovered exactly matches the amount of liquids injected. There is no reason that this should be the case. Water is injected at the periphery of the reservoir and at the very bottom. All the water does not go to push the oil higher and toward the center. Some of the water goes in the opposite direction, away from the reservoir, or lower. To keep the reservoir pressure constant, you must inject more liquids than liquids extracted because all water injected does not go into the reservoir.
That being said, I find it astounding that 15 years ago, Ghawar had a 32% water cut at the very top of the reservoir.
Ron
I must slightly disagree. If pressure is held constant, liquids in must equal liquids out, excluding compressibility effects.
You wrote “Some of the water goes in the opposite direction, away from the reservoir, or lower.”
While that is true, that water that goes in the other directions displaces liquids in those areas which has to go somewhere.
Ovi, I cannot find the link now but I remember reading, several years ago, about the amount of injection water that was lost because it moved in another direction instead of into the reservoir. Of course, when you have an anticline, the water must either go into the reservoir or down, deeper into the anticline. However, water is much less viscous than oil and can pass through far less porous rock than oil. However, I am not an oilman and cannot say much more than that.
Perhaps one of the oilmen on the blog can comment.
OVI, R0N
The effective movement of injected water into a water drive reservoir is partially a function of the size or volume of the downdip driving aquifer and geology. A dead giveaway is the pressure response and material balance, in rough terms here.
If more water is injected into a significant downdip aquifer than the reservoir barrels produced then the reservoir pressure will plateau at approximately virgin conditions in ideal rock. I have a small field that Texaco flooded in the 70s injecting almost twice the water than reservoir barrels produced resulting in zero production increase. My estimation is: big aquifer and bad rock. The latter is readily characterized by DSTs, logs, fracs and pre flood decline rates.
Almost every reservoir engineer in the world could give a superior answer but this should be sufficient for your arguments.
Injection and production have to match, not just for the field but for each individual fault block in the field (typically with a producer-injector pair, or one injector feeding two producers). If injected water is being lost and not directly supporting the pressure then I think it would mean the well has been improperly designed or drilled. I can see the opposite maybe – i.e. if there is partial aquifer flood then less injection water would be required to maintain volume balance, but mixing seawater and aquifer water can be difficult, (scaling) and I’ve never heard of such a situation in practice.
Ron, I have posted twice here in the past and someone here posted this before me – South Ghawar water cut is 60%, p. 1024
https://www.researchgate.net/publication/321583912_Comprehensive_review_of_water_shutoff_methods_for_horizontal_wells
South Ghawar went online decades after North and Central Ghawar. If South Ghawar is at 60% water cut then North and Central Ghawar must be much higher.
Isn’t North and Central Ghawar of much higher quality than South Ghawar?
At least that’s what I remember from somewhere. For that reason, South Ghawar was exploited much later. It stands to reason that the water cut for North/Central Ghawar should be higher
Ron,
I made the following post seems 2019
https://aktiertips.se/northern-ghawar-water-and-production/#more-214
I think you will find the water cut images interesting for northern ghawar with dates.
I think the post came from Dennis arguing that the ain dar 1 well was not located in the best part of ghawar witch it clearly is, best location in best part. Witch naturally is the logic position to place it.
Wow , Baggen you said it all in your sign off statement .
“All of this together i believe the northern parts of Ghawar are more or less done and today stands for a fraction of total remaining production from the combined Ghawar field. ”
This was in 2019 . Today is 2021 .
Thanks Baggen, great post. The charts were fantastic. I had seen the Ain Dar water saturation charts before. But they clearly show that in 2004 Ain Dar was mostly water. If they are pumping anything from Ain Dar today it is oil-stained brine.
A good article on the CAPEX starvation in the energy sector . Only 44% of the assets are being replaced .
https://www.knowledgeleaderscapital.com/2021/07/23/the-us-energy-sector-is-in-chronic-atrophy-and-that-could-be-a-good-thing-for-energy-investors/
Good charts in that article HinH
I suspect that in the scenario of a quick drop off in global oil supply that capital will come looking hard and fast for a place to deploy. Where will it find good projects to invest in?
I don’t think the most likely scenario is a quick drop off in global supply, but that’s just unschooled speculation based on close to no solid facts.
Big company in India has decided to ramp up its refining capacity. I suppose they are planning to source the oil from Iran,etc? If so, China and the rest of East Asia will be competing vigorously for the same.
“Indian Oil Corporation (IOC), the largest oil refiner in the country, looks to boost its crude oil refining capacity by one-third over the next half-decade as it believes gasoline and diesel demand will continue to rise in India, IOC’s chairman Shrikant Madhav Vaidya told Bloomberg.”
https://daily.energybulletin.org/2021/07/indias-largest-refiner-plans-to-ramp-up-capacity-this-decade/
Tight oil data for June is out. See tight oil estimates by play spreadsheet at page linked below.
https://www.eia.gov/petroleum/data.php#crude
Chart below shows centered 12 month tight oil average output. In 2018 the average was about 6500 kb/d, for most recent 12 months the average is 7063 kb/d, about 936 kb/d below the peak 12 month average (7989 kb/d).
Looks like we are still waiting for that sharp upward turn in shale production. 😉
US Light Tight Oil through June 2021.
Ron , they also serve who stand and wait . 🙂
Ron,
My expectation is that the centered twelve month average (CTMA) of tight oil output will turn up sharply in 2022.
Dennis, it wasn’t too long ago that you had production turning up sharply in mid-2021. Exactly when in 2020 do you have the actual production turning sharply up? It looks like that you have the EIA actual data turning up sharply in late 2021. Is that correct? It looks like you have too much of a lag time for the 12 mth avg. The lag time should be six months, not eight to nine months.
Ron,
I use the centered 12 month average (where I put the center at July for a Jan to December average). Model turns up in July 2021, but doesn’t reach current EIA tight oil estimate until Jan/Feb 2022. Chart below has EIA monthly data and model as well as model CTMA (centered twelve month average).
Note that the rate of change in output in July 2021 for my model is close to zero (first derivative is close to zero), then the slope gradually becomes positive from July 2021 to January 2022.
We will be lucky to be up or flat in 2022. At current prices there will be no movement up.
Thanks LTO Survivor,
My expectation is that Brent will rise to $80/bo by Jan 2022 and remain at that level (for 12 month average price) until 2033, that is the assumption made for the scenario. I also assume wellhead price for natural gas will be $2/MCF and NGL will sell for $18.75/b.
Perhaps you will be correct, I expect Permian output will continue to increase, but perhaps decline from other tight oil plays will offset this increase and output will remain flat. I doubt it will decrease at this price level.
Ron,
I think I remember what you are talking about. I thought in 2020 that tight oil output would fall to lower levels than has been the case and then thought there might be a sharp recovery around the middle of 2021.
The chart below was a scenario I did in March 2020, notice how far off it was for June 2021, the scenario guessed about 4200 kb/d of tight oil output in June 2021 (actual was around 7000 kb/d) and by March 2023 tight oil output remains below 6000 kb/d.
Perhaps this is the sharp up turn you remember from not that long ago, though it is not a very sharp upturn in 2021, the slope of the output curve barely turns positive by the end of 2021. Maybe you can find the mythical scenario where I predicted a “sharp up turn” in 2021, I have many scenarios with a mild up turn in 2021, but perhaps to you any positive increase in output is “sharp”.
Dennis, your chart is extremely optimistic. Given the fact that the Permian is the only shale play that is actually increasing production, do you really believe that that chart is realistic? Icreredable! It is not remotely realistic. The Permian will be lucky to increase production more than the rest of the US Shale is decreasing.
Dennis, you are living in a dream world.
Ron,
We will see what happens when oil prices are $90/bo or higher. Notice what happened the last time LTO peaked and declined in 2015 to 2016.
I will also note that you have always believed my past projections were overly optimistic when in fact history has proved that they were in fact pessimistic, history does not always repeat, but my scenario is in line with USGS TRR estimates and reasonable economic assumptions.
My scenario for US tight oil minus Permian basin tight oil is below, CTMA is centered twelve month average. I do not expect the previous peak (4021 kb/d in October 2019) will be attained for US tight less Permian, but expect a secondary peak around 3540 kb/d in 2025, if Brent oil prices (in 2021 $) reach $80/bo by Jan 2022 and remain at that level or higher on average through 2026.
I have no doubts that the Permian can go higher. I also have no doubt that the rest of the USA, shale as well as conventional oil, can go lower. This push-pull will keep anything dramatic from happening during the next few years to America’s oil production. My point is: The dramatic growth in US oil production is over.
This means it really doesn’t really matter as far as peak oil is the subject. The up or down that the USA contributes will not be enough to make much difference. The rest of the world has peaked. End of story.
Ron,
We will see, I remain skeptical that 2018 will be the final peak in annual average World crude plus condensate output.
I agree that US might have peaked in 2019, but US output is likely to rise above the 2018 average output level of 10964 kb/d, in fact it is currently above that level. I agree we won’t see the dramatic growth of 2017 to 2019 in the future, growth in World output will come from OPEC+, Canada, Brazil, Guyana, and Norway, with perhaps some growth from US as well (I expect US output will reach 12000 kb/d for a secondary 12 month average in 2027/2028.)
Ron, there is not going to be any growth as you said . The pull and push are unevenly matched . The pull up in production can only come from the Permian but that will be in arithmetical progression(all sweet spots drilled and swept) , the push down will be in geometrical progression in the other shale basins(high decline rates ) the push down in shale will be more than the pull up . Now add the regular decline of 3to 4% on conventional onshore (base 3.5 mbpd) . I don’t know about offshore and Alaska . Alaska specially is something that can just stop due to factors beyond control ( you posted on that ) . Offshore is high cost and also with a high decline rate . No way there can be growth , the question is how fast will be the decline since there is so much lying by the shale companies we really do not know if they are swimming naked .
Dennis wrote: growth in World output will come from OPEC+, Canada, Brazil, Guyana, and Norway,…
No doubt had Russia not admitted that they are post peak, you would have included Russia in that group. No doubt there will be several countries that will continue to increase production, however slight, in the near future. But the decliners have now overtaken the gainers.
Dennis, whenever you talk about where the oil production growth will come from, you never mention any nation that is in decline. The decliners are not in your field of vision. That is your blind spot.
Ron,
We can look at World minus OPEC plus 5 nations (Russia, US, Canada, Brazil, and Norway) and find that from 2010 to 2018 the “rest of World” besides OPECplus5 declined at an average annual rate of 305 kb/d. After 2018 OPEC plus cut output and we had a pandemic. My thesis is that the OPEC plus 5 nation group will more than offset the rest of the World’s decline. OPEC plus 5 nations increased output at an average annual rate of 1388 kb/d over the 2010 to 2018 period, I expect this rate of increase will be smaller in the future, especially after OPEC has restored the production cuts by mid 2022, but I expect it will be higher than the rate of decline elsewhere at least until 2027 when the World may reach its final peak in crude plus condensate output.
Hole in head,
US L48 onshore minus tight oil has not been declining at 3.5 to 4%, lately, more like 1 or 2%. GOM may see some growth or plateau fro a few years. For US C plus C minus tight oil for Jan 2015 to Dec 2019 the least squares trend is an average annual decline of 31 kb/d with average output for the period of 4492 kb/d (US minus tight) or an annual rate of decrease of 0.69%.
My model takes account of production in all the tight oil basins as shown in my charts above, higher oil prices makes more of the tight oil profitable to produce. Perhaps it will take $150/bo as LTO survivor suggests, I think $90/bo will do it, but time answers these questions.
Dennis , since decline in offshore is not going to be severe as you have commented then we just have to wait for the tide to runout and see who is swimming naked in the shale basins .:-) . I think we will find out soon . Your scenarios of $90 and 150 will never occur so I am ignoring them .
P.S ; When I say “never occur” it means sustained 6months + basis . Spikes can happen .
Hole in head,
The average Brent price in 2019 US$ from 2011 to 2014 was about $108/b. If supply is short oil prices will rise and currently the World economy is larger than in the 2011 to 2014 period so as a percent of World GDP an equivalent price today (percentage of total World GDP spent on crude plus condensate) would be about $130/bo in 2019 US$. If World crude plus condensate output has peaked (the 2018 annual average level is never attained or exceeded in the future) as many here have claimed, I would expect that Brent at $130/bo in 2021$ is a very real possiblity by 2023 or 2024. I think output will rise and keep prices below this level until perhaps 2028, but the speed of the transition to electrically powered transport might effect demand for oil by 2028 and the peak may occur due to lack of demand rather than lack of supply (though I doubt this will occur and expect high oil prices from 2025 to 2032.)
Dennis , 2011-2014 is not 2021 -2022 . There was no Covid . There was not hundred trillions in debt . Shale arrived at the gate to increase output . Trillions were printed during 2008 -2010 by Bernanke and company to allow the high prices for a short period of time(3 years) . It was like a high to a drug addict . If the price was not artificial then why has it been in the dumps since 2014(7 years) ? . Conditions of 2011-2014 do not exist today , so your whole analogy is incorrect . We have run out of road . What Bernanke printed in 3 years Powell is printing in 3 months and it is like pushing on a string . Your argument that high prices will bring new production does not hold because there is nothing new to bring online . The lack of CAPEX in E&P over the last 10 years is well documented .
Hole in head,
I disagree. High prices was due to high demand, the prices are in constant US $, so inflation and money supply are not a part of the story. The low prices since 2014 was due to a combination of over supply of oil and the pandemic. It also explains lack of investment as low prices means low profit and less incentive to invest. Tight oil is very short cycle investment and can ramp quickly with high oil prices and OPEC has lots of spare capacity at present so getting back to 2018 levels of output just takes a bit more output from Brazil, Norway, Canada, and US tight oil.
You assume oil prices will be low for the long term, if your assumption is correct, then 2018 may remain the peak.
I just think your assumption is incorrect on oil prices.
I am still searching for the 10mbpd of shortfall from the export pool in 4 years time (2025) . If I remember West Texas who designed the ELM model calculated 10 years from peak and/to exportable surplus is zero . US is an exceptional case since while it is a nett importer of crude it exports shale oil which its refineries cannot use . So actually it is not a case of surplus production but a case of mismatch between refinery input and oil production . Even if the exported oil was used by the refineries US would still be a nett importer of crude .
P.S : You think 4 years is a long way to go ? Covid is already a year half old and it seems yesterday . This blog is how many years old ? Time flies .
Hole in head,
If export land model proves correct, then we will see a severe spike in oil prices which will tend to increase supply (compared to a lower oil price scenario) and reduce demand for oil in part by accelerating the move to electrically powered transport. So far the dire warnings from 2007 have not come to pass, in fact ASPO-USA seems to no longer exist so I cannot find the original paper.
On problematic assumption of the model is that consumption increase in exporting countries continues to increase in the model and there is no feedback from oil prices.
In reality nations are likely to reduce subsidies to their citizens for oil as the market price of oil rises, this will reduce the rate of growth in exporting countries demand for oil.
In short, the model no longer works when the World peaks due to a lack of oil supply and exporting nations will behave differently after the World peak in oil output than nations that peaked in output and net exports prior to the World peak.
Dennis, I was also searching for ELM but could not find it in complete detail. I agree that the model does not work because again jogging my memory it forecast zero export by 2020-2022 which obviously has not happened . Regarding consumption increase in exporting countries the increase will continue ( Norway is exception) ,the rate of increase is questionable ,but we have seen the jump in KSA in the last BP report when it is now number 4 even triumphing Japan . Easing out subsidies is easier said then done . Social unrest for the rulers is a nightmare . The US govt has not raised fuel taxes in ages . High oil prices in the international market work both ways for the exporters . High prices = more income makes it possible to subsidize the locals and prevents unrest . High prices = lost revenue . Each barrel extra consumed is loss of revenue from the international market . A tug of war . If I was MBS what would I do ? Better keep my head attached to my shoulders , I guess .
Hole in head,
There are better methods than just a subsidized low fuel price. A ration card with fuel credits that can be traded fro those that want to reduce consumption would lead to reduced fuel use by society, the powers that be simply need to innovate, lots of possibilities.
Dennis , easier said than done . There are unintended consequences like black markets , price gauging , decline in economic activity = raised poverty level = subsidizing of food . Higher corruption . I have worked in a rationed economy of India from 1973 -93 . I know the pitfalls and the problems that arise . Repeat , easier said then done .
Hole in head,
Not all goods rationed, just a card that allows a quantity of fuel to be purchased by the citizen when using the card, the fuel allotment would be allowed to be traded for cash on the open market, those that choose to use less fuel will have excess fuel credits and can trade on an open market to those who choose to use extra fuel. This will be an incentive for people to use more fuel efficient transport or drive less.
Not a “planned” economy like India of old.
Alternatively OPEC governments could allow fuel prices to rise to the World price and simply provide cash to citizens equal to the “fuel allotment” which might have been assigned to a fuel card.
Dennis , ” simply provide cash to citizens equal to the “fuel allotment” which might have been assigned to a fuel card.”
You mean like the US govt is doing now ? Print and print . The US is now seeing the unintended consequences of this .
Evidently you are ignorant on the pitfalls of a regulated ( doesn’t have to be rationed) economy . By your above statement to provide cash means print and print and that means inflation . Start a new loop ,raise petrol prices , issue more cash, increase inflation , raise petrol prices and rinse and repeat . Anyway no govt has the will to do such an act as it is political suicide . Best we stop with this discussion .
Both Bakken and Eagle Ford appear to be in decline. The data is through June 2021 and is in Million barrels per day.
Ron
if the total is flat and there are two down basins, there must be an up basin somewhere. Guess where.
Thanks Ovi,
A snippet of a recent Permian model (ERR=56 Gb) which reaches 7000 kb/d by 2029 and remains on plateau of 7000 to 7100 kb/d until 2034, chart below only shows model through July 2022 (output at 4500 kb/d). The model uses the USGS mean TRR estimate of 75 Gb, only 56 Gb of which is extracted under the economic assumptions of the scenario.
Dennis
If the LTO Permian continues to grow at its current average rate of 36 kb/d/mth, it will exceed the March 2020 high of 4,225 kb/d by December or January.
Let’s keep in mind that this growth rate is being fuelled by completing 125 Permian DUCs each month. Last Friday’s Rig report shows an increase in interest in drilling in the Permian because 5 rigs were added. There is a lot of talk of returning cash to investors but it looks like at the current WTI prices companies may be able to return cash to investors and also drill more.
From the article
“There’s something a bit dodgy about the large adjustments, mostly negative, of the probable reserves. These are not transfers to proved reserves as the adjustments there have also been predominately negative. The kindest interpretation might be that some of the reservoir team were rather naïvely optimistic with their initial estimates.”
Oil and oil pricing is very political. Companies are hedging oil at prices far below the level the market suggests it will be. U.S. policy makers want cheap oil, oil companies want as high a price as they can get. Those companies have no leverage in capping production to increase the price. But what if they could downgrade reserves and scare the authorities and the market into action?
Permit approvals are up.
But what if they could downgrade reserves and scare the authorities and the market into action?
And what happens to the price of their stock when they downgrade their reserves? It crashes, big time! Dumb move. And every company would have to be in on the scam or it would not work. They get caught and go to jail. Another dumb move.
Exxon downgraded their reserves by 7 billion barrels last year, when the share price was in the toilet.
Not every company would have to be in on it, just the big ones such as Shell, Exxon, Chevron etc etc.
Elon Musk is in court over his purchase of the insolvent Solar City. Investors and pensions funds are alleging he breached his fiduciary duties when the buyout was made. The other defendants settled for $60m last year. But Mr Musk is riding shotgun on this one. You want to talk about fraud? It’s as clear as day in this case. Will Elon Musk see the inside of a jail cell?
Hell no, not on your life.
The big oil firms scratch the Federal authorities back and receive preferential treatment with regards to access to leases across the globe. Write downs of reserves wouldn’t see any of the big players under investigation, let alone court.
Hume, public oil companies in the US are required to evaluate their reserves at current oil prices. Low oil prices have a direct correlation to their economical retrievable reserves. There is nothing to investigate.
HuntingtonBeach,
Ron was intimating fraud and a potential investigation. I was not.
China Adds to Supply as Refiner Demand Stalls
Trading sources say China is releasing more than 20 million barrels of mostly sour crude from its strategic petroleum reserve in what appears to be an attempt by the government to push oil prices lower and control inflation.
If all of that oil were released into the market over a single month, it would equate to 946,000 b/d, or more than double the volume that Opec-plus will add to global supply from August.
Just wondering.
Does anyone forsee demand being significantly greater than supply in the next 10 years, especially as Evs start to replace ICE from 2030?
Sean,
Yes,
Sean , EV’s are not going to be the one’s that will move the needle . It will be ‘” affordability ” . There are 1.3 billion ICE cars and trucks add airplanes, ships ,construction equipment , diesel electric generators etc and all these are not going away anytime soon .
Something on EV batteries .
https://oilprice.com/Energy/Energy-General/The-World-Will-Run-Out-Of-EV-Batteries-By-2025.html
Hole in head,
This article does not go into details on why we would run out of batteries by 2025. Often such studies fail to assume that economies of scale will be significant. The poor assumptions lead the models to fail. As the world ramps up battery production they will utilize materials more efficiently and increase the capacity to produce batteries per square foot of manufacturing facility, more resources will be developed, for those materials in short supply new types of anode and cathode design will allow substitutes to be used.
Prices will rise as needed to balance the market and may lead to efficient allocation of resources, particularly if trade barriers do not get in the way of this process.
Dennis , the issue is not economies of scale . The issue is not enough lithium and cobalt . It is not an economic problem it is a “resource problem ” . If it does not exist then it does not exist . If economics was a solution to resources then there would be no such thing as “rare earth” elements . The world would print zillions and they would be conjured .
Do we need to start a Peaklithium.com site and a peak cobalt.com site?
@Ovi
Lithium isn’t that rare – there was only not enough looking for it before. you can event get it out of seawater, providing vast quantities:
https://www.mining.com/scientists-develop-cheap-and-easy-method-to-extract-lithium-from-seawater/
Cobalt isn’t necessary, it’s only needed for high performance batteries. Low cobalt and no cobalt batteries are used more often now.
The rare earths are Scandium, Yttrium, Lanthanum, Cerium, Praseodymium, Neodymium, Promethium, Samarium, Europium, Gadolinium, Terbium, Dysprosium, Holmium, Erbium, Thulium, Ytterbium and Lutetium
None of them are used in batteries. That is just an internet rumor.
Scandium and Yttrium are used for making special high performance alloys used in jet engines. Nobody says “We won’t have airplanes in the future because we are running out of rare earths”.
That is because the whole rare earth scare is a lie invented to attack battery technology. Some fossil fuels are running out. All fossil fuel is being replaced by energy sources that aren’t running out. People who have a problem with that try to project the problems of the fossil fuel industry on to its competing technologies, but it’s just bullshit.
Renewables and electrification are happening and quickly. That comes with some problems, but not with the same problems we had in the past.
Throwing around terms like “rare earth” without even knowing what they mean shows you are suffering from the Dunning–Kruger effect.
When I read cobalt in this study i knew I could stop reading.
The trend in batteries is already now low cobalt, or no cobalt at all. It’s rare, it has bad press and last but not least it’s very expensive.
This are 3 no’s – it will have it’s place with supercars and other high performance use cases – but it will be phased out more and more.
Even Tesla now builds the base version of Model 3 in China with a LiFePO battery – no rare metals at all, and no danger of ignition, too.
Otherwise cars like this wouldn’t be possible, too:
https://spectrum.ieee.org/cars-that-think/transportation/advanced-cars/chinas-most-popular-ev-no-longer-a-tesla
It’s nothing for the USA or Europe – but the 100 mile range is enough for most metroploitan areas.
The constraint on vehicle batteries will likely be from insufficient manufacturing capacity, rather than raw material shortage. From what I read.
Be not surprised to encounter this at time in this decade when exceedingly brisk demand for batteries will result in long wait times for the vehicle you ordered.
Hickory,
The auto companies have a lot of resources, and there is a lot of capital that may no longer be goin to the fossil fuel sector looking for a ROI, manufacturing capacity will ramp up attracted by high ROI.
True Dennis- the capital resource and motivation for battery production will be available,
But the ability to get the job done (ramping up manufacturing capacity/supply chains) will be the big challenge.
Consider the semiconductor shortage currently- No shortage of the raw material, capital or motivation, but certainly shortage of the end product.
A similar situation will likely be seen with batteries over the next dozen or two years, and should come as no surprise.
Hickory,
The pandemic caused a lot of supply chain disruption, these are not normal times. As the pandemic gets under control and more people get vaccinated the supply chain disruptions will subside. Batteries will ramp up, and supply chain issues are likely to be resolved.
We will see Dennis.
Battery manufacturing capacity was behind the game before the pandemic and more behind now.
Two weeks ago Tesla announced they had $0.5B in back-orders for powerwalls that they couldn’t produce for installation currently.
https://electrek.co/2021/07/14/tesla-powerwall-backlog-80000-orders/
Also Consider-
https://www.autoweek.com/news/a37079370/ev-battery-shortage/
https://www.forbes.com/sites/neilwinton/2021/07/27/battery-scarcity-will-dwarf-chip-shortage-impact-on-global-auto-sales-report/
https://www.npr.org/2021/04/08/985253463/if-worlds-battery-supply-doesnt-scale-up-automakers-will-be-in-trouble
Hickory,
I agree we will know more in the future. Often we accomplish things that seem unlikely. I don’t know about you, but I would not have foreseen the changes of the past 35 years, 35 years ago. There will no doubt be bottlenecks, but as long as we allow changes in prices to indicate where capital is needed as shortages and price spikes will lead to opportunities for those with capital that are willing to invest.
This is not new technology, we just need to build the factories and processing facilities to produce the batteries and other needed components. The lack of investment has mostly been due to poor forecasting of the speed of the transition, as it becomes clear that most mainstream estimates of future demand for electric transport are far too pessimistic and early investors reap large rewards from the higher prices of batteries that are likely to result, those with less accurate predictions of the future will pile in and bring supply up to adequate levels, perhaps even overshooting and bring battery prices down with a glut in 2035 to 2040.
Of course the future is impossible to predict correctly, so I agree we will have to see how it all unfolds.
Meanwhile- the Utility scale modular battery storage product from Tesla-
the MegaPack-
is sold out through the end of next year according to Musk.
“Megapack is the largest, densest battery system in the world—with giga-scale capacity”
https://www.tesla.com/megapack
Yep, its a major global manufacturing challenge (the whole electrical sector) that is just getting started.
Hickory, Hole in Small Head has an oil mentality attitude of borrowing to much money on a technology of fracking shale before understanding the consequences of its market results. On the other hand the legacy auto manufacturers have spent the last decade testing EV technology. GM has minimized it’s financial and marketing exposure with low volume of the Bolt, 8 fires and recalls. As compared to Tesla’s and it’s 800 battery fires and no recalls. I’m willing to bet that the major auto manufacturers have done their homework on resource availability for their current 10’s of billions of dollars of new battery plants. GM is going to mine lithium near Salt in Sea, Ca.
Recent article of a new start-up that is hoping for a 100 hour battery at 1/10th the cost of lithium. Who knows if it will pan out, but there is billions being invested in a variety of schemes.
opps, https://www.greencarreports.com/news/1132987_a-new-iron-age-startup-promises-low-cost-high-energy-iron-air-batteries-for-home-grids
Thanks, haven’t been here for a while but thinking about writing a story and looking for details. When do you think demand will exceed supply?
In a free market the demand and supply curve will cross at any given time setting the price
Sean,
Price adjusts to match supply and demand, so perhaps your question is when does the market become supply constrained so that oil prices rise dramatically, my guess is 2025 to 2027, but in the mean time if the World economy continues to grow at 2.5 to 3% per year on average we will see oil prices continue to rise in order to match supply and demand. I would guess $100/bo for Brent in 2021 US$ is a very real possibility by 2023 to 2024 and possibly $120/bo for Brent (2021 US$) by 2026 to 2027. These guesses are of course highly speculative, but certainly a high probability of higher oil prices going forward until demand grows more slowly due to electric land transport transition, I expect this effect to hit in 2033-2035 will oil prices starting to decrease as demand for oil may start to decrease faster than the supply of oil at prevailing oil prices at that point (which might be $150/bo in 2021 US$ at that point).
Usually supply and demand are kept together by price.
The best way to measure demand is not what consumers say they “want” or “need”. What people want is to have everything free of charge. The question is how much money are they willing and able to spend on the product.
Energy efficiency measured in GDP per BTU has been steadily increasing for decades, and electrification is accelerating that. At the same time, energy costs have been bumpily decreasing. Adding that together, it means people are spending less and less of their income on energy, presumably because they are unwilling or unable to spend more.
Meanwhile liquid fuel, which is about the most expensive form of energy, is losing its niche thanks to the gradual uptake of plugin vehicles (now 19% of the European market). So it looks like less and less will be spent on the industry.
A post full of graphs etc . Frankly above my pay scale . Please read , analyse and explain in simple terms .
https://www.zerohedge.com/news/2021-07-26/oil-russias-clever-gasoline-game-analysis
Dennis, your charts are not really that clear. Just slanted lines with a few data points on them.
Anyway here is OPEC + your five saviors. They peaked in November 2018 and plateaued at about 2 million barrels per day below that before the covid collapse.
And here is the rest of the world. That is World less OPEC and your five saviors.
They have declined about 2 million barrels per day since 2013.
Ron,
I think OPEC + 5 saviours is not doing justice to the fact that most of the increase came from US shale. Please can you publish the same chart but without US shale?
Everyone seems to have their own views on US shale going forward, so that can be kept separate. Let’s see how much of a saviour these guys are without US shale.
Thanks
Yes, I will post it below where I get a wider chart display.
Ron,
OPEC cut output by about 2 Mb/d in 2019 vs 2018 (annual averages), that explains the drop in 2019. Also not that this group increased output by about 8 Mb/d from 2013 to 2018.
Ron,
I just saw this from Art Berman showing his forecast for U.S. oil production. He must be counting a lot more reserves than are economical to produce.
steve
Well, he still has 2019 the peak of total US production. I cannot argue with that. However, he shows the lion’s share of the decline to be in conventional, Alaska, and offshore. He has tight oil producing massive amounts of oil, several times the amount that has already been produced, out to 2050 and beyond. I would be shocked if that turns out to be the case.
Ron,
If we take Art’s RED COLOR Tight oil production and eyeball what it would be compared to the Conventional Lower 48 States GREEN COLOR production, Art’s LTO forecast to 2050 is assuming oil reserves about 75-80% of conventional.
How the hell can that be?
steve
Alaska has a few problems going forward.
https://insideclimatenews.org/news/11072021/thawing-permafrost-trans-alaska-pipeline/
Not sure what Art is smoking but he is definitely hallucinating. Oil prices need to be much higher and the rig count at least double where it is today to reach half of his projection. I think Art is a smart guy but he is way off base here I believe.
LTO.
Good luck in the shale fields finding the labor to run double or triple the rigs that are currently running, along with all the other associated services required to get that first oil in the pipeline.
Funny thing, just today we got a mailer from the second largest employer in our small town. They employ 500-600 people. It was addressed to “current resident.” We have lived at this address since 1994. This employer is asking us to apply for a job.
The sent one to everyone in town.
You can’t work from home in the oilfield, last I knew.
The analysts for the shift project report of 2021 about future oil supply are seeing, based on the data of Rystad Energy, a decrease of production of 20% for 2030 for USA from the level of 2019 oil production in USA.
JEAN-FRANÇOIS FLEURY,
That’s an interesting forecast… a 20% decline from 2019? So, they are predicting approximately 9.7 mbd of U.S. oil production by 2030. With the Shale Industry decline rate at 48% annually, I’d like to see how they come up with those numbers.
Although, maybe Exxon and other Majors will move to 4-mile Laterals, 120 stages, and 40 million pounds of fracking sand per well to reach these lofty production goals.
steve
Our company has about 5 years left of BonaFide drilling inventory. Every other company is either similar or less. These so called experts need to really look company by company and see what’s left in terms of inventory. I just don’t see how the LTO increases as much as Berman predicts and doesn’t fall off the cliff once the inventory is extinguished. The decline is much steeper than offshore. Look no further than the data from the year 2020. The curve will look similar in 2027 but not start from 12 million.
LTO , I am a fan of Art , but this time he has really been smoking something which I don’t know . One word for his projections “ridiculous ” .
How can the predicted LTO output in the next several decades be 5X higher that the estimated crude oil reserves in the USA?
Paul,
As you no doubt know, the reported reserves are proved reserves with a 95% probability of being extracted at current oil prices. A mean estimate (F50) with a 50% probability that at least that much is extracted is typically about 1.5 times the F95 estimate. It is also likely that oil prices will rise between now and 2030, a conservative scenario assuming a maximum Brent oil price of $80/bo in 2021US$ from 2022 to 2033 with prices then decreasing to $50/bo by 2050 (also 2021 US$) has a URR for tight oil of 87 Gb, based on the USGS mean TRR estimates, reasonable cost assumptions and the oil price scenario described. Through the end of 2019 about 16 Gb of cumulative tight oil had been extracted which would suggest 71 Gb of remaining resources. At the end of 2019 there were about 47 Gb of crude plus condensate proved reserves for all of the US (F95). Using the 1.5 times rule of thumb, we would get about 70.5 Gb of proved plus probable (2P) reserves (F50). Note that tight oil proved reserves are only 23.2 Gb, and 2P reserves about 35 Gb. The extra resources (36 Gb) would come from possible reserves, contingent resources, and reserve growth over time.
Note that the estimate of US tight oil proved reserves in 2011 was 3.6 Gb with 2.4 Gb of cumulative production through the end of 2011 for a total of 2.4+3.6*1.5=7.8 Gb URR, currently based on cumulative production and 2P reserves we would have a URR estimate of 51 Gb about 6.4 times the 2011 estimate. Note that I do not anticipate that tight oil resources will grow by another factor of 6 in the next 8 years, but perhaps we will see tight oil URR grow from 51 Gb to 87 Gb ( a factor of 1.7) over the next 8 to 10 years. That’s my current best guess based on the information publicly available (USGS, shaleprofile.com, EIA, and state oil and gas agencies).
Due to the stacked nature of the chart, its hard to confirm, but it looks like Art’s data is predicting offshore production to reach another peak in the 2028-2032 time frame – in the 2 mmbopd range. (Currrently in the 1.7-1.8 range) My current view is that it’ll be in the 1.3 mmbopd range by then.
There are a number of projects in the queue that should be producing by then – like Anchore,Whale, Ballymore, Black Tip, Shenandoah. In addition Mad Dog 2 and Vito will be well online – Buckskin should have more wells online. Maybe I’m a little pessimistic here.
Interesting tidbit – his chart shows offshore production in the 2 mmbopd range in 1970, yet the offshore GOM was only producing about 1 mmbopd at that time. I suspect the rest is from offshore Pacific,, I’ve never looked into that data myself.
Quick check of offshore Pacific OCS production – it looks like it never exceeded 100 kbopd, at least in the 1970 time frame. Graph below is from a legacy MMS document from 1989 or so. (30 mmbo for the year be about 82 mbopd).
Offshore Alaska has never had much production – only about 30-40 mmbo total
So, still not sure where the 2 mmbopd from the graph above for 1970 offshore oil production is coming from. I am assuming offshore means federal waters, not state waters. State water production is usually included in the production for the adjacent state.
Link to document:
https://www.osti.gov/biblio/6843574
From Ovi’s link below, the rest of OPEC plus quotas in figure attached.
https://www.argusmedia.com/en/news/2237794-opec-issues-august-september-quotas
Overall an increase of 800 kb/d over the next 2 months (August and September from 36341 kb/d to 37141 kb/d for OPEC nations, that are limited (Iran, Libya, and Venezuela are not included as their production is not limited by the quota agreement.)
In the above list only Russia counts . Mexico is now a nett fuel importer like Indonesia . kazahakistan is as well coined ” cash as gone ” . The rest are struggling with their last puddles of oil to stay alive . No increases , decline all the way . Let us see who becomes from exporter to importer .
Opec+ issues August, September quotas
The Opec+ coalition’s two largest producers, Saudi Arabia and Russia, can raise crude output to 9.6mn b/d in August and 9.704mn b/d in September, according to quotas seen by Argus.
Both countries can lift production by just over 100,000 b/d in each of the two months, as outlined in an Opec+ internal document (see table for full August and September group quotas).
This follows the 18 July approval by Opec+ for a collective 400,000 b/d output increase in each month of the August 2021-April 2022 period, and then of a rise of around 432,000 b/d from May next year until the group’s cuts are unwound by the end of 2022. This includes a three-month window in which the group can pause these increases in response to any change in the fundamental outlook.
Below are the high hoped for the OPEC countries.
https://www.argusmedia.com/en/news/2237794-opec-issues-august-september-quotas
Here are Dennis’ saviors, with and without US Shale. Removing US Shale changes things considerably. Without shale, the peak is two years earlier in November 2016. Now we see a two-year plateau at 55 million barrels per day, dropping to 53 million barrels per day a year before the covid collapse.
The date of the peak is not really important. What is important, is the reaction of the world economy for decareasing supply. Will there be a permanent global recession, or will we use oil more productively, and GDP will grow regardless of decreasing supply? It is possible to do more valuable work with less energy.
Indeed Name.
The big question is not when peak, but what after, for example-
Which country (ies) that can now afford oil will be the first to not be able?
Which sectors will be the first to become not just discretionary, but obsolete?
Which countries will digress from dysfunctional to failed… first?
Which country will be next to revert to oil rationing by mechanism of government allotment rather than just by price?
Which countries will be least affected by less access to less oil?
Do people consider oil so unimportant that in the 2020’s it is still routinely used for light vehicle transport?
Hicks , exactly what I have been lamenting about . Rockman had a name for this POD ( Peak Oil Dynamics ) . I have quoted this before so just a repeat ” A small hole can sink a big ship ” . 5% inflation does not count for you and me but from where I come it is the difference between eating a slice of bread or going to bed on an empty stomach . We are watching the incorrect parameter . For a diabetic you check sugar level , not temperature and blood pressure . We have to watch for exportable surplus , that is the key . If Congo does not get its oil , no Cobalt = no smartphones . I can give several similar examples . Yes , total oil production is a very important figure but now as we are past peak new issues are going to crop up . An example is oil production to refining capacity mismatch . US exports 3.5 mbpd of shale because the domestic refineries cannot use this . I know that the the refineries of ENI ( Italy ) were designed to refine Libyan oil . What do they do if the required grades are unavailable ? Yes , we can blend and mix , but all is cost , no free lunch . We are on a slippery slope and we have little ( avoid using the word no) control on these factors .
In a rational market/world- the important uses of oil for industrial /agricultural/ petrochemical applications will get priority, and the optional uses like travel will get priced out. Just about all travel is now oil optional- get used to the idea.
I know the world economy is not a rational system, but nonetheless a considerable chunk of the of remaining oil production will get funneled away from travel, as this decade and the next unwinds.
btw- the Fed (and ECBank) printing is not out of ignorance. Its a matter of picking the lesser of several evils, since the alternative is standing by wearing a supervisors hat while deep depression takes root. The central banks only have a few blunt tools at their disposal- they aren’t the one making policy. Economic Policy is made by the other branches of government, businesses, and the purchasers/voters [collectively]
Hicks , I agree that the central bankers are now stuck between a rock and a hard place . What they are doing is the only action they can take . Their policies ( economically incorrect) have given us 12 years of the good life which would have otherwise ended in 2008 .
Coming to second point which is the destruction of the leisure travel etc to save the system . My analogy is that this is like cutting off your hand so that the rest of the body will survive . The problem is that it is the hand that you worked with to earn an income and not be a burden on society (govt ) ,so now you become a liability instead of an asset . This was a result just 2/3 years past peak . What next since from here starts a decline ? Left hand , right leg , left leg ???
What is essential ? Let me give a real time anecdote . During the first phase of Covid UK shutdown everything except “essential services ” was closed . In the second week there were no eggs to available in the food stores . Why ? The farmers had the eggs but they had no cartons to pack and ship . The govt exempted the carton manufacturers .The carton manufacturers had no ink and no cardboard to make the cartons , so they were exempted . The ink manufacturer had no chemicals to make the ink and the cardboard manufacturer had no cardboard because his supplier in Sweden/ Denmark was in shutdown , The question is where does it end .? Who will decide what is essential ? I am 100% in agreement with you that this system is not rational , but what is the solution to this irrationality ? Globalization was a boon to our society but the end of globalization will be the noose around around our neck . We are heading for trouble as the whole system ( energy , financial , environmental etc ) unravels . This is what David Korowicz termed as a Synchronized System Failure . As a matter of fact since GFC 2008 that is all what the politicians , bankers etc have been working on to avoid . The problem is, now a system overload with all their actions . It was a party and all parties must end . Be well .
P.S : Globalization was a product of ” cheap and abundant ” oil . Does it make sense to ship drinking straws from Shanghai to Rotterdam ? Yes, I am correct . I have seen boxes marked so in the warehouses in Rotterdam .
Lots to say on that whole topic HinH.
First I am addressing the most likely scenario- where oil production gradually declines- perhaps 2-3%/yr.
Oil will get more expensive.
Richer people will keep traveling and using oil in discretionary/optional ways, but most everyone else will have to start cutting back .
I’m guessing leisure travel comes before most other categories of use when it comes time to cut back.
And yes, it will be crushing to certain sectors (who rely on long distance tourism for example). Nonetheless the basic sectors like agriculture, petrochemicals and manufacturing will plow and grind ahead.
I wonder how much optional oil consumption there is in various countries. Maybe not too much in India, and maybe a hell of lot in the US.
And of course now there is another option for most transportation uses.
You asked -“Who will decide what is essential ?”
At first no one will decide- it will be market pricing and the consumer will decide.
Later, in a situation of greater severity, your Central Planning Authority [or its equivalent] will decide. Good luck.
So, let’s divide the world production into 3 buckets:
1. US Shale
2. Saviours: OPEC saviour 5 – US Shale
3. Rest of the world: ROW
ROW has been on a declining path for over a decade now. Is it going to show increasing production. I doubt it.
Saviours – This group, the largest, plateaued over 2016-19 but saw a decline in production for a year before covid.
Shale – Views have been extensively discussed here. Consensus is that non-Permian will continue declining. Permian has increased supply in the last few months, just enough to offset decline in non-Permian, but can it continue doing so? I would say Permian will come across a speed bump when the inventory of DUCs are over, but let’s watch and see.
So, the only way for global production to see another peak is for the saviours group to at least offset the cumulative decline from US Shale and ROW. Seems unlikely. They are below their all time highs in 2016 by 8mmbpd and in 2018, everyone was pumping all they could and still not reach the 2016 high. Same for when OPEC was going full steam in April 2020 with a lot of the supply coming from inventory and the Saviours as a group was still 2mmbpd below its 2016 high.
Nice summary, Ancient Archer.
If there is a new peak, mostly because of the Permian, I would guess it will be short lived, maybe in 2023-25 timeframe. Then, on the other side, the decline is likely to be that much worse.
Ancient archer,
Best to focus on annual averages rather than monthly peaks, if we exceed the 2018 peak in the future we would need to exceed where we were in 2018. US output was about 10.9 Mb/d that year, OPEC was about 120 kb/d below its peak year in 2017 and Russia was about 90 kb/d below its peak year of 2019. It is assumed by many that OPEC cannot increase output above its 2017 annual average output, I doubt this is the case if Brent oil prices rise above $80/bo, I agree Russia and US may have both peaked in 2019, but I strongly disagree that they will not be able to at least there 2018 level of output and maintain that level for several years.
In addition Norway, Canada, Brazil, and Guyana are all likely to increase output above the 2018 level of output.
I believe it is highly likely that the current annual average C plus C peak in World output in 2018 will be exceeded in the future.
Ancient archer,
When we deduct tight oil from OPEC plus 5 nations (US, Russia, Canada, Norway, and Brazil) for annual output from 2010 to 2018 we find and increasing annual trend of 700.5 kb/d (using least squares to find the linear trend). So yes tight oil output was a significant contributor and will likely contribute less in the future. Note that this could lead to higher oil prices and might lead to larger increases elsewhere compared to the 2010 to 2018 period. Keep in mind tight oil output may continue to grow and that the average annual tight oil output in 2018 was about 7080 kb/d, this is likely to grow to 10000 kb/d in 2027. So roughly a 500 kb/d increase per year on average from 2022 to 2027 for US tight oil output.
Hi Ron,
My chart is annual average output from 2010 to 2018, in 2019 OPEC cut output to support oil prices and in 2020 we had a pandemic, so the relevant part of the curves is 2010 to 2018. No need for the noise of monthly variations in my view.
Chart below plots World minus OPEC plus 5 on right vertical axis and OPEC plus 5 nations on left axis. Annual average C plus C output for 2010 to 2018 is plotted. The fall in output from OPEC cuts and the fall in prices in 2019 and pandemic in 2020 are ignored, in both cases a lack of demand relative to supply was the issue.
Ron,
The Drop in 2019 is explained by the OPEC cuts of 2000 kb/d in 2019. Also in 2016 there was higher output from Iran due to lack of sanctions relative to 2018. When we look at annual data for OPEC plus 5 minus tight, 2018 is the peak, not 2016. The peak for US, Russia, Canada, Brazil and Norway minus tight oil is 2019 for average annual crude plus condensate at 23858 kb/d.
The EIA’s Monthly Energy Review is out. They have June C+C production up 198,000 barrels per day over May production but still below April’s production numbers. I have no idea what caused the May dip.
Ron
The MER uses the weekly numbers to get their estimates. Here are the monthly averages using the weekly data for April, May and June
April 10,947
May 10,955
June 11,143
The April estimate was low by close to 200 kb/d. May and June are very close to the MER numbers. I would not be surprised if May is also low by 200 kb/d.
I think we should expect May output to vey close to April, i.e, close to 11,175 kb/d. Note that the STEO is forecasting almost flat US production out to October of close to 11,200 kb/d.
I really appreciate this blog and everyone contributing. Some high quality information about such a vital topic in these turbulent times.
Looks like we are in for some very very interesting future years. Regardless of whether the peak was in 2019 or is gonna be in 2030: Changing our lives and culture to be more in harmony with what mother earths can give, is gonna be our lessons and task. Adapting now would be the wise thing to do.
There is not gonna be a techno fix that will enable us to keep our current lifestyle. Maybe some parts of life will acctually improve… I see more authentic close human connection being more normal in a time with less energy and technology.
Thank you
Seems like very discordant messages coming from BP. I think this was 2020 based on a reference cited (but couldn’t find the date)
Peak oil demand and long-run oil prices –
https://www.bp.com/content/dam/bp/business-sites/en/global/corporate/pdfs/energy-economics/bp-peak-oil-demand-and-long-run-oil-prices.pdf
”signals a shift in paradigm from an age of (perceived) scarcity to an age of abundance-
Over the past 35 years or so, for every barrel of oil consumed, two have been
added to estimates of Proved Oil Reserves. In its recent Outlook, BP
estimated that based on known oil resources and using only today’s
technology, enough oil could be produced to meet the world’s entire demand
for oil out to 2050, more than twice over! ”
I also have zero confidence in the public pronouncements of officials from big exporters like the Saudi family, Russia, Iran, Iraq…about their production capability or reserves. Zippo.
If you do, you are a much more trusting oil and news consumer than am I.
The trick is “using today’s technology” – not a reasonable price.
You can use C- and D-class LTO wells – oil will cost 150$ but it can produced. You can cream more old fields, tap some arctic ressources. This is all “todays technology”.
The question is: Does this make sense, or it is time to move on to the next technology. There will be enough oil then to fuel the hard to replace cases for the next 100 years. Shallow and his international friends can do this, getting a base production from worn out fields.
Some metropol areas world wide will have to switch from rattling stinking old gas cars for public taxi transport to cheap chinese electric cars, and the one or other additional power plant. So the gas will be free for food production.
I think this will be happen anyway – you can buy cheap electric chinese cars now for 4-7000$. From the view of the taxi owner they can be filled with cheap or even stolen electricity. A taxi using gas will use gas for 10-20$ a day in this mind numbing perpetual traffic jam doing a maximum of 100 miles in a work day. This car will pay itself off in a year. I have been in Kathmandu, the normal traffic speed not often reaches 10 mph (2-3 mph is the normal in the center). It’s next to impossible to drive a 100 miles range car empty in a day of taxi work.
More speculation about shale recovery.
https://www.argusmedia.com/en/news/2238286-shale-pioneer-hamm-skeptical-private-ep-can-fill-gap?amp=1&__twitter_impression=true
BP completely buys into OPEC’s claim that they have 1,189 billion barrels of oil reserves. That is one trillion, one hundred and eighty-nine billion barrels of reserves. Of course, OPEC just added those reserves with a pencil. And they continue to do so. For every barrel OPEC produces, another barrel automatically appears to replace it. And they have been adding this magic oil to their reserves since the 1980s. Their reserves always increase, they never decrease no matter how much oil they pump out of the ground.
What is unbelievable is, people at BP, the EIA, and indeed even a couple of people on this list completely believe OPEC’s claims. Even Robert Rapier has defended them, at least he has defended Saudi Arabia’s claims of magic oil. That is what makes my head spin. Do they believe in the tooth fairy also?
OPEC’s Crude Oil Reserves
Ron,
I agree OPEC proved reserves are overstated by close to a factor of 2. Keep in mind that US reserves have also grown, in fact by more than those of OPEC (on a percentage basis). The OPEC reserves are likely 2P or 3P reserves rather than proved reserves. A reputable firm did audit KSA’s claimed reserves, and people have looked at IHS proprietary data and not made much noise about this. Jean Laherre estimated about 660 Gb of remaining resources for OPEC in August 2018. His estimate for World C plus C URR was about 2800 to 3000 Gb and in the past his estimates have been conservative (they have mostly been adjusted higher over time from 2000 Gb in 1998 to 2900 Gb in 2018.)
My current best guess is about 3100 Gb for World C plus C, but it could be anywhere from 2900 to 3300 Gb with about an 75% probability it will fall in that 400 Gb window.
Also at your link I noticed that the 1189 Gb includes about 220 Gb of claimed Orinoco reserves, those are likely to be more like 50 Gb so that imediately reduceds the OPEC reserve estimate to 1020 Gb. If this was a 2P estimate rather than a proper proved estimate then we would divide by 1.5 and that would bring the estimate to 680 Gb, which would still be too high. Based on Laherrere’s estimate for OPEC 2P reserves, proved reserves for OPEC would be perhaps 440 Gb. I focus on 2P reserves as that is the best estimate by petroleum engineers.
Dennis, you know full well that you cannot compare US reserves with OPEC reserves. US oil companies are subject to SEC rules and regulations, OPEC reserves are not. Oil companies always underestimate early reserves because they would be heavily fined if they overestimated reserves. Then they would increase the reserve estimates as they got a better estimate of what they really were. That is how the myth of “reserve growth” originated.
Second, US reserves increased when they discovered oil could be extracted from tight source rock.
My current best guess is about 3100 Gb for World C plus C, but it could be anywhere from 2900 to 3300 Gb with about an 75% probability it will fall in that 400 Gb window.
Wow! That is really astounding. You say the world has over twice the reserves that OPEC says it has. Their estimate: OPEC’s estimate of World oil reserves
OPEC ……..1,190 Gb
Non-OPEC . 308 GB
Total ……..1,498 Gb
Dennis, do you really believe OPEC has underestimated World oil reserves by that much? Do you really believe that the World has over twice as much oil as OPEC claims?
I remember doing this calculation about OPEC vs ROW production to reserves:
OPEC reserves = 79.4%
OPEC production = 40%
ROW reserves = 20.6%
ROW production = 60%
79.4/40 / 20.6/60 = 5.8
So the rest of the world produces almost 6 times more oil per barrel of reserves !!
So the OPEC reserves are clearly exaggerated by more than a factor of 2.
Frugal,
We could do something similar by looking at US R/P and conclude that everyone except the US is exaggerating their reserves, but only when we make the dubious assumption that R/P ratios should be the same everywhere.
It is pretty clear that OPEC large producers have chosen to develop their resources more slowly so the market is not flooded with excess crude which would drive oil prices to a level where production is not profitable for most producers.
When doing these calculations you need to deduct Orinoco and oil sands reserves which are very different in their development profiles fom conventional crude.
Since 1988 OPEC reserves are likely 2P (proved plus probable) reserves rather than 1P (proved) reserves, in 1980 OPEC may have reported an actual proved reserve number and in the 8 intervening years various OPEC nations increased their reserves by switching to proved plus probable reserves rather than proved in their fight over production quotas.
Dennis,
Deducting the Orinoco and Canadian oil sands from these calculations makes the P/R ratios of OPEC vs ROW much worse:
(1189 – 235)/40 /(308 -171)/60 = 10.4
Do you really believe that OPEC is holding back production by a factor of 10, or that their fields are 10 harder to produce from compared with ROW? Saying that their stated P1 reserves are actually P2 reserves would change this number to maybe 5 instead of 10, but still something is seriously not adding up.
Frugal,
To do the comparison properly, look at OPEC minus Orinoco and assume these are 2P reserves (proved plus probable), then look at non-OPEC and deduct canadian oil sands to get proved reserves, then multiply those by 1.7 to get 2P reserves for non-OPEC. OPEC R/P is 83 in 2019 and non-OPEC is 19, so roughly a factor of 4 different. Different nations develop their reserves differently, and reserve estimates for the World are not very good.
Interesting that the BP “proved reserve” estimate is very similar to the Rystad 2PCX estimate for World totals.
OPEC does not develop its reserves as quickly as non-OPEC by choice so that they don’t flood the market and drive oil prices lower.
In the end, no one really knows how much oil is left, how much of that can be produced, and at what rate, and at what price.
And THAT is some scary shit.
Some can see , some choose not to see . 10 yrs ago the world already knew .
https://www.miningweekly.com/article/opec-believed-to-overstate-oil-reserves-by-70-reserves-depleted-sooner-2012-10-04
HiH,
The co-author of the report is a chap called Brent Giles. What an appropriate name for an oil & gas analyst! 🙂
Ron, I’m 99% sure Dennis is stating 3100 as a total URR not as remaining reserves.
Yeah, you are probably right. But what good is that figure unless you give us cumulative production numbers. Then we can subtract that from the URR to see how much is left. Why not just tell us how much is left in the first place? After all, that is really all that matters.
Used is around 1,600. We could be on either side of half way.
2023-25 no peak unless we see $100 oil.
Ron, you are correct . Dennis himself has admitted that he does a top down scenario while you and me are doing a bottom’s up scenario . In Dennis’s scenario the ” if ” is the price . All his scenarios are ” If the price of oil goes to $ 100 , 150 etc .” I think if Dennis was the EU fisheries minister he would tell the fishermen ” Get a bigger boat , bigger nets ” while the actual problem is that the fish are depleted . Wrong diagnosis , wrong medicine .
P.S : Dennis , this is nothing to takedown the work you do . You effort is invaluable and always appreciated .
Ron,
Read the sentence before the one you quoted, was I talking about reserves?
No, I was talking about URR and I guess it needed to be stated more clearly, though I have used this URR estimate of 3000 to 3100 Gb as my best guess for World URR for years. Currently World cumulative C plus C output is about 1400 Gb at the end of 2020, URR=3060 Gb, remaining resources are about 1660 Gb. Laherrere’s estimate would be about 1500 Gb for remaining resources. Scenario below for a very low extraction rate for conventional resources after 2020. The peak year is 2026 at 84.3 Mb/d, but output could be higher with extraction rates near 2018 level bring peak output to 86 Mb/d. Scenario in chart below has lower extraction rates than 2018 for all years after 2020. Click on chart for larger view.
Dennis, thee is something terribly wrong with that chart. You have production hitting 76 million barrels per day in the middle of 2020. Then you have world production hitting 83 million barrels per day in the middle of 2021. That is right now! Obviously you are a little confused on that point.
Fix your chart and we will discuss it later.
Dennis, does the URR estimate of 3000 to 3100 Gb include OPEC official reserve numbers or did you divide these numbers by 2?
Ron,
The chart is a simplified scenario with the same extraction rate every year after 2020. A very easy fix. Scenario below has extraction rate for conventional oil increase linearly from 2021 to 2025 and then remain flat thereafter, URR=3055 Gb, peak is 86.4 Mb/d in 2026.
Also note that we do not know what annual average output will be in 2021 for World C plus C, though I would agree it is not likely to be 83 Mb/d.
I think you are pretty close out to 2023, but that is when the curve turns down. Though, even for 2023, you are about a million barrels per day too high. I think 81 million barrels per day will be the highest we ever get again. (Give or take 1 million bpd.)
Frugal,
I do not do a bottom up analysis, a top down HL analysis suggests about 2700 Gb of conventional oil URR for World, USGS analysis suggests about 3000 Gb of World conventional oil URR, a peer reviewed paper from 2014 suggests World proved plus probable reserves (IHS data) are about equal to reported proved reserves by BP Statistical Review of World Energy for year ending 2011. Note that my best guess for conventional URR is 2800 Gb (conventional excludes tight oil and extra heavy oil with API gravity less than 10 degrees), with about 87.5 Gb for tight oil URR and 153 Gb for extra heavy oil URR (Canada and Venezuela). Jean Laherrere’s estimate in 2018 for World C plus C URR was about 3000 Gb, my current best guess is about 3045 Gb.
At the end of 2020 approximately 1423 Gb of cumulative crude plus condensate had been produced. If my guess is correct for World URR that would leave remaining resources for World crude plus condensate of about 1622 Gb at the end of 2020.
Updated oil shock model below, click on chart for larger view.
Ron,
If Jean Laherrere’s estimate of World URR is roughly correct (and my guess is that his estimate is conservative as in the past), then we would need to assume a very low extraction rate for conventional oil resources in the future for your scenario to be correct, if we had a permanant recession (similar to during the pandemic) forever, this might be correct, but I think the odds are low that will be the case.
We will just wait and see who’s guess is closer to reality. You are correct that oil will peak and decline and eventually we may agree on the timing of the peak and will disagree on the future rate of decline, though it could be steep in a rapid EV transition scenario.
Ron,
Scenario below limits tight oil scenario to no more than 8480 kb/d (my expectation is that it may go to 10,000 kb/d by 2028). It also limits extraction rate for conventional oil to no more than 5.263% after 2020, prior to 2018 the conventional oil extraction rate had been between 5.8% and 6.1% from 2009 to 2018. The extraction rate (in every case it is the conventional extraction rate even when I leave out “conventional”) fell to 5.66% in 2019 and to 5.17% in 2020 and then gradually rises to 5.4% in 2023 and remains at that level until 2294 (end of scenario).
The question would be, why does the extraction rate never recover to the 2018 or even the 2019 level? I see no reason that this would be the case and thus reject this as a likely scenario.
The scenario is presented below and I would put the probability at 1% or less that the future World output of crude plus condensate will be this low or lower.
click on chart for larger view
We shall see–
Nov 2018 is starting to get a bit far away in the rear view mirror.
But, you are the experts, I’m just along for the ride.
Dennis, I now understand why we have such a different perspective on future oil production. You are focusing on URR and extraction rates. I am paying absolutely no attention to that. I am looking only at the production increase or decline of the world’s largest producers and the probability of those trends continuing and for how long. Russia has peaked, and there is a strong probability that the USA has peaked. And things don’t look all that promising for Saudi Arabia. Also, the world less those three production leaders is also in decline.
The world’s production decliners have overtaken the world’s production gainers. That is all that matters. Screw URR and extraction rates. These will be something for post-peak analyzers to analyze when they try to figure out why they missed calling the peak until well after it was past.
Okay, either of us could be wrong. One of us will be wrong. But I am looking at actual data coming from the world’s oil producers and trying to figure out what this is telling us. You are looking at estimated URR and possible extraction rates and trying to figure out what that is telling you.
I trust my method over yours. Thank you.
Dennis,
You had this question: “The question would be, why does the extraction rate never recover to the 2018 or even the 2019 level? I see no reason that this would be the case and thus reject this as a likely scenario.”
I have an answer for you. One word – capex. 2014 capex was $730bn and that has come down to $310bn for 2020 and 2021. The climate change lobby will make sure that the O&G sector doesn’t get easy access to funding going forward, so future capex is not likely to increase much even with higher oil prices. Heck, even Aramco cut capex to give the promised $75bn annual dividend.
Do you think the oil in the ground will extract itself? Extraction rates will decline with a steady decline in capex as has happened. Not only for a year or two but since 2015 and the pandemic and the increase in climate change hysteria has now pushed it into the egregious zone. You’ll never be able to get the same extraction rates at $300bn of global capex as you did with $700bn of global capex. What am I missing??
Ancient Archer,
Extraction rate for conventional oil has been relatively stable from 2015 to 2018 (5.9%, 5.9%, 5.84%, 5.83%), despite the drop in CAPEX and CAPEX will change with a change in oil prices. Not sure what CAPEX was for each of those years, in 2019 extraction rate dropped to 5.66% and in 2020 to 5.17%.
It is no coincidence that CAPEX dropped in 2015 when oil prices dropped from an average of $120/bo in the 2011 to 2014 period to $58/bo in the 2015-2018 period (Brent in 2020 US$ for both periods). My expectation is that oil prices will increase and that CAPEX will also increase.
In short, no I do not expect the oil will extract itself, I expect the market will function appropriately so that supply and demand are matched. Oil prices will rise to a level that will accomplish this, perhaps $80/bo will be enough, maybe $100/bo or even $120/bo will be needed. Consider the following
https://oilprice.com/Energy/Energy-General/Oil-Majors-Are-Primed-For-A-Massive-Earnings-Season.html
The good news for oil and gas investors: The long-suffering sector is on course for a repeat of a stellar first quarter by posting blowout earnings, again, in large part due to an increase in oil and gas prices.
Three-quarters of energy companies that have reported earnings have exceeded expectations, while half have managed to surpass revenue expectations.
Even better: The energy sector’s expected revenue growth of 92.1% is a high watermark for the entire U.S. market.
The article goes on to imply that climate concerns and investors wanting to see higher dividends may result in very little increase in CAPEX. If so, that simply will lead to even higher oil prices if supply remains restrained. Eventually the companies are leaving cash on the table by not taking advantage of higher oil prices by investing in greater oil output when oil prices are high.
Also note that private oil companies are not subject to public sentiment or shareholder demands. The labor shortage in the oil field will be reduced if oil majors sit on the sidelines and leave more workers to be hired by private companies, which may choose to increase their CAPEX with higher oil prices.
See my post further down thread with CAPEX data and extraction rate data, based on 2010 to 2018 data (prior to OPEC suts and pandemic) as CAPEX increases, extraction rate decreases, but the correlation is weak (R squared about 40%). For every 100 B increase in CAPEX extraction rate decreases by about 0.1%.
For the average CAPEX level for 2010 to 2018 of about 494 B in 2019 US$ we would expect an extraction rate of about 5.89%. A lower CAPEX level of say 425 B 2019 US$ (as in 2010) suggests a higher extraction rate of 5.97%, based on the least squares trend of 2010 to 2018 CAPEX vs extraction rate. My conservative scenario assumes extraction rate recovers to 5.83% by 2034, slightly less than the 2018 extraction rate (5.84%).
Of course we do not know what will happen in the future, we can only guess based on what we have observed in the past.
Ron,
I use all available information, USGS, Jean Laherrere, OPEC, IEA, EIA, shaleprofile.com and information from oil pros here and elsewhere to inform my view.
It is correct that nearly all of the increase in World output from 2010 to 2018 came from US, Russia, and Saudi Arabia. About 982 kb/d per year over that period came from those three lage producers out of a totla of 1082 kb/d for the entire World C plus C output over the same (2010-2018) period using annual average output for each year and the least squares linear trend. So 91% of the increase was from those 3 nations. The important figure to focus on is the peak year of 2018 when these three nations produced 32321 kb/d (EIA data) for annual average output.
I think these three nations can return to that level and maintain it and note that the peak level for all of thes nations (which occured in different years) was 10598 kb/d for Saudi Arabia in 2018, 12248kb/d for US in 2019, and 10847 kb/d for Russia in 2019 with a total of 33693, I do not think this higher “peak capacity” is likely to be achieved in the future, but the 2018 level for these three nations is 1370 kb/d less than this peak.
Also keep in mind that OPEC has kept output growing slowly on average from 2016 to 2018 as they restained output to try to support oil prices. Things will be different when oil prices rise in the future and even if Russia and the US cannot raise output by much (though I believe US output will rise to 12000 kb/d by 2025) OPEC, Brazil, Canada, Norway, and Guyana will likely grow output by more than the decline in the rest of the World, especially at high Brent oil prices of $85/bo in 2021 US$ or more.
Ancient Archer,
Looked into Oil CAPEX and found
https://www.iea.org/data-and-statistics/charts/investment-spending-in-oil-and-gas-upstream-rebased-at-constant-2019-costs-2010-2020
Chart below looks a World extraction rates for conventional oil (right axis) and World CAPEX upstream spending on oil and gas (in constant 2019 US$) for the period we have data (2010-2020).
CAPEX spending dropped in 2020 due to pandemic, my guess is that it will recover. We will see.
Also for 2021 to 2025 see
https://www.businesswire.com/news/home/20210407005687/en/Global-Oil-and-Gas-CAPEX-Outlook-Report-2021-Growth-Trends-and-Forecast-2020-2025—Upstream-Sector-to-Dominate-the-Market—ResearchAndMarkets.com
and
https://www.rystadenergy.com/newsevents/news/press-releases/a-record-cash-flow-is-brewing-for-the-worlds-public-eps-in-2021-as-us-shale-delivers-super-profits/
Dennis, referring to the 2018 oil production from Russia, Saudi, and the USA, you wrote: I think these three nations can return to that level and maintain it…
Russia has already stated that they have peaked. I know, they said they hoped to maintain that plateau through 2024, but they are already in serious decline. Your hopes for Russia are totally unrealistic.
Also keep in mind that OPEC has kept output growing slowly on average from 2016 to 2018… Then: as they restained output to try to support oil prices.
Those two statements are contradictory. They could not possibly do both at the same time.
At any rate, they did not keep output growing, they kept output shrinking. And I am not at all sure that was voluntary.
Monthly Data … Yearly Average
Dec-15 30,888 30,543
Dec-16 33,029 31,701
Dec-17 31,483 31,507
Dec-18 31,073 31,336
You can see that December was the peak. And 2017 production was above 2015 when there were no cuts.
I meant to say 2016 was the peak.
Ancient , ” What am I missing?? ” . Chief , you are not the one , it is what many have been missing . You provided a piece of the jigsaw puzzle that was missing and it fits perfectly into the larger picture that we will not have a new peak . Kudos .
Dennis,
Good stuff. I’m not sure about the inflation related adjustment to the numbers. Also, where does the IEA chart say its only for conventional?
The thing is, the benefit from capex is sticky in nature. What do I mean by that? Means that if you increase capex you’ll not get gains immediately and so is the case in reverse. There is a delay of 5-7 years. If you are right and the world does increase capex, it’ll be 5-7 years before the greenfield investments start producing oil. Yes, there will be some brownfield capex which will start producing in a year or two. But that will hardly stop the massive declines coming thru.
Decline never sleeps but capex did!
Over- reliance on something unsustainable or finite in supply can result in an extended period of growth that is based on a fragile underpinning.
Some would say better to hit up against that limit of supply earlier so as to avoid overshooting the supply even more severely.
We are many decades too late on this account when it comes to crude oil.
Probably best to get the peak oil news acknowledged by the ‘world’ now.
Loud and clear- Crude OIl Supply Has Peaked
The sooner the realization comes to all, the sooner there will start to be some belt tightening, and
some adjustments in future expectations and plans. Maybe a little less pain than waiting yet another year while even more unsustainable growth in demand (and mouths) occurs.
#Population Overshoot, #Peak Oil , #Unsustainable Growth, #Adjustment
In the past, Ron has said something to the effect that most people will never believe oil has peaked and is going into decline, even when it’s obvious. They will always claim it is something else. Probably just blame it on the Libs.
Hell, there are people that even refuse to acknowledge the effectiveness of vaccines during an epidemic.
Hickory,
Problem with saying peak oil is now, or is behind us, when it is not is a matter of credibility.
I simply call it as I see it. The peak will occur in the next 5 to 9 with my best guess (50/50 odds it will be earlier or later) being Jan 2028.
This does not mean we should not start preparing to use less crude oil, far from it. That should have started 20 years ago, we must move as quickly as feasible, and the faster the better.
Dennis, I’m in your camp. I think peak will be determined by demand. Which will be determined by any or all of the following, war, pandemics, government stimulus, conservation, efficiency, transition, technology or something we haven’t even thought of yet. I don’t see EV transition off setting normal past economic and population growth demand for at least about another 5 years. But with in 10 years, EV transition will be reducing total demand. I would put a higher probability of 2018 peak being surpassed in the future than not.
You take way to much crap from the past peak crowd. You are looking at the situation correctly. 2011 to 2014 proved high oil prices can produce more production than the naysayers ever imagined. So now that I have expressed my opinion. You can jump over to the Ron camp.
Huntingtonbeach,
In this case I agree with your assessment, we may be wrong, reality may be different from any of the views expressed here. It will be interesting to see how it plays out, often my scenarios of the future have been too pessimistic, perhaps this time will be different.
Geologically we may be able to reach a new peak. But a lot of folks have to keep their shit together on both the supply AND the demand side to hit a new peak. It’s not just no civil war in Iraq, Nigeria, etc, but also no debt explosion in China or US that would kill demand and knock the bottom out of the price of oil for 3-5 years while the new peak is suppose to happen. So much has to go right in so many countries for a new peak. It just seems really unlikely. The fact that no model suggested a collapse of demand due to the black swan of the pandemic tells me there’s a LOT unaccounted for that could go wrong.
Stephen,
A chart I did in April 2019 for Seneca cliff type scenario starting in 2025, nobody can predict when a black swan event will occur. For this scenario the event occurs in 2027 and it is assumed the World economy never recovers. Perhaps a large asteroid strike or all out nuclear war would precipitate such a scenario.
I disagree that such scenarios are likely, in short I disagree that everything has to go just right for oil production to continue to rise or remain on plateau. The main thing that is likely to lead to a decline in output is as society moves on from oil to other types of energy, this seems highly likely in my view in the 2035 to 2040 time frame ( and perhaps sooner, but not likely before 2030).
“So much has to go right in so many countries for a new peak.”
I totally agree.
Dennis,
There has been a massive black swan event that has collapsed oil demand approximately every ten years for at least the last three decades (9/11, Great Recession, Covid). The world is getting more complex and energy supplies peaking will put all kinds of strain on countries in myriad ways. Yet you remain confident this next decade will not have one. I find that overly optimistic.
Both 911 and great recession bounced back to new record highs
Stephen,
Last black swan in 2019, if your every 10 year back swan thesis is correct, the next one would be 2029 (I expect this will be World recognition of peak oil in 2028 leading to Great depression 2).
In the mean time over the 2021 to 2028 period World output will grow in response to high oil prices and strong demand for oil and difficulty keeping ahead of oil demand even at a higher level of oil prices (which will likely push oil prices to over $100/bo by 2024/2025). We will also see more demand for EVs and possibly a strong move towrds electric transport which will help to reduce the rate of growth in demand and might moderate oil prices, keeping them in the $90 to $110/bo (2021 US$) range.
If EVs manage to reduce demand enough that oil prices start to decrease as demand for oil starts to fall faster than the supply of oil at prevailing market prices, we might avoid Great Depression 2 in 2029/2030, perhaps we will have to wait for Pandemic 3 or WW3 for the next black swan in that case (or a large asteroid strike). Note I think the optimistic scenario of avoiding Great Depression 2 with a transition to EVs that is fast enough to avoid $150/bo oil and a severe supply crunch for oil has about a 50/50 chance of being correct, the quicker the transition the lower the risk, but a coin flip that it will be quick enough to avoid a very severe economic downturn in response to peak oil in 2028.
In any case we will have to agree to disagree.
Take a close look at my Seneca cliff scenario above, the closest thing we have seen to a drop in supply like shown in that scenario is 1979 to 1982 and the pandemic in 2020, and we have never seen a permanent decline in oil output as shown in that scenario, that may occur some time after 2031, but it is very unlikely to occur in the next 10 years (1% probability or less).
Is it your expectation that demand for oil will never recover?
That is wishful thinking (from a climate perspective) in my opinion. I agree there will be economic ups and downs, but note that 9/11 was a very minor economic event at the World level, which is where I focus.
What did Rumsfeld say? There’s the known unknowns but also the unknown unknowns. I feel the latter category is growing as the world’s crises multiply. This allows me to have little faith in prognostications of business as usual for any length of time. It only takes one large failure of supply, be it Russia, the Permian, Nigeria, KSA etc to keep us from a new peak. And the same is true on the demand side, as another oil price crash from falling demand like 2008-9, 2014-15, or 2020-21 would again curtail investment and keep us below the previous peak. It appears this decade is the last chance for the world to reach an ultimate peak above 2018, and like an athlete who must line everything up perfectly to get a gold medal, so too must the hydrocarbon world fire on all its oil cylinders to reach a new peak. Personally I don’t think this jalopy has it in it, but I could be wrong. So yes I’ll agree to disagree.
Stephen,
Perhaps their will be some large failure in supply, I nust think the chances are lower than you believe.
I have consistently underestimated World oil supply in the past. I try to learn from past mistakes.
I hear you Dennis.
When I say peak oil I am thinking in terms of a rough top range, rather than a specific month in a specific year. Frankly, I don’t even know that global production data is all that accurate.
I am in a position where credibility of a claim on the moment of peak oil is meaningless to anyone.
I respect your efforts to be more specific, and to be as quantitative as you can be in the face of very poor global data and very rough primary assumptions. Noble effort, I think.
And yet bottom line-
to me we are effectively at peak- in terms of implication.
We are past peak oil/capita even using your estimate from the graph above [3045 URR] with a peak at 87 in 2027.
I would not be surprised to see oil production reach or even slightly exceed past levels. Still- we are in the effective peak zone. That is what I mean by ‘peak oil’
Hickory,
Yes we are probably close to the peak. I agree the data is not perfect and yes on a per capita basis oil consumption peaked in 1979 so on that basis the peak was long ago. There are many narratives about what a disaster the coming (or past) peak will be. I simply try to make a realistic projection based on the information I have, output will surely be limited and a slight rise in output or a plateau seems the most likely scenario over the next decade or so.
Here’s a countdown clock of oil left in the world.
Oil left in the world
35,442,913,090 barrels per year comes to 97 million barrels per day. (365.25 days per year) That is total liquids, (which includes bottled gas), not crude plus condensate. We were, before the covid collapse, at 83 million barrels per day.
At any rate, the decline should start when we have consumed 50% of total reserves. I believe we are well past 50% but new technology has enabled us to get well past 50% before decline sets in. And when it does, the decline will be much faster because of the fact that we will be, or are, well past 50% consumption of total recoverable oil in the ground.
If you divide OPEC official reserves by 2 as Dennis suggests, this puts the remaining oil reserves at around a trillion barrels. And if peak oil is at around 50%, then the World has already peaked.
Frugal,
Current cumulative production of crude plus condensate is about 1423 Gb (end of 2020), if remaining resources were 1000 Gb that would imply a URR of 2423 Gb and a peak at 50% would be at 1211.5 Gb, we were at 1217 Gb cumulative C plus C output at the end of 2013 and we were not at peak C plus C output. World URR for crude plus condensate will be at least 3000 Gb and might be as high as 3400 Gb (depending upon demand and oil prices in the future), the 3000 Gb estimate assumes only 200 Gb of oil sands resources in Canada and Venezuela and these may be more like 400 Gb if oil prices remain above $80/bo in 2021 US$ (or higher) long term.
In addition, you are forgetting reserve growth. US 2P reserves grew by approximately 63% from 1980 to 2005, world conventional 2P reserves at the end of 2011 were about 1200 Gb. Let’s assume they grow by 50% over the 2011 to 2035 period (25 years as in the US 1980-2005 case), that would be 1200 times 1.5=1800 Gb of 2P reserves for oil discovered up to December 31, 2011. From Jan 2012 to March 2021 about 268 Gb of crude plus condensate was produced in the World. For the reserve growth assumption I have made (and assuming no new oil discoveries after 2011 which is unlikely) we would have 1800 minus 268 equal to 1532 Gb of remaining proved plus probable reserves as of March 31, 2021, this excludes extra heavy oil resources which may be 150 to 300 Gb for URR with about 20 Gb of cumulative production at the end of 2020, so 130 to 280 Gb of remaining resources of extra heavy oil and about 60 Gb of remaining resources of tight oil for a total of 1700 to 1850 Gb of remaining crude plus condensate resources as of the end of 2020.
If there is a crash in World C plus C output, it is much more likely it will be due to a crash in oil demand and oil prices in 2035 as demand falls faster than oil supply, then we could see all out development of resources by OPEC and a severe supply glut as large producers of cheap oil try to take market share from each other before their oil resources become worthless. At that point high cost producers such as tight oil and Arctic oil stop developing resources and eventually stop producing as the World price of oil might plummet to $25 or $30 per barrel in 2021 US$. I do not envision this occurring until some time after 2040, but it may begin (the crash in oil prices) around 2035.
A final comment on discounting OPEC reserves. If we want “proved” reserves we could divide OPEC official reserves by 1.7, but keep in mind that proved reserves are an estimate that has about a 90% probability of being less than the correct estimate, that is why the proved plus probable estimate is considered the engineering best guess, it would be the engineering estimate that a group of expert petroleum engineers would believe to have a 50/50 chance of being either too high or too low. In 2011 the World “proved” reserves reported by BP was roughly equal to the proved plus probable reserves reported by IHS. See section 3(b) of paper linked below:
https://royalsocietypublishing.org/doi/10.1098/rsta.2013.0179
from that paper a quote:
Globally, BP [13] estimates 1263 Gb of conventional proved reserves in 2011 (slightly more than cumulative production to date) and 389 Gb of non-conventional proved reserves. The latter comprise 169 Gb of Canadian oil sands and 220 Gb of Venezuelan extra-heavy oil, but both estimates are disputed and only a fraction of this volume is likely to be recovered over the next 25 years. In principle, global 2P reserves should be larger than 1P reserves, but according to an authoritative industry source (IHS Energy) global 2P reserves are approximately the same as national declared 1P reserves—suggesting an overstatement of proved reserves by several producing countries.
I do not have access to the IHS database so this may no longer be the case in 2020.
Dennis
in the latest Rystad report on recoverable oil resources, their current estimate is 1,725 Gb. This is almost the same as the BP estimate of 1,732. Their chart shows the reductions for 2020.
https://www.rystadenergy.com/newsevents/news/press-releases/worlds-recoverable-oil-now-seen-9pct-slimmer-commercial-volumes-can-keep-global-warming-below-1p8c/
2P, proven + probable I would think is most likely. After all, probable is not yet proven. However, 2PCX is rather weird, it includes undiscovered fields. How do they know how much is undiscovered? Discoveries have been dwindling down to almost nothing lately.
Thanks Ovi,
The 2PCX may include an estimate of future reserve growth along with any new discoveries, cumulative production through 2020 is 1423 Gb, then add the 1725 and we get a URR of 3148 Gb, a bit higher than my estimate of 3045 Gb. As I often claim, my estimate is fairly conservative despite the opinion of many here. Rystad’s estimates are usually pretty good and I am sure they have access to much more data than I do so this is unsurprising, in addition they have a team of experts that likely are better informed than me.
Note that it is not unusual for reserve estimates to decrease in a low price environment like we had in 2020.
Roughly 1/2 of the oil is still in the ground, if we accept the big estimates presented here by those who have studied the issue hard.
Just how much of that oil can or will be used is a big question mark.
How much capital can be thrown at the attempt?
What further enhancements in recovery are as yet unknown?
How quick or slow will the global market move toward electric transport?
How many oil producers will become unstable/failed nations?
Will the global populace be prosperous enough to continue with brisk petrol purchase?
Clearly there is a big fat potential tail of production after peak, but at some time that tail will get thinner quickly, and a lot of potential oil will be left in the ground- such as in Venezuela.
This second half of game may be a lot more like a short quarter.
A completely unpredictable short quarter.
Thank you for that clock. Is it not the silliest thing you’ve ever seen? It treats all oil as a homogeneous substance with a known quantity, like a big tank with a tap. The rate at which that tank is being depleted is probably the only feature of that graphic that is even approximately correct.
The rest is soothing fiction.
UK DATA: Oil output plunges 23% in May in pandemic aftermath
UK offshore oil production was down 23% on the year in May at 816,000 b/d, with crude output down 21% at 752,000 b/d, according to official data, likely reflecting post-pandemic ‘catch-up’ maintenance and spending cuts.
Pollux , tks for the update . In the future we are going to hear a lot of excuses like this as the production declines in the ” end of life ” producers .
P.S : Definition of “end of life ” are the institutions that continue to produce inspite of financial profits etc ,etc .
Dennis, sometimes I can’t tell if you believe what you write or you are just pretending. Same with Nick G. and others incidentally so I’m not saying it’s just you.
You just can’t change your cup is half full view, can you. Where is webhubbletelescope, by the way? Did he retire or just decide to stop posting?
Dolph9,
Webhubbletelescope posts as Paul Pukite, his focus is on climate change, particularly understanding the ENSO phenomenon. See
https://geoenergymath.com/
especially relevant is the post linked below
https://geoenergymath.com/2021/05/13/low-dof-enso-model/
As to whether I believe what I write, I do. My point of view changes over time as I get new information as does my expectation for the future.
If tight oil output is limited to a maximum of about 8400 kbd and we have a slow recovery of conventional extraction rate over the 2020 to 2035 period to the 2018 extraction rate level for conventional oil at the World level, and a World C plus C URR of about 3100 Gb (roughly between the Laharrere and USGS estimates), then we get the conservative scenario below.
I would guess there is a 66% probability that peak oil output will be higher than this scenario and perhaps 2 to 5 years earlier (exraction rate will likely ramp up more quickly than this scenario),
Note also that if the Rystad 2PCX estimate is correct and URR matches that estimate (3148 Gb URR for World C plus C), this scenario reaches 50% of that URR for Cumulative C plus C in 2025. Peak for the scenario occurs at about 54% of the URR for cumulative C plus C output.
Dennis, the Rystad 2PCX estimate is just a wild-ass guess because it includes “undiscovered fields”. Those fields may never be discovered. 2PCX estimates also include “contingent resources” as well as “risked prospective resources”. Contingent on what? And exactly what are “risked prospective resources”?
Seems like there are a lot of iffies and maybes in those 2PCX wild expectations. What is wrong with just “Proven + Probable”?
Ron,
The proven plus probable reserve estimate at any point in time tends to underestimate future 2P reserves, see my post on US reserves where the estimated 2P reserves grew by about 63% over 25 years, if one had assumed the 2P estimate for US reserves was correct in 1980, in 2005 they would have underestimated by 2P reserves by a large margin. The same remains true today.
That is why using 2P reserves and assuming no reserve growth and no new discoveries will lead to an underestimate of future reserves.
Do you ever wonder why World URR estimates for conventional oil have increased from 1800 Gb in 1998 to 3000 Gb in 2018?
The answer is partly oil discoveries, but mostly reserve growth. You can assume these have now ended, but it is a poor assumption in my view.
Contingent and prospective resources defined at link below
https://www.spe.org/en/industry/petroleum-resources-classification-system-definitions/
Every guess about the future is uncertain, the people at Rystad are very capable and their guesses are likely much better than mine.
Dolph9 , I am in constant disagreement (most of the time ) but his intention to get the correct info out has never been in doubt . You can question his argument but never his intention .
ExxonMobil and Chevron both reported lower than expected production for Q2.
Production of liquids fell for both. Spending less CAPEX.
Shallow sand,
How did their free cash flow and earnings per share compare with 2Q2020?
I hope you have found a workover rig (including people to do the work).
Dennis.
Much better of course, due primarily to oil price and natural gas price.
We did get a crew and well is hung on. We also got a tubing job done on another well. We have two more tubing jobs we are waiting on now.
Shallow sand,
Good to hear, hope you can get some crews in soon.
Well, Dennis, your beloved Chevron, for instance, made $1.4B in profit from N. American operations 2Q21; last year, same quarter, it LOST $2.1B. So in the Permian Basin, for instance, CVX really hasn’t made any money…yet. IN fact, nobody has, even EOG. Not in 14 years. Not in any shale oil basin.
“Free” cash flow is not free when you are in debt and paying an average of 6.5 % over three “mortgages,” on your assets.
The hedging fuck ups all these shale oil and shale gas folks made 2Q is nothing short of spectacular. They are going to leave $12 B on the table that could have gone to paying debt off. Which, by the way, in the Permian, is NOT $120B but closer to $180B with private debt. So your “all Permian debt will be paid off in 2.5 years and everything is peachy” model needs to be re-looked at. You can’t use total Permian production to model the end of only about 65% of total debt. Well, YOU can, but its not the truth. The Permian, overall, is adding debt. not paying debt back, by the way.
How can you make all these absurd claims about the future of US tight oil, and not be in the least bit interested in earnings reports? The arrogance of that is amazing.
So, for your readers benefit, you have totally dismissed pressure depletion in the Permian, and rising GOR, as just being “physics.” You have amazingly stated that there are 120,000 more Permian locations to be drilled and that Permian production will double from what it is now…regardless of individual well productivity clearly going down, down, down. In other words, you have dismissed Mother Nature totally. You are, to be clear, smarter than Mother Nature.
Furthermore, you have stated that all debt in the Permian will be paid off and that the HZ tight oil sector will double its production from net revenue going forward, without adding more debt, and all this will happen at $70 Brent. Permian operators rely on WTI, not Brent.
It is clear to me when I read AOB comments, nobody believes your shit anymore. They comment, ask questions and state opinions of concern for the future, and you dump on them, like your smarter than everybody and everybody “values” your opinion. That great oil man from Southern California believes in you, however, so that’s something.
But not really.
I think you are doing a great disservice to our nation, a nation that needs to begin conserving crude oil… like tomorrow morning. You, you are more interested in making a name for yourself, or selling books.
I hope people will look to other sources for meaningful discussion on their oily future. This fella on Twitter, for instance, is pretty savvy. He is keen on the CORRECT financial state of the shale oil sector: https://www.oilystuffblog.com/single-post/week-one
Maybe you’re on another blog? I don’t think what your saying applies here.
What I see is models and discussion on the state of the world’s petroleum production and reserves, and trying to make educated guesses about what might happen in the future.
The models and discussion here are based on the numbers. The numbers may be good or not-so-good, but they’re what we got to work with.
The best path forward for mankind and it’s oily future is a whole other blog.
Only from the great state of white supremacy and fascism Texass does a hole digger qualify as a financial analyst. That idiot over at oilyshit gets less than one percent of the comments peakoilbarrel receives. Jealousy plan and simple. Tiny ego complex.
Dennis your above responding to this
Really HB, while I disagree with Mike’s comments about Dennis, I thought his analysis was spot on. You must try to understand, Mike is asshole deep in alligators and it really pisses him off when someone tells him the swamp he is in is really a profitable water park.
+1 , and I am a Brownie so not a white supremist based in Europe , to add I care a f+++ all about the CRT shit going on in the US . What matters are the facts and facts alone regarding “peak oil” . When POD(Peak Oil Dynamics) hits it will not distinguish by the color of your skin .Mike has the facts because he has the ear to the ground .
Thanks for the comment Mike,
I agree we should conserve oil, my models simply try to make a realistic estimate of potential output. I am well aware of the well profiles of the average well in the Permian basin and assume wells become less productive over time in my model.
Scenarios I have done for the Permian basin recently have ranged from 35 Gb (low completion rate of 460 completions per month and low TRR) to 56 Gb (mean USGS TRR and medium completion rate (25% higher than previous high of about 500 completions per month).
My model assumes zero debt on December 31, 2009 for Permian basin. It then makes assumptions about CAPEX, OPEX, royaties and taxes, transport cost, oil, NGL, and natural gas prices for the future and uses actual prices for Jan 2010 to June 2021 for crude and natural gas, I assume NGL sells for 25% of the price of a barrel of crude.
I use Brent as a benchmark because that is considered the World bench mark for oil prices, I assume the wellhead price is $5/bo less than Brent (approximately equal to the price of WTI, though lately the Brent/WTI spread has narrowed to under $3/bo.
I include interest on debt in the model at 7.5%, rather than the 6.5% you suggest and I would be surprised if major oil companies are paying that rate of interest. For Chevron see
https://www.stock-analysis-on.net/NYSE/Company/Chevron-Corp/Analysis/Debt
Interest rate is about 2.3% bsed on 10K filings through Feb 2021.
Small companies no doubt pay higher interest rates, but they may also carry much smaller debt loads, if they are well run.
As to how much Permian output can increase will depend on the price of oil.
My scenarios assume $80/bo for Brent in 2021 US$ (or $75/bo for WTI in 2021 $). Future drilling is financed from free cash flow for model.
Two scenarios below, The 56 Gb ERR scenario assumes the USGS mean TRR estimate of 75 Gb for Permian tight oil is correct, maximum completion rate is 624 new wells per month. The 35 Gb ERR scenario assumes a TRR of 60 Gb and a maximum completion rate of 460 new wells per month. Economic assumptions are the same for both scenarios, oil price rises to $75/bo for WTI in 2021 US$ from Jan 2022 to Dec 2033 and then declines. NGL assumed to sell at 25% of the price of crude and natural gas sells at $2/MCF.
Someone requested that notice be given when a new US production post was coming.
There will be a US POST on Saturday July 31 afternoon.
Rig Count is down, M&A is up, Major are reducing CAPEX and laying off staff, Banks are not lending to the E & P world, PE has puked on ESG and fossil fuels are dirty awful words. We will soon come to understand what true energy poverty is all about. Good luck in the brave new world.
Tks Ovi .
The EIA’s Petroleum Supply Monthly came out today. US C+C was up 80,000 barrels per day. The Gulf of Mexico was up 29 Kb/d and New Mexico was up a whopping 49 kb/d but amazingly Texas was down 22Kb/d. North Dakota was up 26 Kb/d.
Forgot to add, the data is for May 2021.
A new thread on US Oil Production has been posted
https://peakoilbarrel.com/us-may-oil-production-growth-surprises/
A new open thread Non-Petroleum has been posted
https://peakoilbarrel.com/open-thread-non-petroleum-july-31-2021/