Taking a closer look at OPEC. All OPEC and price data below is through December. All production data is in thousand barrels per day.
Iran and Libya have had serious political disruptions in their production numbers. Simply adding them to the OPEC numbers distorts the picture. To try to figure out what has been happening to OPEC we need to look at OPEC without Iran and Libya.
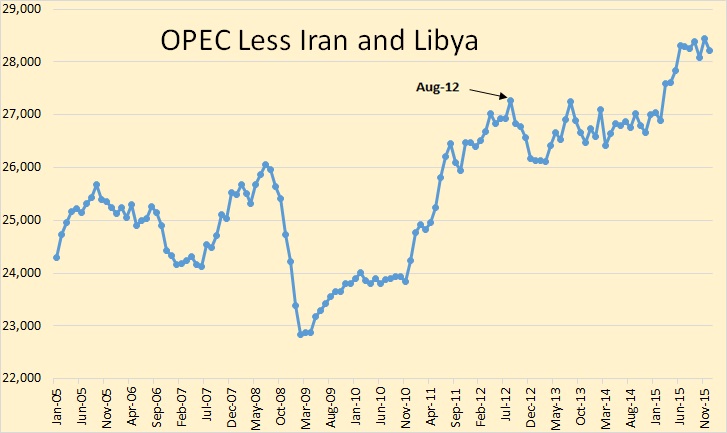
Here is OPEC less Iran and Libya, or the OPEC 10 if you will. I have marked August 2012 as what I call the “Price Peak”. Not the peak in oil prices but the production peak that was brought about by the increase in the price of oil. That price increase began in early 2009 and by March 2011 was well above $100 a barrel. And the price of oil did not drop below $100 a barrel until late August 2014.
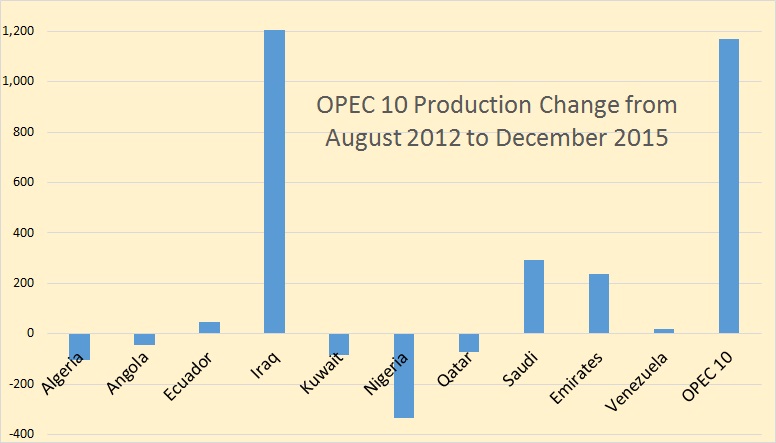
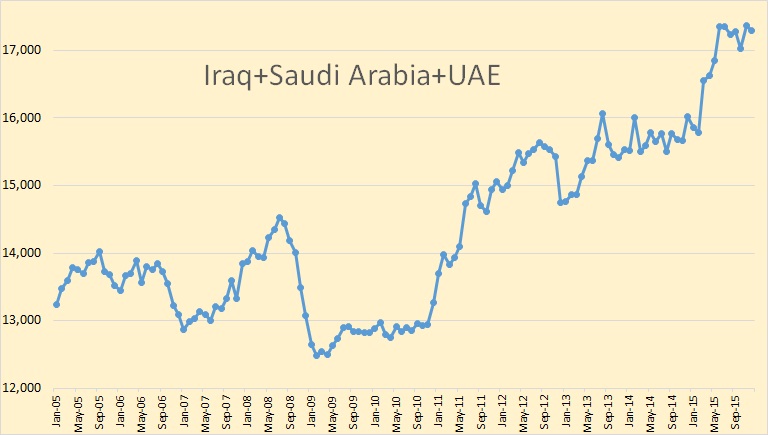
Here are is the production change from August 2012 to December 2015. As you can see the lions share of increase came from Iraq with a little help from Saudi Arabia and the UAE.
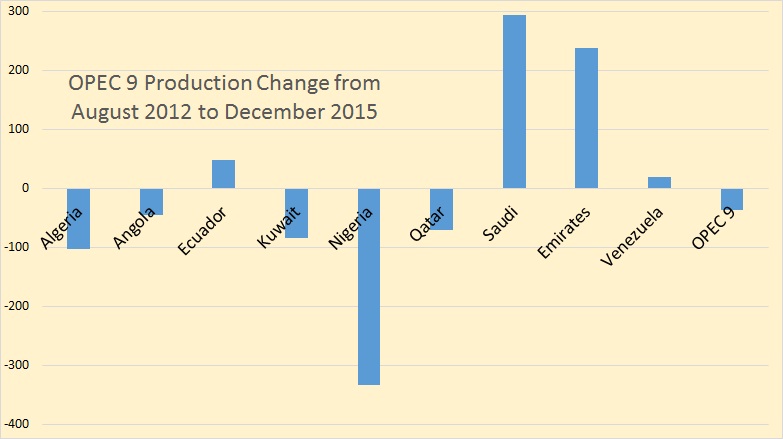
Removing Iraq from the mix and the remaining 9 OPEC nations were actually down during that period. Except for Iraq, OPEC production from August 2012 until the present, is actually down in spite of the price of oil being in excess of $100. And that is not even counting the huge decline from Libya during this period. The Iranian decline was prior to this period.
The price data in the chart below is from the Mundi Index and is the average of three spot prices; Dated Brent, West Texas Intermediate, and the Dubai Fateh, US Dollars per Barrel
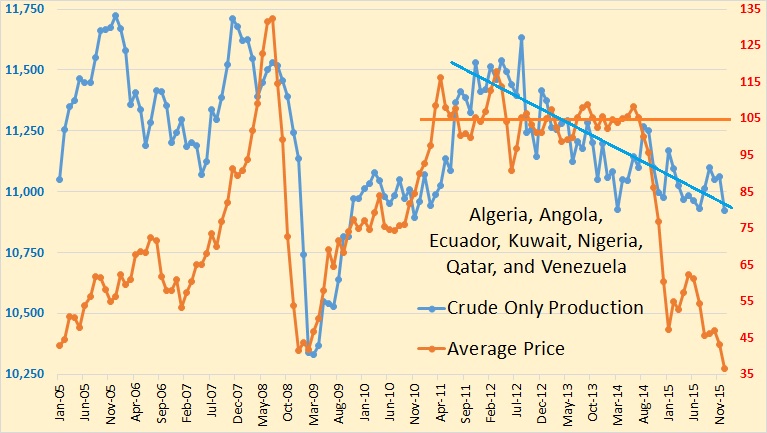
This is a chart of the combined production of Algeria, Angola, Ecuador, Kuwait, Nigeria, Qatar and Venezuela, seven of the 12 OPEC nations. The point I am driving at is that oil, averaging about $105 a barrel, could not stop the decline in the combined production of these seven OPEC nations. These OPEC nations have peaked and a return of $100 plus oil will not change that simple fact.
Barring the collapse of the Arab Spring and peace breaking out in Libya, any further increase in OPEC production must come from Iran and/or Iraq, Saudi and the UAE. Saudi and the UAE, I believe are producing at or extremely close to their peak, and I am not so sure about Iraq. At any rate the OPEC 10, in my opinion, has peaked. Any possible increase in Iraqi production will be offset by the decline in production of the other 9.
Crude oil production charts of all 12 OPEC nations can be found at the page OPEC Charts.
361 responses to “A Closer Look at OPEC”
Good points Ron.
When you subtract the human element (military-political instability) it looks like a lot more could be produced from Libya, Iran, and Venez.
When you add the human element, it all looks very fragile. I see the current output from Iraq and Saudi as certainly vulnerable.
I wonder why an organization of petroleum importing countries (OPIC) was never formed, to collective deal with OPEC on pricing and delivery issues.
A couple of links relevant to Saudi Arabia:
Amazon link to “On Saudi Arabia”
http://www.amazon.com/On-Saudi-Arabia-Religion-Lines/dp/0307473287
NYT: Surprising Saudi Rises as a Prince Among Princes (June, 2015)
http://www.nytimes.com/2015/06/07/world/middleeast/surprising-saudi-rises-as-a-prince-among-princes.html
https://en.wikipedia.org/wiki/International_Energy_Agency
Estimated Unplanned Crude Oil Production Outages in OPEC countries (mb/d)
Source: EIA Short-Term Energy Outlook, January 2016
Iran crude oil production and unplanned production outages (mb/d)
Source: EIA Short-Term Energy Outlook, January 2016
Libya crude oil production and unplanned production outages (mb/d)
Source: EIA Short-Term Energy Outlook, January 2016
Total OPEC crude oil production and unplanned production outages (excl. Indonesia) (mb/d)
Source: EIA Short-Term Energy Outlook, January 2016
According to the EIA estimates, if not for production outages, OPEC production would increase by almost 4 mb/d over the past 5 years, from 30.7 mb/d in January 2011 to 34.6 mb/d in December 2015
AlexS. What are the OPEC countries’ consumption statistics during that period?
I think you posted information re KSA oil consumption, but what is it for OPEC as a whole?
shallow sand
I do not have combined data for all OPEC members, only for some of them.
Oil consumption in Saudi Arabia and Iran (kb/d)
Source: BP
Oil consumption in several other OPEC countries (kb/d)
Source: BP
Hi Shallow sand,
Try
http://mazamascience.com/OilExport/
Roughly 4 Mb/d in 1990 and 8 Mb/d OPEC consumption in 2014, estimating from the chart.
Combined data for 8 OPEC members (Iran, Kuwait, Qatar, Saudi Arabia, UAE, Venezuela, Algeria, Ecuador):
1990: 3.4 mb/d; 2000: 4.6 mb/d; 2005: 5.8 mb/d; 2010: 7.2 mb/d;
2014: 8.4 mb/d. (from BP)
AlexS. Thanks again for the data.
Although somewhat conspiratorial on my part, I note Citi and Goldman Sachs are now turning bullish on crude oil.
I read that since the first of 2016, there has been extremely high correlation between the S & P 500 and WTI.
I wonder if maybe the money center banks have decided that further shorting of crude oil will torpedo the US stock market, and thus the economy, given the “wealth effect” confidence, or lack thereof, it creates.
Further, although not bank threatening, these banks stand to lose a lot if some bigger shale names implode.
Also, Mr. Kerry is in KSA again, supposedly trying to soothe over ther Iranian issue. I wonder if there is also some “crude overdone” talk going on? It would not surprise me if US is just as concerned about low prices, given the obvious correlation with US investor confidence.
Not like $45 or so is that great, but at least we could fight through that. Still in 20s in the field, which is still a money burner.
shallow sand,
I also noticed that GS, Citi and IHS’s Yergin have turned bullish. And I agree with them, current price is not justified by fundamentals and cannot stay at these levels for long.
$45 is quite possible in the second half, maybe by the end of the year, in my view.
I don’t know about Kerry, but Saudi Arabia has just said that “$30 oil is ‘irrational’
This is why they turned bullish:
http://www.reuters.com/article/citigroup-energy-idUSL2N1551W2
and trying to move it with this:
http://www.bloomberg.com/news/articles/2016-01-22/oil-is-trade-of-the-year-for-citigroup-after-iran-export-surge
Hi AlexS,
Unplanned outages are a fact of life. It is unlikely that all the “unplanned outages” will be resolved at the same time, and there is the ongoing decline from the OPEC9 (which has been relatively modest to date). I would agree that at some point OPEC output will increase as outages in Iran, Iraq, and Saudi Arabia are resolved. I doubt any problems in Nigeria, Venezuela, or Libya will be resolved in the near term. Total OPEC output might increase 3 to 4 Mb/d over the next 10 years, but there will be declines in non-OPEC output.
Total OPEC output might increase 3 to 4 Mb/d over the next 10 years,
Given that the OPEC nations that are in decline, will decline 3 to 4 Mb/d over the next 10 years, that means that OPEC nations that are not in decline must increase from 6 t 8 Mb/d over the next 10 years… for that to happen.
Would you care to name which OPEC nations will show such an increase?
Crickets chirping
Hi Ron,
Your chart with 7 declining OPEC nations has about a 600 kb/d decline from 11.5 Mb/d in late 2011. The decline rate is about 1.33% per year from Dec 2011 to Dec 2015.
If we assume this rate of decline continues for these 7 countries for 5 years then output declines by 700 kb/d over those 5 years.
So we would need only a 4.2 Mb/d increase from the rest of OPEC to get a 3.5 Mb/d increase.
My guess would be about 2 Mb/d from Iraq, 1 Mb/d from Iran, and 1 Mb/d from Saudi Arabia and 0.2 from elsewhere in OPEC.
Note that I suggested OPEC might increase output this much, it is intended as a maximum likely output. It may well be less, but not likely to be less than 2 Mb/d in my opinion.
Dennis, of course I disagree with you here. I think your estimate of future OPEC production here is way, way off the mark. However we are both just making our best guess.
It would be really stupid for us to argue about what is going to happen in the future since neither of us really know.
So I say you are wrong and you say I am wrong. So we will just have to leave it at that for the next five years or so. And that is the sorry state of affairs that we are just going to have to live with.
HI Ron
On this point we agree we don’t know the future.
Note that my best guess for all Opec is a 2 Mb/d increase over the next 3 to 5 years. I would think your best guess might be flat opec output if so we aren’t that far apart and reality may fall between these guesses.
A few years ago on the Oil Drum there was a lot of expert discussion on what might happen to decline rates on Ghawar. All the results were off because they had to use best guess data, but I think the analysis methods were fairly solid. One eye catching result indicated that the production could drop by over 50% in a matter of 2 or 3 years once water breakthrough hits horizontal producers (and then steadies out again to a slower decline rate). In one scenario this sudden drop was expected about now.
Hi Ron,
I said in my comment 10 years, the 7 declining OPEC nations would decline about 1.4 Mb/d if the 1.33% annual decline rate does not increase. So the rest of OPEC would need to increase by about 5 Mb/d over 10 years, so maybe 2 Mb/d from Iraq, 1.5 Mb/d from Iran, 1.25 Mb/d from Saudi Arabia, and 0.25 Mb/d from UAE, above 2015 average levels in 2025. So total OPEC output (from current OPEC members) would be about 3.5 Mb/d higher in 2025 in this scenario (which I believe is optimistic). A more realistic estimate would be about half this increase or 1.75 Mb/d higher OPEC output in 2025.
I assume oil prices will rise from $100/b in 2018 to $150/b in 2025 (2016$) and that demand for oil will not be reduced due to a severe recession between 2016 and 2025. If demand is low due to recession or War then oil prices and output will be lower than the “realistic” scenario and OPEC output would clearly decline if there was a major war in the middle east (say a Saudi Iran Iraq war with Nato on the side of KSA and Russia and China backing Iran and Iraq, or essentially a non-nuclear World War 3.)
Nuclear war is another can of worms which gets us to more serious doomer territory. Not sure how that plays out, but not well would be my guess.
I would not isolate OPEC from others. The better technique would be to identify nations with low potential, already declining. I believe their total forecasts can be prepared simply extrapolating an exponential decline for all of them lumped together.
The other nations, which include Saudi Arabia, Iraq, Iran, USA, Canada, Brazil, Russia, and possibly the Emirates, can be considered individually.
I ran so many models and excel workbooks in my life nowadays I can’t get too motivated to crank one up. But if you think this is worthwhile I’ll see,if I can give it a try.
I would appreciate if you cranked one up fernando.
Maybe a guest post?
Hi Fernando,
I would love to see that, probably a 2% decline rate would work (exponential decline) for the declining nations.
Not sure how the forecasts for the other nations would be done, but I don’t have nearly the knowledge that you have about the oil industry.
HI Alex
In your eia chart it looks like 3 Mb/d not 4.
Hi AlexS,
I misread your comment, you are talking about the increase for the past 5 years with no outages would have been about 4 Mb/d.
I was looking at your first EIA chart showing OPEC outages which is about 2.7 Mb/d, which was not what you said. My apologies.
If we assume the situation in Libya will not improve much over the next 3-5 years, but all other unplanned outages come back on line, we would see an increase of 1.7 Mb/d, then we subtract declines of 700 kb/d fro the 8 OPEC nations (including Indonesia) in decline and we would have about a 1 Mb/d increase, if Iraq, Iran, Saudi Arabia, and UAE cannot expand output any further. I think these 4 nations might increase output by 2 Mb/d over the next 5 years if oil prices rise to $100/b by 2018 and remain that level or higher through 2021, which would add up to about a 3 Mb/d OPEC crude oil increase between 2015 and 2021 (comparing yearly averages).
I think the relatively low oil prices of 2016 and 2017 will lead to oil scarcity by 2018 and $100/b or higher will be the average oil price in 2018.
This quote which I just hooked from Quora, by Richard Muller, was in response to questions from students as to why they should have to study subjects they did not expect to bear DIRECTLY on their careers.
It does bear directly on understanding the complexities of the oil industry, oil markets, international politics, future technologies, overshoot, and everything else we discuss in this forum.
“I was watching an interview with a well-known actress a few years ago. She was opposing nuclear power, and made some statements about the aftermath of 3-Mile Island. After she went on for a while, the interviewer pointed out that she got many of her facts wrong. She was indignant. “This is not about facts,” she said. “It’s about feelings!”
Many, maybe most people have a similar approach to life. There is a marvelous description of this attitude in the wonderful book, Uncommon Sense by Alan Cromer. Most of the world makes decisions based on feelings, not taking into account thoughtful analysis. Yet nothing conflicts with good decision making as much as giving in to this instinct.
In my mind, Shakespeare and Geometry teach the most essential lessons needed for a productive and successful life. Properly taught, they teach you to think, to take in the evidence, to analyze, and to deduce. My favorite Shakespeare course was taught by Prof. Hugh Richmond at Berkeley; I went to all the lectures (as an auditor) and did the readings while I was a graduate student earning my Ph.D. in physics at Berkeley, but this course was very important to me. Whenever I see Prof. Richmond, I thank him yet again for this course. No course gave me more insight into human behavior. Or about writing and persuasion — Shakespeare’s methods for convincing us of his insights.
Think of Antony’s great speech, “Friends, Romans, Countrymen …” and how he brings a hostile crowd to his own point of view. In what other course would you learn how to do that? Is that a skill that will prove useful in your future life? Let me ask that differently. Is there any more important skill?
And it is not just the way that Antony does it. It is the very fact that he does it. Recognize that, and you become aware of an aspect of life that you don’t get in a physics or engineering course.
About writing…. Shakespeare sets the standard, not in flowery language, but in vivid language, language that makes you understand what it is that Shakespeare wanted you to understand. That’s why you need to read (or better yet — watch) the originals, not the short study guides designed to give you the plot and help you with a pop quiz.
Think of what we learn about life and love from Much Ado About Nothing, about how two people who hate each other can change and feel deep and true love towards each other. I can go on and on, and if you had a good Shakespeare course, so can you. Many of the great books are comparably good; I particularly love the Russian novels, especially War and Peace. But I sometimes just sink into Moby Dick and read it again.
Geometry is the class that teaches us about logical thinking, about what it means to draw a conclusion, about the meaning of truth and how we can test it to see if it is correct or false. Most reality cannot be reduced to simple theorems in the way we do for geometry, but a study of that subject shows us that at least some truths really do exist; some speculation is definitely false, and with careful thought and analysis, you can (at least sometimes) tell the difference.
Of course, there is a limited amount you can learn from these courses. They are really meant to trigger a lifelong learning, of logic, of literature, of books and plays, of fact-based knowledge and knowledge of people and persuasion, a lifelong learning that informs and educates. Stick with it for a few decades and you will understand and be able to control and influence much of the world around you.
If the actress I was referring to had studied geometry, maybe she wouldn’t have been so cavalier about whether facts matter; if she had studied Shakespeare, maybe she wouldn’t have been so cavalier about total trust in the guidance of feelings.
If you are older, and feel that you don’t understand the world; if you feel powerless and cheated out of life, it just may be because you didn’t study Shakespeare or Geometry when you were younger, or because you just got through them, instead of getting into them.”
Muller has forgotten more science , and more about human nature too, apparently, than most people can ever dream of learning.
I will say it again, sound bites are for fools and people who want others to do their thinking for them.
Understanding any thing worth the trouble of understanding it invariably requires time and intellectual work.
“you will understand and be able to control and influence much of the world around you”
That sounds deranged.
“That sounds deranged.”
It sounds crystal clear to ME.
Are you saying YOU personally do not understand and control and influence SOME of the world around you?
The word “much” can mean a little or a lot of course.
I understand MOST of what goes on in the world which is of interest to me, and I believe that most people who make an honest effort to do so can come to understand those aspects of the world that are important to them.
Now as to how much CONTROL over the world I have is concerned, I have a LOT of control over a small portion of it. I am enjoying tropical level warmth, eating tropical fruit, and reclining in an easy chair, watching the birds outside at our feeders, while the wind howls and the snow blows, playing with my crystal ball, talking to people on the far side of the planet.
A man such as Muller trains a hundred or more capable scientists, personally, as their mentor, over the course of his career, and may make some important discoveries himself. He makes things happen. He has influence with powerful people.
The Henry Ford’s and Bill Gate’s of this world make things happen.
http://www.wired.com/2016/01/jeff-bezos-blue-origin-rocket-took-off-and-landed-again/
Now if a MAN is technically illiterate, and spends his time watching football, and playing cards, or drinking beer, and never studies the classical literature as Muller suggests, then HIS understanding of the world, compared to that of a man such as Muller, is as the understanding of a dog, compared to that man himself.
If I come off sounding like an elitist, I do not deny the description. I live on a daily basis among people who are intelligent enough, as intelligent as other folks, but IGNORANT as a fence post, when it comes to the sciences and history.
I do not look down on such people, they are MY OWN people, my OWN close blood kin in many instances. But otoh , my close blood kin includes medical doctors, engineers, teachers, professors, and other true professionals in various fields. I am a professional myself, in the true sense that I have devoted years of study to learning my profession, learning countless things I could NEVER hope to learn in one lifetime,on my own, except by learning them in a university environment, in an organized, structured environment created for that purpose.
There is a HELL of a difference between being a “professional truck driver” and a professional engineer, or a professional accountant, or a physician, etc.
Muller thinks very highly of himself but… Golden lads and girls all must, as chimney-sweepers, come to dust.
Actually considering his accomplishments, I should say he is quite justified in having a high opinion of himself, if in fact he does. Not everybody gets to be professor of physics at an elite university.
And he seldom talks about himself, if he ever does, to my knowledge. He talks about his WORK.
I will hazard a guess that he is satisfied that with his accomplishments, and with his status, and feels no need to brag about them.
People can speak like prisoners of the Matrix.
They can speak in the language of it; ‘professional’, ‘university education’, ‘corporation’, ‘cars’, ‘taxes’…
They can live under the wool of a culture pulled over their eyes to blind and curtail them from any other way to live; to make them think that there is no better way than what they know, existing within their own perceptual myths, slaves to their societal straightjackets.
To quote a piece of graffiti once read:
“You are not your job” ~ Anon
Caelan,
Speaking of Jobs. Are you still unemployed ? You could try HomeDepot. If that doesn’t happen for you. Lowe’s will hire anybody.
Good Luck
“You are not your job” ~ Maybe
‘Trump 1.0′? Really? LOL
But sure-sure, I could also huckster trucks and EV’s– even second-hand ones– and offer some complementary Kool Aid for the consumers– after my share of course.
Go Trump!
*fart/belch*
…How am I doin’?
Good post Mac.
If Saudi policy is to endure lower oil prices in favor of market share, then it is logical that the Saudis would pump at greatest ability in order to yield greatest share. Saudi production has declined each of the last 6 months. Certainly the Saudi’s won’t tell; but time will tell if the ongoing decline marks their greatest ability.
The decline of the past several months was due to supply disruptions from the Neutral Zone
(250 kb/d net to Saudi Arabia.)
From EIA STEO:
“Kuwait and Saudi Arabia continue to have a combined disruption of 0.5 million b/d at the Wafra and Khafji fields in the Neutral Zone that straddles the two countries.”
AlexS,
This is weird: I saw an announcement a few days ago that production would resume in the Neutral Zone, but now I can’t find it–ah, it was on Rigzone Thursday.
Production is to resume “soon.”
http://www.q8dailynews.com/story-z4351308
I thought I saw that on Rigzone also.
I’d love to see an ELM analysis of OPEC and various OPEC subsets i.e. OPEC 7, OPEC 10 etc. I understand times see turbulent and nothing that has happened is likely to continue in a linear fashion, but all the same, if Mr Jeffrey J. Brown would grace this fine blog with an ELM guest post of any sort I’d be ever so thankful.
2005 to 2013 total liquids consumption data for OPEC 12 (finally heard from an EIA contact in regard to missing 2014 global consumption data; he said he would look into it. ):
http://www.eia.gov/cfapps/ipdbproject/iedindex3.cfm?tid=5&pid=5&aid=2&cid=CG9,&syid=2005&eyid=2013&unit=TBPD
2005 & 2013 OPEC 12 EIA Data (rounded off):
2005:
Production: 35 million bpd (total petroleum liquids + other liquids)
Consumption: 7
Net Exports: 28
ECI (Production/Consumption): 5.2
2013:
Production: 36 million bpd
Consumption: 9
Net Exports: 27
ECI (Production/Consumption): 4.0
Estimated number of years to ECI Ratio of 1.0 (production = consumption, and thus zero net exports), based on above ECI decline: 50 years
Cowboy Integration Estimate of post-2005 CNE (Cumulative Net Exports):
10 Gb/year (at presumed net export peak) X 50 years X 0.5 (area under a triangle) less 10 Gb (annual net exports at peak) = 240 Gb
CNE shipped from 2006 to 2013 inclusive: Approx. 80 Gb
So, ballpark guess is that OPEC has already shipped about one-third of post-2005 CNE, through the year 2013.
Ratio of estimated (as of end of 2013) remaining post-2005 CNE divided by 2013 net exports: 24 years.
Note that this approach, using initial seven year rate of decline in Six Country ECI Ratio was too optimistic by 23%.
And note that the above extrapolation of the OPEC 12 data, in effect, assume an indefinite increase in both production and consumption.
As I noted on a prior thread, the ELM model, and the Six Country Case History, showed that a declining ECI Ratio corresponded to an accelerating rate of depletion in post-export peak CNE.
Link to my lengthy defense of the ELM on the prior thread, which, as noted, is just a set of mathematical observations:
http://peakoilbarrel.com/opec-except-iran-has-peaked/#comment-556981
And a link to the normalized charts for the ELM, Six Country Case History and (2005) Top 33 Net Exporters:
http://peakoilbarrel.com/opec-except-iran-has-peaked/#comment-556985
As best that I can tell the CC (Crazy Cornucopian) visitors from Fantasy Island so far have adamantly refused to acknowledge the mathematical facts inherent in the ELM, what I call “Net Export Math.”
Thanks Jeffrey! I hope you’re well.
An ELM for Algeria, Angola, Ecuador, Kuwait, Nigeria, Qatar and Venezuela, seven of the 12 OPEC nations clearly post peak that Ron discusses above would be an interesting eye opener.
It seems to me we’ll be running on fumes sooner than most folks think.
For the Export Land Model (ELM), I stipulated a production peak with an ECI Ratio (ratio of production to consumption) of 2.0 (consumption = half of production), with declining production and increasing consumption. My most recent graph shows a net export peak in the year 2000.
The Model
From 2000 to 2007, the Export Land ECI Ratio fell by 42%, which corresponded to a 95% decline in remaining post-2000 CNE (Cumulative Net Exports).
A Case History
From 1995 to 2002, the Six Country* ECI Ratio fell by 17%, which corresponded to an 84% decline in post-1995 CNE. An extrapolation of the initial seven year 1995 to 2002 rate of decline in the Six Country ECI Ratio resulted in an estimate of post-1995 CNE that was 23% too high.
Estimates of the Declines in Post-Export Peak Remaining CNE
(Based on initial rates of decline in the respective ECI Ratios)
From 2005 to 2013, the OPEC 12 ECI Ratio fell by 23%, which I estimate corresponded to about a 33% decline in remaining post-2005 CNE.
From 2005 to 2013, the (2005) Top 33 Net Exporters’ ECI Ratio fell by 17%, which I estimate corresponded to about a 26% decline in remaining post-2005 CNE.
*Major net exporters, excluding China, that hit or approached zero net exports from 1980 to 2010.
http://www.bbc.com/news/science-environment-35344664
Hawking weighs in on threats to the globe. I love Hawking, but he is missing the biggest threat IMO.
ELM.
It’s simple. Plug the actual net export data on the ELM chart starting in 2007. You ought to be able to do it through 2014.
The ELM Fantasy.
At the time that I posted my ELM essay 10 years ago this month (which predicted that we were on the verge of a global net export decline), the Top Five net exporters at the time were showing a 7.4%/year rate of increase in net exports, up from 19.4 million bpd in 2002 to 24.2 million bpd in 2005 (total petroleum liquids + other liquids, EIA data). At this rate of increase, they would have been up to about 44 million bpd in 2013.
Their net exports actually fell from 24.2 million bpd in 2005 to 21.3 million bpd in 2013. Granted, their combined net exports have not fallen as fast as our modeling suggests that it would. However, an extrapolation of the 2002 to 2005 rate of increase in would have shown about a 20 million bpd increase in net exports through 2013, whereas actual net exports fell by about 3 million bpd.
The Crazed Cornucopians are complaining that the Export Land Model, which is really just a set of objective mathematical observations, is wrong, because 10 years after I predicted, because of falling production and/or rising consumption, that we were on the verge of a net export decline, our subsequent modeling of (2005) Top Five net export numbers was not right on the mark.
It’s simple. Plug the actual net export data on the ELM chart through 2014. A nit. The 2007 upper confidence level should be below the 2006 actual data point. 2015 looks fine by eyeball.
The ELM FUD campaign – “ferocious decline” – was based on the reference case. Are you retracting it?
Troll alert
Not necessarily.
Models need to be able to withstand different forms of, say, scrutiny, which can help in hashing out and clarifying what the models are expressing as well making them more robust and expressive.
As I have periodically noted, we are dealing with mathematical certainties:
The ELM is a nothing burger, hence Brown’s reticence to post actual data to demonstrate empirical falsification.
KSA reafirmation of their market share strategy is about as clear a definition of insanity as I can think of. An OPEC reduction of 5 to 10% would deliver an immediate 100 to 150% price increase per barrel, keep the wolf away from the door , and may restore the Saudis stability. Non OPEC producers are ready to join in…what more do they want? If cutting off one’s nose to spite their face is a sound strategy then I guess they are on point. Meanwhile ISIS is knocking at KSA door and could possibly be heading in full force since they are being squeezed out of Syria and Iraq. House of Saud is in deep shit.
Are LTO producers ready to join in…?
Is Iran ready to join in after 3 years of underproducing due to the sanctions?
Hi AlexS,
Is the marginal Russian barrel profitable at $30/b?
I would think there is some production everywhere in the world where even the OPEX is not covered by this oil price (after taxes etc), so wells might be moved to smaller chokes or temporarily abandoned where possible and that completion of new wells would be slowed while waiting for the oil price environment to change. Several large IOCs have announced big layoffs, so I imagine fewer workers might slow down the process of implementing investment decisions to some degree, the smaller OCs have already made many cutbacks, within 6 months we will see these cutbacks start to reduce oil output. I doubt $40/b is going to stem this decline.
Behind WSJ’s paywall but available via Google, bold mine:
Russian Oil: Output Grows as Prospects Shrink
Without new investment, Russia’s oil future is less bright. In West Siberia, where some two thirds of the country’s oil is produced, companies battle declining production rates after decades of oil extraction. “It’s unlikely we can stabilize production in West Siberia,” said Mr. Alekperov of Lukoil. “We can only slow the decline.”
—-
Horizontal drilling last year made up about a third of all drilling in Russia, up from 11% in 2010, according to CDU TEK, the monitoring agency at Russia’s energy ministry. Such wells are drilled parallel to an oil or gas formation and can boost yields as much as five times that of a vertically drilled well. It is a technique that helped fuel the U.S. oil boom of the past few years.
“Russia was late to this,” said Sergei Alekseev, director of marketing at TMK, Russia’s largest manufacturer of steel pipes for the oil industry. “But now we see it everywhere.”
The technology has allowed Russia to squeeze more oil out of older fields across Russia and particularly in Siberia, where Lukoil is pumping at Imilor, but is only staving off the inevitable, executives said. Many of the big West Siberian oil fields have produced for more than five decades and yield less every year.
Output across the Khanty Mansiysk region, which includes Imilor and accounts for just under half of Russia’s output, fell 2.8% in the first 11 months of 2015 versus a 1.6% decline for 2014 overall, according to IHS Energy, a consulting firm.
At Rosneft’s Varyeganneftegaz division in West Siberia, oil production has fallen almost 6% in the first nine months of 2015 compared with the same period a year earlier. Rosneft posted a crude oil production decrease of 1% in the same nine-month period because of declines in older fields, despite new output from offshore projects and East Siberia.
It is just a matter of time before two thirds or Russian oil production starts showing some very serious declines.
Dennis,
There is indeed some production in non-OPEC countries where OPEX is not covered by $30 oil price.
But this is not the case of Russia (see the chart below, which I had already posted earlier).
I don’t think that at $30 currently producing wells in Russia would be idled, or development drilling will be significantly cut.
If prices remain at these levels for the whole year (which is not likely, in my view), there will be further cuts in investments in new project, but this should not affect near-term production levels.
For example, Lukoil’s $8.5 billion investment program for this year was based on $50 oil. Their CEO Vagit Alekperov said last week that he still expected Brent to reach $50 by the end of 2016, but the company now has 3 much lower oil price scenarios: base case @ $30 average for the year; optimistic @ $40; and “crisis scenario” @ $20/bbl. At $30 they would cut investment by $1.5bn to $7 bn, at $20 – to $5.5 bn. Note, that up to 90% of operating and capital costs in Russia are ruble-denominated. And given that the ruble/US$ rate is closely correlated with the oil price, the real capex in ruble terms would be reduced much less than in dollar terms. Capex cuts will primarily affect projects with long payback periods, some non-essential spending, investments in new infrastructure, etc.
Meanwhile, projects that were scheduled for 2016 continue to come onstream. Thus, last week Rosneft has started commercial oil production at Zapadno-Epasskoye field in Russia’s Tyumen Region.
( http://www.worldoil.com/news/2016/01/21/rosneft-subsidiary-brings-zapadno-epasskoye-field-onstream )
Median Total Cost of Oil Production per Barrel
Source: Rystad Energy
[ http://money.cnn.com/interactive/economy/the-cost-to-produce-a-barrel-of-oil/index.html?iid=EL
Hi AlexS,
The median cost doesn’t really tell us much, it is the cost to produce the most expensive barrels which is relevant. You seem to argue that the low oil prices are unlikely to affect output. If output is unchanged, it would stand to reason that oil prices would remain $30/b. Why won’t the oil price remain $30/b, if that price will have little affect on output in the near term?
Perhaps the median OPEX in the US is $15/b, but based on Shallow sand’s comments, this seems pretty low.
One has to realize there are costs besides OPEX and CAPEX, royalties and taxes (in the US) are usually about 30% of the wellhead price and there are transport costs to get the oil to a refinery ( we will assume the refinery pays WTI or Brent prices for simplicity). The transport cost varies but we will call it $5/b (often with pipeline access this is close to the low point, in some cases it is $12/b when crude is shipped by rail) So at a WTI of $30/b, the wellhead price might be $25/b, then $7.50 gets paid in royalties and taxes, so we would be down to $17.50/b and at least half of US output would be making $2.50/b more than OPEX in this scenario.
Maybe Shallow sand and others in the US oil industry can comment on whether the $15/b US median OPEX estimate seems correct. Seems too low to me.
What do they classify as “capital expenditure”? All of the CAPEX needed to produce a given oil reserve volume? As Denis says, lumping production units by country is a bit too coarse.
The question is more what’s the individual field/well limit, and the psychology of the operator.
I have audited operators who simply didn’t know what opex was for individual units, so they kept on producing them at a loss.
The real reason oil is rallying:
http://money.cnn.com/2016/01/22/news/russia-ukraine-sanctions-john-kerry-davos/
The downturn began with Kerry announcing sanctions
following your logic, oil should soon return to $100.
That was the level when sanctions were announced
“The downturn began with Kerry announcing sanctions”
This idea that the drop of oil price was Obama administration (in full cooperation with Saudis) declaration of an economic war on Russia is a recurrent theme of many posts. It is enhanced by the fact that talking about Saudis defending their market share does not align well with the facts. Gaining 11 billion (1 Mb/d, at $30 * 365 days) and losing 100 billion in budget is not a very apt strategy of defending market share. My impression is that Saudis wanted a “modest” drop, say, to $60 and were instead caught naked by Wall Street sharks.
Why they can’t just wait when the US shale production died with a natural death? Outside of sweet spots, it was not very profitable at $100 per barrel and actually profitability greatly improved due to oil slump (with all “redundant” expenses thrown under the bus and greatly increased danger of environment catastrophe ). Now people claim that it can survive at $60-$70 a barrel.
BTW this article has a pretty strange set of comments (for CNN website ). Looks like people start ignoring or, worse, questioning official propaganda line.
It s quite hilarious how the rats are changing their tune now:
http://www.pravdareport.com/news/business/22-01-2016/133132-soros_russia_international_reserves-0/
Soros is definitely a typical financial rat, GS-style rat to be exact — a financial hacker. No questions about it.
Soros is one of the greatest philanthropists of our times, a champion for democracy and human rights.
“George Soros has been a prominent international supporter of democratic ideals and causes for more than 30 years. His philanthropic organization, the Open Society Foundations, supports democracy and human rights in more than 100 countries.”
The infamous KOCH brothers support cancer research.
Of course that just might be because they are afraid of getting cancer THEMSELVES, lol.
What people do on the job, and what they do after they go home from the office is two different things.
Having said this much, Soros is a nice guy, compared to his peer group.
Is not he also a supporter of “color revolution” and “disaster capitalism”:
http://www.sott.net/article/295896-George-Soros-The-hidden-hand-behind-color-revolutions
Just asking.
Actually it is important that these do not shut down from a nat security pt of view:
http://www.wsj.com/articles/stripper-wells-are-wild-card-in-oil-rout-1441660049
Of course, I agree.
Are you the famous oil trader Andy Hall?
A new post from Aleklett
https://aleklett.wordpress.com/2016/01/22/what-will-happen-with-the-iranian-stored-40-million-barrels-of-oil/
He does not ask himself an important question, what all those tankers contain. Is this crude or condensate? Or some refined products like heating oil too.
For what it’s worth, Iranian sources say it’s condensate and fuel oil. I guess we will find out.
http://www.reuters.com/article/iran-oil-idUSL3N1021Z120150723
For comparison
US condensate production increased from 231 mb in 2011 (start of shale oil boom) to 326 mb in 2014
https://www.eia.gov/dnav/ng/hist/rl2r57nus_1a.htm
So IEA’s estimate of 36 mb x 0.67 = 24 mb would be 7.4 % of 2014 US condensate production
There are some reporting issues regarding “Lease condensate,” i.e., I suspect that a good deal of condensate production is reported as crude oil production. And in fact, the EIA refers to Crude + Condensate (C+C) as “Crude oil.”
A survey that the EIA did last year estimated that 22%, or about 2 million bpd, of US Lower 48 C+C production consists of condensate (45 API +). And about 40% of US Lower 48 C+C production exceeded the maximum API Gravity for WTI crude oil (42 API Gravity).
My “Condensate Con” comment:
http://econbrowser.com/archives/2016/01/world-oil-supply-and-demand#comment-194595
Hi Jeffrey,
One cannot know how that bar from 40 to 45 API is divided, it might be that 5% is 43 to 45 API or it might be more, we don’t really know, many people put the condensate dividing line at 50 API. Tapis is a high quality crude traded in Asia with an API of 43 to 45, it is notconsidered condensate.
https://en.wikipedia.org/wiki/Tapis_crude
The article below also puts the dividing line at 45 API or higher for condensates, so if the US output was 9.5 Mb/d and 22% was above 45 API, that is about 2.1 Mb/d of condensate, this can be exported to Canada where they need it to dilute the oil sands so it will flow in pipelines.
http://www.ogfj.com/articles/2012/10/fifty-shades.html
There is actually no exact definition of condensate and its API gravity threshold.
“On Oct. 3, the U.S. Energy Information Administration … held a closed-door “Condensate Workshop” for officials from several government agencies and experts from the industry in an effort to come up with a new and more consistent definition.”
“Some experts have suggested that the federal government define condensates as any hydrocarbons that are liquid at standard pressure and temperature and have an API gravity of more than 50 degrees.
Hexane has an API gravity over 80, pentane over 90 and butane over 110, which are all well above the suggested 50-degree threshold.”
http://www.reuters.com/article/us-condensate-usa-kemp-idUSKCN0HZ03220141011
[My comment: butane is certainly not included in condensate. Normally it would be pentane+]
———————————–
“The API gravity of condensate is typically 50 degrees to 120 degrees. ”
(from Schlumberger glossary)
http://www.glossary.oilfield.slb.com/en/Terms/c/condensate.aspx
———————————–
“Condensate gravities range between 50° and 70° API.
Light crude oils have an API greater than or equal to 45°.”
https://www.e-education.psu.edu/png520/m18_p6.html
——————————
“Refiner Phillips 66 and midstream giant Plains All American (PAA.N) have said condensate is oil with an API gravity of 45 or above. Meanwhile, Marathon Petroleum Corp’s top executive said in a recent interview he believed condensate should have an API gravity of 60 and above. ”
http://www.reuters.com/article/us-oil-condensate-idUSKCN0HX0BU20141008
———————————–
“Condensate is a very light hydrocarbon with an American Petroleum Institute (API) specific gravity of greater than 50 degrees and less than 80 degrees. ”
http://info.drillinginfo.com/what-exactly-is-condensate/
—————————————-
“Anything above 45 degrees API can be considered condensate, depending on who you ask. Some of the stuff pouring out of wells in Texas, North Dakota, and Colorado is coming in at a range of 50 to 60 degrees API.”
http://blogs.wsj.com/corporate-intelligence/2014/06/25/what-is-condensate-introducing-americas-new-oil-export/
———————————————
“The API gravity of lease condensate ranges between 45 and 75 degrees”
http://petrowiki.org/Gas_condensate_properties
———————————
Hi AlexS,
Thanks. So in summary, most industry observers would consider condensate as liquid with an API gravity above 45 degrees, though the choice of the low point varies from 45 to 60, with 50 often cited.
Above 50 is condensate with so very few exceptions they aren’t worth considering. Don’t fret so much over it, set it at 45.
Matt Mushalik,
I’m a little uncertain about the figures because your link takes you to a page, under the heading Natural Gas, titled Natural Gas Liquids Lease Condensate. To me, “lease condensate” means wellhead condensate and that is not associated with NGLs; condensate also comes out at the NGL-separation stage down the line. If it is the latter that the chart refers to, then the figure is not total production of condensate but only that recovered from the NGL stream.
Somebody help?
“At the end of November, roughly 36 mb of oil, of which 67% was condensates, was floating in 18 tankers.”
Source: IEA Oil Market Report, December 2015
Iranian oil in floating storage
source: http://money.cnn.com/2016/01/18/investing/iran-sanctions-hoarding-oil-prices/index.html
“With no clear timeline for a restart at petrochemicals producer Dragon Aromatics, one of Tehran’s key condensate buyers, after its April fire, Iran hoped new buyers in South Korea, Japan as well as in China would pick up the slack, traders said.
The CNOOC-Shell petrochemical plant in southeastern Guangdong province could also be a replacement buyer for condensate, they said. The plant was forced to drop a regular supply pact in mid-2012 when the European Union put an embargo on trading Iranian oil.”
http://www.reuters.com/article/2015/12/03/us-china-iran-oil-idUSKBN0TM0CN20151203
“Iran may roil global oil markets with plans to sell about 45 million barrels of fuel stored in tankers in the Persian Gulf within three months of the removal of sanctions on its economy, according to analysts.
Most of the stored oil is condensate that contains a sulfur compound, which complicates sales because many refineries can’t process it, said Victor Shum of IHS Inc. and Robin Mills at Dubai-based Manaar Energy Consulting. To market this large amount of oil within three months — the equivalent of about half a million barrels a day — Iran will have to resort to offering deep discounts, they said.”
The condensate … is pumped from the offshore South Pars natural gas deposit.
Iran may need to spur sales of its sulfur-heavy condensate by offering discounts of at least 10 to 15 percent, Shum said. Its main condensate customer, Dragon Aromatics Zhangzhou Co. of China, stopped buying after a fire at its plant in April and an Iranian refinery designed to use it won’t be ready until 2017, causing stockpiles to build, he said.
“There will have to be a major impact on the market of selling that condensate,” said Manaar Energy’s Mills, who worked for Royal Dutch Shell Plc on projects in Iran from 1998 to 2003. “If they’re already having difficulty shifting it, adding another half million barrels will be even more difficult,” he said by phone. “They’ll manage, but at what discount?”
http://www.bloomberg.com/news/articles/2015-10-29/iran-seen-jolting-oil-market-with-90-day-supply-after-sanctions
Petrobras is in pretty deep doo doo, and will likely fold, as a business enterprise, unless the price of oil rises sharply and soon.
http://www.usatoday.com/story/money/markets/2016/01/23/riskiest-oil-stock-in-world/79105742/
Can the Brazilian government bail’em out?
Maybe.
Maybe Fred Maygar will chip in on this question. He knows a lot about Brazilian politics.
They don’t have to fold. They simply have to shut in 700,00 BOPD. That will raise prices so they can go through the hoop.
API: Oil and natural gas drilling down by half in fourth quarter 2015
http://www.api.org/News-and-Media/News/NewsItems/2016/Jan-2016/API-Oil-and-natural-gas-drilling-down-by-half-in-fourth-quarter-2015
WASHINGTON, January 19, 2016 – Estimated total U.S. oil and natural gas well completions fell by 51 percent in the fourth quarter of 2015 compared to year-ago levels, according to API’s 2015 Quarterly Well Completion Report, Fourth Quarter.
Estimated development oil well completions in 2015 fourth quarter fell 55 percent compared to 2014 fourth quarter estimates. Estimated development gas completions decreased 37 percent over the same period.
For 2015, total well completions decreased 35 percent overall compared to 2014 levels. Oil completions were down 37 percent and natural gas completions were down 28 percent). Total footage drilled was down 27 percent overall.
From your link:
“We can’t expect that growth to continue if our own outdated energy polices stand in the way. Reducing unnecessary regulations and speeding up permitting on federal lands will help U.S. producers to compete effectively in the global market under the low-price environment.”
Typical. They are blaming it all on the federal government. If the government would just get out of the way and allow them free drilling on federal lands, that would fix the problem. Hell, if the government would just get out of the way and allow them free access to government lands then they could produce more and drive the price down further.
These right wing nut cases really piss me off sometimes. It is always the governments fault. All their problems would be solved if the government would just get out of the way and let them do as they please. Then all our nations problems would be solved. The rich would get richer and the poor could just go to hell.
“They are blaming it all on the federal government. If the government would just get out of the way and allow them free drilling on federal lands, that would fix the problem”
I agree. They are losing money on the private lands, but they hope to fix this if they are allowed to drill on the federal lands.
Yes, I wonder where all the US federal locations are that work at $26-32 WTI and $2 HH?
I read somewhere that there is enough federal lands open to drilling that it’d take a decade to get through it all. I guess the problem is they need a couple decades worth and they need it now not later. Typical right wing (which basically means big business these days) campaign to try and manipulate perception of current events to try get what they want.
The true irony is that right wing is almost totally small business. Long ago, big business became left wing because they had to get along with their unions. In general, big business is NOT right wing. Start by listing the biggest: Apple, Google, Facebook, almost the entirety of silicon valley. GE gives mostly to democrats. So do the Wall Street Banks (all of New York City has a special relationship. For example, while Jews are 3% of the population, they are over 60% of Wall Street Executives). What is Hollywood, which has the the movies to promote agendas? What are most of the Newspapers? NY Times, Washington Post, LA Times, Chicago Tribune, etc.? How about the mainstream media? All left. But, go ask the small businesses with 2 to 100 employees – they are mostly right wing. They want lower taxes and less government interference.
Hi Clueless,
Not sure there is actual evidence that most small businesses are right wing, a nice story though. Most small businesses set up their businesses so that profits are zero (if they are privately owned). Any profits are paid out to the business owners as bonuses and they are taxed on their personal income just like everyone else.
Perhaps these small business owners think that everyone but them should pay taxes or perhaps they think that capital gains and dividends should not get special tax treatment, I agree with that position and that tax shelters favoring the wealthy should be eliminated from the tax code.
Hi Ron,
I hear ya, loud and clear, and have NO DESIRE to argue this point.
BUT I hear the same sort of bullshit from hard core people on the left, who blame all our troubles on ” GRRREEEEDDDDYYY BISNESSMEN”.
It’s just a talking point handy for rallying the unthinking foot soldiers.
Come to think about it, the foot soldiers on either side are generally not capable of much thinking. If they were, they would not be true believers in socialism on the one hand, or unbridled capitalism on the other.
Mac, what you missed in the story was the irony! They are losing money because way too much oil and gas is being produced. But if the government would just get out of the way and allow them to produce more then that would fix the problem.
Do you not see the irony in that argument? And just when, from the left, have you ever heard such nonsense?
Another example of irony is you saying that you “have NO DESIRE to argue this point” then you proceed to argue the point.
Why do these silly ironic arguments always come from folks on the right? 😉
I think it is because they are not really arguments the way the average person thinks of arguments. The goal is always to erode the power and control of the government. They throw everything regardless of how non-sensical ironic or whatever at this issue and use this prescription because solving whatever problem they are supposedly addressing is only secondary to them. Damaging the governments ability to function is the objective. Undermining the government’s legitimacy is the goal.
From the left, it is generally a question of problem solving. There is a genuine effort to analyze the situation and arrive at a solution (I’m not talking about actresses here Mac but policy experts) and often, government is looked at as the logical perhaps the only tool capable of performing the necessary function.
The right, with their mindset assumes that the goal of the person on the left is to expand the government. THis is projection. Because their goal is the opposite. To hobble or delegitimize the government. But expanding the government is not the goal of most people on the left. It is simply a consequence of trying to problem solve since most of the problems that attract the attention of people on the left require collective action to solve and government is the primary tool with which a modern society achieves collective action.
I think this is why we are always talking past one another.
The left has a pretty wide range, they can include a centrist like Clinton all the way to hard core murderous thugs like Fidel Castro.
I guess in your view, a democratically elected Marxist socialist like Salvador Allende, is much worse than a hard core murderous right wing dictator and thug like Augusto Pinochet because Pinochet proclaimed himself anti communist?
Yes, Pinochet was much better than Allende. Once communists get in power they proceed to destroy democratic institutions, put in place a censorship, a system to repress the people, including concentration camps, mass murder and terror are used if needed, and on top of that they destroy the economy. The system decays, and entrenches a corrupt oligarchy which is incredibly hard to dislodge.
Pinochet types on the other hand give up power.
This is why you find people like me who have suffered horrors under communism, and are quite willing to decapitate communists and mount their heads on spikes if the need truly arises. I’m not prone to violence, but it should be clear that communism is a cancer which needs to be fought with resolution, and to the death if necessary.
Any one who can, with a straight face, claim that Pinochet was much better than a democratically elected president whether or not that president was a self identified Marxist, is simply not capable of rational thought because of purely idelogical blindness!
Ah yes, good old Pinochet. What, 35,000 victims: 28,000 tortured, over 2,000 executed, and over 1,000 missing plus 200,000 or so people who suffered exile and God only knows how many went through clandestine centers and illegal detention including my best friend and his wife. She was held and tortured for two years for the crime of being a university professor. What a sweat chap General Pinochet was. My friend is a mining engineer and could never figure out his “crime” other than being married to an academic.
State folks like Pinochet couldn’t have got anywhere without a whole lot of dupe, mindlessness, compliance and acquiescence. What a sorry lot.
That is indeed true Fernando, and in a healthy polity, the right would include a broad spectrum as well since is should be a healthy natural counter-balance to change initiated by folks on the left. But here in the U.S. the right, that is the conservative impulse has been co-opted by The Radical Right, Movement Conservatism, a fringe group in the time of Eisenhower et al. Perhaps this condition is temporary. Being taken to its logical extreme with the likes of Cruz and Palin maybe it will have to fail spectacularly before the portion of the population who gravitate towards a conservative world view can organize themselves around a rational set of principles. But we appear to be a long way from there right now.
Hi SW,
The reasonable Rebublicans got voted out of the Republican party and most of the reasonable Republican positions have been adopted by the majority of Democrats, there are a few Democrats out there on the fringes arguing for crazy policies such as a National Healthcare system (already adopted by almost the entire OECD, except the US). Only a few crazies though, most stick to the party line that change for the better is too divisive.
Hi Fernando,
Clinton would be on the right in Europe (or at least the center). She is arguing against a national healthcare system, which would hardly be on the left in most European nations.
Now if this were the 19th century, Clinton might be considered on the left.
She is arguing against a national healthcare system, which would hardly be on the left in most European nations.
No, she very strongly supports the so called “Obama care” program, which is a national healthcare program. What she does not support, and Sanders does support, is a “single payer”, system.
A single payer system is what Canada and almost every European nation has. It is what I favor also because it cuts out the middle men, the insurance companies.
The insurance company mark-up is what makes our current system so damn expensive. Did you know Medicare is not allowed to ask for bids for drugs as the Veterans Administration does. That is because the pharmaceutical company lobbyist wrote the damn bill. The insurance companies and Big Pharma has our congress bought and paid for.
Well, there is a few others who own a piece of our congress also, like the NRA.
A single payer system is what Canada and almost every European nation has. It is what I favor also because it cuts out the middle men, the insurance companies.
Ditto! Same in most civilized societies. In Brazil, basicl health care is considered a human right. Every one is entitled to basic health care if they need it, for free!
Obviously if you are wealthy you can purchase personal care as much as you like. But that, like checking into a five star hotel or flying first class are luxuries that you pay for…
Yeah, good point. I’m not sure if any current candidate other than Bernie Sanders even comes close to being left of center. In Europe Clinton would be considered right wing. As for the current crop of Republicans they are mostly just a bunch of ultra right wing neo fascists.
Kasich is nice. So is Paul.
No,I haven’t missed the irony. I said I hear ya, loud and clear. In the vernacular of the American common man, this means I AGREE WITH YOU.
I doubly pointed out that I agree by saying I have no desire to argue YOUR point.
My point, a different point, is that both sides display the same sort of hypocrisy.
You are very much like everybody else, and remember what pleases you, they call it confirmation bias. You overlook anything that tends to contradict your own bias. So do I .
I suppose you have forgotten the speeches made during the recent “occupation ” of Wall Street, etc?
You haven’t heard HRC rail about the big banks, and how she is going to put a whupping on them, and make them roll over on their backs, and pee themselves, when she gets to be prez? She uses somewhat more restrained language, but the message is more or less the same. Only the naive take it to heart, literally, in either case.
Ask a republican what he thinks about somebody putting a garage or machine shop down the street from HIS house, and you will find out INSTANTLY that he DOES INDEED believe in government. He also probably believes in locking up kids for smoking pot, unless they happen to be HIS kids.
I have wandered from one end of the political spectrum a couple of times, round trip, over the course of my life. I am pretty much in the middle now, and plan to vote for Bernie if he gets the nomination. I have said so before.
Could it be that I am ( gasp!) a liberal, going around posing as a conservative ? Maybe I just think of myself as a conservative as a matter of HABIT, this being evidence of cognitive dissonance on my part?
A Darwinian explanation ( the evolutionary theory of psychology) of human behavior works extraordinarily well in describing and understanding how and why we act.
We are born liars, evolved liars, HABITUAL LIARS, from the top of the heap right on down to the flies that look like wasps. Conservatives lie, liberals lie, preachers lie, environmentalists lie, the Koch brothers lie.
I tell a few myself from time to time but so far none today, unless I have forgotten them already. LOL.
Key point that no one has noted so far. The API release mentioned “unnecessary regulations AND federal….”
“Unnecessary regulations” is a separate issue from opening more federal lands for drilling. It’s about reducing regulatory requirements (and related COSTS) for fracking, produced water disposal, EIR’s, special off-shore BOP’s, spill-containment, new rail cars, pipe lines, etc. Regardless of how MUCH oil the API’s members produce and sell, if they can reduce COST per barrel, they are more profitable in the low-cost-oil environment. Their members don’t care about producing more OIL, just making more PROFIT (or at least losing less).
Google Venezuela news, and the state of that unfortunate country becomes clear , very quickly.
It seems very likely to me that there will be some sort of revolution there, within the year. Oil production may crash to very close to zero.
I have no idea how long it might take to recover. Even if the goverment stabilizes, and the country remains calm, it will take a good while before anybody much will risk his money in Venezuela, and a good while after that to get the oil flowing again.
The government owes several times what it is taking in. The only debts, apparently, that have been paid recently are those relating to government bonds, and default on those appears to be in the cards, within the year.
Nobody in his right mind ships anything to Venezuela these days expecting to be paid for it later.
Venezuela will be not unlike Syria, Iraq, Afghanistan or Somalia in very short order. Much of the region will soon follow.
The region is fine. Venezuela is highly unstable.
The news I hear late Saturday early Sunday:
1. they are shipping seven tons of gold to an airplane, extracted from the national bank vaults.
2. Cilia Flores, the president’s wife, and Diosdado Cabello, former National Assembly president, were visiting generals around the country. Bocaranda says the president told the defense minister to take away sidearms from army officers. I don’t know if the order was obeyed (note: it’s well known the Cubans have military embedded in the Venezuelan forces, they also have secret agents inside ready to murder officers as needed, thus a coup will take place executed by Cuban moles).
3. Several statements issued by Cabello, Maduro, and other communist leaders saying the National Assembly “isn’t needed”.
@Fernando
The region is fine?
44 of the top 50 cities for highest murder rates are in South and Central America. The region is a mess in so many ways I don’t know where to start.
https://en.wikipedia.org/wiki/List_of_cities_by_murder_rate
The region isn’t about to be like Somalia or Syria. Relax.
Saw an article over at insideevs.com a few hours ago, as sales data for December 2015 from various countries continues to trickle in and decided to do a little digging. Here are some titbits that some people might find interesting.
With the worldwide, year to date plug-in sales standing at 447,617 at the end of November, adding the December sales data from the US, the Netherlands, China (BYD only), France, Norway, Denmark and Australia, the 2015 total comes to 495,504. With no data yet from Japan, Germany, the UK, Canada and the rest of the world, the approximately 4,500 needed to take the total to over half a million should be easily reached. That would make the total plug-ins sold worldwide for 2015 more than 60% greater than the 320,713 total for 2014.
The amount of plug-in vehicles produced in China in 2015 of which, less than two thirds are passenger cars, exceeded the total amount of plug-in in vehicles sold worldwide in 2014.
Based on data from the Monthly Plug-In Sales Scorecard at insideevs.com it should be safe to say that cumulatively, over a million plug-in vehicles have been sold worldwide since the latest wave of plug-in vehicles went on sale starting in December 2010. Actually in looking for the answer to the question I pose in the next paragraph, I found that this number was passed last September:
Global Sales Of Plug-In Electric Cars Hit One Million
What I want to know is, how many of these plug-in vehicles will it take to reduce demand for oil by a million barrels per day? Except for China, I think it is safe to say that most plug-ins that are sold will be displacing an ICE powered vehicle. A quick search brought up the following:
How Will Growing EV Demand Affect Oil Demand?
Could mainstream electric vehicle adoption result in a significant drop in crude oil demand? While some impact would of course be expected with large-scale adoption, could the impact be larger than is currently supposed?
An interesting new article published over on Seeking Alpha explores these questions, and provides in-depth descriptions of some interesting possible scenarios.
According to the analysts over there, roughly 39 million electric vehicles (EVs) and plug-in hybrids (PHEVs) will be on the roads in the US by 2030. A fleet of this size would lower gasoline consumption by around 17.2 billion gallons a year (the electrics would use about 180 terawatt-hours of electricity a year instead).
So, based on that article, some simple arithmetic suggests that a million plug-ins could reduce oil demand by 1.2 million barrels per day. My gut tells me that figure is high. What do others think?
Below is the article that started me on this track:
Netherlands Shocks With Nearly 16,000 Plug-In Electric Car Sales In December!
The cause?
The surge of sales in late 2015 isn’t a natural phenomenon, but related to some tax rebate cuts beginning January 1, 2016,
All-electric cars remain at 4% tax (so no rush in sales here), but plug-in hybrids move from 7% to 15% (non-plug-in stand at 21-25%) – note the surge (pictured left) in extended range sales in December.
It’s also amplified by new models and new versions of existing models (like Mitsubishi Outlander PHEV).
Anyways, we are fairy confident that the year 2016 will begin badly in comparison to 2015’s end for plug-in car sales in the Netherlands.
I believe the typical auto here in the USA is driven enough that the average gasoline consumption per car is very roughly a gallon a day, being actually around seven to eight gallons a week.
So – It would take about forty cars to save a barrel of oil per day. It would take close to three barrels of crude to make that much gasoline, but we can assume the fraction of the crude that becomes gasoline can be used for other purposes, and ignore this factor, for purposes of this discussion. Forty million pure electrics and or plug in hybrids could easily save us a million barrels a day. The savings would probably be greater, because these would be new or at least newer cars, and the newer a car is, the more heavily it is used.
Let us suppose we subsidize the construction of forty million pure electric and or plug in hybrids to the tune of 5000 bucks each. That would be about 200,000, 000,000 bucks. Real money, even by the standards of Washington politicians!
BUT – if we assume oil goes to one hundred bucks, and stays there, which seems ENTIRELY possible from my pov, a few years down the road…………. well then …….. hmmm…..
A million barrels at a hundred bucks is a hundred million dollars A DAY that would STAY HOME, rather than line the pockets of people in oil exporting countries, people who are not really and truly our friends, in most cases.
We would save a billion dollars on imported oil every ten days. This billion could stay home, providing local jobs. This thought experiment looks at first glance as if it might be a pretty good deal, taken all around.
Any reduction in the consumption of a commodity tends to force the price of that commodity DOWN. There would be a huge additional savings as the result of gasoline selling for LESS.
If oil spikes up hard and sharp, it is not unreasonable to believe that Volts, Bolts, Leafs, Tesla Threes etc will all sell like ice water in hell within the decade- assuming the batteries give service comparable to the COMBINATION of IC engines AND automatic transmissions.
There will be many other pure electric and plug in hybrid models as well, because just about every large manufacturer is committed to building electric and plug in hybrid cars. These cars will be on virtually every new car lot all over the country within the decade.
Forty million electrified cars and light trucks within fifteen years ? It could happen.
Range anxiety is something the driving public will eventually forget about. People who need long range will buy plug in hybrids, or a Tesla pure electric, or rent a conventional car for a trip, if they don’t own both an electric AND a conventional car.
I believe that 60-65% of every barrel refined ends up as gasoline, not 33%.
In 2014 USA refineries produced an average of 46% gasoline per barrel of crude.
Crude from each different locale varies widely in the gasoline fraction.
It depends on the amount of gasoline consumed by these plug ins. The USA has vehicle efficiency goals which should increase fleet fuel efficiency, it’s fairly easy to assume this efficiency is reached, and compare that to today’s consumption rate. My conclusion is that refinery owners should be prepared to export refined products to countries with a growing population and increasing gasoline demand. I don’t expect there will be ANY refineries built in the OECD in the future.
US gasoline consumption was 137 bn gallons in 2014
https://www.eia.gov/tools/faqs/faq.cfm?id=23&t=10
39 million EVs in 2030?
But this 2011 study
http://www.cargroup.org/assets/files/ami.pdf
assumes that in 2025 there will be 44 million light vehicles more on the road than in 2009
So where is the reduction in gasoline consumption?
“So where is the reduction in gasoline consumption?”
Excellent point, Matt!
All such arguments should be stated with the caveat “everything else held equal”.
The saving of the million barrels would be real, but sight of it would be lost in the noise.
However high consumption is at that time, it would be ANOTHER or ADDITIONAL MILLION barrels per day HIGHER, without the hypothesized thirty million electrics in the fleet.
Hi Matt,
From
http://www.rita.dot.gov/bts/sites/rita.dot.gov.bts/files/publications/national_transportation_statistics/html/table_01_11.html
US 4 wheeled vehicles (passenger cars and other 4 wheeled vehicles(1970-2006), and long and short wheelbase light duty vehicles (2007-2013), remained relatively flat from 2006 to 2013, so the 2011 study looks to be wrong if the trend of the past 7 years continues.
We may have reached “peak 4 wheeled vehicle” in the US, if so the 39 million plugin cars replace ice vehicles. The European Union (especially the early 14 members) has also probably reached peak car. I will let someone more familiar with Eurostat dig up that data.
In addition, fuel economy in the US will move closer to European levels when fuel prices increase, so there will be a significant reduction of US oil demand from both of these trends.
This will not be enough to offset increased demand from emerging economies so oil demand will remain robust over at least the next 20 years and oil prices will be high by 2018 (back to $100/b or more). This might drive demand down a bit and speed the transition to non-oil transportation.
I believe the typical auto here in the USA is driven enough that the average gasoline consumption per car is very roughly a gallon a day, being actually around seven to eight gallons a week.
So – It would take about forty cars to save a barrel of oil per day. It would take close to three barrels of crude to make that much gasoline, but we can assume the fraction of the crude that becomes gasoline can be used for other purposes, and ignore this factor, for purposes of this discussion. Forty million pure electrics and or plug in hybrids could easily save us a million barrels a day. The savings would probably be greater, because these would be new or at least newer cars, and the newer a car is, the more heavily it is used.
Let us suppose we subsidize the construction of forty million pure electric and or plug in hybrids to the tune of 5000 bucks each. That would be about 200,000, 000,000 bucks. Real money, even by the standards of Washington politicians!
BUT – if we assume oil goes to one hundred bucks, and stays there, which seems ENTIRELY possible from my pov, a few years down the road…………. well then …….. hmmm…..
A million barrels at a hundred bucks is a hundred million dollars A DAY that would STAY HOME, rather than line the pockets of people in oil exporting countries, people who are not really and truly our friends, in most cases.
We would save a billion dollars on imported oil every ten days. This billion could stay home, providing local jobs. This thought experiment looks at first glance as if it might be a pretty good deal, taken all around.
Any reduction in the consumption of a commodity tends to force the price of that commodity DOWN. There would be a huge additional savings as the result of gasoline selling for LESS.
If oil spikes up hard and sharp, it is not unreasonable to believe that Volts, Bolts, Leafs, Tesla Threes etc will all sell like ice water in hell within the decade- assuming the batteries give service comparable to the COMBINATION of IC engines AND automatic transmissions.
There will be many other pure electric and plug in hybrid models as well, because just about every large manufacturer is committed to building electric and plug in hybrid cars. These cars will be on virtually every new car lot all over the country within the decade.
Forty million electrified cars and light trucks within fifteen years ? It could happen.
Range anxiety is something the driving public will eventually forget about. People who need long range will buy plug in hybrids, or a Tesla pure electric, or rent a conventional car for a trip, if they don’t own both an electric AND a conventional car.
Electrification of the personal auto is not going to save the life of Old Man Business As Usual, but it WILL keep him out of the cemetery for a few additional years, with a little luck.
My apologies to all for a major brain fart on my part. Looking over the article again, I realized that it said, “A fleet of this size would lower gasoline consumption by around 17.2 billion gallons a year.” I did my arithmetic without taking proper notice of that and came up with “a million plug-ins could reduce oil demand by 1.2 million barrels per day“, the error with units meaning my figure was of by a factor of 42. Now that I have realized my error, everything makes more sense and as said by OFM the average plug-in has the potential to save about a gallon a day.
According to the EIA, “Refineries in the United States produced an average of about 12 gallons of diesel fuel and 19 gallons of gasoline from one barrel (42 gallons) of crude oil in 2014.” So, it would take about 19 million plug-ins to reduce oil consumption by a million barrels per day, assuming consumption of diesel goes down by a similar amount.
I did a little extrapolation based on the worldwide growth rate between 2014 and 2015 and came up with a doubling period of 18 months so, if the fairly modest growth rate of about 4.37% per month continues, the 19 million figure should be achievable within 70 months, less than six years. So plug-in vehicles have the potential to reduce world crude oil consumption by a million barrels per day over the next six years.
I am fully aware that a black swan event could happen at any time and make that extrapolation hopelessly optimistic. On the other hand other developments could accelerate the pace of EV adoption and make the 19 million very conservative. Who knows? The thing is. as OFM points out every chance he gets, a very small oversupply of something for which no storage is available, can cause the price to fall dramatically.
“Who knows? The thing is. as OFM points out every chance he gets, a very small oversupply of something for which no storage is available, can cause the price to fall dramatically.”
Likewise, a small reduction in consumption, when supplies are tight, can prevent the price from RISING dramatically.
If fifteen or twenty years from now we are compelled to get by on domestic production, maybe supplemented by some coal to liquids, and some biofuels, forty million electric cars might keep the price of gasoline from shooting up from say six or eight bucks a gallon, to double that, by reducing consumption.
Personally I BELIEVE in peak oil, and I BELIEVE in EXPORT LAND. We may never be able to pay six or eight bucks, but otoh, maybe we WILL.
Hi OFM,
At 6 to 8 dollars per gallon we would see people move to European levels of fuel efficiency rather quickly, at 10 to 12 dollars per gallon we might see rapid adoption of EVs and plugin hybrids. The increased demand from developing economies and the eventual peak in output around 2023, is likely to result in oil prices being $150/b or more by 2025.
A price of $150/b would get us to $5/gallon (assuming no tax increase), and $200/b gets us to $6.40/gallon, assuming at $100/b the gasoline price was $4/gallon and that the non crude costs are fixed (probably not a realistic assumption). We don’t get to $9/gallon until crude oil is over $300/b (given the fixed refining, distribution, profits, and taxes assumption).
It will be interesting to see how high oil prices can go, in the past growth slowed with oil spending over about 6% of total World GDP, but with more fuel efficient vehicles, this rule of thumb may not apply.
Judging from Europe’s experience, very high fuel prices ($8/gallon) do not result in a big move to hybrids and EVs. Not sure things would be much different in the US, except our public transportation is much worse so we may be more sensitive to high fuel prices here in the US.
Europe has not rushed to EVs even having survived $8+ fuel for some years for a range of reasons. First, we are used to high prices. The policy of high taxation on fuel has been Europe wide for nearly 30 years. In fact, at least in the UK, the tax rate on fuel peaked in 1999 and has been in slow decline since, as governments found it impossible to raise tax at the same time as rising prices. This high tax has been hugely beneficial to the European economy, as it offset the taxes needed to pay our social services, like universal free health care. So, when oil went from $20 to $120, the price at the pump less than doubled. We learned to cope. We have been driving steadily more efficient vehicles for the last 30 years, and fuel consumed is a relatively small part of the overall cost of owning the vehicle – insurance costs , servicing, purchase prices , sales taxes, and excise taxes are all high, and as we drive fewer miles on average, and have fewer cars per capita, with the option of public transport at least in urban areas, we absorbed the extra cost instead of buying into untested technology with well documented drawbacks. (mostly range and cost and unknown battery lifetime).
The £5000 ‘subsidy’ each EV attracts in the UK is largely a con – as the average sales tax on that same EV is about £5000 – in other words, the government is simply failing to take its cut and not forking out a penny of actual money. In Europe, new cars are bought by relatively wealthy people and by employers and car hire fleets. For this demographic, fuel efficiency is relatively low on the list of new car attributes, the rich will always be able to afford gas guzzlers. These cars are traded on, usually at 3 years old, to the next most wealthy demographic, and so on down the income scale as the car ages. The people who most need fuel efficient cars are the people who never buy a new car.
EU is going big into EV’s, says Inside EV’s.
http://insideevs.com/plug-in-electric-car-sales-expected-to-grow-by-652-in-europe-through-2021/
http://insideevs.com/plug-in-electric-car-sales-in-uk-sets-record-market-share-of-1-7-in-december/
http://insideevs.com/netherlands-shocks-with-nearly-16000-plug-in-electric-car-sales-in-december/
It would appear that the European love-affair with “clean” diesels is over, at least for now.
I plan to buy electric, reserving my ‘clean’ diesel as a second family car, and for long journeys or larger loads. I have been planning this for a couple of years.
UK awards £40 million in funding to boost EVs
The U.K. Department of Transport has announced the winners of the Go Ultra Low City Scheme, which aims to encourage the use of low emissions vehicles. The main winners are the cities of London, Bristol, Nottingham and Milton Keynes, which are developing projects that encourage drivers to switch to plug-in electric cars. A smaller part of the funding will go towards projects in other U.K. regions, mainly in the north-east of the country.
London received £13 million to create “Neighbourhoods of the Future,” which prioritizes ultra-low emission vehicles (ULEVs). Projects include streets that utilize car-charging street lighting and low emission zones offering parking and traffic priority to owners of plug-in vehicles.
Regarding continued drilling:
“Why drill and defer completions? Because six rigs are contracted for a long term. There are three options typically: to keep drilling; to send an early termination note; or go “IBC” (idle but contracted – i.e. pay the IBC dayrate). Keep drilling may not be the worst of all alternatives, actually. I sense that two rigs will be early terminated. I am not sure if any additional will be.”
This from a comment by Richard Zeits under an article by him about Whiting.
http://seekingalpha.com/article/3821456-whiting-petroleum-expect
This was a big question around here at one time.
I never had much doubt drilling and deferring completions was a viable option. Companies with deep pockets can do it and hold completions for up to three years as long as they get all the required permits and approvals to do so.
Hi Fernando,
For those without deep pockets and if they have a large inventory of DUCs, would it not make sense to conserve cash and stop drilling new wells? I am probably missing something here, there seem to be a lot of players that do not have deep pockets who continue to drill new wells, I just do not understand this behavior, what am I missing?
Maybe they have lenders with deep pockets? A lender may see a profitable move if the owner is willing to risk it. Think about it this way:
Joe the Fool comes to you, wants to borrow $4 million to drill, but says he’ll leave the well sit until prices go up. You lend $4 million at x % with a balloon payment for the interest, say $1.5 million, due in about 3 years. The loan is then paid as per standard terms. You also agree to finance the other $3 million to complete and hookup within three years IF oil price averages $70 per barrel for three months in a row. If you don’t get paid the balloon, you foreclose on the well.
Work out the numbers and tell me, if you have $200 million to lend, would you be that banker? Would you be Joe the Fool if you got the rig contract, the tubulars, and the employees you don’t want to lay off?
Hi Fernando,
The lenders are the fools, the loans will never be paid back and the well will not be sold for the amount it cost to drill and complete.
If the company goes bankrupt, the bank is left with an asset worth less than the loans outstanding.
So you are saying that the lenders are stupid, I think. They are lending money that is unlikely to be repaid, a huge risk.
The asset value depends on the oil price. What’s the probability it will be $90 per barrel on January 1, 2020? If the well is ready to produce in December 2019, will it make money?
Oh, if WTI could just climb back and trade in a $55-65 range for several years.
Probably the most fun we had was 2005-mid 2007. Seemed like a very high price at the time, yet costs did not go crazy. Second half of 2007 seems like when that started with costs and 2008 was horrible.
Seems to me this price range would be good for many. Gasoline would be in $2.25-$2.75 range in most states? LTO would maybe not crash and burn, but would have its ears pinned back some, maybe some more cautious approaches, some debt reduction and drilling from cash flow as opposed to debt.
One can dream, can’t he?
Shallow, for what it’s worth, many deep water, extra heavy oil, and marginal conventional oil projects I reviewed over the last five years need $90 plus per barrel to move forward. I reviewed these as a consultant, therefore I can’t discuss details.
My impression is that a lot of what’s on the shelf waiting to be developed requires high prices. The exceptions are in OPEC, Russia, and other countries where strategic considerations control the pace. Thus the price will, in a rough fashion, be dictated by these large player strategic needs. And I suspect they will feel more comfortable with prices above $80 per barrel. I think they will try as much as possible to stifle competition from marginal producers such as the USA and Canada, but to accomplish this all they have to do is try to keep prices in that 80 to 100 range.
Fernando-
You may be the right person to ask this. Would it ever make sense economically or practically for 25 degree oil to be blended with condensate to increase the value of the oil?
John, I am not an oil man but… I really don’t think so. When the oil is refined, and the different length polymers are separated, what you would get out would be 25 degree oil and condensate… and any other hydrocarbons that was mixed in with the 25 degree oil or condensate.
By mixing heavy oil with light oil you do not get medium oil. When you mix very long polymers with very short polymers, you don’t get medium length polymers. It don’t work that way.
John, it might under some special circumstances. I ran a project which mixed a 45 degree condensate into a 32 degree crude. Our simulations showed it was the way to go because the condensate came off a platform after separation at 800 psi. We ran that condensate to the separator inlet in a large oil treating platform, and the oil helped keep light ends in the liquid phase.
There are circumstances where the blend is done to reduce transport costs.
I don’t think you want to blend a condensate with a 25 API, but that just has to be studied. We do it all the time. Take the liquids and run them through the Linear Programing models for different refineries and you get an answer down to the penny. Is this a real case?
Thank you both for the answers. The reson for my question relates to explorers in the Falkland Islands. The Sea Lion field, discovered by Rockhopper, has oil and may come on production in 2020 or later. Borders and Southern has found a good size condensate field in the south Falklands. I was interested in learning if there would be a use for the condensate found by Borders.
In such a case the joint transport makes it obvious you blend. If the operstors and interests are separate they are compensated using an oil bank mechanism. This is used for joint pipelines in the Gulf of Mexico, the North Sea, etc.
I don’t think that Rockhopper development is viable. They probably need $80 per barrel, even if the get much lower CAPEX. I guess they could try buying a Petrobras FPSO if it becomes available, but the weather is much worse off the Falklands. A gas condensate discovery is likely less viable, plus they need to figure out how to get the condensate all the way to the Sea Lion FPSO.
A bit off topic: I left this comment at judithcurry.com , in a discussion about that blog’s content and design. I thought you may find it interesting. What I’m trying to do is have the climatologists use what I consider are more reasonable emissions pathways. Right now the climate change impact literature is loaded with the exaggerated emissions from very high fossil fuel resources. This makes the models overpredict future warming.
“My background made me focus on the CO2 and methane emissions projections, the carbon cycle, and the emissions pathways used by the climate model intercomparison projects.
As I have written, I am convinced the ongoing depletion of fossil fuels will lead to increasing prices, which dampens future demand. This isn’t reflected in the projections, which naively assume the supply is nearly endless. When the models (the IAMs) allow this inexhaustible supply we see projections such RCP6. The extreme model, RCP8.5, wasn’t able to achieve the specified forcing even though it was revved up with an incredible amount of coal and huge methane emissions.
I realize mine is a minority point of view, but as time goes by over the next two decades you will see fossil fuel prices increase much faster than inflation, and demand will indeed be dampened (by market forces, not by COP21). This means the “business as usual” emissions pathways are gentler than predicted.
I’m concerned that, at this point in time, this month, the IPCC is having meetings to decide on emissions pathways. The meetings and the submitted pathway specifications aren’t being discussed at all in blogs or any open sources that I know of. And I’m afraid the IPCC committees are so political they’ll will again have an extreme and unrealistic pathway they will nickname “business as usual” in reams of follow up “climate change impact” papers.
In conclusion: “Solving the climate change problem” has evolved into a political conflict, and this leads to the use of shoddy logic and demagoguery. The IPCC creates biased inputs for climate models using scenarios intended to back political propaganda, and they rely on the rather naive many of you have that fossil fuels are almost inexhaustible.
I propose this subject should be discussed once in a while. And since those emissions pathways specifications are being defined this month, there is an urgent need for somebody who sits in that committee to explain what’s going on.”
I agree with Fernando that rising prices and depletion make it likely that fossil fuels will not be burnt in the quantities projected in the climate models.
The climate scientists themselves so far as I can tell are not directly responsible for this situation. It seems it arises from political and regulatory considerations. They use the data they are TOLD to use.
ANY ONE agency associated with, or funded by government is often COMPELLED by law to use figures provided by OTHER agencies or organizations.
So- When I had a talk with a man who prepared a transportation plan for my local school system, he told me he was COMPELLED to use numbers provided by federal agencies, although these agencies are notorious for making in accurate forecasts. Failure to use these numbers would open him up to lawsuits alleging negligence and incompetence in the event his own figures turned out to be in error.
I have no doubt the climate science community is collectively willing to go along, in order to get along, and play the game. The opposition plays the game too, and sometimes it is necessary to fight fire with fire.
It is quite common for folks with good honest intentions to exaggerate the consequences of failure to listen to their advice. So we try to scare kids into not driving if they have a couple of beers, but the truth of the matter is that so long as they do not drive RECKLESSLY, they are damned unlikely to have an accident even if drinking. I have ridden in cars with drinking drivers thousands of times without being involved in an accident, personally. I hardly ever got in a car two times in a row back in my youth when the driver was strictly sober. BUT I stayed out of the cars of guys I considered RECKLESS, meaning they were habitual speeders, etc.
We tell parents these days that the risks of their kids being kidnapped is so high they have grown afraid to allow their kids to play in their own yards in nice neighborhoods these days.
Fear mongering is the name of the game these days, and everybody is playing the game.
Hi Fernando,
The peak fossil fuels (in the near term) view is not the mainstream view. There are many that believe that the coal resource is very large and that higher fossil fuel prices will make this resource very attractive.
For the mainstream case you would need to take at least my high oil and natural gas cases (which many mainstream observers would claim are much too low) and Steve Mohr’s high case (case 3). I believe we would be talking about 1700 Gb or so of Carbon emissions in a mainstream business as usual scenario. This is probably consistent with the RCP 6.0 scenario and RCP 8.5 is consistent with the cornucopian view point (which is pretty main stream thinking), here we think in terms of Kerogen extraction and technological innovation unlocking huge fossil fuel resources.
I agree with you that the cornucopian view is unrealistic, but my views are far from mainstream on the fossil fuel resource front.
The folks on this blog think I am an optimist, in the real world I would be considered excessively pessimistic with regard to fossil fuel resources.
I guess we would need someone with extensive knowledge of the coal industry to make better guesses of the coal URR, the best thing I have found on coal is Steve Mohr’s phD thesis. The work of David Rutledge on coal is a minority viewpoint.
Denis, the climate issue simulations seem to disregard the fossil fuel resources and the associated uncertainties. They started covering their asses a little bit with very low quality papers about a year ago, but to them this is a non issue.
I don’t even try to tell them what to use, merely try to introduce the subject. Their work, as it stands now, doesn’t pass the smell test. I even mentioned to one of them I felt it mas becoming a case of fraud or professional misconduct on their part.
Hi Fernando,
The RCP8.5 may be consistent with a Cornucopian view such as that of Michael Lynch, these guys argue with a straight face that fossil fuel resources will never run out, technological innovation will allow recovery average factors to be raised to 50% or even 75%.
These guys publish in very mainstream venues, rather than on obscure blogs and the views are widespread.
I agree with you that those views are incorrect and the RCP8.5 scenario is absurd, we will never recover enough fossil fuels to raise greenhouse gas levels to a CO2 equivalent above 600 ppm.
This is plenty to create climate disruption and is consistent with RCP 6.0.
The RCP8.5 is to show what happens if the Cornucopians are right about fossil fuel recoverable resources.
Whether there’s “climate disruption” or not is a different issue. I’m focusing on the ongoing CMIP6 specifications. I don’t trust their system (they already demonstrated they were willing to use a fraudulent approach for CMIP5), the reforme the only thing im hoping to achieve is another fraudulent process with rcp8.5-like pathways.
Given the model misties they have at this time I think eventually they will have to retune those climate models, thus making the drop to an rcp6 or lower a really critical issue.
wait, what?
Fernando Leanme says:
01/27/2016 at 4:50 am
“Hansen had to pull back his 5 meter paper. As far as I’m concerned they mounted a panic mongering industry.
My own estimate is about 630 ppm peak CO2. That doesn’t worry me as much as other issues, such as what do we do with a Muslim horde invading Europe while Angela Merkel sits there sucking her thumb, the decay of USA politics, Zika, Ebola and other diseases, or the threat posed by communism and other extremist movements.”
???
Humanity apparently generated +/- 200 ppm since 150 years in addition to the +/-200 ppm present before heavy use of oil/gas/coal. Since we are apparently at peak oil, let’s add 200 ppm + 0-100 ppm from remaining coal/gas to the current value.
I agree with 630 ppm peak CO2. Even sinple math can validate your estimation.
Fernando
FWIW you have my strong support in asking for close attention to forward projections of the rate of burning of fossil fuel.
Personally I do not think the already baked-in climate upheaval which is still to manifest, needs any exaggeration. And clearly atmospheric CO2 concentration will continue to increase for a while even in the face of any likely reduction in rate of burning. Even if the burning rate of fossil fuel peaks by mid-century along the lines estimated by Aleklett and/or Laherrere, CO2 will still for a time be added to the atmosphere at a rate greater than can be absorbed and sequestrated each year.
A question I would like to see addressed could be – “When will we see ‘Peak CO2’ and at what concentration?” My own rough calculations based on Aleklett & Lahererre suggest Peak CO2 of 560 ppm round the turn of this century, i.e. at something like double the pre-industrial concentration.
At the moment, Hansen’s suggestion of a perhaps 5 metre rises in global average sea level in as little as 50 years remains controversial but not easily dismissed. It would appear to me prima facie that his scenario would not be affected much if at all by a substantial reduction in the rate of CO2 emission likely to begin after mid-century.
In the following 22nd century and thereafter we would with any luck see a continuing reduction from Peak CO2 and other GHG, but it seems to me the big question for future generations and legacy civilisations is just how long atmospheric CO2 will remain above the current level of 400 ppm. It must be a mighty big and incredibly rapid warm pulse, whatever. The 400 ppm number appears to be the level last sustained for a lengthy period (equilibrated climate) ~3 million years ago when average sea level was probably 20 metres higher than present. Again FWIW, my guess is that sea level rise would be the least of a number of adverse effects that could be expected by then. And by then as you rightly imply the fossil fuel resources that enable current industrial activity and urban population will be very much reduced anyway.
best
Phil
Just keep in my folks, that poor people and poor countries as well as those who fall short on crude and nat gas, will burn coal. They will burn coal like they did in the 1920’s in Europe, and like they do now in China. India is planning to massively ramp up their coal use.
http://www.nbcnews.com/business/energy/developed-countries-turn-coal-india-fires-production-n493156
The same thing will happen in the wealthier places like the USA if we fall short on other fuels. Best thing we can do is reduce demand one way or another.
Should say- “keep in ‘mind’ folks”
Hansen had to pull back his 5 meter paper. As far as I’m concerned they mounted a panic mongering industry.
My own estimate is about 630 ppm peak CO2. That doesn’t worry me as much as other issues, such as what do we do with a Muslim horde invading Europe while Angela Merkel sits there sucking her thumb, the decay of USA politics, Zika, Ebola and other diseases, or the threat posed by communism and other extremist movements.
Those things worry me also Fernando. But I am far more worried about the threat posed by fascism than communism. Just look at the group of republican candidates for president, especially Cruz and Rubio. They are fascist to the core. It is the new American Fascist Movement, and it scares the hell out of me.
Ron, that’s because you haven’t lived in a communist dictatorship and I have. I’m also watching closely what they are doing to Venezuela, and the threat they pose in Spain.
The threat posed by a guy like Rubio is more associated with his ties to the Israel lobby and his potential willingness to make additional blunders. But Hillary is a lobby puppet too. On the other hand Rubio will put the clamps on Raúl Castro, and Hillary will aid the dictatorship and increase the threat level to the USA.
“A bit off topic: I left this comment at judithcurry.com , in a discussion about that blog’s content and design. I thought you may find it interesting. “
Why would you leave a comment at Judith Curry’s? She has to be one of the worst research scientists I have run across in any discipline. The denier side of academic climate science is filled with similar no-talents like her, including the AGW troll Richard Lindzen. I have recently taken apart Lindzen’s theory on the oscillation of upper atmospheric winds and the results indicate that he was unable to associate lunar forcing as a mechanism, even though he had been working the topic for 40+ years. http://forum.azimuthproject.org/discussion/1640/predictability-of-the-quasi-biennial-oscillation#latest
Cruz and Rubio are scary because they will likely listen to dullards like Curry and Lindzen.
Better stick to climate scientists on the smart side of the denial aisle. People like Pierrehumbert and Held and so on.
Sure, “take apart” the theories if that’s your thing, but you can’t “take apart” the official scientific data which shows global temperatures have continued their stable streak into the 21st century in spite of the now-infamous increase in CO2 gas. E.g., http://www.woodfortrees.org/plot/rss/from:2001/plot/rss/from:2001/trend/plot/esrl-co2/from:2001/normalise/offset:0.68/plot/esrl-co2/from:2001/normalise/offset:0.68/trend
I am taking apart the denialist scientists. They are the ones that made their own bed.
The news in Oz, is all about the huge snow storm in the NE USA, yet not one comment on here. Not interested either side of the climate change debate. More interested in how people are getting on. Survival/ mild disruption etc. Is it a news story, or a real story?
I assume it will be good support for the nat gas market, and a lessor extent for heating oil, though I did see headline, stating the recent rise in the price of oil, was due the up coming storm. I read that as a another lost journalist looking for a headline!
I hope everyone is safe.
Toolpush. Maybe no East Coast posters here.
It was unusual in that those of us in the “middle” didn’t get much of the weather.
I will say it is an unusual storm for the areas it hit. Also, it is major news because of where it hit, big population.
We have not gotten 3′ of snow, but have 1′-2′ before, and likely not as big of news since fewer people live here.
I do wonder about lower fuel demand as the storm shut down traffic.
And, as usual, anytime one of these hits Kentucky, people were stranded for about 20 hours on an interstate. Seems like that always happens in KY.
Thanks Shallow, Fred and OFM,
Interesting nobody from the NE commented. I know Dennis is up there some where. Maybe is is real bad and comms are down, but I don’t think so.
The picture on TV looks like a normal Russian or Nordic winter
Hi Toolpush,
The storm did not make it to where I live (it hit south of me). I always find it interesting how flummoxed people get by a little snow. I am a skier and look forward to it. In fact in northern New England there has not been much snow and the skiers from the north looked enviously at all that snow that was wasted on those down south that don’t know which end of a snow shovel to use. 🙂
I am also always surprised how many people get stuck on the highway in snow, the storm must come in quickly with lots of wind so people pull over. It is tough driving in snow and the roads should be closed down south in advance of the snow because many people can’t drive safely on snow covered roads.
Hopefully not many people have been hurt, I haven’t really paid attention.
toolpush,
In its recent weekly report http://www.eia.gov/naturalgas/weekly/, the EIA did not report the latest production, supply and storage data. This is the first time they have delayed the data according to my knowledge. My gut feeling is the consumption data will be at an all time high going far above 120 bcf/d and weekly draw could be as high as 300 bcf/d. Although stocks are still very high, the speed of stock draw over the latest weeks could be very interesting. In addition, the latest implosion of the high yield bond market does significantly impact US oil and gas production (see below chart). The gas market gets increasingly tight, yet for the big price spike it is probably too late this year. However, the situation improves by the month.
Assuming gross decline from existing US gas production is approximately 24%/year, or about 17 BCF/day per year*, the US would need about 6.2 TCF/year of new production in order to offset declines from existing wells. I put this number in the context of what the EIA showed for all countries in 2013 that produced 5 TCF/year or more of dry gas:
US: 24.3 TCF
Russia: 22.1
Est. US Gross Decline: 6.2 TCF
Iran: 5.7
Qatar: 5.6
Canada: 5.1
*Louisiana’s observed net rate of decline in marketed gas production (after new wells) from 2012 to 2014 was 20%/year
Jeffrey,
This is exactly my point. As shale represents two thirds of the natgas market, the decline rate is at an all time high. Shale has completely changed the dynamics – on the upside and the downside. As the bond market for shale companies collapsed, the leverage to the downside is now enormous. It is not only the natgas market which suffers, yet the whole US economy. So, at some point it will be necessary to let gas prices go higher. http://energyfuse.org/things-have-changed-low-oil-prices-a-major-threat-to-the-u-s-economy/. It is not anymore possible to subsidize low natgas prices over the bond market.
Heinrich,
I think the US nat gas market needs a few 200-300 bcf per week, just to balance the market. I doubt if it will ever get 2-300 bcf per day, but I suspect that is a typo.
toolpush,
In my post above I wrote ……weekly draw could be as high as 300 bcf/d…. I know it will be very likely too late for this winter until the market turns into short supply. Yet the market turnaround is here. The bond market is the judge.
HL – I posted info from the report on Ron’s previous topic. But, not storage data. I clicked on your reference, and sure enough, it is still there. A draw of 178 BCF from storage for the week ending Friday Jan 15 reported on this report on Thursday Jan 21. Both right on schedule, i.e., their reports usually come out on Thursday for the week ended the previous Friday. In fact, I was surprised that it did come out on Thursday since many times when there is a National Holiday (MLK), the report is delayed to Friday.
clueless,
Thanks for your reply. EIA did come out with the overall number from two weeks ago, yet did not specify it in the detailed production supply and demand figure. There was also no data implemented in the chart. So, I guess this is just an estimate. However, they did not come out with the production and supply numbers from last week (the storage numbers are always one week older). There could be also some confusion about the storage leak in California, where it is still unknown how much gas escaped.
Is it a news story, or a real story?
Dunno! Been a long time since I lived in the North East, though I lived through a few major blizzards in New England and New York city before I decided to move down to Florida. Most people just hunker down for a few days and it generally isn’t a big deal, life goes on.
Having said that, what did catch my attention was the intense flooding on the Jersey shore, according to reports it was worse than hurricane Sandy and they were getting hurricane force winds, which coupled with frigid temperatures and blizzard conditions must have been a very unpleasant experience indeed! Hope those people are safe!
Just taking a break from shoveling. The 6″ prediction turned into 2 feet of reality. No big deal here in the hills, we have seen worse. No ice storm, which was great.
The storm surges are getting worse along the coasts. NorEasters are a particular problem.
Your two feet of snow adds up to a couple of inches of rain, falling over the same time frame, some of it melting from the bottom, the rest from the top, over anywhere from a three days to a week or longer.
But the media throw in a lot of talk about floods, while usually failing to mention the only floods resulting are apt to be those brought on by storm surges, directly on the coast.
Yes, THIS TIME the flooding was storm surge into low lying coastal areas.
Sometimes up north in the hill and mountain regions we get flooding because of ice dams forming in rivers. Had a couple of towns with ice floating through them, not fun.
It’s going to be a lot longer than a week to melt this off. Ground was frozen so melting will mostly occur top. First major snow cover this year, albedo change will keep things a little cooler now.
Melts used to occur around here in March but now they can occur anytime, often mid-February lately. Depends mostly on the jet stream configuration.
This year some of the lakes are still showing open water. Last year they had about 18 inches of ice at this time. Ice is too thin to walk on right now. Holds up the birds though. 🙂
Media I looked at all very clearly said the flooding was coastal, low lying areas. Best to look at the media from the area in question, easy to do with the internet.
Hi Fred,
I missed the part of the news about flooding in New Jersey. I am with you, hoping the local folks are ok.
The media blow every little thing up into a monster of some sort these days, in order to get audience share up.
If you can’t sell some sex, the next best thing is a natural disaster, even if you have to start with just another snowstorm.
A few people will die of exposure, a few houses will burn due to faulty chimneys and over stoked stoves, a few powerlines will be down for a day or two. In terms of things that are really important, this storm is a ” piss ant” event. It’s a molehill, really , that has been elevated to ALPS status. These unfortunate events are disasters sure enough for the individuals involved, but they are not common enough to show statistically except if you are an insurance guy digging deep.
Hell, when I hit my ” google news” bookmark, a full quarter of the items are SPORTS. Could anything possibly be less important in the grand scheme of things than who wins a fucking ball game? The athletes are all paid journeymen and would as soon work for the opposition next year as not.
Whole damned teams could trade places,from general managers down to the bat boys, leaving only the UNIFORMS and signs in place, and the fans would not even give a shit,or even NOTICE, they would continue to root for the new team, wearing their old favorite uniforms.
Having said this much, if such storms are getting to be noticeably more FREQUENT, then in that case, they should be taken as early indicators of changing climate, which IS important.
They are sort of ignoring the high northern hemisphere snow cover data:
http://climate.rutgers.edu/snowcover/chart_daily.php?ui_year=2016&ui_day=23&ui_set=0
Data like this doesn’t fit the official line. But from a technical point I can add that global warming does increase humidity, this increases winter snow cover (winter snow is increasing), and reduces summer snow cover (because it melts). The increased winter snow increases sea ice thickness even as the warm sea reduces sea ice extent. So we can see in the data how the climate has all sorts of interesting feedbacks.
There are still significant discrepancies between the EIA monthly and weekly data for U.S. C+C production.
Weekly numbers show an increase of 139 kb/d from September 25 to January 15, including an uninterrupted growth (of 71 kb/d) over the past 6 weeks from December 4.
Alex,
Thank you !
This large discrepancy between weekly and monthly data suggests that sources are at least partially different and somewhat incompatible. This also puts a shadow on the accuracy of EIA data in general, especially provided by the monthly short term energy outlook.
I think similar problems exist in other statistical data that EIA the short term energy outlook provides.
Previously I asked a similar question about reliability of their world C+C production and consumption data, but I did this from the point of view of accuracy individual country data (which are probably less then 1%):
http://peakoilbarrel.com/opec-except-iran-has-peaked/#comment-557103
It is well known that OPEC countries used to cheat on their production data as their quotas depend on the current volume of production.
Amatoori also provided a link for the following article which is relevant to this discussion: http://www.reuters.com/article/us-oil-prices-kemp-idUSKCN0V0276?feedType=RSS&feedName=GCA-Commodities&utm_source=dlvr.it&utm_medium=twitter&dlvrit=1391616
See also response of Watcher to his comment:
http://peakoilbarrel.com/opec-except-iran-has-peaked/#comment-557074
likbez,
We have many times discussed the [un]reliability of the EIA U.S. oil production statistics. They have previously relied on the state-level data, which in many cases is uncomplete, with few exceptions (like North Dakota). The EIA was adjusting these numbers according to their old methodology. But their numbers were still inaccurate and had to be revised many times during the next 12 months.
The EIA now has a new methodology: they get production data directly from the largest companies, which account for about 90% of total output in each state. This survey-based approach now covers 15 individual states and the federal Gulf of Mexico, where the bulk of U.S. C+C is produced. The EIA claims that the new methodology has improved the quality of their estimates. But, as can be seen from the chart below, the numbers still need to be revised, and all of the revisions over the past 4 months were upward (see the chart below).
In 2015, the EIA has not only underestimated U.S. oil production numbers for the past months, but its predictions for the next several months were also too low. As a result, the most recent numbers for some months are up to 0.5 mb/d higher than earlier estimates.
The EIA weekly numbers are based on completely different methodology, and they were always seen as very inaccurate. Furthermore, unlike monthly statistics, weekly numbers are never revised.
What is interesting, weekly statistics from my chart above show a rising trend in U.S. oil production from October to January, while monthly numbers suggest a declining trend. But monthly numbers for October may again be revised upward, while the numbers from November are forecast, rather than estimate. We may not know the more or less exact numbers for end-2015 until mid-2016.
U.S. C+C production estimates from the last 5 issues of the EIA Short-Term Energy Outlook
There are several hypothesis that can be advanced based on the data accuracy and a huge lag of EIA and IEA data (as somebody aptly noted: the main purpose of IEA data is to please Americans):
1. Any talk about world glut below 1 Mb/d should be dismissed as statistical noise as the accuracy of supply/demand data for most countries does not allow to defect such a glut or oil shortage.
2. EIA is not only statistical outlet but also a propaganda outlet as well providing (sometimes false) signals to Wall street traders and as such having outsize influence on the dynamic of oil prices. They literally can move oil up or down.
3. “The Great Condensate Con” was probably intentional and essentially is equal to creating an artificial additional pressure on oil prices via manipulated statistics.
4. The only data that can counterbalance EIA/IEA bias can come from OPEC, but taking into account outsize influence of Saudis within the organization chances are slim.
5. Rebound of prices, if any, can be pretty abrupt as lack of supplies will be detected only when it becomes acute.
6. Repeating Watcher “It is indeed astounding that oil numbers, the most important numbers for all civilization, are not reliable.”
likbez,
As you can see from the chart above, the EIA has actually significantly underestimated U.S. oil production and the resilience of the LTO producers in 2015. All their US tight oil projections from 2011 to 2014 also proved too conservative. I do not understand, how this has served their “propaganda”?
I totally agree with Watcher’s statement. The lack of reliable up-to-date oil statistics is regrettable. At critical moments like today, this poses serious problems and risks for the oil industry and the governments. But I do not think that the data is being deliberately falsified
All their US tight oil projections from 2011 to 2014 also proved too conservative. I do not understand, how this has served their “propaganda”?
I agree Alex. The EIA’s estimates are sometimes too high and sometimes too low. But I do not believe this is intentional. They just make their best guess and quite often it is way off. But they just do the best they can.
Some people see conspiracies in every branch of government. Conspiracies to help or hurt Wall Street, banks or whomever. This, in my opinion, is sheer nonsense.
Ron,
>Some people see conspiracies in every branch of government.
> Conspiracies to help or hurt Wall Street, banks or whomever.
> This, in my opinion, is sheer nonsense.
I greatly appreciate your critique. Probably you are right. But the oil price dynamics is so strange that without conspiracy theories it is impossible to explain what is happening. What why so many people lost their jobs.
Who in his sound mind two years ago would suggest that shale industry created with such a great effort will be on the verge of destruction in 2016 and the oil price drops below $30 ?
Does not that means that we entered conspiracy theories domain. Or this is neoliberalism “modus operandi” aka “non-creative destruction” ?
Sorry about that.
Does not that means that we entered conspiracy theories domain. Or this is neoliberalism “modus operandi” aka “non-creative destruction” ?
You seem to think that “because it happened” then “some conspiracy is afoot here that caused all this shit.” Fortunately that is not the only explanation. And it is way, way down on the list of being the most plausible explanation.
Hey, shit happens. Get used to it.
Alex,
You are definitely a far better specialist in this domain then me and I greatly respect your opinion.
I just proposed several hypothesis. Some of them might well be false and some might well be classified as “conspiracy theories.” Please remember that the term “conspiracy theory” was introduced by CIA into public discourse to blackmail doubters about official JFK assassination story.
I would agree that EIA stats are the probably the best we can be get as information from other three letter agencies is not public.
That said, I am not so sure that it makes sense to dismiss those concerns on a single basis that “All their US tight oil projections from 2011 to 2014 also proved too conservative”.
There is a strong evidence behind “Great condensate con” hypothesis by Jeffrey Brown. Would you deny the fact that EIA was a cheerleader of the USA shale boom (and associated with it dramatic rise of production of condensate) and that merging oil and condensate production into a single category was one of the driving forces behind “oil glut” story ?
> All their US tight oil projections from 2011 to 2014 also proved too conservative.
I agree. But that does not mean that their actual figures are true and not massaged in any way. Or that all their projections remain conservative, if this projection goes against “talking points”. Please consider their projection about the drop of the USA shale oil production for 2016 as a hint.
Also their interpretation of oil/condensate storage dynamics (“growth in global liquids inventories put downward pressure on Brent prices throughout much of the year” http://www.eia.gov/forecasts/steo/pdf/steo_full.pdf ) looks to me one-sided.
Rising storage does not necessary mean oil glut. Sometimes it means completely opposite — hoarding of oil (arbitrage — selling futures and buying real oil for lower price pocketing the difference) or technological/seasonal issues. For example as you pointed out in the other post one or the reason for Iran storage of condensate was that they lost their primary consumer in China due to a refinery fire. Any serious problem in the supply chain probably results to the dramatic rise of storage levels.
Oil in commercial storage was bought by somebody and as such is different from storage by oil-producing nations such as Iran. Probably bought for a purpose. If so, why they strongly suggest that this is the primary indication of “oil glut”?
But that does not mean that their actual figures are true and not massaged in any way.
The actual figures are not the figures of the EIA. The are the figures of the Texas RRC, the North Dakota NDIC, and of all the other states that report their production numbers to the EIA. They cannot massage the data in any way because the data are not theirs to massage.
The EIA is not engaged in any conspiracy to defraud… somebody… for the benefit of… somebody else. Get over it.
“…there was not enough renewable energy installed globally to run the internet,
See also, How to Build a Low-tech Internet
Fergodssake! EVERYTHING starts small. I did, you did, the horseless carriage did,the biggest tree in the world did, and so on and so on. To say at the beginning of x that x isn’t big enough to do y is hardly news. Needs no saying.
So why does it get said here so often? Are we a bunch of morons?
So I say again. Solar is the future, no ifs. And electric vehicles are the future, no ifs at all. And way sooner than anybody here is talking about.
Example, installers around here tell me best predictor of choice for PV is that person knows somebody who already has it. Definition of exponential, no?
Same with EV.
Sure wimbi,
But we are talking about just the internet alone and in the old days, things were different, growing, resources a-plenty…
Things might look good on paper or our POB computer screens, but like going to Mars in our rockets, we need to discuss the realities of that above and beyond how well our rockets work so that the people who go there are not left stranded with no food, water or air. Oops, we forgot about that.
Two problems that emerge for me are;
1. Contraction (and a vast infrastructure and so-called government, built on expansion and FF’s) and;
2. Vested Interests (built on the aforementioned).
When we start adding renewables– effectively reducing energy– all kinds of strange, unpredictable effects can start happening, such as with regard to vested interests based on FF’s, both at home and abroad. And then there’s Jevon’s Paradox.
But of course I know we have limited options at this point, which is additionally why I’ve been voicing my concerns in these regards.
Society on renewables– assuming– and this is a whopping assumption– we get anywhere close to one powered on them– looks like it is going to be an equally whopping sociopoliticultural shift, the likes of which, in large part precisely because of this form of shift, may make its success next-to-impossible, if not impossible– especially if it is not approached with some humility, measure/balance of realism, holism and understanding and appreciation of scale, etc..
My method is super-simple. “We cannot predict the future but we can construct it.” So that’s what I am doing, constructing what I would like the future to be. Start with me. Then go on to my group, my town. Stay close and connected, help where can.
So far, so good. We have an EV car club, with instant access to longer range or other vehicle as desired. We have a shared PV system, where we can go for first cost and also get solar down in the glen.
People with capital can invest it right here, where they can look the business guy in the eye and judge how he’s doing. And comment.
We have a good reuse, repair, repurpose, recycle business going, where people go FIRST when they need something, or want to change or give.
And so on. Working on it.
That seems reasonable, wimbi, and I am here in Nova Scotia for a similar venture. I had a place south of here but things went ‘south’ temporarily, so I’m in the process of resetting things. I also got involved with an ecovillage pioneering effort before Nova Scotia, but decided to try to leverage a small town here first to see if I could avoid baking from scratch something resilient, such that it was felt an ecovillage was more about than a small town.
Anyway, I think you have an essay already on that site you mentioned, yes? I’ll read it and hope for photos and videos if/when possible… or at least drawings/diagrams?
Indeed, perhaps like how the universe apparently creates the space it expands into, we can create the future/reality we enter into. And it can be a great one with foresight, democratic input, and system/contextual/etc. thinking, etc..
Working on it here too. Keep in touch/tabs.
We have a good reuse, repair, repurpose, recycle business going, where people go FIRST when they need something, or want to change or give.
No wonder Glenn S. hates you so much! You have implemented a small scale self sufficient alternative energy powered version of the circular economy in your own back yard. And that is not supposed to be possible. If word gets out and more and more people start following your example his fossil fueled world starts to become less and less necessary.
So please just keep doing exactly what you are doing! Thank You!
Thanks for the kind words, Fred. Truth to tell, my motives are not so high as all that. I have a problem lots of people would be super happy to have. I am at the end of my life, I still have a fairly good pile of ill-gotten gain from my days of crime against the environment long past, I want to disperse it wisely asap before the reaper gets me, and I have lotsa good choices right here among great young people already doing great stuff that they themselves initiated.
Problem. How best to do it. We are gonna spend this weekend talking about that. They are, not me. Then they come up with the plan, and we go on from there. Fun!
Fergodssake! EVERYTHING starts small. I did, you did, the horseless carriage did,the biggest tree in the world did, and so on and so on.
Yep! Even the fossil fuel industry started small… imagine that!
Though at presents it seems to have gotten way too big for its britches! But if ‘Peak Oil’ is happening then it is going to shrink while alternatives like solar can only grow! 🙂
On the other hand powering the internet with alternative energy has to start small too…
http://goo.gl/HB4tvF
Alphabet subsidiary Google has contracted for 61 MW of solar power with Duke Energy, the largest utility in the US, to power its North Carolina data centers.
While utility-scale renewable power purchase agreements are common for Google, this is the solar power contract that’s big enough for an entire data center.
Same with Apple:
http://goo.gl/6UBonI
Inside the Huge Solar Farm That Powers Apple’s iCloud
In the early days, Apple bought renewable energy credits to cover the center’s electricity use. In 2012, the company built its first solar farm across the road from the data center. Apple built a second solar farm, and announced plans this month for a third, all roughly about the same size, to keep up with the growing use of data. It also operates fuel cells, running on biogas pumped in from a landfill. All of the power generated on-site is fed into the electricity grid.
“On any given day, 100 percent of the data center’s needs are being generated by the solar power and the fuel cells,” Jackson said.
And this is just ‘data centers’. This does not include the rest of our society, Fred and wimbi.
Yes, things might start small, but how do they end? The bigger they are, the harder they fall? As things wind down, it may become increasingly more difficult to justify ‘data clouds’ full of cheesy videos that require the power of a small town while people in their vicinity lose their shirts. The point here– which I keep making because some of you seem to like to remove it from its contexts– is also about sociopolitics. We might want to put makeshift beds/dorms in datacenters; turn the places, themselves, into ‘small towns’.
Hang on wimbi, I see we are live. I am just editing my post here to include a quote from an essay I just recalled reading some time ago by John Michael Greer (Thanks, John, if you’re lurking. Lurkalicious.). I also noticed a much more recent one which I haven’t read from just last year.
The point here– which I keep making because some of you seem to like to remove it from its contexts– is also about sociopolitics. We might want to put makeshift beds/dorms in datacenters; turn the places, themselves, into ‘small towns’.
Caelan, trust me I understand where you are coming from. I even understand sociopolitics quite well. I also understand not being able to walk across a street in Sao Paulo for hours at a time because of non stop automobile traffic.
Who knows maybe we will have people living in the data centers and raising fish and vegetables using aquaponics and hydroponics in what used to be space designated for parking of private cars.
I don’t know. What I do know, is that the current system won’t work anymore. Maybe we will all just die off and go extinct. Civilization may just finally end. Then again it might not. It won’t really be over till the fat lady sings!
I hear you, Fred.
The best approach would seem to be to ‘Keep It Simple’ while making continual and conscientious efforts at contextualizing things in their inter-relatedness and their inter-relatedness and effects over time, especially with regard to nature, because of course we are a part of it.
Reading off complicated statistics that only seem to merely greenwash/whitewash whatever it is that’s desired to make look good with little in the way of the aforementioned is relatively circular, canned, meaningless.
“Life is really simple, but we insist on making it complicated.” ~ Confucius
Hi Caelen,
As Yogi so famously said, predictin’z hard, ‘specially the future.
Where things might END , nobody can say.
But we can make educated guesses, or at least semi educated guesses, and those of us who have “seen the light” when it comes to renewables believe we have at least the POTENTIAL to continue to live dignified lives, without giving up the best parts of modern technologies.
There is in my estimation PLENTY of reason to believe that IF we put our collective mind to it, we CAN build out enough renewables to enable us to live reasonably well, for quite a long time yet, on the remaining endowment of one time fossil fuels and other natural resources.
During that time, we can work on changing our ways, so as to continue to live dignified lives on a SMALL fraction of the non renewable resources we use today.
Will some of us succeed in transitioning to a renewables based economy, and way of life?
Nobody knows, but barring the worst sort of bad luck, such as WWIII, we have a couple of generations at least to work on it.
I assure you , people such as Wimbi, Fred and I do not take this sort of challenge lightly. If we succeed, or rather if some portion of humanity succeeds, it will be at the cost of plenty of blood, sweat , and tears.
We agree with you , what we refer to collectively as sociopolitics is going to necessarily and inescapably play a tremendous role in what happens, for better or worse.
Success is going to depend on changing the VALUES of men , on the grand scale. We know such changes are possible, as they have happened before. Can we bring about another such change ? Nobody knows.
What we do know is that if we do not try,and at least partially succeed, we are going back to the DARK AGES.
The biggest new use of energy in Colorado, and it is large, is to make marijuana marketable. I really do not know what they do, but I assume that it includes indoor growing and then drying it out. I read an article the other day that some of the increased power demands are causing problems.
Marijuana is not already marketable? LOL
There is plenty of coal , enough to build out plenty of solar and wind infrastructure.
Steel can be recycled endlessly, except for whatever gets thrown away or lost to rust, or buried so it cannot be retrieved, as in the case of oil well casings etc.
Renewables are not up to the job of supporting Old Man Business As Usual now, and will not likely ever be able to support the current generation of BAU. Nobody who takes sustainability and renewable energy seriously claims otherwise, at least not in terms of the next few decades.
But there will be a NEW GENERATION of business as usual, for sure. It may be based on sticks and stones, and firewood, or it may be based on wind and solar electricity and a good bit of modern industry.
Renewables can and will continue to grow exponentially, for quite some time, and the energy returned on the energy invested in them is high enough that once the renewables base is large enough, they can continue to grow without dependence on fossil fuels.
It IS an open question whether we will collectively manage to build out renewables to such an extent before we run short enough of fossil fuels and other one time thru resources to prevent our succeeding in doing so.
We are already getting five percent of our electricity in the USA from wind and solar power, and we can double that easily within a decade. At the same rate of growth, we will be at twenty percent in two decades, and over forty percent in three decades.
Renewables get cheaper, as we build more.
And we are going to learn how to avoid wasting energy, the way we do now, so we will get along fine with half per capita of what we use today.
Our sun room is capturing so much heat today I have found it necessary to open a couple of windows nice and wide. If I had more thermal storage in the rest of the house, I would not need ANY firewood or oil to stay warm tonight, although the forecast is for 20 F. LOL
SOME people may pull thru overshoot ok.
http://phys.org/news/2016-01-rapid-energy.html
Says switch to renewables can be FAST and CHEAP. That’s my experience, too.
My bet- it WILL be fast and cheap. And surprise the livinhell out of the FF guys.
Hi Old Farmer Mac,
You said:
There is plenty of coal , enough to build out plenty of solar and wind infrastructure.
Whether this is true depends on who you ask.
David Rutledge estimates about 700 billion metric tonnes for the World Coal URR, Steve Mohr has estimated three cases, the low case is similar to David Rutledge’s estimate and is based on Hubbert linearization for individual nations and best estimates where this method doesn’t work, his medium case is his best guess, and his high case covers the most optimistic estimate he can imagine based on his research.
See http://www.theoildrum.com/node/6782#more
For coal when we convert from exajoules to billions of metric tonnes, his high case (case 3) is about 1300 billion tonnes of coal and his medium case is about 900 billion tonnes of coal. At the end of 2014 about 330 billion tonnes of coal had been produced and the annual rate of production was about 8.2 billion tonnes of coal per year. Let’s assume as oil and natural gas peak that these fuels become more expensive and more coal is used. We will assume annual consumption increase to 13 billion metric tonnes(BMT) per year by 2038 and then plateaus at 13 BMT. In that case we reach 650 BMT of cumulative output in 2043 (half of the high coal URR estimate of 1300 BMT) and would be close to the peak, perhaps a plateau could be maintained until 2048.
Note that a more realistic guess for coal URR might be about 1000 BMT (the average of the high and low estimates. That scenario might peak in 2031 at 11 BMT/a with a plateau until 2036. Coal scenarios shown below.
Bottom line, we have less economically recoverable coal than many people think.
we have less economically recoverable coal than many people think.
I agree. But…it’s based on a price assumption for “economical”. Do we know what that price assumption is?
I keep bugging you about this because I think this approach could be misleading. There is much more coal than the Rutledge/Mohr estimate if we’re willing to pay, say, 20 cents per kWh. I agree that’s very unlikely, but the assumption that coal will go away is based on a public policy which charges a cost for CO2 and other forms of pollution. Without that, coal consumption could increase, as we see in the study referenced above: “If renewable energy costs were lower and natural gas costs higher, as is expected in the future, the modeled system sliced CO2 emissions by 78 percent from 1990 levels and delivered electricity at 10 cents per kWh. A scenario that included coal yielded lower cost (8.5 cents per kWh), but the highest emissions.”
In other words, we can’t rely on geology or unregulated free markets to phase out coal – we’re going to have to make a collective decision to pay at least modest costs up front in order to avoid much greater costs down the road. I think that needs to be stressed, over and over again.
So…what price per ton of coal or per kWh are we assuming for “economical”??
Most routing gear in the US required regulated Supplies. ie. the Grid.
MikroTik gear runs on 8-30 or 10-67V and can route Billions of Packets daily 24×7
running on a 6S Stack of 18650’s that fit in your pocket and a medium size PV Panel. http://www.mikrotik.com/
Kirkuk estimated 9 billion barrels remaining proven and recoverable. Flowing 500K bpd.
Rumailia estimated 17 billion barrels remaining proven and recoverable.
(BP targets output of 2.1 mbpd. 22 yrs of flow. 2.1 is up from 1.6 mbpd now)
Majnoon estimated 13 billion barrels remaining proven and recoverable.
(Petronas and RDS have the contract and target 1.8 mbpd within 7 yrs (of 2009), interim target from 45K bpd in March 2010 to 175K bpd in 2012. Latest RDS website bragging says now 210K bpd. They ain’t gonna hit 1.8 mbpd this year)
West Qurna estimated 43 billion barrels remaining proven and recoverable.
(Exxon RDS won the Phase 1 (9B in reserves) contract planning 0.27 mbpd to 2.2 mbpd. 7 yrs from 2009. 480K bpd in 2013)
(Lukoil now owns 75% of the rights to WQ Phase II 13B remaining proven and recoverable, planning for raising from 180K bpd in 2012 to 1.8 mbpd by 2020).
Several other single digit billion barrel fields in Iraq.
So if it turns out there is say a hundred billion barrels there, and a billion lasts the world maybe eleven or twelve days, at current rates of consumption, well, it looks as if there is enough in these fields to last us, collectively , maybe three or four years, or maybe ten years, collectively, if the highest estimates turn out right.
Methinks we have a peak oil problem staring us in the face.
I am a big believer in renewables, but every drop that can be gotten out of the ground at an affordable price will likely be burnt, and if it can be gotten out faster, it will likewise be burnt FASTER.
Of course getting this oil out will take the best part of a century, rather than a decade.
Those foreign company contracts are allowing the strip mining of Iraqi oil fields. It’s pretty criminal to produce them that way.
Fernando – You need to educate the clueless. What does “strip mining” the oil fields mean? I really do not know.
Strip mining usually refers to mining of a mineral by means which ignore destruction of the land, and the goal is just to rip it out as fast and as cheaply as possible. Environmental rules have pretty much curtailed that. With respect to oil and gas, I have read some critiques of depleted oil fields by reservoir engineers who point out that the methods used damaged the true potential to maximise the reserves. Is that your meaning?
Maybe Fern’s speaking Pidgin.
I used strip mining as a simile. They have plans to produce oil at very high rates in a relatively short period of time. The fast development pace “forces” them to bring in expat labor, doesn’t allow local suppliers to evolve, and leaves the country all screwed up with Dutch disease when the oil starts declining.
I’ve considered trying to advice countries on how to negotiate these deals but it’s useless. They go for the short term cash. In Iraq’s case it’s practically rape.
Globally, we consumed about 270 GB of C+C in past 10 years, and as I have occasionally opined, it seems likely that actual global crude oil production has been on an “Undulating Plateau” since 2005.
I find it interesting that global net exports have been flat to down since 2005 despite a very expensive increase in production. My feeling is that this will not end well.
http://mazamascience.com/OilExport/
As various ‘export lands’ become ‘import lands’, especially the over populated ones with few other resources to profit from (like Egypt etc), the trend seems to be that a lot of porcelain is going to get broken.
UK, Argentina, Mexico, etc etc It’s goin gto be a damn mess by 2023.
One would assume that Lukoil and Exxon understand that the quicker they get oil to flow in Iraq, is akin to building their own gallows, and making the noose to boot.
Anybody seriously interested in gaining some insight into the possible reality of a near term revolution in auto business, with the personal ownership model fading away, and the shared self driving model taking over, will enjoy this longer piece at WIRED, written by one of their reporters who has spent plenty of time places such as LA , driving himself, and now using UBER and other services there to get around.
It is a REAL eyeopener. This shit is HAPPENING,
NOW.
The dollars and cents argument is going to simply blow all other arguments out of the water, assuming just a couple of things, one being that the self driving tech really works out ok. I believe it will.
The other thing is that vested interests, and Luddites, not be able to prevent the transition. I am afraid that between them, they might be able to delay the transition, maybe a long time, but in the end, it WILL come to pass.
http://www.wired.com/2016/01/the-metastructure-transportation/
The technology is here now , and will be commercialized within the next four or five years. Old Man Bau will last that long, and longer, in my opinion.
It is a REAL eyeopener. This shit is HAPPENING,
NOW.
No shit! That’s exactly what I have been saying for a while now… 🙂
That is precisely what keeps the Glenn Stehles of the world and their handlers up at night. It is their worst nighmares becoming reality.
They don’t want to even hear about the possibility that the old private ICE fossil fueled mode of transport is already being disrupted today.
As an example, my son is 20 years old and studying computer science, the last thing he and his friends think about is getting a driver’s license. They all have smart phones with Uber apps.
My urban friends who are my age are all seriously thinking about giving up on all the hassels of car ownership and going with Uber, Lyft and Zip Cars plus public transport for getting around when needed.
Why? Because it is so much cheaper! And the disruption has barely begun! Wait a couple more years when things really start rolling (no pun intended)! Private cars are a thing of the past. Get ready for massive reduction in demand for gasoline.
Hi Fred,
Yes, because it will be so much cheaper. !!!!!!!!!!!!!!
And the cheaper it gets, the cheaper it WILL get, for some often overlooked reasons.
First off, when you hire a ride, EGO and status will be largely nullified. People who feel compelled to own very nice cars, and wear very nice clothes, think nothing at all about being seen at the McDonald’s Drive Thru window. Ditto a hired ride, it will be just a ride, and it will seldom be necessary to hire a LIMOUSINE , rather than just hiring a generic car.
Second, there will be little need for manufacturers to produce a dozen different models, and variations of these models , and change them out every year or two, and produce them in a hundred different colors. Standardization on the GRAND SCALE will rule again, and a mechanic will be able to fix a given problem BLINDFOLDED, because he will have seen it multiple times. Hired cars will be running many more miles, per day, and be much better maintained, using fleet management techniques, and can be expected to last a very long time, as cars go.
And while the cars themselves will pile up the miles fast, the people who ride it them will be paying by the trip, and consequently will probably ride less. When I think about going to town in my old car, the thought that comes to mind is the price of a gallon of gas, rather than the total cost of owning the car.
The gas costs only a couple of bucks, but the total cost of a trip to town is at least double that, due to insurance, tags, maintenance ,depreciation etc.
The cost of a hired ride will be a ” total cost” price , and people who watch their money will hire a car less often than you would think for this reason.
And range is not going to be much of an issue for a self driving electric. The owners will put charging stations in advantageous spots, and a car that is not busy will go there, and plug itself up, and get however much juice it can, before it is summonsed by the next customer. Most likely just about every for hire car will be charged sufficiently at the beginning of rush hours to make it thru the rushes, without having to stop for recharging.So the range bugaboo will vanish like snow in the spring, lol.
SOME self driving cars WILL be capable of long trips, either because they have the battery capacity needed, or because they are plug in hybrids such as a VOLT, and can go four hours or more , and hit a gas station, and go another four hours.
Incidentally the gas station will likely be automated too, lol.
The real question may be employment for working class folks in an automated world.
The real question may be employment for working class folks in an automated world.
Yes, that is something that as a society we also need to start preparing for ASAP!
I have already posted this link before but it is also an eye opener in terms of what self driving trucks will do to employment and the consequent ripple effect throughout the economy.
Self-Driving Trucks Are Going to Hit Us Like a Human-Driven Truck
The imminent need for basic income in recognition of our machine-driven future
https://goo.gl/DCI6WX
The self driving trucks are going to be here even faster than self driving cars. Actually they are on the road right now. One of the consequences will be a massive reduction for demand of diesel fuel as well.
Every where you look there are disruptions happening that should reduce demand for fossil fuels.
Fred
That is also a great link about the driverless trucks and, with a reading of OFM’s Wireless link, the future of road transportation may start to shape up.
Your piece described two vehicle truck convoys, but the Germans are already testing four vehicle convoys wherein the three following trucks are driverless and mimic the lead truck via sensors.
Not only would the construction of driverless rigs be way cheaper as not needing human accessories, to be able to travel 70/75 mph nonstop 24hr/day with, say, LNG as fuel … a convoy could transport goods cross country for a fraction of today’s cost.
Extrapolating that for human transport, 85/100 mph interstate transport on highways with van/bus driverless vehicles, you now start to give the airlines a run for the he money.
Exciting, highly disruptive technology.
OFM
That is a great link about the Ubers.
Yesterday, I was at Ground Zero of Uberdom – downtown San Francisco – both working and observing the first day effects of a three-week long shutdown of streets in SF as Super Bowl festivities start to ramp up.
In addition to the unsurprising chaos on the detoured streets, it seemed like fully one half of the vehicles were Ubers (Goobers, I call them).
This mode of transportation has virtually taken over in this area and, when the autonomous aspect kicks in, it should be great as it will, hopefully, cut down on the incredible number of accidents that occur daily during rush hours … a large number of which are caused by people using their ‘smart phones’ while behind the wheel.
Good auto mechanics are both rare and expensive, further inducing people to forgo car ownership.
“…and now using UBER and other services there to get around.”
WoW he learned how to use a taxi!!!!!! Ground breaking,,,,, Disruptive!!!!!
Once you guys get done with your circle jerk… whats new and sustainable here?
whats new and sustainable here?
Have you ever used a service like Lyft or Uber? There’s a reason they are pushing traditional taxi services out of business.
http://money.cnn.com/2015/05/11/investing/uber-50-billion-valuation/
Ride sharing app Uber is reportedly raising more money in a round of financing that would value the company at $50 billion.
That is higher than 406 companies in the S&P 500, including blue chip industry leaders like FedEx (FDX), Capital One (COF), DirecTV (DTV) and Charles Schwab (SCHW).
It was less than a year ago that Uber was worth only $18 billion. Uber’s valuation rose to $40 billion by December.
Not too shabby for a company founded in 2009.
Using services like Uber reduce the need to own private automobiles and therefore reduce congestion on the roads. Less use of fossil fuels and less pollution.
Driverless cars are even more efficient. If these vehicles are EVs it gets better still.
Especially if they can be charged using solar, wind, hydro, geothermal etc… wherever and whenever possible.
Or was that just a rhetorical question?
Some more rumbling about a March
OPEC meeting.
Looking at year end reports here, comparing to past years. Really puts into perspective how much 2015 deviated from prior years in the P & L, which is what matters.
Plugging in average price thus far in 2016, using 2015 expenses is yet another pretty stark reminder of just how low we are. It makes 2015 look good.
I think the shorts, etc have hit critical mass on what they wanted to accomplish. As the oil market and stock market are now highly correlated, I am looking for the tide to turn. $26 was just too far.
I don’t think OPEC or Russia want to deal with a year or two of $30 oil. Given the connectivity of the global financial markets, I have a feeling we are going to see some big short covering.
I also think if we have any decent recovery, the banks are going to insist shale live within cash flows for awhile.
Shallow-
You’ve written much before on well economics. Would you say that most operating expenses for operating a well are mainly fixed? Electricity, fuel and other expenses would seem to be the same regardless of whether the well was producing 50 barrels per day or 25 b/day. Workovers and repairs seem to be needed to be conducted regularly enough that in a sense they are fixed costs as well.
So, it would seem to me regardless of where prices go, a shale well earns less money on a per barrel basis over time because these costs are spread over fewer and fewer barrels every year. It is no wonder that shalies kept borrowing to drills. The new production provided high margin barrels in the early years to offset the worsening margins of legacy production. Am I looking at this correctly?
If so, I think the upcoming numbers for the shalies will be horrific. With less new drilling, production will decline. Producers will be producing less barrels and earning a lower margin on each barrel produced as production from legacy wells makes up a larger percentage of production. Add in lower oil prices and the hemoraging could be quite bad.
John Keller. I do not know how quickly we will see this effect, but it will be there.
Below are my views of Bakken wells.
LOE varies greatly, but many range $10-$18,000 per month, not including down hole repairs. This comes straight from joint interest billings I have reviewed. Granted, there is some G &A in those, some are tough to decipher. However, I have noticed as wells get down under 1000 BO per month, water hauling decreases, and LOE tends to be around $10-12,000 per month.
A year ago, tubing leaks were costing in the $70,000 range to repair, down hole pump changes around $30,000. This was on rod lift wells.
A year ago I looked at several wells operated by Marathon Oil. Wells completed 2008-2010 ranged from $13-$55 per BOE to operate per the joint interest billings. There were some re fracked wells, that were running under $3 per BOE, as I recall. I did a post on this information.
I agree that Q4 will be horrible. But, if we stay around $30 WTI in Q1, it will really open some eyes. Right now there is very little cash flow with BOE realized being $18-22 in the Bakken, worse in more gassy areas.
We have shut in a lot of wells. We are just running water floods, plus a few low cost wells that make almost straight oil. $20s in the field is devastating for the US industry. For conventional producers, few are operating at a profit.
I am hoping for either a flush down to $10, which will force OPEC and Russia’s hand, or a shift takes hold in the money center banks, where they decide oil shorting needs to stop. This slow drift since July has been horrible.
Look at Parshall field. 6-8 year old wells making mostly 10-30 barrels per day. This is North Dakotas best. Not much cash flow, yet the wells really are not that old in my view.
Hi shallow sand,
Rysted estimates median US OPEX at about $15/bo, does that seem too low to you?
Do they have median US OPEX in dollars per month?
Dennis,
the OPEX number for calculation of breakeven oil price includes cash operating costs and excludes non-cash costs, such as depreciation and amortization, impairments, etc.
$15 for U.S. median cash OPEX looks reasonable.
Below is a table which shows units costs per barrel for EOG.
Their cash costs per barrel were $16.12 in 1Q15 and have declined since then.
The problem for shale players is not OPEX, but capex, as they need to drill new wells just to maintain production. Full-cycle costs for shale players is well above current oil price.
Hi AlexS,
I don’t know what “marketing costs” are exactly, but if they are necessary to sell the oil produced and are never zero, it seems they should be included in OPEX. This looks like financial sleight of hand. I would say cash operating costs are $28.15 in 1Q2015, a far cry from $15/b.
Dennis,
marketing costs refer to their marketing division. They buy oil from third parties and re-sell it. This has nothing to do with the upstream business.
P.S. the cost of selling their own oil is included in general and administrative expense, which is also called SG&A (selling, general and administrative expense)
Hi AlexS,
Ok. I would note that EOG is the cream of the crop for the LTO players (not including those with very deep pockets such at XTO and Statoil), so not really representative of the median.
At $30/b ( and $20 to 25/b at the wellhead) many of these companies will burn through their cash paying interest and will have to declare bankruptcy. It will be very difficult for them to secure any further financing.
Dennis,
EOG’s cash costs are not an exception (see the table below).
Even at $25-30 shale companies can cover cash operating costs, i.e. to keep producing from existing wells.
But no doubt they have to severely cut capex in order to remain cash-neutral. With this much lower capex they will not be able to maintain production at 4Q15 levels. If they try to increase production, even at minimal rate, they would be burning cash.
Bankruptcy occurs when a company cannot pay on its principal debt, or interest. Theoretically, they can refinance their debt and capitalize interest payments. Important to note, that most large shale players have very long-term debt maturities and reasonable debt ratios. But many smaller players are at risk.
Pioneer Natural Resources operating costs per boe (2Q15)
As I have previously noted, given an ongoing decline in wellhead revenue, due to falling production and/or falling product prices, unless total operating costs (LOE and pro-rated G&A) fall at the same rate as, or at a rate faster than, the rate of decline in wellhead revenue, the resulting rate of decline in net cash flow from a given lease will decline at a rate faster than the rate of decline in wellhead revenue, and the rate of decline in net cash flow will accelerate with time.
This implies a tremendous mismatch between debt levels and remaining cumulative net cash flow from production.
Jeffrey. Yes, thus my constant harping regarding PDP PV10. I would wager up to 25% of all Bakken/Three Forks wells drilled and completed since the year 2007 are losing money on an operating basis at today’s prices, and thus are not assets, but liabilities.
I suspect at $30 WTI and $2 Henry Hub, PDP PV10 of $10 million based on 2014 product pricing falls to maybe $1 million at present product pricing in the Williston basin, for Bakken/Three Forks wells completed since 2007.
At 2014 pricing, a 100 BOEPD well was likely netting 8-9 times what a 100 BOEPD well is netting under current product pricing.
The way the companies stay alive at these levels is through under the table bank bailouts (i.e. ignoring reserve based lending standards).
Almost NONE of the LTO companies in the United States are in a position to have ANY further credit extended to them under traditional reserve based lending standards. Almost ALL of them have total debt exceeding 65% of PDP PV10 at the current futures strips for WTI and Henry Hub. MANY have total debt which exceeds PDP PV10, which, in my book, makes them technically insolvent.
In its 2014 10K, CLR noted that its PV10 all categories fell from $22 billion to $9 billion, simply by replacing 2014 SEC product pricing with 2/15/15 product pricing. 2/15/15 product pricing was SUSTANTIALLY better than present.
Thanks guys. I have followed these companies for a long time. I have been amazed at the disconnect between the glowing company presentations and terrible actual financial results. The wells obviously don’t produce what the operators claim.
The reality of operations for a single well is the final piece of the puzzle. I think most people (including me for a while) have looked at operating expense as a variable cost. But because it is mainly fixed, as Mr. Brown notes, the fall in revenue from lower production will result in disproportionately larger drops in cash flow.
Thanks again for your replies.
John Keller.
Parshall field reports 359 wells, 8 of which are confidential.
Those 359 wells averaged 114.90 barrels of oil per day, or 3,447 barrels per well in 11/15. I took the oil runs for the 8 confidential wells in making the computation.
However, by my quick run through, 234 of the 359 wells produced under 100 bopd, or under 3,000 barrels of oil in the month of 11/15. Of those, 86 produced between 2,000-2,999, 60 produced between 1,000-1,999 and 88 produced from 0-999 for the month of 11/15.
I REALLY wish we could see the lease operating statements for each of these wells. There are recent completions producing 10,000-30,000+ per month which skew the average. I am sure if we had last 12 months of lease operating statements, one would find that $$per BOE is very small on the flowing new completions, and $10-$50 per BOE for the wells under 1,000 barrels per month that are on artificial lift.
Assume we have a well that produces 1,000 barrels of oil and 1,000 mcf of gas in a month, with 80% net revenue interest. At $25 oil and $2 gas, our well generates $21,600 of gross revenue, after severance and extraction taxes, $19,440. As I have stated, I have seen ranges of $3,000 to $30,000 per month LOE, without down hole or other major repairs. Even if we go with $8-10,000 per month, there is just not a lot of cash flow being generated, for a 21,000′ well bore which cost $7-12 million to drill and complete. And if we have a tubing hole, need to change a down hole pump, have a gear box go out on a Lufkin 640, etc, there may be $0 operating cash for the whole year on the lower volume well.
Again, other than possibly Sanish or Grail, this is THE best field in the Bakken. NO staying power on these wells, and therefore I’d say even this field struggles to be economic at $20s or less well head crude and $2 or less well head gas.
It also would be interesting to know what NRI is on the Parshall wells. Companies rarely disclose this information either. 75% makes a big difference v. 87.5%.
Finally, we do not know what the gross working interest is for EOG on their Parshall wells.
Enno Peters has provided much information regarding oil and gas production from “older” (5+ years) wells in the Williston Basin. I am grateful to him for that, as it helps me see that, Basin wide, Bakken wells do not make sense to drill and complete at any price we have seen since 11/2014. Very, very few of the wells completed since 11/2014 will payout in five years, and thus are economic failures.
Plus prorated G&A expenses.
So using your example, $19,400 net revenues and let’s say $15,000 in LOE. Well, if production drop 15% y-o-y revs go to about $16,500. Cash flow chopped over half without any change in oil prices. I realize this is rough. I realize a lot of models might have 6-10% declines for the tails of these wells.
I have yet to see any shale players come out of bankrupcty. I think once the drilling stops, cash flow disintegrates. The assets go to land value which is not very much. The recoveries on shale debt will be shockingly low. The companies have been manufacturing EBITDA by drilling loads of new wells.
Thanks for the analysis.
Zero Hedge, who may not be the most reliable source but always have something to say, reckon Sandridge might be on the verge Chapter 11 and Chesapeake might not be far behind:
http://www.zerohedge.com/news/2016-01-25/sandridge-nears-bankruptcy-would-be-second-largest-shale-chapter-11-past-year
They also reckon that creditors are getting about 15 cents on the dollar on previous redundancies:
http://www.zerohedge.com/news/2016-01-23/energy-creditors-lucky-recover-15-cents-dollar-bankruptcy
The zero hedge article says American Eagle’s assets (which I believe are all Bakken) sold for $45 million. However, I looked up the 8K regarding the sale, and found that the actual purchase price was $36.75 million pursuant to a purchase agreement dated 10/21/15, same was approved by the BK court 11/6/15 and the sale closed 11/23/15.
Per 2014 American Eagle 10K
PDP PV10 $178.5 million
PUD PV10 $49.5 million
PV10 – all categories $228 million.
So, American Eagle’s production sold for 16% of 2015 PV 10 – all categories. Keep in mind, that the purchase price was agreed to in October, when WTI was still in the 40s.
Yes, I know, the American Eagle assets are not “core” Bakken. However, if the SEC reserve reports are all prepared accurately, this should not matter as “core” should have a much higher PV10?
BTW, 16% of CLR 2014 SEC PV10 all categories is $3.7 billion. As of 9/30/15, long term debt of $7.1 billion. Not saying that is what will happen, but the SEC reserve reports coming out in the next 30-45 days should be very interesting indeed.
So, see what can happen to PV10 valuations when the price of oil and gas drops by more than half? And now we are more than 70% off on the well head price of crude oil in the Bakken.
Do the companies have to release the entire reserve reports to the public? I’d sure like to see a few when they come out, and then plug in the current strip.
If drilling stops, cash flow continues from existing wells, albeit at a rapidly diminishing rate.
However, if drilling and completion (D&C) stops, cash outflow (D&C capex) also stops. At $30-40/barrel. capex definitely exceeds cashflow.
From a purely financial perspective, at current oil prices it doesn’t make sense to drill and complete new shale wells, ot to drill and postpone completion of new wells, or to complete the wells drilled several months ago.
AlexS, it has not made sense since 11/14 IMO. And because it has continued, all viable producers have suffered greatly at the expense of the non-viable LTO producers.
shallow sand,
I’m looking forward to seeing shale companies’ 4Q results.
The average WTI price was $41.94, the lowest in 2015.
(1Q15: $48.48;
2Q15: $57.85
3Q15: $46.55 )
And less production was hedged.
But 1Q16 should be much worse. The EIA predicts average WTI price at $36.36, January average is ~$30.
And even less hedges.
The underlying reality…the ‘elephant in the room’ ‘that will result in elephants fading into a dim human memory…and then we will likely circle the drain…
http://www.dailymail.co.uk/sciencetech/article-3192285/World-s-population-soar-11-billion-2100-HALF-live-Africa-claims-report.html
I have my doubts whether humanity will make it to 11B…I truly hope the human population doesn’t get that high…if it does large swaths of the World will have people living in misery….and much of the rest of the life on this beautiful planet will suffer…and large numbers of species will likely go extinct.
Uber, Lyft and Zip Cars plus public transport in the U.S. won’t fix Africa, or stop the sixth mass extinction event.
I can’t understand why the people in high total fertility rate countries cannot understand the horrible outcomes that are happening now and will happen at a hugely magnified rate in the future due to their actions…they don’t win any intelligence contests with yeast.
My guess is people in high total fertility rate countries will go conquer some new land. Maybe that which is currently occupied by low total fertility rate populations.
http://hipcrime.blogspot.ca/2016/01/the-fates-of-nations-biological-theory_23.html
Step 1. Individuals and groups evolved a bias to maximize fitness by maximizing power, which requires over-reproduction and/or over-consumption of natural resources (overshoot), whenever systemic constraints allow it. Differential power generation and accumulation result in a hierarchical group structure.
Step 2. Energy is always limited, so overshoot eventually leads to decreasing power available to the group, with lower-ranking members suffering first.
Step 3. Diminishing power availability creates divisive subgroups within the original group. Low-rank members will form subgroups and coalitions to demand a greater share of power from higher-ranking individuals, who will resist by forming their own coalitions to maintain power.
Step 4. Violent social strife eventually occurs among subgroups who demand a greater share of the remaining power.
Step 5. The weakest subgroups (high or low rank) are either forced to disperse to a new territory, are killed, enslaved, or imprisoned.
Step 6. Go back to step 1.
http://www.dieoff.org
“Let them eat cake!”
Marie Antoinette
Occasionally the low ranking subgroups find ways to band together and direct their violence at the higher-ranking individuals. Even Chimpanzees occasionally gang up on an Alpha male that is too tyrannical and unjust…
I have my doubts whether humanity will make it to 11B…I truly hope the human population doesn’t get that high…if it does large swaths of the World will have people living in misery….and much of the rest of the life on this beautiful planet will suffer…and large numbers of species will likely go extinct.
You won’t have to wait to get to 11B! Large swaths of people are already living in misery right now!
I don’t have a link handy but I read this past week that there are 68 individuals who currently hold as much wealth as one half of the human population.
Uber, Lyft and Zip Cars plus public transport in the U.S. won’t fix Africa, or stop the sixth mass extinction event.
That too is absolutely correct! But then neither will our current system. Keep in mind that the US has roughly 5% of the world’s population and consumes about 25% of it’s finite resources. And that for all practical purposes most of the world, at least until very recently, aspired to live like Americans. What could possibly go wrong?
So anything that Americans and of course all the other citizens of first world countries do to change the system and reduce consumption is a step in the right direction, however minute that step may be!
Will that save Africa or stop the sixth mass extinction? Probably not… but doing nothing or continuing on the current course sure as hell won’t either!
I meant for this reply to follow Jimmy’s one thirty two am comment.
People are just biological machines, and do what they are programmed to do, by evolution, which is screw and make babies, until such time as they ( if lucky enough) get rich enough to learn about birth control, and adapt to using it.
Evolution is a blind process, with the “goal” of survival and growth. It does NOT provide brakes where none have ever been needed. Food for humanity has always been scarce, hence overeating has never been a significant problem, until very recently. There was no need for brakes to restrain the appetite, no need for brakes on the tendency of the body to store fat, because there was seldom an opportunity to store enough fat to endanger the individual.
A fat man in prehistoric times would have been a rarity, but suppose one did manage to obtain enough high calorie food to get nice and chubby, say for instance by eating a lot of nuts. He would have been at a little higher risk of being CAUGHT by a leopard, and eaten, but overall , much safer, because winter starvation was the much GREATER risk. ( An olympic sprinter hasn’t a prayer of outrunning a leopard!)
People in times gone by had lots of kids, and still do, because that is the result of screwing,which is the greatest of all pleasures, and because most kids DIED well before reaching adulthood. Mother Nature arranged it that way , not “deliberately” but relentlessly, because the name of the evolutionary game is survival thru reproduction.
I might not exist myself, if it weren’t for the fact that people used to have kids, in part, to ensure a labor supply of their own, and to ensure their own survival in their old age.
Folks in desperately poor countries ARE DOING THE RIGHT THING,by having lots of kids, from the point of view of their own individual survival, to the best of their knowledge.
There is a safety net, of sorts, for old people now, in wealthier countries, and if something happens to me, my ancient Daddy will be warehoused in a nursing home, where he will die in a few weeks of heartbreak and loneliness, being partially demented already.
Two or three generations back , he would not have outlived the last of his children willing and able to look after him, by more than twenty four hours.
What we need now, what would probably deliver more bang for the buck than ANYTHING ELSE, is probably four or five billion super sturdy little tv sets, with built in solar collectors and batteries, and a fleet of B52 bombers to drop them all over, any place where people are desperately poor, and then satellites with tons of programming in the various local languages.
After that ,keep them flying, dropping birth control pills, which are substantially cheaper than condoms, which stupid men don’t want to use anyway.
Since the tv already has the screen, and power supply, some of them ought to be upgraded to simple generic computer capabilities as well, so they can be used to practice writing, math, etc.
For anyone interested in this past Saturday’s Blizzard snow depth totals.
https://nwschat.weather.gov/p.php?pid=201601241956-KPHI-NOUS41-PNSPHI
Warning: fossil fuels content!
If 90 million barrels of oil were used yesterday, and the same amount is going to be consumed today, and another 90 million are going to be needed the next day, you’ll be able to predict how much will possibly be used in a 100 days.
Looks like 9 bi!!ion barrels.
2700 billion barrels, looks like the number of 100 day stretches to use 9 billion barrels of oil is 300, or 30,000 days of oil.
1300 gone, 1400 to go, 15,500 days, in approximately 15,500/365 or 42.5 years, the available oil will be less, not as much as there is now, and probably a lot less. Something else will be needed. Steam engines using coal is a good choice. You can run power plants, train engines, ships, even cars can run on steam. Coal as an energy source works. Old King Coal was a merry old soul and a merry old soul was he! I know it’s King Cole, just fiddling with words. All apologies for advocating the use of an energy source to create usable energy, a shameless shill. har
It was another Pleasant Valley Sunday yesterday here in Status Symbol Land, so it is all good.
The Panthers beat the Cardinals, which makes sense, cardinals are much smaller than panthers, so you can’t really expect cardinals to defeat panthers. It is not fair! lol
If only three percent of the total amount of oil is extractable, then .03 of the total amount of oil on earth is 2,700,000,000,000 barrels which makes the total amount 90 000 000 000 000, that’s 90 trillion barrels of oil trapped under the earth’s surface. 97 percent cannot be extracted, there are limits, finiteness.
It is impossible to use it all, yet it will be gone someday. OPEC will have to save some for later.
The Blizzard of 1949, what a series of snowstorms can do.
A steam engine buried in snow somewhere in Nebraska:
http://www.democraticunderground.com/1017167876
What’s Uber going to do when 100,000 fans want to leave the football stadium in Rotterdam and they all call Uber? Going to be a really long line. har
“What’s Uber going to do when 100,000 fans want to leave the football stadium in Rotterdam and they all call Uber? Going to be a really long line. har”
I guess if they got there, they can get back home the same way. Uber will not be all alone, and the public transit in Rotterdam will be alive and well.
In my opinion, there is a real possibility that a few decades down the road, people will not gather in crowds of a hundred thousand for such trivial purposes as watching a ball game, for the very specific reason that transportation to and from will be prohibitively expensive , due to the peaking problem.
My great great grandparents, when they were young, did not believe trucks and tractors would ever replace horses, but they lived to see it happen, for the most part. Hell, they never even SAW a truck or tractor until they had kids of their own.
Now I for one believe in technology marching right along, and believe I have a good shot at living to see autonomous for hire cars replace a substantial part of the existing conventional auto fleet.
I also believe that , to paraphrase Twain, the death of the coal industry has been greatly exaggerated, although no doubt the industry is going to go thru some tough times over the next couple of decades.
Renewables are not apt to be built out fast enough, and people are not apt to change their energy hog ways , fast enough, to enable us to give up coal anytime soon.
Political pressure brought by the environmental community, with ample and great justification, is SLOWING down the use of coal, and will continue to slow the use of coal, for some time, but once oil and gas are scarce enough for the prices of them to start getting out of hand, the calculus of political pressure will change fast. Even the greenest of the green young professional women will be glad to burn some coal, if necessary, to charge up her electric car, or the UBER car she summons, rather than walk or bike very far to work in the rain.
Truckers and farmers WILL bring pressure enough that if diesel fuel is not available in sufficient quantities, coal to liquid plants WILL BE BUILT, and operated. Ten or twenty dollar synthetic diesel is a world class bargain, compared to doing without.
A SUBSTANTIAL AMOUNT of coal will continue to be burnt, so as to manufacture NEW steel, etc, but old steel will most likely be recycled in ELECTRIC steel mills powered by wind and solar farms, backed up by coal fired generation, or hydro, once gas gets to be really scarce and expensive.
New technologies are not going to SAVE Old Man Business As Usual,not forever, but new tech will keep him out of the cemetery for a while , maybe two or three or more decades, by stretching out our remaining supplies of fossil fuels, and other non renewable resources.
Old Man Business As Usual is going to be replaced by his children, various members of a NEW GENERATION Business As Usual, in different parts of the world. Some of them will be sticks and stones kids, some nineteenth century industrial kids, some in between.
A few of them might be low energy, sustainable versions of BAU. MIGHT is the keyword.
There is a slight possibility fusion power will play a big role in new generation business as usual scenarios, and a good possibility that new nukes, safe and affordable nukes, that do not produce bomb fuel, will be commercialized and built in large numbers.
What’s Uber going to do when 100,000 fans want to leave the football stadium in Rotterdam and they all call Uber? Going to be a really long line. har
The Dutch all have bicycles so they won’t need to call Uber. And 100,000 fans would have a helluva time hailing cabs at the stadium if they tried that instead. Moral of the story is that the best way to go see the game will be to take a tram or train and walk from the station to the stadium, har har 🙂
The average U.S. producer was using more than 80 percent of its cash flow just to service interest payments when oil was at US$50 a barrel.
http://oilprice.com/Energy/Oil-Prices/How-Soon-Could-A-Sustained-Oil-Price-Rally-Occur.html
== quote ==
On January 19, Martin Pelletier, a portfolio manager with TriVest Wealth Counsel in Calgary, wrote an article in the Financial Post titled, “Why the price of oil will recover faster than you think.” He sees the crude production declines required to make a meaningful impact on the global supply / demand equation coming from U.S. light tight oil (shale) producers. Pelletier wrote, “Having covered the industry as a sell-side analyst, I’ve seen my fair share of reservoir models and production profiles. Shale wells have what is termed a hyperbolic decline curve, meaning they have upwards of a 75 percent decline rate in production in the first two years before they stabilize at substantially lower levels. They require continual drilling and a lot of capital reinvestment just to keep production flat, let alone grow it. Capital markets closed for business early last year and debt markets quickly followed suit, so these producers have had to rely on rapidly falling cash flows to continue drilling wells. The average U.S. producer was using more than 80 percent of its cash flow just to service interest payments when oil was at US$50 a barrel.
A interesting evaluation of Venezuela from a more left perspective
(Even Fernando would agree with some of the analysis, as much of the blame is put on the Bolivarian Revolution).
http://dissidentvoice.org/2016/01/the-two-lefts-and-venezuela/#more-61385
I agree with most of it. I liked it so much I sent it on tweeter so I can resend to @nicmerevans later. What that misses is the sheer amount of theft, and the little personal touches, like judge Lourdes Afiuni being jailed and raped, Basil da Costa being shot at Tracabordo by regime secret police, Nicolasito Maduro dancing as Syrian traders tossed money at him, the memo by the Podemos consultants advising the regime when to jail and release correspondents, a grandmother crying because two grandsons were shot by criminals, the emails I get from people begging for help to find medicines …. And of course the endless crap we read from communists who defend injustice, torture, and theft because it’s carried out by …..other communists.
Dear Mr. Jeffrey Brown:
Of all the contributors on this site, you have highlighted the problems inherent in counting condensates as crude. I am not a petroleum chemist so am not so familiar with the limitations of condensates. Could you briefly tell me what you can and can not use condensates for? I get that one can refine 30-45 WTI into gasoline and other useful fuels like jet fuel, but: Can you drive on condensates? or am I correct in believing the condensates can only be turned into heating fuels.
Thanks for your answer in advance
I’m actually not anywhere close to be a refining expert, and I think that Fernando can give you more detailed answers, but insofar as condensate is concerned, the biggest problem with too much condensate as a percentage of Crude + Condensate (C+C) refining feedstock is that condensate is deficient in distillate (jet fuel, heating oil, diesel, etc.) plus heavier components.
However, the quality issue, in my opinion, is something of a Red Herring.
My principal point is not that the liquid partial substitutes for crude oil, i.e., condensate, natural gas liquids (NGL) and biofuels, are deficient in quality compared to crude oil; my principal point is that the available data, at least in my opinion, strongly suggest that we have been on an “Undulating Plateau” in actual global crude oil production (45 API and lower crude oil) since 2005, while global natural gas production and associated liquids, condensate and NGL, have (so far) continued to increase.
The obvious question is that if it took trillions of dollars in post-2005 global upstream capex (spent on oil & gas projects) to keep us on an undulating plateau in actual global crude oil production, what happens to global crude oil production given the large, and ongoing, cutbacks in global upstream capex?
Hi Jeffrey,
Output of C+C decreases until oil prices increase, when oil prices increase sufficiently, oil company investment increases (real investment in new wells) and C+C output increases, at least until 2023. After that increasing investment might keep output flat for a couple of years if oil prices are high enough ($200/b in 2016$), but whether the World economy can grow at that oil price is an open question.
The scenario above is based on a URR for C+C less extra heavy oil of 2800 Gb (300 Gb higher than a Hubbert Linearization estimate). If the C+C less extra heavy URR is lower (2500 Gb), the peak will be sooner.
We can only speculate on crude only output as we do not have data for World crude only output. While condensate output has increased in the US, it may have decreased elsewhere, we just do not have the data. Also note that the amount of condensate per cubic foot of natural gas can change over time so we cannot assume if natural gas output increases by 10%, that condensate output has also increased by 10%.
True. The implied percentage increase in OPEC 12 condensate production from 2005 t0 2014 far exceeded the percentage increase in OPEC 12 gas production.
Hi Jeffrey,
OPEC reports NGL, condensate and unconventional crude together, it does not break out condensates, so there is no implied percentage of OPEC condensate unless you assume you can guess the amount correctly.
You think you can make a very good guess, my point it remains a guess.
Rune Likvern has argued that in many places in the World the amount of NGL per unit of Natural gas produced is decreasing, that does not tell us anything about condensate. Another issue is that many countries don’t report crude separately, some report C+C+NGL, some report C+C, and OPEC reports crude only data for OPEC only.
Basically we do not know the percentage of C+C that is condensate for the World, and for OPEC the condensate increased about the same amount as natural gas output increased from 2005 to 2014 (about 56% in each case). This tells us nothing about the rest of the World though.
EIA OPEC 12 C+C less OPEC 12 Crude Only = Implied Condensate
Did Global Crude Oil Production Peak in 2005?
http://peakoilbarrel.com/worldwide-rig-count-dropping-again/comment-page-1/#comment-546170
OPEC 12 Crude and Implied Condensate: http://i1095.photobucket.com/albums/i475/westexas/OPEC%20Crude%20and%20Condensate_zps12rfrqos.jpg
Incidentally, your third paragraph contradicts your first paragraph. Did you mean to say US in the the third paragraph?
I realized by the third paragragh that I could use EIA and OPEC data to estimate OPEC condensate.
The percentage increase in condensate from 2005 to 2014 was about 56%, the same as the natural gas output increase from OPEC over the same period (using BP data for 2014).
We do not have crude only data for the rest of the World so we cannot estimate condensate output unless we assume the rest of the World is the same as OPEC (which may not be the case) with condensate output increasing by the same percentage as natural gas output.
You might argue that in Texas this has not been the case, there has been more condensate per cubic foot of gas produced lately. I would argue this is due to the unique nature of the Eagle Ford play and is not likely to be a World wide phenomenon.
Here’s the data I have (annual averages):
EIA OPEC 12 C+C less OPEC 12 Crude Only = Implied Condensate
2005:
31.9 million bpd – 30.7 million bpd = 1.2 million bpd
2014:
32.4 million bpd – 30.0 million bpd = 2.4 million bpd
Which of course is a 100% increase in implied condensate production.
But in regard to refinery yields, here is a chart of refinery yields by API Gravity. Note that Cat Feed + Distillate Yield drops from about 55% at 39 API gravity (approximately the average API value for Brent & WTI) to about 20% at 42 API Gravity (which is the maximum upper limit for WTI crude oil).
Here’s a link to, and an excerpt from, the source document for the chart:
http://www.nrcan.gc.ca/energy/crude-petroleum/4561
As I have previously discussed, I suspect that US (and perhaps global) refiners hit, in late 2014, the upper limit of how much condensate that they could process if they wanted to maintain their output of distillates and heavier products, which plausibly contributed to the 100 million barrel build in US C+C inventories, from late 2014 to late 2015, as US refiners increased their net crude oil imports from December, 2014 to December, 2015.
*The more common dividing line between crude & condensate is 45 API Gravity, but EIA data indicate that about 40% of US Lower 48 C+C production in 2015 exceeded 42 API Gravity, which is the maximum upper limit for WTI crude oil.
Yeah, distillate yield is the big deal. Gasoline doesn’t move food.
Watcher,
The amount of fuel used for moving food in trucks and on trains is a pretty small part of overall oil use. Not a big deal at all.
Another thing about gasoline versus diesel engines.
Diesel tech has not advanced nearly as fast as gasoline tech, and modern gasoline engines are not nearly as far behind diesels in terms of efficiency as in former times.
And there is no inherent reason that a gasoline engine cannot be built to last as long as any diesel- and for a lot less money. It takes a fool, when it comes to managing his money, to buy a new diesel pickup truck.
As a matter of fact, a lot of people who use a medium sized truck, such as dump truck, on an intermittent basis, are going back to gasoline engines, because with diesel now being more expensive than gasoline, not to mention the record keeping involved due to burning diesel, which is not required when burning gasoline, the gasoline burning truck is the better deal.
The demise of the carburetor, and the arrival of fuel injection and computerized engine management, wiped out half of the advantage of the diesel in terms of fuel economy.
But gasoline powered trucks are in short supply on the used truck market, and a lot of people who would like to have one can’t find one at a reasonable price.
Most likely I will buy one more dump truck, even though I am retired, just to use it for personal projects. It will be gasoline powered, for sure, so long as gasoline is twenty percent cheaper than diesel fuel.
Diesels are more reliable, but cost an arm and a leg to repair if you do have a problem, compared to gasoline engines.
Gasoline account for about 1/2 of total U.S. consumption of liquid fuels
Gasoline and diesel consumption in the U.S. (mb/d)
source: EIA
The McKinsey refinery assay library paints a different picture of LTO compared to the NRCan API 42 condensate. The assay difference between LTO and WTI is de minimus. Sheesh, all you have to do is look at price. There is a de minimus price difference between Eagle Ford 47 and WTI.
> “Can you drive on condensates?”
Yes, but it’s illegal in most states (https://en.wikipedia.org/wiki/Natural-gas_condensate)
It is also harmful to modern engines due to its low octane rating ( about 30 to 50) and possible presence of cancerogenius additives (benzene) and sulfur. Before 1930 it was used as an ICE fuel in low RPM, low compression engines. Both Karl Benz engines, and early Wright brothers aircraft engines used it. It has a distinctive smell when used as a fuel, which allows police to catch people using condensate illegally.
The white gas sold today as a fuel for stoves is a condensate with the benzene and sulfur removed
Adding ethanol improves the octane number (https://en.wikipedia.org/wiki/Octane_rating) and makes it possible to drive regular cars on distillate. You need E85 mix for that.
My impression is that the drive to blend ethanol with gasoline (most of the gasoline now sold in the United States contains some ethanol) and introduction of E10, E15, and E85 that happened in the USA was at least partially dictated by the desire to blend condensate (as a substitute for gasoline) with ethanol killing two birds with one stone. Moreover denaturized ethanol contains at least 2% of condensate. All gasoline engine vehicles can use E10, so some amount of condensate is present in US gasoline almost by definition.
E85 (used only in flexible-fuel vehicles (FFV) ) allows blending of considerable amount of reprocessed condensate (probably 40-50%) with ethanol and still getting acceptable octane number. E85 is an abbreviation for an ethanol fuel blend of 85% denatured ethanol fuel and 15% gasoline or other hydrocarbons by volume, although the exact ratio of fuel ethanol to hydrocarbons can vary considerably while still carrying the E85 label. The ethanol content is adjusted according to the local climate to maximize engine performance. ASTM 5798 specifies the allowable fuel ethanol content in E85 as ranging from 51% to 83%.
Condensate has a very low viscosity and often used to dilute highly viscous heavier oils that cannot otherwise be efficiently transported via pipelines.
It’s official: China the most solar PV installed globally
Buried in the latest reports on 2015 solar installations is a fact that attests to the changed landscape of global solar markets: that China has surpassed Germany and now has the largest installed solar PV capacity of any nation on earth.
This fact was not missed by official state news agency Xinhua, which last Thursday reported that with 15 GW added in 2015 China has now reached 43 GW of solar photovoltaic capacity. This is below the estimates of major market analysts. Mercom Capital estimates that China has installed 46 GW of solar PV since 2009, and GTM Research puts cumulative installations to date at 50 GW.
This development was a long time coming, as China has been the world’s largest market for solar PV since 2013, with over 10 GW installed in 2013 and 2014. The nation plans to install 150 GW of solar PV by 2020, however China is still struggling with transmission issues and high levels of curtailment are being reported, particularly in western provinces.
Renewables International’s take:
Germany now #2 for solar behind China
It was fun while it lasted, but China has reportedly reached 43 gigawatts, compared to just under 40 gigawatts in Germany. The Germans have lost their status as the largest PV country in terms of installations in the world for good.
Reuters and Chinese media have both reported the installation of 15 GW of PV in China last year, bringing the country up to 43 GW. The full data are not yet in from Germany, but the country’s Network Agency reported 39.6 GW up to the end of November, with monthly installations having fallen to around 0.1 GW per month.
At current rates of new capacity additions, China is building 10 times more PV annually than Germany, which could never have remained the largest in terms of total installations anyway – the country is simply too small, though its power consumption remains the largest of any country in Europe (including Russia) at around 600 TWh, just ahead of France at above 500 TWh.
Here is a graph that accompanied the Renewables International story that gives a different perspective on the German energy transition than the ones often trotted out by certain people.
Data is data. It doesn’t have a perspective.
Germany spent more to install it earlier. Being an early adopter has advantages and disadvantages. If they want to call that help, that is simply their choice of words.
The price has gone down almost ten times and I suppose efficiency has gone up considerably. It is hard to believe that solar PV was competitive in the early 2000s as we were told. I guess we were lied then.
Solar is fantastic if you live between 40°N and 40°S. Outside that you get most of the energy when you need it the least.
Well, I live at 18°N and this is what we’ve got coming down the pike:
JPS, New Fortress pursuing separate parts of LNG project
JPS is also in final negotiations with General Electric (GE) as the primary equipment supplier for the Old Harbour plant.
“JPS is currently finalising the agreements with both GE and the ‘EPC’ contractor and coordinating the start of this new generation facility with the completion of an associated LNG facility that will be built to provide gas. These two projects will total over US$500 million and begin operation in early 2018 with full commercial operation by the middle of 2018,” said JPS via email.
In 2018 when the generating plant and the LNG handling facilities are complete, any guesses as to what the price of LNG will be?
I guess we owe the Germans a debt of gratitude for providing incentives to nurture a market that, has resulted in the dramatic decline in the price of PV systems. Maybe if it were not for them the 20MW PV project currently under construction in Jamaica would not be happening now.
How much of the 20MW is DG – Rooftop Distribution Generation?
The 20MW is a single 160 acre site with ground mounted arrays. See:
PM breaks ground for US$60m solar energy plant in Clarendon
In terms of DG, I asked a former college classmate of mine who works in the government ministry that, is responsible for energy and he told me that, they are trying to figure out how to get a fairly accurate fix on it.
I decided to make a wikipedia entry on Solar power in Jamaica and included a table featuring 18 installations larger than 50 kW in size, for which I could find on-line references. As a background to this, I have a spreadsheet with over 180 installations that I am aware of, either from seeing them from the ground or from Google Maps Satellite View or from installer web pages. My spreadsheet has over 180 entries, 105 of which I could not get information for. About 30 are residential properties the rest being commercial/industrial, hotels, hospitals or schools. Those that I have data for amount to 7908 kW of installed capacity. I could use NREL’s PVWatts calculator to get a reasonably accurate estimate for the installations that are visible from the satellite but, that’s not something I’m that interested in doing.
There is nothing even remotely close to the EIA’s electric power monthly compiled by any department of the Jamaican government or if there is, it is not publicly available. As for one day old data like that put out by the California Independent System Operator (CAISO) or the almost real time data on Germany from the Frauhoffer ISE’s Energy Charts web site, forget about it!
Then you owe that debt of gratitude to the Spaniards, also. That dip in your graph between 2007 and 2011 was Spain’s push to become a world solar power.
I suppose we would if the data supported that assertion but, I put together a little spreadsheet using data from wikipedia’s Growth of photovoltaics page (tables at the bottom of the page) and the data doesn’t support your assertion. I did a little graph showing the installed capacity per year of the top five countries by installed capacity in 2007: Germany, Spain, Japan, the U.S.A. and Italy. The graph shows that Spanish added capacity exceeded that of all except Germany in 2007 and Spain had the highest added capacity in 2008 only. From 2009 on the Spanish contribution to worldwide added capacity has been absolutely pathetic so, no the world does not add a debt of gratitude to Spain. The honors go to Germany, Italy, Japan and to a lesser extent the US. Since 2010 China’s installations have grown rapidly and China is now doing the heavy lifting.
Tsk, such ingratitude.
Spain went from #4 in 2007 to #2 in 2008-2010 in total solar installed and was #1 in solar installation in 2008. Of course the subsidies to do that were about to bankrupt the country.
Then we went over peak oil consumption and we did no longer need more energy and we could not afford the subsidies. Without the subsidies the solar does not get installed even in a country with so much sun as Spain. Now the situation is even worse, there are disincentives to install solar PVs by particulars as electric utilities no longer have to buy their electricity, so they have to give it away, and there is a special tax if your solar installation is hooked to the grid. Electric utilities have a lot of power in Spain.
Electric utilities have a lot of power in Spain.
Yes, Tony Seba describes that as “Regulatory Capture” and it is now being attempted/practiced in several states in the US. The states where it is being practiced are not experiencing the same level of growth as the states where Regulatory Capture is not being practiced or has been unsuccessful.
Dear Jeffery Brown,
Thank you so much for the effort it took to write that response to my question. This blog serves to bring a beacon of truth onto the subject of energy. Ron should be congratulated as well for his outstanding service for making it all possible.
Dana Gardiner
Good work Ron, as usual.
Gail has posted what I think is probably the most important chart defining our ‘predicament’.
https://gailtheactuary.files.wordpress.com/2016/01/global-breakeven-prices-vs-daily-global-production.png
This shows that of all global ‘oil’ production, only about 20 million bbl per day has a cost or production below the current price of oil. This is produced by Saudi Arabia, Iran, Iraq and Kuwait. The rest (USA, Canada, Russia, China, Venezuela, UK, Norway and everybody else) are simply going broke fast, or faster, depending on their actual costs.
Check out..
http://ourfiniteworld.com/2016/01/19/why-oil-under-30-per-barrel-is-a-major-problem/
This does not look good…
Thanks Adam, I will have a new post late Wednesday. I am going to post that chart then, along with some comments and questions.
> Gail has posted what I think is probably the most important chart defining our ‘predicament’.
The chart is very questionable. Saudis costs are listed at $25, while they need above $90 to balance the budget. Russian costs are listed as around $80 while Russia can balance the budget at $50 and definitely is OK at $70. The cost of US shale production are shown as below the cost of US conventional production. Unless I misunderstood something this is simply wrong.
Her point 4 ( Oil demand doesn’t increase very rapidly after prices drop from a high level) is questionable too ( 2015 had shown pretty rapid increase in oil demand, far exceeding initial forecast by EIA).
Her view about demand suppression at high oil prices while reasonable in general, is IMHO questionable too at the range of oil prices we already observed (let’s say prices below $120).
While the idea of secular stagnation of western economies in high oil prices regime is probably valid (and pretty common in the literature on the subject) what price range we should understand as high is open to discussion. This is probably more connected with EROEI then with the price as such. Please note that the current low oil price did not lead to noticeable acceleration of western economies in 2015. .
Those charts are always wrong because we lack good data on break-even prices and because it is a moving target, as prices evolve. But they all look very similar with oil from Middle East OPEC the cheapest, conventional oil from rest of the world intermediate, and shale, bitumen, deep sea and Arctic as most expensive.
Gail is right in that oil demand is very sensitive to oil price raises and very insensitive to oil price decreases. There has been a small increase in oil demand in 2015, from about 1.2% demand growth to about 1.8% in 2015. Demand is expected to increase less in 2016, about 1.6%. These increases in demand have been lower than the increases in supply. Hence the price problem.
I find Gail views quite well founded. Let’s remember that She placed peak oil in 2015 quite some time ago.
The price of oil that economies are able to withstand without going into recession is also a moving target. If you calculate it on a historic graph you are likely to get it wrong, as it depends on things like economic growth, debt expansion and interest rates changes. In the current state of the global economy, with slow growth, China and US reducing their rate of debt growth, and a modest increase in interest rates I seriously doubt that the economy can afford an oil price above 60$/b without going into recession.
The chart is very questionable. Saudis costs are listed at $25, while they need above $90 to balance the budget. Russian costs are listed as around $80 while Russia can balance the budget at $50 and definitely is OK at $70.
Likbez, the chart has nothing to do with what it takes any country to balance their budget. It is an estimate of what it cost that country to produce a barrel of oil. That figure may or may not be off but the size of any country’s budged has no bearing on what it cost them to produce a barrel of oil. Don’t mix apples with the oranges.
Ron,
> the size of any country’s budged has no bearing on what it cost them to produce a barrel of oil
There is an interesting nuance here. If prices do not return to this level ($90+ per bbl) in, say, five year period, the chances are that Saudi Arabia seize to exist as a country. So it will be some other country cost of production.
Sorry Ron – Trying to remember how to insert an image in my post. Please delete.
recent piece from Kurt Cobb at Resource Insights.
excerpt…
A year ago I said the crash in commodity prices signaled a weak economy and that financial markets would eventually have to reflect this fact. The widely watched S&P 500 Index closed at 1,994.99 on January 30, 2015 just prior to the publication of the linked piece. Last Friday’s close was 1906.90. The U.S. stock market hasn’t exactly reflected the weakness in commodities, but it hasn’t gained any ground either.
In addition, last August I wrote that low oil prices were also a reflection of this weakness and that all the talk about cheaper oil giving a boost to the economy was misplaced because of the immediate loss of oil-related employment and of revenues to companies and to governments which, of course, tax the oil. The S&P 500 is down about 200 points since then, but any significant adjustment still looks like it lies in the future.
Of course, starting in August stock markets around the world began to fall. Central banks reacted with words of support, and the U.S. Federal Reserve Board of Governors put off a long-anticipated interest rate hike because of weak market conditions.
Stock prices then rebounded to near their previous levels and all was forgotten…until the beginning of this year. The continuing rout in oil prices began to underline not only the weakness in the global economy, but also the unclear situation at major banks holding large energy-related loan portfolios. The Dallas Federal Reserve Bank was reported to have encouraged banks in its jurisdiction to forebear on energy loans. Essentially, the Dallas Fed was telling banks to ignore losses in their energy portfolios until further notice so as not to cause a panic. The reserve bank quickly denied any such guidance to member banks.
The truth in this particular instance may not matter since what we do know–that energy-related junk bond losses are at 2008 crisis levels–could suggest that energy-related losses at the world’s banks may end up being the size associated with the subprime mortgage crisis that brought the global economy to its knees in 2008. It is worth remembering that in 2007 then-Federal Reserve Chairman Ben Bernanke assured the U.S. Congress that “the impact on the broader economy and financial markets of the problems in the subprime market seems likely to be contained.”
These and other anxieties moved stock markets and oil down sharply last week before a bounce that was in part inspired by central bankers in Europe, Japan and China who all signaled the possibility of more easing.
http://resourceinsights.blogspot.com/
“Iraq’s oil ministry said on Monday that the country had record output in December, with its fields in the central and southern regions producing as much as 4.13 million barrels a day.”
That does not even include Kurdistan.
http://www.cbc.ca/news/business/markets-feb25-1.3418170
On the bright side, at least there’s going to be plenty of cheap gasoline for the whole world…forever?
Iraq may further raise oil output this year: senior official
Mon Jan 25, 2016
http://www.reuters.com/article/us-iraq-oil-idUSKCN0V3193?mod=related&channelName=ousivMolt
Iraq may further raise oil output this year, reaching levels as high as 4 million barrels per day (bpd) from the country’s south, a senior Iraqi oil official, who asked not to be named, said on Monday.
Iraq has been producing from its southern fields around 3.7-3.8 million bpd in recent months.
September was 4.4 mbpd. for all of Iraq.
http://www.platts.com/latest-news/oil/vienna/iraq-capable-of-crude-production-of-at-least-27482474
6mbpd by 2020
There was a prediction of 12 mbpd by 2018 just a few years ago.
Crude price crash vs subprime
http://www.bloomberg.com/news/articles/2016-01-25/so-yes-the-oil-crash-looks-a-lot-like-subprime
“The point here is not that oil is necessarily the new subprime crisis per se but that the recent action in the price of crude resembles nothing if not the bursting of a bubble and
** the sudden realization that the asset has been overvalued for too long ** ”
Geeezzz .. I fear we shall see true value.. , What did housing shortages have to do with WWII? Does Russia deploy S400’s in St Petersburg (Florida) hoods? Nothing is over till we decide it’s over! Was it over when the Germans bombed Pearl Harbor?
https://www.youtube.com/watch?v=V8lT1o0sDwI
Meditations on booms, busts, oil prices, sales taxes, Albertans and their governments
AlbertaPolitics.ca, David Climenhaga, January 2o, 2016
The zero hedge article stoked my interest as pertains to American Eagle Energy.
What reasons will the same fate not befall the other primarily Bakken players, assuming the financing dries up?
Clearly American Eagle Energy’s metrics were worse than their Bakken peers, but not maybe as bad as might be expected.
The thing that I keep wonder is when do we see the M &A in the Bakken, or any of the LTO plays, for that matter?
Why not a hostile bid for WLL, trading at $6, or OAS at $4, etc? What, if anything, do the supermajors know? Or are they just as scared as the rest of us, not knowing what to think?
AlexS, why wouldn’t a Russian supermajor take a shot at one of the US LTO companies? They might be able through that to get a leg up on the tech needed to exploit Russian LTO later on, when the price of oil makes sense to do so?
shallow sand,
Due to the high legacy decline rate, shale companies are not backed by worthwhile assets (long term producing wells). It is better for big companies to start a shale operation from scratch – if they think it is a good option. In the recent shale bankruptcies bondholders have got a maximum of 15 cents on the dollar, which is in many cases not enough to cover legal fees. This explains also the extreme nervousness of bondholders as their holdings are backed basically by nothing. Slowly investors are waking up to this fact. It still takes time, yet it turns increasingly into a panic. Men go mad in herds, yet recover their senses one by one.
shallow,
debt is the reason nobody wants to buy these companies out. Quicksilver just sold itself for $250 million. Company debt was in excess of $2.35 billion, so debt holders recovered 10-12% of invested money. That is a really horrific recovery level for debt. The company claimed its assets were worth $1.2 billion when initially filing for bankruptcy in March of 2015. American Eagle sold for $45 million with debt at $215 million, so a slightly better recovery, but keep in mind those properties sold in October when oil was in mid-to-high $40s.
WLL, OAS, and a number of other names have too much debt, which would need to be made whole if somebody purchases companies outright. Nobody would step up to the plate until these guys are bankrupt. Once bankruptcies take place buyers will emerge.
From what I remember, American Eagle issued a bond and missed its first interest payment. Kind of reminded me of the housing/subprime debacle when you had borrowers missing their first mortgage payment.
I agree with Dan’s assessment. Why buy the company, saddled as it is with catastrophic debt levels, when you can either buy bonds at very low prices to get the assets, or alternatively wait for BK and buy the assets at knock-down prices in an auction? And regarding tech, again, wait for BK and snap up the newly unemployed star engineers.
So do you think all of the LTO companies will go BK? Is Wall Street still overvaluing these companies?
I completely understand the responses to my question. However, look at where companies such as Marathon Oil, Anadarko, Apache, Hess and ConocoPhilips are trading. Yet little merger talk, other than Anadarko/Apache recently.
shallow,
equity in all of these names is priced as if oil is at $60. All shale companies are technically bankrupt as none have full-cycle costs below $60. Drilling within cash flows (without hedges) would result in declining production unless prices go back to $60-65 range. Even then, drilling within cash flows would allow for flat production for less levered Permian names and maybe EOG, while the rest would still witness declining production.
MRO, APC, APA, HES, and COP are considerably leveraged and in COP’s case management is stubbornly keeping that hefty dividend payout.
Considering where equity is still priced for these names, I have to believe that market expects oil prices to double in a very short time. In October they were pricing oil at $70-75, now they are down considerably and are pricing WTI around $60. Of course, we are nowhere close to those levels, thus equity is still way overpriced.
shallow sand,
There’s an article at Bloomberg/oil and gas about private equity investment picking up in distressed oil and gas companies. The money goes to drilling new wells, with the investor getting a set part of the cash flow to start with, later giving back most of its participation. I believe it’s an old model, with private equity being the innovation.
Gwalke wrote: Why buy the company, saddled as it is with catastrophic debt levels, when you can either buy bonds at very low prices to get the assets,…
No, it does not work that way. The bankruptcy court decides how the spoils will be divided and the bondholders usually get nothing. That’s why they call them “junk bonds”. They have a very high yield but stand a chance of going to zero.
or alternatively wait for BK and buy the assets at knock-down prices in an auction?
Well the assets will definitely be a lot cheaper after bankruptcy but not likely a real bargain. An auction is just that, everyone gives their bid and the very highest bid gets the assets. Big companies will be putting their bid in also. The assets will therefore be sold at a fair price, or very close to the price they are actually worth to a major producer. That definitely does not mean a dirt cheap price.
The assets will therefore be sold at a fair price, or very close to the price they are actually worth to a major producer. That definitely does not mean a dirt cheap price.
Why not?
Dirt cheap IS all they’re worth at this price of oil.
No Watcher, you simply do not understand. I think anyone would define “dirt cheap” as something well below “fair price”. Dirt cheap is not a synonym for fair price. It would be far closer to the opposite of a fair price.
A fair price is what it’s worth. Dirt cheap is a price well below what it’s worth.
Oh maybe. Words. A fair price might be dirt cheap.
The sum of its parts is worth more than its whole.
A local construction company placed itself up for sale, no buyers. The company had an auction and made more money than the asking price.
Plenty of buyers when it’s one piece at a time.
shallow sand asked:
“why wouldn’t a Russian supermajor take a shot at one of the US LTO companies? They might be able through that to get a leg up on the tech needed to exploit Russian LTO later on, when the price of oil makes sense to do so?”
It can make sense, and Rosneft actually owns a stake in the tight oil Cardium development project in Canada
http://www.rosneft.com/Upstream/ProductionAndDevelopment/international/Kardium_Canada/
But further acquisistions in the U.S. are not possible due to the regime of sanctions which prohibits transfer of shale and Arctic offshore technologies
Interesting line from ExxonMobil’s Energy Outlook 2016
“North America, which for decades had been an oil importer, is on pace to become a net exporter around 2020”
Are they dreaming or forgot to remove this line from previous projections?
Only 4 years are left till 2020. You need to compensate for all the USA imports and that means that they forecast more then 8 Mb/d of oil production growth for the continent or more then 2 Mb/d per year. This and the next year should probably be written off as the necessary capex are not here. So we have two years left. That means 4 Mb/d growth is needed for 2018 and 2019. Even with prices over $100 per barrel this is a difficult task. I wonder which countries in North America are capable to grow oil production over 1 Mb/d ? Dramatic USA shale/tight production growth is probably in the past.
Yep. Common sense seems to have left the building. A lot of decisions are however made due to info like this..
likbez,
Canada and Mexico are net oil exporters. Canada is expected to increase oil production by 2020.
Canada and Mexico are net oil exporters. Canada is expected to increase oil production by 2020.
That’s not saying a lot. What are they expected to do in 2016, 2017, 2018 and 2019.
Hell, 2020 is five years away. The world could go to hell in a handbasket by that time.
If not for the drop in oil prices, North America could reach the status of net exporter of oil and other liquids by 2017
North America net imports of petroleum and other liquids (mb/d)
Source: EIA
Alex,
US imports are over 8 Mb/d in 2015 ( http://www.eia.gov/dnav/pet/pet_move_impcus_a2_nus_ep00_im0_mbblpd_m.htm )
Here we have for 2015 only 19.37-15.03=4.34. Does this mean that the USA is refining around 4Mb/d for re-export of distilled products or what ?
US net imports of crude and products
Exxon expects continued growth in oil sands and NGLs production and rebound in LTO output by 2020.
Personally, I am not sure that in a low oil price environment, the goal of “oil” (total liquids) independence within North America is achievable by 2020. Thus, I think that the U.S. C+C production may only return to 2015 peak levels by 2019 or 2020, depending on the strength of the oil price rebound
Liquids trade balance by region (mb/d)
Source: ExxonMobil. The Outlook for Energy: A View to 2040 (2016)
note:
http://www.scientificamerican.com/article/carcinogenic-chemical-spreads-beneath-american-town/
I have speculated a lot about how much oil storage is being built these days, to take advantage of the cheap price, mostly.
But producers with money available may be building storage partly to enable them to keep crews together, and avoid costly shut in procedures, which can damage some oil fields.
I found a piece which came iirc from oil price dot com originally saying there is a hell of a lot of storage construction activity going on world wide, which means a hell of a lot of oil IS going into storage, but I failed to book mark it and cannot find it again.
But I did run across this site, which has a lot of stuff of interest to the peak oil community, and especially to the hands on guys and traders.
It’s well worth a bookmark.
http://www.tankstoragemag.com/news_feed/
http://www.voanews.com/content/smuggling-venezuela-economy/3162671.html
Read this and weep for the insanity that is Venezuela these days.
Nobody can produce goods, and sell them, long term, for less than the cost of production. If a person sells in a Venezuelan market, legally, he gets the useless local currency.
This article focuses almost entirely on the smuggling aspect of the enonomic troubles, which leads me to think maybe the VOA, and the authors, don’t want to say much about the idiocy of the socialist government mismanaging things so badly.
It barely mentions filling up a car for a few cents, in hard currency, with gasoline worth many times more, or the inability of people to get a price for stuff, in the official currency, that allows them to stay in business.
Whatever they take out, smuggling, results in something coming back in. NOTHING is said about what the smugglers get, but in most cases it will be hard currency, of one sort or another, which WILL buy goods and services inside the country.
Sometimes you have to read between the lines of the western msm to understand what is actually happening, in the same way that Russians had to read between the lines of the old Soviet state controlled press. What was NOT said was often considerably more important than what WAS.
One little tidbit, that a state owned tanker was stopped for smuggling, says it all. Sometimes reporters and editors manage to slip in such small items for those willing to do a little thinking for themselves.
How high up would you have to be , to control the loading, sailing,and unloading, of an ocean going ship, belonging to a government?Without the load undoubtedly stolen, and the proceeds to be stolen, as well?
Astronomy Trivia
ONE TRILLION KILOMETERS APART: A LONELY PLANET AND ITS DISTANT STAR
Astronomers have found a planet, until now thought to be a free floating, in a huge orbit around its star. Designated as 2MASS J2126, it’s about one trillion km from the star (7000 times the Earth Sun distance). At such a distance it takes roughly 900,000 years to complete one orbit so it could be a long time before the next Christmas rolls along; solar panels wouldn’t likely be a great bet either – in spite of what wimby will say.
http://www.sciencedaily.com/releases/2016/01/160126091039.htm
Solar panels would be better prospects than local oil plays.
Doug L,
7000 AU!
The inhabitants think all the stars are theirs, I bet, not just one. Lucky critters.
oil price forecasts continue to be revised downward:
World Bank slashes 2016 oil price forecast
Tue Jan 26, 2016
http://www.reuters.com/article/us-oil-outlook-world-bank-idUSKCN0V41XJ
The World Bank has slashed its forecast for crude oil prices by $14 to $37 per barrel for 2016, it said on Tuesday, amid growing supply and weak demand prospects from emerging markets.
In its annual Commodity Markets Outlook, the World Bank lowered its price forecast for 37 of 46 commodities, including oil, saying that weak demand from emerging economies is likely to continue.
World Bank economists said weak demand would continue even as oil supply grows with the resumption of Iranian exports, continued U.S. production and a mild Northern Hemisphere winter.
Oil prices should decline another 27 percent in 2016 after plummeting by 47 percent last year, according to the outlook. The World Bank uses an average of Brent, Dubai and West Texas Intermediate oil, equally weighted.
“Low prices for oil and commodities are likely to be with us for some time,” said John Baffes, senior economist and lead author of the report.
World Bank economists said they expect a gradual recovery in oil prices over the course of 2016 but the rebound will be smaller than in previous years that followed sharp declines, including 2008, 1998 and 1986.
A Reuters poll in January showed that crude oil prices were unlikely to rally much in 2016 because of subdued demand and rising supply, even though non-OPEC output was expected to moderate.
Earlier in January, the World Bank cut its forecast for global economic growth due to the weak performance of emerging economies.
All main commodity price indexes are likely to fall in 2016 amid a supply glut and a slowdown in demand for industrial commodities from emerging economies.
Emerging market economies have been the main sources of growth in demand for commodities since 2000.
==================================
Credit Suisse cuts oil price forecasts by more than $10 on supply glut
Tue Jan 26, 2016
http://www.reuters.com/article/us-research-crude-creditsuisse-idUSKCN0V41B3
Credit Suisse on Tuesday cut its crude oil price forecasts by more than $10 for 2016 and 2017 citing high inventories and slower demand growth.
The bank slashed its 2016 price forecast for Brent crude to $36.25 per barrel from $58.00 earlier, while lowering its 2017 outlook to $54.25 per barrel from $65.
It also cut its 2016 WTI crude price outlook to $37.75 per barrel from $56.44, and for 2017 to $54.25 from $63.31 per barrel.
The Swiss bank, however, said prices were likely to converge back to the $60 per barrel levels required to grow American shale in the next few years.
AlexS. I agree with Daniel’s post above. I do not think we see much supply growth in the US at $60 WTI.
Hi shallow sand,
I agree with your assessment on US oil supply at $60/b especially if the $37/b average oil price forecasts for 2016 are correct.
I also think World oil supply will fall rather than grow at a 2016 average oil price of $37/b. Either the price will be correct and supply will fall along with a fall in demand (implying a World recession) or supply will fall, demand will be as forecast and oil prices will rise to a higher average 2016 level than recent forecasts. Time will tell, it always does.
Oil price will average $65 in the future. In 2015 dollars.
Alex,
I think your recent posts can be viewed as a sign of capitulation which might mean that recovery of oil prices is closer then many suggest 😉
http://www.telesurtv.net/english/news/Venezuela-Launches-Revolutionary-Summit-20160123-0008.html
I believe anybody who looks at this site , and reads the stuff there, will understand a lot more of what is going on in Venezuela.
I will leave it at that.
Everybody will come to their own conclusions.
With consumption increasing and production decreasing I feel safe forecasting a price stabilization or rise. Although Iran production will increase I don’t think it’ll be entirely exported. Some will be consumed domestically to power manufacturing and agricultural production and exports. Iraq is a wildcard. Maybe Iraqi increases will simply offset unconventional and LTO declines and production will stay flat. The real wildcard is OPEC. The price will go up as soon as they have a meeting and decide it does. I feel KSA is waiting for non OPEC producers (Russia) to get on board with agreeing to production quotas. At the moment KSA is demonstrating just how volatile things can be for everybody in the oil production business. Once everyone is on board with quotas then some price stability can be more easily predicted.
https://www.eia.gov/forecasts/steo/report/global_oil.cfm
EIA estimates global consumption of petroleum and other liquid fuels grew by 1.4 million b/d in 2015, averaging 93.8 million b/d for the year. EIA expects global consumption of petroleum and other liquid fuels to grow by 1.4 million b/d in both 2016 and 2017. Forecast real gross domestic product (GDP) for the world weighted by oil consumption, which increased by an estimated 2.4% in 2015, rises by 2.7% in 2016 and by 3.2% in 2017.
Consumption of petroleum and other liquid fuels in countries outside the Organization for Economic Cooperation and Development (OECD) increased by an estimated 0.8 million b/d in 2015, considerably lower than the 1.4 million b/d increase in 2014 mainly because of the slowdown in Eurasia, which saw a contraction in its consumption, and to a lesser degree because of China’s slightly slower demand growth. Non-OECD consumption growth is expected to be 1.1 million b/d in both 2016 and 2017, reflecting higher growth in the Middle East and Eurasia.
OECD petroleum and other liquid fuels consumption rose by 0.6 million b/d in 2015. OECD consumption is expected to continue rising in both 2016 and 2017 by 0.3 and 0.4 million b/d, respectively, driven by an increase in U.S. consumption. OECD Europe demand is also expected to increase through the forecast period, albeit at a slower pace than the 0.3 million b/d increase in 2015. U.S. consumption is forecast to increase by 0.2 and 0.3 million b/d in 2016 and 2017, respectively. Consumption in Japan is forecast to decline by less than 0.1 million b/d in both 2016 and 2017.
The EIA’s Electric Power Monthly with data for November came out today. The total electricity generated was down to three quarters of the maximum amount generated in July. Hydroelectric, wind and Nuclear were up on the amounts generated in October. With a month to go before the winter solstice, solar was down, as is to be expected but, even at it’s maximum it did not generate the 1% needed to lift it off the base line. If distributed (rooftop) generation were to be included, solae (thermal + PV) would have exceeded 1% from April through to August.
The really interesting part is that coal and gas were both down with coal remaining below gas for another month, meaning that gas has generated more electricity than coal for six of the eleven months up to November. In terms of absolute totals for the year, coal has still generated more electricity than gas for 2015 so far.
Electric power generation up to November 2015.
from…
Econbrowser
Analysis of current economic conditions and policy
Can lower oil prices cause a recession?
This entry was posted on January 24, 2016 by James_Hamilton.
http://econbrowser.com/archives/2016/01/can-lower-oil-prices-cause-a-recession
http://www.zerohedge.com/news/2016-01-26/oil-prices-2016-will-be-determined-these-6-factors
“A 2 percent oversupply in a world where we cannot even measure within 5 percent with any certainty drops the price of crude over 70 percent and has every analyst that claimed just 2 years ago that we would never see crude below $100 again now claiming that we won’t see oil above $40 anytime soon. They were wrong then, and they are wrong now.”
http://www.zerohedge.com/news/2016-01-26/oil-prices-2016-will-be-determined-these-6-factors
Price not going up ? or just hedging.. Damned if you do Damned if you don’t.. Total Insanity
Longtimber,
Very interesting. Thank you !
I like the following observation “A 2 percent oversupply in a world where we cannot even measure within 5 percent with any certainty drops the price of crude over 70 percent and has every analyst that claimed just 2 years ago that we would never see crude below $100 again now claiming that we won’t see oil above $40 anytime soon.”
I agree that those claims about oversupply of less then 1 Mb/d made with strait face by people who are basing their judgment on figures which have accuracy 1% in best case and world production of over 90 Mb/d are irritating. This is a pure “doom and gloom” propaganda and should be treated as such.
In this sense there is something fishy in most of the talk about “oil glut”. Looks more and more like a desperate attempt to save Western economies from the secular stagnation which they have found themselves after crash of 2008 and if not to push them into more rapid growth, then prevent sliding into another recession. May be with some geopolitical motives as well.
With conservation efforts, US shale/tight oil industry, Canadian sands and Arctic drilling thrown under the bus.
In other words all talk about glut is just a smokescreen for something else. Note the level of sentiment manipulation by MSM (oil glut “doom and gloom”) and questionable behavior of agencies such as EIA and IEA. Actually not that questionable; keeping oil prices as low as possible is, essentially, part of their statute. That’s why they were created in the first place.
IMHO the current situation is mainly the result of a trifecta of Saudis dumping of oil (political decision that has nothing to so with “defending market share” explanation; with Saudis action serving as a trigger which allowed Wall Street to push oil into downward spiral), a glut of condensate (aka “Great Condensate Con”) which EIA and friends count as oil and “naked shorts” in monetized futures market, where you no longer need to have commodity on the other side of the contract to short it. So it is pure gambling.
Futures market now literally drive oil prices. So “tail is wagging the dog” (with generous help from EIA) quite literally. Wall Street yet another time managed to royally fleece naïve investors who wanted to earn some pennies on recovery of oil prices and lost dollars in the process.
So the question how long can we live in this “artificial reality” is an interesting one. But I think that wake up to reality might be pretty abrupt.
Artificial Fishy Synchronicity: “Everything’s changed since last year,” “Historically, the correlation between oil and stocks has been tighter during recessions. As the financial crisis spread in 2008, it spiked above 0.8.”
http://davidstockmanscontracorner.com/oil-and-stocks-dance-the-bear-market-tango-tightest-correlation-in-26-years/
US peeps ( excluding investors ) are frightened of being bankrupted by Health scam than high Energy costs. What’s next ?
Longtimber, the reason low oil prices are not helping is the low prices are too extreme, IMO.
This is the worst oil bust in USA, post Great Depression. The benefit of $1.50 gasoline v. $2.50 gasoline is outweighed by the massive business failures at $15-25 well head oil, v. $55-65 well head oil.
Yet, despite the stories of massive CAPEX cuts, there is apparently too much oil. And, even with the massive CAPEX cuts announce, LTO companies will STILL be cash flow negative. Why are creditors not demanding all cash flow go to debt principal reduction? Don’t they see how little these assets are worth, based on the BK sales?
Kind of like there is supposedly too much corn, yet local grain elevators began paying .30 ABOVE big board prices, because they are low on corn.
The benefit of $1.50 gasoline v. $2.50 gasoline is outweighed by the massive business failures at $15-25 well head oil, v. $55-65 well head oil.
Says the producer. The aggregate annualized expenditure decline of $450 billion for U.S. consumers at $30 relative to $100 oil disagrees. Says the consumer.
Yes. A boon to those who consume and own no investments (90% oil stock market correlation).
Or are talented day traders with shorting ability.
I tell you marmico, I never saw this low for this long.
Also, $100 oil doesn’t equate to $2.50 gasoline. $55-$65 is the oil price I am driving at.
I agree $100 is no good, $30 either IMO, unless you are adept at trading it up and down.
Finally, how much of the $450 billion is taken out of the pockets of labor and business owners in the United States?
Why are the markets not booming with these low gasoline prices, which, combined with gas mileage for the fleet, are possibly the lowest since the 1960s?
Grain is low, is this helping the consumer also?
Copper is low, is this also helping the consumer?
Don’t get me wrong, commodity price spikes hurt. But the commodity prices here are deflationary, IMO.
> The aggregate annualized expenditure decline of $450 billion for U.S. consumers at $30 relative to $100 oil disagrees.
> Says the consumer.
Think about this not as savings for US consumers but as a re-distribution of 450 billions up to the top 1%.
Those $450 billion are partially paid with destroyed job, reduced maintenance, bankruptcies and huge (50% or more) losses for investors in energy companies, mutual find, ETFs and oil ETNs (here naïve investors were simply wiped out).
Oil producing countries will take measures to stem this damage in the future by bumping up their refining capacities and cutting exports from G7 countries to the bones. Oil producing countries were major buyers of G7 exports. Russia already made such a cut. Germany alone lost around 40 billions in exports to this country. And those exports will not return even if oil prices recover. They are mostly gone. The US oil majors might also be affected with this backlash as this slump is widely considered to be US+Saudi conspiracy. I wonder if some nations might try to kick them out.
As energy is around 7% of S&P500, many 401K accounts are also affected. For older people who have larger sums in 401K losses from this may exceed savings at the pump.
Also investors in energy ETFs and mutual funds suffered huge losses (50% or more) and those who invested in ETN were wiped out. Few of those who sold their holdings and took losses will ever return to this sector.
In five states with shale oil patch damage from low oil prices collapse spread to municipal bonds, real estate and retail. Those states are effectively back in 2008.
Oil conservation efforts were slowed down and in some cases reversed (SUV boom in the USA) .
So even for the US consumers this slump is a mixed blessing. The only winners are Wall street sharks. Again, this is yet another redistribution of wealth up. This is how neoliberalism works..
There are always buyers and sellers buying and selling at prices both higher than and lower than so called big board prices, this being brought about by local or regional shortages and surpluses, and local or regional changes in consumption. But the price never varies very much from the so called big board price, because it is easy to ship commodities such as corn.
But it takes a few weeks for the buyers and sellers to get together and actually complete deliveries in quantities large enough to bring prices back to normal.
And the price of corn can STAY above or below a posted market cost, due to shipping , just as the cost of oil, at a given location, can stay above or below a posted price, due to shipping. This is normal, corn is generally cheaper where it is grown, than it is a place a thousand miles away where it is used.
There is basically nothing wrong, so far as I can see, with putting down the current oil price to nothing more, and nothing less, than a good old cut throat price war, between lots of players who in some cases hate each others guts, and desire to see each other in HELL, with other producers unable to get together, and cut production, for countless very real reasons.
An American company would be in court charged with violating some pretty heavy duty law if it tried to organize a production cut, either domestically or internationally. Most of the various producing countries are too small to really matter much, as individual countries, in terms of the big picture, and there is no existing MECHANISM or organization that has the power and purpose of bringing them together, and no known way to enforce and agreement among them, even if they were to reach an agreement to cut production.
Personally I believe political paralysis alone is more than adequate to prevent most oil production from being managed on a sensible basis. A nationalized oil industry is compelled to go with whatever suits the sovereign government wants, and politicians are reluctant in the extreme to lay off large numbers of workers, or do anything that cuts into foreign exchange earnings, or upsets the local political apple cart in any way.
They are not blamed for the PRICE of oil, but they WOULD be blamed for doing any thing ABOUT the price of oil, if it involves shutting down any local industry.
Now here is an interesting bit of ancient folk wisdom, often repeated by cops discussing a domestic disturbance, among themselves.
” They can’t all be right, they can’t all be telling the truth. BUT all of them can be lying.Most likely all of them are lying about at least a few detiails, or at least telling less than the whole truth. ”
Some of the time, virtually all of the participants in a major dispute are lying at least in part.
More CAPEX cuts in USA tight oil and gas (from Oil and Gas Journal):
Continental Resources Inc., Oklahoma City, has reported a capital expenditures budget for 2016 of $920 million, a 66% reduction from the planned $2.7 billion for 2015
Hess Corporation is planning a 2016 capital and exploratory budget of $2.4 billion, a 40% reduction from its 2015 actual spend of $4 billion and 20% below its preliminary 2016 guidance of $2.9-3.1 billion provided in October:
http://investors.clr.com/phoenix.zhtml?c=197380&p=irol-newsArticle&ID=2132482
http://www.hess.com/company/news-article/2016/01/26/hess-announces-2016-e-p-capital-and-exploratory-budget
From CLR release.
26 Bakken completions in 2016.
4 rigs running in Bakken in 2016.
Begin 2016 w 135 DUC, end 2016 with 195 DUC in Bakken.
Oil gas ratio company wide goes from 70/30 in 2014 to 60/40 in 2016. This I assume is due to more OK activity.
Production exit 2016 at 180K BOEPD. Down from 220K in 2015. Oil decline much worse, by my math 145 bopd to 108 bopd.
Hess lost $1.8 billion last year but “We finished 2015 with one of the strongest balance sheets and liquidity positions among our E&P
peers,” Chief Executive Officer John Hess said.
Their proved reserves dropped from 1.43 billion to 1.086 billion on production of 368 kboepd (is this because they sold assets or because the price drop has made some reserves uneconomic?). Oil was 147 kbpd in USA, 91 in rest of world.
Next year’s production expected to be 330 to 350 kboepd.
We live in interesting times.
http://abcnews.go.com/Technology/doomsday-clock-time-adjusted-show-close-apocalypse/story?id=36524149
There is a very real possibility that there might never be a WWIV, because WWIII might put us back to the stone ages, if anybody survives.
A interesting and tense moment at December’s American Geophysical Union conference came with an all star panel of climate scientists and energy experts, and clear lines were drawn between the “must have nuclear’ faction, lead by James Hansen, and the “renewables can do it” faction, represented by Mark Jacobson of Stanford – who I interviewed the same day – more on that soon.
New research seems to support Jacobson.
…a study out today suggests that the United States could, at least in theory, use new high-voltage power lines to move renewable power across the nation, and essentially eliminate the need to add new storage capacity.
This improved national grid, based on existing technologies, could enable utilities to cut power-sector carbon dioxide emissions 80% from 1990 levels by 2030 without boosting power prices, researchers report today in Nature Climate Change.
http://climatecrocks.com/2016/01/27/path-to-renewables-may-be-easier-than-thought/
I break with Hansen, who seems misguided, with regard to nukes, and recall quite a bit of chatter over at TOD during the Fukushima/Daichi daze suggesting that nukes were not at all how they were cracked up to be, such as in terms of fossil fuel inputs, insurance, (coerced)public funding, other accidents, cover-ups, ‘actual versus reported’, waste site management, Helen Caldicott, Ivan Illich, State lock-in, radioactivity time-scales, Finland, burial/cleanup, and the like.
That’s in part what I appreciated about TOD; a lot more meaning and context ‘beyond the pale’ was injected into the conversation.
Any way you slice it, nuclear energy comes up with way too many holes for my comfort.
Hi Ron,
One year ago you put your reputation on the line. I quote:
“Why we are at Peak Oil Right Now
BY RON PATTERSON POSTED ON 02/01/2015
“In this life nothing is certain. Therefore I am not declaring, absolutely, that we are at peak oil, only that it is a near certainty. But I am putting my reputation on the line in making the claim that the period, September 2014 through August 2015 will be the year of Peak Oil.” Jf. http://peakoilbarrel.com/peak-oil-right-now/ ”
Do you still stand by this judgement or does it need some kind of modification by now?
Best regards,
Søren
No, I stand by it. I have said all along that 2015 will be the year would crude oil (C+C) peaks. I may not have picked the month but I sure as hell picked the year, or I believe I did.