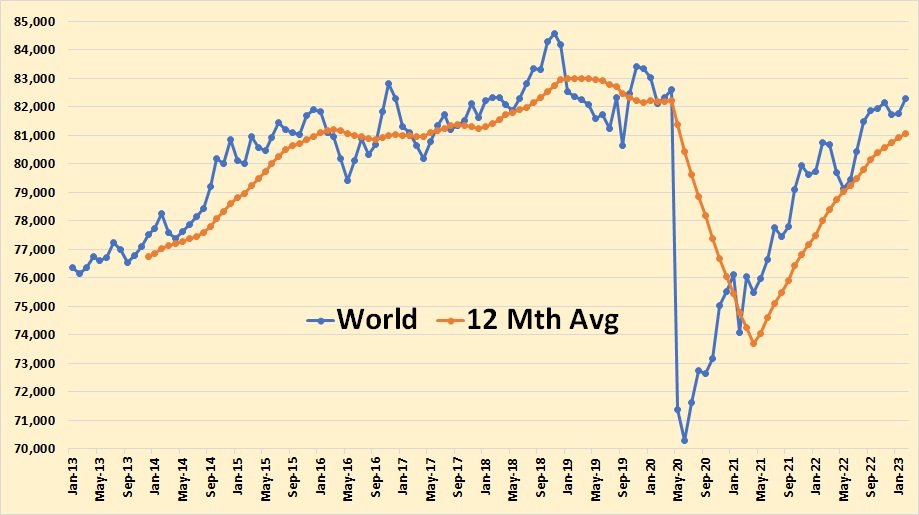
World C+C production increased by 524,000 barrels per day in February to a post-pandemic high.
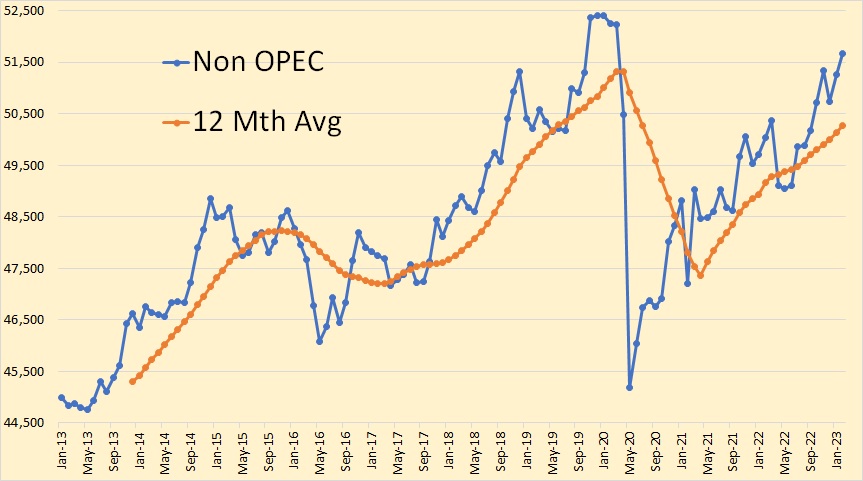
World Non-OPEC production increased by 395,000 barrels per day in February.
Since the world C+C peaked in November 2018, to current world data in February 2023, World C+C is down by 2,287,000 barrels per day. Non-OPEC production during that time period is actually up by 769,000 barrels per day, while OPEC production during that time period is down by 3,021,000 barrels per day.
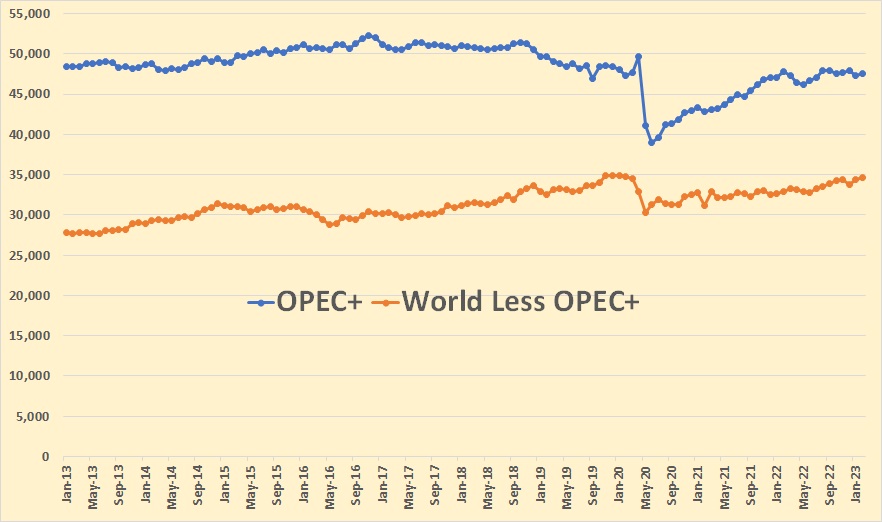
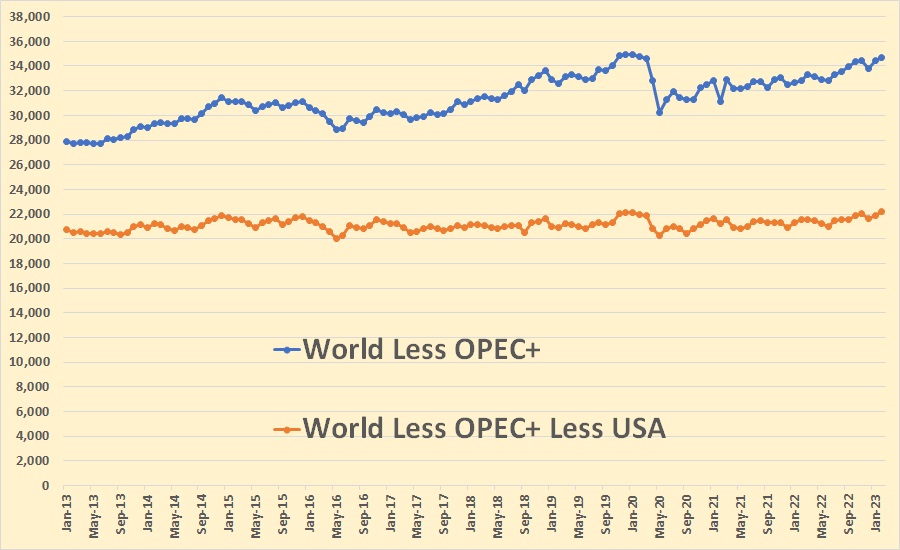
This zero-based chart gives us a better picture of things. OPEC+, as of February 2023, produced 58 percent of world oil C+C production while Non-OPEC+ produced 42 percent of world C+C production’
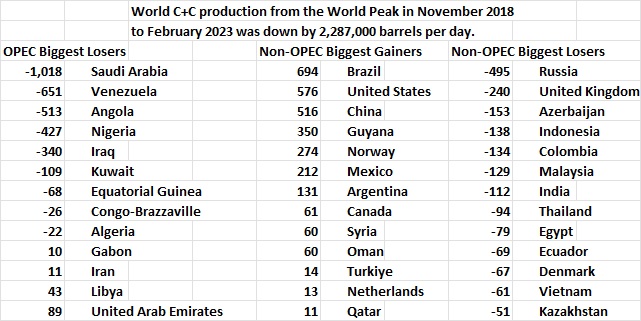
The data above is in thousands of barrels per day.
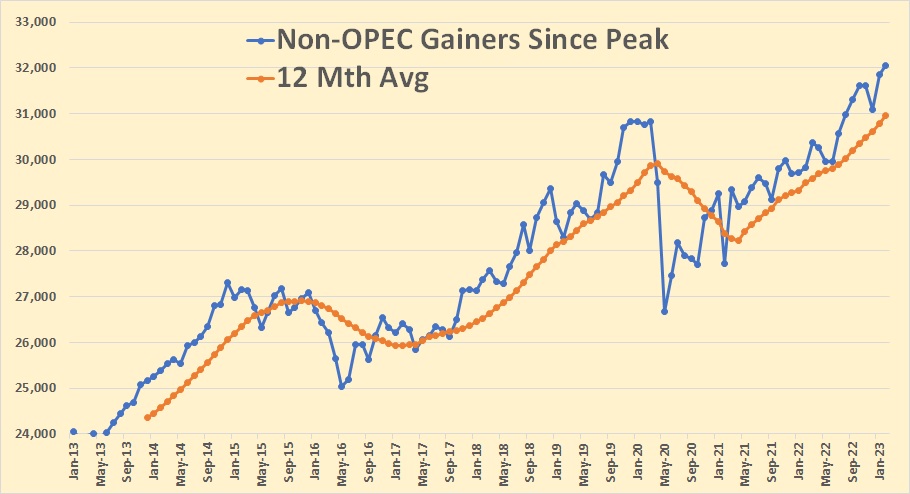
17 of the 77 Nno-OPEC nations have increased C+C production since the November 2018 peak.
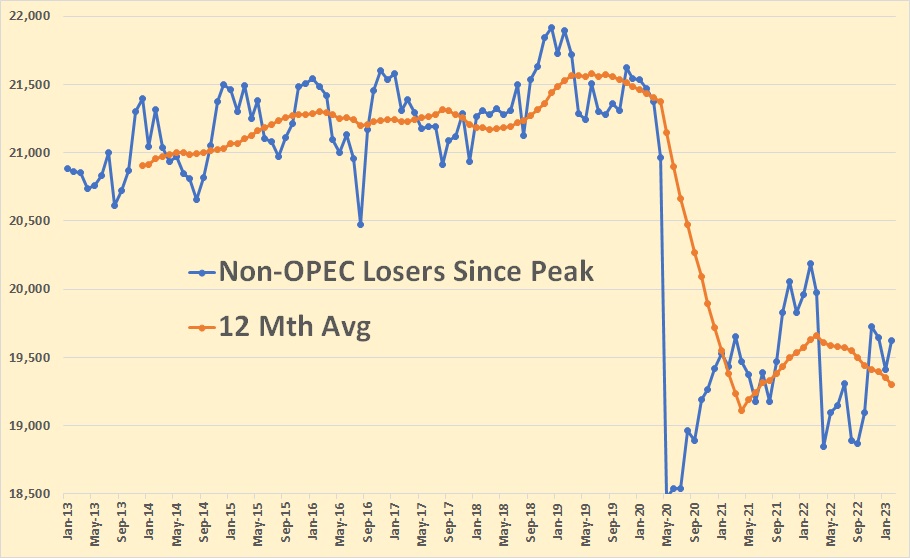
60 of the 77 Non-OPEC nations have lost production since the November 2018 peak. However, their total current production is almost 12.5 million barrels per day lower than the gainers.
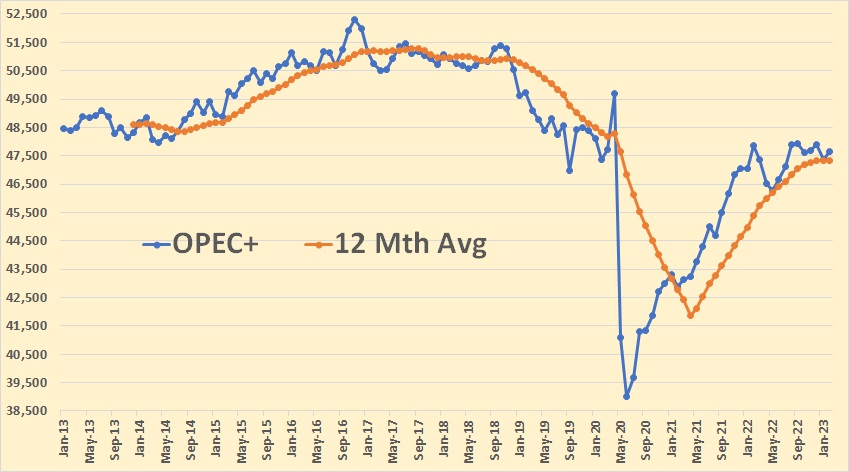
This is OPEC+ C+C through February 2023. They have pretty much plateaued for the last 13 months. This data is only through February. Reports have them down another 1 million barrels per day through May.
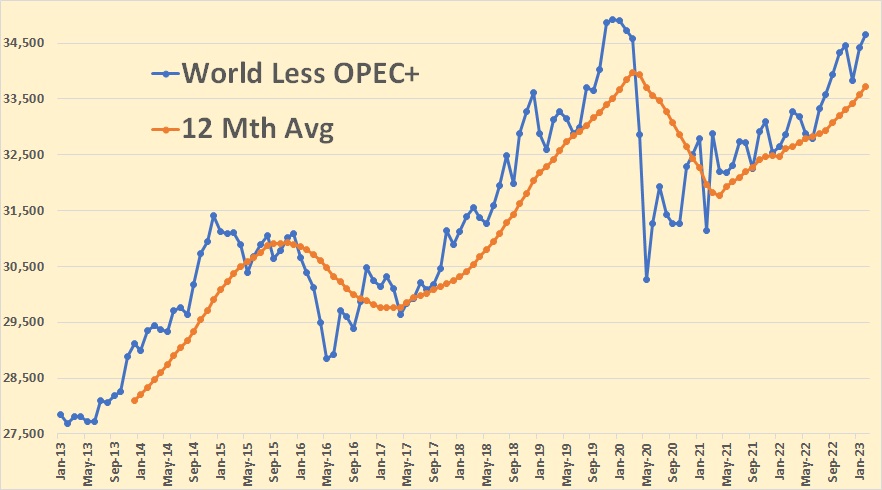
World less OPEC+ is back at pre-covid levels.
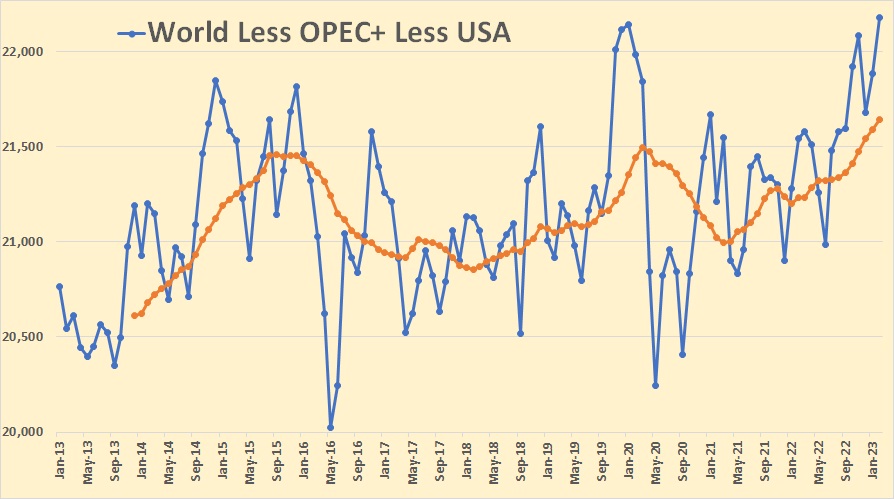
If you remove the USA from World less OPEC+ looks hectic, but not very impressive.
The above zero-based chart clears up things. It is obvious that World less OPEC+, less the USA has been almost flat for the last decade. Some nations have gained while others have waned. Meaning it is pretty much a wash. So… it is up to the USA and OPEC+ for gains or losses for future oil production.
OPEC+ stalled at about 3.5 million barrels per day below their peak in 2017. That was as of February. At that time, almost all were producing well below their quota. Now they are cutting a lot more.
I am not optimistic about the future of world oil production. Though OPEC+ cuts are now voluntary, there is little evidence that they can produce above their September pre-covid high of 47,936,000 C+C barrels per day. As of February, they were 300,000 barrels per day below that level. As of May, they are at least another 1 million barrels per day below that level.
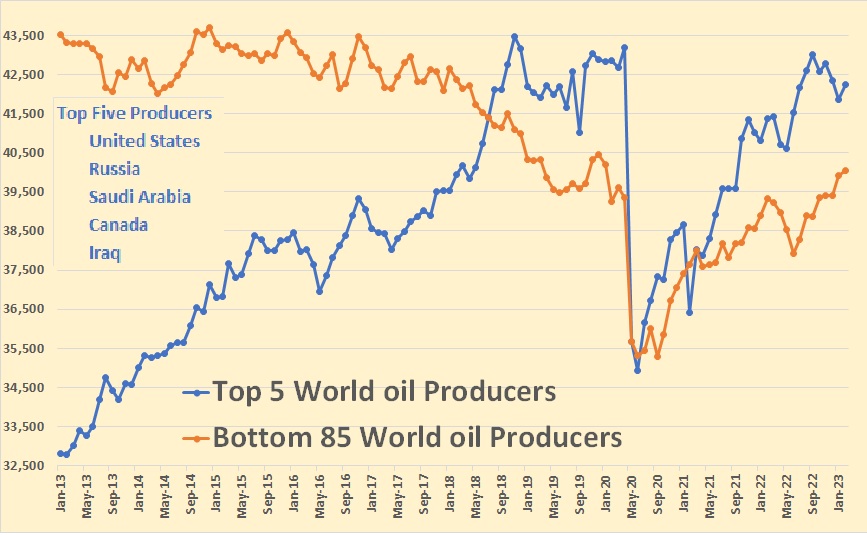
Above are the top 5 world oil producers and the bottom 85 world oil producers. The current top 5 were, in January 2013, 43% of world oil production, while the current bottom 85 producers were, on that date, 57% of world oil production. Ten years later, in February of this year, the top 5 producers are 51% of world oil production, while the bottom 85 producers were 49% of world oil production.
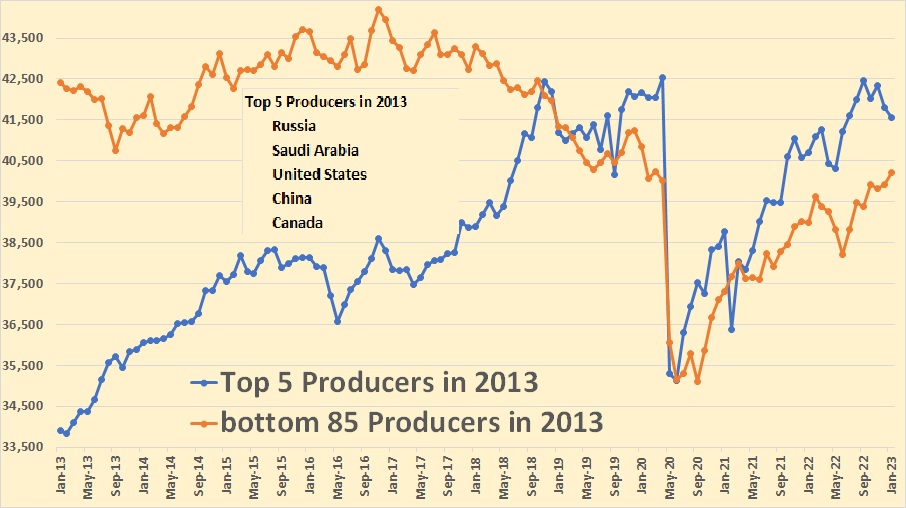
The top 5 world oil producers in 2013 look pretty much the same, except China was number 4 then and number 6 in 2013. Iraq was number 7 in 2013.
Conclusion: Whether world oil production waxes or wanes in the future depend pretty much on the world’s top producers. The cumulative production of the world’s lesser producers will continue to wane. It will be up to the world’s top three producers, the USA, Russia, and Saudi Arabia, as to whether world oil production waxes or wanes. I am not optimistic.
191 responses to “World Oil Production up in February”
Great post Ron, thanks.
Interesting to note that since the global oil production level entered the peak plateau phase in 2014,
that world population has increased almost 10%,
that real global gdp is a lot higher despite pandemic [I don’t have that number],
that so far oil still remains somewhat affordable for more than half of humanity,
and that the total global debt is up over 20%. It is speculation to guess how much of that debt spending has gone to sustain direct or indirect oil production/consumption.
Obviously, so much going forward depends on the length of time this plateau phase is sustained and then how quickly the production then declines.
>>Interesting to note that since the global oil production level entered the peak plateau phase in 2014,..<<
Hickory, would this plateau you are mentioning anything like the one Daniel Yergin has mentioned? Where we get into an undulating plateau?
We have seen a peak in 2019 and many of the voices here are saying that the peak may yet to come.
…many of the voices here are saying that the peak may yet to come.
Not really that many. 🤣
Dennis, Coffeeguy, and Reservegrowthrulz…may be others but those are the three that come to mind…I would say Dennis is much less confident in his projections now as compared to a year ago, but his projections still seem way off to me…
Kengeo,
I have recently done analyses using Hubbert Linearization(HL) which give higher estimates than the Shock Model, which I prefer. In the past the HL method has tended to underestimate actual URR based on analyses by the USGS and others. Laherrere and others have recently estimated URR of 3500 Gb for World C plus C using HL, my best guess Shock Model has World URR at about 2700 Gb. My models might be “way off” on the low side.
Lots of people think the charts of oil global production will top out in the shape of rough/bumpy plateau prior to declining, rather than an abrupt and sustained cliff like drop. In fact it can look like both depending on the timescale of such a chart.
At this point it looks to me like we already entered a plateau phase of global oil C C production in 2014, at 82 mbpd /- 3 mbpd (3.6%) being the rough boundaries of the top. Just a rough observation.
Using a 5% band would have a much higher probability of being correct. Same message though.
No one knows how long it will last.
Chart from last week
Thank you both!!
Hickory – Conventional oil plateau started in early 2000’s, the US tight oil extended the plateau by ~10-15 years, we are now 5 years post-peak and still ~5 mb/d from matching the previous peak. While it’s not impossible, it seems highly unlikely that a new peak would be reached, more likely is continued loss of ~1 mb/d each year (if not more). The big question is how quickly shale oil production drops…my guess is 0.5 – 0.75 mb/d decrease starting soon…
Kengeo,
Depends on how conventional oil is defined. If we use the definition of conventional that all crude plus condensate that is not extra heavy oil or tight oil (what the USGS calls continuous resources), then the peak for conventional oil was 2016 at 73.4 Mb/d.
I’ve been coming around on Dennis’ 2028 prediction for peak oil. I don’t think PO is in the rear view. Certainly geology is not a barrier. If sanctions were lifted on Iran and/or Venezuela, Australia went full shale, or Canada tar sands were ramped to max, I think we could accomplish a new 12 month avg peak.
Add to this the economic side and I think we could do it. The system can be geared up or down fairly easily. Right now, almost every central bank is either raising rates or keeping rates the same. China, Europe and US all at or near contraction in Services, Manufacturing, or both. Debt levels are high. Money supply is shrinking. These things ARE going to hurt demand, no matter what the supply situation is.
And that takes pressure of producers to pump at max. Doesn’t this allow for building of capacity and reserve growth? I know there aren’t a ton of new fields, and you’ve got depletion, but it seems like a lot of wells can be made to plateau, ramp up or down, to the point that once the economy turns positive again – globally say maybe midway 2024 – oil supply will be there to rise with it.
In sum, finance won’t be the limiting factor in the end, and neither will demand. The world will want the oil and right now its kind of half-assing production because the economy hasn’t needed it or politics has interfered. I guess in a world super desperate for the stuff we might just break down into world war. But assuming the overall global economy keeps its shit together, I think it pushes parties to deliver the energy it requires. I think the geology would allow it. And I think global capitalism has enough sway to allow it as well.
TwoCats, You are saying if, if, if, and even ifs. Yes, if world peace broke out, if all sanctions were lifted, if we don’t have a recession and prices go to $125 a barrel then we would very likely surpass the 2018 peak in world oil production.
TwoCats, there are always political problems, and there are always economic problems. There will never be a time when we do not have such problems. These things are just as much a part of world oil production as geology.
And I must agree with you. If we lived in a perfect world, peak oil would still be in the future. But we don’t and it ain’t.
“If we lived in a perfect world, peak oil would still be in the future. But we don’t and it ain’t.”
Agreed.
Although it looks to me like a ‘generous’ plateau phase has a substantial possibility.
Ron,
Every argument has ifs, yours included.
Dennis, did you really think I was unaware of that?
but my ifs really aren’t that fantastical if you took the time to consider them.
https://time.com/6236995/venezuela-us-eases-sanctions-chevron/
and I shouldn’t have to provide any evidence of capital’s willingness to print money, but apparently I have to.
https://www.economist.com/content/global_debt_clock
my argument only requires these two things which are ALREADY TRUE (NOT IF’S) to be MORE TRUE. So think before you reply.
and to rebut your statements directly
1) no – world peace would not need to break out – straw man
2) I’m actually banking on a massive recession – I think that helps my argument
3) “political problems” and “ramping up global oil production” simply aren’t mutually exclusive. I would have added that to my original response but it disappeared into the “comment holding pen” that I’m subject to 🙂
I think Dennis is referring to US peak in 2028, don’t think he makes any real forecast for world in 2028? Also don’t think the world needs to peak when US peaks…conflating US vs. World…
Current est. is ~82 mb/d.
Nov. ’19 pre-covid peak was 83.4 mb/d
All time peak (Nov. ’18) was 84.5 mb/d
World needs 2.5 mb/d to come online before matching the existing ’18 peak.
So many headwinds for increasing world oil production:
-Limits in the physical amount of oil remaining
-War in Eastern Europe
-Drops in demand related to alternate energies and overall weak economics
-Prices too high for consumers yet too low for many producers
-Prices would need to go too high in order to get major production growth, resulting oil price shocks ultimately destroy demand
I think Dennis is referring to US peak in 2028, don’t think he makes any real forecast for world in 2028?
Kengo, you simply have not been paying attention. Dennis has made not one, but many predictions as to when world production will peak. Below is his latest… I think. He makes so many of them; it is hard for me to keep track. 🤣
Anyway, Dennis’ predictions are not bad at all. He has the world peak only a tiny bit higher than my prediction, already past in 2018. Dennis is a peak oiler, just like me. He only has it a tad bit higher and a decade later.
Ron,
I agree, I make lots of predictions that are adjusted as I get new information,
my latest guess has a World peak in 2028 at about 84 Mbpd, slightly higher than the 2018 peak.
Ron,
Thanks for suggesting my scenarios are not terrible, very likely (nearly certain) my scenarios will be wrong. Whether too low or too high is unknown by me.
Two things:
1 – the peak is centered at ~2022-2023 (consider the broad peak where prod. >80 mb/d; ~2015 thru ~2030)
2- projection is fundamentally flawed in that it doesn’t consider the great many smaller producers that are quickly running out of oil (<5 or less years of supply):
-Australia (26 million people)
-Mexico (127 million people)
-UK (67 million people)
-Nigeria (213 million people)
-Angola (35 million people)
What does half a billion people losing access to crude oil look like in the next 5 years?
Where is this drop in production of ~6 mb/d shown in the graph
What about the other countries that are producing less, how much less? 4% annual decline?
So ~2027 production = (82-6) * ~90% = 68 mb/d?
Or does a miracle bring 25 mb/d or production out of thin air???????
People this is basic maths, no/few brain cells needed to understand the coming cliff…
Kengeo,
Using Hubbert linearization suggests a URR of 3200 Gb for World C plus C, my scenario has a URR of 500 Gb less than such an analysis would indicate.
See https://peakoilbarrel.com/world-oil-production-up-in-february/#comment-758393
The peak for a Hubbert curve using a logistic function occurs in 2026. The oil market is a World Market where nations export and import oil so only World supply matters. Many oil resource estimates have 3500 Gb or more for World C plus C URR.
Perhaps you could present a “realistic” prediction for 2023 to 2035 and you can chart it next to my current best guess, listed below starting with 2023 (annual average values in Mb/d)? Then we can compare in the future which prediction proves more realistic, if you dare.
81.10
81.69
82.36
83.08
83.60
83.93
83.84
83.37
82.35
80.85
78.93
77.05
75.21
You do understand that 1P reserves increase each year? Just look at US proved reserves and production over time to confirm this.
See https://www.eia.gov/dnav/pet/pet_crd_pres_dcu_NUS_a.htm
Proved reserve growth over 1977 to 2012 was at an average rate of 5% per year for the US.
There arelots of discovered oil resources that are not developed in the World.
In my model I have 2800 Gb of total resources that get discovered from 1870 to 2300. About 2618 Gb have been discovered by the end of 2022 with 1467 Gb cumulative production and 449 Gb of developed reserves that have not yet been produced for a total of developed reserves (produced and not produced) of 1916 Gb with 702 Gb of discovered resources yet to be developed plus an additional 182 Gb of cumulative discovery (includes reserve growth) remaining in the future. The a total of discovered and undiscovered resources to be developed of 884 Gb as of Dec 31, 2022. It is for this reason that using proved reserves as your guide will lead to a severe underestimate of future output. Decline rates will be far less severe than you seem to anticipate.
Dennis , I think it was JT who posted . Hubbert curve is invalid in current situation , Cantrell curve is that matters . I will try to locate his post ( too late now ) . Thanks Kengeo . Out of the box thinking .
Hole in head,
Canterrell is not the World, a small piece of the puzzle. As I have pointed out we have had North Sea decline, Canterell, North Slope Alaska, etc. these have already occurred, but World output has continued to chug along. The Hubbert analysis suggests 3200 Gb for World C plus C, and Laherrere et al in 2022 estimated about 3500 Gb for World URR of C plus C, my scenario is about 23% lower than the Laherrere analysis (2700/3500=.77).
I await Kengeo’s scenario and your answer on if you have revised your $25/bo World Oil price in 2025,
Dennis –
At a glance, in addition to the 6 mb/d loss over next 5 years from those low level producers, I would wager that combined output from US-Russia-Canada-Brazil-Norway will drop approx. ~25 mb/d over the next 10 year period, or ~2-3 mb/d each year.
This is a considerable drop, but a possibility nontheless…
So in the next 4 years it’s possible that we may see a decline of ~4 mb/d each year, this translates into ~5% annual decline rate…not far off from literature.
Here’s the US-Russia-Canada-Brazil-Norway group plotted along with the other group (10 countries w/ >50% production):
Kengeo,
Your group of 5 small producers will see about a 1.6 Mb/d decrease in output over the next 10 years. The 5 % decline rate for US, Canada, Brazil, Norway, and Russia is a decrease of 2.5 Mb/d per year over 10 years. For simplicity lets assume all other nations have constant output over the next 10 years, and the 10 nations you mention see the decreases you anticipate. The chart below compares your scenario with mine so far, feel free to revise your scenario to make it more “realistic”. We can compare in the future which projection seems more accurate.
Note that Russia, US, Canada, Norway, and Brazil produced 31.4 Mb/d of C plus C in 2022 and the 5 small producers produced about 5.4 Mb/d in 2022 for a total of 36.8 Mb/d, this is about 45.6% of World C plus C output.
My scenario reaches 50 Mb/d in 2050 (18 years later than Kengeo’s projection).
Dennis –
I think that’s a good comparison, I’d say we both have a 5% chance of being “right”, but there’s a >80% chance it will be somewhere in-between.
My guess is 50/50 chance it falls within the 70-80 mb/d range, and 5% chance it’s >80 mb/d in 2028, >30% chance it’s <70 mb/d.
Limits to available oil supplies will also keep production <80 mb/d.
Kengeo,
My guess is that there is perhaps a 5% probability it will be as low as your scenario or lower in 2028 and about a 50/50 chance 2028 output will be either higher or lower than my guess, that would be about a 45% probability in my view that output in 2028 would be between 62.52 and 83.9 Mbpd.
For your probabilities to make sense you have 5% probability that it is more than 80 Mbpd and a 30% chance that it is less than 70 Mbpd, that would suggest a 65% probability that output will be between 70 and 80 in 2028 in your estimation, the total needs to add to 100%.
Dennis , yes still $ 25 by 2025 . Just for thoughts , could be $ 25 in 2023 if all the cuts and sanctioned oil was on the market ? Just speculating .
Thanks Hole in head,
Just so we are clear that is the price for WTI, I assume, but what time period? Do you mean the weekly average price, monthly average price, yearly average oil price, or simply the daily closing price? It might be possible that one day in 2025 the price could fall that low, but in my view any period shorter than the monthly average price is of no significance. I doubt we see any average monthly closing price for WTI of less than $50/bo in 2025, by 2032 the odds would be better that we might see a monthly average oil price as low as $25/bo. I think you first made this prediction around 2020 or so, so I assume you mean in 2020 US$? Not sure that even in a World where OPEC plus did not exist we would see $25/bo as very few producers make a profit at that price level so even without a cartel production would be cut back in such a World.
Dennis . it was $ 25 (2019 value) by 2025 . It was a point of time bet , no averages . I had archived it but seems gone missing . You can take me at face value on this .
Dennis , how are you on this one .
D COYNE
IGNORED
08/03/2022 at 6:16 am
Kengeo,
US exports 3.5 Mbpd of tight oil, this may increase to 6.5 Mbpd by 2028. A fairly significant amount.
Recent Shock Model from May 2023, by 2035 World C C output falls to about 75 Mb/d from the peak in 2028 at roughly 84 Mb/d. The average annual decline rate over the 2028 to 2035 period is roughly 1.6% per year (not shown on chart which ends at 2029).
Hello Denis,
a peak of 1.12 % higher , sorry is my maths off ? could be called a rounding error 😉
still a peak is a peak I guess even if for all pratical purposes its not much of one , been waiting since TOD days to see it so this time I might live long enough…..
5 years , just in time for my pension to kick in , uh oh , not good at all !
Forbin
Forbin , ” 5 years , just in time for my pension to kick in , uh oh , not good at all ! ”
Best of luck . My opinion , take an early pension with a lower payout . A bird in hand is better than two in the bush . This is an opinion not advice . Be well .
Forbin,
Yes I agree it will not be very significant and note that this is a conservative estimate in my opinion, it is possible that the undulating plateau might be maintained until 2035, if demand for oil holds up. My guess is that waning demand for oil as the World transitions to electric transport might lead to falling oil prices and less supply to match the lower demand as less oil will be profitable to produce. My scenario is based on that low oil price assumption after 2030 leading to less rapid development of oil resources.
If that assumption is wrong we may see slower decline rates as high oil prices could keep development rates for oil resources high.
the theory would be that the economy would need the energy, it couldn’t be delivered, and oil prices would go bananas. (right now the economy doesn’t need energy, so its a moot point). But since everything about the economy and indeed “reality” is so completely mystified there is almost zero percent chance of that scenario happening. so peak oil has essentially become a non-event. I know this is a bit postmodern for an oil blog – but it certainly explains why so few people are concerned that the gas tank indicator is deep in the red.
Twocats,
Currently the World economy is growing relatively slowly and supply of oil is keeping up with demand (the reason for OPEC cuts). The world will only become concerned when demand outruns supply at current prices and we see oil prices rise to perhaps $100/bo or more. My guess is that we do not arrive at that point until 2024 or perhaps 2025 (depends in part on how fast the World economy recovers from its current slow growth period).
In short, oil price is the signal recognized by the World, many expect oil output will continue to rise enough to meet demand at low oil prices (under $90/bo in 2023$) for a decade or more. I think they are likely to be wrong from 2025 to 2030 when oil prices may be “high” (over $90/bo in 2023$).
Dennis
It’s true that Cantrell is not the world but how much of the world is Cantrell? I say a good portion. Shale is with its steep decline rates. Offshore is with its steep decline rates. How many of the giant and super giant fields have been artificially goosed by enhanced recovery techniques. We’re talking a very large percentage of production that will like have similar decline rates as Cantrell did. Hubbert wasn’t modeling our present industry so the curve needs to be adjusted.
JT,
I disagree. Number one, there are many places including Canterell included in the World data at present, we have seen rapid declines from North Sea and other offshore fields and from Arctic Oil in Alaska as well as many Giant fields in the Middle East that have started to decline, in addition my shock model includes rapid decline from tight oil.
What we find is that different areas start their decline at different times and this tends to moderate the decline of the overall World output curve. Basically the cliff scenario that many seem to worry about requires many areas of the World to start their decline phase simultaneously, this is just not very likely.
I tend to agree the Hubbert curve will likely not reflect actual output. Note however that many argue that output shouls peak at close to half of the URR estimate. This is only true of the logistic is a relatively good estimate of the output curve. Also keep in mind that the USGS estimates World C plus C resources at about 3500 Gb (close to the recent estimate by Laherrere at al). My scenario uses a URR of about 2700 Gb. See table 1 at link below
https://www.sciencedirect.com/science/article/pii/S2666049022000524?via%3Dihub
USGS Assessment for Conventional oil, about 3000 Gb
http://energy.cr.usgs.gov/WEcont/chaps/ES.pdf
Unconventional (oil sands in Venzuela and Canada and tight oil) perhaps 500 Gb.
Dennis – Circle back to Laherrere 2022 and see what he says about Canada and Venezuela…of the large reserves, few if any are being utilized…they are too poor quality to be economically significant – do you see Canada growing oil sand production much beyond current levels? When do you expect tar sand to peak? My guess it peaks within 2 years, maybe holds steady for another couple years, but certainly declines by 2030…
Yeps Kengeo . Resources are not reserves . Venezuela , tars ands , Bazhov shale are resources and not reserves . The IEA has been shifting the goal posts as to what is oil to please it’s political masters . It is now the end of the road , Just emptied out my frying (frituur) box . Gonna keep it and not take it to the recycling yard , maybe I well get a good price a few years later when IEA certifies this as oil . 🙂
Kengeo,
The Canadian government expects oil sands to increase by about 971 kb/d from 2022 to 2038 under current policies scenario.
See https://www.cer-rec.gc.ca/en/data-analysis/canada-energy-future/2021oilsands/
I expect that by 2035 we may see Canadian oil sands peak at about 940 kb/d above the 2022 level. For Venezuela I expect Orinoco output will remain roughly flat through 2035 at the 2022 average level. I do not have good data on Venezuelan Orinoco belt output, but it seems to be in the range of 250 to 350 kb/d, they are having problems due to a lack of condensate to dilute the extra heavy oil. This shortage of condensate is largely due to US sanctions, the US has plenty of condensate output from the Permian basin that could be shipped to Venezuela to increase Orinoco output. Unfortunately, Biden has chosen to leave Trump era policies regarding Venezuela in place, I am not sure if changes in policy require Congressional action, which is difficult to achieve in today’s political environment. Perhaps the Venezuela sanctions policy changes if Biden is reelected in 2024.
I’m going to side with Ron. Canada has limits based on NatGas. Australian shale isn’t likely because of geology. Venezuela is mud I’m not sure anyone is rushing into developer it.
JT,
Canadian output is expected to increase according to the Canadian government, I agree Australian shale is not likely to be developed (a guess by me). We do not need perfection, but it remains possible that Iranian and Venezuelan output could increase with some sanctions relief, my model assumes this does not happen, simply further increases from US, Canada, Brazil, Norway, Guyana, and possibly Saudi Arabia, UAE, Iraq, and Kuwait. I do not think we will exceed the previous peak by much, just 1 to 2 Mb/d around 2028.
D Coyne – I’ll leave you to handle my lightweights
Many analysts favor a Hubbert Curve type of analysis. The chart below compares a Hubbert model based on 2005 to 2018 data (excludes pandemic and OPEC cuts of 2019) with URR of 3200 Gb that peaks in 2026/2027 with an Oil Shock Model that has a URR of 2700 Gb. The models are similar up to 2030 or so, but the shock model is muchless optimistic after 2030 than the Hubbert Model. Output is in kb/d and data comes from US EIA the chart is for World C plus C output.
Note the rough plateau for the Hubbert Model from about 2015 to 2036, a good 22 years, I think that’s too optimistic, maybe 16 years (2015 to 2030) is more reasonable.
The backside of the Hubert curve is no longer a realistic projection. Hubert developed his curve during a period of progressive growth globally. Technical enhancement of aging oil fields lead to fast rates of decline as was experienced in the Cantarell field. Shale has developed a similar world decline scenario. Hubert modeled very conventional land based basins that were easy to access and maintain and add strippers to. Very different and not as meaningful for today’s oil production. Use the Cantarell curve instead.
JT
Much of the World’s output remains conventional output, the curve is based on 2005 to 2018 World data, and includes rapid decline from various offshore plays.
Canterell is a very small piece of puzzle.
I agree the Hubbert method is likely to be wrong, I believe the shock model is a more general alalysis and likely to be better.
JT,
Hubbert’s basic thesis wa that output would follow a bell shaped curve, the logistic was simply chosen as a convenient functional form, there is nothing magical about it, the analysis is relatively simplistic using a singe curve as I have done here, one can make it more complex by choosing several overlapping logistic curves to get a better fit up to however many separate functions one thinks is necessary. I think using past discovery to estimate a future discovery curve and past extraction rates to estimate future extraction rates with a fixed rate of development of resources over time (also based on historical rates of development) provides the best model.
Some think this is overly complex. I believe it is no more complex than a logistic analysis with 3 functions or more, fit to past production data.
Your model isn’t overly complex. Taking as many curves as you’d like and fitting them to past aggregate information isn’t complex, it is just redoing Hubbert’s idea and converting it into multiple cycles of development rather than one big cycle. Do what Hubbert did that didn’t work, and double down on it. What Hubble had glommed onto to some extent became known later as discovery process modeling, and began it’s first journey through the science world about here:
Arps, J. K., and Roberts, T. G., 1958, Economics for drilling for Cretaceous oil on east flank of Denver-Julesburg Basin: Am. Assoc. Petroleum Geologists Bull., v. 42, no. 11, p. 2549–2566.
It was the basis for science that followed in terms of field size classes, discovery rates and drilling efficiency, estimates of the undiscovered, etc etc. The fundamentals of discovery process modeling ultimately arrived at being used by the USGS for the 2000 World Assessment, and I believe it continues to be used to this day. It isn’t just one, or 5, big cycles, it is all the little ones, and turns out, they are known! That would be more complex if only because of the data handling involved, but more importantly, that would be the right level of applicatin to slapping random development curves to when going after future development, with the cycle representing at least a measure of the effort difference between geologic regimes, which the random curve slapping routine is clueless about.
Reservegrowthrulz,
I agree the model would be improved with more information on economics etc, I do not have information on the economics for each geological formation in the World, and even if I did, the model would be a bit unwieldy. I will note that the USGS ignores economics and Dr. Pukite’s Shock Model does as well, the model is physics based and lack of information on every geological formation in the World led him to use a maximum entropy analysis following the work of Jayne as a general analysis with historical discovery, development, and output as an input to the model. Adding economics could in principle be done with a resource cost curve and assumptions about future prices, though this is a bit of a moving target as the cost curve shifts over time and isn’t readily available.
Some of the information that is available does not seem accurate see
https://www.spglobal.com/commodityinsights/en/ci/research-analysis/global-crude-oil-curve-shows-projects-break-even-through-2040.html
where they claim breakeven prices for average Permian well at about $46/bo, this is off by about $35/bo at current natural gas and NGL prices (the real number is more like $80/bo).
We are back into discussion about how to model oil production with Hubbert’s model. As I said before, using logistic function to fit past data is called loglet analysis and doing so produces nice looking graphs. This would be fine, when one has separate data streams for example in the USA for lower 48, Alaska, GOM and tight oil or if lower 48 conventional is left out it can be calculated by subtracting the the others from the total.
Why use logistic model rather than the other bell shape curves. Simply because the ultimate can be estimated in a straight forward way. Using a Gaussian fit forces one to guess by trial and error which “looks” the best.
In the earlier thread I posted my calculation for OPEC. Here is a graph for the OPEC minors – 8 smaller producers. Peak was in 2005 and ultimate is estimated to be 232 Gb. The second graph shows the decline rate, the theoretical and the actual so far. The actual data fluctuates wildly, but the intrinsic decline rate is 6.4%. This is on the next post.
This is the decline rate curve
Here is the graph for OPEC majors, the 5 largest producers. Ultimate is 861 Gb, with 95% confidence interval giving a range between 777 Gb and 964 Gb, Peak year 2026.8 and the range between 2023.7 and 2030.2. Intrinsic decline rate is 4.1%.
Dennis, I am using logistic and not Gaussian.
Seppo,
Thanks for the clarification, I did not realize you were using a Gaussian. Are you assuming a normal or lognormal distribution?
For your OPEC chart posted in a previous thread what was the URR?
Dennis, I am not using a Gaussian but logistic.
Estimate for the ultimate for OPEC is 968 Gb and intrinsic decline rate is 4.8 %
Seppo,
Sorry, I misunderstood. Thanks.
Cool charts, for OPEC-13 I get a URR of 1080 Gb, with an annual decline rate of 3.72% in 2080 and about 1% in 2030. Not sure how intrinsic decline rate is defined.
For non-OPEC I get a URR of 2180 Gb, with a peak in 2033 at about 52 Mb/d. When two models are added for OPEC and non-OPEC the peak is 2026 at about 82 Mb/d with URR of about 3260 Gb.
Dennis, what I call the intrinsic decline rate is that at the exponential tail. Perhaps I should use another term, but by this terminology, on the decline side the decline rate moves from zero to this value monotonically.
Thanks for the clarification Seppo, I didn’t carry my curve far enough to reach the exponential tail, for my Hubbert curve for OPEC I have a terminal decline rate (or intrinsic decline as you call it) of 4.22% per year. For non-OPEC the terminal decline rate is 3.32% per year and for the World the terminal decline rate is 3.45% per year.
World Hubbert Model Annual decline rates after 2026 (peak is 2026 for the Hubbert model).
Another Model for World using a Gaussian fit on C plus C output data from 1965 to 2022 and compared with an Oil Shock Model Scenario. My guess is the Shock Model estimate will be more realistic.
Dennis –
I agree, this would put the peak in the rear view – we can finally all agree!!!
Kengeo,
That Gaussian scenario was a mistake based on my misunderstanding a comment by Professor Korpela. The peak for the Hubbert scenario for the World is 2026. Note that for the Hubbert scenario with a URR of 3200 Gb decline is relatively moderate, not 5% per year as you imagine.
In chart below I have several scenarios low, best guess and high and a scenario called Kengeo that has World output at 70 Mb/d in 2028. My subjective probability estimate for 2028 is a 95% probability that output will be between my low and high scenario (77.5 to 89.9 Mb/d) with a 50/50 chance output will be either higher or lower than my best guess of 83.9 Mb/d in 2028. That suggests a 47.5% probability that output will be between 83.9 and 89.9 Mb/d and a 47.5% probability that output will be between 77.5 and 83.9 in 2028. Also we would guess the probability is about 2.5% that output in 2028 is less than 77.5 Mb/d and 2.5% probability that output would be more than 89.9 Mb/d in 2028. I would also put the probability that output is between 70 and 77.5 Mb/d in 2028 at about 2% and the probability that output is less than 70 Mb/d in 2028 at about 0.5%. Also mentioned earlier was 80 Mb/d in 2028 and I would put the probability that output is between 80 and 83.9 Mb/d in 2028 at about 40% and the probability that output will be between 77.5 and 80 Mb/d at about 7.5%.
A slight modification of Hubbert model using 2005-2019 World C plus C data for Hubbert linearization. Peak in 2025 at 83268, intrinsic (or terminal) decline rate is 3.75% reached after 2214, the annual decline rate is about 2.2% in 2060 and about 1% in 2040.
Thanks Ron, interesting post. I wonder how many candidates there are for failed state status amongst the nations in decline.
Horizontal Oil Rig counts with OLS Trends for Permian(14 per year), Williston(3.5 per year), Eagle Ford(-3.6/year), and Niobrara(-2/year) over past 52 weeks. Note that for the past 8 weeks there has been a steep decline in horizontal oil rigs running in the 4 major tight oil basins, an annual rate of decline of 216 rigs per year. If that rate were to continue rigs would fall to half of the week ending level from June 9 , 2023 by this time next year. I do not expect that will occur, but that’s the current short term trend.
The annual rate of increase over the past year based on the OLS trend for all 4 major tight oil basins is about 12 rigs per year (roughly flat).
Russia’s oil and gas revenue plunged in May as sanctions and dwindling exports weigh on Moscow’s energy trade
Budget proceeds from Russian oil and natural gas fell by over one third in May amid Western sanctions and lower gas exports, Bloomberg reports.
According to the country’s Finance Ministry, last month’s revenue from oil and gas taxes sank 36% from a year ago to 570.7 billion rubles, or about $7 billion.
Revenue from crude and petroleum products slid 31% to 425.8 billion rubles, while gas revenue plummeted 46% 145 billion rubles. That’s despite higher income from a mineral extraction tax on gas, which was not enough to cover export duty losses.
Proceeds from the two commodities make up around a third of Russia’s budget, which is already under pressure from spending for Moscow’s war on Ukraine.
There is a lot more to this article but nothing about production. I suspect it slid quite a bit in May also.
Reduced import crude available for the west? MBS has strong backing internally and is not shy about his contempt for Blinken.
https://smoothiex12.blogspot.com/2023/06/wow-whats-missing.html
Ron
Thanks for doing the Non-OPEC/World post for me while I am on holidays.
German chemical production . Recession indicator ,
Ok but did the production move someplace else in the recent drop?
No , Greenbub , It did not move anywhere . Chemical plants can’t be built overnight . The consequence is low availability and higher prices . It is also called inflation .
“Chemical plants can’t be built overnight” -gee, thanks. I thought they could.
What I meant was did other plants in the world increase production to pick up Germany’s slack.
Never mind, I retract the question.
German press release .
Germany: Industry Will Die Without Russian Gas
Germany might have to cut or turn off industrial capacity if Ukraine’s gas transit agreement with Russia isn’t re-upped after its expiration next year.
“[Economy Minister Robert] Habeck, who is also the vice chancellor, issued the stark warning Monday at an economic conference in eastern Germany, saying that policymakers should avoid ‘making the same mistake again’ of assuming that the economy will be unaffected without precautions to secure energy supplies,” reports Bloomberg.
Here’s why: current rules demand that countries share the burden of gas shortages, which means Germany would have to export gas to Eastern European countries to help them shore up their losses. Germany’s manufacturers would be left without adequate supplies to keep running.
RUSSIAN $180 Billion Oil Disaster as Price Falls, Production Cuts & Sanction Discounts Hurt Russia
Great 20-minute Joe Bloggs YouTube video. Joe says despite OPEC+ cuts, world oil price and demand will keep falling. Russia is in a world of hurt.
Ron,
Opec cuts started in April and were extended to 2024 with a 200 kbpd increase for UAE and Saudis claiming they will cut 1000 kbpd in July. The market seems unconvinced of the Saudi 1000 kbpd cut, even if it happens they have only said July.
Dennis, I was not commenting on the cuts for myself. I was just commenting on what Joe Blogs said. I don’t think you have watched the video yet, so your comments are a little confusing.
the beginning was a little basic, but got good around minute 9. I love how each time before the OPEC “surprise” cuts, oil price had already risen $10 – $15/barrel. Why WOULDN’T OPEC front run the announcement and make MAD CASH!
key takeaway: oil price is cyclical and subject to global economy. but at least OPEC is trying to act counter-cyclically to smooth the drop. Even if these cuts only add a small premium to oil, its still better than many other courses of action. This would be what the Fed is supposed to do: raise rates to slow inflation and job market when they are hot, and cut rates during the opposite. Instead, they are always backward looking. it seems OPEC has better economists than the Fed.
Platts Survey: OPEC+ production plunged by 670,000 bpd in May Bold mine
In early April, a day before a regularly scheduled OPEC+ panel meeting, the biggest OPEC producers in the Middle East and several other members of the OPEC+ pact announced a total of 1.16 million bpd of fresh production cuts between May and December 2023.
The reduction is on top of Russia’s current 500,000 bpd cut, which was extended until the end of the year. In those OPEC+ cuts, Saudi Arabia said it would reduce its crude oil production by 500,000 bpd and said that the move was “a precautionary measure aimed at supporting the stability of the oil market.”
At the latest OPEC+ meeting on June 4, the voluntary cuts were extended through 2024, while Saudi Arabia announced a unilateral production cut of 1 million bpd for July, which could be extended beyond next month.
So, at the start of the fresh cuts in May, OPEC’s crude oil production fell by 440,000 bpd to 28.16 million bpd, while non-OPEC producers saw output drop by 230,000 bpd to 13.17 million bpd, according to the Platts survey.
Saudi Arabia strictly complied with its pledge to cut 500,000 bpd beginning in May, and its production averaged 10 million bpd last month, per the survey.
The Reuters survey from last week also found that Saudi Arabia and the other major Gulf producers that had pledged cuts from May stuck to their commitments. Saudi Arabia, Kuwait, and the UAE largely implemented their announced cuts last month, the Reuters survey of OPEC’s production found.
Ron:
On your third graph, are the OPEC and NON-OPEC labels reversed?
Old Chemist, you are reading the legends wrong. That is not OPEC and Non-OPEC. That is, OPEC+ and Non-OPEC+. Or, as I put it, World less OPEC+. And no, they are not reversed. Make sure you see the plus sign after the acronym OPEC. You will be seeing that plus sign a lot from here on out.
Not to dunk too hard on those who are quick to claim how smart Oil and other corporate executives are but I came across this article when searching for AI – Oil related articles
https://www.energyintel.com/0000017f-92be-df49-abff-96fffe420000
“The decline in hedging activity has decreased the number of futures bought or sold by commercial players. Airlines stopped hedging, cutting their long positions held directly or indirectly through third parties. Many oil producers, burned by their simplistic hedging practices, also stopped hedging.”
“One company, Pioneer Natural Resources, missed out on revenues of more than $2 billion as a result. It then stopped hedging rather than looking to the Mexican example.”
I actually made THIS EXACT ARGUMENT when SRSorroco was posting Pioneer financial statements and someone came at me about it. Well, check and mate MFers.
Treasury is getting ready to issue some $600 billion in T-bills. Then there is commercial real estate that needs to be rolled over at higher interest rates. It something like $3 trillion in CRE loans that have to be rolled over in next 3 years.
Regardless of all the death of the dollar you read about. Demand for dollars will outweigh availability of dollars over next 3 years by a long shot. And yes I get there is over $2 trillion sitting in RRP right now that will flow out as FED cuts rates back to zero.
And remember the Eurodollar system is a bank ledger system that uses zero bank reserves. And it’s 5 times as large as the onshore US dollar system that the FED regulates.
Demand for dollars will far outweigh availability of dollars outside US over next 3 years.
The issuance of $600 billion of new on the run collateral will actually help with to grease the process of money creation in REPO markets. So that should somewhat ease financial conditions temporarily.
Until markets are overwhelmed by debt rollover cost later on this year and next year.
I’m starting to hear stories of funding being extremely hard to get as banks have tightened lending standards in the wake of the bank failures.
Combined all that with the fact that new orders are dropping off a cliff. Only matter of time before it shows up in labor market as mass layoffs as companies holding out for second half rebound slowly realize that is not going to happen.
The FED’s BTFP increased by almost 7 billion last week alone. For those that don’t know the the BTFP is the FED’s bailout lending program for the small and medium size banks.
Banking crisis isn’t over. They are underwater on US treasuries but the real problem shows up later as commercial real estate blows up the collateral gets repriced and we’re in a 2008 like crisis again.
And into this, US producers are increasing oil and natural gas production.
The only thing holding up oil prices is the supposed refill of SPR.
“I’m starting to hear stories of funding being extremely hard to get as banks have tightened lending standards in the wake of the bank failures.”
not just stories (below is mostly raw data). but to summarize – in the senior loan officer opinion survey on bank lending practices – respondents have tightened standards for 4 straight quarters (through 1Q23) while demand has been down for 7 quarters.
https://www.imfconnect.org/content/dam/imf/News%20and%20Generic%20Content/GMM/Special%20Features/The%20Latest%20Fed%20Loan%20Officer%20Survey.pdf
https://www.federalreserve.gov/data/sloos.htm
not that this has anything to do with poor hedging practices, but certainly a large part of Oil Price Down thesis. Why? We are moving towards a credit event of some sort and that will most likely be the final phase of this cycle that started in 2021.
There is going to be a crapload of CRE loans that just don’t get rolled over. How many of these small and mid size banks can JP Morgan absorb?
It’s going to go from a liquidity problem to an insolvency crisis.
Hedging is largely done with borrowed money right? Using some sort of collateral to borrow the funds needed to hedge.
A wrong hedge can absolutely wreck a company.
HHH, I don’t think you understand how hedging works. Hedging allows you to sell your product at a profit at a given price. But you miss out on windfall profits if the price rises higher than the hedged price. And hedging allows a buyer to buy at a price he can afford to pay. But he misses out on windfall savings if the price drops below the hedge price, which he agreed to pay.
Hedging is always a risk eliminator. It can never cause massive losses. It is for very conservative companies and not risk takers.
Hedging with swaps and collars can cause large margin calls.
We always hedged with puts, to avoid margin calls. Puts are paid for upfront.
Quote received this morning for a $62 WTI put for the remainder of 2023 was $2.03, which is cheaper than recently. A 2024 calendar year $62 WTI put was $6.79.
As I have posted before, in the money puts, also called floors, that we bought 2003-05 were around $1 per barrel.
What I’m getting at is if you borrowed the money. Even if it’s just puts or calls that you are buying that only risk the cost of the put or call it still adds up if you’re hedging 100% of your production.
You still have to service the debt you incurred to make the hedge happen whether or not that hedge pays off or not.
It amounts to financial speculation. So not only do you need to know how to run an oil company. You need to understand macroeconomics and why prices go where they go. Which I’m guessing very few get it right and even when they do get it right it’s more luck than knowledge.
HHH. No doubt, hedging is very difficult to get right.
Also true, puts could be with borrowed funds. At 8% interest rates, that gets tougher.
Same goes for margin on swaps and collars. Many times, I understand, a bank is putting up the money for those, with the customer paying interest. Again, now at 8% .
Swaps are in the $60s WTI now. Henry hub gas swaps are $2 and change.
Then you have the local basis. I think crude basis has stayed strong in the Permian. Gas, not so much.
Surely we are going to be seeing some Q2 earnings misses in the shale patch, but there are probably some short term financial engineering strategies that can be employed.
I wonder if they are still putting high EUR’s on the books for these wells. That can help a lot.
I’d assume that as prices grind lower more and more shale producers will be looking to financial engineer profits.
Money at 8% doesn’t come free. You have to have some sort of collateral to get those loans.
But when the underlying collateral gets repriced that’s where things blow up.
Banks tightening lending standards means oil in the ground might not be enough to lend against. Banks are de-risking and building a capital cushion for what they all know is coming.
in the original article I posted there was a claim that Mexico had developed a unique strategy to hedge oil revenues. here is a random article I pulled from 2022 and it reports the strategy buttressed them during Covid
“The finance ministry said in January 2021 that Mexico received a 2020 payout from the oil hedging program of $2.38 billion, compensating for some 80% in lost oil revenues after the coronavirus pandemic sent crude prices tumbling.”
https://www.reuters.com/business/energy/mexico-muddies-waters-oil-hedge-avoid-cost-hikes-wall-street-oil-majors-2022-10-20/#:~:text=The%20world's%20largest%20financial%20oil,%241%20billion%20on%20the%20program.
seems like a national strategy would have a lot of firepower (intellectual and financial).
Today’s interest rate pause . A comment on Wolf Street .
”In the middle of chemotherapy, the oncologist decides, “Let’s skip a few treatments and see how the malignancy reacts”. ROFL .
@twocats:
I always wonder who takes the other side of a trade like that. The net P&L is zero so who lost a couple of billion? ( not really asking you, just wondering….)
Rgds WP
@weekend peak – well that’s a very good question. typically large houses that sell options will also buy futures to hedge those hedges so perhaps no single party takes the entire counterparty hit. another aspect of the answer (slightly tangential) is that Mexico “hides” its purchases so that parties have trouble taking the opposite side to try and put pressure on their purchases (like a gamestop gambit).
I mean, the options market is larger than the actual market so it can absorb quite a bit. on the flip side, counterparty risk might be part of the reason oil price dropped below zero for a period of time. i.e. as the options swing too wildly in a direction, the subsequent futures purchases and other hedges of hedges create a positive feedback pushing the price further in the momentum’s direction.
Equatorial New Guinea bites the dust . Zero exports .
Just wondering . Several years ago (2008) Indonesia quit OPEC because it became a nett importer of oil products . Their argument was that it was not worth paying the annual membership fee . Any thoughts on how many of the marginal oil producers / exporters are now in the same boat ?
Time to stop paying fees to OPEC. Gabon next.
Opec output down as producers deliver cuts
Argus is reporting that the May’s production drop is 820,000 b/d.
London, 9 June (Argus) — Opec output fell to a 19-month low in May as Russian refinery maintenance curbed production and other members implemented most additional cuts.
Production by Opec members with targets was 820,000 b/d lower in May. Output by Opec members fell by 440,000 b/d and supply by non-Opec members was 380,000 b/d lower, Argus estimates (see table).
The largest reductions were made by the eight Opec members that agreed to additional cuts of nearly 1.16mn b/d starting in May in a surprise move announced in April. They include Saudi Arabia, Iraq, Kuwait, UAE, Algeria, Gabon, Oman and Kazakhstan. Together they cut their output by close to 1.08mn b/d in May relative to their targets, falling 80,000 b/d short of the extra cuts pledge.
May Apr* May target. ± target
Russia 9.56 9.84 10.48 -0.92
Saudi Arabia 9.98 10.5. 10.48 -0.50
Iraq 4.18 4.15 4.43 -0.25
Kuwait 2.57 2.60 2.68 -0.11
UAE 2.90 3.00 3.02 -0.12
Nigeria 1.28. 1.09 1.74 -0.46
https://www.argusmedia.com/pages/NewsBody.aspx?frame=yes&id=2458250&menu=yes
The OPEC 10 members with quotas plus the Non-OPEC members of OPEC + were down 820,000 barrels per day. However, the three members exempt from quotas, Iran, Libya, and Venezuela, were up 150,000 bp/d, bringing the total OPEC+ to down by 670,000 bp/d.
the seems reasonable to me
https://oilprice.com/Energy/Crude-Oil/Pioneer-Sees-70-100-Oil-As-Supply-Growth-Remains-Constrained.html
Exxon Bets New Ways to Frack Can Double Oil Pumped From Shale Wells
(Bloomberg) — Exxon Mobil Corp. is betting that a better way to frack will double the amount of oil it can pump from shale fields.
“There’s just a lot of oil being left in the ground,” Chief Executive Officer Darren Woods said Thursday at the Bernstein Strategic Decisions conference. “Fracking’s been around for a really long time, but the science of fracking is not well understood.”
Hydraulic fracturing, or fracking, is the process of blasting water, sand and chemicals underground to break apart rock and keep it propped open for oil to flow out. Though the technology gave rise to the US shale boom, only about 10% of the oil in a reservoir is recovered using current techniques. Better drilling and fracking methods may prove critical as output growth from shale fields slows.
Read More: Oil Wells Creeping Into Texas Cities Herald Shale Era’s Twilight
Exxon is working on two specific areas to improve fracking, Woods said. It wants to be able to frack more precisely along the well so that more oil-soaked rock is getting drained. It also wants to keep the cracks open longer to boost the flow of oil. Sand is the primary method today to prevent fractures from closing up.
“That in my mind is where the first wave of technology will come into that field,” Woods said. “We think we’ve got some promising technologies to employ there that will significantly improve our recovery.”
©2023 Bloomberg L.P.
https://www.bnnbloomberg.ca/exxon-bets-new-ways-to-frack-can-double-oil-pumped-from-shale-wells-1.1927597
Looks like clever humans have found another way to put off Peak Oil for a good long time- never bet against human ingenuity in finding energy. All your charts are going to be made worthless.
C8 , I rather have more confidence in Shallow Sand and Mike S . All fluff .
SHALLOW SAND :
Maybe people paying more attention can help me here.
The article is a summary of two articles. The ExxonMobil article in Bloomberg is totally devoid of specifics. So it tells me nothing. It isn’t about refracs, I don’t think.
The JPT article discusses two types of refracs. A bullhead frac, which I assume uses no new casing, and a frac that does use new casing.
The bullhead frac costs $1.5 million /-. But no discussion on what to expect in the way of production response.
The frac with a new liner costs $4 million /-. With this frac EUR could be as high as 170k BOE. I think BOE, I’m not clear if this is BO, or BOE, which is very important.
One thing I caught. Standard casing used on these wells is 5 1/2”, “because the operators didn’t intend on using liners for refrac at the time.” Therefore special 3 1/2” or 4” casing is being manufactured to use in these.
I wish I knew how much that casing costs. I’m sure it’s higher than a kite. I know a little bit about specialized tubing. The lined stuff we use in injection wells is 2 3/8” and costs $14 per foot. 1 1/2” we have used to slim hole injection wells costs about the same. I have heard new 4 1/2” casing costs over $40 per foot. That is why nobody is drilling in our field. The one drilling rig left based in our county is currently stacked. It sits right across the blacktop from our North tool house.
Do just a little math folks. .75 x $75 per barrel x 170k barrels is $9.6 million rounded. I assume that 170k EUR is over 30 years. I’m giving the benefit of the doubt this is all oil.
Who here would invest $4 million up front to return $9.6 million over 30 years? Before LOE of course. And before production taxes of course.
We are paying $6.06 per foot for used gas storage 2 3/8” tubing. The price has finally stabilized, a little over double what we were paying pre-2021. Doing anything now in our field, other than just trying to keep stuff running is cost prohibitive.
Refrac’s might make sense at WTI over $125 sustained? $150?
I’m with Mike. He’s on the ground in EFS. This refrac stuff appears to be fluff.
From Mike S
https://www.oilystuffblog.com/forumstuff/forum-stuff/and-the-lies-they-just-keep-on-a-commin
Also consider
https://www.mrt.com/business/oil/article/pioneer-ceo-scott-sheffield-sees-looming-peak-17823129.php
Basically Mr Sheffield (CEO of Pioneer) expects the Permian will peak in 2028 or 2029 as premium drilling locations become scarce, other CEOs of Permian focused tight oil companies see a peak around 2030.
Scenario below has average annual Permian tight oil output peak in 2029 at 6306 kb/d.
Dennis, things could play out well as you depict in your chart above. That is an increase of about 1 million barrels per day over the next seven years. That is not nearly enough to make up for the decline in the rest of the world. Remember, the US averaged an increase of about 1.4 million barrels per day per year from September 2016 to November 2019.
That’s why I don’t get excited about what might happen or what might not happen concerning future US oil production. I know it will have damn little effect on determining when the world oil production peaked or will peak.
Ron,
There may be increases elsewhere besides the US (Canada, Brazil, Norway, Guyana, Saudi Arabia, UAE, Iraq, Kuwait, and possibly Iran.) Note also the Permian scenario is very conservative, meant to match the predictions by CEOs, these predictions are meant to get the US government from regulating the oil industry too severely. My models reflect slower growth in US tight oil output.
Dennis – See my post above, where do the 5-6 mb/d lost from Australia, Mexico, UK, Nigeria, and Angola within next 5 years come from?
Here’s a graph:
Need to think about these (and other) countries when you make your projections…
Kengeo,
The past does not predict the future also note that decline tends to be exponential, so if we see decline from 9 Mb/d to 6 Mbpd over 10 years (about 4% per year) and we assume that rate of decline continues in the future, it would suggest about a 2 Mb/d decline over the next 10 years. Based on the performance of these 5 nations from 2014 to 2019, the 4% annual decline assumption is likely too high. The World output is the important parameter in my view. The big drop in these nations output from 2008 to 2014 was offset by increased output from other nations over that period. Declining output in some places is likely to be offset by increases elsewhere with the major increases coming from Brazil, Canada, Guyana, Norway, US, UAE, Iraq, Saudi Arabia, and Kuwait over the next 6 to 7 years. I expect the increases will more than offset the decreases over the next 6 years resulting in a gradually rising level of output from 2023 to 2028.
I did a quick OLS on monthly data for these 5 nations from Jan 2008 to Feb 2023 and the decline rate is 3.47% per year. In Feb 2023 output was 5574 kb/d so over the next 10 years assuming continued annual decline rate of 3.47% per year we would see about a 1.66 Mb/d decrease in output from these 5 nations over the next 10 years and over the next 6 years (up to the 2028 peak) we would see about a 1.06 Mb/d decrease in output from this group of 5 nations.
So Why Is Pioneer’s Oil Production… ROLLING OVER?
If we look at the Well Profile for the New Mexico Permian and compare it to the Oil Production Profile, they match. Both are heading up more than a 45% angle.
However, something just doesn’t look right when we do the same for Pioneer’s Well Profile vs its Oil Production Profile. The Well profile is heading up at nearly 45%, but the company’s oil production is ROLLING OVER.
Furthermore, Pioneer plans to add 500-530 wells in 2023, with 100 being 3-mile laterals, and they only forecast to grow production moderately or possible just stay flat.
Why is Pioneer and the overall Texas Permian oil production not matching up with the Well Profiles?
steve
Steve,
A well profile is output for a single well over time, you are not using the terminology in a standard way. Pioneer wants to keep output flat, so they are completeing the number of wells needed to accomplish that. They also do not want to use their premium well locations too quickly to keep shareholders happy, especially at current prices.
Pioneer completed 586 wells in 2021 and only 483 wells in 2022.
DENNIS,
So, Pioneer doesn’t want to use its “Premium Well Locations” too quickly. Got it. Couldn’t have figured out that one on my own so… GRACIOUS. 🙂
Yes, I have heard that the Shale Industry has moved to MODERATION in regards to producing its remaining premium well locations too quickly. Sounds wise.
However, someone needs to tell the companies in the New Mexico Permian that maybe they should also MODERATE their number of premium wells as they are going HOG WILD. Why aren’t the companies trying to keep production FLAT in the New Mexico Permian, especially with these low prices?
Moderation… LOL.
steve
Steve,
The average well in the New Mexico Delaware basin is more productive than the average well in the Midland basin where Pioneer operates so companies in the different basins may make different decisions about how many wells to complete. Also privately held companies may make different decisions because they do not have pressures from shareholders to pay high dividends.
US shale productivity fears spur new technology drive
Growing concerns about the longevity of US shale production has a number of leading US producers looking for ways to delay the inevitable and squeeze more out of existing plays.
While advances in horizontal drilling and hydraulic fracturing (fracking) paved the way for the shale boom by unlocking reserves that were previously thought to be inaccessible, the good times might be coming to an end. Shale growth is widely expected to peak later this decade.
Some operators are already running out of their best drilling inventory and productivity is waning, spurring the industry to become more efficient and find ways to maximise resource recovery. The need to extend inventory has been behind a recent uptick in mergers and acquisitions dealmaking in the shale sector, as producers seek to bulk up their positions. With shareholders squarely focused on improved returns and capital budgets under tight control, companies are seeking to get more from less.
ExxonMobil is looking to improvements in technology to double the amount of oil it can pump from its Permian shale wells. At present, the company is only recovering around 10pc of its unconventional resources. “There’s still a lot of oil being left in the ground,” chief executive Darren Woods says, adding that although fracking has been around for a long time, the science behind the technique is still not well understood.
There is more to this article. I have posted only about half of it here.
Ron , ” they can huff and they can puff ” but they can do nothing . Peak oil world 2018 , peak oil USA 2019 .
“If You’re Driving Off a Cliff, Do You Need a Faster Car?”
To land further away from the cliff 😛
https://www.energyintel.com/00000188-b08c-dc0b-a59b-f08dcb680000
OPEC production dropped by 430,000 b/d in May
MOMR has the OPEC decrease in May at 464 kb/d from secondary sources, the direct report (except Iran where I use the secondary sources estimate) from OPEC members has the decrease at 507 kb/d and the average of the two (secondary source and direct report) is a decrease of 485.5 kb/d.
https://www.opec.org/opec_web/en/publications/338.htm
The latest OPEC Monthly Oil Market Report is just out. OPEC 13 production was down 464,000 barrels per day in May. But that was after April production had been revised down by 76,000 bp/d. So actually, OPEC crude-only production was down 540,000 barrels per day from what was reported for April last month. Total crude-only production in May for OPEC 13 was 28,065,000 barrels per day.
OPEC reached a post pandemic high in September 2022 at 29,696,000 bp/d. OPEC production, in May, was down 1,631,000 bp/d from that post pandemic high.
Dennis will have a full report in a few days.
No wonder we continue to drain our spr here in the states. We might be way past peak of high grade crude.
How to ship Russian oil to Pakistan:
1. Russia to India
2. India to UAE
3. UAE to Pakistan
Does that sound efficient to you?
Do you think Russia is pleased about that?
Does that put upwards or downwards pressure on the price of oil?
Crazy ?
How much of the global oil consumption is
-‘essential’ for basic service, material, and operations of basic industries [ex. farm operations] vs
-completely optional [ex. leisure travel of all sorts], vs
-the big third category of very useful but readily survivable to do without [ex. bananas, cell phones] People will use this category of oil if they can afford to, without restraint.
A lot of this comes down to affordability. A huge swath of the population currently cannot afford optional uses such as leisure travel, personal ownership of a vehicle, or embedded oil in the form of imported foods or tools or equipment of all sorts.
Other people have plenty of money for all sorts of completely optional uses of oil products at current prices.
Just what the overall portion of these categories is hard to know, but the cumulative purchasing power of the population will determine how much money can be directed to oil product purchase, and ultimately to E & P.
Depending on how things play out, it is possible that many countries with marginal economic standing may drop off the list of those who can purchase anything but essential oil product, and the same will happen with large swaths of the populations within each country of the world. In fact, for many it already is that way.
If this affordability (lack thereof) becomes a bigger issue it very well may result in a sustained situation where the blunted demand results in a price a little too low for many fields to be tapped with financial viability. The result would be more stranded oil than many people anticipate.
This scenario is one of dropping demand, not by choice or replacement by EV, but by economic hardship.
HHH has been beating this drum for along time, based on the belief in economic depression.
It may play out in a much less abrupt or dramatic way, with stagnation or a series of recessions with little to no intervals of growth.
Alternatively, there might be enough purchasing power sustained so that oil production can be funded to much higher pricing levels.
It could go either way.
I suppose I’m just stating the obvious. Pardon, if thats how it is.
OPEC+ grants Russia higher production baseline
OPEC+ said that under the latest figures, Russia’s crude oil production has been revised to 9.949 million barrels per day for February 2023 from 9.828 million bpd previously.
´´´´´´´´´
Meaningless baselines, as everyone is firing on all cylinders.
OPEC+ said that under the latest figures, Russia’s crude oil production has been revised to 9.949 million barrels per day for February 2023 from 9.828 million bpd previously.
https://finance.yahoo.com/news/opec-grants-russia-higher-production-193133037.html
´´´´´´´´´´´´´´
Meaningless baselines as everyone is firing on all cylinders
A Few Months Away From Potential Start Of Global Energy Crisis:
https://seekingalpha.com/article/4611111-a-few-months-away-from-potential-start-of-global-energy-crisis
I don’t agree with his expectations for prices but he is seeing the same supply issues as a lot of posters here.
“My personal view is that Saudi Arabia’s ability to pump high volumes of crude for a sustained period of time is limited. Its largest field Ghawar has seen a drastic reduction in capacity based on reports that surfaced a few years ago and while there is not much information out there since those reports came out, chances are that the field’s ability to produce a steady volume of oil has been further reduced since then. Saudi Arabia is now looking to sell less oil at a higher price.”
…
“Zeroing in on rig activities that target crude oil, in particular, suggests that there is a much bigger underlying problem that is causing companies to drastically reduce their drilling activities. My personal view is that there is an industry-wide deterioration in prime drilling acreage availability. Some companies may be outright running out, while others are just looking to preserve their remaining inventory in order to prolong the life of their shale plays.”
George
In the table at the bottom of the IEA repot. There is a lot of spare capacity
Ovi,
I am very skeptical of the spare capacity claims by the IEA, my guess is about 1.9 Mb/d for OPEC spare capacity as of May 2023, rather than the 4.5 Mb/d claimed by the IEA.
Can spare capacity assessment ever be very accurate? My guess is it’s just the result of taking the difference between measured production and some best guess for maximum capacity, which would have to include sustainable, future minimax limits for individual wells, reservoir, oil handling, gas compression, total liquids, injection, power, pipelines, maintenance etc. It is really difficult to assess, even for a single plant never mind a country, there isn’t much incentive for the E&Ps to spend much effort on such an assessment (they are more interested in next week than next year), and I think would be more likely to be over estimated rather than under (and it changes each day with new data as wells decline, new ones are drilled, compositions change, production equipment ages and is upgraded etc.). There may be some spare showing up because production is temporarily down because of unplanned outages, which is why its better to look at something like a six month average rather than monthly ups and downs (e.g. especially the sub-Saharan countries). I don’t believe IEA is capable of assessing spare capacity independently, which means it has to rely on whatever number the producer company tells them. Iraq will have some capacity because of the Kurdistan issues. I think KSA issues are really water handling, mostly injection capacity, these only manifest over a long time and especially difficult to assess for centralised system feeding many fields. UAE may have spare, but if they are trying to increase production why not use it up already. Some spare may come because wells were choked back and fields rested for COVID which gives a short term pressure recovery and noticeable later production boost, but that is now almost all gone. I think all other countries are in decline and are maxed out in at least one of the main production components, there will be some developments in progress to overcome some of these limits, but declining in numbers as discoveries have dried up.
Can spare capacity assessment ever be very accurate?
No, it is never accurate. In fact, it is never even remotely close to being accurate. It is simply the producer telling us what he is able to produce.
I lived in Saudi Arabia for almost five years. There, wild exaggeration is simply part of the culture. They expect you to know that. But Westerners simply cannot understand that part of the Middle Eastern culture. They simply believe it.
Both OPEC’s spare capacity and proven reserves is nothing but a wild exaggeration. Those Middle Easterners think it hilarious that Westerners believe every word of it.
George Kaplan,
I have used recent quarterly maximum output to assess sustainable capacity, I agree this is not a great method, and will change over time, but I will only believe the claimed Saudi capacity of 12.2 Mb/d when I see average output over a 12 month period at 12.2 Mb/d for Saudi Arabia. I am skeptical that we will ever see output at that level. The recent 12 month peak in Saudi output is about 10586 kb/d, that’s where I would put their capacity (it is actually the maximum average 12 month output from July 2005 to December 2022 for the centered 12 month average crude output for Saudi Arabia.
A possible largish and not fully foreseen future impact (or possibly connected with the latest cuts) is that with horizontal wells and full contact completions (or whatever they are called, my memory is going), such as are used in all the big fields in KSA/UAE/Kuwait and maybe Iran and Iraq, when water breakthrough occurs it can come very fast as the oil/water interface reaches all of the well. This is ameliorated if there are intelligent completions so that section of well high in water can be shut off, but eventually it will overwhelm the facilities. Firstly it means that the well capacity for oil is reduced, which is not such a problem if there are lots of spare wells (which I think KSA has) but it also means much more injection water is needed to maintain the same oil flow (i.e. to replace the volume for the oil plus the extra from the increased water) and I don’t think KSA has that amount of spare high pressure pumping.
George,
Yes Matt Simmons talked about this in Twilight in the Desert in 2004, so far the Middle East oil producing nations seem to have a handle on this, but it could change in the future.
Thanks for posting this, George. This is a real eye-opener. I am going to highlight that headline again. Hopefully, a few people will read it, wake up, and smell the coffee. Those OPEC cuts were about a lot more than just price support. As you quoted above, Saudi is having serious decline problems. Ghawar has seen a drastic reduction in capacity!
A Few Months Away From Potential Start Of Global Energy Crisis
The chart in the article is from last month’s MOMR . I have posted the chart from the June issue below. OPEC says “Preliminary data indicates that global liquids production in May decreased by 1.02 mb/d to average 100.2 mb/d compared with the previous month.”
Half of that decline was OPEC cuts. The other half was Non-OPEC decline. Notice the solid blue line in the chart below that indicates world oil production. Of course, this is total liquids. A C+C line would look similar except about 20 million bp/d lower.
Ron,
If we look at non-OPEC decreasing by 510 kb/d, we must remember that we have both decreases in Russian output (about 150 kb/d) and in Canadian output due to wildfires this spring.
https://www.reuters.com/business/environment/cooler-weather-brings-some-relief-wildfire-hit-canadian-oil-province-alberta-2023-05-08/
IEA Report
World oil demand will grow by 2.4 mb/d in 2023 to 102.3 mb/d, a new record. China’s rebound continues unabated, with its oil demand reaching an all-time high of 16.3 mb/d in April. The non-OECD accounts for 90% of gains this year, as OECD demand remains lacklustre amid the current manufacturing slump. An increasingly adverse macroeconomic climate will act as a headwind in 2024, and as the post-pandemic recovery will largely have run its course, oil demand growth is set to slow to 860 kb/d.
Non-OPEC leads world supply growth through next year, adding 1.9 mb/d in 2023 and 1.2 mb/d in 2024. As for OPEC , total oil output in 2024 is set to decline by 200 kb/d as production curbs are carried through the year. Total oil supply is forecast to reach record high levels of 101.3 mb/d this year and 102.3 mb/d next year. In May, world oil supply fell by 660 kb/d to 100.6 mb/d after extra cuts from some OPEC producers kicked in. Saudi Arabia has promised to curb output by a further 1 mb/d in July.
Russian oil exports dropped by 260 kb/d in May to 7.8 mb/d, largely unchanged from a year ago. Crude oil exports rose by 90 kb/d to 5.2 mb/d while product exports slumped by 350 kb/d to 2.6 mb/d. China and India accounted for at least 56% of total Russian exports, while shipments to Africa, the Middle East and Latin America made up another 12%. Estimated export revenues fell by $1.4 bn to $13.3 bn, down 36% on a year ago, with average crude prices easing from $60/bbl in April to $55/bbl in May.
Production table at bottom of IEA report.
https://www.iea.org/reports/oil-market-report-june-2023
World oil demand will grow by 2.4 mb/d in 2023 to 102.3 mb/d, a new record.
According to the OPEC MOMR, may production was 100.2. That’s 2.1 million barrels per day below what will be required to meet 2023 demand. That means prices must rise to increase prices while lowering demand until the two meet in the middle. At least, that’s how it is supposed to work.
Ron,
Some of the demand can be met through stock draws, though I imagine the IEA expects prices will rise as this occurs, also the IEA assumes that OPEC policy put in place in June will not change. If stocks decrease and oil prices rise, OPEC might increase quotas or individual nations may cheat on their quotas. Also the demand estimate may be too high as you suggest and high prices may lead to both more supply and less demand than at a lower oil price level.
Thanks Ovi,
Also in the IEA’s June Oil Market Report is the IEA estimate that OPEC-13 output decreased by 380 kb/d in May 2023 from 28.88 Mb/d in April 2023 to 28.50 Mb/d in May 2023. OPEC has OPEC-13 at 28.53 Mb/d in April 2023 and 28.07 Mb/d in May 2023. The significant differences are in Iranian and UAE production estimates for May accounting for most of the 460 kb/d difference in the May 2023 estimate between the OPEC and IEA estimates for OPEC output.
April May. Prod vs Target May target. Spare capacity
Supply Supply
Algeria 1 0.97 -0.04 1.01 1.0 0.03
Angola 1.06 1.11 -0.34 1.46 1.11 -0.0
Congo 0.28 0.28 -0.03 0.31 0.27 -0.01
Equatorial Guinea 0.05 0.05 -0.07 0.12 0.06 0.01
Gabon 0.2 0.21 0.03 0.18 0.19 -0.02
Iraq 4.09 4.09 -0.34 4.43 4.75 0.66
Kuwait 2.68 2.57 -0.11 2.68 2.83 0.26
Nigeria 1.02 1.22 -0.52 1.74 1.33 0.11
Saudi Arabia 10.48 9.98 -0.5 10.48 12.25 2.27
UAE 3.32 3.2 0.18 3.02 4.2 1.0
Total OPEC-10 24.18 23.68 -1.74 25.42 28.0 4.35
Iran4 2.79 2.87 3.8
Libya4 1.13 1.15 1.22 0.07
Venezuela4 0.78 0.8 0.84 0.04
Total OPEC 28.88 28.5 33.86 4.45
Azerbaijan 0.51 0.5 -0.18 0.68 0.54 0.04
Kazakhstan 1.65 1.58 -0.05 1.63 1.67 0.09
Mexico5 1.67 1.68 1.75 1.68 0.0
Oman 0.84 0.8 -0.04 0.84 0.85 0.05
Russia 9.6 9.45 -0.37 9.83 9.98
Others 6 0.83 0.85 -0.2 1.06 0.82 0.01
Total Non-OPEC 15.1 14.86 -0.85 15.79 15.54 0.19
OPEC+ 19 in cut deal4 37.61 36.86 -2.59 39.45 41.86 4.53
Total OPEC+ 43.98 43.36 49.4 4.64
This might be easier to read. Chart is from June 2023 Oil Market Report that Ovi linked above, best resolution in original web page, just scroll to bottom to find table. Data is in Millions of Barrels per day.
Dennis
Thanks for putting up a better table.
I have limited computer capability on holidays and am more interested in sight seeing.
Ovi,
Your welcome, enjoy Europe!
Not to mention the legacy trend which runs again an again.
Dennis –
Think about the question like this:
What is a reasonable expectation for 2028 production for Group 1 (Aus-Mx-UK-Ng-Ang)? – from 2010-2020 they dropped in half ~9 down to 5, I would guess they drop at least in half again by 2028…
US – Let’s take your projection of US output – I think you have it growing by 0.5 mb/d per year, fine – so in 2028 it’s ~14-15 mb/d. But for the record I don’t believe this will happen, more importantly – we shouldn’t squander these resources, they should be conserved…
Russia – I’m ok holding it steady, but it’s more likely it will fluctuate and trend downward, give them 10 though for sake of discussion.
For Canada-Brazil-Norway – hold them steady ~ 10 mb/d is fine for this exercise.
Here’s the take-home, no matter what US or other countries do, they can not grow production enough to offset losses from other countries, it’s simply not possible…
Ron has produced a myriad of charts showing just this issue, it seems you never want to take on the discussion when it’s broken down by country, I think because your argument unravels (you give too much weight to the gainers – and ignore the losers).
Couple the lack of physical supplies with the refinery and likely demand issues…growth from 2018-19 levels seems like <1% chance of happening…
I think if you shift your projections by ~5-10 years you get much closer to reality…
Just look at where the discussion has gone in past 12 months…the trend seems to be you are revising your estimates downwards, and I'd argue that you will likely continue that trend for next 6-12 months.
12 months ago, did you think the SPR would be at it's lowest level since the early '80s?
I sure didn't see that one coming…
I guess it comes down to one simple question, has the worldwide production downtrend from 2018-2023 been broken? Nov-18 was 84.5 mb/d, Nov-19 was 83.4 mb/d, and Jan-23 was 82 mb/d…
US production has been relatively flat for almost 12 months, so with the other countries dropping by ~1 mb/d, we know that current worldwide production is likely <82 mb/d, maybe even <81 mb/d, so the downtrend continues and we are 3-4 mb/d below the 2018 peak…
Kengeo,
OPEC has 1.9 Mb/d of spare capacity, not including Iran which could produce another 1.2 Mb/d with sanctions relief, that brings things to 3.1 Mb/d, potentially Venezuela could produce more if they got their act together.
Chart below looks at OPEC, US, Brazil, and Canada grouped together and compared with the rest of the World. For the period from 2010 to 2022 the OPEC, US, Canada, and Brazil group increases output at an average annual rate of 654 kb/d and the rest of the World sees utput decrease at an average annual rate of 263 kb/d. My guess is that the increasing group will increase more than decreases by the decreasing group from 2023 to 2028. The rest of World decreased at an annual rate of 0.83% per year from 2010 to 2022 on average, so the rate of decrease is fairly marginal.
The increase in 2028 if these trends continued would be 83 Mb/d, but note these are affected by the pandemic. If we used 2010 to 2019 the increasing group increased at 1200 kb/d per year and the decreasing group by about 211 kb/d per year, those trends would give us an overall increase for the World of 989 kb/d per year which would bring output to 86.7 Mb/d in 2028. The average of the two scenarios is 84.9 Mb/d, my shock model scenario is a bit more conservative at 83.9 Mb/d in 2028.
Kengeo,
World output had been increasing since 2020, I expect this will continue. World C plus C output up by 4728 kb/d from 2020 to 2022 (using annual average output for each year as in chart below, data from EIA).
Dennis, I think you know that production has increased since 2020 because of the recovery from covid demand collapse. The fact that you failed to mention this indicates that you may be trying to be slightly deceptive here.
But I apologize and take it all back if you had no idea why production had increased so dramatically since 2020. That is, if you had no idea what caused the increase since 2020, then you have every reason to believe that pattern will continue. 🤣
Ron,
Yes I realize the increase from 2020 is recovery from the steep decrease that occurred during the pandemic. I did not say, nor do I expect the rate of increase that occurred from 2020 to 2022 to continue, but I expect there will be further increases in World C plus C output over the next 3 to 6 years. A Hubbert type analysis suggests a peak in 2025, a Shock model analysis suggests a peak in 2028, probably 2026 to 2027 would be a reasonable guess at slightly over the previous 12 month average peak maybe about 84 Mb/d.
This was in response to Kengeo’s suggestion that the trend is down since 2018, obviously this is mostly due to the pandemic, which is so obvious I did not think it needed to be stated.
In my comment I said that World output would continue to increase, the rate of increase I expect is about 568 kb/d per year on average from 2022 to 2028 using an ordinary least squares (OLS) trend on my Oil Shock Model estimate over those years. I do not think the 2360 kb/d rate of increase seen over the 2020 to 2022 period will continue and that is not what was intended to be conveyed. I was simply presenting the data and assuming that people understand that a pandemic occurred, I think most would understand this with no need for any explanation, but clearly I was incorrect.
When people complain about my being pedantic, it is for this reason, if every detail is not explained as if to a three year old, then I am accused of being deceptive. I instead have greater expectations of the people reading the comments than is reasonable.
My apologies for being so “deceptive.”
The covid rebound was last year, that’s all over now (for tight oil it stopped significant rebound about 1 year ago).
Let’s make this easier, for Dennis’ 2031 projection of ~82 mb/d, what regions make up the bulk of that production?:
North America: ~25 mb/d, does that last until 2031? Surely any gains by US/Canada will be absorbed from loss in Mexico
Middle East: Peak was 2016-18, ~31.5 mb/d, currently <30
Eurasia: Peak was 2010 at ~26 mb/d, currently <25
Africa and South America: Peak was 2008 at ~18, currently ~13.
Looking at trends, can expect to lose 5-10 mb/d by 2031 (I would say this is a best case scenario).
But looking at trend lines, <70 seems very likely…
Anyone know when Rystad will come out with their annual assessment of reserves?
Kengeo,
Can you put that together in a World Chart where you add all your “polynomial projections” together? Then if you would like you can compare them to my Hubbert and Shock model projections in spreadsheet linked below.
https://drive.google.com/file/d/1bQkWXLxwEC4JqMRhxpYzhNUwLUUh3-la/view?usp=sharing
Chart below for my projections, I think the Shock model is more realistic especially after 2030.
Also could you use Crude plus condensate data rather than all liquids as that is really the better metric and is what I use. Data easily accessible from
https://www.eia.gov/international/data/world/petroleum-and-other-liquids/annual-petroleum-and-other-liquids-production?pd=5&p=00000000000000000000000000000000002&u=0&f=A&v=mapbubble&a=-&i=none&vo=value&&t=R&g=none&l=249–249&l=2–2&l=72–72&l=73–73&l=9–9&l=140–140&l=48–48&l=163–163&s=94694400000&e=1640995200000
Or see spreadsheet linked below
https://docs.google.com/spreadsheets/d/1gxWotVFgpDu-AmpyLkA2s8c7NZ3xcMvT/edit?usp=sharing&ouid=105320434049434900507&rtpof=true&sd=true
Polynomials will give a very poor prediction of the future. It essentially assigns random curves to the data, there are an infinite number of different functions that could be chosen and the choice is entirely random without any underlying physical justification for the model.
Scenarios below compare shock and hubbert models with a Hybrid model that follows the shock model most years except 2026-2031 where it is the average of the shock and Hubbert scenarios. These are best guesses where there is a 50/50 chance output might be higher or lower than the scenario in my opinion.
After 2031 the Shock Model scenario declines more quickly than the Hubbert model due to an assumption that demand for oil falls below supply and oil prices start to fall which reduces oil profits and supply. By 2050 demand for C plus C falls to 51.5 Mb/d and by 2060 demand falls to 32.7 Mb/d in the Shock Model scenario.
Dennis –
No problem, see chart below, made some eyeball projections based on existing trends, not sure how this compares to what you have:
Here’s world total production:
2025-78 mb/d
2030-76 mb/d
2035-71 mb/d
2040-66 mb/d
Dennis –
Excerpts from Laherrere 2022 paper, be forewarned – cherry-picked 🙂
“To correctly understand the scope for future oil production we need to turn to the key topics of URR estimates, and ‘mid-point peak’.”
“our analysis suggests that the corresponding resource-limited production peak will occur soon, between perhaps 2022 to 2025.”
“…global production of conventional oil, which has been on resource-limited plateau since 2005, is forecast to soon decline, likely causing in our view significant strains across the global oil supply chain, and global economies more widely.”
I think your shock model is a best case scenario – for example, if we take the mid-point as 2018, then we might expect ~76 mb/d as soon as 2028 and loss of ~1 mb/d annually thereafter.
Ron – Any guesses on 2028 production value (or anyone else who is looking at the numbers)…
Here’s my best guess:
Total 2028 production of ~70 mb/d (works out to loss of 2 mb/d annually – seems extreme but plausible):
Middle East – 25
US – 10
Russia-10
Others – 25
Ron – Any guesses on 2028 production value (or anyone else who is looking at the numbers)…
Kengeo, On June 21, 2028, I will be 90 years old if I am still around. I don’t expect to make that date. However, my guess would be 75 million barrels per day C+C.
When the fall of 2028 arrives, I think you guys will say, “Hey, Ron got it pretty close. Too bad he’s not around to gloat over Dennis, whose estimate was off by a country mile.
Yeah, that’s what I think is gonna happen. 🤣
Well happy early bday Ron! Funny enough, my mother-in-law shares the exact same day and year as you, your estimate seems like a good one!
Ranges:
2024 80 +/- 1.5
2025 79 +/- 3.0
2026 78.5 +/- 4.5
2027 78 +/- 5.8
2028 77 +/- 7
Funny enough, my mother-in-law shares the exact same day and year as you,…
Born June 21st, 1938. Not many of those around anymore. 😫
Thanks, Kengeo, wish your mother-in-law a happy birthday for me.
dead cat bounce?
Significant ‘ouching’ has been felt by the US private producer whose rig counts are down 32% over the last year with large E&P’s unwilling to pick up the slack!
OPEC tried to kill US shale growth for 8 years yet in the end, it’s US government/Fed itself + geology that did it. 🛢💰
Courtesy Shubam Garg
Quark, I just finished an analysis of the IEA report on oil 2028.
The article is divided into three parts (spanish).
I think it may be of interest to readers of peak oil barrel.
https://futurocienciaficcionymatrix.blogspot.com/2023/06/hoja-de-ruta-aie-hasta-2028-parte-iii.html
Thank you so much.
The California energy crisis was an actual financial crisis . Read about it and how we were fooled . Hoaxes and narratives and how Enron fooled all .
“The title of Wayne Lusvardi’ article “Current Hoaxes are Re-Runs of the 2001 California Energy Crisis” grabbed my attention. Maybe its my imagination, but hoaxes and and energy are almost interchangeable words to me these days.
This quote from Lusvardi is simply amazing IMHO: “not to create a shortfall to game the market (as depicted in the book The Smartest Guys in the Room and movie 2005) but to avoid conveying power when the grid was congested, which lowered prices.
The Cal Energy Crisis was really a financing crisis, as California was not running out of electricity but clean air in 2001 . . . .
This story of how a clean air mandate morphed into a so-called energy crisis, a contrived electricity price bubble, price controls, utility bankruptcy, blackouts, merchant power producers overcharging then having to rebate the overcharges, a potential bond market crisis, a fake California “wet drought”, inflated long-term electricity rates, the recall of a state governor, and, effectively, taxation without representation, was so complex that the scapegoated Enron greed story was more believable to the public. Journalists blamed Enron and academics blamed “deregulation” but both were diversions. ”
As an aside, at least 2 prominent Midlanders, Ted Collins and George Staley, were instrumental in establishing HNG in the Permian Basin which after acquiring several interstate pipelines went on to become Enron. Many retired Enron employees lost life savings and pensions when Enron rolled over. Former employees kept their Enron stock when the left for other opportunities because Enron was considered a “blue chip” stock. A brother was a former geologist at Enron for at about 10 years and left before the scandal. But he was locked out of his 401K during the scandal and lost at least $200,000 while Skilling, Fastow and other executives were allowed to trade their stock and options.
Read all about this at
https://www.oilystuffblog.com/forumstuff/forum-stuff/looking-for-the-wizard-of-oz
OPEC data shows Saudi oil production cuts will “sharply” tighten global markets Bold Mine
(Bloomberg) – Saudi Arabia’s latest oil production cuts are set to tighten global markets sharply next month, data from OPEC show.
Even before the kingdom announced its surprise new measures just over a week ago, the Organization of Petroleum Exporting Countries expected that world inventories would deplete rapidly in the second half amid a post-pandemic recovery in fuel demand.
With the 1 million barrel-a-day cutback to be implemented by Riyadh in July — and possibly longer — the shortfall will intensify. World consumption will exceed supplies by roughly 2.7 MMbpd next month, a report from OPEC indicated on Tuesday.
If the kingdom opted to extend the reduction for the whole third quarter, it would be the biggest deficit since 2021.
Despite the projected tightness, crude traders have so far reacted with indifference to the new curbs unveiled by Saudi Energy Minister Prince Abdulaziz bin Salman on June 4. Brent futures have declined 4% to near $73 a barrel since Riyadh’s plan emerged, as fears over lackluster demand in China take center stage.
The price retreat may be welcomed by the U.S. and other consuming nations, which have condemned OPEC and its allies for stoking inflation by withholding oil supplies. But it could be painful for producers like the Saudis, which the IMF believes needs oil prices above $80 to cover government spending.
With such a tightening of the oil market due to such a dramatic cut, why are future WTI oil prices still trading around $70 a barrel? Someone, please give me a rational reason for this. This, to me, seems unexplainable.
Ron,
The traders do not seem to believe the estimates of future oil supply and demand by OPEC, the IEA, and the EIA.
One thing that seems apparent to me is that the data is not very good, even the EIA which seemed pretty good to me in the past, has very large adjustments to its data which are needed to balance estimated output, refinery inputs, import and export estimates. If we add up all the adjustments to crude supply from Jan 1981 to March 2023 it is 2.795 billion barrels of oil, this is 3.36 times the total US petroleum stocks as of March 2023 (includes the SPR). The data is just astoundingly bad, it is no wonder that markey participants are confused, we don’t really have a handle on petroleum stocks, production, imports, exports and refinery input.
See link below where the adjustment for March is 32,165,000 barrels, about 12% of US crude output in March, though the error could be production, refinery inputs, imports or exports or all of the above, we just do not know.
https://www.eia.gov/dnav/pet/pet_sum_crdsnd_k_m.htm
Peak oil is here according to this article.
https://blog.gorozen.com/blog/hubberts-peak-is-finally-here
“Using our neural network, we have updated our basin analysis, and the results are shocking”
Lightsout – Great find, here’s same/similar on seekingalpha – It’s a must read!!!!
“For the first time, productivity per lateral foot registered a 6% year-on- year decline in the Permian. According to our models, this proves the industry has drilled its best wells; basin-wide production decline is likely not far behind. With the Eagle Ford and Bakken unable to grow over the last eighteen months, once the Permian rolls over, the shale revolution will shift from growth to decline, and Hubbert’s Peak will reemerge with a vengeance.”
https://seekingalpha.com/article/4611129-goehring-and-rozencwajg-q1-2023-natural-resource-market-commentary
Simple…. the market needs proof of supply erosion. Headlines, expectations and pledges aren’t enough to overcome anticipation of possible soft demand right now. However, the same can be said for fears of demand erosion not being able to push us much lower… things seem to be in stubborn limbo right now until a catalyst breaks us higher or lower. I am still skewed to an eventual grind higher starting sometime this summer. Just an amateur hunch.
Gunga , ” the market needs proof of supply erosion ” . No , the market needs no proof . It works on half truths , lies and intervention by the govt . Price discovery is not possible any more . There is no more a market , only speculation . Best of luck looking for price discovery .
HIH.
The Market exists because individuals transact in it, regardless of how inefficient, reliable or trustworthy. So, there is always a market, even if the integrity of it is in question.
Price discovery exists always as the human battle between fear and greed and it is still essential to the market. Price discovery happens every moment a trade is made.
My simple point on my previous post was to emphasize that the current uncertainty in price direction on crude appears to be due to a “show me the proof” environment. It is waiting on reasonable trend confirmation data. There appears to be no dominant conviction up or down on oil price right now….
Gunga , ” even if the integrity of it is in question. ” . If the integrity is in question then their is no market . There is nothing known as a ” little bit pregnant ” . 🙂
the nasdaq is up 40% YTD (basically 7 companies). Nvidia is up about 200%. anyone who has any cash is absolutely shoving every dollar into AI. So I ask you, can you pitch oil as an AI play? No? Then beat it. even if i were an oil company, why would I put any reserve cash into my own stock or oil when AI is here.
Twocats,
AI might be used to optimize the fracking process, in fact I believe it is already being applied.
See for example
https://novilabs.com/resources/urtec-2023-understanding-the-drivers-of-parent-child-depletion-3862321/
TwoCats, my question had nothing to do with the price of any oil company’s stock. It was about the price of a barrel of oil on the futures market. Why is the price so damn low when world oil production has dropped considerably in the last two months and scheduled to drop even more.
That could be because the traders believe a world recession will keep demand for oil very low. Or it could be because they don’t believe Saudi Arabia when they say they are going to cut production by another million barrels per day.
My opinion is I believe the Saudis when they say they are going to cut production further. I also believe the recession will get worse and keep prices low. But that is just my opinion. And my opinion has known to have been wrong.
Oh, and I do not get the AI connection. You totally lost me there.
Discovery trend and CAPEX
A lot of recent deepwater discoveries have been in new basins offshore Guyana and Namibia, but there may not be many such prospects left. I get the impression that results for Suriname, Cuba, Sierra Leone, Senegal etc haven’t been all that exciting. 7th and 8th Generation rigs are so expensive that only wells with very high prospectively are drilled, so the results are doubly disappointing. Even where large discoveries are made it is getting that it may be difficult to find commercial development solutions such as with Bay du Nord and SW Bonga. Over the next few years the deepwater section seems destined to shrink to match the small wedges for shallow and onshore and one day in the early thirties there will not be an exploration industry any more.
Do you have a link to the article this came from?
No I don’t and the original seems to have been marked up with some writing. From the graphics it appears to be from one of the standard firms.
What did the EU import ? Russian diesel or Saudi diesel . ?
World oil output to reach record 101.3m bpd in 2023: IEA Bold Mine
Global oil production in 2023 will reach a record figure of 101.3 mln barrels per day (bpd) and in 2024 will grow to 102.3 mln bpd, according to the report of the International Energy Agency (IEA).
The United States will continue to dominate non-OPEC+ countries in terms of production growth.
According to the IEA, the adjustment of quotas for individual OPEC+ member nations will have no meaningful impact on global oil supply this year. However, the IEA forecasts a global oil deficit next year, particularly in its second half.
At the same time, non-OPEC+ nations will boost global oil supply by 1.9 mln bpd in 2023 and 1.2 mln bpd in 2024, while OPEC+ countries will decrease supply by 200,000 in 2024 amid voluntary production cuts.
The IEA noted that global supply of oil in May 2023 declined by 660,000 bpd due to the start of voluntary cuts in oil production by some OPEC+ members.
While oil demand continues to rise both seasonally and structurally for the rest of the year, supply is expected to rise only temporarily, the statement said. Global oil production fell by 660,000 barrels per day in May to 100.6 mln bpd.
This is sheer nonsense. Understand they are talking Total Liquids here, not C+C. Nevertheless, 101.3 million bpd would not be a record. The record Total Liquids, so far, was in November 2018 at 102.3 million bpd. The post-pandemic high was even higher than their prediction of a “record” high. That was in November 2022 at 101.71 million bpd. The level in May 2023, according to the OPEC MOMR was 100.2 million bpd.
But their prediction for non-OPEC+ nations is even nuttier. They predict an increase of 1.9 million bpd this year and another increase of 1.2 million bpd next year. That is an increase of 3.1 million barrels per day in the next 18 months for the world less OPEC+. As the chart below shows, any increase in world less OPEC+ will have to come from the USA. That is not likely to happen.
BP’s World Statistical Report will cease to be BP’s. Being turned over to Energy Institute. BP will be on the advisory board and Energy Institute will have KPMG and Kearney (acctg firm and consultant firm) as partners.
Next report due for publication 26 June.
No feel for this being agenda based. Worth nothing BP itself had cause to pretend green this and that.
Watcher,
Good to see you post. Hope all is well with you.
As Ohio’s recently released 1Q 2023 production report indicated (somewhat surprisingly, perhaps), Encino brought in 4 wells in the northern Utica – Columbiana county – with average production ~636 bbld over 3 months.
This is not Permian tier numbers, certainly, but it does significantly expand the geographic footprint of economically viable liquids production in the Buckeye state.
(Farther south – in Guernsey county – Ascent had a well average almost 1,500 bbld over the quarter).
As an aside, has anyone on this site mentioned that Brazil is on track to be the world’s fourth largest oil producer?
Planned near doubling (~3 million bbld to almost 5 1/2) in the coming years with the pre salts being the main driver.
(Lottsa pre salts in the world. Ever improving seismography could make for … mahtee interestin’ future happenin’s).
Innovation – like depletion – never sleeps.
Watcher
So, what is the price for getting the same data (in excel format) as before?
Rig and Frac report for June 16
Rigs continue to drop but Fracs have reversed direction and increased.
Overall Hz oil rigs dropped by 4 to 498 and are now down by 74 over the Nov 25 high of 572.
Permian rigs are down 3 to 325, down 20 from the April 28 high of 345.
Texas saw an increase of 3.
NG rigs also continue to drop.
Ovi and/or Dennis –
How many new wells per year are required just to keep production flat? My WAG is between 250 – 500 new wells every year are needed to maintain flat production profile…
One rig can likely drill and complete ~4 – 5 wells in a year?
Here’s graph of permian crude production – looks to be at plateau…
Kangeo
I think you are asking: “How many wells per month are required to keep production flat.?”
For the Permian the answer is somewhere between 475 and 500 wells per month, currently. For the past few months, Permian drillers have been using close to 30 DUCs over the close to 470 wells drilled to slightly increase monthly production.
In the upcoming US post in early July, I will be reporting that the 495 wells drilled in the Permian in May increased production by 9 kb/d. To offset the decline, production from 483 wells was required. In other words if only 483 wells were completed in May, production would have been flat.
In July, it is forecast that production will increase by 1 kb/d.
Yes, thanks Ovi for interpreting my poorly worded question…so it sounds like companies are willing to keep the top spinning- but see no reason to increase production at current price, which makes good business sense.
Ken geo,
Better estimates from EIA or Novi Labs that include Permian output in New Mexico.
https://www.eia.gov/energyexplained/oil-and-petroleum-products/data/US-tight-oil-production.xlsx
or
https://novilabs.com/blog/permian-update-through-april-2023/
The post by Enno Peters at Novilabs has a supply projection that assumes the rig count falls by 100 rigs in the Permian by September and then remains at that rig count (256 rigs) until December 2030. Based on the DPR report about 1.33 wells were drilled per rig in April 2023, assuming this ratio does not change this would imply 133 fewer wells drilled per month once the rigs fall by 100. Assuming no change in new well productivity and that wells completed is the same as wells drilled after September 2023 the supply scenario in Enno’s report suggests only 510 minus 133 wells or 377 completions per month are needed to keep output in the Permian basin flat from March 2023 to December 2030. Personally I doubt that we see rigs drop from 356 in April 2023 to 256 rigs by Sept 2023. If the recent Permian rate of decrease continues to Sept we might see a drop of 40 rigs and Permian output would continue to increase. My 450 well per month scenario suggests about 338 rigs operating in the Permian basin, using the DPR data. If we use baker Hughes horizontal oil rig data and estimate roughly 340 rigs operating in April with 474 wells drilled we get 1.39 wells drilled per rig, using that metric suggests 324 horizontal oil rigs would be enough to drill 450 wells per month.
Frac count for June 16
The Frac count has reversed direction and has increased by 12 above the low of 256 on June 2. The frac count went up 10 last week and 2 this week. The current frac count is 32 lower than the high of 300 on November 25.
New posts are up
https://peakoilbarrel.com/opec-update-june-2023/
and
https://peakoilbarrel.com/open-thread-non-petroleum-june-17-2023/