A post by Ovi at peakoilbarrel.
All of the oil (C + C) production data for the US states comes from the EIAʼs Petroleum Supply monthly PSM. At the end, an analysis of three different EIA monthly reports is provided. The charts below are updated to April 2020 for the 10 largest US oil producing states.
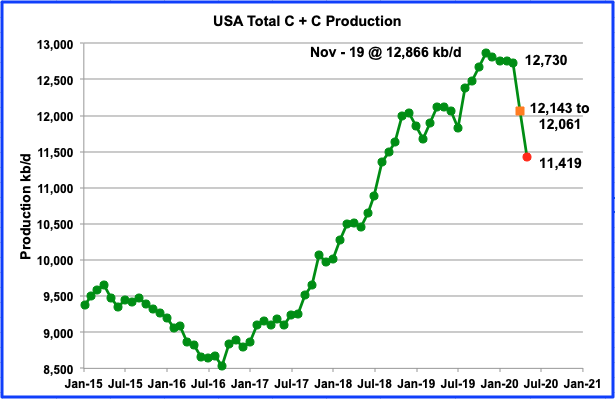
This US production chart is updated to April and tentatively extended to May and shows the continuous slow decline in oil output from US oil fields from November 2019 to March 2020 and then the sharp acceleration in April and May. Since the current EIA data is two months delayed, April is the first month that shows the combined effects of the pandemic and low oil prices.
March output was 12,730 kb/d, revised up by 14 kb/d from the May release. The orange square is both a projected and actual April output. April output according to the EIA’s release is 12,061 kb/d, a drop of 669 kb/d from March. For comparison purposes, the 12,143 kb/d was taken from the late June Monthly Energy Review. It is too high by 82 kb/d. The early June STEO projected April US output of 12,380 kb/d, much higher than the MER and the latest EIA PSM report. Using the EIA’s weekly data, May drops to 11,419 kb/d, red dot.
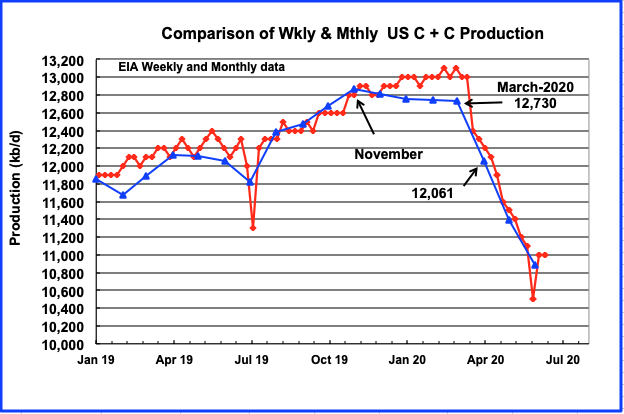
This weekly chart is updated to July 1, Canada Day, EH! The last two blue triangles represent output estimates from the late June MER for May (11,394 kb/d) and a 26 day average for June, respectively. The June average is 10,885 kb/d.
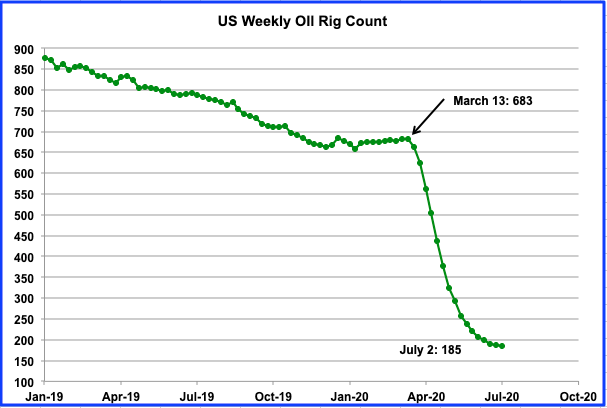
The weekly drop in US operational oil rigs is slowing and appears to be heading for a minimum in July. For the week of July 2, US oil rigs just dropped by 3 from the previous week. The slowing in the rig count drop appears to be reflected in the increased output in late June shown in the previous chart. Interestingly, over the past 3 weeks, Texas oil rig counts were almost flat, 97 (June 19), 98 (June 26) and 97 for the week of July 2.
RANKING PRODUCTION FROM US OIL STATES
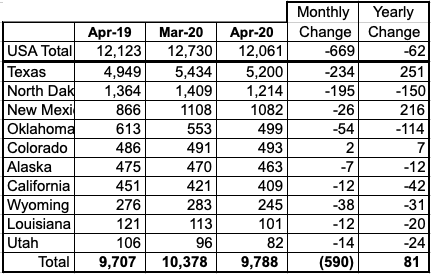
Listed above are the 10 states with production previously greater than 100 kb/d. This month Utah fell below 100 kb/d again but is retained for continuity. These 10 accounted for 9,788 kb/d (81.2%) of US production out of a total production of 12,601 kb/d in April 2020. US year over year production in April was negative and will continue negative going forward for many more months. Note that of all these 10 states, only one state, Colorado, had a monthly and yearly gain in April.
Not shown in the table is the GOM which produced 1,915 kb/d in April and would rank between Texas and North Dakota.
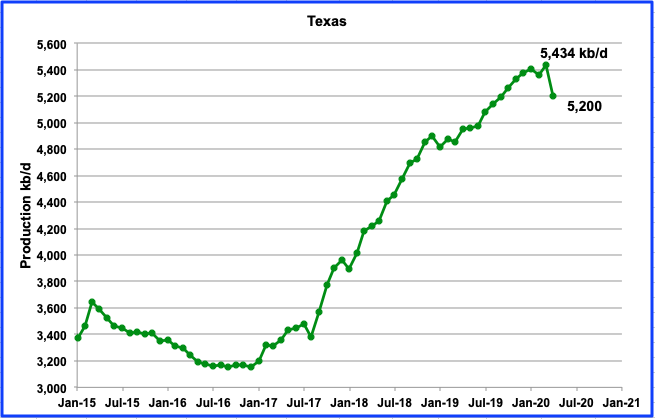
Production in Texas decreased by 234 kb/d to 5,200 kb/d in April. March was revised up by 10 kb/d to 5,434 kb/d.
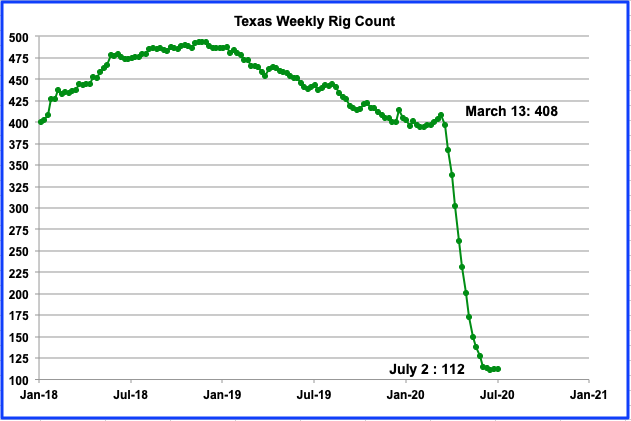
From March 13 to July 2, the Texas rig count dropped by 296 or 72.5%. An output drop followed in April as shown in the previous chart. The above chart includes all rigs. Oil rigs fell from 379 in the first week of January to 97 in the week of July 2. Note that for the week of July 2, the rig count was flat at 112.
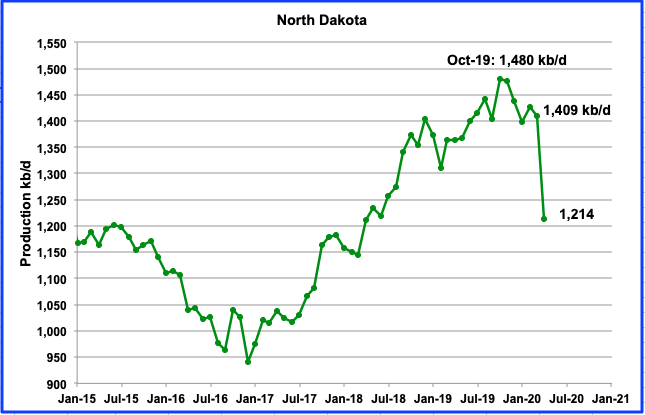
North Dakota’s oil production started to drop in November 2019 after peaking at 1,480 kb/d in October. However it increased in February only to resume its decline again in March and April to 1,214 kb/d. In the March POB report, Helms’ provided an output estimate for April of 1,048 kb/d. It was too low by 166 kb/d. The April decline was smaller at 195 kb/d, not the 361 kb/d projected by Helms.
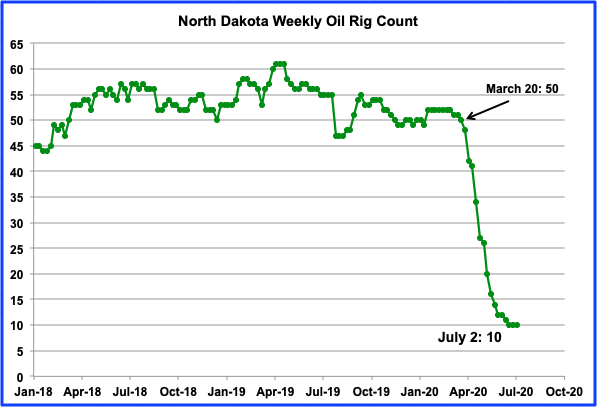
The North Dakota oil rig count has held steady at 10 for the weeks of June 19 to July 2.
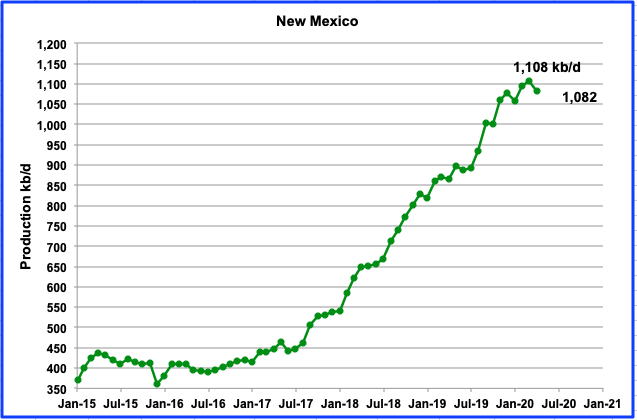
New Mexico increased its production in March by 14 kb/d to 1,108 kb/d. However April saw an output drop of 26 kb/d, its biggest since July 2016, to 1,082 kb/d. It will be interesting to see what May brings.
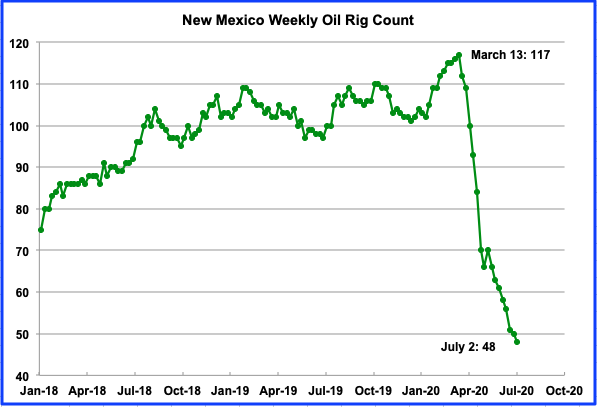
From March 13 to July 2, New Mexico’s oil rig count dropped by 69 or 59% to 48. Increased production declines can be expected next month.
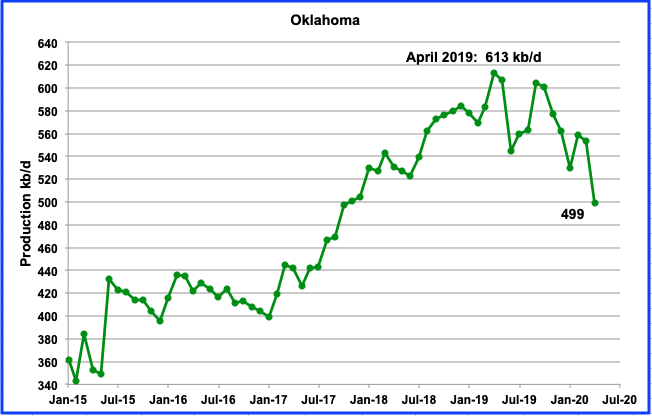
Oklahoma’s output rebounded in February after declining for four months in a row but resumed its decline in March and April. April output dropped by 54 kb/d to 499 kb/d.
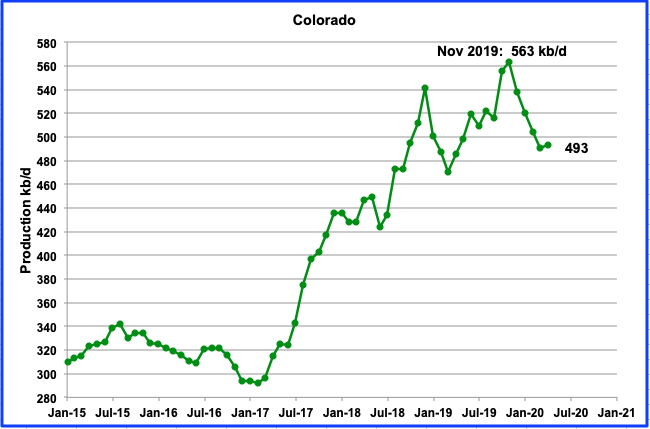
Colorado production increased by 2 kb/d in April to 493 kb/d. Colorado’s production dropped steadily since November 2019, until April’s reversal. Colorado was the only state to report a monthly gain in April.
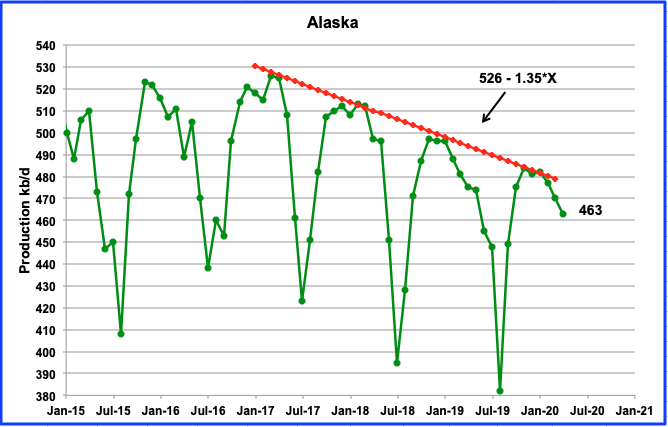
Alaska production continues its annual summer decline. In April output dropped 7 kb/d to 463 kb/d. The latest EIA weekly data for June shows output to be close to 362 kb/d. This is 20 kb/d lower than the August 2019 output of 382 kb/d
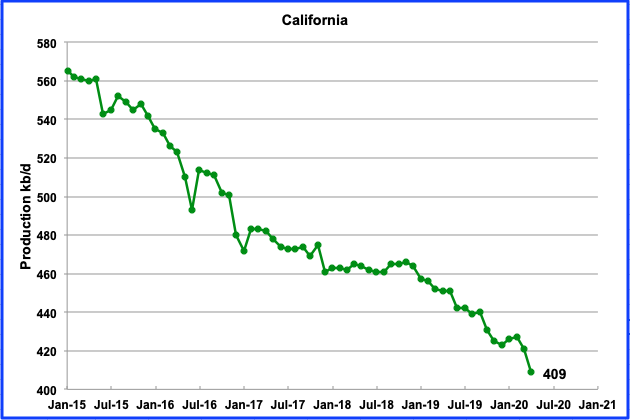
California’s slow output decline has resumed. April production was down by 12 kb/d to 409 kb/d. Over the last three years, the average decline rate has been close to 24 kb/yr.
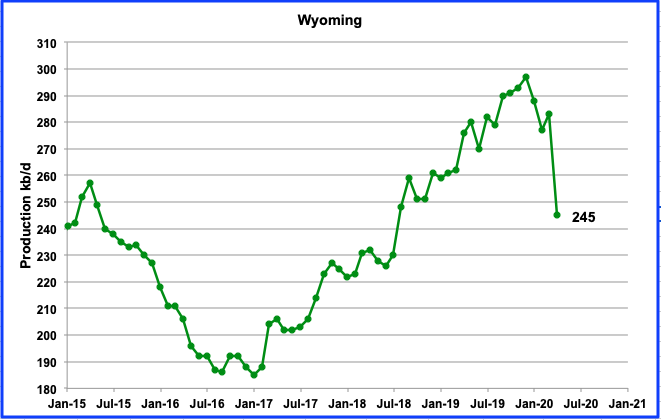
Wyoming increased production by 6 kb/d to 283 kb/d in March but declined by 38 kb/d in April to 245 kb/d. During the week ending July 2, Wyoming had 1 oil rig in operation, down from a high of 20 in January 2020.
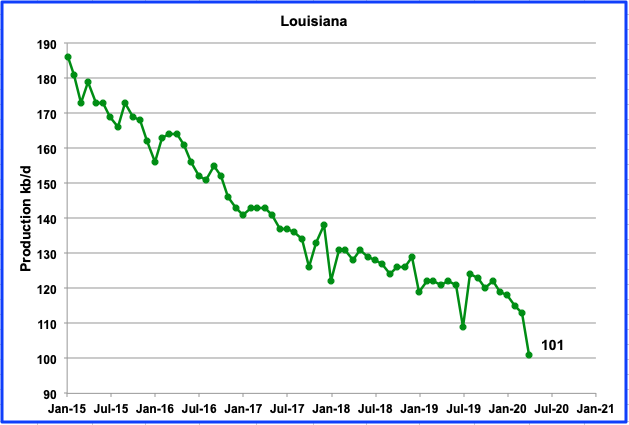
Louisiana’s output has been in decline since August 2019. In April production was down by 12 kb/d to 101 kb/d. In January 2020, on average, 22 rigs were operating while there was only 10 operating in the week of July 2, a drop of 1 from the previous week.
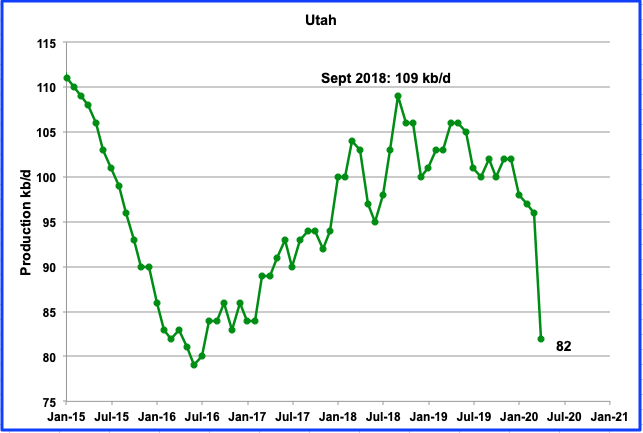
After the low in June 2016, Utah’s production peaked in Sept 2018 at 109 kb/d. Since then, output has been unsteady but with an overall decline. It declined by 13 kb/d to 96 kb/d from September 2018 to March 2020. In April, production dropped by another 14 kb/d to 82 kb/d. Utah’s oil rig count slowly climbed from 4 rigs in January to a peak of 8 in the week of April 3. By the first week in May, no rigs were operational.
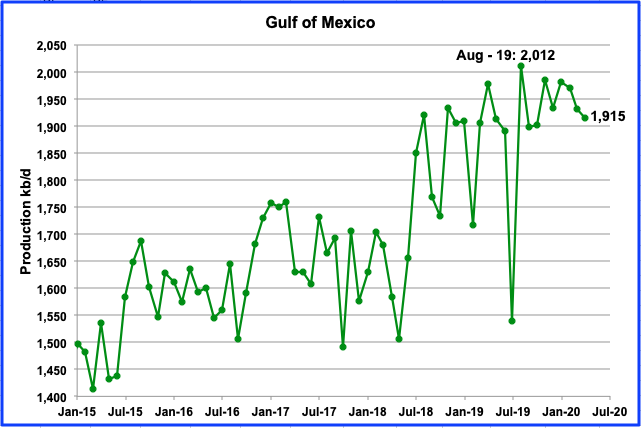
Over the past year, GOM output has kept bumping up against a production ceiling of 2,000 kb/d. In April output dropped by 16 kb/d to 1,915 kb/d.
UPDATING EIA’S DIFFERENT OIL GROWTH PERSPECTIVE
1) DRILLING PRODUCTIVITY REPORT
The Drilling Productivity Report (DPR) uses recent data on the total number of drilling rigs in operation along with estimates of drilling productivity and estimated changes in production from existing oil wells to provide estimated changes in oil production for the five principal tight oil regions. The charts are updated to July 2020.
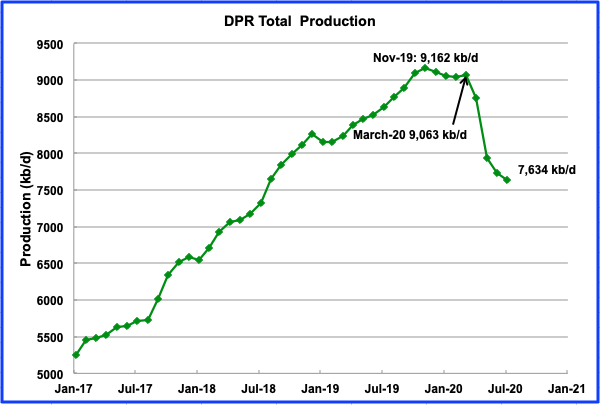
Above is the total oil production from the 7 basins that the DPR tracks. Note that the DPR production includes both LTO oil and oil from conventional wells/fields.
According to the June DPR report, LTO oil and conventional oil output peaked in November 2019 at 9,162 kb/d, revised down from the 9,181 kb/d estimate in the May report. The largest decline occurred in May, 811 kb/d. The projected output in July is 7,634 kb/d, down 91 kb/d from June. The contributions to the output decline from the four major basins are shown In the charts below.
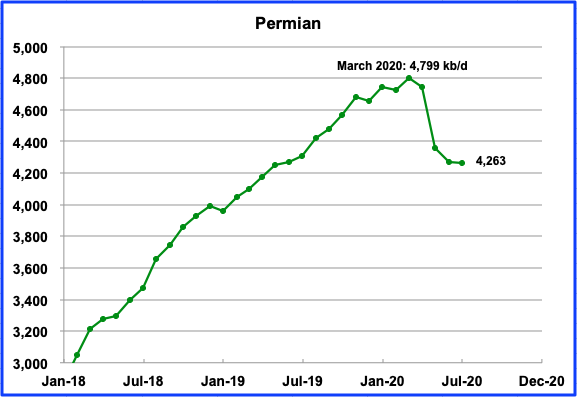
Permian output in July is projected to be essentially the same as June, 4,263 kb/d, down 7 kb/d.
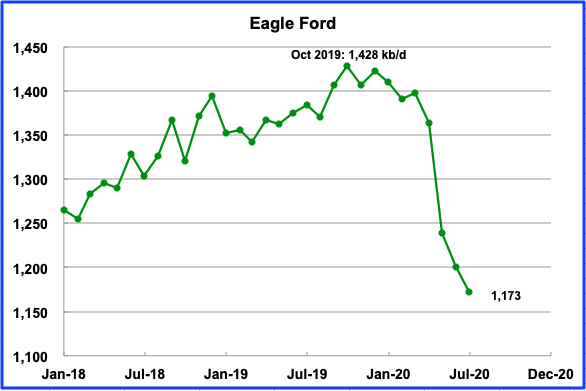
Eagle Ford’s May drop was 125 kb/d. July’s drop is projected to be a much smaller 28 kb/d to 1,174kb/d.
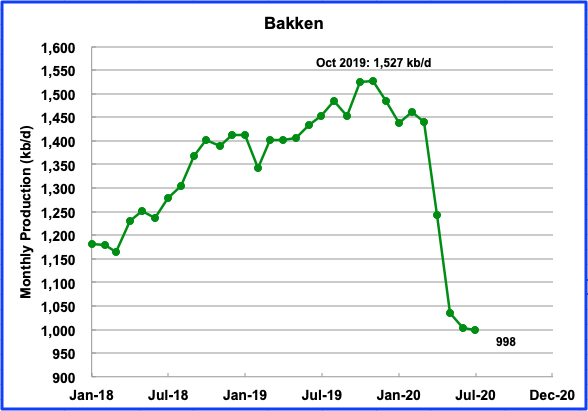
The Bakken is projected to have two big output drops. April declined by 197 kb/d and May declined by 207. July output is expected to be 998 kb/d, 5 kb/d lower than June. It is interesting to note that the North Dakota output for April was down by 195 kb/d, very close to the DPR estimate.
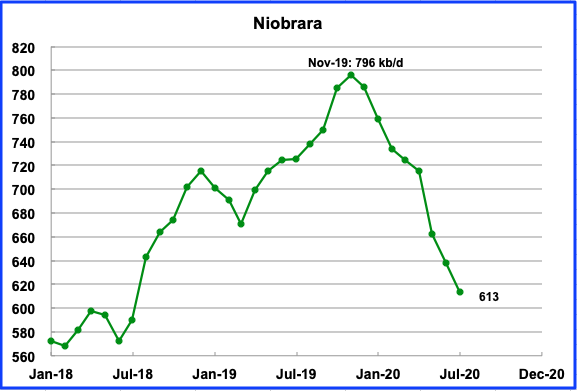
Niobrara output is expected to drop by 25 kb/d in July to 613 kb/d.
2) LIGHT TIGHT OIL (LTO) REPORT
The LTO database provides information on LTO production from seven tight oil basins and a few smaller ones. These charts are updated to May 2020.
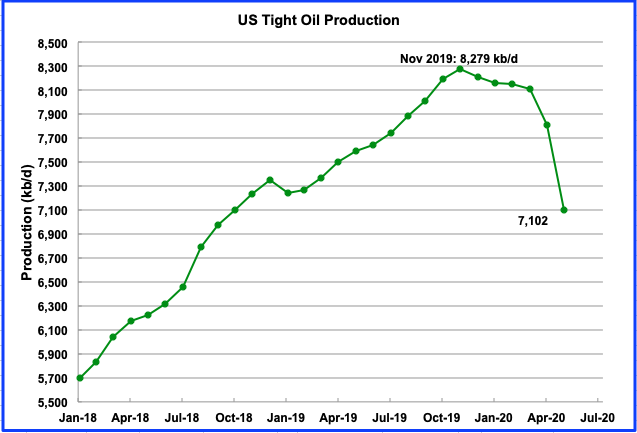
May’s total LTO output is expected to decline to 7,102 kb/d from 7,806 kb/d, a drop of 704 kb/d.
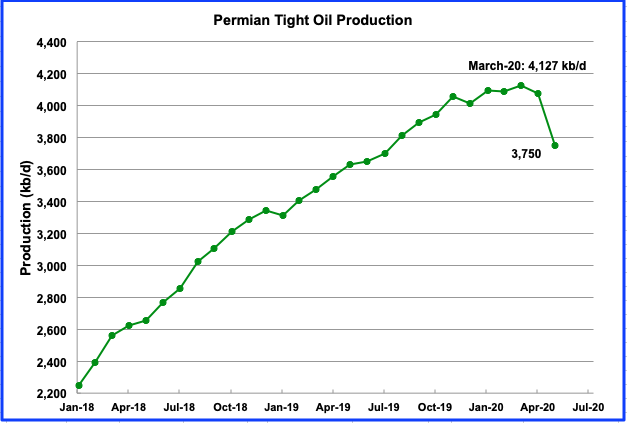
Permian output in May is projected to be 3,750 kb/d, a drop of 328 kb/d from April’s 4,078 kb/d, close to half of the total LTO decrease.
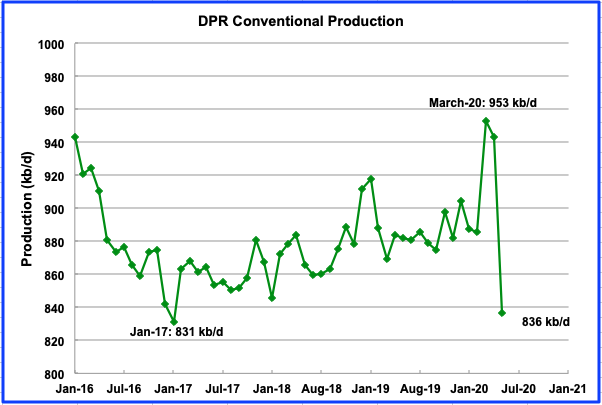
This chart shows that conventional oil in DPR basins is also being shut in. The chart was obtained by taking the difference between the DPR and LTO production estimates up to May 2020. From Mar-20 to May-20, conventional oil in DPR basins fell by 117 kb/d, or 12.3%. Overall DPR production fell by 12.5% over the same time period.
3) SHORT TERM ENERGY OUTLOOK (STEO)
The STEO provides projections for the next 13–24 months for US C + C and NGPLs production. The June 2020 report presents EIA’s oil output projections out to December 2021.
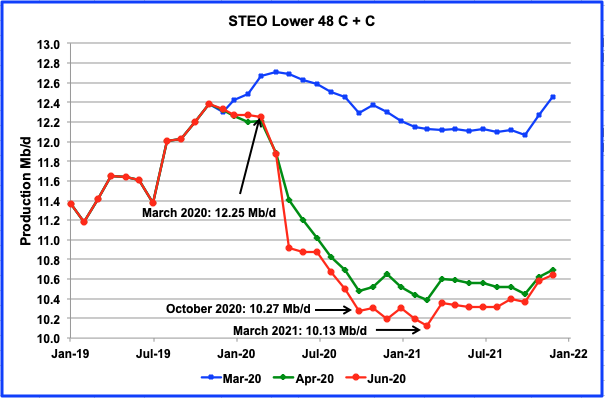
The June STEO report has revised their April output projection down from their earlier report.
The STEO is projecting a major drop of 1.98 Mb/d in US L-48 production from March 2020 to October 2020. Note how the June STEO output projection has dropped by a further 200 kb/d to 400 kb/d in the October 2020 to March 2021 time frame compared to April’s estimate. While the STEO is showing fairly steady drop from March to October, the projection from October to March 2021 appears to be more tentative and further revisions should be expected over that time. Comparing March 2020 output with December 2021, the decrease is reduced to 1.61 Mb/d as production slowly begins to rise, starting in early 2021.
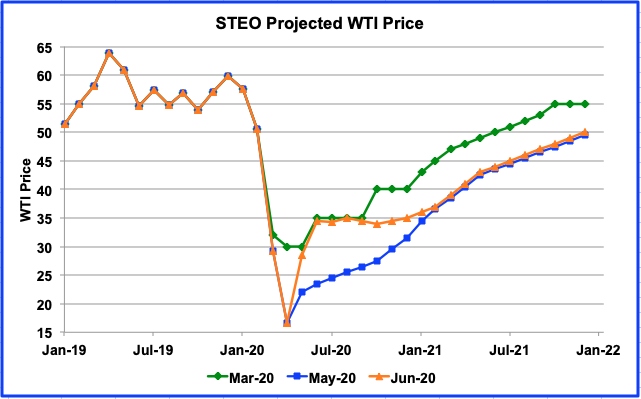
Now that the price of WTI has moved closer to $40/b, it appears that the STEO March projection is closer to the early July price of $40/b than their May estimate, which was issued on May 12th when oil was $25.78/b. The June STEO was released on June 9 when WTI was in the $37/b to $39/b range.
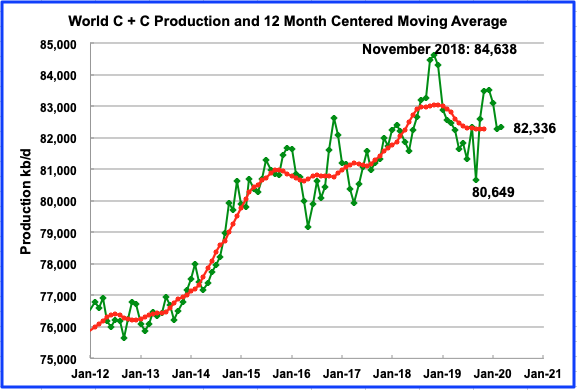
World oil production increased by 48 kb/d in March 2020 to 82,336 kb/d.
147 responses to “US Oil Decline Accelerates in April”
Finally some some production doom and gloom
Who’s willing to venture a guess or estimate of the retail price of gasoline and diesel fuel a year from today?
If the product were anything other than oil, it would be much easier to guess or estimate the price, because production costs would be more readily available.
But in the case of legacy oil, and a producer in desperate need of cash, I suppose the producer will continue to produce and sell at any price above the socalled lifting cost. I hope I’m using this term correctly. I take it to mean that lifting cost is the cost of just keeping the well in production, without considering paying off loans, etc, so that some cash flow is generated, regardless of whether the well is profitable.
There’s obviously a hell of a lot of legacy oil left to be produced, and I’ve seen estimates of lifting costs as low as ten dollars a barrel for some of it.
I posted a link at the non oil thread about fleet operators maybe going to electric cars pretty soon, which is the sort of thing that could have a significant impact on the price of gasoline within the next few years.
Ofm
Probably best guess is about the same price as today as economic crisis won’t be resolved, but supply would mot be adequate at lower price. This would be a guess of avg monthly price for US for most recent month reported vs same month in 2021.
OFM
I don’t see the logic in why fleets would go to EVs. These are the issues I see:
1) Cost: Because of higher initial cost, they would have to charge more per day.
2) Range/Range Anxiety: A typical EV owner would have good knowledge of where to charge up. An occasional EV renter no so much. Not sure a user of an ICE car would want to try a new EV experience on a business or holiday trip. When EVs get to 50% of the market, then I could see rental demand increasing.
3) Usage: Due to the above two considerations, usage/popularity/demand would be low, driving the daily rental cost higher.
I am sure if you give some more thought you might find more Pros and Cons
Ovi,
A few more pros-
Much lower projected maintenance costs
Much lower ‘fuel’ costs
Another con-
Much,much higher battery replacement cost
“This time, Amazon placed the order—a big one”-
Electric-vehicle maker Rivian just booked an order for 100,000 delivery vans to be built at the former Mitsubishi plant in downstate Normal, IL”
First batch due to be delivered 2021
https://www.chicagobusiness.com/manufacturing/time-amazon-placed-order-big-one
Hickory
I agree with your points when it comes to an EV owner. I don’t see the first two points being meaningful to an EV renter.
On another note: EV buses are the new up and coming trend.
I think EV buses will make a big impact on city transit buses. I think the city transit bus is the ideal use for EV buses. You have fixed routes and their range and daily use are known. The capital costs would be high but their maintenance and fuel costs would offset that. The environmental benefits would be an added bonus.
I speak from experience. Back in 1985, I was the manager of an office that helped develop standard 4o ft natural gas transit buses. We had residents in our Cdn cities complaining about the particulates and smell emitted by city transit buses. I put together a consortium of natural gas companies, transit properties, a bus manufacturer and engine company (Cummins) to try to address these concerns.
I made the presentation, full of economics, to Cummins in hopes that they would join. They were critical. The others partners were Cdn but we had no engine manufacture. After the presentation, their research chief stood up and said to me, something along the following lines. His first words made me sink and my boss told me he was initially shocked.
“Ovi you are crazy. Do you really think I am going to convert a compression ignition engine to a spark ignited engine as he looked at me. However, as crazy as you are, I am going to join you because my company does not want to read an SAE paper three years from now to find out that you have developed a NG engine with another company. As head of research, my company pays me to keep us in the lead. The rest is history. Natural Gas buses are now common in Europe and the US.
At that time NG was inexpensive in Canada. We were saving $10,000 per bus per year so we could offset the higher capital cost of the buses and the expensive compressor station. Also the NG bus had range limitations at the time in that that could not go as far as a diesel bus. In time that problem was addressed.
EV transit buses have almost identical issues, higher capital costs vs operating costs vs range. Up to 2017, NG bus order were still being placed. Probably still are. However I have noticed more and more cities now switching to EV buses. I see this trend continuing and impacting diesel demand.
Two links below on Boston buying NG buses and engines from Cummins.
https://www.ngvglobal.com/blog/cng-buses-headed-mbta-boston-0805
https://www.cummins.com/engines/transit-bus
Santiago is showing a lot of initiative in expanding it’s EV-bus fleet. I’ll be interested to see them crunch the numbers after a few years of use.
https://insideevs.com/news/431577/byd-delivered-150-more-electric-buses-chile/
Ovi,
By fleet, I think OFM means a company that provides vehicles to employees, such as a government agency or a large corporation, I agree for rental cars, demand for EVs will likely only come from owners of EVs and perhaps a few environmentally aware people who do not own a vehicle. Taxi fleets might also switch to EV.
Battery Replacement worries are evaporating. EVs are four times as efficient so fuel costs are much lower, and, even better for the bean counters, mostly fixed unlike oil. Maintenance costs are much lower. Company vehicles including taxis will make attractive EV candidates. Driving an EV with 1.24 million mile battery life 200 miles for 200 business days a year, the vehicle will still last over 30 years. Kind of a no brainer…
https://www.motorauthority.com/news/1128492_china-s-catl-ready-with-battery-that-lasts-more-than-a-million-miles
Don’t forget the one thing that everybody loves; “jobs, jobs, jobs!”
“Members of the International Association of Sheet Metal, Air, Rail and Transportation Workers – SMART Union, Local 105 – constructed the K7M for Frederick TransIT to include 22 seats, and a range of up to 150 miles. The bus has a charging time of 2.5 to 3 hours.”
https://ngtnews.com/byd-delivers-three-k7m-battery-electric-buses-to-transit
Jobs ,jobs and jobs you said .
Explain to me how this will offset the total jobs lost in the tourism and travel industry . Total T and T industry employs 380 million worldwide with a turnover of $ 17 trillion . 1 in 6 is in T Tn in Thailand ,1 in 8 in Greece,Turkey,Morroco . 21 % of GDP in Italy ,18 % of GDP in France and Spain . I can add many other industries e.g retail ,automotive etc all dead . These boondoggles like EV ,self driving,tiktok,uber,etc are not going to save us . The decline of IC is here ,it will be a roller coaster but the decline will be steep and will end in a splash . Get yourself some lifesaving equipment . Here is something coming shortly to a theater near you .
https://oilprice.com/Energy/Energy-General/The-Death-Of-The-2-Trillion-Auto-Industry-Will-Come-Sooner-Than-Expected.html
Explaining it to yourself seems to be your forte; like a soliloquy of the solipsist.
In Europe because of the CO2 targets with its suporting taxing, on the fleet side, everything is going towards electric or more common going for plug-in hybrid (PEHV)
In Germany you get some nice bonuses as buyer/leaser (today up to more than 10000$) and the very popular leasing over your company with some taxfree waiver of wage ist now much cheaper with electric or PHEV (half the tax of conventional cars)
– Mercedes, Audi or BMW are selling over 60% to “enterprise” customers because of this rules, and you basically cannot sell any car in this area without some kind of plug in hybridication anymore, with the medium term targets clearly for a bigger all electric mix – and so are the road maps of the car makers.
Libya.
Can’t tell the players without a scorecard. Oil assays say Libya’s oil is rich in diesel. The two sides are LNA vs GNA.
The GNA is backed by an odd description of the UN and Turkey. What a delightful description.
The LNA is run by a guy named Haftar and is backed by the UAE, Russia, Egypt and Haftar is a US dual citizen. How cool is that?
The LNA seems to have control over most of the oil. Haftar has been under attack by US and Russia narratives as they pretend to be angry that Haftar is obstructing export.
The fight between the two sides seems to ebb and flow with media writing for deadline describing it as a all out war. This layout looks weak to me. There are quotes of casualty counts of only about 1,000 and that’s over a period of a year.
In general, Haftar is thought to be somewhat secular in contrast to a more Muslim Brotherhood aligned GNA. Hilarious bit of journalism described Haftar as an aspiring strongman. The horror.
OPEC continues oil export cuts in June
The world’s major oil producers, including Gulf nations, continued export cuts last month.
In June, the Organization of the Petroleum Exporting Countries (OPEC) cut oil exports by 1.84 million barrels per day compared with May, Reuters reported today. This follows the record 9.7 million barrels per day supply cuts in May. OPEC’s exports averaged 17.2 million barrels per day in June. Production was also down by 1.92 million barrels per day during the month, according to the outlet.
The cuts show that OPEC is continuing to tame its output amid the oil and COVID-19 crises. A huge drop in demand for oil because of the coronavirus pandemic led to a price war this year between Russia and Saudi Arabia and historic drops in oil prices. In April, Russia, which is not part of OPEC, reached a deal with the organization to cut production, leading to prices bouncing back significantly in May. The two are still working to maintain supply cuts.
Prices are still up relative to earlier in the year with the continued cuts. The price of Brent crude, a global benchmark for oil prices, was around $43 a barrel today. In April, the price hit a 21-year low at under $16 a barrel at the height of the pandemic and price war.
Saudi Arabia is the largest oil producer in OPEC, followed by Iraq and Iran. Gulf countries, Iraq and Iran all depend on oil for state revenues.
The economic situation is bleak in many OPEC countries as they struggle with the coronavirus. Gulf countries’ economies are expected to contract by 7.6% in 2020, an International Monetary Fund official said this week. Iran continues to be ravaged by the virus and faces tough US sanctions. And Iraqi businesses have experienced significant job and revenue losses during the strict lockdowns in the country.
https://theshiftproject.org/wp-content/uploads/2020/06/Study_Risk-supply-Europe_TSP-with-Rystad-Data.pdf
The English version of the report by the French organization:
theshiftproject.org
Seppo
Thank you for the link. Much appreciated.
An excellent read, thanks.
In one section they suggest a peak in all liquids between 2020 and 2035 for pessimistic and optimistic scenarios, with reality likely falling between these.
Let’s say it falls exactly between these two years, that would be Dec 2027 or Jan 2028. Hmm, where have I heard that? 🙂 Seems a pretty good estimate though.
Question . How long can the big players at OPEC continue to sell oil at $ 45 p/b before landing into trouble . For me the lifting cost is not important what is important is the total cost .KSA has a lifting cost of say $ 20 per barrel but it^s total cost is + $ 85 per barrel as 95% of the revenue is oil and this has to be distributed to the public in KSA or they will behead MBS . This is reality . Come to think all those marginal players like Gabon ,Ecuador , Colombia ,Angola etc are unimportant to the big picture . Of the top 5 Opec producers/exporters, Iran is under sanctions and Iraq is in turmoil ,that leaves KSA ,Kuwait and UAE . For all these countries total cost is the concern and not lifting cost . Example the UAE is composed of 5 emirates but only AbuDhabi has oil . On the other hand we have Dubai where the real estate bubble just burst and Abu Dhabi has to bail out Dubai . Next is Oman , it is a member of the GFC and is now in a financial pickle and must also be bailed out . Why are these bailouts important ? Simple, all these currencies are pegged to the USD ,if the peg breaks it will have a cascading effect worldwide ,understand that the HK dollar peg is already under stress with the new Chinese law .Events could spin out out of control and there could be a major currency crisis leading to a domino effect . Any thoughts ?
In order for the dollar to weaken on an international level. Remember there are two different US dollar markets. One is inside the USA the other is outside. The Euro and the Yen have to strengthen for the dollar to weaken on an international level. There is no way around that fact. What is the debt situation in Europe and Japan? Every country is backed into a corner now because of the debt. They all need a cheaper local currency to service debt but also need a cheaper US dollar and they can’t
have it both ways.
My guess is ultimately the dollar goes much much higher on an international level. i’m mean really will Europe even have a common currency 10 years from now? Everybody expecting the US dollar to fall because the FED. Are in my opinion wrong. Maybe in the USA it’s value can fall. But not outside of it. If the Eurodollar gets unwound due to excessive dollar strength. I expect the Euro and the Pound to go to 0.50 on the dollar. The Australian and New Zealand dollar to go to less than 0.20 to the dollar.
If the dollar system ever ends as we know it the rest of the world gets crushed first. Where oil would fit in would be about $10 because nobody would be able to pay anymore than that.
A strong dollar would absolutely wreck the oil producers. Because $10 just don’t cut it. The FED expanded it’s balance sheet by over $3 trillion. And all we got on the dollar index is about 600 basis points of a pull back.
A weak US dollar will wreck Europe and Japan. And if nobody is allowed to devalue then you can’t inflate the debt away. That would lead to global cascading debt defaults. Debt deflation on a scale never seen before.
Do negative interest rates make the debt disappear? They don’t. They allow debt to grow even larger.
Oil ever making it back to $100 depends on how well things hold together.
“Do negative interest rates make the debt disappear? They don’t. They allow debt to grow even larger.”
Not if the central banks simultaneously cut back their financial injections. So the balance sheets do not inflate further.
Then money would inevitably flow out of the current owners.
The cost of living would drop.
Why else have the central banks followed the course of lower interest rates in recent years?
Only positive interest rates are so fixed in people’s minds that negative interest rates seem completely absurd. But they are not.
https://www.nytimes.com/2009/04/19/business/economy/19view.html?_r=1
HHH, I understand what you are getting at . I understand the concept of the dollar and the Euro dollar . I also understand the dollar shortage problem in the world . My questions are
1. The Eurodollar is the defacto petro dollar (in my opinion ,could be wrong ),what if the pegs start breaking in the petro exporters because they cannot meet their dollar requirement by incoming dollar income because of low prices ,like Oman is having the problem .
2. In my opinion the USD in US domestic is not disconnected from the Euro dollar ,superficially yes, but at the hip not . This would allow the FED to print dollars to infinity . Are you implying that the FED will print to infinity without effecting the Euro dollar market ?
3. If the FED prints to infinity ,will the rest of the world be a silent watcher as their domestic economies are crushed to service their dollar based debts ?
I have expressed in my post that the ability to service the dollar based debt by majority of the petro exporters who are all pegged to the USD will lead to defaults and accelerate the demise of the USD as a reserve currency . I also must mention that other forces that are anti USD hegemony are also working in the same direction . So would it be a choice between (a) let my economy crash (b) if I crash I take the whole world down with me . I very well understand the ramifications of the USD loosing its reserve currency status without a substitute , but we are not living in normal times , the world is ^upside down ^ . Oh by the way oil at $ 100 is a pipe dream ,because the issue is not supply/demand but affordability.
The OPEC economies are not very big on the World scale so the impact may not be great worldwide. OPEC output might decrease, but that might cause oil prices to rise and would help alleviate the problem.
There are a number of negative feedbacks that tend to correct economic problems. The same is often true in currency markets.
International economics has a lot of moving parts besides simply the actions of central banks, one has to look at how trade flows and international capital flows are affected by changes in exchange rates.
Oyez ! Oyez ! Oyez ! All persons having business in oil are admonished to see this video from the shif project french association. Interessed in cuting our oil consumption to both prevent climatic hasards and prevent economic hasards due to weanings linked to the depletion of oil fields, they decided to break their piggy bank to buy the whole set of oil data of Rystad Energy concerning their oil reserves compilation. And then, they did a webinard to present these data and as they are, like me, French, they spoke mainly of the grim energetic future of Europe. A specialist of IEA, in the webinard, confirmed the fact that their own analysis, based on Rystad’s database and others, were pointing in the same direction. As a matter of facts, the geology forecasts, without further commissionings of oil fields, a cut in oil production of 30 mbl/d in 2030. And IEA thinks that the drop in investments in exploration and new oil fields commissioning due to the covid crisis accelerated the process. https://www.youtube.com/watch?v=FlJ14aOfS3s
With the world on the path to anarchy and economic collapse, Oil use is the least of the world’s problems. Oil consumption is going to drop even more as the economic fallout catches up to consumption. In the US, there is now a second round of layoffs as states order lots of retail business closed again. Lots of small business are only able to remain open as business owners tap personal savings and loans to stay afloat but this isn’t going to last much longer. Looting and vandalism is going to result it a lot of permanent store closures. That’s going to translate in a lot of long term jobs losses. The US is certainly going to face a lot more looting, rioting & arson this year, as the economic problems become more evident.
“U.S. mortgage delinquency rate rises to 7.76% in May”
https://www.housingwire.com/articles/u-s-mortgage-delinquency-rate-rises-to-7-76-in-may/
“Delinquency rate triples in US commercial mortgage market 7.4% in May”
https://www.ft.com/content/b8eac068-e7c9-42ea-b9bf-6e2b4666f5c3
Tech guy,
Not surprising, a comparison to 2008 and 2009 delinquency rates is the proper comparison to make.
https://alfred.stlouisfed.org/series?seid=DRALACBS
For first quarter of 2010 the delinquency rate for all loans at commercial banks in the US was 7.4% and the delinquency rate remained above 4.4% from 2008Q4 to 2013Q1 or 14 consecutive quarters.
Except that was 2 years after the great recession. This happened just a couple of months after the lockdown began. I am sure it will top 10% later this year. No way can any business pay its debts when its shutdown, or has a fraction of revenue it normally receives.
The only way this economic is holding where it is, is from a awful lot of money printing from the Federal reserve.
https://fred.stlouisfed.org/series/WALCL
While there is a slight dip, I am sure this graph has only one direction to go: UP!
Perhaps the delinquency rate for all loans will go to 10%, my crystal ball is in for repairs, so 10% by 2020 Q4, we will know in 9 months if your guess is correct.
Chart from fred link above.
Alaska will be interesting to watch now that BP have just handed over all the production assets to the new operator. This draws to a conclusion 60 years of BP operations in the state.
There is a CDC page called Excess Deaths. May have mentioned it before. It tracks deaths from all causes month by month and compares it to the average of that same month over a previous five years.
We need this because it’s an election year and there are agendas in play. Some of the agendas are not political. They can be financial.
Number of cases derives from number of tests. The number of tests has not been constant and so the number of cases doesn’t say very informative things. You can’t have a virus death without a virus case, but deaths are so rare among the cases, it just is not informative.
Elective surgeries have disappeared as patients have become nervous about getting infected at a hospital. The stimulus package provides money to hospitals that are treating covid cases. So it’s inevitable that the number of hospitalizations for covid-19 increase. It is not informative.
Deaths are informative. They are in decline, but mostly that’s because New York and the northeast overall had such a devastating peak. The covid-19 curve matches pretty closely with excess deaths. So while it’s likely true that there are deaths attributed incorrectly to covid, there aren’t many. Excess deaths are definitive.
So the curve is in decline. There is variance on it because counties have state holidays. Smoothing that variance out a bit indicates that the curve’s decline looks like a negative exponential. The right side tail is now clearly not going to be at 0. It is shaping up to indicate a long-term daily death total of over 600.
With no treatment, and with ongoing mitigation measures in place, we can expect 600 deaths per day from this virus. That is 600 above the long-term average. It is an increase of about 100 from how the tail appeared a few weeks ago. California has had some recent big death numbers and has dragged the tail upwards.
This is 219000 deaths per year. Essentially all of them are over age 65. Pre virus, about 2 million people per year over age 65 in the US died from all causes.
With current mitigation measures in place, and with no treatment or vaccine, the over age 65 population of the US will see 11% more deaths per year than normal. This is pretty big.
US Frac Spread count at 74 on July 2, about 5 times lower than one year ago and down 4 from 6 days earlier.
Roughly 900 tight oil completions per month one year ago, so if oil focused frac spreads have also decreased by a factor of 5 this implies roughly 180 tight oil completions per month, assuming no change in completion rate per frac spread.
See minute 12:00 to minute 13 of video below.
https://www.youtube.com/watch?time_continue=1236&v=ZhJc5MrOTKQ&feature=emb_title
Dennis
At a guess I would expect travel time between jobs to be greater with so few spreads operating.
Lights out,
Perhaps. I imagine there will be certain sweet spots in the Permian, Eagle Ford, and Bakken where wells will be completed, other areas may wait for higher oil prices. I also expect the proportion of Frac spreads operating in Permian to rise relative to other areas, possible Eagle Ford as well as these areas have a lower transport cost to refineries and/or export markets.
I need to update my tight oil models to reflect about 200 tight oil completions per month (note my earlier comment stating 900 completions a year ago was wrong it was roughly 1000 completions per month in June 2019) from May to Dec 2020, followed by a gradual increase. My current model has completions falling to zero from May 2020 to Dec 2020, that would require a frac spread count of zero (for oil focused frac spreads) which is highly unlikely.
Dominion cancels Atlantic Coast Pipeline, sells natural gas transmission business
https://www.richmond.com/news/virginia/dominion-cancels-atlantic-coast-pipeline-sells-natural-gas-transmission-business/article_340549bd-cd01-57f1-9167-86b6ee406f02.html
Rats abandoning ship?
Buffett midstream. Hard to lose money delivering gas in the US.
“For Berkshire, the deal means that Warren Buffet’s company will soon account for 18 percent of all natural gas moved across state lines, up from 8 percent currently.”
https://oilprice.com/Energy/Energy-General/Two-Major-US-Pipeline-Projects-Face-Cancelation.html
The VA-WV Mountain valley pipeline is still under construction.
I believe the cancellation is because Dominion is going back to coal fired power plants instead of switching to Ngas. Funny, I see lots of articles about how Dominion is abandoning fossil fuels with the pipeline cancellation, but they didn’t read that Dominion is just going back to coal.
https://www.forbes.com/sites/edhirs/2020/07/06/coal-wins-atlantic-coast-pipeline-canceled/#665b9b2d487f
Its possible that someone else will pick up the pipeline at some point.
A very messy project, with social opposition.
We shall see.
“A very messy project, with social opposition.” Funny, that description fits practically every energy pipeline project in North America. New projects are held up with endless regulatory requirements and court challenges. Even some existing pipelines have their operations threatened (Enbridge Line 5, Dakota Access). It doesn’t seem to matter to protesters or courts that these pipelines are needed by the market, and there may be no alternative to fill the void if they are shut down. Maybe soon consumers will feel some real pain as a result of these obstructions. Then we might see how fast these judges that force these obstructions will change their tune.
As expressed:
We shall see
Who owns the other 50% of TAPS?
https://seekingalpha.com/news/3587585-alaskan-officials-ok-bps-sale-of-oil-leases-to-hilcorp
As of 2019, ConocoPhillips owned 29%, ExxonMobil owned 21%, Unocal Pipeline owned 1% and BP owned 49% (all percentages rounded).
Will be interesting to see how Hilcorp does with these assets. Deep pockets will be needed in the current oil price environment.
Federal judge orders Dakota Access Pipeline shut down
Looks like both Canada and the US are having problems with pipelines and getting them approved. This line will be shut for 13 months. The pipeline has been carrying as much as 570,000 barrels of oil out of the Bakken each day.
============================
“A federal judge has ordered the shutdown of the Dakota Access Pipeline while a lengthy environmental review is conducted of the project opposed by environmentalists and the Standing Rock Sioux Tribe.
The move was requested earlier this year by Standing Rock and three other Sioux tribes in the Dakotas who fear environmental harm from the oil pipeline and sued over the project four years ago. North Dakota officials have said such a move would have “significant disruptive consequences” for the state, whose oil patch has been hit hard in recent months by falling demand for crude amid the coronavirus pandemic.
Standing Rock Chairman Mike Faith said the tribe is trying to prevent a potential environmental disaster should the line leak.”
https://bismarcktribune.com/bakken/federal-judge-orders-dakota-access-pipeline-shut-down/article_2cc387a3-f003-5557-b356-4063123a62ad.html
More news on the pipeline shutdown. The shutdown will likely be permanent. Bold mine.
Why The Bakken May Not Come Back
The Bakken shale is already declining because of financial struggles and the oil market downturn, but the potential shuttering of the Dakota Access pipeline could close off the possibility of a rebound.
The 570,000-barrel-per-day oil pipeline carries Bakken oil to the Midwest. On Monday, a federal judge ordered the pipeline to shut down within 30 days after vacating authorization for the project. Energy Transfer immediately appealed for a “provisional stay,” but on Tuesday, U.S. District Court Judge James Boasberg shot down that request.
Energy Transfer will still file a conventional appeal to stay the judge’s order, and surely the company will follow through on that as quick as possible. But it’s not clear how quickly the judge will respond to that; meanwhile he ordered Dakota Access to be drained by August 5.
Even if a stay is granted, the pause could be “short-lived,” ClearView Energy Partners wrote in a note to clients. The firm cited a separate case involving an electric transmission line that resulted in the Army Corps of Engineers being forced to undertake an environmental impact statement after the project was completed.
“Put another way, even conservative jurists can back a court ruling that finds agency environmental reviews flawed and should be suspended while redone,” ClearView Energy Partners wrote. “[T]he horizon for Dakota Access may be darkening,” the firm added.
Assuming that Dakota Access goes offline and undergoes an environmental assessment, which could take the better part of a year, the process will drag on into a potential Joe Biden administration. At that point, the Army Corps, under a new direction, may change its stance, killing off the pipeline.
Time will tell, but in the interim, the temporary closure is an enormous victory for the Standing Rock Sioux Tribe. “This pipeline should have never been built here. We told them that from the beginning,” the Tribe’s Chairperson Mike Faith said.
If Dakota Access is forced to shut down for good, it could head off any hopes on the part of the oil industry to revive production in the Bakken. Without the pipeline, a large portion of Bakken production would need to return to the practice of moving large volumes by rail.
Snip
The Bakken was already slowing down before the pandemic. Years of red ink from shale drillers soured investors on the whole fracking enterprise, but that is particularly true in the Bakken. For example, Continental Resources, which has a prominent presence in the Bakken, saw its stock price fall in half between late 2018 and late 2019.
Bakken production hit a peak in October and November of last year at just over 1.5 million barrels per day (mb/d), before declining to 1.43 mb/d in February, just before the global pandemic rocked the market.
Because the North Dakota region has much less storage capacity than Texas and Oklahoma, Bakken drillers were immediately squeezed when the market went into a tailspin, forcing them to shut in thousands of wells. The EIA expects production from the Bakken to dip below 1 mb/d in July.
A source at one unnamed Bakken oil producer said that the region’s total production will need to decline to 950,000 bpd in August if Dakota Access shuts down. At the start of this week, Continental’s share price is off by more than 15 percent, a reflection of the negative impact of the DAPL shutdown.
“We are not shutting in the line,” Energy Transfer spokeswoman Vicki Granado said in an email. Judge James E. Boasberg “exceeded his authority and does not have the jurisdiction to shut down the pipeline or stop the flow of crude oil.”
https://www.bloomberg.com/news/articles/2020-07-08/energy-transfer-says-it-won-t-shut-dakota-access-despite-ruling
From your link:
“Energy Transfer is playing a very dangerous game,” said Earthjustice lawyer Jan Hasselman, who represents the Standing Rock Sioux Tribe against Dakota Access. “They don’t get to ignore a federal court order just because they disagree with it.”
This is hilarious. They disagree with the judge’s decision so they will just ignore it. Only Donald Trump could get away with such a stupid stunt as that.
I’m afraid we’re going to see more of this type of crap. Trump has massively increased people’s distrust of and disrespect for all parts of the Government. It’s only going to get worse. Lots worse.
I read here a lot and very very rarely comment, but I just had to post that.
From the article, “The company later said in a statement it had no intention in defying the Judge’s order.”
Also, I went to the company’s website. The most recent press release, dated today, makes clear the company will not defy a court order.
Big difference between extremely confident in winning a quick reversal on appeal and intentionally violating a court order.
I’m not making any comment on the ruling, nor advocating any position in the case, just noting what the company put out in a statement after the spokesperson’s statement.
Say “Dakota Access shall shut down the pipeline and empty it of oil by August 5, 2020.”
ET -12%
BRK.B +2%
TSLA blasted to even a higher orbit. +14%
https://seekingalpha.com/symbol/ET?s=et
https://seekingalpha.com/symbol/TSLA?s=tsla
I think i said in a post or two back that US dollars are flowing to any country that is supporting asset prices in their home country via QE or whatever. China is trying ramp it’s stock market to get US dollars to flow their way currently. Having to have dollars to do business on international level is everything. Having to have US dollar to buy oil in everything.
If China ever opens their capital account and the only reason they’d do this is to try to get away from US dollar their currency peg would break and they would devalue 40-50% against the dollar. Only reason China can import all the oil they do is because they use US dollars. My guess is their imports of oil would drop by 2/3 if the try to leave the dollar system. But they really want to leave it. They just can’t.
This is something to watch if your watching the oil market. China doesn’t get a swap line from the FED when they need dollars. They have to find other ways to get US dollars. Like ramp stocks or even the Belt Road is just away to get dollars to flow towards them.
Without the huge trade deficit the US runs with China. China wouldn’t have the dollars it needs to do business. To import oil and everything else. Like iron ore or coal from Australia.
Shale oil production is set to drop due to rig count. This market is going to tighten up. Prices are going to rise.
Every country wants US dollars flowing to them. Because they have to have them to do business to buy oil. 70% of cross border transactions globally are done in US dollars. Only problem now is you got US dollars flowing to everybody and it’s pushing up the value making everybodies currency appreciate against the dollar. And if any country does anything to halt or stop this appreciation. Those dollars they need start flowing right back out.
Only question is how much currency appreciation can each
individual country handle? For some it isn’t very much.
Coming shortly to a theater near you .
https://oilprice.com/Energy/Energy-General/The-Death-Of-The-2-Trillion-Auto-Industry-Will-Come-Sooner-Than-Expected.html
That’s an advertisement promoting Facedrive. It also includes disclaimers at the bottom of that article. Oilprice.com repeats that so called article several times every week.
Satish , thanks for pointing this out . I missed this . I apologise to all for the error . Must be careful in vetting . Thanks once again .
Hole in head,
Eventually there will be self driving cars and TaaS will take over personal transport and the ICE vehicle industry will be toast.
It will take 20 to 30 years for the transition to electric transport to be complete.
Dennis,
You say it will take 20-30 years for the transition to electric transport to be complete. With all due respect, are we going to employ ENERGY TOOTH FAIRIES to produce all these EV’s??
When Global Oil production peaks, say goodbye to ramping up the so-called Renewable Energy Transition.
Steve
Steve,
See https://tonyseba.com/portfolio-item/clean-disruption-of-energy-transportation/
I think Seba is too optimistic, but natural gas and coal can be used as bridge fuels combined with better efficiency and a transition to electric transport. Self Driving robotaxis serving most personal transportation needs at 100 k per year per vehicle would require 10 times fewer vehicles. It would also be fairly simple for decent apps to increase the number of average riders per vehicle during peak transport times and also flex scheduling for work hours can spread the commute timing so fewer vehicles are needed at rush hour. Reduces time spent stuck in traffic and reduces energy use and time wasted. Though with robo taxis the time on commute can be used productively for office workers.
Steve.
Another scenario is that there will be plenty of energy to fuel the ‘ramping up the so-called Renewable Energy Transition’.
Try to stay with me for a minute here.
Consider that for the next 10-20 years many economies will be prioritizing industrial output to produce wind, solar, electric vehicles. And this will pickup steam at increasing rates.
The places that are wise and do this job seriously will be in much better shape than those who don’t.
You seem to be interested in money flows-
As an indication of where money for industry and energy is flowing, take a lo0k at look at the 3 month charts of –
run, nio, niu, tesla, fuv, solo, wkhs, nkla, plug, bldp, lit
This is just 2nd inning for these industries, and its a 20 year ball game.
Hope you have been riding this wave. Its just starting.
Will it replace all the energy lost by depletion.
I doubt it, but electric transport needs only about 1/3rd the energy/mile as that of the petrol/ICE mechanism
But once again, the places that ride the effort hard, are going to thankful for every dollar and minute invested in the attempt.
bias disclosure- I acknowledge that I am an investor in a handful of the companies listed above, and that I am an independent power producer (solar) with excess to the grid, and that I have vehicle that plugs in at home to ‘fuel’, and that I am forgetting what it is like to stand around at a gas station.
Of all the electric pickups coming out in the next 2-3 years, this is one I have my eyes on-
https://nikolamotor.com/badger
see that little specification- 0 to 60 in 2.9 seconds
Holy crap.
Are you buying the battery or the hydrogen powered one?
I’m not in the buying pool now. Likely in a few years.
You are correct- it looks like there will be choices-
“The battery-electric version of the Badger will offer a claimed 300 miles of range, while the fuel-cell/battery-electric hybrid will offer a claimed 600, the company said. What sets it apart from the rest of the upcoming electrified-truck pack is that, if an owner buys the battery-electric-only version, they can later upgrade and have the fuel-cell system added to their Badger.”
are we going to employ ENERGY TOOTH FAIRIES to produce all these EV’s?? When Global Oil production peaks, say goodbye to ramping up
Car manufacturing is primarily powered by electricity, not oil.
High oil prices would only accelerate the transition to EVs. Tractors were expensive in the 1930s, but they lowered food prices and increased pressure on farms still using horses, so investment in tractors only increased. Farmers either bought tractors or went bankrupt and the bank sold the land to the neighbors who had bought tractors.
Nick G,
The raw materials used to produce the parts are produced using a large input from fossil fuels, though this may gradually change over time to a lower fossil fuel input.
Hi Dennis,
This conversational thread started with the idea that global Peak Oil would prevent a transition to EVs, due to a shortage of energy for the manufacture of EVs. So, before we move the conversation to Fossil Fuels in general: would you agree that PO isn’t likely to significantly block a transition to EVs due to a shortage of oil inputs to produce them?
Nick G,
Yes I agree it may not block the transition, but the idea that cars are produced with just electricity is a bit far fetched.
Potentially in 30 years EVs might be produced with much lower fossil fuel input (considering entire life cycle of production here), but it will be 50 to 70 years before it falls to less than 10% of the input energy for total World GDP in my opinion (worldwide consumption of fossil fuel.)
There are analyses that are far more optimistic, (Tony Seba) but though my heart hopes he is correct, my mind thinks he is too optimistic. Perhaps I am incorrect, my wife often reminds me there are very good odds on that bet. 🙂
the idea that cars are produced with just electricity is a bit far fetched.
Well, what do you have in mind?
Think about factories: they’re closed buildings, so you’re not going to have a lot of burning going on. Forklifts are electric, assembly lines are electric, all tools (screwdrivers, etc) are electric. You may have a bit of process heat, which will be primarily electric – there may be some using NG, but there will be very little that’s diesel – that’s just way too expensive.
The primary material input to cars is steel. In the US most of the steel used in cars is processed by steel mills powered by electricity, not coal and certainly not oil.
Mining is in large part electrically powered. Underground mining equipment is almost entirely electric.
Sure, there’s some oil-powered freight transportation of parts and the finished product, but the cost of that oil is a very small percentage of the manufacturing costs of a car.
If the price of oil were to rise to $150 it would have very little impact on the cost of manufacturing a car.
Nick,
Is all of the steel used domestically produced?
I doubt it. Is all of the plastic in the vehicle recycled plastic, also unlikely.
In any case the comment that car manufacturing is powered by electricity is true at the factory level, and the oil input specifically is probably quite low except for distribution of parts worldwide.
I switched from oil to fossil fuels, my mistake, you said only oil and the specific oil input to the economy will fall as oil output declines, oil prices rise and the transition to electric transport accelerates (powered by natural gas, nuclear, wind, solar, hydro, geothermal, and coal). There are many sources of energy besides oil and there remains plenty of energy efficiency improvements that can be made in all aspects of society.
Well, I think we’re in general agreement.
One thought about plastic: a quick search suggests that the average light vehicle might have around 150 kilos of plastic. That’s very roughly about one barrel of oil. If the price of oil goes from $50 to $150 then the oil input for plastics would add very roughly $100 to the price of the average car. At around $34k that’s an increase of .3%. And that assumes no increased effort at lightweighting, substitution, recycling, etc.
Actually, plastic doesn’t have to come from oil. In China they’re using coal as a source for petrochemicals. And in the US these days most plastic probably comes from things like ethane – there’s some ethane in lease condensate, but am I right in thinking that NGL (aka plant condensate) isn’t included?
Automobiles require a number of raw materials for their production. This includes aluminum, glass and the iron ore to make steel, as well as petroleum products used to make plastics, rubber and special fibers. After raw materials are extracted from the earth, they are transformed into products that automakers or auto parts companies use in the assembly process. The automobile industry is one of the largest consumers of the world’s raw materials.
https://www.investopedia.com/ask/answers/062315/what-types-raw-materials-would-be-used-auto-manufacturer.asp
Cornucopians just can’t get over soon losing cars. Not keen on the bus I guess. Oh, the future will be such a fright.
https://www.fleetowner.com/running-green/article/21136185/frederick-county-transit-adds-more-byd-buses-to-its-fleet
Automobiles require a number of raw materials for their production…
Yeah, we agree.
Survivalist,
Buses use less energy if they travel at capacity, in urban areas they make sense and personal transport should be banned from urban centers to allow the bus to move with little traffic.
In rural areas, the bus would often run with few passengers and TaaS would probably be more energy efficient, in my opinion. When self driving transport is perfected, only the very wealthy will choose to own a vehicle, or tradespeople who need a truck for their occupation. I expect that is 20 years in the future (+/-5 years).
I find that hard to believe unless government imposes a lot of unpopular policies that benefit one party against others
Relevant to Berkshire and its purchase of a pipeline company. Berkshire, the poster child of portfolio diversity, has a single company occupying 43% of the entirety. AAPL. Between Berkshire and the Swiss National Bank it’s hard to see how Apple can fall. They don’t really need to sell any products.
Federal budget deficit for June was $862 billion. 1 month. That used to be a bad year.
People come at these issues from many different perspectives, and different vested interests or concerns.
For those of you here with vested interests or occupations in the fossil fuel industry, I don’t think this talk about transition to electricity in transportation is the end of the world.
Contrary to some others, I do think that fossil fuel demand will be high for a long time, and it will be a struggle to achieve the massive scale industrial build-out that will needed to accomplish the transition. It took a long time to build up all this international fossil fuel demand, and it will be a hell of a challenge to come up with enough alternatives to keep up with oil depletion, as I see it.
I don’t think most places in the world will be up to the challenge, if past performance is any guide.
As always, I acknowledge I could be wrong, but that’s my take on it.
Hickory ,well put .Agree 100% .
Hickory,
There is a fair amount of natural gas and coal that can be used as energy sources, and more wind, solar, hydro, geothermal, and nuclear power can be built when needed. The way I see it the oil industry might do ok if OPEC holds together, if not oil prices will be low and there may not be a lot of profit for producers of high cost oil. Even at $60/bo EVs and plug in hybrids may be the cheaper choice by 2025 and lower oil prices might be needed by 2035 just to keep oil demand high enough so another oil glut does not ensue.
Oil shock models in chart below all assume the same scenarios for extra heavy and tight oil output, the difference between the low, medium, and high scenarios is the extraction rate from producing reserves, with lower rates (5.46% in 2027) in the low scenario and higher rates (5.74%) in the high scenario. The medium scenario assumes an extraction rate of 5.6% in 2027 (the extraction rate was also 5.6% in 2017, with a maximum of 12.1% in 1973.) The scenarios assume the extraction rate never rises above the 2027 rate in the future and thus are quite conservative (the 2019 US extraction rate was 15.7%). If one assumed extraction rates continued to increase after 2027, the output levels would be higher than presented here.
By 2030 the worlds population will be just about 10% higher than today, and all 8.5 Billion will be energy consumers.
True, but energy is not consumed equally by every citizen of the world. And, a very big and, each citizen of the world will likely be consuming a whole lot less energy than each citizen consumes today.
Agree Ron, but the growth in population will be a factor keeping the pedal to the metal on energy demand.
Yes, but how do you confront your model with the forecasts of Rystad Energy as it was exposed in the Shift Project’s webinard video at 29’34” (see above)?
Mr. Fleury,
The models are different because the Rystad model looks at all liquids, my model focuses on C+C so the comparison is difficult.
My scenarios are more conservative than the Rystad scenarios. According the the shift project paper, they expect a peak between 2020 and 2035, the average of these would be 2027.5, though scenarios matching 2035 and 2018 peaks are easily created with lower or higher extraction rates.
For a detailed explanation of the Oil Shock Model see Pukite et al 2019 at link below
https://www.amazon.com/Mathematical-Geoenergy-Discovery-Depletion-Geophysical-dp-1119434297/dp/1119434297/ref=mt_other?_encoding=UTF8&me=&qid=1594419107
Some brief posts on the oil shock model at page below, start with the oldest post first.
https://peakoilbarrel.com/category/shock-model/page/2/
Scenario below uses a Natural Gas Shock model with a medium URR assumption and the assumption that past rates of NGL per Cubic meter of natural gas continue in the future. I also discount the average barrel of NGL to its barrel of oil equivalent level, it is unclear if Rystad does the same.
I believe the Rystad scenarios are too optimistic.
In any case the “high C+C case” and high C+C+NGL scenarios are compared below.
Note the chart above uses too high a conversion factor for NGL for energy content. In 2019 C C NGL annual output was only about 86.4 Mboe/d and NGL output was about 4.1 Mboe/d, biofuels output was about 1.8 Mboe/d.
The proper measure for energy output is a unit of energy such as the Joule, measuring energy output in terms of volume such as barrels or cubic meters is nonsense.
BP data for C+C+NGL consumption in exajoules, where 1 exajoule is 1E18 joules.
Enno Peters has a new post on shaleprofile.com which indicates that May, 2020 ND Bakken production will be in excess of 300K BOPD below April, 2020.
shallow sand,
Interesting, thanks. EIA has May Bakken output down about 200 kb/d, but they often revise their numbers especially for the most recent month reported (currently May 2020). So that would bring them down to 876 kb/d (if the April output estimate from the NDIC is not revised), a level not seen since October 2013.
If shale oil production drops by 4 mmb/d by mid 2021 due to rig count. Aren’t they all pretty much insolvent due to lack of flow? Not enough flow to service debt. Of course if a New Green Deal comes after the next election that flow will likely head to zero anyway. 95% of what is discussed on this blog is shale oil. If Trump doesn’t win i guess the discussion will have to be about non shale oil going forward. If peak oil all depends on shale and shale all depends on an election well you’ll know for certain that we are pass peak in November.
HHH.
Prior to shale, a bank would not lend more than 60% of PDP PV10.
Most shale companies owe more than 60% of their PDP PV10 at the current strip. Several owe over 100%.
I’d say if the DAPL stays shut down for over a year, Bakken weighted producers are SOL. WLL is already BK. OAS, QEP and SM look pretty weak. Even MRO will be in trouble, they are heavy in the Bakken. Maybe even HES.
We should probably hold onto our strippers through 11/2020. If the Dems sweep, by mid-2021 US may be down below 8 million BOPD once GOM and Federal shale drilling ceases. New Mexico Permian has a lot of Federal lands.
Also, seems Dems could make it hard to drill shale on non-Federal lands through some draconian EPA regs.
Oh bullshit SS. The US may very well be below 8 million barrels per day well before mid-2021 but it will not be because of the Democratic sweep we expect in November. And what on earth makes you think they will shut down the GOM. Obama did not shut down the GOM even when the worst oil spill ever happened. So what gives you the dumb idea that Biden will do it.
From the tone of your post, you seem to clearly support the Republicans and Trump. Anyway, the Republicans just make up bullshit that the Democrats will do if they get in. And that is exactly what you are doing. It is nothing but pure bullshit. And bullshit has been the main theme of the Trump administration, bullshit and nothing else.
Ron. I vote in Democratic primaries. I consider myself a moderate.
Accusing me of being in favor of Trump is so far off. I did post my feelings on Trump but edited them as I need to avoid posting that kind of stuff.
Note I posted ceasing drilling in the GOM, not production. That is something Biden has pledged to do, stop offshore drilling. He has also pledged to stop fracking on Federal lands, which means no more shale wells on Federal lands. A large number of shale wells in New Mexico Permian are on Federal lands. New Mexico Permian is a large driver of US shale, it appears to have the most economic shale wells.
I really don’t understand why some Democrats get so upset when I point out this part of the party platform. I am just pointing out what Biden has said he will do and what Democratic legislators say they are in favor of.
Ron, as you know my family owns stripper oil production and has for over 40 years. The last 6 years have not been fun. I blame unprofitable shale over production for that. I personally would like to see US shale reigned in. It has severely damaged the entire US oil industry.
My hope is that when the Democrats win, they notice the difference between US shale, deep water GOM and stripper wells like what we operate. I hope they don’t try to shut us down too.
I don’t think Biden wants to shut down existing US production. I don’t think moderate Democrats in the Senate and House want to shut down existing production. I am worried about the left wing of the Democratic Party. They don’t do nuance well.
I post here partly to show that not all US oil production is the same. It isn’t all owned by companies like ExxonMobil. Probably between 500K and one million wells are operated by small businesses. Many are self-employed. One of my best friends lives on 20 BOPD that he and his wife operate themselves.
Stripper production generally has a small footprint. It has been here for decades, in our case soon 115 years. In our small county alone it employs over 100 people full time.
Ron, I am tired of people on both the left and right attacking each other, as you just have me. Most of the USA is sick of this, I suspect.
I try very hard to post factually accurate information here and to keep the politics out.
Finally, as I have made very clear, I am an investor in our family’s oil operations, I do not manage them.
Not everyone who owns oil production is some far right wing person.
On another note, there seems to be lacking on the far left and far right a little thing called reading comprehension. As soon as such a person sees one thing they do not like, they go off. Half the time they didn’t even comprehend what the author wrote. Just like the above post on DAPL. ET did have a spokesperson make a cocky statement about not shutting down DAPL. The same article noted the company shortly thereafter put out a statement that it had no intention of defying the court’s order. Somehow you missed that, just like you missed that I posted DRILLING in the GOM and not STOPPING PRODUCTION.
Sorry SS, I will try to do a little better next time. However……
Also, seems Dems could make it hard to drill shale on non-Federal lands through some draconian EPA regs.
Draconian? Trump and the Republicans have trashed all environmental protection regulations, and they are in the process of trashing the environment. After all, protecting the right of industry to trash the environment is far more important than protecting the environment itself. Draconian indeed!
Ron, I wasn’t commenting on anything Trump has done.
The Obama EPA was going to make us buy or rent an $80,000 camera to check methane emissions from oil wells that have been producing from 30-110 years and produce so little gas that they cannot burn a flare.
There was going to be a stripper well exemption to the methane rules, but the far left nixed that.
Regulations can make industries unprofitable to the point of eliminating them. If there is no de minimis exemption for methane emissions, stripper oil wells are finished as most aren’t near a gas pipeline and produce so little gas as to be wholly uneconomic.
We own land and live where our wells are. We don’t want to pollute our land or the air we breathe.
Some seem to think the industry is currently unregulated. I’d say our experience is that is not true. All of our wells and facilities are inspected at least annually by state inspectors. We have been cited for leaving an empty five gallon bucket next to a well (debris around well) among other things. They go by the letter of the statutes and administrative regs.
The states do most of the regulation of oil and gas, not the federal government. Where the feds can make things tough is through onerous EPA regs.
SS, thanks for the reality on the ground . Amateurs like me do not understand the fine lines and nuisances that exist , but I have already indicated in my earlier post that you and Mike S are guys who have ^ an ear to the ground ^ . Greatly appreciated .
“or rent”
what would the rental cost be? Was the rental cost worth going to war with the concept of being an effective environmental steward or make it more advantageous to join forces with those who you admit are actively trashing the environment. I’m sorry but these issues are polarized. If you want to be reasonable you have to try to find that middle ground and work from a position of good faith. Crafting effective government regulations that achieve their goals without being unintentionally “onerous” is difficult. It is an iterative process. It requires active engagement. A knee jerk rejection of regulations is counterproductive. Everyone involved agrees that it is a pain in the ass. But you take a cut at it. Then you keep working on it. You modify it because there are always unintended consequences. The stupid way to do it is to put a regulation in place, get a backlash and then remove the regulation because of pressure. No, there was a reason for the regulation and there was likely a reason for the backlash. Both forces need to be addressed in further iterations of the regulation. It is a never ending process. That is what good government is about. We haven’t had that for a very long time.
what would the rental cost be?
That’s a key question. Some equipment rentals are very expensive, such that 10 months of rentals can pay the full cost of the equipment. On the other hand, careful utilization and amortization of the equipment can make it very cheap: if you use it for 10 years, for 3 shifts, then you could get about 10,000 shifts of use and the equipment cost for each shift would only be $8.
If a single well can be effectively tested with 8 continuous hours of monitoring, it would only cost $8.
Do we know the minimum monitoring time for each well?
Nick g. We operate around 300 wells, including injection wells. The monitoring will fall most heavily on those with wells that produce little oil, even if same would otherwise be economic.
There are a lot of unknowns as to how much the compliance cost would be. I do know the first step is to fill out massive amounts of paperwork for US EPA, identifying each well location, etc, even though the states already have all of this information and it is public.
Nick g.
I found quotes for rental of an FLIR g320 thermal imaging camera that is the kind needed.
$2,100 per day, $4,900 per week, $14,000 per month.
Another question I have. So we image all 1 million +/- stripper wells. Does the US EPA even have the manpower to review the data?
Yeah, 40 single day rentals would pay for the camera! Clearly, somebody has to buy cameras for use by a large number of operators and spread the cost around. Do the stripper operators have an association that could do it? They could charge their members $150 for a daytime rental (7am-3pm) and $50 for an evening/overnight rental, for the operators on a really thin cost margin. They get $200 per day, and recover their cost in just 6 months of rentals (or in a year, if the two-shift concept is too cumbersome).
I have a couple of FLIR cameras, but they’re much less expensive. The cost is puzzling: the GF320 resolution (320×240) seems pretty standard – the difference seems to be temperature sensitivity, which FLIR advertises will help speed up repairs. But…perhaps lower sensitivity (for $600!) would be sufficient to screen for leaks.
As far as processing the data, could the operators do it, with integrity spot checks by the EPA?
SW. Many stripper oil well operators are presently engaging in a study with the DOE and US EPA to determine how much methane is actually emitted from stripper oil wells in various locations in the United States lower 48. This is a voluntary action by the operators. I wish we had been selected to participate. That way we could learn how much our wells emit.
I have no problem with regulations provided they are grounded in legitimate study. As I understand it, the reason stripper wells were not exempted was because environmental groups located some abandoned gas wells in PA that they claimed were emitting high amounts of methane.
Based on these few wells, which should have been plugged or at least swedged, and for which there was no operator as they had been abandoned decades ago, the US EPA did away with the stripper well exemption. It was due to pressure from environmental groups, not because all or even a representative portion of stripper wells had been studied and been found to be a problem.
Most operators pay a considerable amount of fees every year to the various states. These fees are to be used to plug abandoned wells. However, some states have transferred these fees to the general fund and used them for purposes unrelated to oil and gas.
I suspect (just a guess) that most stripper methane emissions are from abandoned gas wells like those in PA. They need to be plugged.
Stripper well operators are not perfect. There are bad operators and there are issues that arise with good operators.
99 % of the motor vehicles I observe are still being operated by oil based products. There is also a laundry list of non-transportation petroleum based products. That would include many products that are being used by healthcare front-line workers in battling COVID.
I am just trying to provide info to those who have limited knowledge of the industry, in hopes of combatting some broad and erroneous generalizations that are made by those with extreme positions on both sides.
SW. The methane regs, as I read them, are very burdensome with little environmental benefit. I am glad they are now being studied more thoroughly by US EPA.
I try to be balanced and keep an open mind, something that is sorely lacking in the USA at this time, IMHO.
The methane regs, as I read them, are very burdensome with little environmental benefit.
How did you come to that conclusion? Did you include the green house gas impact of methane?
Nick g.
Poorly worded on my part.
I have read several studies about methane emissions from oil and gas wells. These were conducted and published by scientists, primarily professors at universities.
What they have found is that abandoned gas wells pose the most risk for methane emissions, and that among those, there are a few “super emitters”. This makes sense, as these abandoned gas wells are monitored by no one, and likely have poor cementing, holes in casing, and are also likely “standing open” at the surface. The worst are coal bed in SW PA.
Active gas wells are next, again with there being a few super emitters, where companies need to do a better job monitoring leaks.
Next follow active and inactive shale oil wells. These produce a lot of gas at high pressures, much of which is being flared.
Next are abandoned conventional oil wells. Again, these vary greatly, from almost zero emissions to a few super emitters.
Last are active conventional oil wells, the bulk of which are stripper oil wells.
I think as there has been quite a bit of study of this issue, it would seem best to more heavily regulate the “super emitters”. Instead, US EPA proposes to treat each well the same.
This, of course, burdens the stripper well operator the most. If emissions monitoring costs $3,000 per year per well, a well that produces 300 barrels per year has a $10 per barrel expense, while a 30,000 barrel per year well has a $.10 per barrel expense.
Do you think XOM and CVX are in favor of applying the rules equally to stripper wells because they are environmentalists, or is it because they have a tremendous competitive advantage?
Once again, the public has little knowledge of the stripper well industry or the people who are employed by it.
In our county, practically every operator is owned by people living in the county. I looked at a list of the top 20 operators. 17 live in the county, 3 live in the county immediately to the North. Zero are public companies. Each has a minimum of 20 years operating experience.
Oil is generally being produced in the same manner as it has been since the Field was discovered. What has changed is the use of electricity to operate pumping units and injection pumps, the use of technology to notify pumpers of problems 24/7, and finally, much more strict environmental regulation.
From my reading, I would note that initially salt water was disposed of in creeks. However, as early as 1911, federal and state authories began to regulate and prohibit such water disposal. This led to injection of salt water down wells. These “accidental floods” which increased production of surrounding wells led to secondary recovery, including regulation of same first passed almost 90 years ago.
The industry as a whole is portrayed by many as some evil empire that recently began polluting the earth.
Again, there isn’t a person reading this who isn’t dependent upon petroleum products. Not one.
Methane has a half life in the atmosphere of 9.1 years. Most comes from rotting vegetation.
“In the first two decades after its release, methane is 84 times more potent than carbon dioxide. We must address both types of emissions if we want to reduce the impact of climate change.
While methane doesn’t linger as long in the atmosphere as carbon dioxide, it is initially far more devastating to the climate because of how effectively it absorbs heat.”
And breaks down into Co2
CO2 lingers longer? CO2’s half life in the atmosphere is five years. Hint: it is very soluble.
You need to try and understand the concepts of dynamic equilibrium and aggregate versus individual behaviour. Hint: they aren’t difficult if you come at them with an open mind.
Archie, surely you must realize that all we have to do is google it.
The Half Life of CO2 in Earth’s Atmosphere – Part 1
Single time constant, 2.5% per annum, exponential decline model gives an excellent fit between emissions (LH scale, coloured bands) and actual atmosphere (RH scale, black line). This confirms Roger Andrew’s assertion from a couple of weeks ago that it was possible to model sequestration of CO2 from the atmosphere using a single decline constant. The Blue wedge at bottom is the pre-1965 emissions stack that is also declined at 2.5% per annum. The half life of ~27 years is equivalent to a residence time for CO2 of 39 years, slightly but not significantly different to Roger’s result.
A couple of weeks ago Roger Andrews had a post called The residence time of CO2 in the atmosphere is …. 33 years? that stimulated a lot of high quality debate and for me a lot of new information came to light. This is the first part of an X part series of posts aimed at summarising what we know, aiming to zero in on “the truth” about CO2 sequestration rates from the atmosphere.
Ron,
That model by Mr Andrews does not agree with what the climate scientists think.
See
https://geosci.uchicago.edu/~archer/reprints/archer.2005.fate_co2.pdf
This paper has 645 citations in the scientific literature based on Google Scholar.
See
https://scholar.google.com/scholar?hl=en&as_sdt=0%2C20&q=david+archer+2005&btnG=
Shallow, I come to this blog to read your rational and practical comments.
Thanks Greenbub!
I am trying to educate myself more on the methane issue as it is looming so large for stripper oil well operators.
There has to be a more cost efficient way for this to be monitored than what has been proposed.
SS-“I post here partly to show that not all US oil production is the same. It isn’t all owned by companies like ExxonMobil. Probably between 500K and one million wells are operated by small businesses. Many are self-employed. One of my best friends lives on 20 BOPD that he and his wife operate themselves. ”
I, and likely many others here, find this information very important to hear and understand. Most people don’t know about this at all. They go to the pump and think its all Exxon and Chevron. Thanks for helping us to see it.
HHH,
See shaleprofile projection down thread, if there is no change in completion rate we might see about 5 Mb/d for tight oil output at the end of 2021. A more reasonable scenario has the completion rate increasing by mid 2021, so that projection is likely too conservative. Bottom line is that 5 Mb/d rather than 4 Mb/d is likely the bottom for tight oil, the surviving tight oil producers might actually be profitable at that level of output.
Crude Oil Shortages Beginning To Bite In Key Markets
There are growing signs that the markets are undersupplied with Urals and Arab Light thanks to continuing deep production cuts as well as a rebound in demand by key customers such as China and Northern Asia.
http://www.aspo.be/wp-content/uploads/2020/07/IFP_74_88_2019.pdf
Is the oil industry able to support a world that consumes105 million barrels of oil per day in 2025?
Seppo,
Many make the mistake of treating all “barrels” of energy liquids as being equal. The fact is the energy content of ethanol, or ethane is far lower than a barrel of crude.
BP has data on the joules of energy consumed both for C+C+NGL and for biofuels. The data is in exajoules (EJ) or petajoules (PJ) (for biofuels). One billion Joules is a gigajoule (GJ).
1 EJ= 1 billion GJ
1 PJ= one million GJ
1 barrel of oil equivalent=6.119 GJ (from BP Stats)
Using these conversions and the data from BP Statistical Review of World Energy, we get the chart below for annual energy liquids consumption (petroleum plus biofuel).
Seppo,
Excellent paper from aspo, thanks.
Figure 9 from paper below (page 9 of pdf). I doubt we will see a productivity increase for the average tight oil well, in fact a decrease in average productivity is more likely. So for me the LDR-SP and HDR-SP scenarios seem most realistic (of those presented), so somewhere between these scenarios seems right. Note that at the end of 2019 US tight oil output was about 8 Mb/d, which is between the low drilling rate and high drilling rate scenarios (at stable productivity), though closer to the low drilling rate scenario.
Seppo,
I guess that 105 mbd will not be produced in 2025.
Very little oil and gas was discovered in 2020H1.
https://www.rigzone.com/news/1h_discoveries_at_lowest_point_in_21st_century-03-jul-2020-162620-article/#:~:text=The%20company%20estimates%20that%20CRV%20discoveries%20stood%20at,to%20the%20same%20period%20in%202019%2C%20Rystad%20revealed.
“Global discoveries of conventional resource volumes (CRV) dwindled in the first half (1H) of this year, according to Rystad Energy.
The company estimates that CRV discoveries stood at 4.9 billion barrels of oil equivalent (boe) in 1H 2020, which is the weakest performing first half of the 21st century, Rystad highlights. Resource volumes were said to be 42 percent lower and discovery numbers were down 31 percent compared to the same period in 2019, Rystad revealed.”
Of the 4.9 bboe, just over 2 bbo is liquids.
https://www.oilfieldtechnology.com/special-reports/02072020/rystad-energy-2h20-discoveries-lowest-this-century/
2 billion divided by 183 days (half year) is equivalent to 11 mbod which isn’t much.
Seppo,
The chart below is from your link and the downward trend in annual oil discoveries is crystal clear.
Also knowing that current C+C consumption is around 30 billion barrels per year…
Keep in mind there are reserves that have not been developed, and that reserves get reappraised yearly and typically the new estimates are higher than the old estimates on average.
For my shock model (for C C only) I use 3000 Gb for the URR (2800 Gb conventional and 200 Gb unconventional from extra heavy oil and tight oil), 1400 Gb is cumulative output through 2019, conventional proved developed producing reserves (excludes oil sands and tight oil proved developed producing reserves) at the end of 2019 were 477 Gb, with 2600 Gb of total conventional discoveries by the end of 2019, the model assumes reserve growth plus discovery from 2019 to 2300 will be 200 Gb, an average of about 700 million barrels of cumulative discovery (including reserve growth) each year worldwide.
So there are conventional resources left to develop (about 700 Gb of non producing resources) and about 200 Gb of new discoveries plus reserve growth for a total of 900 Gb, the peak is likely to be between 2025 and 2030 in my opinion, with a best guess of 2027-2028.
Mr Eriksen,
A chart from 1995 to 2012 looks pretty flat. The drop in oil prices after 2014 may explain the drop in discovery as exploration budgets decreased.
Higher oil prices might change discovery rate.
Dennis, nothing will change the discovery rate because there is no more ^economical^ oil to discover . The keyword is ^economical ^ .
hole in head,
At the current price of oil you may be correct, certainly none will be found without exploration. Higher oil prices (say $80/b or higher for Brent) might lead to more exploration which might lead to a higher rate of discoveries.
Oil prices might never rise and even if they do there is no guarantee that any will be found if exploratory drilling increases, that is why I used the word might, there is perhaps a 50/50 chance that either of us will be correct in this case. Where I think some oil will be found that is economic and you believe none will be found that is economic.
Much will depend on future prices which are unknown.
Latest on oil,gas and shale bankruptcies at Wolf Street .
https://wolfstreet.com/2020/07/10/the-great-american-shale-oil-gas-massacre-bankruptcies-defaulted-debts-worthless-shares-collapsed-prices-of-oil-and-natural-gas/
$40 oil is still leading to stacked rigs, count hits another low, only 23% of this time last year:
“The number of oil rigs decreased for the week by 4 rigs, according to Baker Hughes data, bringing the total to 181—compared to 784 active rigs this time last year.”
https://oilprice.com/Energy/Energy-General/US-Rig-Count-Falls-For-18th-Week-In-A-Row.html
Frac spread count 64 down 10 from last week.
See
https://www.youtube.com/watch?v=jR4w7HqgM3U
In February there may have been about 950 tight oil completions in the US with a frack spread count of about 320, recently the four week average frack spread count was roughly 70 or about 4.6 times lower than February, that would suggest about 205 well completions next month (assuming a one month lag).
US tight oil projection below from shaleprofile.com assumes 270 well completions per month.
Alternative tight oil scenario where well completions gradually return to 800 in 2025 from 200 in Jan 2021.
Using https://shaleprofile.com/us-tight-oil-gas-projection/
Another alternative tight oil scenario, the only change from above is an assumption of a decrease in average well productivity of 1% per month starting in Jan 2025. This is based on the observation that the sweet spots are becoming fully drilled already in 2020 and by 2025 at the latest less productive areas will be where tight oil wells are completed.
BP dividend yield 10.8%.
Running a loss so earnings doesn’t cover that.
Of course, they’re in Europe where it’s relatively easy to borrow at negative rates. This means borrowing to pay the dividend is a profit center. Why cut the dividend?
Watcher,
Are real interest rates negative?
That is the rate that matters.
Of course not.
Deflation is good for consumers and is unrelated to economic growth. Whereas negative interest rates, real or otherwise, distorts the market. It can never happen in a free market.
With a negative interest rate, you don’t need to produce anything – simply borrow & pocket the negative interests as Watcher says. It’s very simple indeed to understand this but these are strange times. Too much of Keynesian nonsense.
https://tradingeconomics.com/country-list/interest-rate?continent=europe
Not many places with negative nominal interest rates. The inflation rate in Europe was about 1.4 percent in 2019.
So a negative real interest rate would be a nominal rate less than -1.4%.
Dood, they are paying a dividend with no earnings. That is all that matters to the shareholder. You think he doesn’t want that money borrowed at negative rates? Ask Germany.
You might want to relearn math. If a borrower has an interest rate of 2% and inflation is 2%, his repayments are cheapened at the same rate as he owes interest. Net 0.
If the borrower borrows at -2% rate with inflation of 2%, he repays with money cheapening at 2% / year and his principal shrinking an additional 2%/year faster than repayment.
Yes,
I agree negative interest rates are a good deal for the borrower. Not sure why a lender would lend. Certainly would tend to lead to a poor allocation of capital as we see in the tight oil industry where they burn as much cash as they do natural gas. 🙂
Okay. We can make a case for it being more complicated because people can’t accept it.
The borrower repays the loan with cheapened dollars. The principal portion of repayment always exceeds the interest portion (for non interest-only loans) and that portion is cheapened by inflation.
The interest paid (not collected) by the lender is also cheapened. This is ominous. As for why would a lender lend . . . BP has reserves of the only stuff that matters.
Every central bank in the world has been desperate for inflation. That cheapens the debt accumulated. But . . . if rates go negative the borrowers (governments) start collecting interest. It becomes a profit center. Running deficits into T’s generates more income to the government, and the government won’t want that income to cheapen. Deflation will become desired rather than inflation. This will grow the value of the debt.
There is no fix for any of this. Oil territory has to be conquered wherever it can be.
Watcher
Negative rates are bad news for banks. They lend money and then have to pay the lender??? Upside down world. Without a strong bank system we are in trouble. I guess that is why the Feds created the stress tests.
Exactly.
No sane person would lend at negative interest rates. Only a central bank would!
You have to ask the lenders who have been purchasing German bonds for about four or five years now at negative rates. Ask them why they are lending the money and paying Germany for the right to lend it.
The answer is usually a sense of safety. Holding a German Bond maybe I’ll say for us at then any sort of eurobond and certainly safer than a US Treasury . If you understand oil and its all important configuration in civilisation, you might be willing to lend money to BP and pay them for the right to do that. You’ll be lending them money so they can pay dividends at 10.8%. Credit worthiness may soon be measured in joules, not dollars.
I don’t get you Watcher. You started off by alluding to insanity of negative interest rates and now you are defending it?
If German Bonds yield negative, why not just hold the physical currency – Euros?
You can’t hold physical currency.
Say you are a corporate which has a cash position of $30mm. Are you going to get $100 notes and stack it up in a locker? That way you will only pay locker fees. Or you can dig a hole in the ground/construct a safe and hire a security company/mercs. Either way, you will be paying money – locker fees/security guard fees etc.
Why not hold the cash at the bank, you say? Simple. That’s because the banks will charge you holding a cash balance for balances > EU500k.
So, there you go. You get negative interest rates because the lender doesn’t have an option. If he wants little/no risk, wherever he goes, he is paying money to hold money. in other words – negative interest rates.
But this limits the amount of negative interest possible.
It’s not possible at -1%, but at -6% the guards will come cheaper. That’s why central banks world wide want to get rid of physical money. The moment only electronic money is here, it’s time for really low interrest.
Some central bankers already said it would be best to be at -5%.
Banks charging a small fee for holding your deposits is different from banks lending at a negative rate.
And note that if you can’t hold on to your money safely, you can’t expect that same money to be held safely by your borrower either. That risk & cost associated with it doesn’t go away irrespective of who holds it.
Watcher, ^Credit worthiness may soon be measured in joules, not dollars.^ Interesting thought .
When we set up a internet exchange we have at a minimum 3 independent upstream links with the highest cost path being a LTE Cell modem. Almost all cell towers are Grid powered with gov mandated 100% Liquid Fuels backup. Any “HA” High Availability network service (Five 9’s or better) requires 3 independent automatically routeable paths and continuous grid free operation. The electrical grid has a single path since each path must be synchronous. The Grid is fragile and will be the 1st causality in chaos or conflict. The credit worthiness of any service that requires the grid to function must depreciated since all is put at risk by design by poor design or laziness. Stick and wires required = zero credit worthiness.
Chart below has trailing 4 week average for Total US oil and natural gas rigs (Baker Hughes data) and frac spread data from primary vision.
Dennis.
Shaleprofile has 5/20 North Dakota post up on its blog.
Thanks ss,
Link below
https://shaleprofile.com/blog/bakken-monthly-update/north-dakota-update-through-may-2020/
Btw Total divvy 8+% and can’t cover it with earnings, either, though almost. BP isn’t the only borrower.
We’ve known for years that Exxon is doing this kind of thing. Now 8% with earnings covering only 2/3 of that. It just didn’t get extreme until now. BP 11%, no earnings. ENI 9% with earnings to cover payout.
TOT and ENI traditional Libya players. Won’t be shut in forever.
But for now there ain’t a CEO anywhere who won’t borrow that money to avoid the headline of a divvy cut. If the Euro oils could manage to borrow at negative rates, profit.