By Ovi
All of the Crude plus Condensate (C + C) production data for the US state charts comes from the EIAʼs Petroleum Supply monthly PSM which provides updated production information up to November 2025.
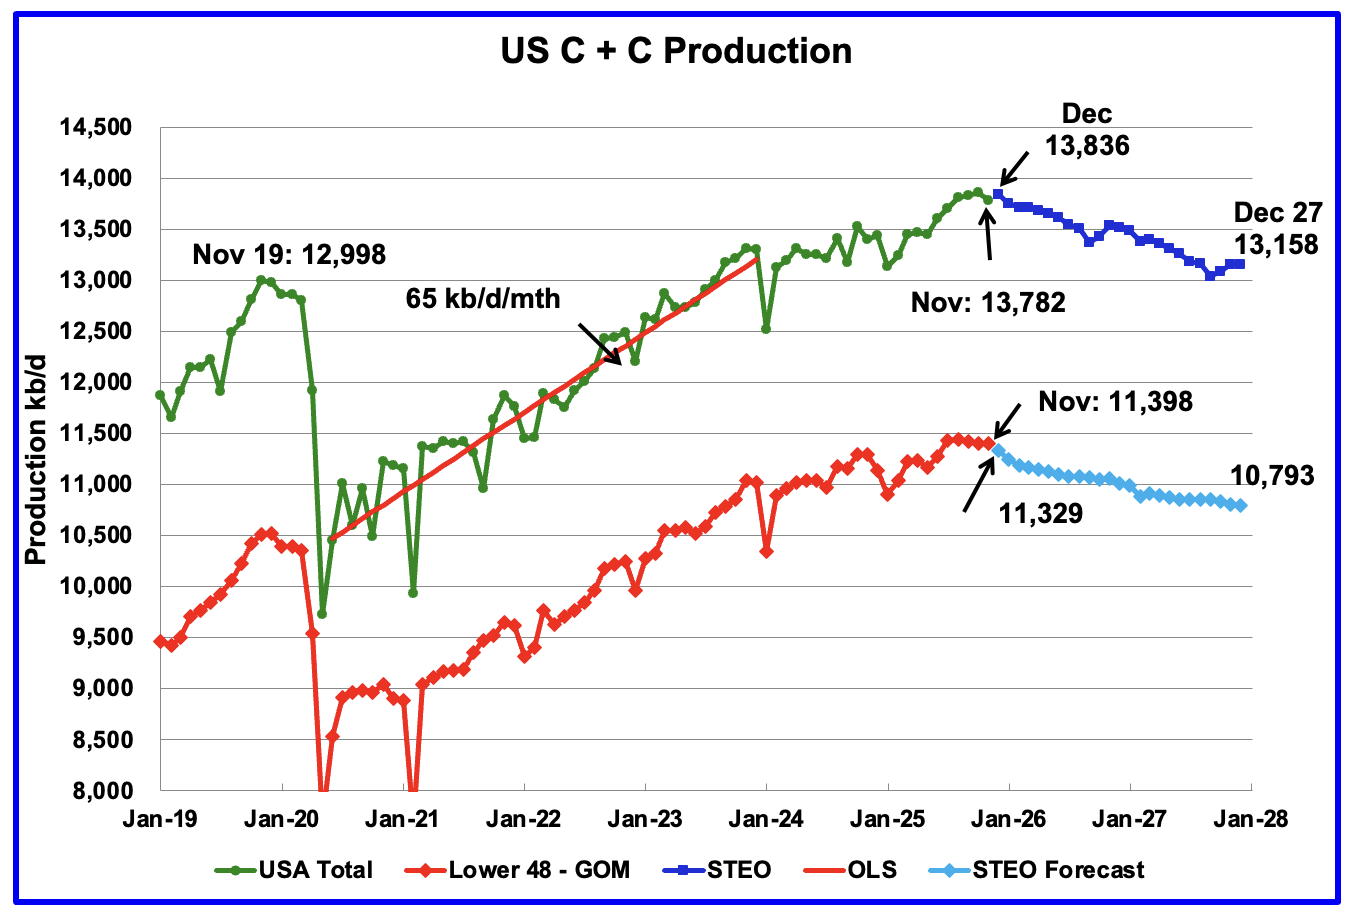
U.S. November oil production decreased by 82 kb/d to 13,782 kb/d, The largest decrease came from the GOM, 76 kb/d. December production is expected to rise by 54 kb/d to 13,836 kb/d according to the January STEO.
The dark blue graph, taken from the January 2025 STEO, is the U.S. oil production forecast from December 2025 to December 2027. Output for December 2027 is expected to drop to 13,158 kb/d. From December 2025 to December 2027 U.S. oil production is expected to drop by 678 kb/d.
Note the almost flat production in the Onshore L48 from July 2025 to November 2025, 11,436 kb/d to 11,398 kb/d, respectively, red/blue graph.
US oil production will peak between October 2025 and December 2025. October has a chance. Onshore L48 almost guaranteed to have peaked in August.
The light blue graph is the STEO’s forecast for the Onshore L48 output to December 2027. From November 2025 to December 2027 production is expected to decrease by 605 kb/d to 10,793 kb/d.
According to this Article: U.S. would lose an average of 340 kb/d in January 2026 due to the cold weather.
“Most of the remaining outages were in the Permian Basin in Texas and New Mexico, which accounts for around half of U.S. crude production, according to Energy Aspects analyst Jesse Jones, who said production there was recovering quickly.”
U.S. Oil Production Ranked by State
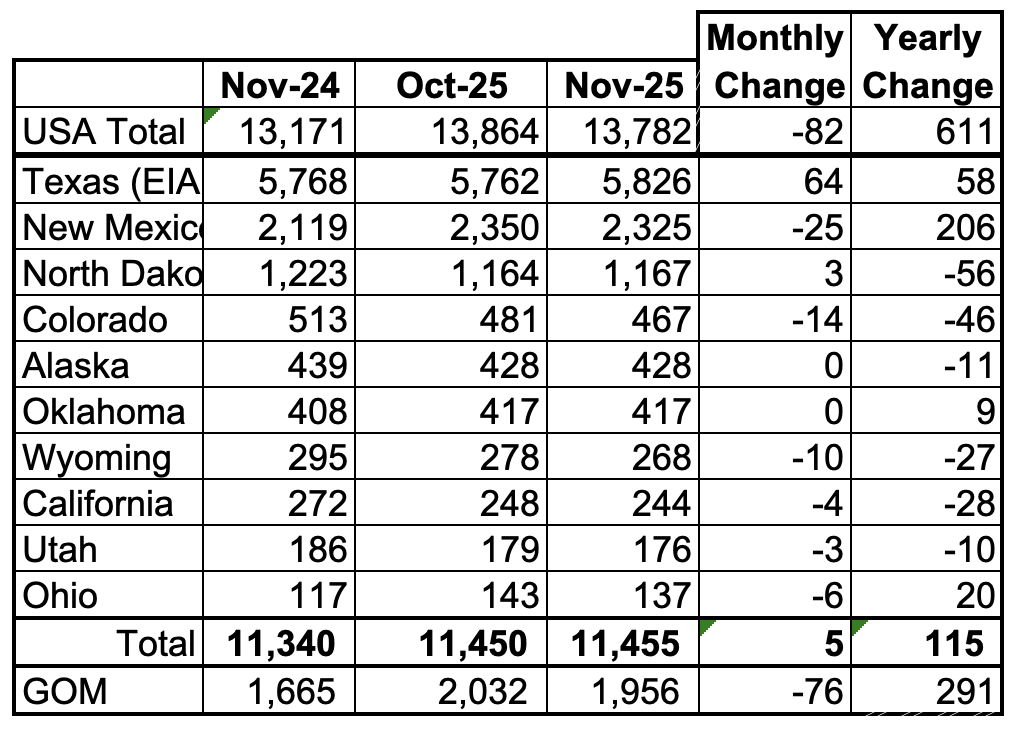
Listed above are the 10 US states with the largest oil production along with the Gulf of Mexico.
These 10 states accounted for 83% of all U.S. oil production out of a total production of 13,782 kb/d in November 2025. On a MoM basis, November oil production in these 10 states rose by 5 kb/d. On a YoY basis, US production increased by 611 kb/d with the largest contributors being New Mexico and the GOM.
State Oil Production Charts
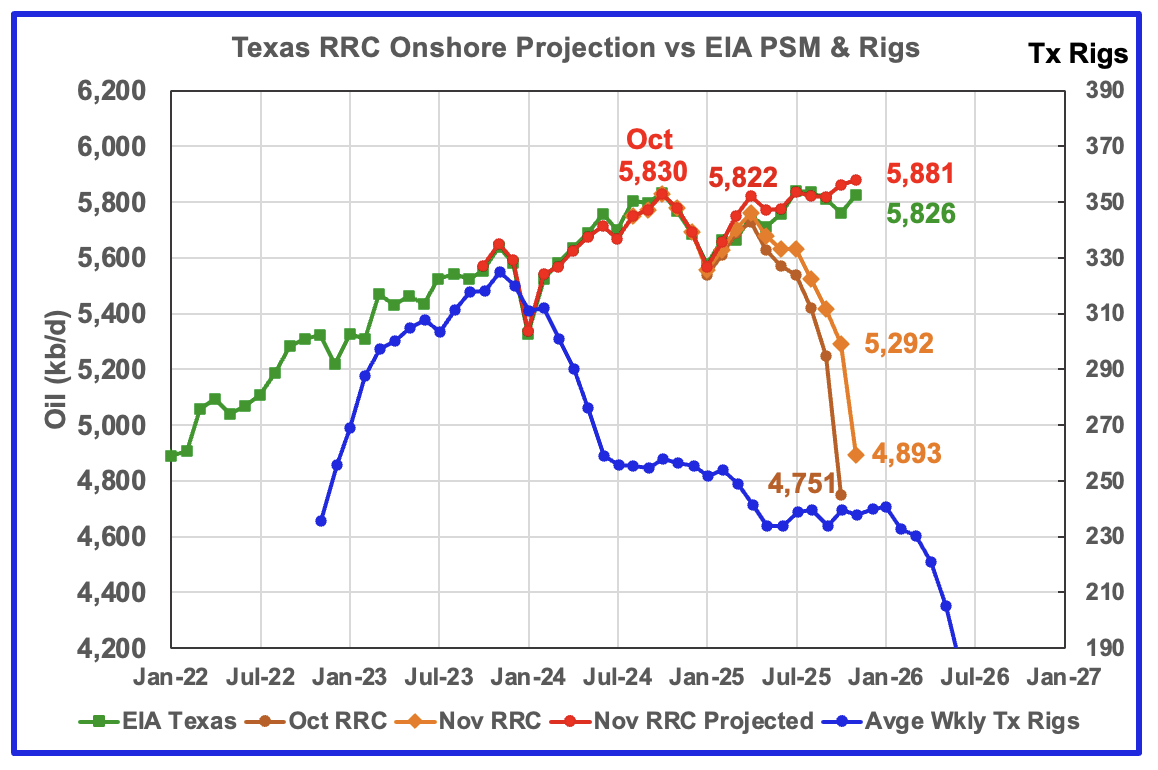
This chart is updated from the one posted earlier this week and now shows EIA’s Texas November production along with the projected November production. As I noted in the previous report: “The projection was optimistic and what is shown is more realistic and possibly still a bit optimistic.
Texas’ November production increased by 64 kb/d to 5,826 kb/d according to the EIA. Of the 64 kb/d, close to 50 kb/d came from Martin and 10 kb/d from Midland.
The Texas’ RRC initial production for November dropped by 402 kb/d from October to 4,893 kb/d. The projection added 988 kb/d to raise November’s projected production to 5,881 kb/d. It is 55 kb/d higher than the EIA’s estimate.
The red graph is a production projection using the October and November Texas RRC data.
The blue graph shows the average number of weekly rigs reported for each month shifted forward by 10 months. So the 276 rigs operating in July 2023 have been shifted forward to May 2024. From February 2024 to July 2024, the rig count dropped from 312 in time shifted February 2024 to 256 in July 2024. That drop of 56 rigs had no impact on production up to July 2025. August 2025 appears to be the first month when the impact of the start of a flat rig count is resulting in essentially flat production.
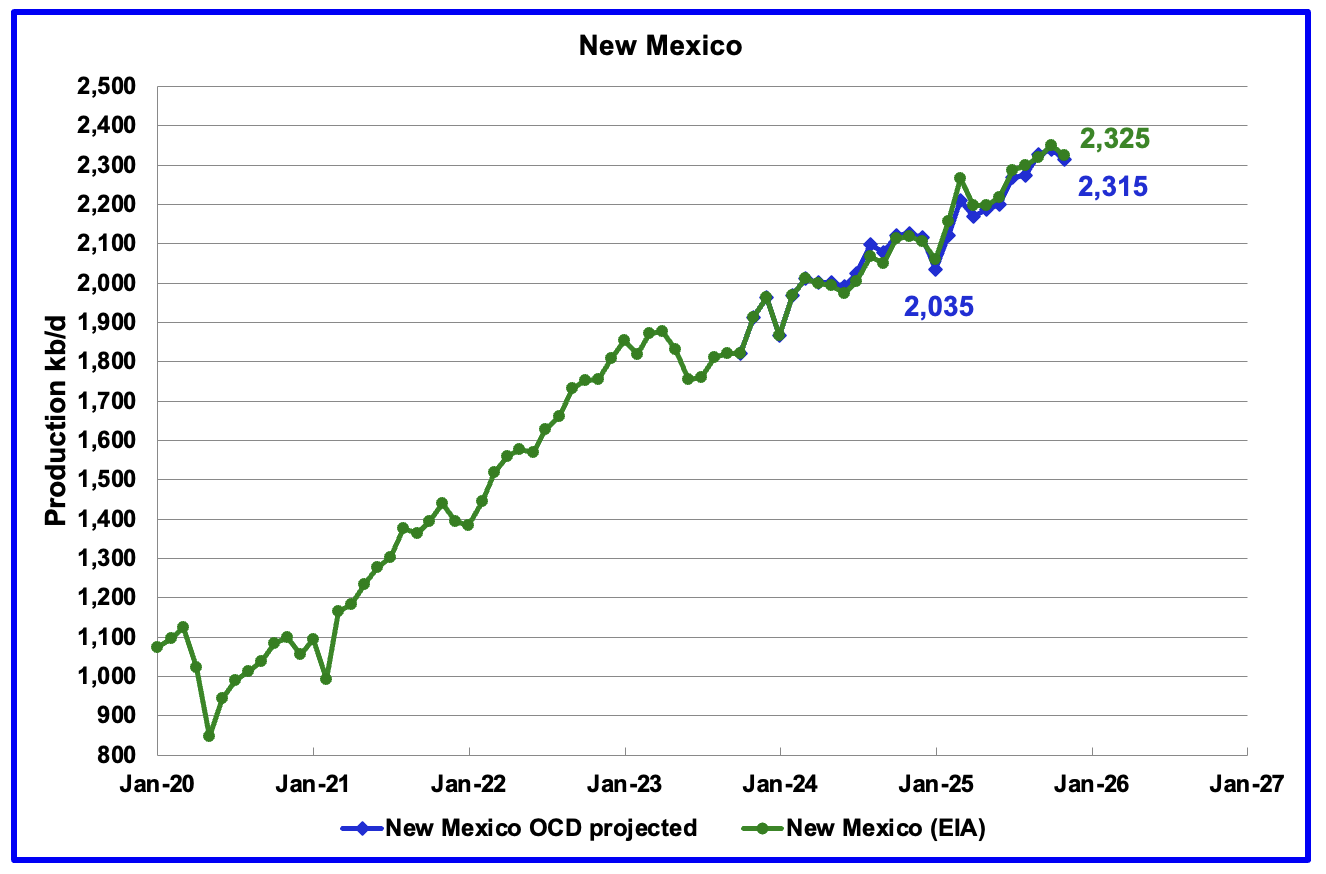
According to the EIA, New Mexico’s November production dropped by 25 kb/d to 2,325 kb/d. YoY production rose by 206 kb/d, the second biggest contributor to overall rising US production.
The blue graph shows the projected output up to November. November’s projected production decreased by 26 kb/d from October to 2,315 kb/d and is 10 kb/d lower than the EIA’s reported production.
Lea County dropped 47 kb/d while Eddy added 20 for a net drop of 27 kb/d to the overall New Mexico decrease.
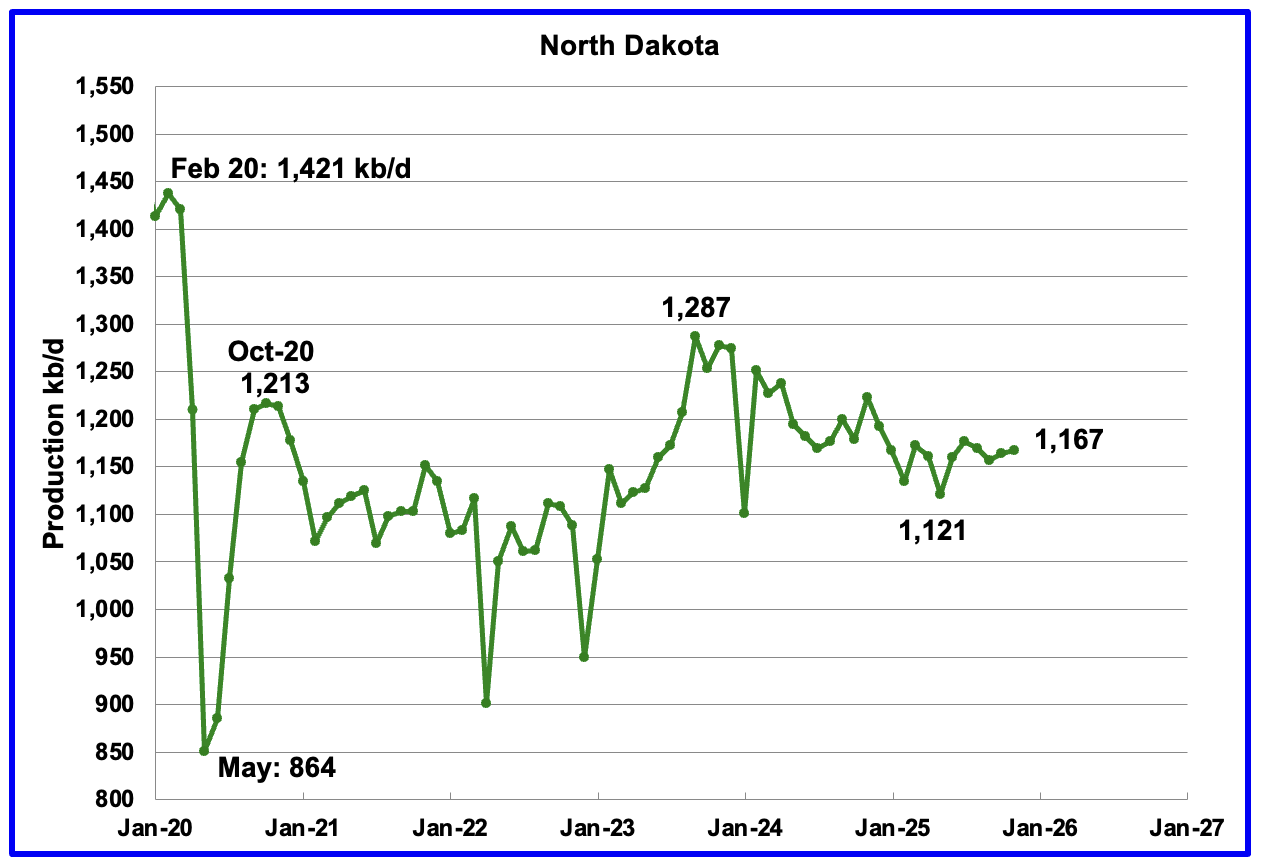
November’s output rose by 3 kb/d to 1,167 kb/d. Production is down 120 kb/d from the post pandemic peak of 1,287 kb/d.
The North Dakota Department of Mineral resources reported November production increased by 12 kb/d to 1,189 kb/d, which is 22 kb/d higher than the EIA’s estimate.
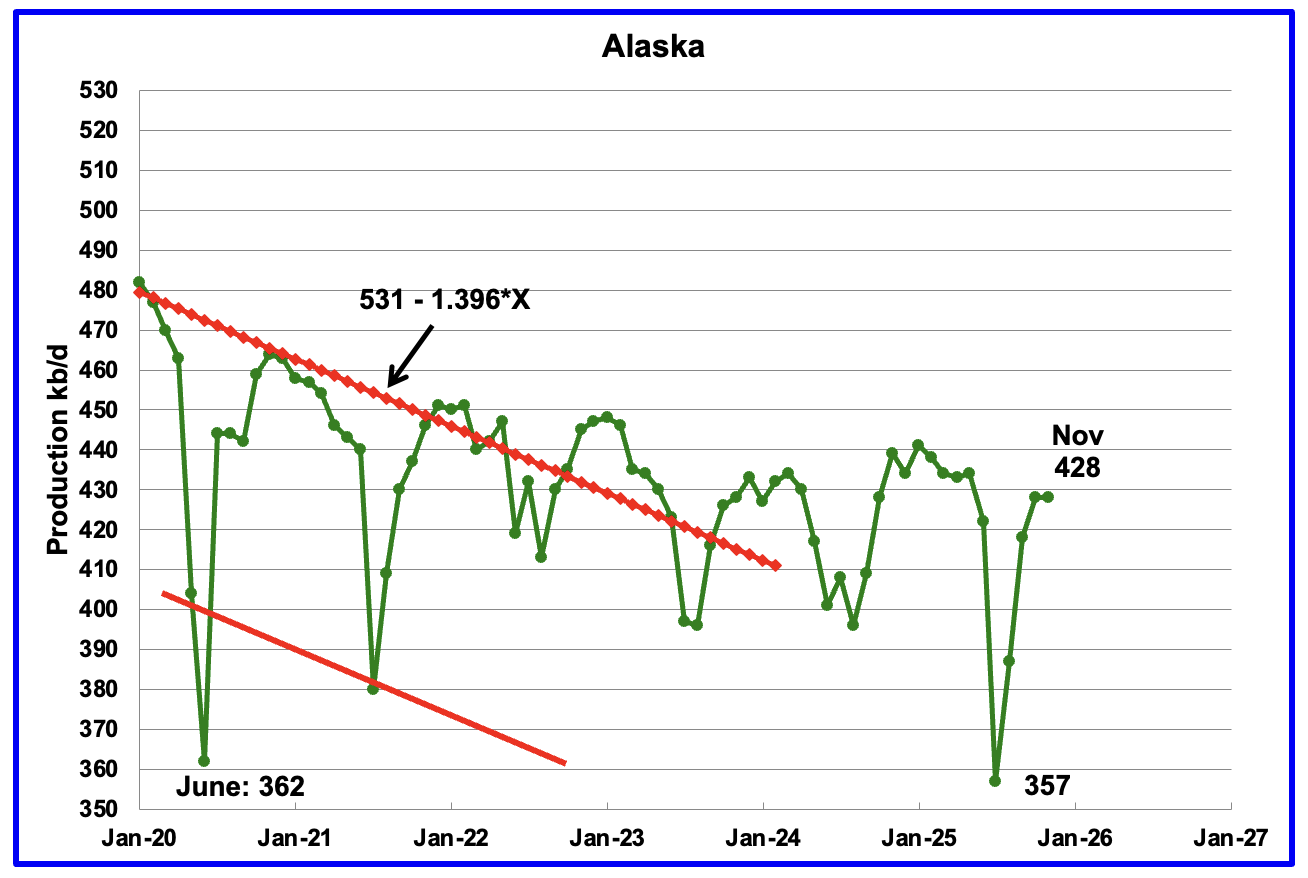
Alaskaʼs November output was flat at 428 kb/d while YoY production was down by 11 kb/d. The EIA’s weekly reports indicated that October production would rise and would average close to 430 kb/d. Production from the weekly reports for November was 430 kb/d.
Alaska has recently brought new fields online to consistently have flat YoY and monthly production gains which have broken away from the earlier dropping production red trend lines. New production is expected to come online from the Picca field in early 2026.
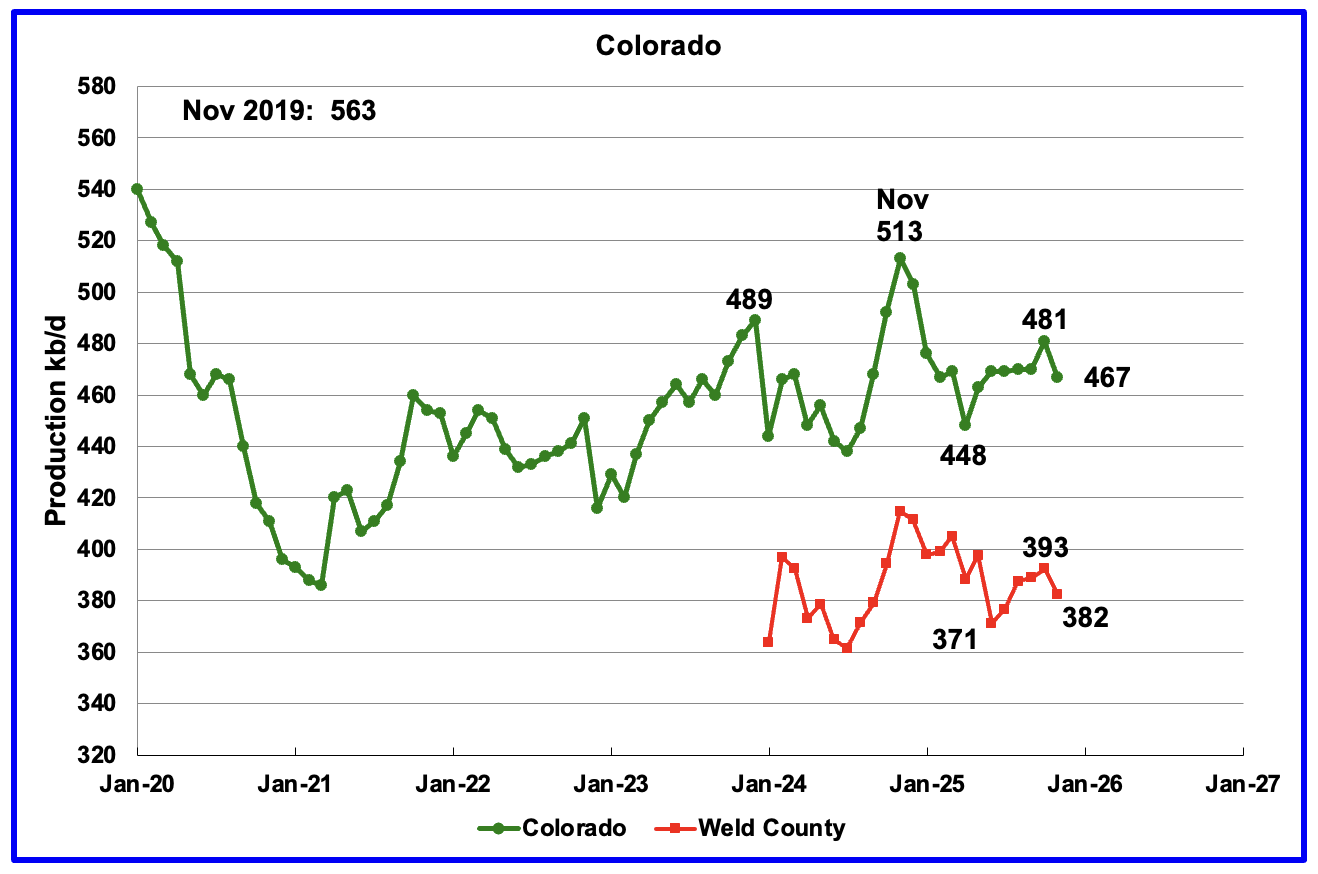
Coloradoʼs October oil production dropped by 14 kb/d to 467 kb/d.
The biggest oil producing county in Colorado is Weld County and its production has been added to the chart. The two graphs have been almost parallel since January 2024 but diverged over the last few months. Weld’s production also dropped by 11 kb/d in November to 382 kb/d.
Colorado began 2025 with 6 rigs in January and February and peaked at 11 in October. At the end of January 9 rigs were operational.
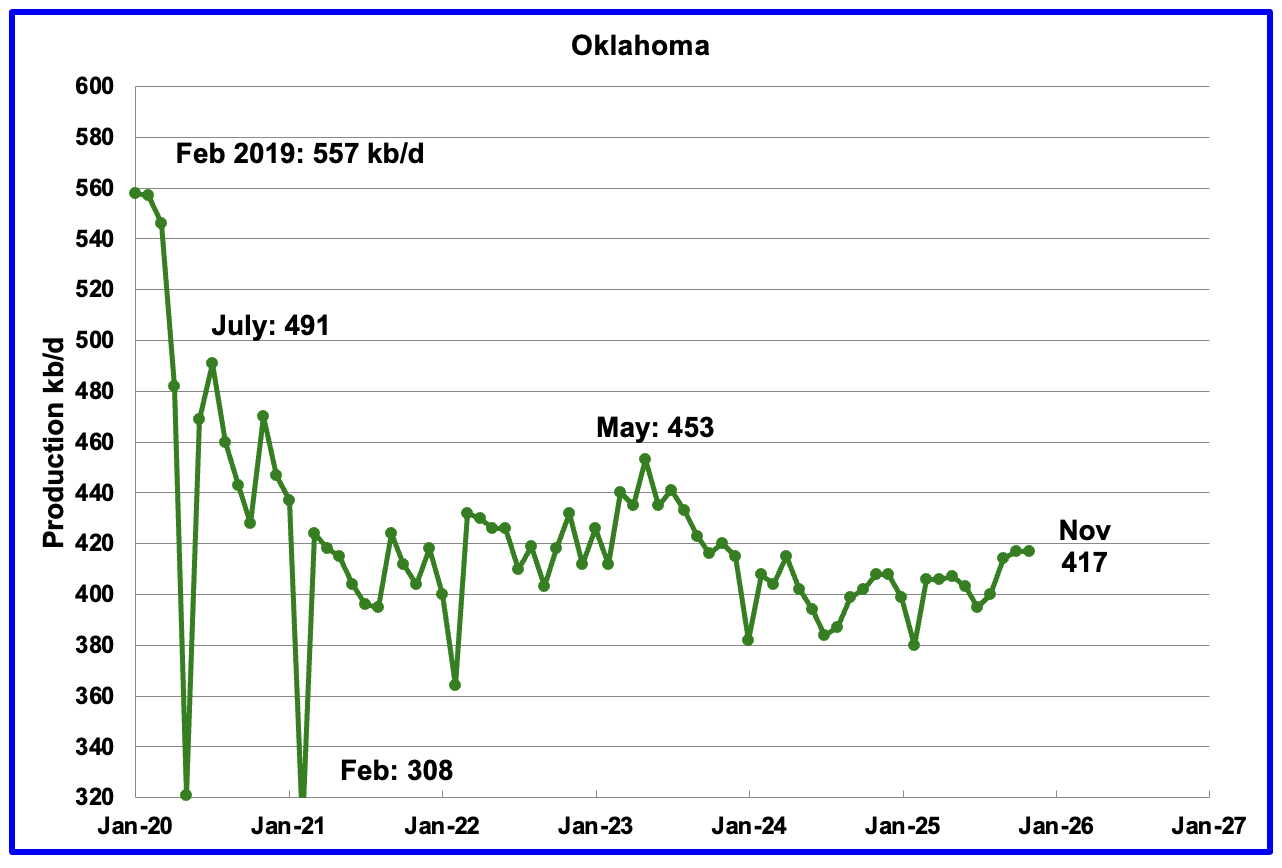
Oklahoma’s output in November was flat at 417 kb/d. Production remains below the post pandemic July 2020 high of 491 kb/d and is down by 36 kb/d since May 2023. Output entered a slow declining phase in June 2023 and now appears to be range bound around 400 kb/d ± 20 kb/d.
Oklahoma had 51 operational rigs in May 2025 which slowly dropped to 40 rigs in January 2026. The rig count has been fairly steady around 40 since July 2025. The steady rig count since July may be showing up in the steady oil production around 400 kb/d.
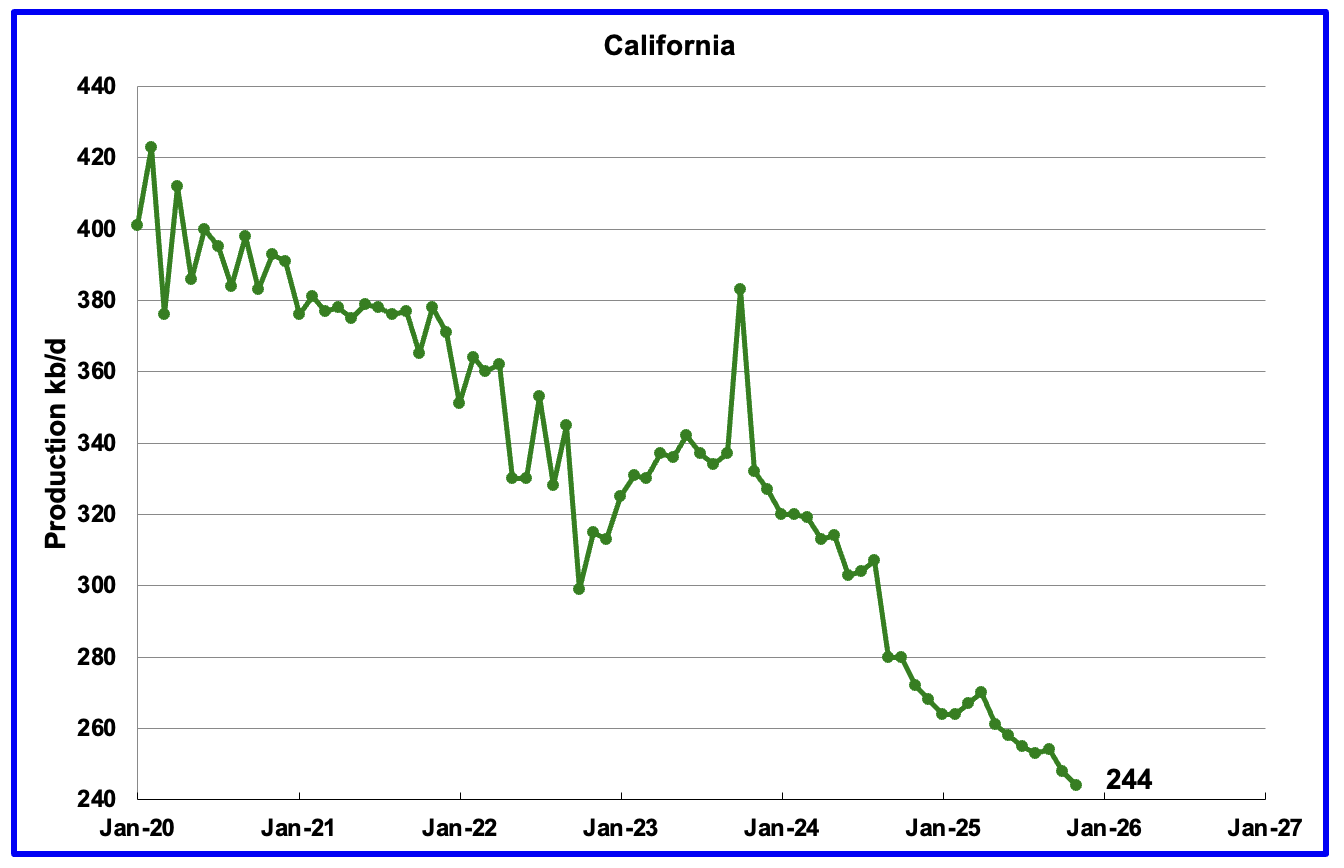
California’s overall declining production trend continues. November’s production dropped by 4 kb/d to 244 kb/d. YoY production dropped by 28 kb/d.
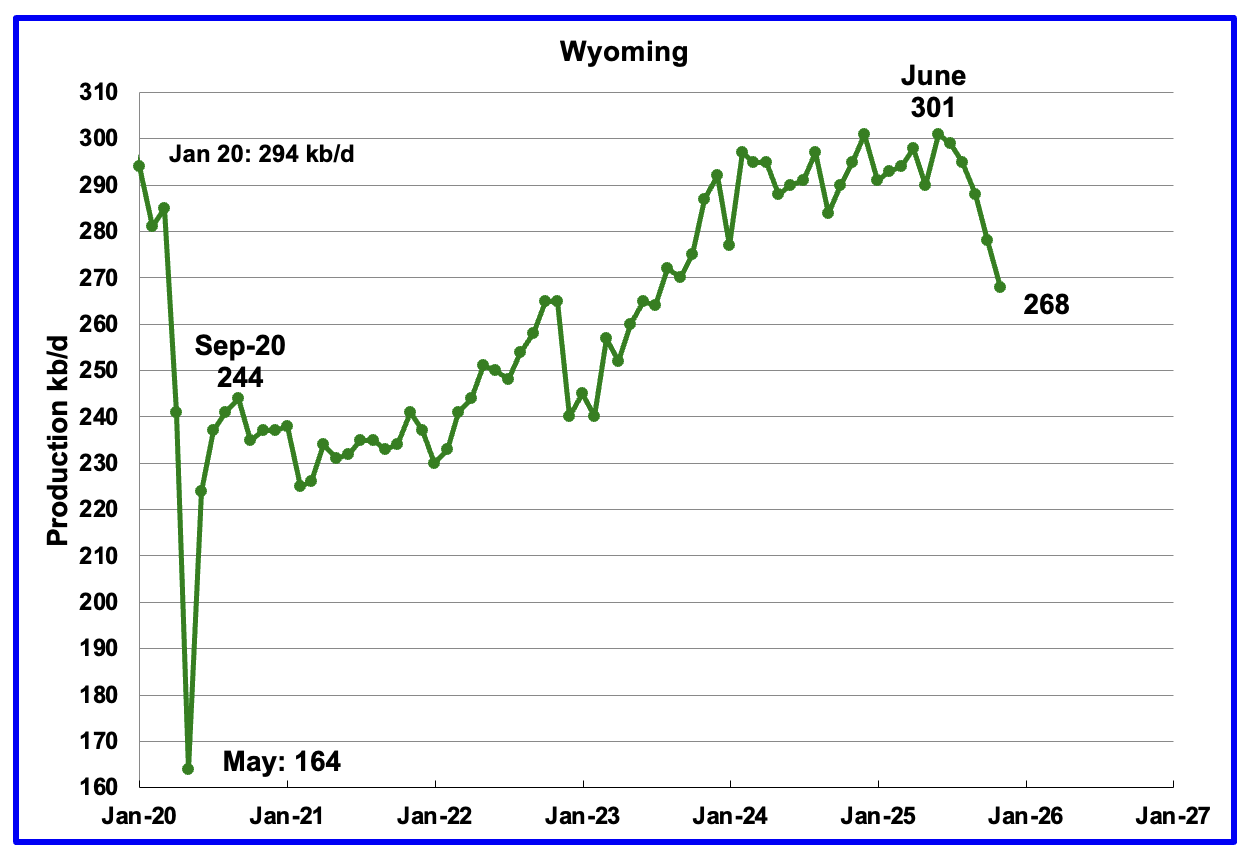
Wyoming’s oil production reached a post pandemic high in December 2024 and again in June 2025 of 301 kb/d. Production has dropped in each of the last 5 months. November’s production dropped by 10 kb/d to 268 kb/d and Wyoming appears to have entered a declining phase.
At the beginning of 2025 Wyoming had 14 operational rigs and rose to 16 in March and April. At the end of December 10 rigs were operational. In January 2026 3 rigs were added for a total of 13. Will the addition of these rigs slow the decline?
According to this Article: Wisconsin drillers are concerned with the current price of oil.
“We’re getting close to marginal prices here where people are going to cut back on their drilling capitalization,” Wold said, noting that spot prices in the low $50 per barrel range gives many operators pause when it comes to coaxing production. The daily spot price that most Wyoming producers track stood at about $57 per barrel on Monday.”
In spite of what Wold says, Wisconsin added 3 rigs in January 2026.
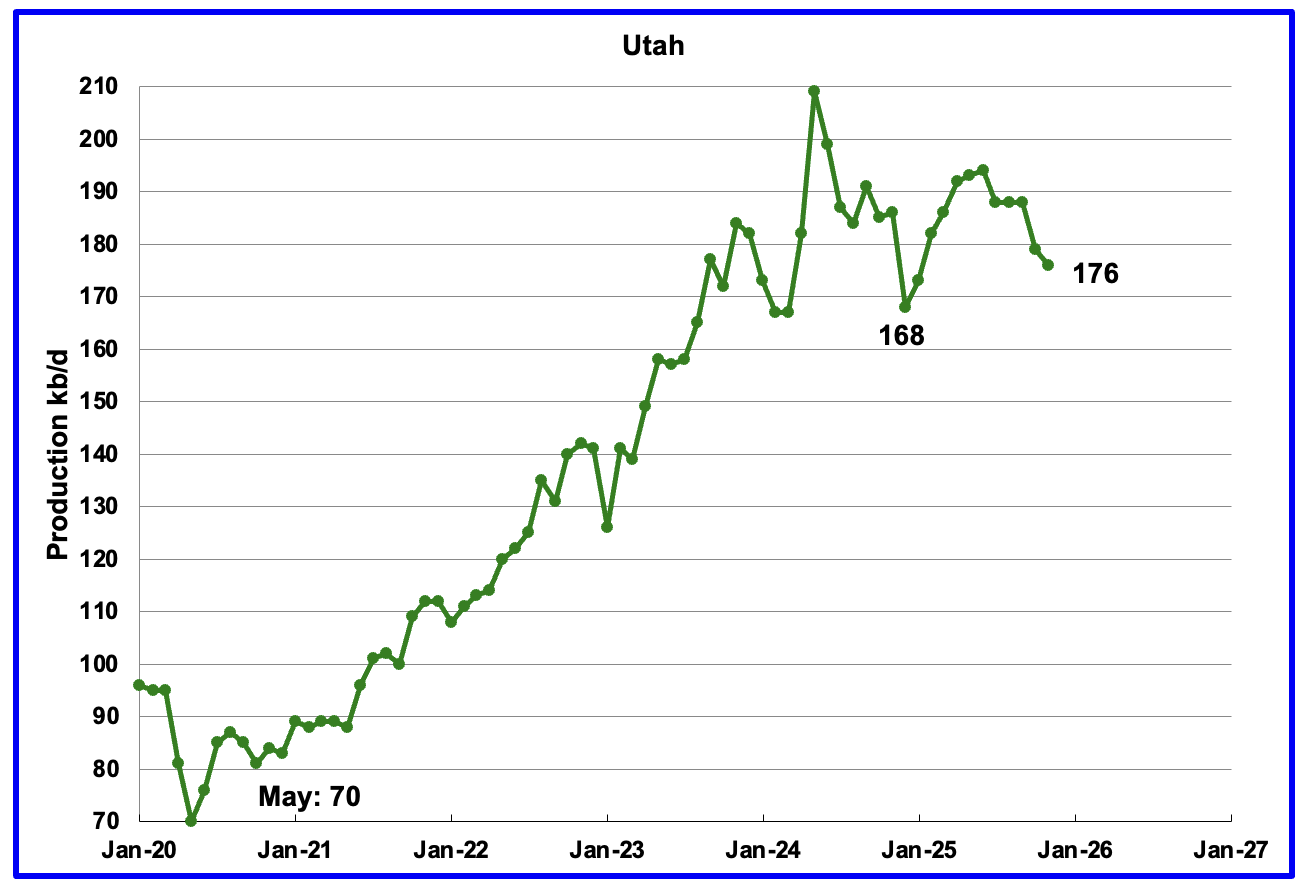
November’s production dropped by 3 kb/d to 176 kb/d. Utah had 8 rigs operating from October 2024 through May 2025 but dropped to 6 in early June 2025 but returned to 11 at the end of January 2026.
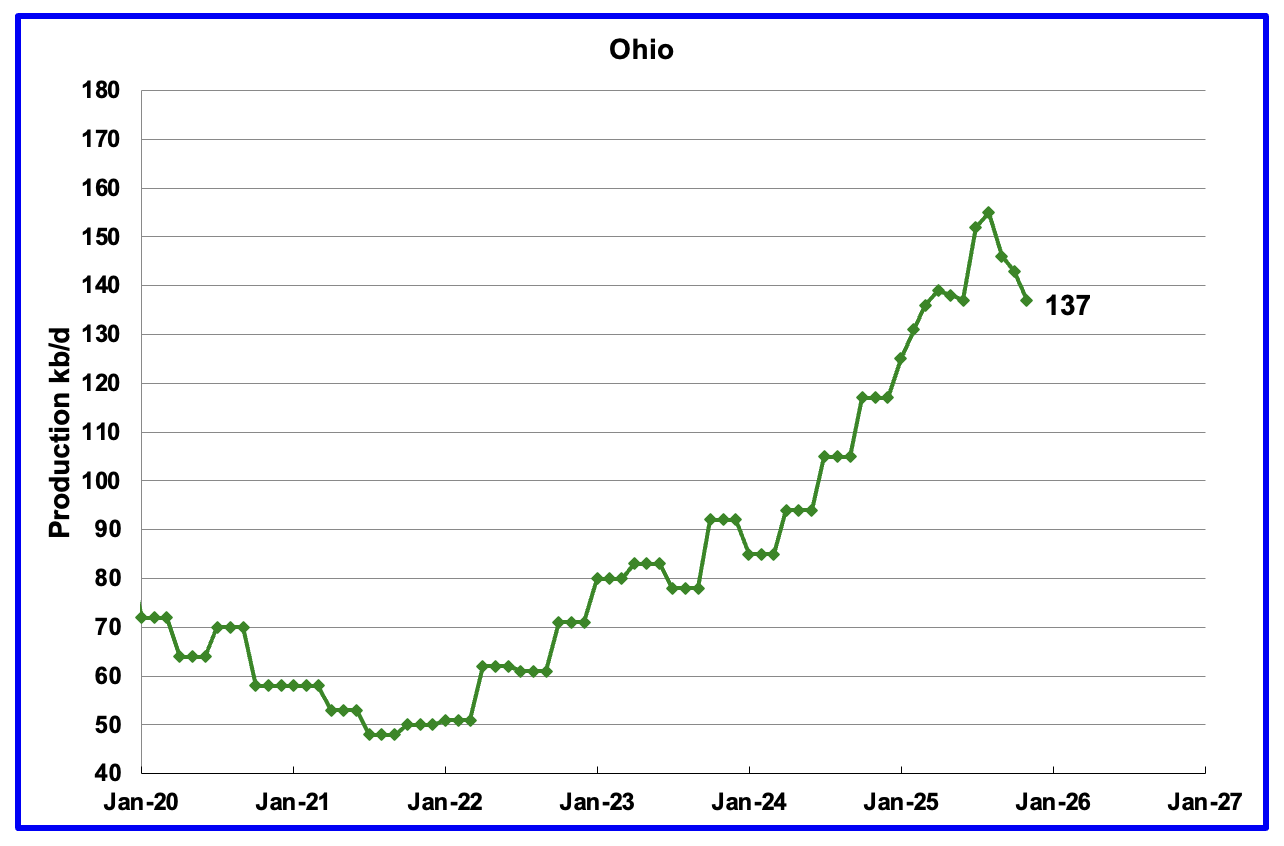
Ohio’s November oil production decreased by 6 kb/d to 137 kb/d. Ohio started the year with 6 NG rigs, In January Ohio had 12 NG rigs and 1 oil rig operating.
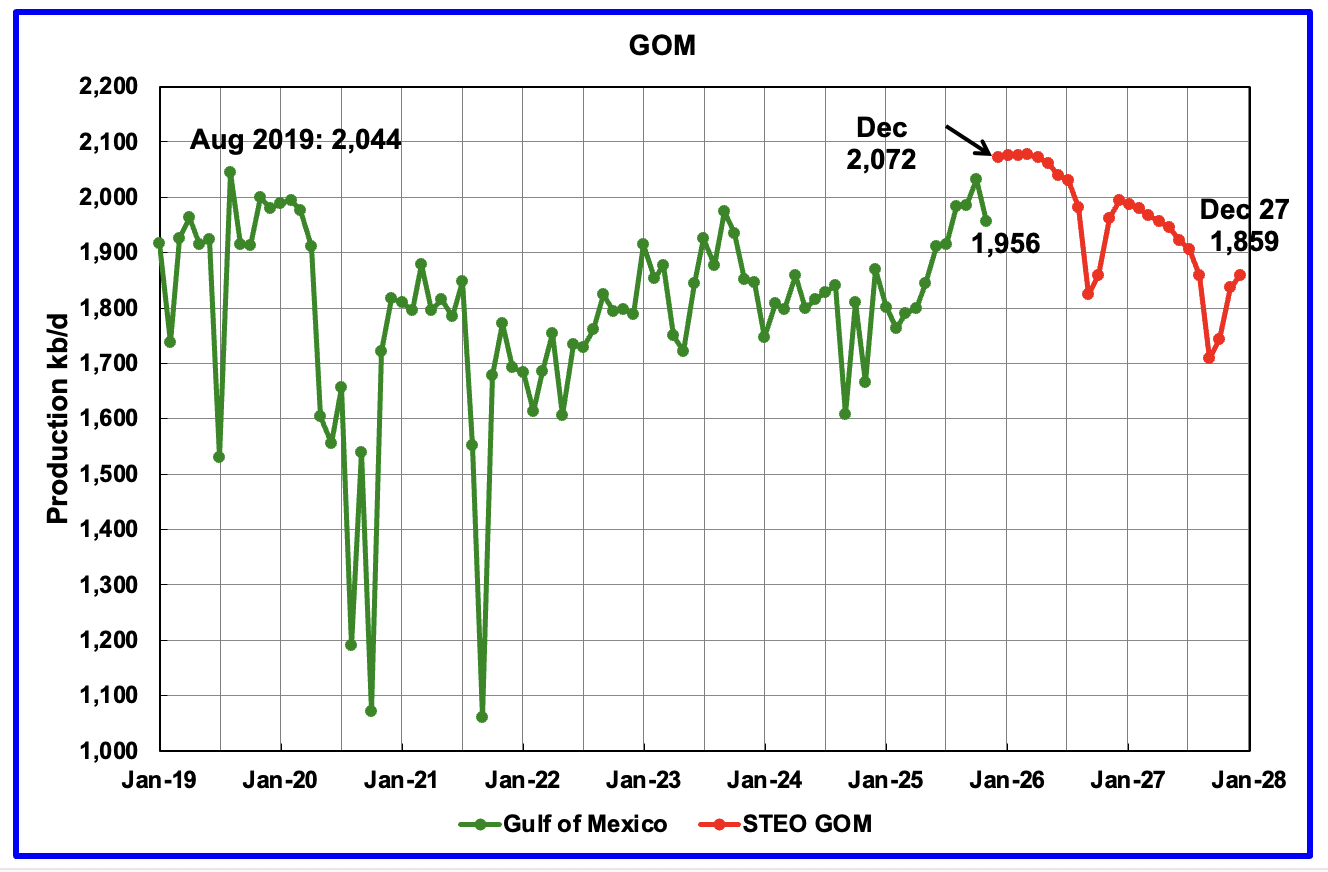
GOM production dropped by 76 kb/d in November to 1,956 kb/d. In the previous report, the STEO was forecasting that November production would drop to 1,988 kb/d. Could be related to some platform maintenance.
The January 2026 STEO GOM projection has been added to this chart. It projects production in December 2027 will be 213 kb/d lower than December 2025 at 1,859 kb/d.
While this Article, says three new projects have helped boost US Gulf of Mexico output since mid-2025 and will continue to add to supply, the STEO is indicating that the GOM will peak in early 2026.
A Different Perspective on US Oil Production
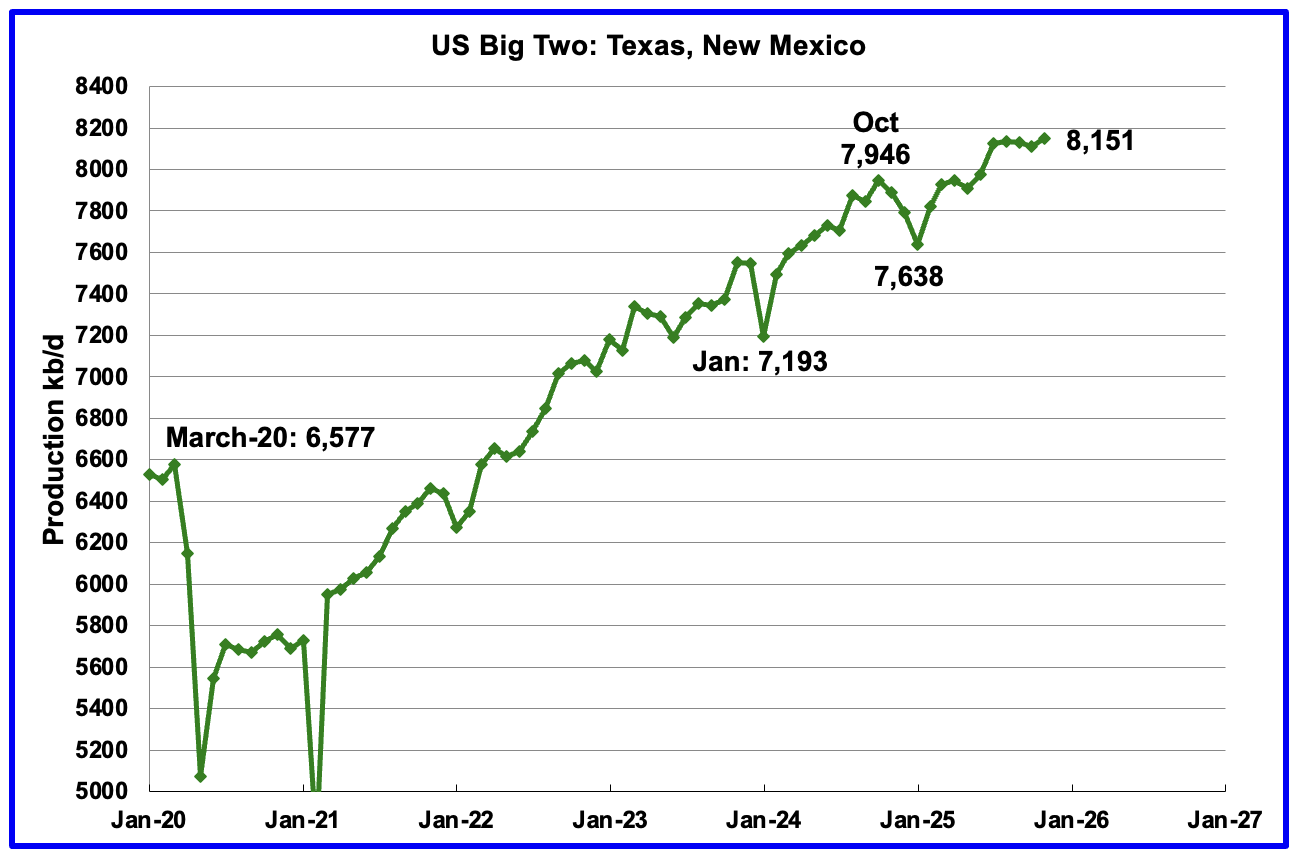
Combined oil output for the Big Two states Texas and New Mexico.
November’s production in the Big Two states increased by a combined 39 kb/d to 8,151 kb/d. Clearly these two states were the drivers of US oil production growth up to July 2025. Is the essentially flat production starting in August 2025 the first sign that production in these two states is close to peaking?
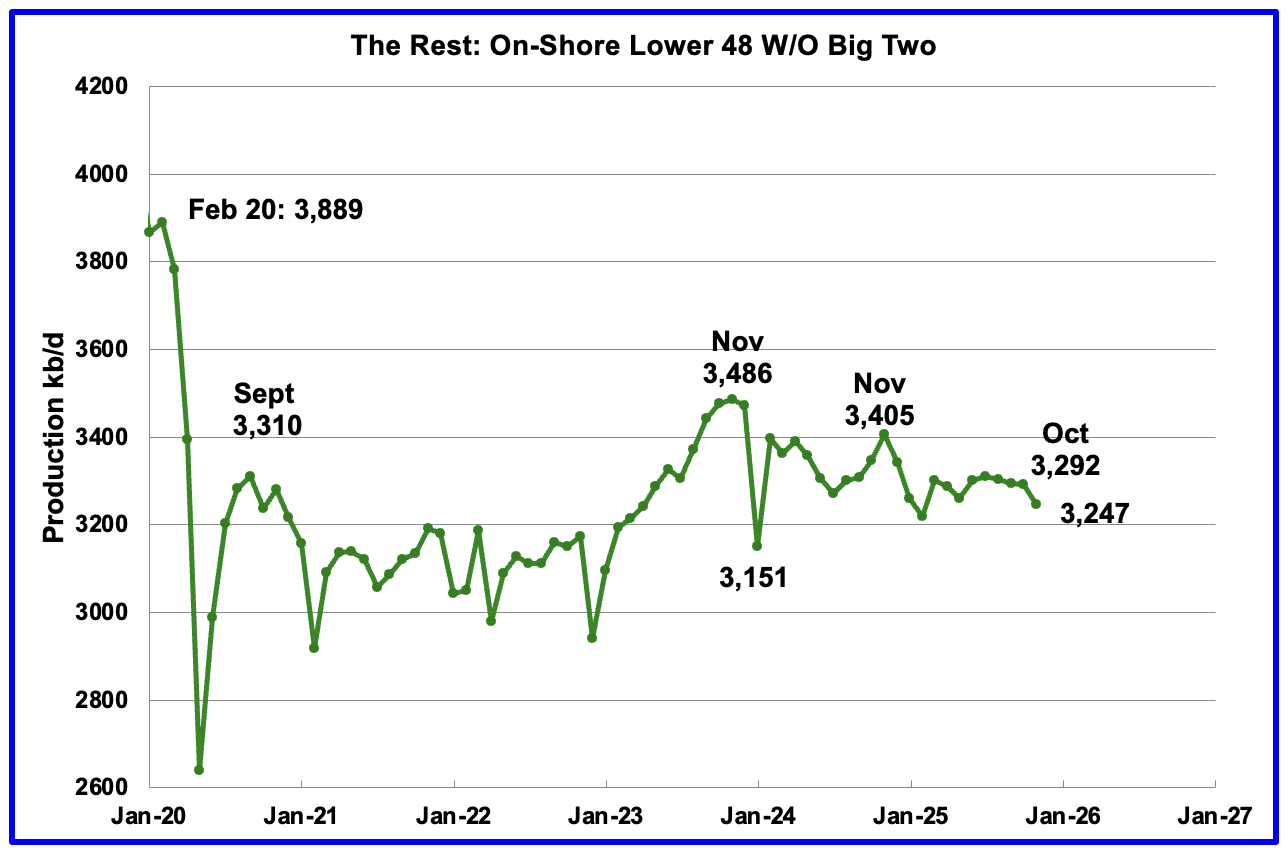
Oil Production by The Rest
November’s oil production by The Rest dropped by 45 kb/d to 3,247 kb/d and is 239 kb/d lower than November 2023.
21 responses to “US November Oil Production Drops”
Ovi,
Could you comment a bit more on the big divergence between the RRC data and the EIA data for Texas? How likely is it that the actual Texas production is more inline with the RRC data (orange or brown lines) than with the EIA data? That would suggest that Texas production has clearly peaked.
(I suspect you or Dennis have commented on this over the last months. If so, I apologize for missing it.)
Bob
There is a huge time lag in the RRC data. I am not a position to explain why there is lag. For instance the original Oct production was 4,751 kb/d. In the current Nov report it was revised up to. 5,292 kb/d. See dark orange and orange graphs in Texas.
To get around the lag the EIA conducts a 914 survey of major drillers/companies that give them a more up to date idea of the monthly production. They then bump that number up to give their final estimate. On the lower right are shown the ratio of the 914 survey and the final EIA estimate. Not sure why the ratio changes.
I use a totally independent mathematical process to project final production. The result depends on the quality of the data which I then adjust and report to our readers. Typically the trend is right but not the number. As noted my TX estimate was high by 1% and did project an increase.
The Tx and NM production estimates use the same methodology.
A TX
There is a new post on Fluid Catalytic Cracking on Mike Shellman’s Oilystuff for those interested in refining. Fluid Catalytic Cracking
https://www.oilystuff.com/group/oil-natural-gas-refining-stuff/discussion
Carnot
Always interested in that. I will check out the posts.
https://oilprice.com/Energy/Energy-General/Economic-Models-Are-Overlooking-a-Looming-Diesel-Crisis.html
Repeating the rhetoric that Light Tight Oils from US shale patches are not enough, need naphthelene rich crude.
The low GOR sweet (low Sulfur) medium API (20~35deg) shale oil from Vaca Muerta are best for Diesel, Kerosene Jet fuel, and export at price even higher than Bonny Light (>API 31 deg).
VM just exported another 70K ton low GOR&API shale oil cargo to US and the new block has the best well now in VM with Low GOR&API.
https://vacamuertanews.com/actualidad/phoenix-sumo-un-rig-en-el-superpozo-de-rio-negro.htm
There is a chance it will become the second well in VM to produce a million barrels in the first year. Both are low API<31deg.
I am glad Vaca Muerta has worked out so well as some commentators on this site did hint about years ago. Whether you could call a diesel crises or not is another issue. There are several adoptions and substitutions of energy than can be made. Better to think of the energy market as a slow moving beast where diesel deserves to be priced at a premium.
Honest question why is the decline curve so gradual, given that all of the basins peaked and individual wells can have double digit monthly declines.
What am I missing?!?
Svaya
I don’t think we can categorically say that “All basins are in Decline”. However I do think we may be very close.
With regard to the high decline rate in new wells, new wells have high initial IPs which offset the steep decline rate in all of the other wells in the past. That is why many new wells are brought online every month. However at this time, the new production and decline are about the same so overall production is essentially flat. This can best be seen in the very slight production decline in the Onshore L48 from July 2025 to November 2025. That is clear indication that the overall decline is over whelming production from new wells. With fewer wells being drilled, the decline will accelerate.
SAYA, nothing. You are not missing anything. The only “Basin” not in obvious decline is the Delaware Basin and only in Eddy County, New Mexico. The rest of the Delaware, and the Permian, as a whole, is in serious decline.
https://www.oilystuff.com/group/oily-stuff/discussion/3b7430ec-5462-4a4a-bca3-91cd7fd2b95a
If the analyst is only concerned about the actual date of a “peak,” whatever that means, or its reputation as an analyst (?) in making predictions…everybody is gun-shy, like an Alabama quail dog. In the past people have picked peaks and then been wrong only because of the additional debt the U.S. shale sector, and the U.S. in general, is willing to take on to keep growing.
You’re good. Use your instincts, your common sense. All Basins are in decline and the only thing that will arrest that decline is more debt. Does that count? Is growth, based on debt, sustainable?
No. It is fake. Artificial.
@OVI, since is hard to project all the wells individually we cannot know, technically this can be done easily with a computer model, but individual well data would be needed. So the problem is the data.
@Mike Shellman, in my opinion, debt might not even be the biggest problem, if the dollar goes haywire, and inflation runs out of control, the debt trick might not work anymore. This will create a self amplifying effect that might wreck the global economy, at least the western economy.
Svaya
The county data provides a good average production for all the wells. As you can see it works well for NM. The EIA data and the projection are very close.
The problem with the Tx data is the time delay and corrections. For some months the updated data for a given month is negative. For me that indicates an input error. Regardless, we should know within the next 3 months where TX stands in the production graph.
Mike
As long as the interest can be paid, it can go on for a long time.
U.S. gdp has grown over the years
https://fred.stlouisfed.org/series/GDP
A proportion of that gdp is fake, it’s just debt.
https://www.ntu.org/foundation/detail/the-us-has-accumulated-70-percent-of-its-31-trillion-debt-in-the-past-15-years
A trillion dollars of debt is the equivalent of the government paying 12 million people $70,000 each year. They buy food, pay bill and keep the economy going. Without this fake gdp the U.S. economy would be in recession.
This debt makes people richer now but in comes at a cost to the future. The two trillion debt increase last year, half went just pay just the interest. That’s four times as much as the cost of all the teachers and police salaries combined.
It’s not just the oil industry in trouble, the U.S. debt will crush the economy. None of this should be a surprise, when you lose 20 million manufacturing jobs the entire system is undermined.
The wealthy will be fine though, because they own the debt
@OVI
I was thinking more about this: projecting for each well based on each well history and then sum the projections.
Eduard
Getting well data is beyond what I can do.
Iver
Don’t let the self-anointed “fiscal conservatives” fool you with their propaganda. America’s debt problem is its private debt, not its public debt.
Americans have been spending more than they earn every year since 1945, and it’s catching up.
Alimbiquated,
Could you expand on your argument, perhaps with sources?
Mike
I am not quite of your definition of serious decline. The charts that are posted for the four main Permian counties and District 8 may be hinting at decline, but those charts only show plateaus with hints of decline. Unfortunately the monthly data from the TX RRC varies month to month and gives different results. That was shown in the report regarding Midland County in the previous US November update.
https://peakoilbarrel.com/us-november-report/
The best that can be said for Midland county is that it is in a plateau phase and may be close to entering decline phase.
If the Midland/Permian basins were in serious decline, I would think that Texas would be in decline. For November Texas production rose. On the other hand, Lea’s decline overwhelmed Eddy’s gain resulting in a November production drop in NM.
I present the production charts and let them do the talking. The rig count charts me be saying something else.
You along with other viewers have the option of looking at those charts and come up with their own perspective.
Ovi, I did; thanks. Tight oil production in all U.S basins is now declining.
If shale oil is not growing, its in “serious decline.” and my statement is relative to R/P ratios, remaining drilling locations, GOR, declining well productivity, increasing water and where to put it, long term debt and short term well economics.
I am an operations guy using a number of sources for information other than the unreliable EIA, who has a mission to keep prices low, which you yourself questioned within months of Trump being elected.
I am not a snap-shot numbers only guy. People that don’t understand the oil and gas business can only rely on what big government wants to them to believe. The bellyaching about the TRRC is only 13 years old on POB…its mission is not to make guesses but to balance every BO produced to every BO sold so the books balance in Texas, RI is properly paid, school districts, counties, the University Fund, the State can make budgets, etc. A novel concept in the world we live in today, for sure.
It is otherwise a silly thing to be debating….tight oil has only one place to go and that is down. If it holds a plateau, or grows 2% annually, its all because it is taking on more debt, which it is.
Dismissing debt as a venue for economic growth is beyond my operational/real life business comprehension. The comments about tight oil debt are, well, whatever. Not made by people who will ever have to deal with that debt?
Debt is fine as long as the interest on that debt can be paid, with regard to tight oil, that declines 85% in 36 months, is the dumbest thing I have EVER heard.
Mike
Thanks for your thoughts and the extra information you bring to formulate your opinion.
What continues to puzzle me is the rise in the time shifted rig counts in some counties and what it means for production.
A good example is Lea County. When the time shifted rig count hits January, it rises rapidly from 37 to 57 rigs. Will this just maintain production or will it rise.
I have to post a World update now. If you would like to share your thoughts on this you can do it here or in the world update.
The latest US production update is at the end.
Screenshot
A new update to World and Non-OPEC Oil production has been posted
https://peakoilbarrel.com/october-world-oil-production-drops/
[…] Por otro lado, el shale oil USA ha permitido aumentar la producción mundial durante la última década y ya se aprecian claras muestras de pico de producción, con los principales CEO´s de la industria advirtiendo del agotamiento de los puntos dulces o más productivos. Incluso la EIA americana reconoce que en los próximos años veremos un descenso en la producción. […]