By Ovi
The focus of this post is an overview of World oil production along with a more detailed review of the top 11 Non-OPEC oil producing countries. OPEC production is covered in a separate post.
Below are a number of Crude plus Condensate (C + C) production charts, usually shortened to “oil”, for the oil producing countries. The charts are created from data provided by the EIA’s International Energy Statistics and are updated to October 2025. This is the latest and most detailed/complete World oil production information available. Information from other sources such as OPEC, IEA, STEO and country specific sites such as Brazil, Norway, Mexico, Argentina and China is reported to provide a one or two month outlook.
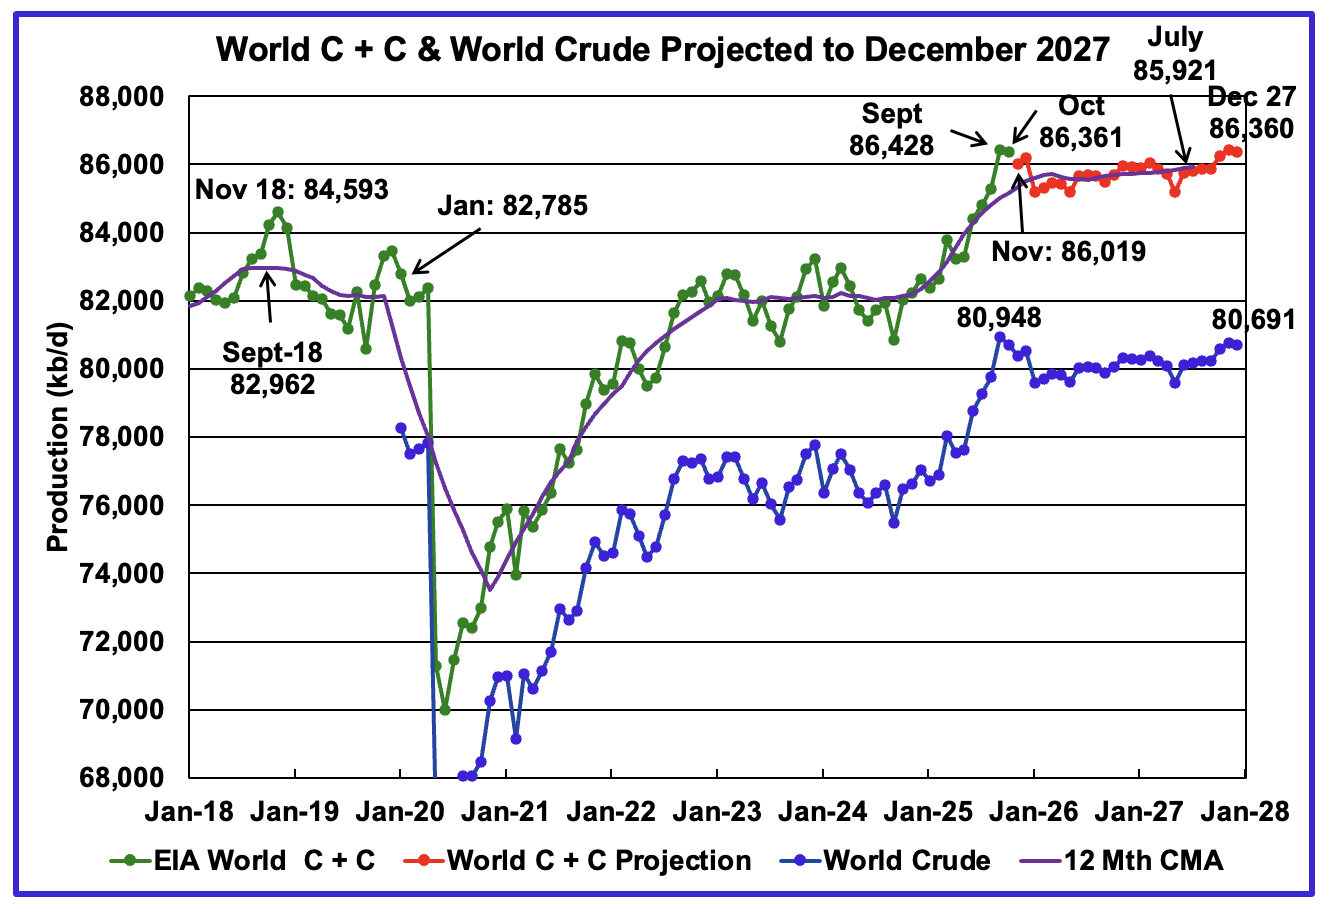
The World’s October oil production decreased by 67 kb/d to 86,361 kb/d. The small October drop may be due to the large September C + C increase due to the large increase in crude production shown in the crude graph and which was also revised up by another 395 kb/d in the current report. That increase then drops in January 2026. The large January drop is just as surprising as the September increase.
September 2025 could be the new World Peak Oil at 86,428 kb/d for the next few years and possibly longer.
This chart has been updated using the February 2026 STEO to project World C + C production out to December 2027. It uses the STEO report along with the International Energy Statistics to make the projection. Production in November 2025 is projected to decrease by 342 kb/d to 86,019 kb/d.
The 12 month Centred Moving Average shown at July 2027 is 85,921 kb/d vs the September 2018 12 month CMA of 82,962 kb/d.
For December 2027, production is projected to be 86,360 b/d, an upward revision of 442 kb/d from the previous report.
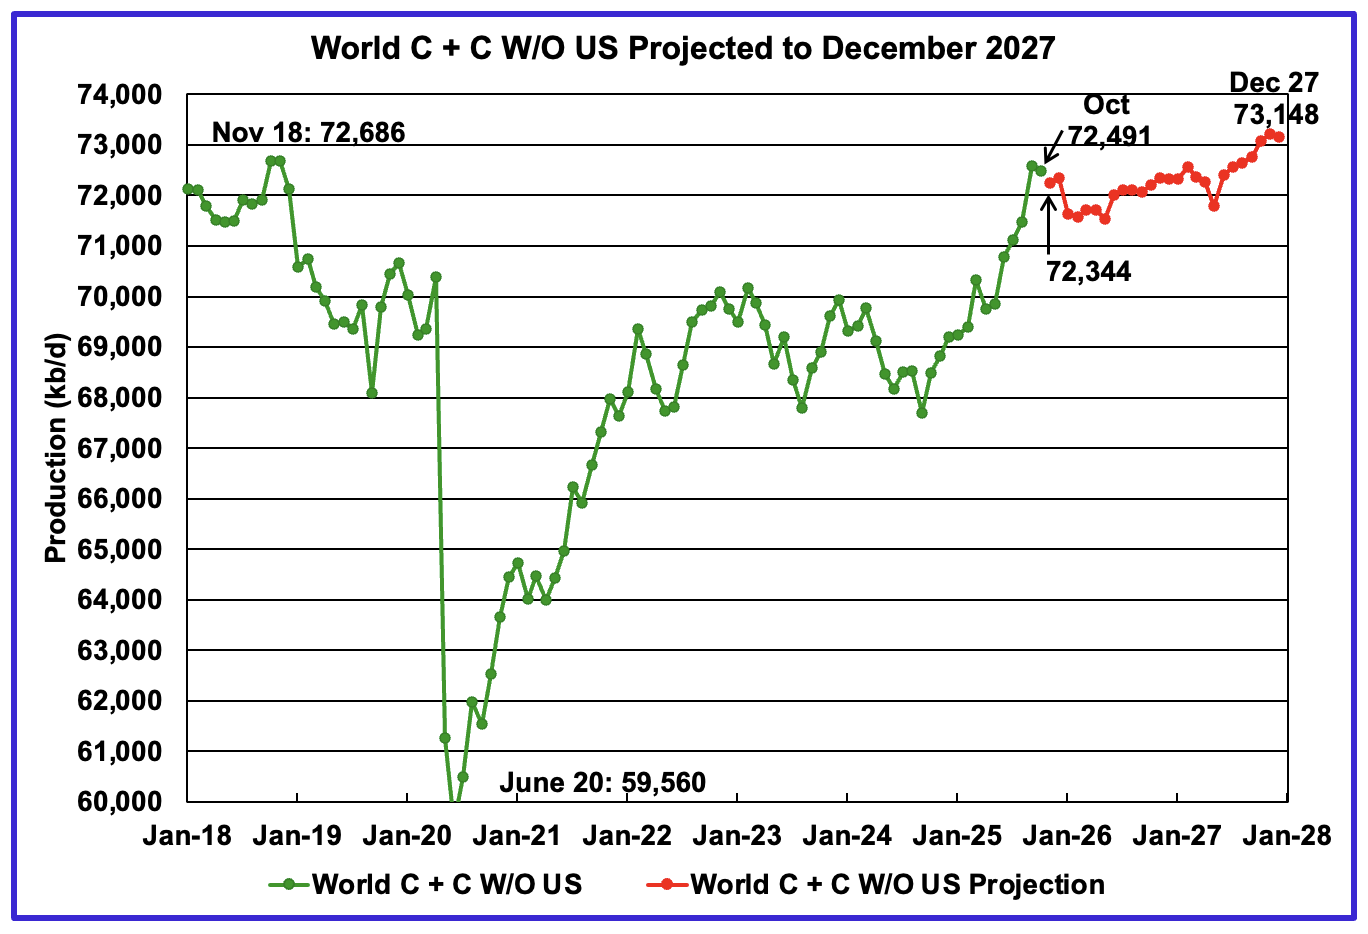
October’s World oil output W/O the US decreased by 99 kb/d to 72,491 kb/d. November’s production is expected to decrease by 147 kb/d to 72,344 kb/d.
The projection is forecasting that December 2027 World W/O US oil production will be 73,148 kb/d, an increase of 657 kb/d from October 2025.
A Different Perspective on World Oil Production
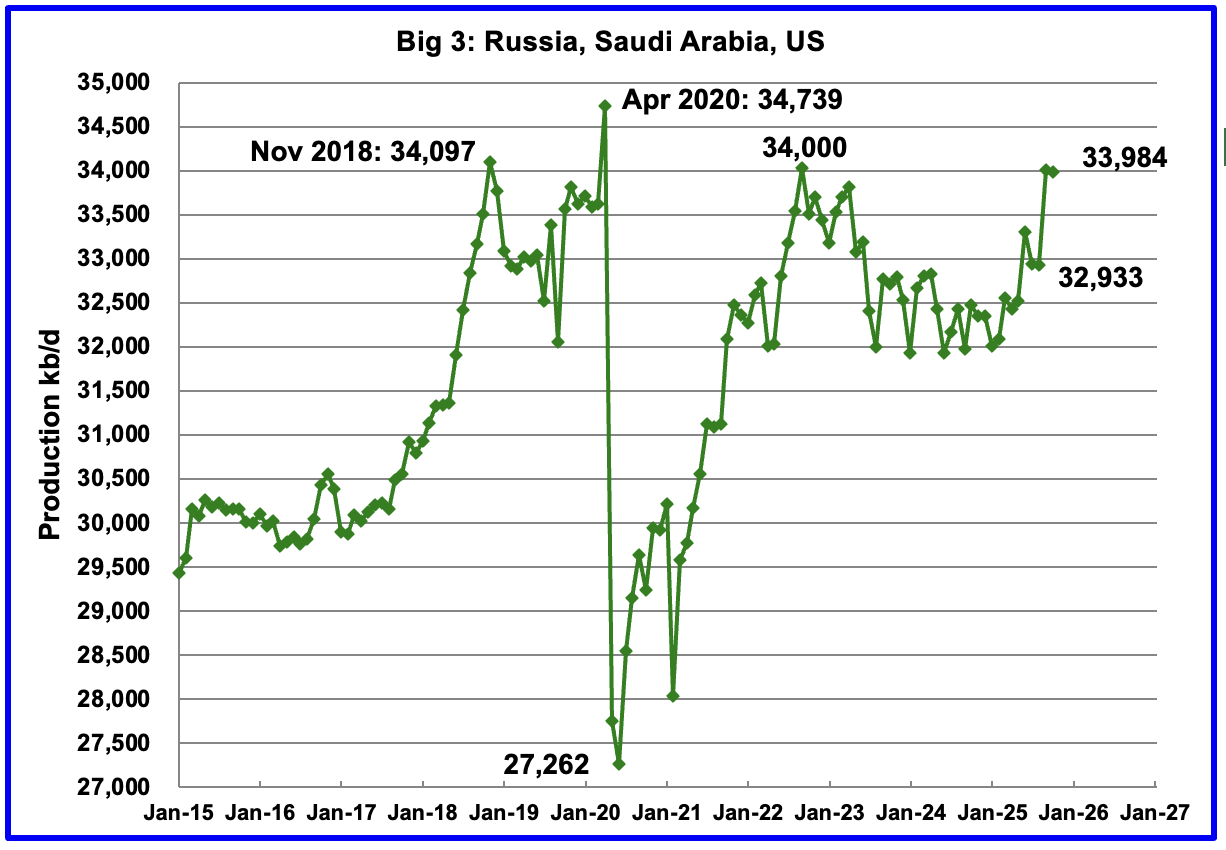
October’s Big 3 oil production decreased by 21 kb/d to 33,984 kb/d.
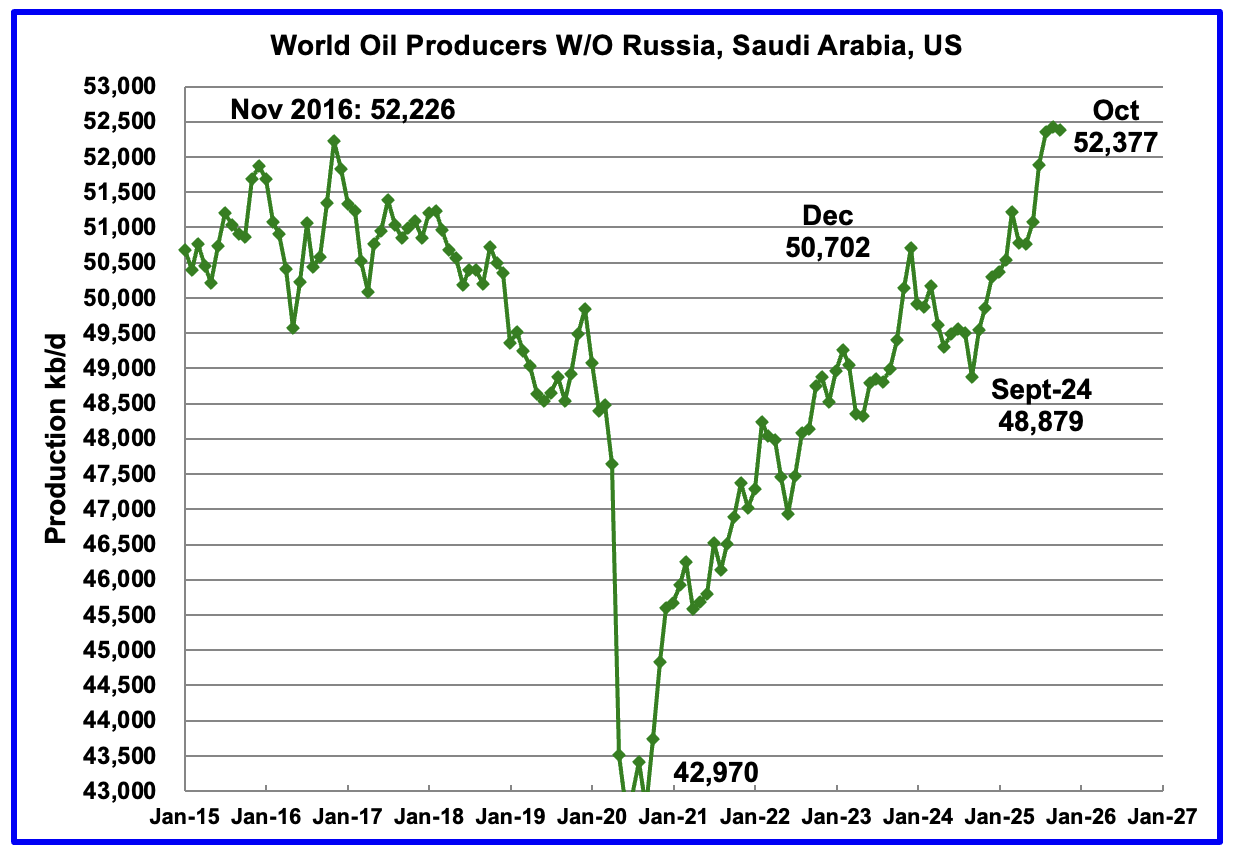
Production in the remaining countries has been slowly increasing since the September 2020 low of 42,970 kb/d. However production dropped in October 2025 by 46 kb/d to 52,377 kb/d.
Countries Expected to Grow Oil Production
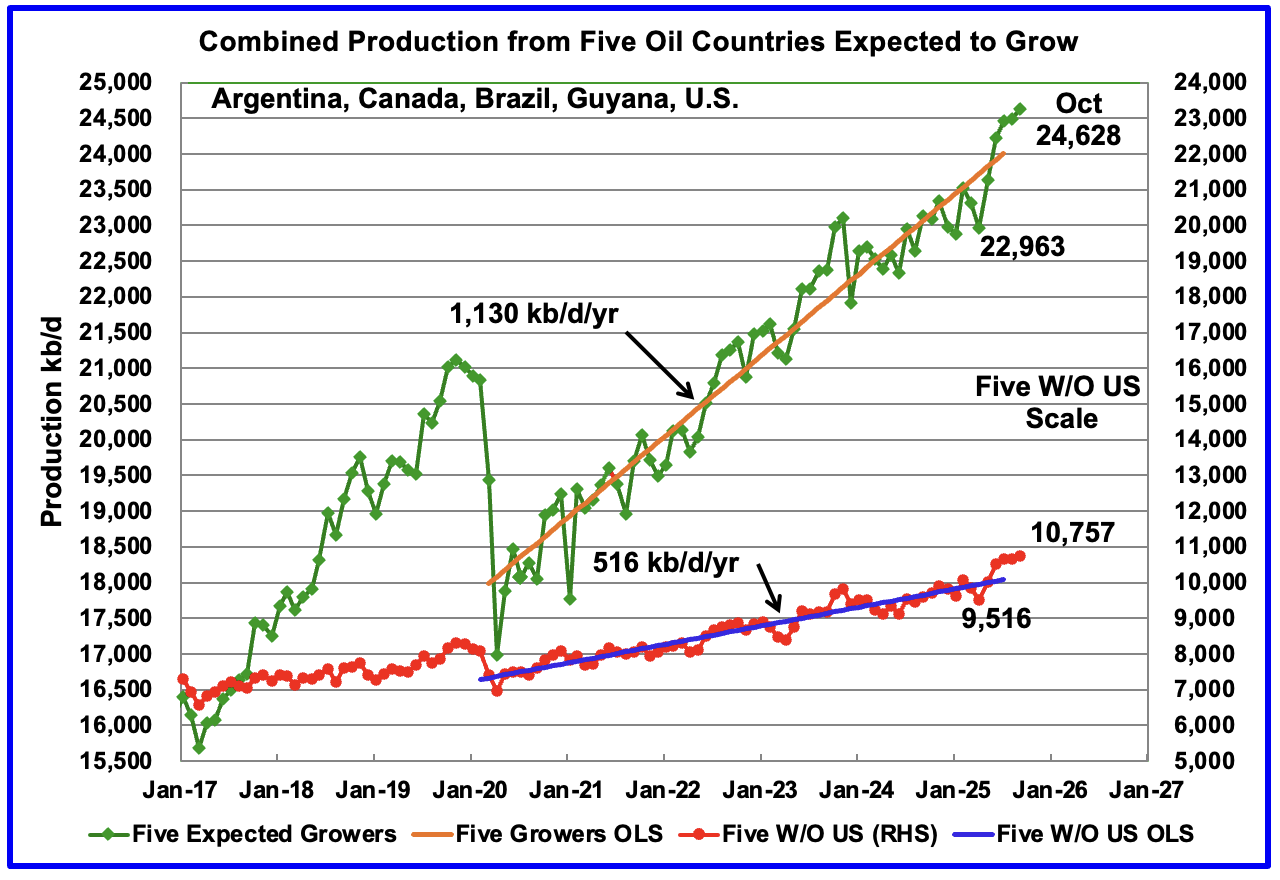
This chart shows the combined oil production from five Non-OPEC countries, Argentina, Brazil, Canada, Guyana and the U.S., whose oil production is expected to grow. These five countries are often cited by OPEC and the IEA for being capable of meeting the increasing World oil demand for next few years. For these five countries, production from April 2020 to July 2025 rose at an average rate of 1,130 kb/d/year as shown by the orange OLS line.
To show the impact of US growth over the past 5 years, U.S. production was removed from the five countries and that graph is shown in red. The production growth slope for the remaining four countries has been reduced by 614 kb/d/yr to 516 kb/d/yr.
October production has been added to the five growers chart, up by 140 kb/d to 24,628 kb/d. October’s production increase was a mix of small gains and declines. For the Five growers W/O U.S., October production rose by 107 kb/d to 10,757 kb/d.
November production for the five countries is expected to be down slightly.
Note: The OLS lines are updated to July. 2025
World Oil Countries Ranked by Production
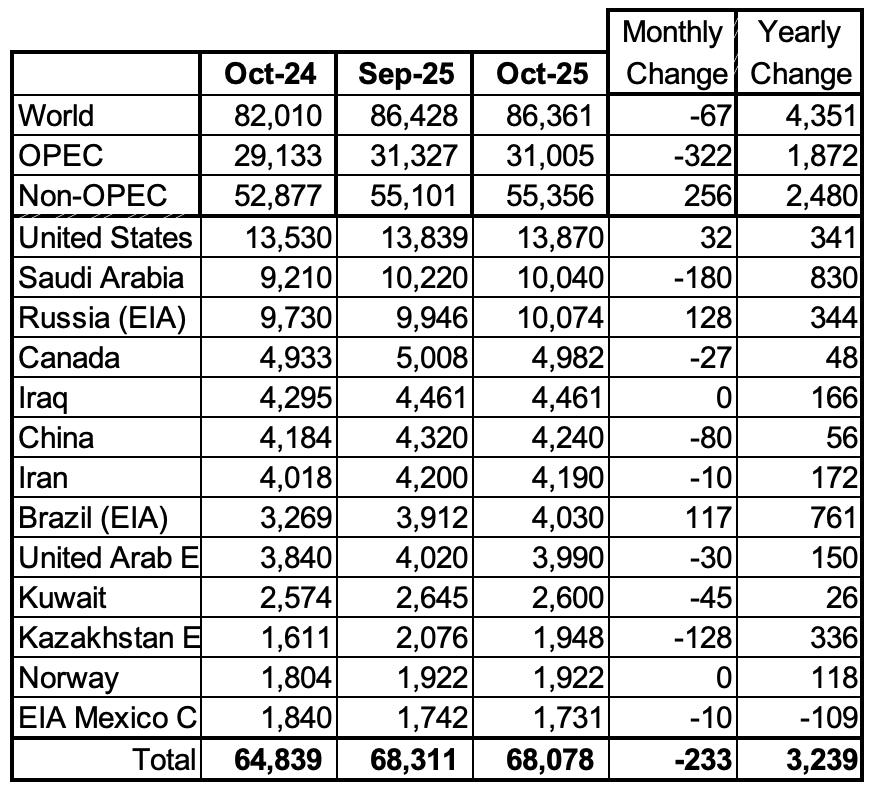
Above are listed the World’s 13th largest oil producing countries. In October 2025 these 13 countries produced 78.8% of the World’s oil. On a MoM basis, production decreased by 233 kb/d in these 13 countries while on a YOY basis production rose by 3,239 kb/d. Note the large YoY increases from Saudi Arabia and Brazil
October Non-OPEC Oil Production Charts

October’s Non-OPEC oil production increased by 255 kb/d to 55,356 kb/d. November is expected to drop by 295 kb/d to 55,161 kb/d.
Using data from the February 2026 STEO, a projection for Non-OPEC oil output was made for the period November 2025 to December 2027. (Red graph). Output is expected to grow by 364 kb/d from October 2025 to reach 55,720 kb/d in December 2027.

October’s Non-OPEC W/O US oil production increased by 224 kb/d to 41,486 kb/d. November’s production is projected to drop by 96 kb/d to 41,390 kb/d.
From October 2025 to December 2027, production in Non-OPEC countries W/O the U.S. is expected to increase by 1,023 to 42,509 kb/d.
Non-OPEC Oil Countries Ranked by Production
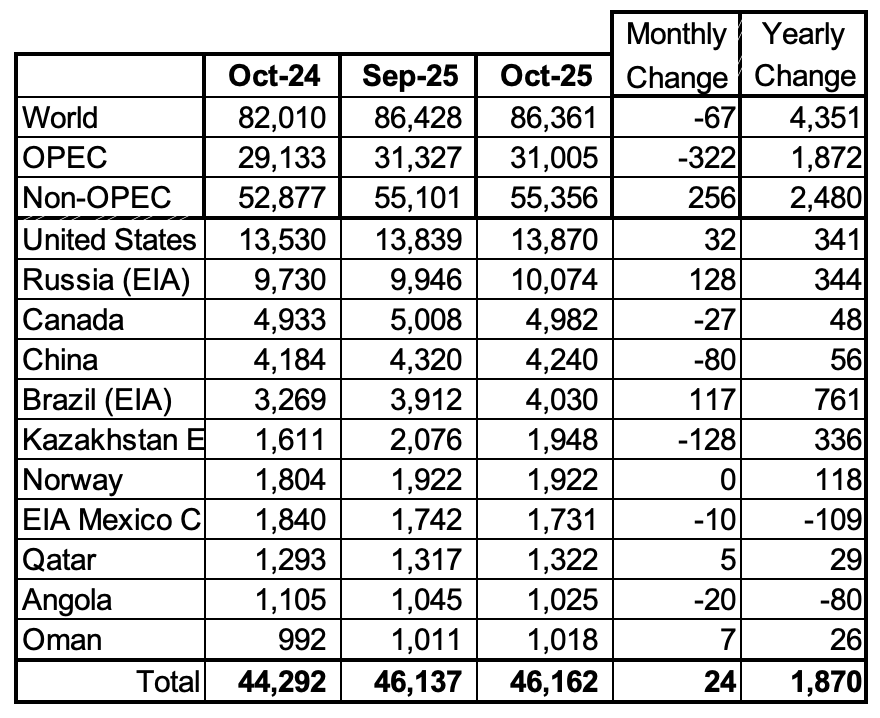
Listed above are the World’s 11 largest Non-OPEC producers. The original criteria for inclusion in the table was that all of the countries produced more than 1,000 kb/d.
October’s MoM production increased by 24 kb/d to 46,162 kb/d for these eleven Non-OPEC countries while as a whole the Non-OPEC countries saw a yearly production increase of 2,480 kb/d to 55,356 kb/d. Major yearly gains came from Brazil, Kazakhstan, Russia and the U.S.
In October 2025, these 11 countries produced 83.4% of all Non-OPEC oil.
Non-OPEC Country’s Oil Production Charts
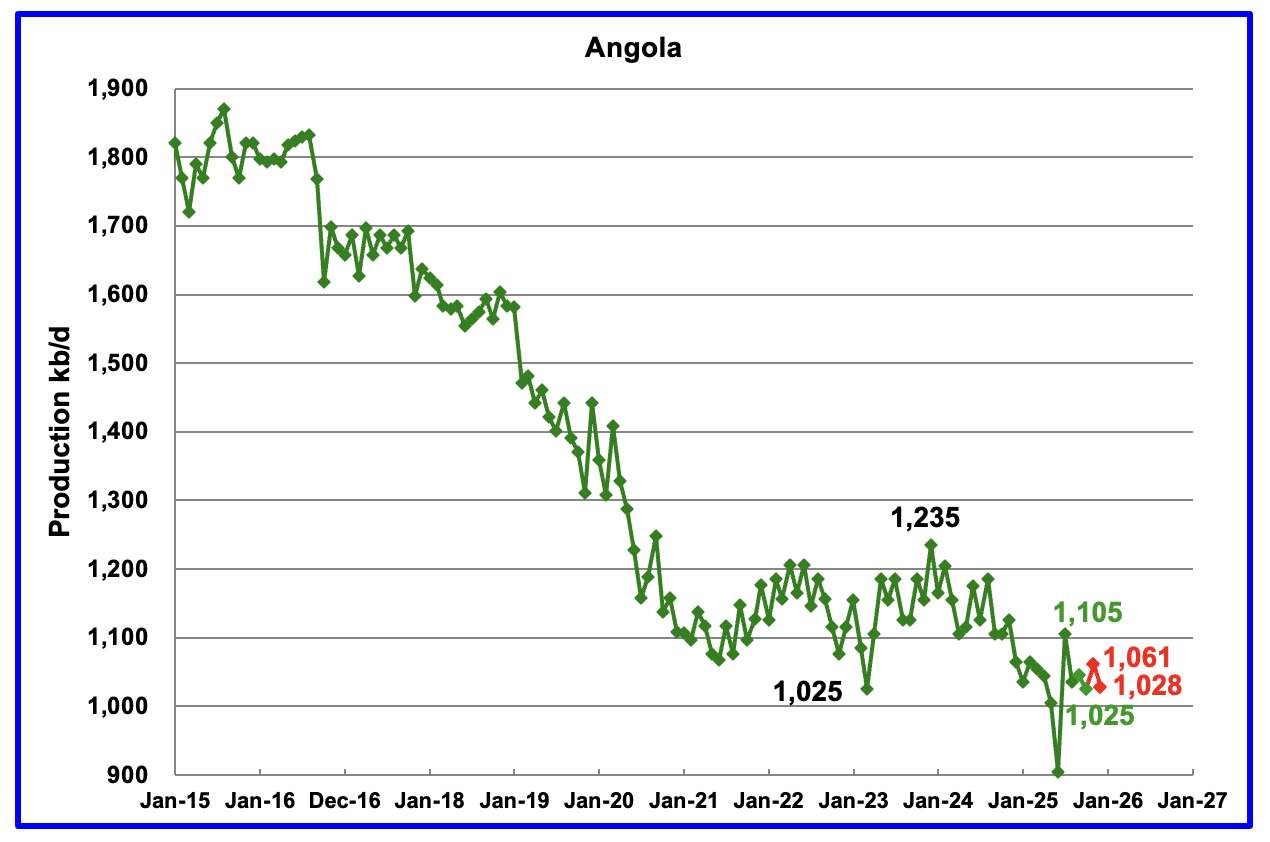
Angola’s October oil production dropped by 20 kb/d to 1,025 kb/d in the EIA’s report..
According to the National Agency for Petroleum, December’s production was 1,028 kb/d, red markers.
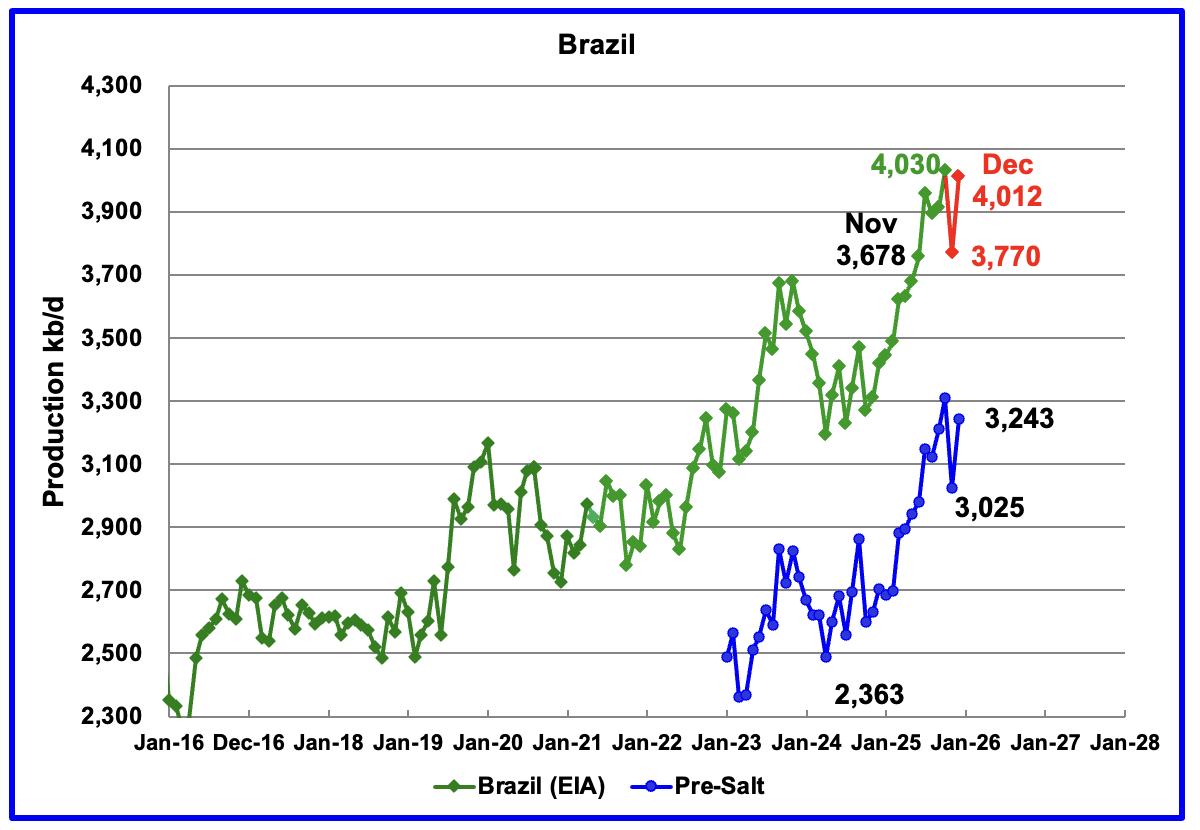
The EIA reported that Brazil’s October production rose by 117 kb/d to 4,030 kb/d, a new record high.
Brazil’s National Petroleum Association (BNPA) reported that production dropped in November to 3,770 kb/d. December production rebounded to 4,012 kb/d. Pre-Salt production was a major contributor to December’s rebound. Pre-salt production increased by 216 kb/d in December to 3,243 kb/d.
According to this article, the November Production drop was due to platform outages at offshore fields.
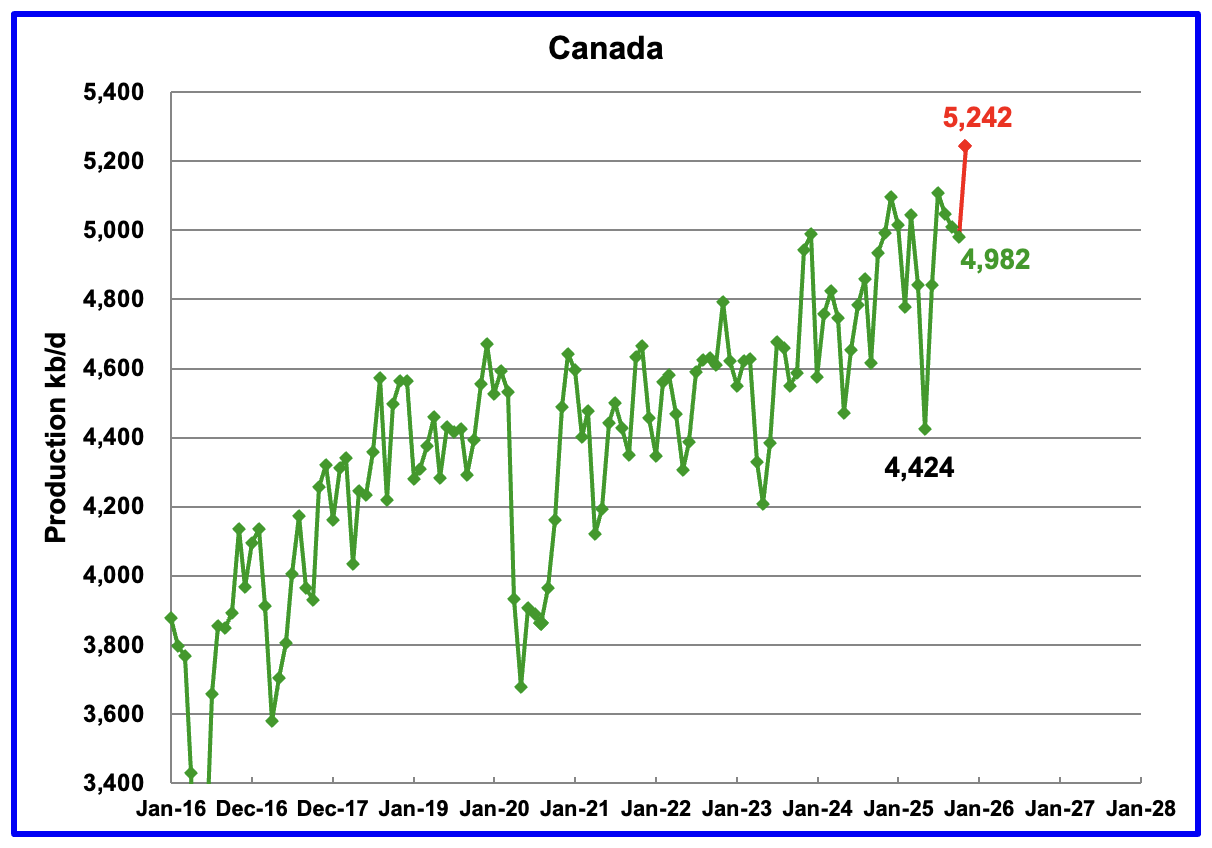
Canada’s oil production decreased by 27 kb/d in October to 4,982 kb/d.
A projection has been made for November production based on preliminary production provided by the Canada Energy Regulator (CER). November’s projected production rose to 5,242 kb/d, a new record high, red marker. The CER estimate contains some NGLs which have been removed from the projection. On average the EIA reduces the CER’s monthly production by 375 kb/d which was also done for the November estimate.
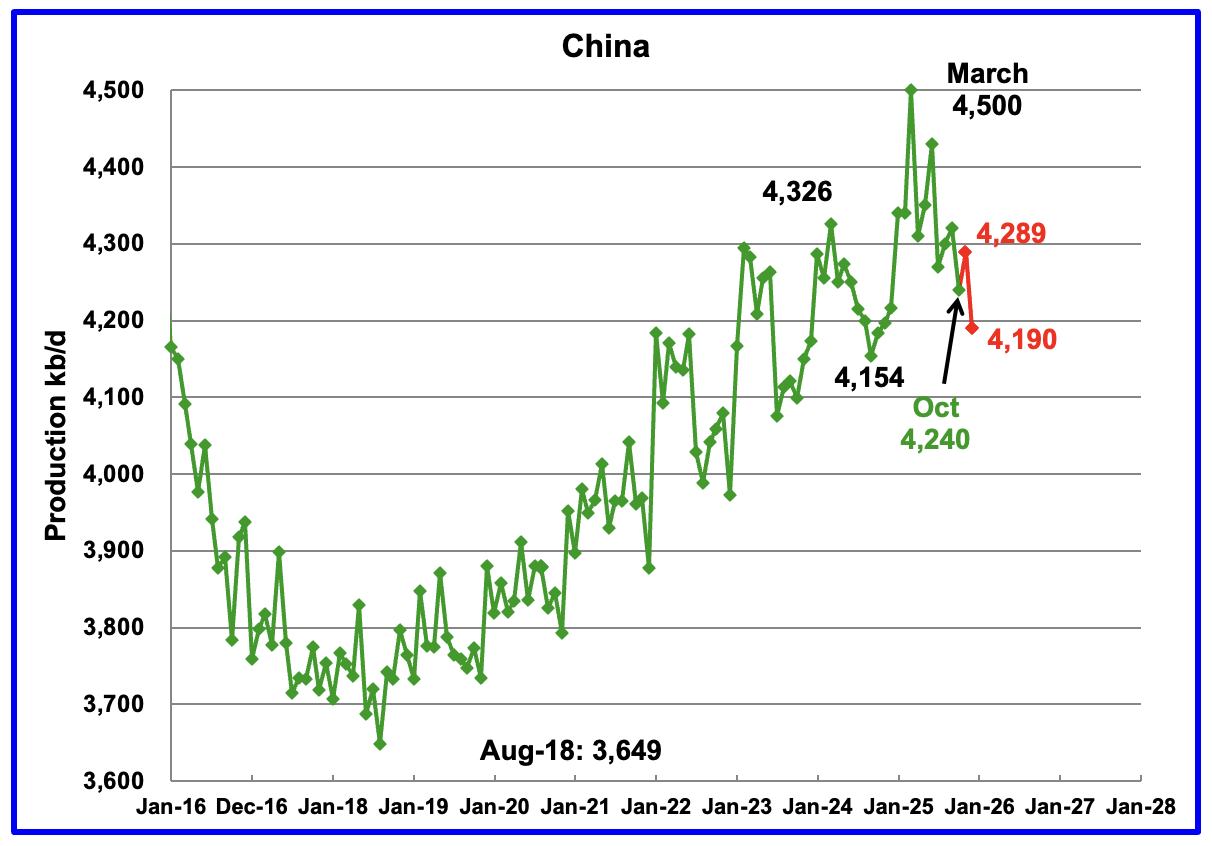
The EIA reported China’s October oil output dropped by 80 kb/d to 4,240 kb/d.
The China National Bureau of Statistics reported November production rose by 49 kb/d to 4,289 kb/d and then in December dropped to 4,190 kb/d.
On a YoY basis, China’s production increased by 56 kb/d from 4,184 kb/d.
Note the large drop of 310 kb/d from March 2025 to December 2025. That appears to be a record drop over those nine months.
However according to OPEC’s February MOMR: In the short term, additional infill drilling and EOR projects are expected to markedly slow the decline rates in legacy wells. Offshore projects, especially in Bohai Bay in northern China and the South China Sea, are expected to remain the main drivers of production growth, supported by recent E&P spending.
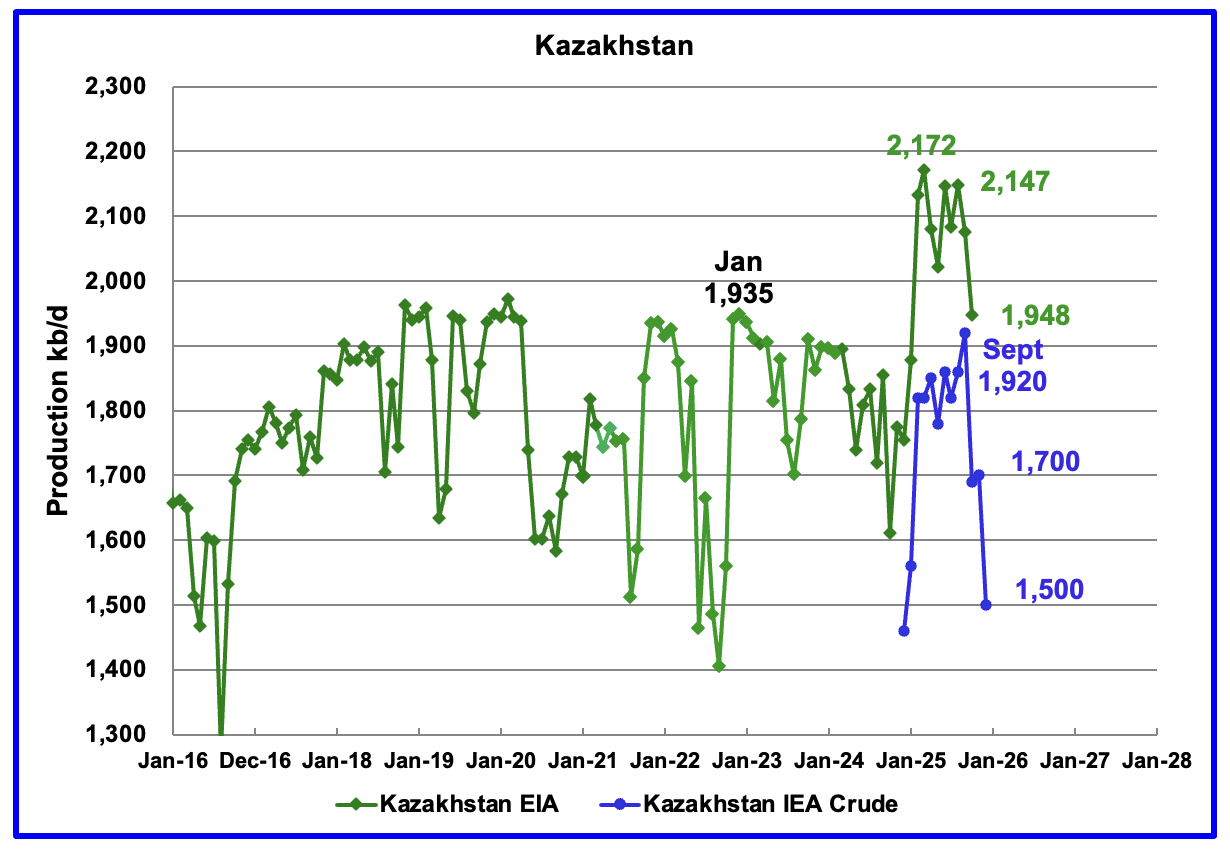
According to the EIA, Kazakhstan’s October oil output decreased by 128 kb/d to 1,948 kb/d.
Since Argus no longer reports OPEC + crude production, production data for Kazakhstan will now be taken from the monthly IEA reports. In November 2025 pre-salt crude production was 1,700 kb/d. The IEA’s January 2026 report stated December’s production dropped to 1,500 kb/d.
According to this Article: Four Opec+ producers plan to triple compensation cuts by June. Kazakhstan will make the deepest cuts.
“Kazakhstan will account for the largest share of the increase, with its cutbacks totalling 669,000 bpd by June, from 131,000 bpd in December. Baghdad, which frequently overproduces its quota within Opec+, will maintain cuts at a 100,000 bpd level by midyear.”
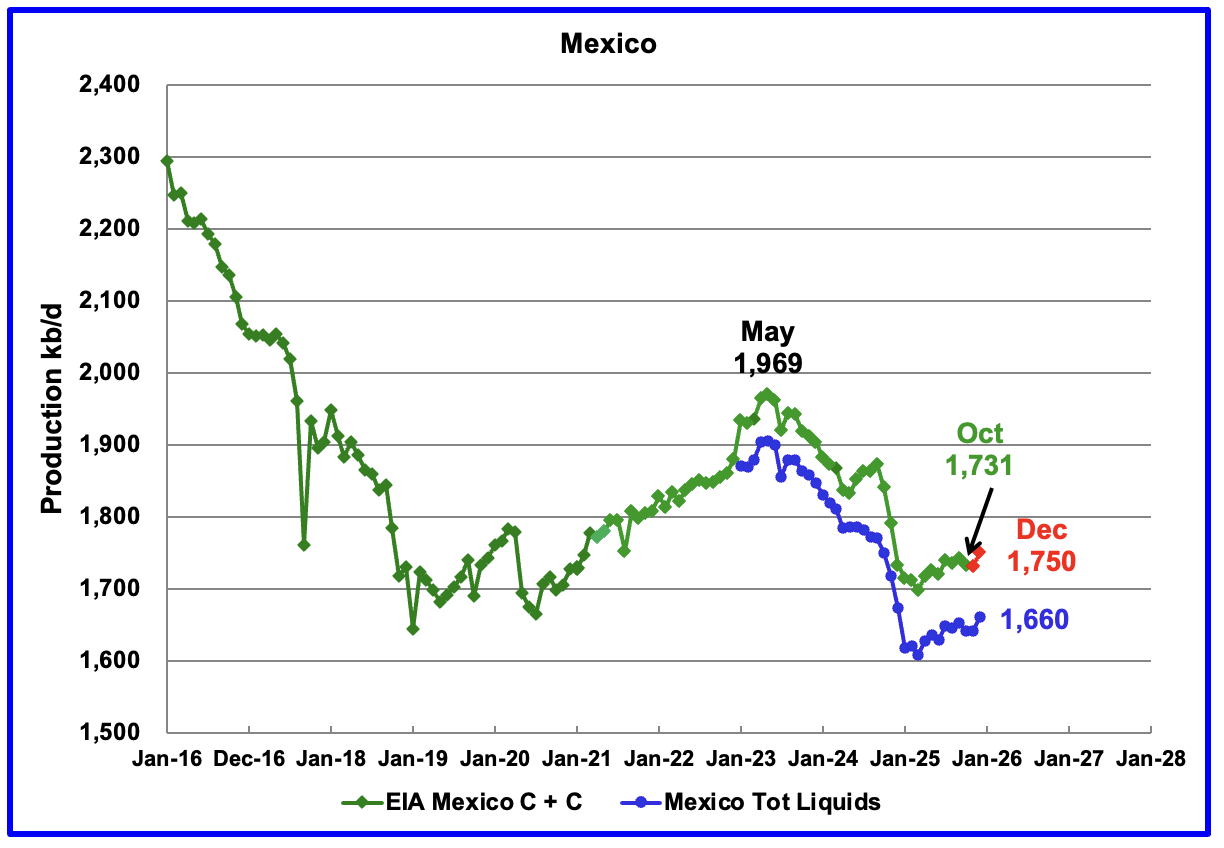
According to the EIA, Mexico’s October output dropped by 10 kb/d to 1,731 kb/d.
In June 2024, Pemex issued a new and modified oil production report for Heavy, Light and Extra Light oil. It is shown in blue in the chart and it appears that Mexico is not reporting condensate production when compared to the EIA report.
In earlier EIA reports, they would add close to 55 kb/d of condensate to the Pemex’s “Total Liquids” report. More recently the EIA has been adding 90 kb/d of condensate to Mexican production. For November and December production, 90 kb/d have been added to the Pemex report. December’s production is estimated to be close to 1,750 kb/d. Note that Mexico’s production, as reported by Pemex for the last four months has stabilized around 1,650 kb/d.
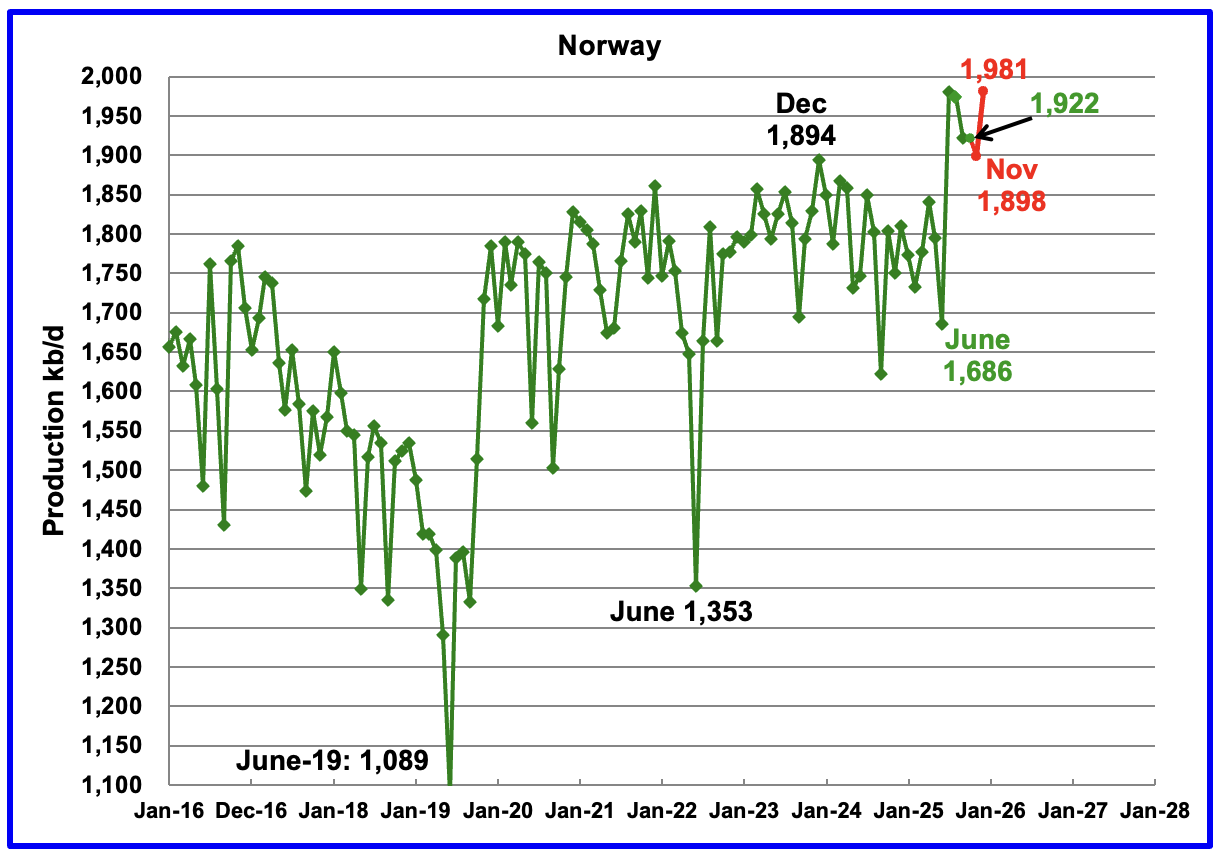
The EIA reported Norway’s October production was unchanged at 1,922 kb/d.
Separately, the Norway Petroleum Directorate (NPD) reported that December’s production rose to 1,981 kb/d, red markers.
The Norway Petroleum Directorship also reported that December’s oil production was 5.1 % above forecast.
According to OPEC’s December MOMR: “For the remainder of the year, output is expected to be underpinned by the Johan Castberg and Jotun FPSOs, complemented by strong contributions from Johan Sverdrup”
However this Article states that Johan Sverdrup output could fall between 10% to 20% this Year.
“Chief executive Anders Opedal said production could fall by more than 10% but remain below 20%, following a period in which the field delivered sustained growth to European oil supply. Exports from Johan Sverdrup averaged about 712,000 barrels a day last year, based on loading programs compiled by Bloomberg, underscoring the scale of the asset as it enters a new phase.”
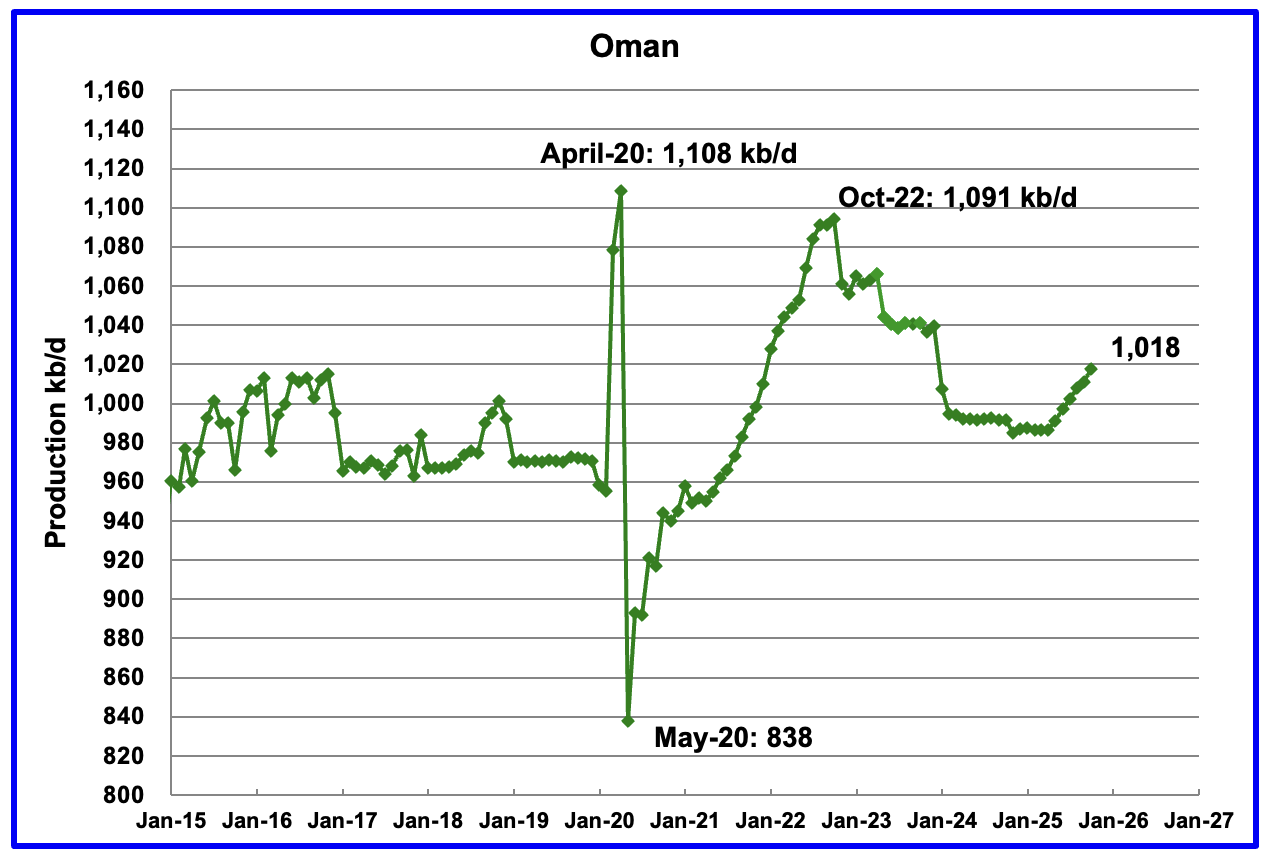
According to the EIA, October’s output rose by 7 kb/d to 1,018 kb/d and appears to have begun a budding growth phase. Previous production peaked in October 2022.
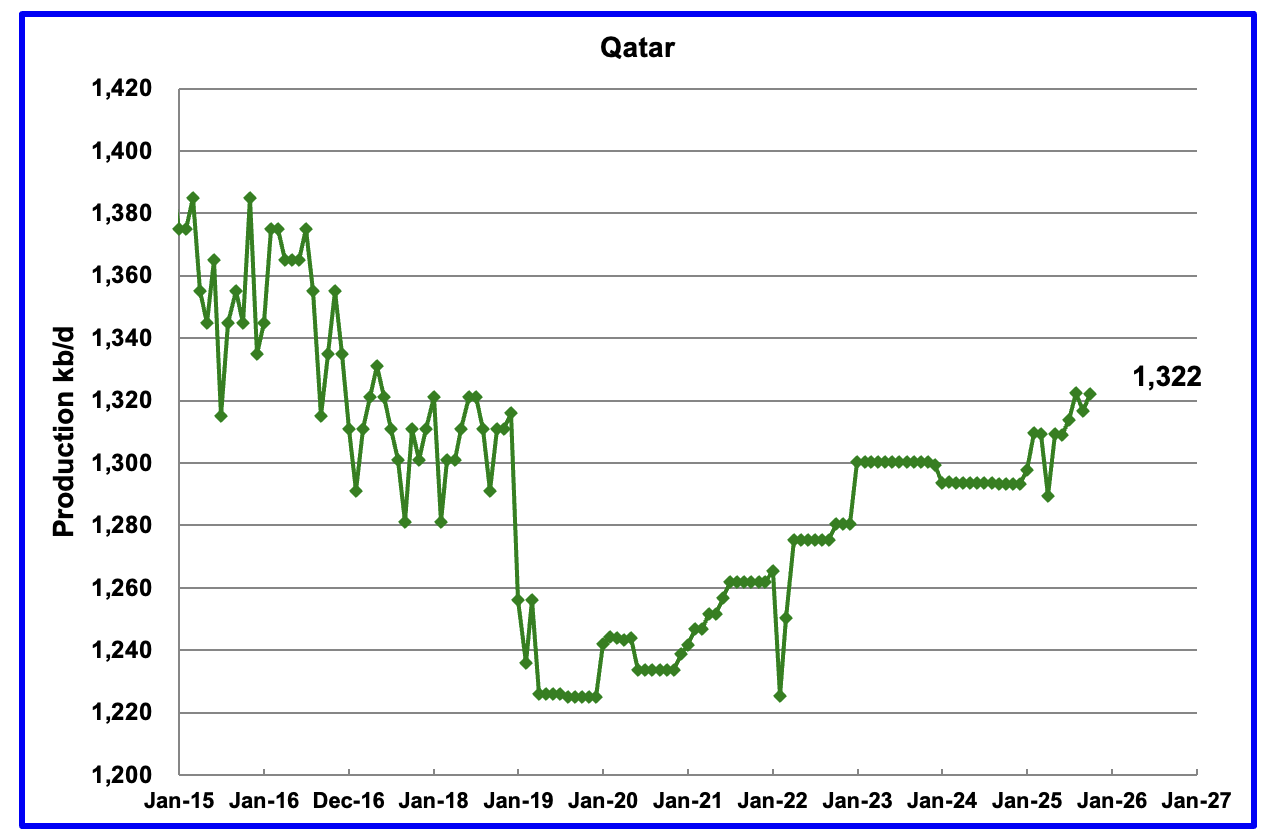
Qatar is now providing the EIA with monthly updated oil production back to January 2025. Qatar’s October output was reported to be 1,322 kb/d up 5 kb/d from September.
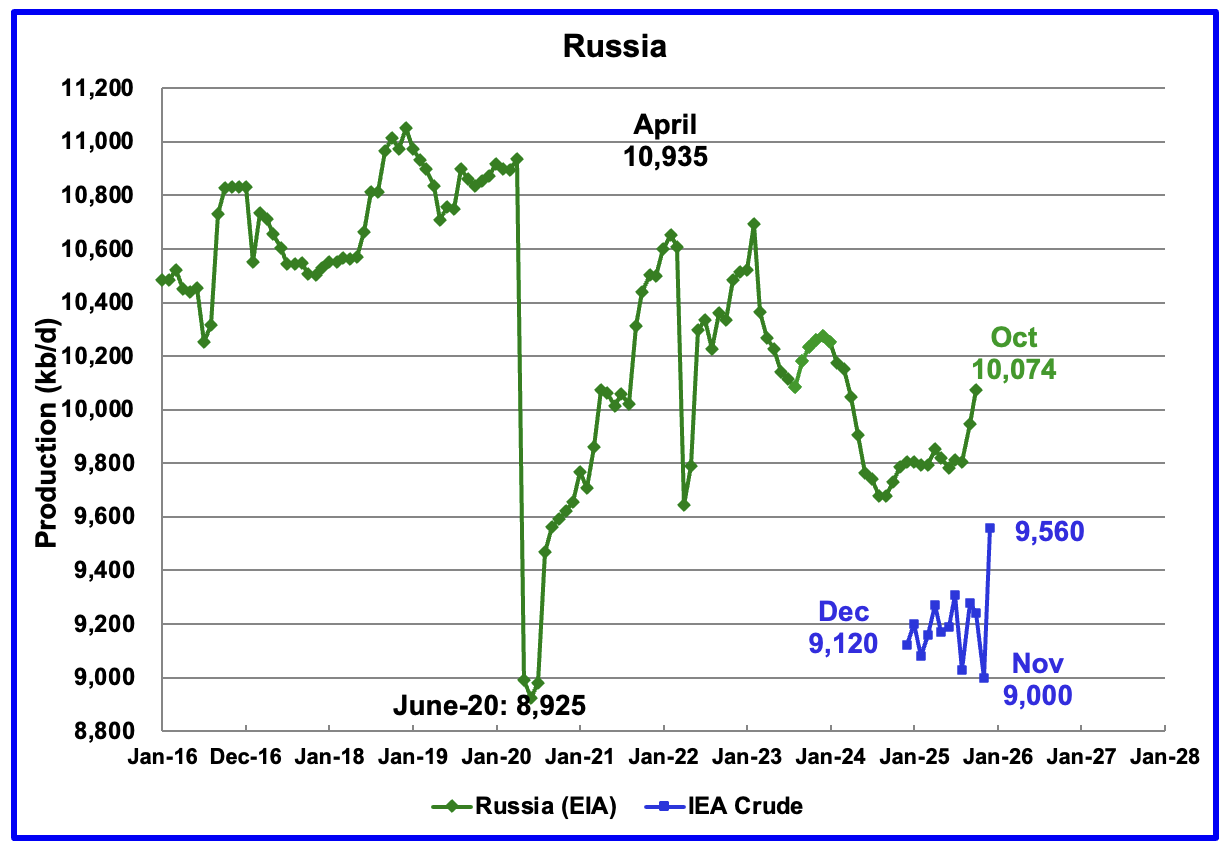
The EIA reported Russia’s October C + C production increased by 128 kb/d to 10,074 kb/d and was up by 271 kb/d from August 2025.
Up to August 2025 Argus Media used to report OPEC + crude production. That monthly report has now been discontinued. The above chart now also shows Russian production as reported by the IEA. It is difficult to assess the accuracy of the IEA report but over the last few months the IEA’s Russian production has been around 100 kb/d to 150 kb/d higher than Argus’ Media. The best that can be done at this time will be to compare the production trends between the EIA and the IEA. I think that Russian oil production continues to be a major state secret at this time because of the damage being caused by the heavy bombing to its related crude oil processing facilities.
According to the IEA’s January report, November crude production was 9,000 kb/d and then December production rose by 560 kb/d to 9,560 kb/d.
However according to this Article: Russia’s Crude Output in December Made Deep Plunge due to Ukrainian drone attacks.
“Russia’s crude oil production plunged by the most in 18 months in December, pincered by western sanctions that are causing the nation’s barrels to pile up at sea and a surge of Ukrainian drone attacks on its energy infrastructure.
Adding to the confusion is OPEC’s February MOMR. These are their production number for November to January, 9,377 kb/d, 9,304 kb/d and 9,246 kb/d respectively. No steep plunge in December, just a slow steady decline. Take your choice.
It is difficult to know what the real facts are regarding Russian oil production.
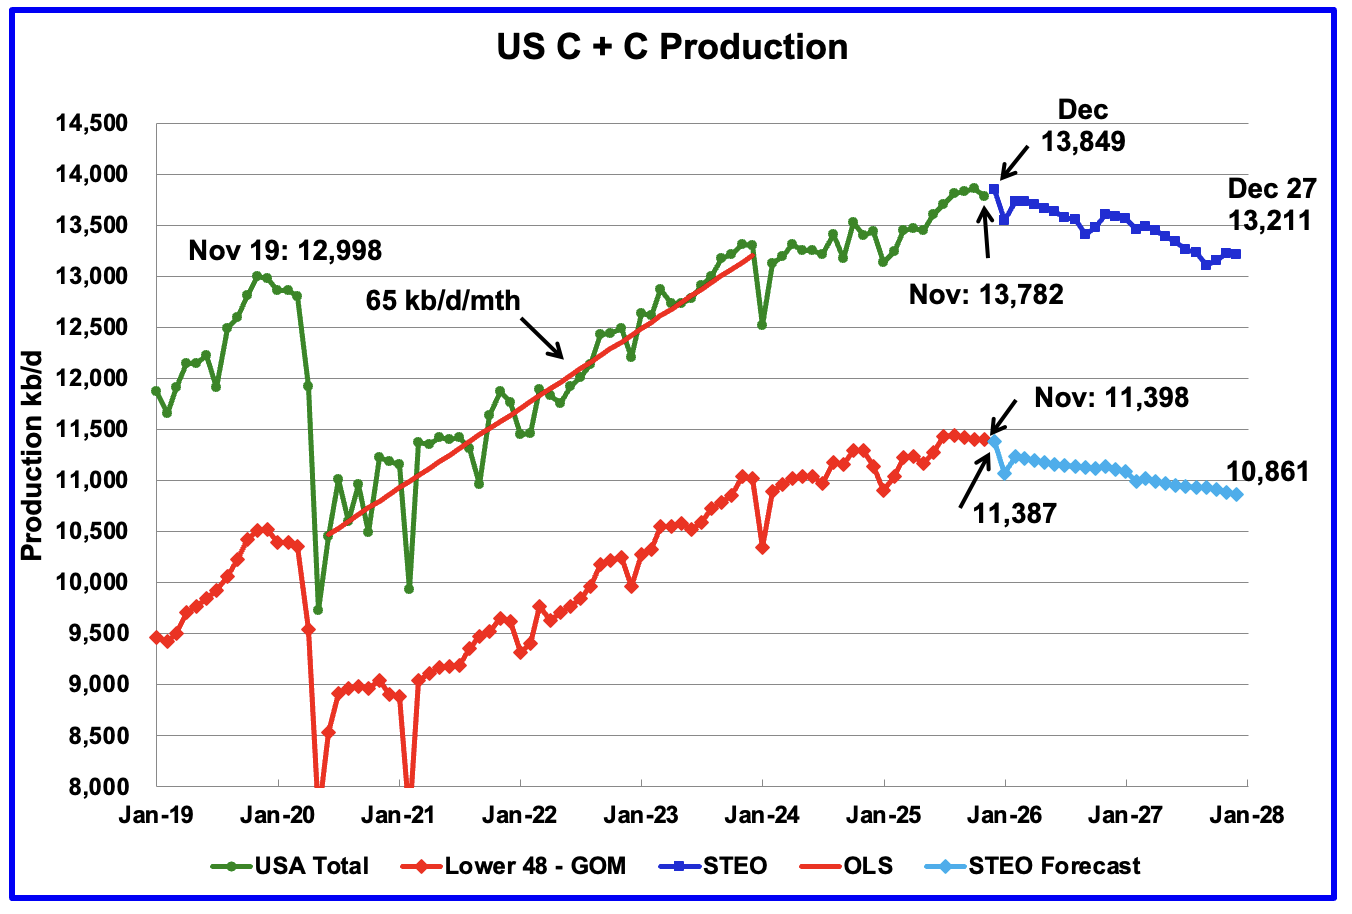
This US production chart up to November 2025 is the same as the one published last week in the US update. However the projected portions of the two production graphs have been updated according to the February 2026 STEO.
U.S. December projected production has been revised up by 13 kb/d to 13,849 kb/d.
Production in December 2027 is expected to be 13,211 kb/d. January’s drop to 13,545 kb/d reflects the severe storms that hit the mid US and the Permian basin.
Note production in the Onshore L48 essentially peaked in August 2025 at 11,440 kb/d. Production decline steepens starting in December 2025.
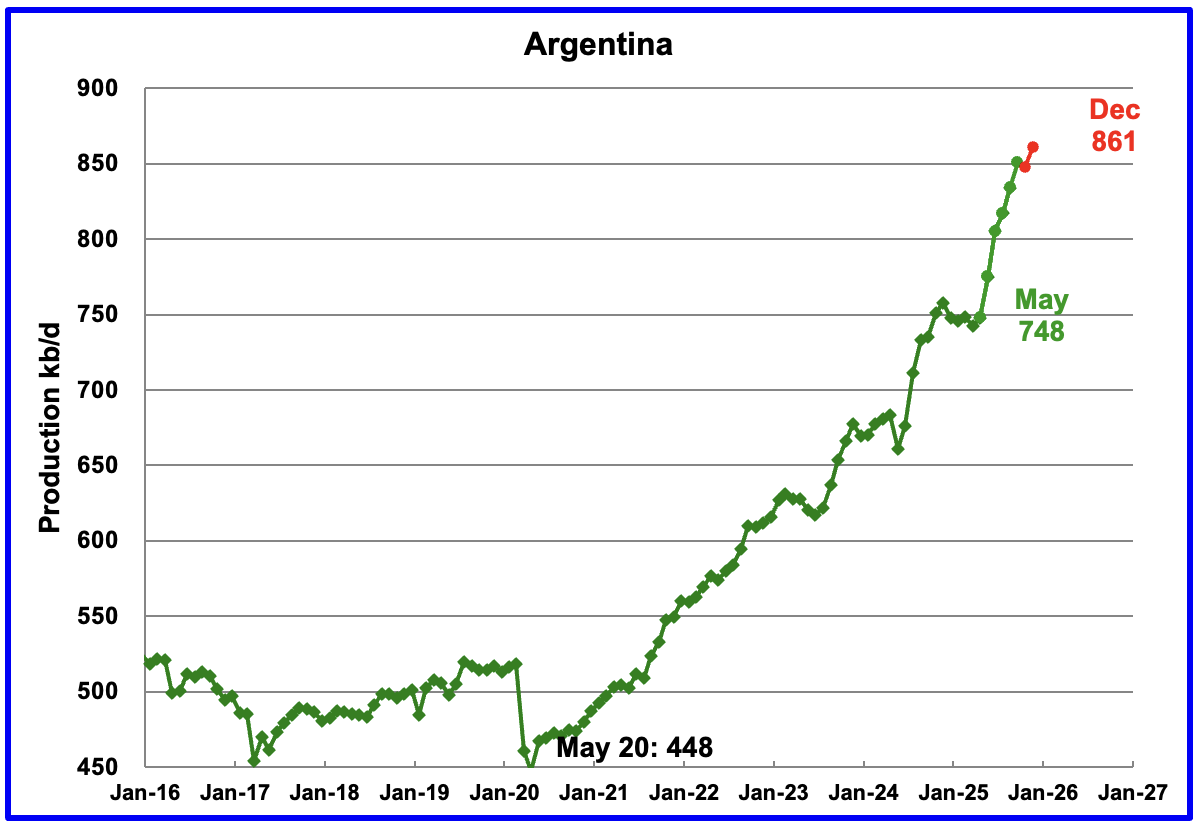
Production in Argentina rose by 13 kb/d in December to 861 kb/d. Vaca Muerta keeps on giving.
76 responses to “October World Oil Production Drops”
As always, excellent job!
To be honest, this is a bit like watching paint to dry, just very very slowly.
The recent peak was unexpected to me, have been following this since -05 or so but it´s C&C so the ratio also matters, quite a bit actually.
My question now, will Vaca Muerta, Orinoco revamped etc. cover Ghavar, Cantarell, Johan Sverdrup et. al. in a meaningful way? Maybe in a kWh/capita availible per year or any other metric?
Laplander
Thanks. Much appreciated.
I agree with your comment that watching these charts is like watching paint dry. I actually think it’s worse because it’s more like watching grass grow.
I think we need to keep our eye on all of the five growers. Four for growing and the US for flipping to the declining side of the ledger.
Ovi,
What do you think the effect on US C&C growth would be if prices went to, say, $120?
Nick
I really have no idea. Would those Tier 3 areas become economic.?
Ovi,
That certainly seems possible:
https://www.domesticoperating.com/blog/2025/09/28/u-s-shale-oil-costs-set-to-hit-95-breakeven-point-invest-now-with-domestic/
So, let’s say x number of barrels production makes a well worth doing at $60. If prices went to 120, wells that produce half x (assuming all else is equal) would become viable.
Any guess, from anyone, how that would affect drilling, completion and production?
NickG,
We would need to see sustained oil prices at over $100 per barrel. In the mean time well productivity per 1000 feet of lateral continues to decrease and this decreased productivity may accelerate as sweet spots run out of room. Of course I have been predicting $100 per barrel in 2015$ for about 11 years. I have changed my tune lately to $60 to $70 per barrel in 2025$. Future prices cannot be predicted.
Higher prices might be enough to maintain a plateau in tight oil output, perhaps for 5 years at most. In my view the peak in US C+C output is now in the past.
Thanks, Dennis,
I’ve always thought it would be helpful to create supply and demand curves for oil, ideally one set for short term elasticity and one for long term. Not an easy project, but even a first-order approximation seems likely to be helpful.
OTOH, maybe the scenarios that are most likely are all one can reasonably manage to even begin to forecast. Which is what you’ve done in your comment here.
Your comment here, and Ovi’s elsewhere that we’re pretty close to a peak in demand, both seem pretty reasonable to me.
That “watching the paint dry” feeling is a symptom of the short attention spans that media addiction causes. People watch TV “business news” with “experts” reading the tea leaves of daily random movements of the stock markets for years, and it reprograms their brains expect the world to change completely every 24 hours.
The reason this website prefers the Y axis to start near the current value instead of at zero is that it makes the tiny jiggles in the more or less flat output lines look significant. That fits the expectations of the modern information consumer.
That’s one of the great advantages of AI — it doesn’t get bored so quickly. I often use it to summarize long documents.
The number of low GOR black shale wells is approaching 50% in Vaca Muerta
https://www.linkedin.com/pulse/number-low-gor-black-shale-oil-wells-approaching-50-vaca-sheng-wu-wycyc/
somehow, Vaca Muerta shale oil claims to have the highest EROI, or smallest carbon footprint — these could be suspicious as they were done during the hey days of “NET ZERO” . Maybe it is related to the lower GOR and slower decline and higher EUR.
Likewise, the Vz heavy crude probably has the highest EROI too, and all because they are saline lacustrine sourced oil? Lots of geologists still think VM and Vz are marine, but they are all much heavier when generated and surprisingly easier to produce than Marine sourced, i.e. Canadian Oil sands has the lowest EROI and largest Carbon footprint.
Oilprice.com had an article claiming Vz heavy has 1,000 times lower EROI or higher Carbon footprint, the author must confused with
MBO” with “Million”.
Ovi
September 2025 could be the new World Peak Oil at 86,428 kb/d for the next few years and possibly longer.
Could be, it all hinges on two countries.
A peace deal in Russia would allow Russian oil to be sold on the open market at market rates. This would push up oil prices as at the moment millions of barrels are being sold cheaply undercutting other suppliers.
Iran, if there is no deal and the U.S. tries to remove the murderers in power there then Iranian oil could be off the market for a while.
No other country production is increasing or decreasing that much in a year.
https://oilprice.com/Latest-Energy-News/World-News/Ukrainian-Drone-Strike-Halts-Major-Russian-Refinery-in-Volgograd.html
Iver
What may be the bigger issue is oil demand. There is already a 1 Mb/d to 2Mb/d excess supply. Also OPEC will make some statement in Early March regarding whether to hold or add production. Very complicated situation.
Along with what Ovi said, global demand is pretty stagnant. Therefore the oil price is low, even without full Russian, Venez, Iranian production. Can’t blame the relatively tame demand on recession. In 2025 global GDP was 3.2% higher than 2024.
ICE’s worldwide have gradually become more efficient, and in some countries (like China at over 50%) electric vehicles are no longer a trivial factor.
Hickory, what the hell does US immigration have to do with global oil supply?
Honestly, you liberals and your obsession with fascist police forces.
Careful Kleiber….we don’t want to confuse the voters even more than they already are. 😉
Many still use ‘God’ as a proxy for goodness, not realizing that the one is an autocratic franchise
and that the other is actual behavior to aspire to.
Ovi
Global oil consumption grew by about 1.2 mb/d in 2024 and in 2025. So not stagnant.
Global strategic reserves are growing taking advantage of low prices but the U.S. is way down on where it should be. It could increase stock by 400 million barrels.
You could do a graph of all the countries in decline over the last 10 years it would give us a idea of how much the growing countries need to make up.
Iver,
Consumption of refined petroleum liquids increased by 1.9 Mbpd from 2019 to 2024, under 500 kbpd. That is pretty anemic growth. Data from EIA.
https://www.eia.gov/international/data/world/petroleum-and-other-liquids/annual-petroleum-and-other-liquids-production?pd=5&p=0000000000000000000000000000000000000000000000g&u=0&f=A&v=mapbubble&a=-&i=none&vo=value&t=C&g=none&l=249–249&s=94694400000&e=1704067200000
Dennis trust you to include the 2 years of Covid when millions lost their jobs and debt and bankruptcies skyrocketed.
Fact is global oil production is at record levels and most of it is being used.
Iver,
The growth recently is a rebound from very low levels of consumption during the pandemic. From 2010 to 2017 the average annual rate of growth for World consumption of petroleum products was 1524 kb/d. From 2017 to 2024 the average annual rate of growth of world consumption of petroleum products was 369 kb/d. If we look longer term, from 1995 to 2009 World annual consumption of petroleum products increased at an average annual rate of 1.7% and from 2010 to 2024 the average annual rate of increase was 0.9%. From 2017 to 2024 the average annual growth rate for World consumption of petroleum products was 0.4%.
From 1985 to 2016 the average annual rate of increase for World petroleum product consumption was 1.5%. From 2017 to 2024 the average annual rate of increase was 0.4%, if we drop the pandemic years of 2020 and 2021 from the 2017-2024 data set the growth rate is lower, 0.3%. It is not valid to drop data, so 0.4% is the proper estimate.
In kb/d, the average annual growth rate from 1985 to 2016 was 1168 kb/d for World petroleum product consumption vs 369 kb/d from 2017-2024, about a factor of 3 difference.
Production is indeed at record levels and is outpacing consumption, that is the reason oil prices are quite low, about $51/b for average Brent 2025 price in 2015 US$. In 2014 the average Brent price in 2015$ was $99/b. For the most recent 12 months the average World output of C+C is 83952 kb/d based on the latest EIA data, this new record for annual output is about 990 kb/d above the Feb 2019 TTMA of 82962 kb/d. In 7 years we see a pretty small annual rate of increase of about 141 kb/d vs an average annual rate of increase in World C+C output from 1985 to 2018 of about 834 kb/d (about a factor of 6 larger in the earlier period.)
Dennis global oil consumption is increasing more slowly but why. Fact is the oil industry is using up more of its own production, such as the vast fleet of trucks involved in tight oil.
There is in fact less good energy to produce real good life improving growth. Coal seams are getting thinner and needing more energy to extract.
GDP is a mindless metric of wealth, anyone who thinks we are getting richer because GDP is increasing needs to go back to economics junior school.
All the missiles, shells and bullets count towards GDP.
https://en.wikipedia.org/wiki/List_of_military_aid_to_Ukraine_during_the_Russo-Ukrainian_war
But nobody is counting the negative GDP
https://www.abc.net.au/news/2022-03-09/ukraine-photos-ruins-homes-damaged-russian-invasion/100894080
There is no distinction between the GDP of thousands of prosthetics limbs made for people who has had their arm or leg blown off. And the GDP of an electric tram getting people to work.
There is no differentiation between healthy food and food that makes people obese.
The GDP of producing a bus is much less than a high tech missile. A missile fired from a launcher does not use much oil, a bus will use far more over time.
Globally we have past peak available net energy. The answer should be to power down. Instead people are through violence trying to get the energy they are lacking.
India/Pakistan, Sudan, Libya. Central African Republic. Venezuela, and on and on.
Iver,
It is correct that energy is used to produce energy and also true that economic output is far from a perfect measure. Stuff that is produced for doing harm has a very long history and unhealthy food is also not something new. Note that consumption of oil by the oil industry still counts as consumption, so this does not explain a reduced consumption growth rate. The fact is that the growth in oil consumption is slower than earlier periods, eventually this growth may slow to zero and will eventually become negative as it must after oil output peaks which may be now or in 4 years or so.
Coal seams are getting thinner and deeper which will make coal a more expensive energy source. As energy becomes more expensive it will be used more efficiently and less will be wasted. Coal and oil will be replaced with natural gas, solar, wind, geothermal and nuclear power as energy sources as coal and oil deplete and become more expensive than alternative energy sources.
Coal consumption for electricity generation has fallen by about half in the the industrial world outside China in the last 20 years. The fleets are rapidly aging and only survive by postponing investment, especially in North America.
Most global coal demand now comes from China. Electricity demand has about doubled in China since 2015, so governments there have scrambled to add all sorts of generation. But the industry is already suffering from overcapacity.
Dennis
The reason global oil consumption growth is slowing down is because people can’t afford it as easily as before.
Gas prices have been increasing and that’s nothing to do with Russia. Local supply has been used up and expensive LNG has to be imported.
Expensive gas means people have less to spend on other things, ironically expensive gas boosts gdp at the expense of other essentials. GDP being a mix of all things, so if non essentials drop in price inflation does not reflect how badly poorer people are.
You are wrong about food, all these high additives foods is a relative new phenomenon obesity rates, heart disease, cancer rates have sky rocketed since the 50s. Do some research.
Do you know what military expenditure is now?
https://www.sipri.org/media/press-release/2025/unprecedented-rise-global-military-expenditure-european-and-middle-east-spending-surges
In 2026 it will be just short of 3,000 billion. Enough to build 9 million high quality homes with solar panels and heat pumps.
This is what I mean when scum politicians and their lackey economists talk about GDP. it suits them to deceive people.
Higher and higher taxes are failing to repair crumbling infrastructure and tackle ever increasing sickness rates.
Only the rich can afford really healthy food. Most people don’t know what healthy food is.
Everyone I know is working more and struggling more.
Iver,
I agree there unhealthy additives in food, as to cancer rates, heart disease, etc. people live longer today on average than 100s of years ago, health care imaging reveals disease that was unreported many years ago (and only a small percentage of deaths had autopsy performed) the cause of death was typically old age. So your “research” on cancer rates, heart disease rates, etc probably tells us little about actual rates in humans over long periods (say the past 500 years or so). People have long struggled, today people may complain more than in the past and social media and smart phones lead to much sharing of struggles that was less commonplace 50 years ago.
The world changes people produce and spend on what they believe is best and I think they should have the freedom to do so. We do not live in a perfect world and this has always been so.
For the World, military expenditures were 2.5% of GDP in 2024, this is a decrease compared to 1982(4.3%) or 1962 (6.1%), further in the past it might have been higher or lower (no data). See https://data.worldbank.org/indicator/MS.MIL.XPND.GD.ZS
Spending on infrastructure comes down to who we elect to represent us in the UK or US, if we want better infrastructure we have to pay higher taxes and everyone wants the infrastructure, but not higher taxes, it is a choice we have collectively made.
Kleiber,
I know you are not a fan of fascists, but some are not aware, so you may have needed a smiley face to clarify your POV. I love ice in my tea in the summer. Fascists not so much.
ICE=internal combustion engine, when discussing use of oil to power transport.
Oh shit, Kleiber. You are now in deep doo-doo. You assumed people on POB that typically always think, and write, only in political terms, call Americans nazis, pedophiles, criminals, convicted felons (over values used in a financial statement!) etc. etc., can all of a sudden change directions and use the term ICE when discussing energy/oil.
I made the same mistake, with Nick over a week ago, and ICE, also relative to China. Its not a coincidence. Don’t be offended by brave soles who anonymously call you names because they do not agree with your political idealism. Its just POB.
Appalachia Basin Study: file:///C:/Users/asala/OneDrive/Documents/Peak%20Production/Articles%20by%20Topic/Marcellus/Detring%20Energy%20Advisors%20-%20Appalachia%20Region%20Study%201Q%202026.pdf
Paoil,
Your link does not work. It looks like it may be a link to something on your computer.
PA oil
I found this, but may not be what you intended.
https://detring.com/wp-content/uploads/2025/11/Westmoreland-Gas-Appalachia-Operated-Wellbore-Only-Opportunity-Q4-2025.pdf
Also found this from detring slides 38 and 39 on appalachian basin
https://www.linkedin.com/posts/detring-%26-associates-llc_detring-energy-advisors-market-update-activity-7194078655029915651-IcSP?utm_source=share&utm_medium=member_desktop&rcm=ACoAABDV_wMB3QBPTlgD0zpWSJp3xTFeAV0uqvA
Rig Report for the Week Ending February 13
The rig count drop that started in early April 2025 when 450 rigs were operating dropped this week. Drilling continues at a steady rate of 365 ± 5 rigs per week since August 2025 and WTI holding in the lower $60s/b.
– US Hz oil rigs dropped by 4 to 363, down 87 since April 2025 when it was 450. It was also up 1 rig from the low of 362 first reached in the week ending August 1. The rig count is down 19% since April 2025.
– New Mexico Permian added 1 rig to 92. Lea added 2 to 61 while Eddy dropped 1 rig to 31.
– Texas dropped 4 to 162. Midland and Martin were unchanged 23 and 25 respectively. The drop of 4 came from 3 other counties. Reeves dropped 2 to 9, Loving dropped 1 to 16 and Reagan dropped 1 to 7.
– Eagle Ford was unchanged at 29.
– NG Hz rigs rose by 2 to 116.
A Rig
Frac Spread Report for the Week Ending February 13
The frac spread count rose by 8 to 153. The increase of eight is a partial rebound from the drop of 15 two weeks ago that may have been weather related. From one year ago, it is down by 50 spreads and is down by 62 since March 28.
A frac
A very interesting metric in my view, since fracs are the last stage, kind of at least, before production starts so they are tremendously important in my view, since without them the methane extraction would decrease quite a lot.
And currently, LNG and NG has a very important role worldwide so a very interesting metric to follow.
Perhaps even more so than C&C?
Laplander
Note that the Frac spread is for C + C and NG. The report does not provide any information regarding the split between the two,
Paoil,
the upload file does not work.
Marcellus is amazing, it is now producing real oil in Ohio
https://www.dailymail.co.uk/sciencetech/article-15559313/Consciousness-exists-death-study-dying.html
Ron may like this.
New study consciousness doesn’t end when you die?
Was a significant topic in his book “Blind to the Blatantly Obvious”
Andre,
IIRC, the basic question is about natural vs supernatural: is there an element of consciousness and memories that exists without the brain? That’s independent of the brain?
I don’t see anything in this article that suggests that there is. It seems to be simply a redefinition of the timing of biological death.
I don’t believe in life after to death. But am open to being wrong.
I read Ron’s book and he talks about this.
Thought he might be interested.
I don’t know him personally, so this is only way to communicate.
That’s it
Smart dumb article above: “But experts are beginning to challenge this view – arguing that consciousness can persist even when the brain stops working.”
No question. I see it happening every day. Sometimes I even try it myself. Terrific breakthrough!
https://www.youtube.com/watch?v=e_MF1OKyNy8
5 minutes
Israel to receive shipments of oil from Venezuela.
Epstein! Epstein!
https://www.msn.com/en-au/news/australia/inside-the-400-billion-copper-battle-that-could-reshape-americas-future/ar-AA1WmsRF
Massive copper reserve being fought over in Alaska,
You Welcome,
Dr. Copper
https://mishtalk.com/economics/trump-orders-pentagon-to-buy-coal-its-an-energy-emergency/
Trump orders Pentagon to buy more coal!
Nullified orders.
The Putin regime is done. Their military is spent, European arms are double the rate from last year. Ukrainians have 200,000 troops on the Russian Border. Once the invasion commences, its over for Russia. Their lines will be pulled northeast/southeast. His asset in Washington helpless.
Fwiw, the Trump administration has added 1000000 more illegals over 2024. Excellent PR bs.
Biden=740000 deportations a month
Trump 480000 deportations a month.
Never trust border security numbers. A bunch of liars.
I dunno about “done”, but it’s interesting that Putin is shutting down the pro-war Z opposition bloggers on Telegram. They were the de facto backers of the Prigozhin putsch attempt, so Putin has always been wary of them.
For the last couple of months the Z bloggers have been increasingly critical of the Russian war effort. The situation on the ground is still a stalemate, but the Ukrainian drones are killing an awful lot of Russian soldiers, with claims of 20+ to 1 casualty rates, and Ukraine may even be turning the tide of creeping Russian advances. Meanwhile Russian air defense looks worse by the minute, and Ukraine is now hitting Russian infrastructure, especially oil and electricity.
So things do seem to be getting tricky for Putin. His American trump card is increasingly erratic. He can’t afford to have competent military leaders around him, because they are coup threats. On the other hand, the incompetence of his generals undermines his legitimacy. So Telegram has to go.
“ He can’t afford to have competent military leaders around him, because they are coup threats. On the other hand, the incompetence of his generals undermines his legitimacy.”
The current US president has the same problem. A classic problem of authoritarian leaders.
Only seven gasoline cars were sold in Norway in January-
https://www.theguardian.com/world/2026/feb/06/only-seven-petrol-powered-cars-sold-in-norway-in-january
“ Norway has long led the uptake of electric vehicles, but other countries are gaining pace. Denmark has witnessed explosive growth, with BEV sales soaring from 2% to 68% in the last decade. BEV market share has also surpassed 33% in the Netherlands, Finland, Belgium and Sweden.
Small and wealthy northern nations have led Europe’s transition to cleaner transport, but they are being joined by populous emerging markets such as China and India. Data published last month shows that Turkey has also caught up with the EU in its adoption rate for BEVs, and in absolute terms its electric market is bigger than Norway’s.
China’s sales of electric cars, including hybrids, have surpassed those of internal combustion engine cars.”
Nick G,
Are you sure you didn’t mean immigration and customs enforcement (ICE) cars? 🙂
Dennis,
My earliest association with ICE vehicles is milk delivery, cooled by….ice. On hot days the delivery guy would give us kids bits of ice to chew on. I do know someone whose parents had a vacation house with a literal ice box: they’d get a daily delivery of ice.
The ICE man cometh.
Dennis
Good one for the new ICE short form. 🤣
DC and Iver,
By far the largest factor in the oil product consumption slowdown in recent years is the end of the Chinese real estate boom. Or alternatively, the largest factor of robust fuel growth in the decade prior to that was the Chinese real estate boom.
Construction drinks a lot of diesel: trucks, excavators, etc. I have researched real estate bubbles always correlate with diesel. In the U.S. diesel consumption is still below 2008-9 levels when the real estate bubble popped. Same in Spain.
China’s real estate boom was larger than U.S. and Spain’s… It is now popped and the major source of oil product growth is gone. For oil product consumption to start growing again at fast rates, the another massive construction boom is needed.
What you mentioned about fracs consuming diesel, this has actually reverse in the last couple of years. Most of the frac fleet is now on E-drive (i.e. electricity/natgas driven)
“ real estate bubbles always correlate with diesel. ”
Hmm. Off-road construction diesel consumption in the US is about 1% of overall oil products consumption. Chinese off-road and logistic consumption are about 2% of overall Chinese oil products consumption. Even if these figures double during a construction bubble it’s not that important.
Real estate bubbles correlate with a lot of things, because they correlate with economic bubbles in general. Similarly, diesel correlates with a lot of things.
OTOH, China is now working hard to electrify heavy vehicles: buses, semi’s, mining trucks, etc. You might want to learn about BYD.
https://www.youtube.com/watch?v=1UeDdWm-8-s
5 minutes
US Navy moves into Perth Australia
This geopoliticist sees this move as anticipation of global supply chains breaking down.
As this would allow US Navy to choke off China in the Indian Ocean and Strait of Malacca.
Announcement a few hours ago that – by FAR – the largest CCGT plant in the country is to be built in Ohio.
At 9.2 Gw, this new plant will be more than double the capacity of the under construction Homer City plant near Pittsburgh (4.5 Gw) which was to be the largest US plant.
Homer City is expected to start to come online next year.
Ohio plant likely 3/4 years out.
As has been mentioned before, the Age of Gas has arrived.
Appalachia Rising!
“ the Age of Gas has arrived.”
Well, the age of gas has arrived, and it’s already starting a slow departure.
Take a look at the recent post on the STEO (Short Term Energy Outlook, January 2026): The first table shows wind and solar’s share of generation rising by 4 points: 2 points come from coal, and one point comes from gas (and one point is hidden by rounding errors, apparently).
Nick G,
No lie, I luv ya like a bruddah from annudda mutha.
Over all the years that you’ve been posting – with rare exceptions – you have displayed unfailing civility and (sorta) data-backed views.
However …
Setting aside that most of your positions are absolutely batshit crazee, you are the poster boy of Selective Info Gathering/Presentation that continues to grotesquely skew Reality.
When one looks at your referenced chart, one readily sees that your data is accurate. When one asks ‘why’ solar and the whirleys are increasing output, you might ramble on about ‘cheaper’, ‘cleaner’, just doggone virtuous power generation. Saving The Planet, and all that.
Anyone with even a passing familiarity in these matters will recognize the huge elephant in the room and point out the MASSIVE, time limited tax breaks
that were included in the 2022 Green Scam bill.
Ol’ chatbot sez about $400 BILLION in tax credits alone are heading into the pockets of the of the Sol/Zephyr boys.
Nice gig if you can get it.
New world we’re living in, Nick.
The insatiable demand from AI-driven power needs is why Siemens, GE Vernova, Caterpillar and Mitsubihi now have a 5 year backlog on new turbines.
Future is unknown, but the Age of Gas is already here.
Well, thanks. Yes, I try to be civil. Instead of “batshit crazy”, I tend to say things like “highly unrealistic”. But, hey, when I use my phrase, if you want to you can substitute your phrase…
So. Yes, your argument is highly unrealistic (!).
Why? Well, first, if you looked at the research on the matter, you’d see that good analysis says that wind and solar are cheaper than FF when all subsidies are removed. See page 9, https://www.eia.gov/outlooks/aeo/electricity_generation/pdf/AEO2025_LCOE_report.pdf
2nd, if you looked at the rest of the world, you’d see that wind and solar are beating the pants off FF generation. China would not be building mostly wind and solar if it wasn’t a good economic decision – they’re no dummies, and they are very pragmatic. Oh, they like the lack of pollution, but would wind and solar absolutely dominate if they weren’t the cheapest? You tell me.
3rd, FF, including oil and gas, have a lot of their own subsidies. Think intangible expensing: that’s big. Also depletion allowance. Oh, sure, it’s limited to small producers these days, but it was very big from 1926 to 1975 – that’s 50 years during which oil got very, very big and saved $470B.
https://en.wikipedia.org/wiki/Oil_depletion_allowance
And, the recent BBB bill significantly increased tax breaks for oil & gas.
So… seen any comparisons of the overall value of tax breaks for oil & gas vs tax breaks for wind and solar??? It would be fun to see.
A few articles:
https://www.taxnotes.com/research/federal/legislative-documents/congressional-tax-correspondence/bonus-depreciation-giant-handout-big-companies-warren-says/7tbfj
https://www.motherjones.com/politics/2014/04/oil-subsidies-energy-timeline/
https://www.imf.org/en/Publications/WP/Issues/2023/08/22/IMF-Fossil-Fuel-Subsidies-Data-2023-Update-537281
https://www.rfa.org/english/news/environment/global-fuel-subsidies-08252023061051.html
Coffeeguyzz,
Always appreciate the energy insights.
As for the Great AI Data Center Buildout and the massive future electricity consumption forecasted by the industry… it turns out to be a BIG FAT LIE.
How so? Well, China has built out a great deal of AI Data Centers, and according to the most recent data, 70-80% of them are sitting idle. Why? It seems the Chinese have found out that the supposed promises of the AI LLM – Large Languange Models turned out to be a CANARD. Overpromised and underperformed.
If we listen to some of the brightest minds in the AI Industry, they are warning of an AI Bubble far worse than the 2000 Dot.com era because most of the FROTH was in the Startup space, whereas now the biggest companies have dumped Billions, hundreds of Billions into the GPU AI Black Hole.
Furthermore, the revenues from AI, once reported, are now missing from the High Tech companies’ SEC Filings.
When companies realize the LLM won’t provide the AI promises, they will STOP buying Nvidia GPUs, and that will signal the POPPING of the GREAT AI Bubble.
So, we won’t have to worry about the future massive electricity demand from these AI Data Centers, because a lot of them won’t be built.
steve
Coffeeguzz,
The gas needed for LNG export and natural gas power plants may not really be there. These businesses believe the hype of very large technically recoverable natural gas resources in the US. They miss the fact that the economically (that is profitable to produce) recoverable natural gas resources will require natural gas prices of 6 to 8 dollars per MCF (in 2025 US$) to recover perhaps 50% of the claimed TRR for natural gas. At those prices the natural gas power plants and LNG export facilities may become stranded assets because natural gas for LNG (from Qatar, Iran or Australia) or by pipeline from Russia will displace US LNG at $7/MCF at HH. The natural gas power plants won’t be able to compete with wind, solar, nuclear, or coal at even $6/MCF. Note that the futures curve for HH has natural gas at $3.60/MCF in 2029 (June/ Dec average), at that price probably a third of the TRR for US natural gas is economically recoverable.
The age of gas may be an illusion and the age of fossil fuel dominance may be coming to an end over the next 15 years.
Steve,
Just made a comprehensive reply and lost it.
Won’t repeat.
Anecdotes continue to gush forth that buttress claims of AI being extraordinarily disruptive.
Legal briefs currently needing 2 week efforts by young lawyer-interns now done (better?) in 1 hour.
Apps created in hours that used to take months.
‘A’ grade college papers done in minutes by students simply telling chatbot what the professor required.
While my own interactions have been primarily research/answer resolving, ol’ chatbot has been recently prompting me to upload screenshots from Google Earth and topographical maps by which it immediately provides mind blowing granular analysis/recommendations for related commercial endeavors.
Future is unknown, Steve, but this AI stuff may well upend much of our familiar paradigms
My 2 cents.
Dennis,
No need for me to cover old ground on why I think you will continue to be incorrect.
Just skimmed through Comstock’s recent conference call wherein a good amount of info related to their burgeoning Western Haynesville play was provided.
They actually speculate that this play may produce more natty than the legacy Haynesville with EURs in the 3.5 Bcf/thousand foot range (ie., 35 Bcf for a 10,000 footer).
Of particular interest to us operational wonks was the description of hardware innovations suitable to this very high temperature, high pressure region.
The Comstock suit mentioned that RSS manufacturers are financially incentivized to provide effective units as their own future market will grow as these productive footprints continue to expand.
Free markets at work.
Tons of economic natty out there to provide cheap, reliable energy for decades to come.
Coffeeguyzz,
Yeah, not only have I heard that from my own contacts, but even the Bright AI minds have seen the same thing. However, these AI Efficiency gains also have a dark side…. again, coming from some of the brightest minds who have been working with AI for decades.
While it is true there will be efficiencies with AI, or what some of these folks say as rather termed… LLM GLORIFIED PLUGINS rather than true AI, no one is making money doing it.
I have conducted financial studies of BITCOIN MINERS who typically experience 90% depreciation by Year 2. AI GPU Chips may burn out and depreciate even faster.
So, while the GREAT AI RACE to win the AI Battle continues… a lot of people are starting to wake up to the Disaster… like Big AI Data Center Private Equity Investor BLUE OWL is now halting Redemptions,
The SHYTE seems to be hitting the fan, but we likely won’t see the AI BUBBLE POP until BIG Companies like Google, Amazon, Oracle stop buying Nvidia GPU Chips… 6-12 months.
One of the bright minds is Ed Zitron: https://www.youtube.com/watch?v=iG8kjXN550o&t
steve
CG,
“ Just made a comprehensive reply and lost it.”
That’s an important lesson. If you’re going to type a long comment for a blog, type it in a word processor or some kind of note app, and then copy it into the blog comment window. CTRL-A, CTRL-C, then CTRL-V (or Cmnd-C etc., if you’re on a Mac, because of course Apple has to be different).
Blogs lose draft comments all the time. It’s a big pain, and it’s avoidable.
Coffeeguyzz,
We can check back in a few years. My guess is that shale gas output will be between the high and low scenarios shown at link below, the medium scenario with URR=900 TCF peaks in 2028 at about 96 BCF/d for marketed shale gas (wet). Cumulative production from 2000 to 2025 was about 375 TCF and 480 TCF cumulative output is reached in 2028 for the medium scenario. Also keep in mind that as tight oil peaks and declines over the next 10 years a large source of shale gas will dwindle.
Much will depend on future prices, if the current futures curve proves correct ($3.60/MCF in 2026$ in 2029) we might see something closer to the low shale gas scenario, higher prices might lead to higher output but would likely lead to a lack of demand for US shale gas.
We will watch and learn.
shale gas 2510
Coffeeguyzz,
Driving through the Ohio river to Pittsbugh and saw the huge power plants, both coal and gas powered, Appalachian rising!
The West Haynesville progress is amazing with Comstock — they could now drill a 10K lateral in 37days, with close to 1K ft/day now. It is also surprising that the legacy East Haynesville did not improve much.
However, Haynesville still laggs behind Marcellus, especially south-west Marcellus, where the shallow 6~7Kft TVD deep 15K long lateral takes only 3~5 days to drill, 99.99% a single trip without tripping back. Similar savings happened for completion, and yet the EUR still close to 50% of West Haynesville with lots of liquid.
Drilling to Utica & Marcellus also pass thru the Pittsburgh coal formation, and spikes of high gas, reminding the potential of coal bed methane still untouched yet.
The Ohio legislature is considering a bill to ban power plants that run at less than 50% capacity from the grid.
The target is solar, but they might be accidentally banning gas peaker plants. Also a lot of coal plants are running at low capacity because they are too expensive.
So news of an age of gas in Ohio may well be exaggerated. Anyway the local Republicans are more interested in cultural wars than electricity.
couple years ago, during the peak days of “net zero”, Penn State Geology has a PhD thesis modeling the solar output from the shale patches. The thesis claimed that the total shale field surface if covered with solar panels, could generate more electricity per year than the gas trapped in shale underneath.
SRSRocco,
I have posted on this on this site many times.
Does anyone think Linear Regression can become conscious? ( this is a top 5 AI algorithm ).
Linear regression is a great tool for trying to understand data that is Linear.
If that data becomes non-linear the tool completely sucks.
Neural Networks ( a fancy name ) are stochastic graphs that are a more sophisticated form of regression.
They use gradient descent (calculus derivatives) to try to minimise the error rate of the predictions.
As long as the patterns don’t change they are useful, but if they do they need to be changed.
There is no place for thought in these things, they are blind algorithms.
Although LLMs can do impressive things they are blind stochastic predictors that are guaranteed to get things wrong.
And when they get things wrong, it compounds over time because the mistakes build on top of each other.
I am baffled that Microsoft, Google, OpenAI, etc can’t see this. (more likely don’t want to see it, $$ TULIP MANIA!)
And am dumbfounded that a chinese kid figured out storing numbers as 8-bytes instead of 64-bytes would save tons of electricity and processing………Microsoft can’t figure this out?
i’d say the most ignorant mathematically-disinclined people are in the geosciences, and AI will start to make inroads here, first by doing much of the peer-review and then highlighting breakthroughs that the human peer-reviewers are too lazy or too comfortable in their niche to bother with.
The exception to that rule is if big money is to be made.
Andre The Giant,
Don’t know if you will see the reply, but I totally agree with your comment.
LLM ain’t AI… and worse, it’s devouring CAPEX and ENERGY while destroying balance sheets of some of the Top Tech firms.
steve
“LLM ain’t AI…”
True to some degree. Once some form of AI-based software becomes a commodity, it’s no longer considered AI. Consider autofocus on cameras, speech recognition software, fingerprint/face matching — these were all considered AI at one time but no longer as these have become ubiquitous. LLMs being used in developing software is actually a monumental achievement but at some point it will seem like a shrug. So AI is always the next step in evolution.
Coughingguy,
And you are also very selective with your info and opinions.
Not sure about being a poster boy. Lol
https://oilprice.com/Energy/Crude-Oil/After-Years-of-Buybacks-Big-Oil-is-Drilling-Again.html
they wasted 5~10 years in wind and solar.
https://oilprice.com/Energy/Energy-General/Why-Blaming-32-Companies-for-Half-the-Worlds-CO2-Misses-the-Point.html
The first oil price article appears to be misleading. In particular, the IEA has not walked back a forecast for peak demand. It has several scenarios (not forecasts), including a new conservative scenario which appears to be a response to the current US president (apparently assuming this president can stay in office for 24 years). Under this scenario alone demand grows very slowly (.5% per year) until 2050. It has three more aggressive scenarios all of which show decline.
A new post is up
https://peakoilbarrel.com/opec-monthly-oil-market-report-february-2026/
Hi Ovi, commendable effort trying to unravel the situation in Russia. As I wrote in a previous comment, for a few weeks in November last year crude output was as low as 7 Mb/d due to the closure of various export terminals. I believe they might have been able to “spread” the impact over various months, with storage and accounting tricks. However the overall picture is rather bleak.
The most revealing data point is the decline of government revenue, now just one third of what it was a year ago:
https://apnews.com/article/russia-oil-sanctions-ukraine-trump-putin-d4db8311f04f70981b6e6a1caee3920e
“In January, Russian state revenues from taxing the oil and gas industries fell to 393 billion rubles ($5.1 billion) That’s down from 587 billion ($7.6 billion) in December and from 1.12 trillion ($14.5 billion) in January 2025. That’s the lowest since the COVID-19 pandemic”
Capital is drying up and thus a slow down in drilling activity:
https://finance.yahoo.com/news/russia-running-money-oil-wells-162400174.html
“After a record pace in the early months of 2025, activity began to slow in June. In December, drilling fell by about 16% compared with the same month a year earlier, data shows.”
At least one third of the companies in the sector are operating at a loss, and the number of bankruptcies is putting pressure on the banking system itself.
https://united24media.com/latest-news/wave-of-bankruptcies-hits-russian-oil-as-half-of-sector-operates-at-a-loss-15980
“Russia is seeing a wave of bankruptcies among smaller oil producers as crude oil prices plunge to 40$ per barrel or lower, and tighter US sanctions squeeze revenues across the sector, The Moscow Times reported on February 17, citing Russian state media.”
The Russian petroleum industry has entered its sunset. The damage it has sustained will take many years to repair. If ever.