Short Term Energy Outlook, February 2023

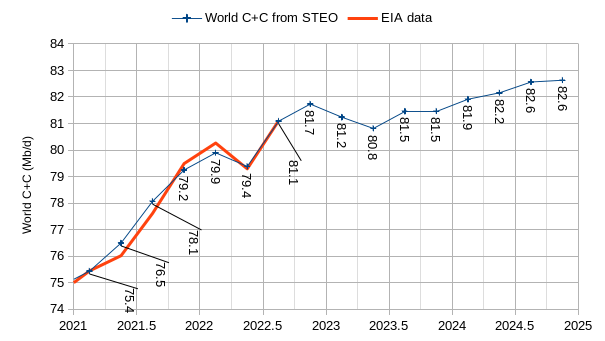
The Short Term Energy Outlook (STEO) was published by the US Energy Information Administration (EIA) on February 7, 2023. For most nations except the US and total OPEC crude oil output the forecast for future production is for total liquids only. In this month’s post I will try to estimate the crude plus condensate (C+C) output indicated by the STEO total liquids estimate for the top 10 non-OPEC producers and the World minus the top 10 non-OPEC producers. I will focus on quarterly output so that we can compare with recent OPEC estimates for World supply and demand in 2023. The estimate for C+C uses historical output of both C+C and total liquids and uses the average of the ratio of C+C to total liquids for the past 12 quarters (2019Q4 to 2022Q3) for the top 10 non-OPEC producers (except the US where a C+C forecast is provided) and for the World minus the top 10 non-OPEC producers. In most of the charts that follow the units on the vertical axis are kb/d of C+C output.

Figure 1
Read More

US EIA Short Term Energy Outlook, Jan 2023

The US EIA Short Term Energy Outlook (STEO) was published on January 10, 2023. This report generally provides forecasts for Total Liquids production for non-OPEC nations, crude only output for OPEC nations, and both C+C and Total Liquids forecasts for the US. At Peak Oil Barrel we focus on crude plus condensate (C+C) output as this is the critical input that provides most of the World’s liquid fuels used for land, air and water transportation. The STEO also provides forecasts for natural gas and electricity output as well as price forecasts for oil, natural gas, and electricity. This post will focus on oil (both total liquids and C+C).

We find the OLS trend in the ratio of C+C divided by total liquids for non-OPEC minus the US over the period from October 2014 to September 2022 (it has been decreasing at an annual rate of 0.267% over that period) and we assume the trend continues from October 2022 to December 2024 (the end of the STEO forecast). This allows us to estimate non-OPEC minus US C+C. Likewise we find the ratio of OPEC crude to C+C which was relatively flat at about 93.7% from Jan 2010 to December 2019 and seems to be returning to this level since the depths of the pandemic. By assuming the ratio is 93.7% crude to C+C for OPEC we can estimate OPEC C+C from October 2022 to December 2022 using the STEO crude only estimate. The non-OPEC minus US C+C estimate is added to the STEO US C+C estimate and this is combined with the OPEC C+C estimate to find the World C+C STEO forecast.

Figure 1
Read More

April’s EIA Oil Growth Projections

By Ovi at peakoilbarrel.

Normally near the end of the month an update on world oil output is posted here. However this month the EIA’s world oil report will appear too close to the US monthly report. For this month, in its place, this space will be filled with the three oil growth projections that the EIA published in April along with other oil production related information. The world report will be posted after the US report, later in May.

Short Term energy Outlook (STEO)

The STEO provides projections for the next 13 – 24 months for US C + C and NGPLs production. The April 2021 report presents EIAʼs updated oil output and price projections to December 2022.

Read More

US Oil Output Continues its Steady Decline

A post by Ovi at peakoilbarrel

All of the oil (C + C) production data for the US states comes from the EIAʼs Petroleum Supply Monthly (PSM). At the end, an analysis of three different EIA monthly reports is provided. The charts below are updated to March 2020 for the 10 largest US oil producing states, (Production > or close to 100 kb/d).

Today’s June 1 update shows the continuous slow decline in oil output from US oil fields from November 2019 to March 2020. March output was 12,716 kb/d, down by 28 kb/d from February’s 12,744 kb/d. Also it should be noted that February’s output estimate from the EIA’s earlier May report, 12,833 kb/d, has been revised to 12,744 kb/d, a downward revision of 89 kb/d. The Red dot is the projected April output from the May Monthly Energy Review.

Read More

The EIA’s Optimistic Outlook

Most of the data below is taken from from the EIA’s Short-Term Energy Outlook. The data through February, 2019 is the EIA’s best estimate of past production and all data from March 2019 through December 2020 is the EIA’s best estimate of future production. However in most cases February production is highly speculative so I drew the “projection” line between January and February.

Understand the above chart is Total Liquids, not C+C as I usually post. As you can see the EIA expects world petroleum liquids to keep climbing ever upwards.

This is the EIA’s data for OPEC all liquids with Production data from April 2019 through December 2020.

Read More