By Ovi
All of the Crude plus Condensate (C + C) production data for the US state charts comes from the EIAʼs Petroleum Supply monthly PSM which provides updated production information up to October 2025.
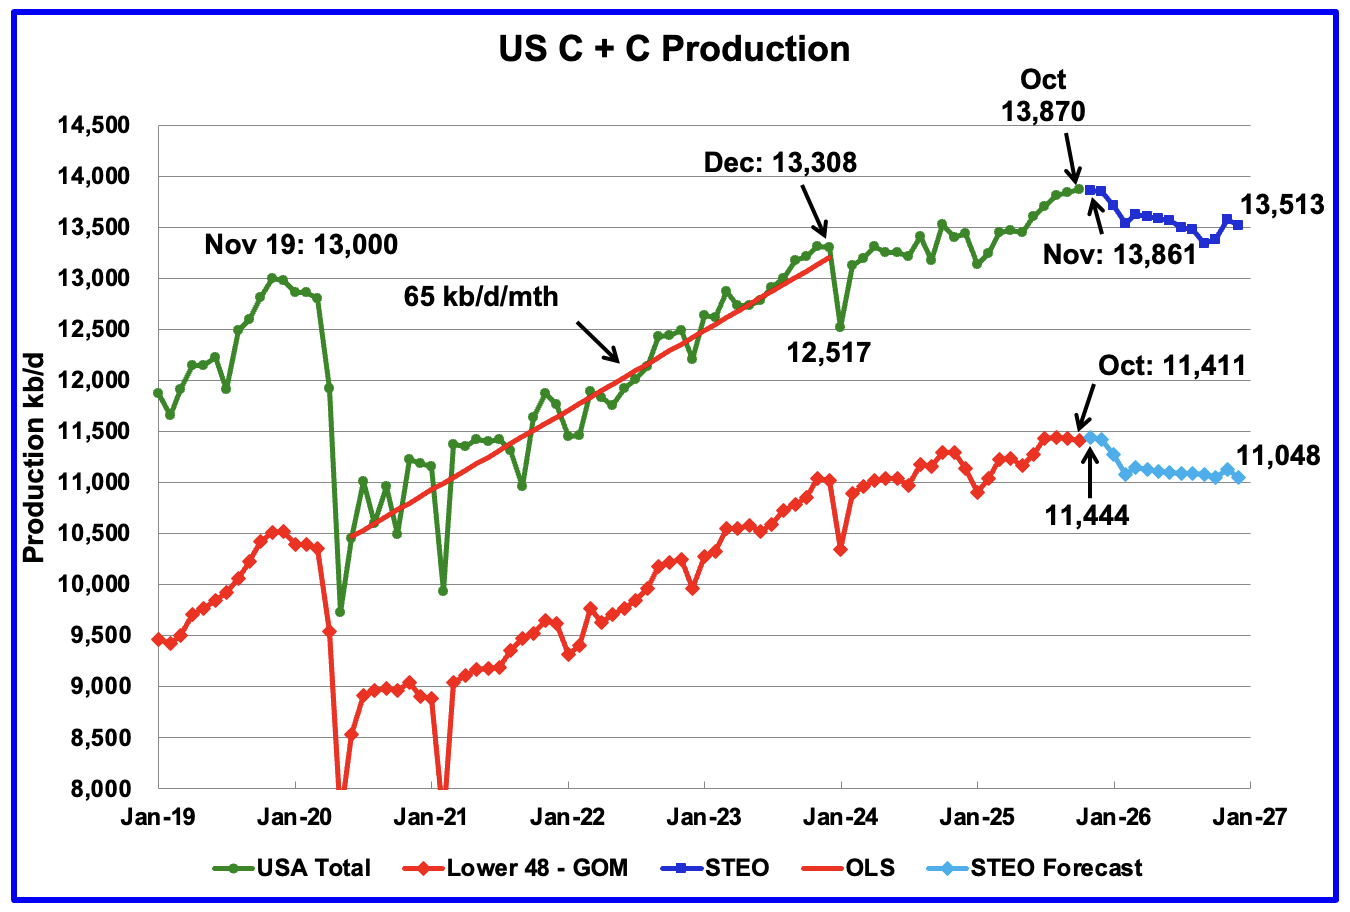
U.S. October oil production increased by 31 kb/d to 13,870 kb/d, another new record high. The largest increases came from the GOM and New Mexico offset by a Texas drop. November production is expected to drop by 9 kb/d to 13,861 kb/d according to the December STEO.
The dark blue graph, taken from the December 2025 STEO, is the U.S. oil production forecast from November 2025 to December 2026. Output for December 2026 is expected to drop to 13,513 kb/d. From October 2025 to December 2026 U.S. oil production is expected to drop by 357 kb/d.
Note the almost flat production in the Onshore L48 from July 2025 to December 2025, 11,436 kb/d to 11,420 kb/d, respectively, red/blue graph. The October Onshore L48 oil production dropped by 25 kb/d from September’s 11,436 kb/d to 11,411 kb/d. The difference between the 31 kb/d increase in the overall US production vs the 25 kb/d production drop in the Onshore L48 is largely due to the 46 kb/d increase from the GOM.
US production will peak between October 2025 and December 2025. October has a chance. Onshore L48 almost guaranteed.
The light blue graph is the STEO’s forecast for the Onshore L48 output to December 2026. From October 2025 to December 2026 production is expected to decrease by 363 kb/d to 11,048 kb/d.
U.S. Oil Production Ranked by State
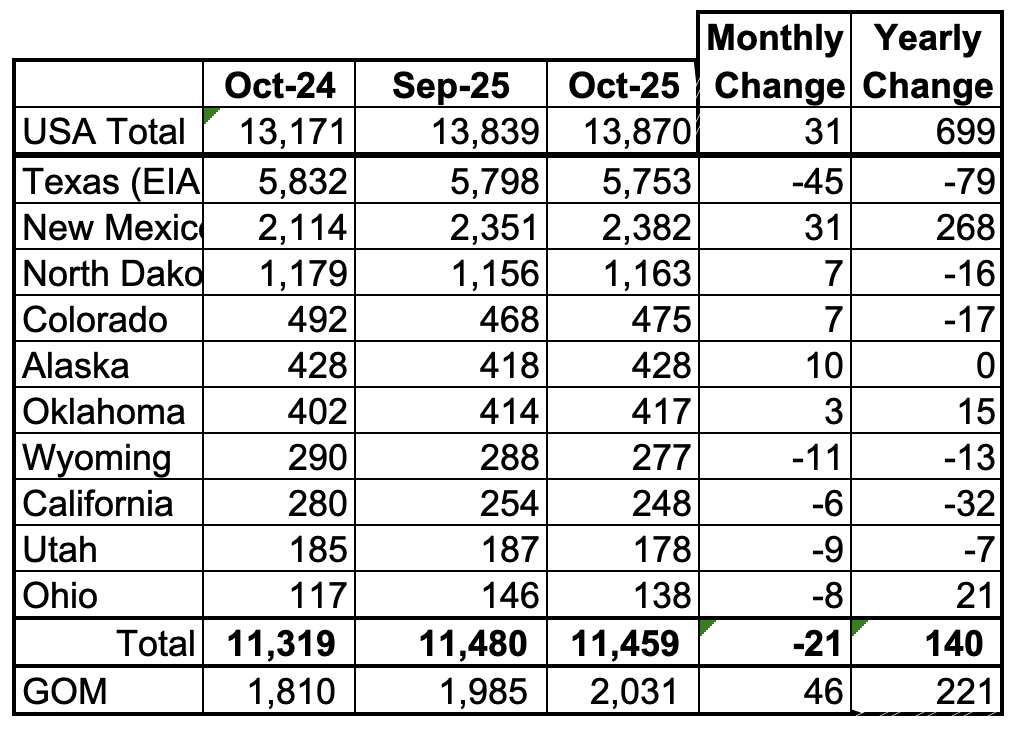
Listed above are the 10 US states with the largest oil production along with the Gulf of Mexico.
These 10 states accounted for 82.6% of all U.S. oil production out of a total production of 13,870 kb/d in October 2025. On a MoM basis, October oil production in these 10 states dropped by 21 kb/d. On a YoY basis, US production increased by 699 kb/d with the largest contributors being New Mexico and the GOM.
State Oil Production Charts
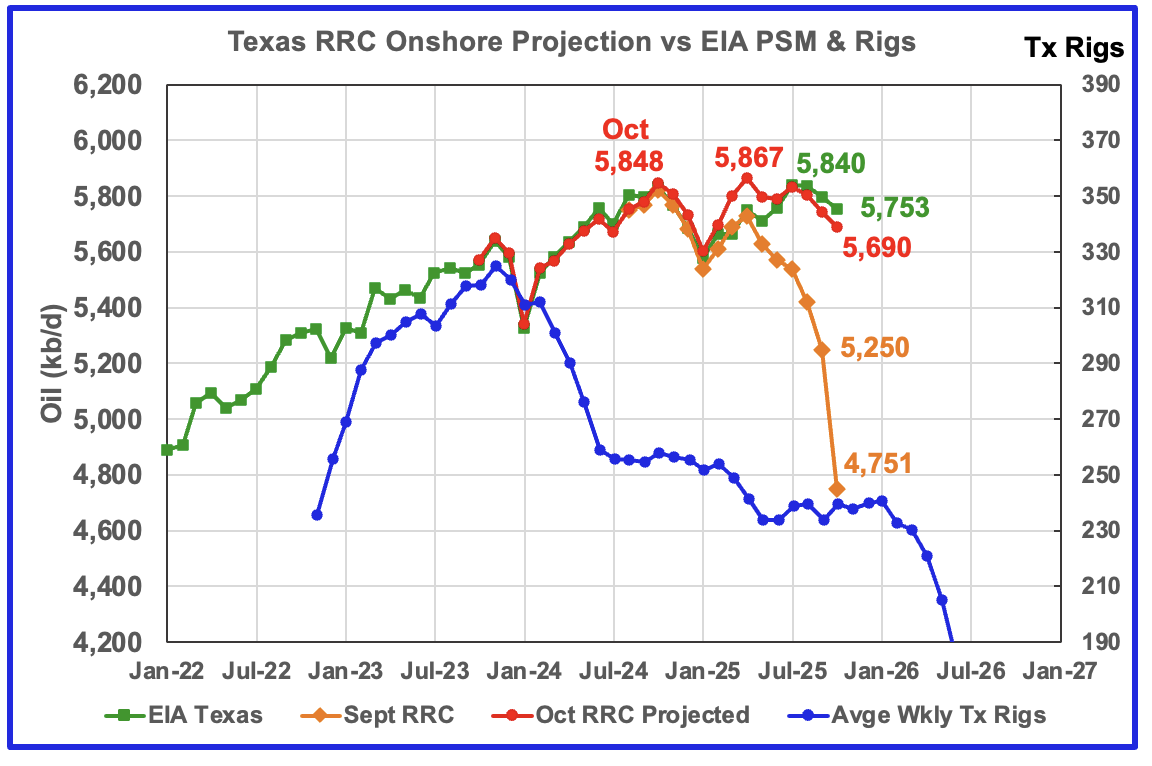
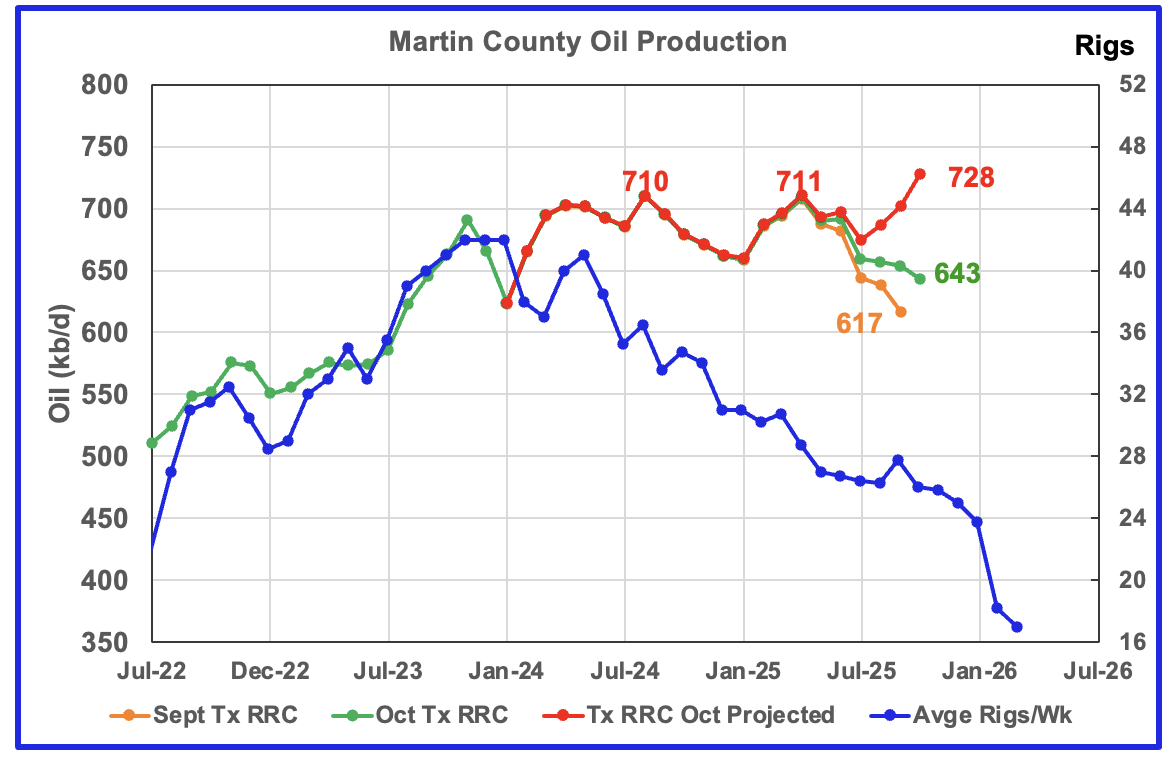
Texas’ October production decreased by 45 kb/d to 5,753 kb/d according to the EIA and is 87 kb/d lower than July 2025.
Texas’ production rebounded from January 2025 to July 2025 to 5,840 kb/d. However since July 2025, production has dropped for three consecutive months. The point to note here is both the production projection and the EIA’s production are going in the same direction from January 2025 to October 2025 and both are indicating that Texas is entering a declining phase.
The Texas’ RRC initial production for October dropped by 499 kb/d from September to 4,751 kb/d. The projection added 939 kb/d to raise October’s production to 5,690 kb/d, 63 kb/d lower than the EIA’s estimate.
The red graph is a production projection using the September and October Texas RRC data.
The blue graph shows the average number of weekly rigs reported for each month shifted forward by 10 months. So the 276 rigs operating in July 2023 have been shifted forward to May 2024. From February 2024 to July 2024, the rig count dropped from 312 in time shifted February 2024 to 256 in July 2024. That drop of 56 rigs had no impact on production up to July 2025. August 2025 appears to be the first month when the impact of the rig count drop on oil production started to show up.
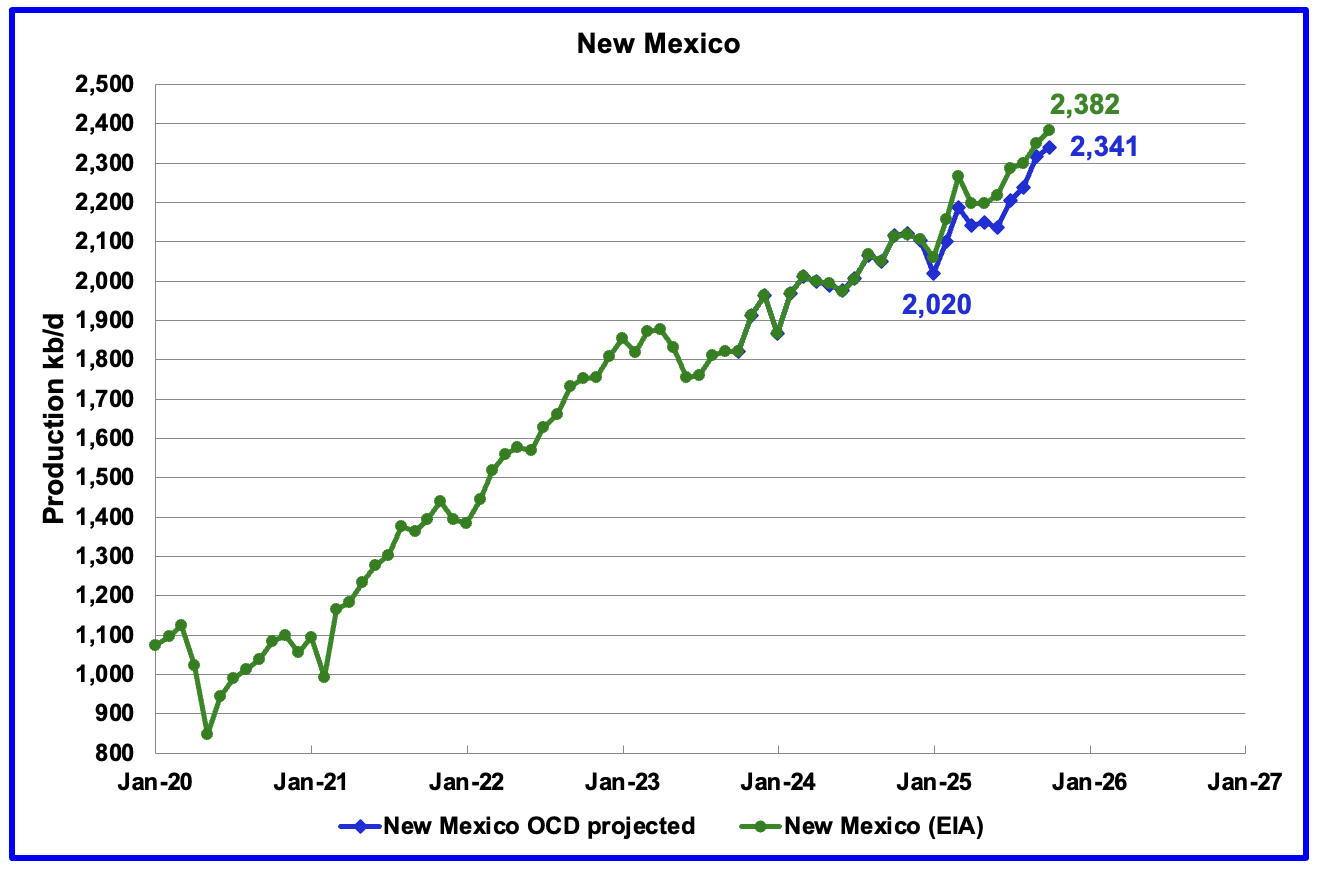
According to the EIA, New Mexico’s October production rose by 31 kb/d to 2,382 kb/d, a new high. YoY production rose by 268 kb/d, the biggest contributor to overall rising US production.
The blue graph shows the projected output up to October. October’s production projection increased by 24 kb/d over September to 2,341 kb/d, of which 22 kb/d came from the OCD’s preliminary production.
Eddy County added 34 kb/d of production to the overall New Mexico increase and is discussed further in the Permian section below.
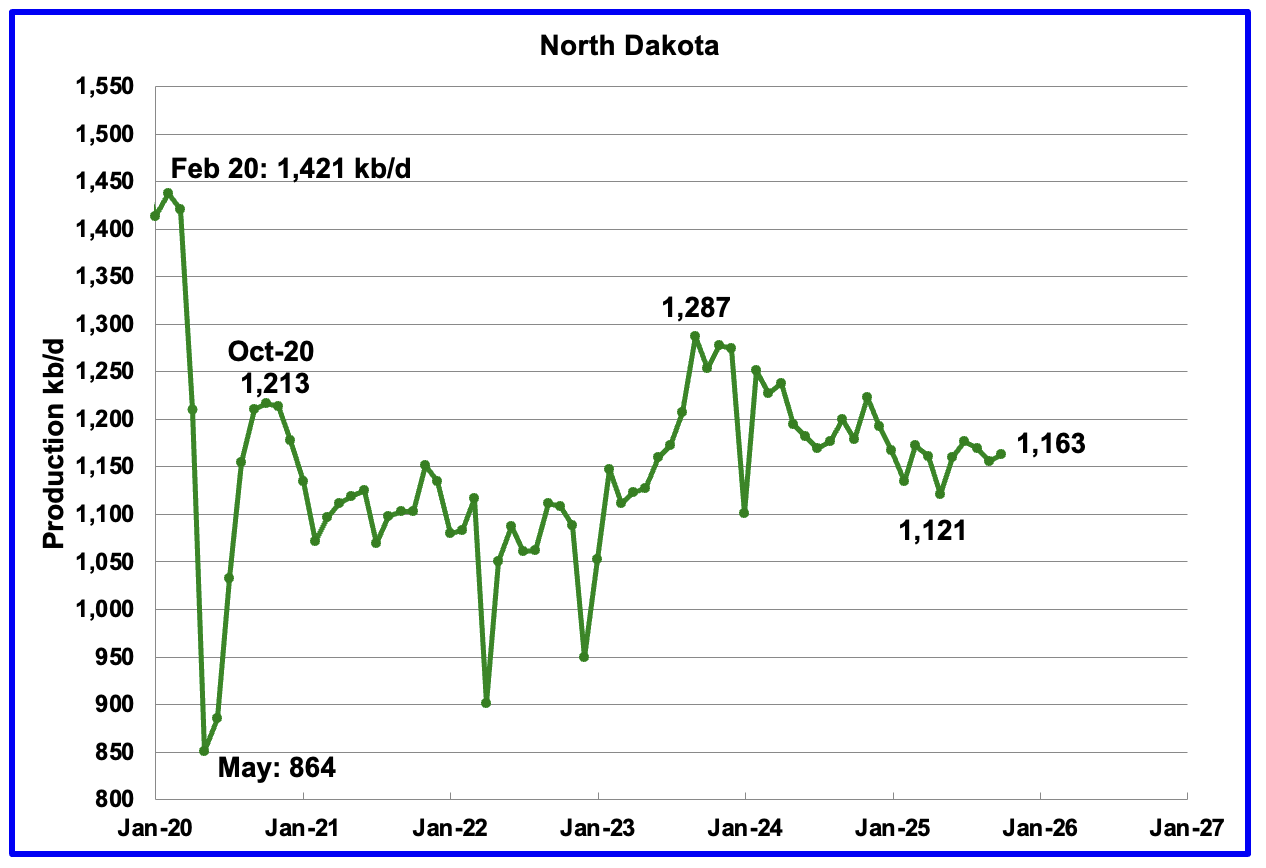
October’s output rose by 7 kb/d to 1,163 kb/d. Production is down 124 kb/d from the post pandemic peak of 1,287 kb/d.
The North Dakota Department of Mineral resources reported October production increased by 1 kb/d to 1,169 kb/d, which is close to the EIA’s estimate.
According to this Article, some North Dakota drillers are drilling 4 mile horizontal wells.
North Dakota’s top oil regulator is pessimistic about oil prices for 2026 but says oil production should hold steady, due in part to new drilling technology companies are using to remain profitable.
“Every time somebody thinks that the industry is essentially kind of maxed out on their technical capabilities, they usually come through with some type of innovation,” said Nathan Anderson, director of the North Dakota Department of Mineral Resources.
One reason North Dakota oil production is stable, despite the dip in oil activity, is companies are drilling longer horizontal wells. Oil wells drilled in the Bakken typically drill vertically until they hit the Bakken rock formation about 2 miles underground, then curve horizontally for 2 miles. The surrounding rock is then fractured, or fracked, to release the oil.
But companies are now drilling farther horizontally. More than 1,000 permits have been issued for wells that are drilled horizontally for 3 miles instead of 2. That accounts for 30% of all wells being completed, according to Department of Mineral Resources data.
Some companies took it a step further in 2024 and began drilling horizontally for 4 miles. There have been 105 permits awarded for wells of that length, a fifth of which have been drilled and completed.
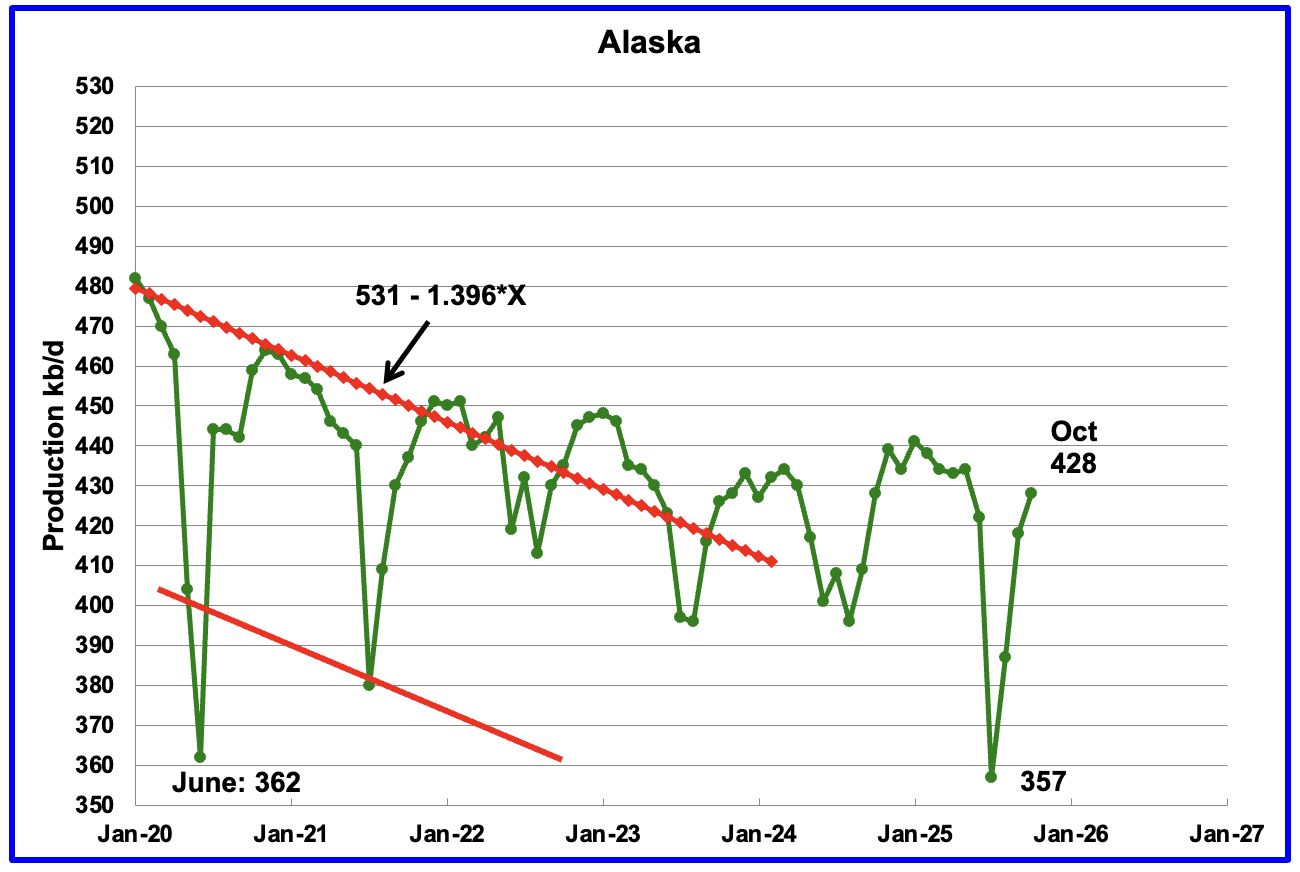
Alaskaʼs October output rose by 10 kb/d to 428 kb/d while YoY production was flat. The EIA’s weekly October reports indicated that October production would rise and would average close to 430 kb/d. Production from the weekly reports for October and November continues to be in the 430 kb/d to 435 kb/d range, showing little growth beyond October.
Alaska has recently brought new fields online to consistently have flat YoY and monthly production gains which have broken away from the earlier dropping production red trend lines. New production is expected to come online from the Picca field in early 2026.
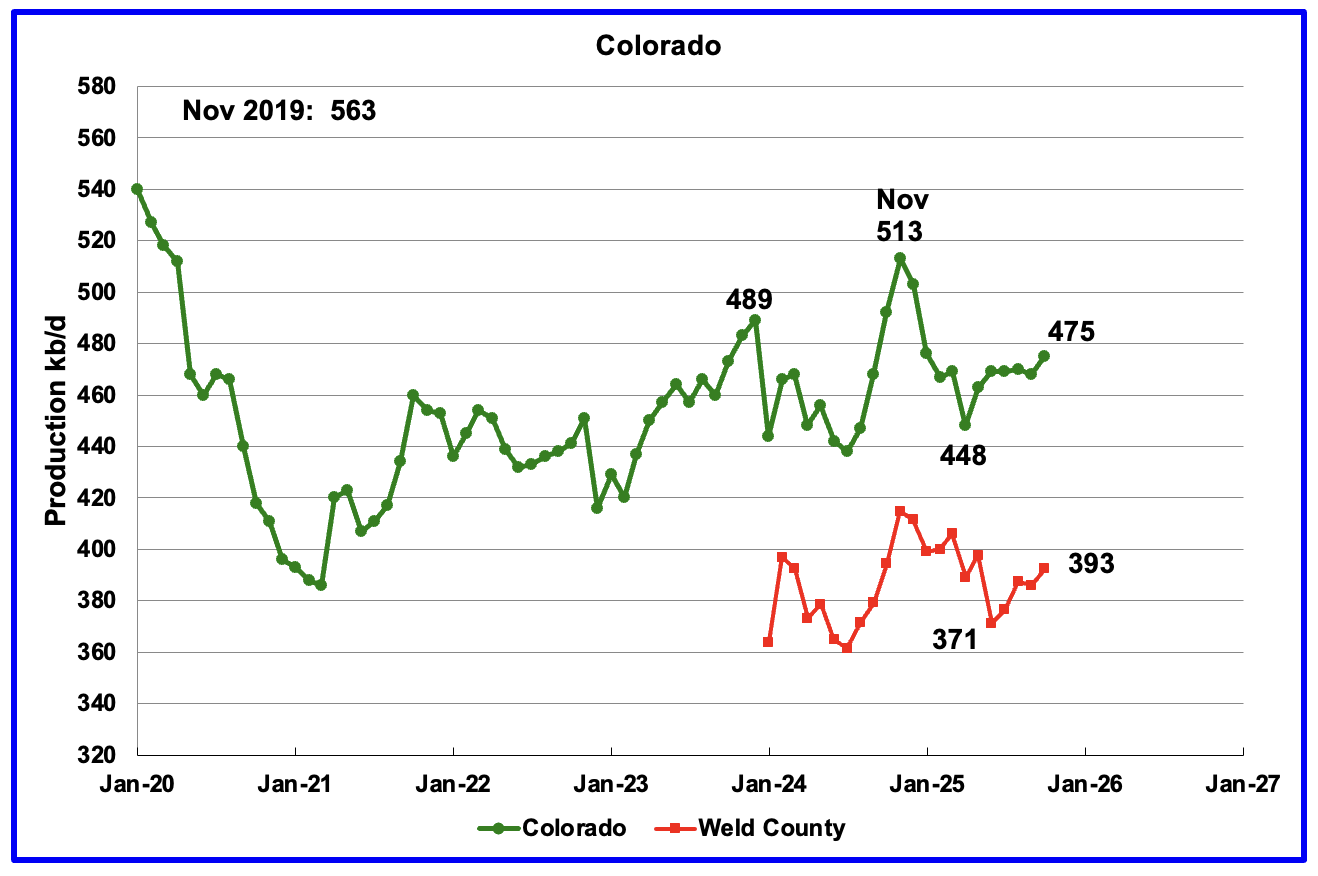
Coloradoʼs October oil production rose by 7 kb/d to 475 kb/d.
The biggest oil producing county in Colorado is Weld County and its production has been added to the chart. The two graphs have been almost parallel since January 2024 but diverged over the last few months. Weld’s production also rose by 7 kb/d in October to 393 kb/d.
Colorado began 2025 with 6 rigs in January and February and peaked at 11 in October. At the end of December 7 rigs were operational..
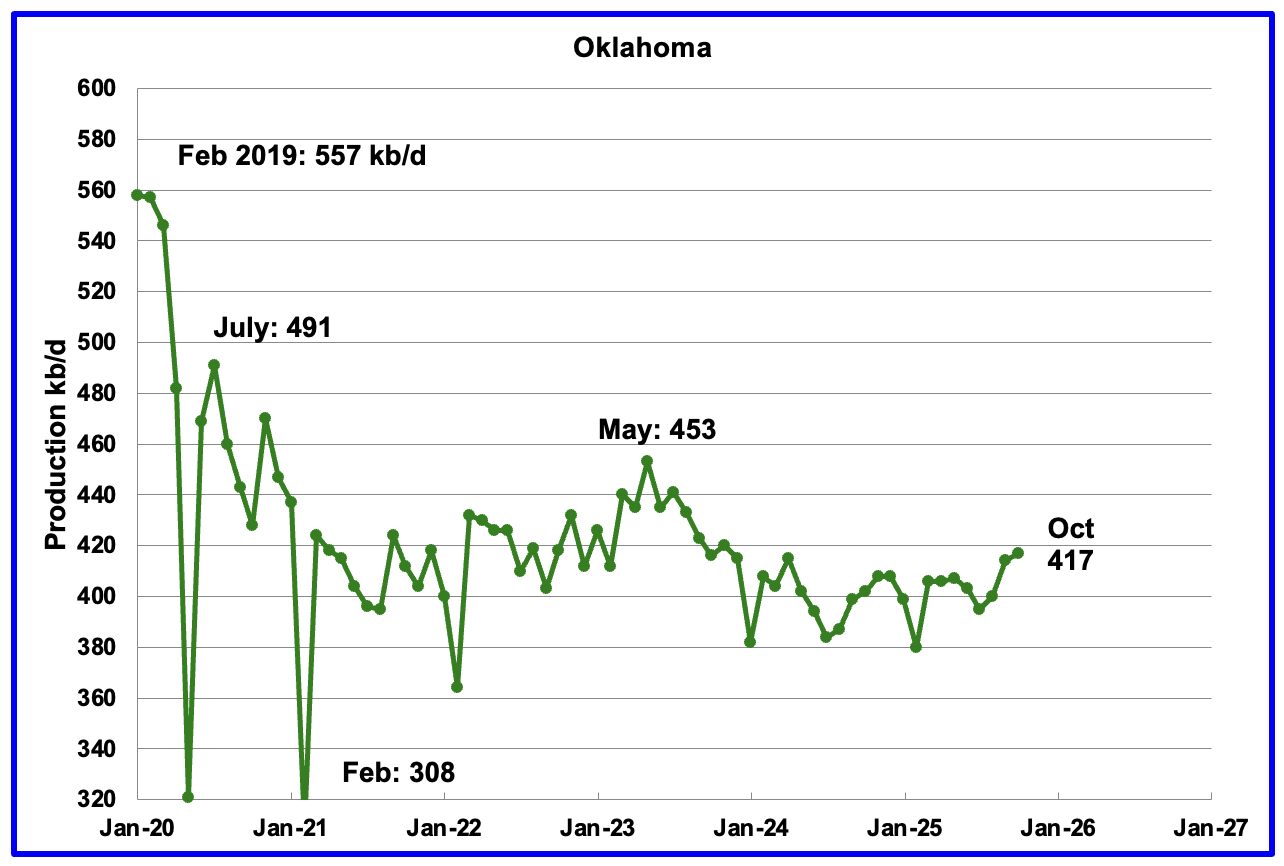
Oklahoma’s output in October rose by 3 kb/d to 417 kb/d. Production remains below the post pandemic July 2020 high of 491 kb/d and is down by 36 kb/d since May 2023. Output entered a slow declining phase in June 2023 and now appears to be range bound around 400 kb/d ± 20 kb/d.
Oklahoma had 51 operational rigs May which slowly dropped to 39 rigs in December. The impact of the dropping rig count after May should begin to show up in a few months, allowing for a 6 month time shift between rig count and oil production.
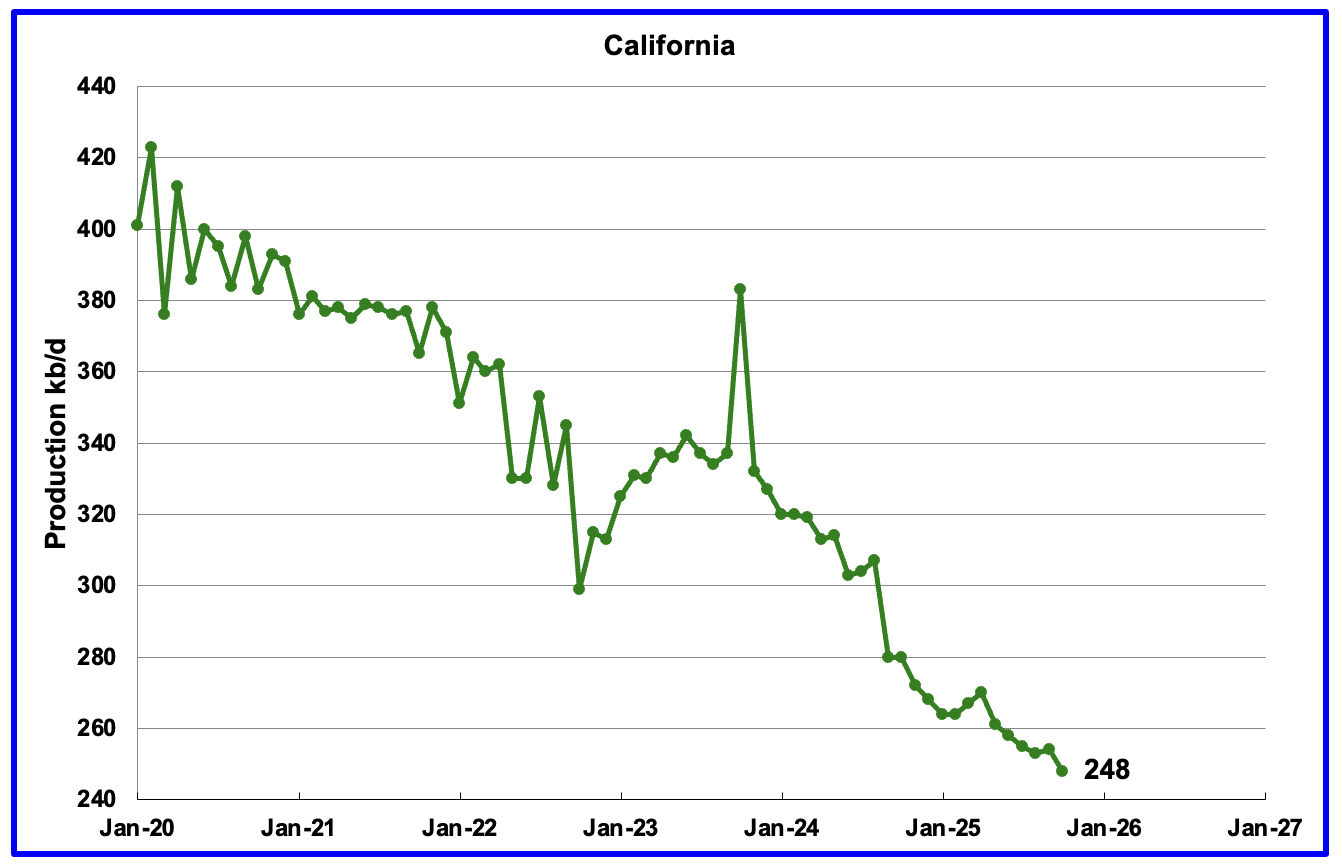
California’s overall declining production trend continues. October’s production dropped by 6 kb/d to 248 kb/d. YoY production dropped by 32 kb/d.
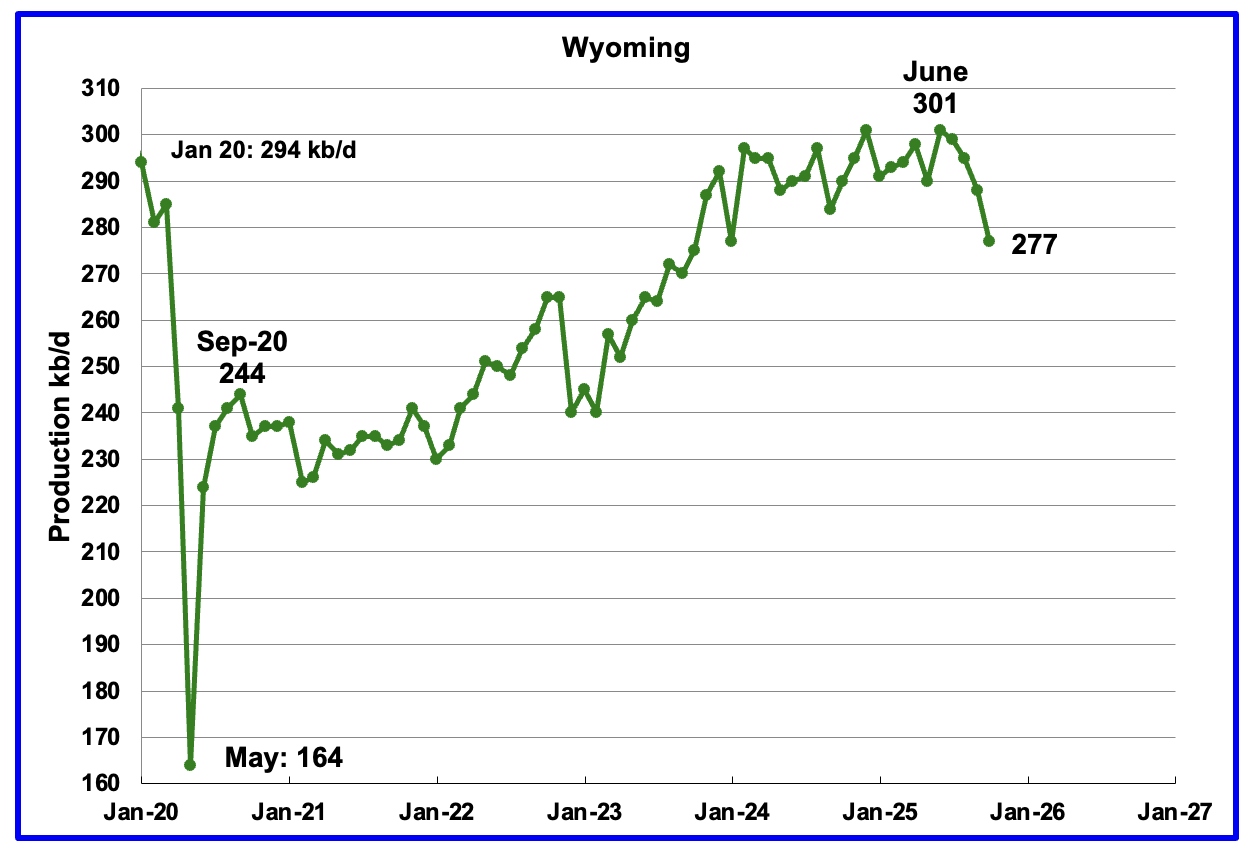
Wyoming’s oil production reached a post pandemic high in December 2024 and again in June 2025. Production has dropped in each of the last 4 months. October productions dropped by 11 kb/d to 277 kb/d and Wyoming appears to have entered a declining phase.
At the beginning of 2025 Wyoming had 14 operational rigs and rose to 16 in March and April. At the end of November 10 rigs were operational. In December 3 rigs were added for a total of 13.
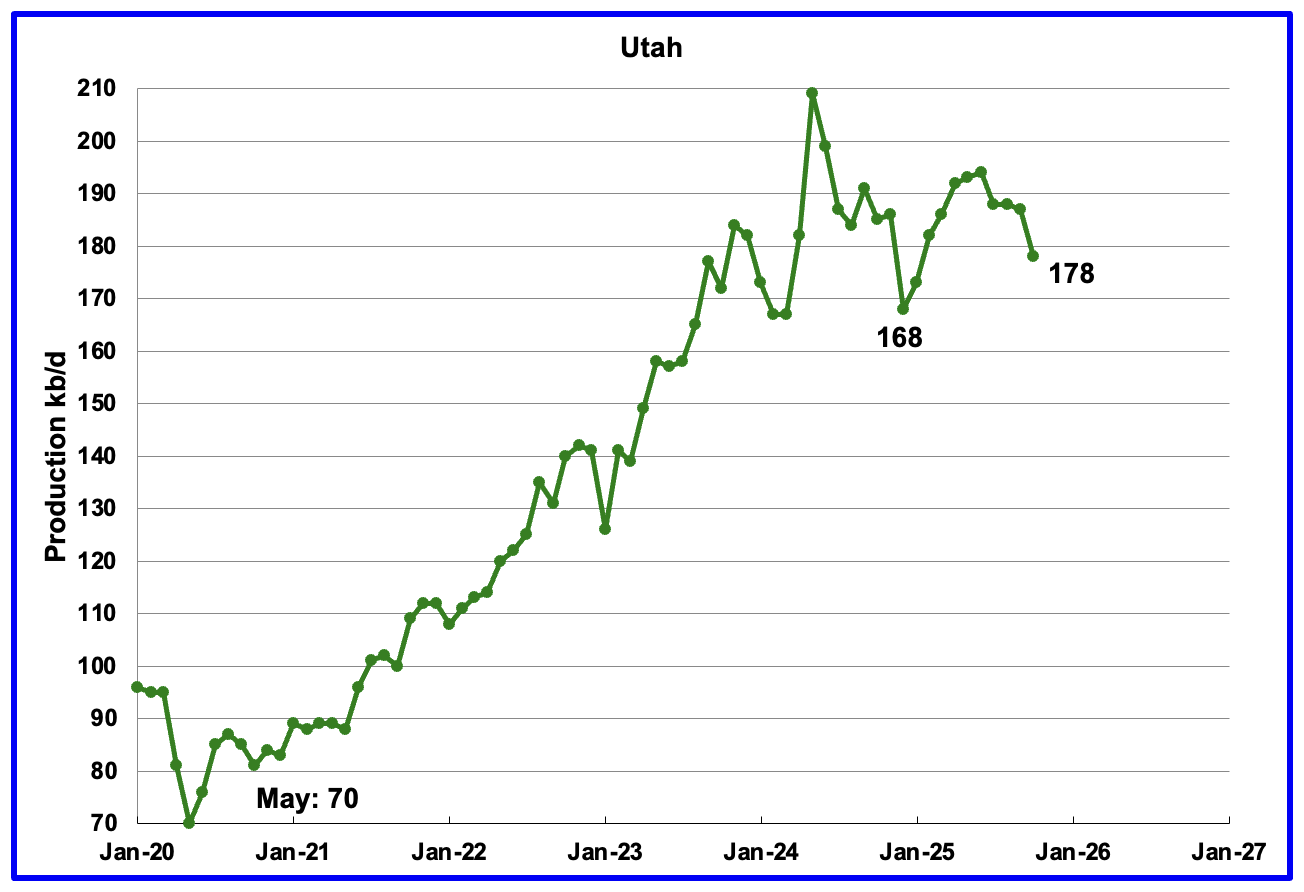
October’s production dropped by 9 kb/d to 178 kb/d. Utah had 8 rigs operating from October 2024 through May 2025 but dropped to 6 in early June but returned to 10 at the end of December.
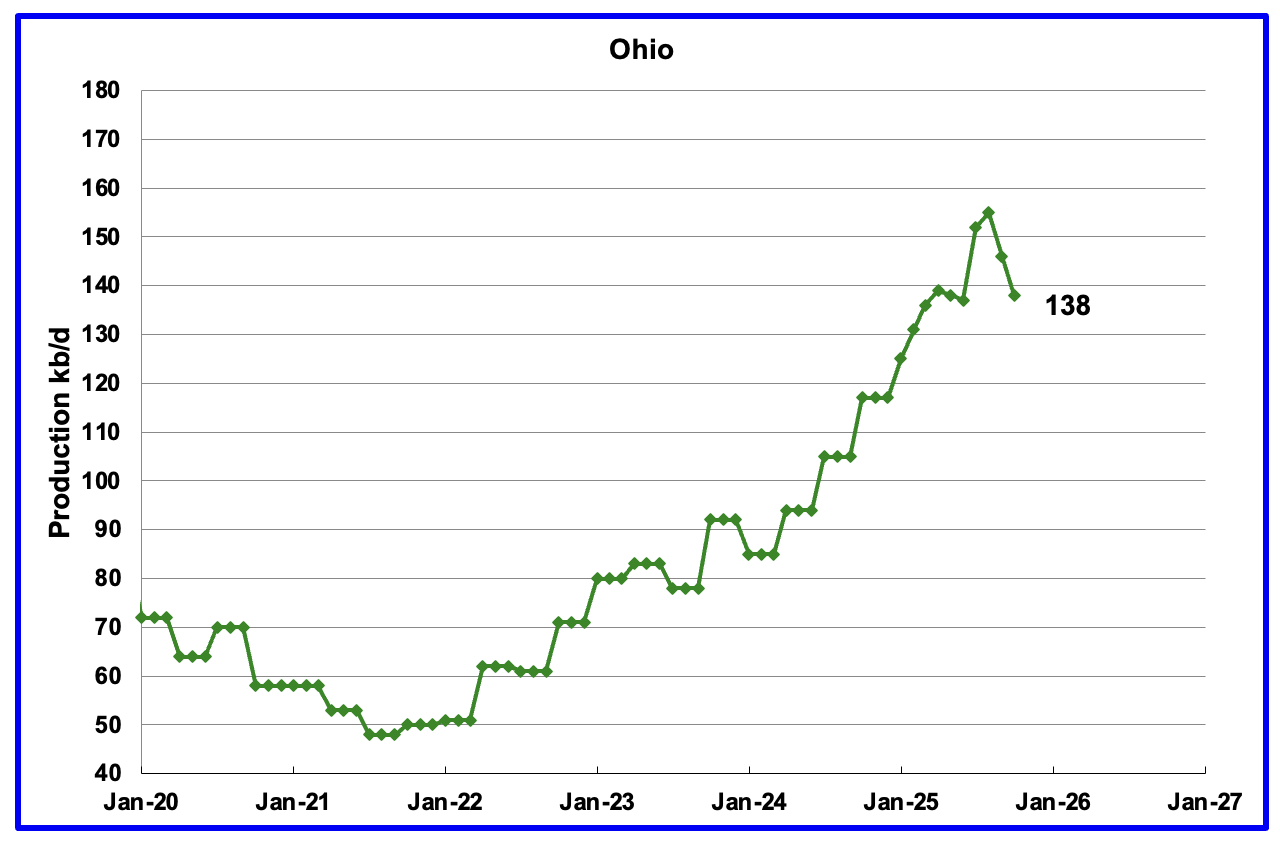
Ohio’s October oil production decreased by 8 kb/d to 138 kb/d. Ohio started the year with 6 NG rigs, In late December Ohio had 12 NG rigs and 1 oil rig operating.
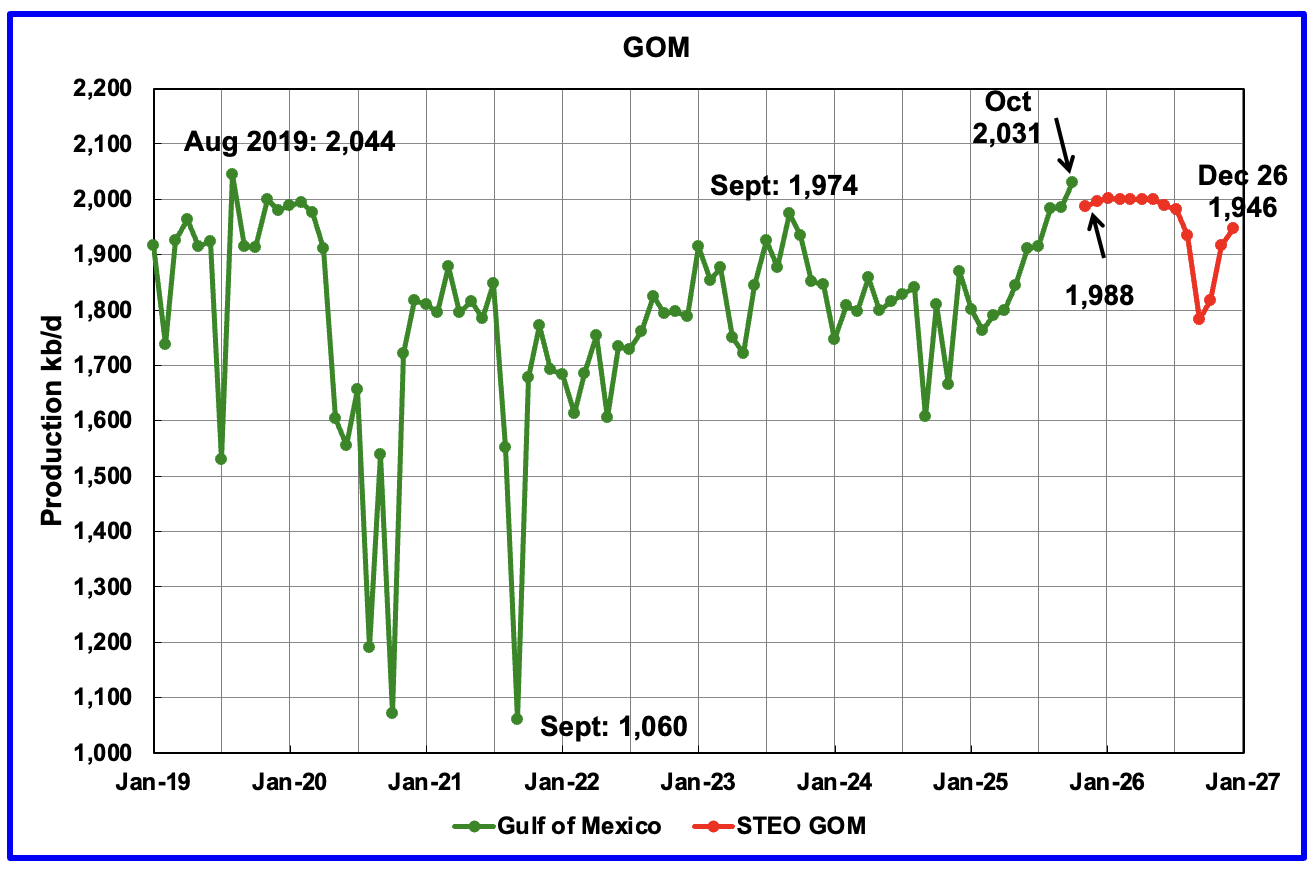
GOM production rose by 46 kb/d in October to 2,031 kb/d. The large increase may be related to the July startup of the Shenandoah floating production system. It reached its 100 kb/d production target in October. (See comment below) November’s production is projected to decrease by 43 kb/d to 1,988 kb/d. Surprised with the projected drop. Could be revised in the January 2026 STEO.
The December 2025 STEO GOM projection has been added to this chart. It projects production in December 2026 will be 85 kb/d lower than October 2025 at 1,946 kb/d.
According to this Article, Three new projects have helped boost US Gulf of Mexico output since mid-2025 and will continue to add to supply.
“Beacon Offshore Energy’s 120,000 b/d Shenandoah floating production system started delivering oil into Genesis’ SYNC pipeline in July. The line connects to the Cameron Highway Oil Pipeline System (Chops), which feeds the SGC crude stream. Beacon said in October that Shenandoah had reached its 100,000 b/d target.
Elsewhere, BP recently started up the Argos Southwest Extension project, adding 20,000 b/d of oil equivalent (boe/d) to the existing platform. Argos output also goes into Chops to feed the SGC stream. And LLOG Exploration’s Salamanca project, which achieved first oil in the third quarter, is expected to ramp up to its design capacity of 50,000 b/d by mid-2026 and flow into the medium sour Poseidon stream.
Additionally, BP’s Atlantis Drill Center 1 oil field expansion project started up two months ahead of schedule, the company reported on 11 December, and is expected to add peak production of around 15,000 boe/d. Atlantis’ gross oil production capacity is 200,000 b/d and feeds into the Chops stream.”
A Different Perspective on US Oil Production
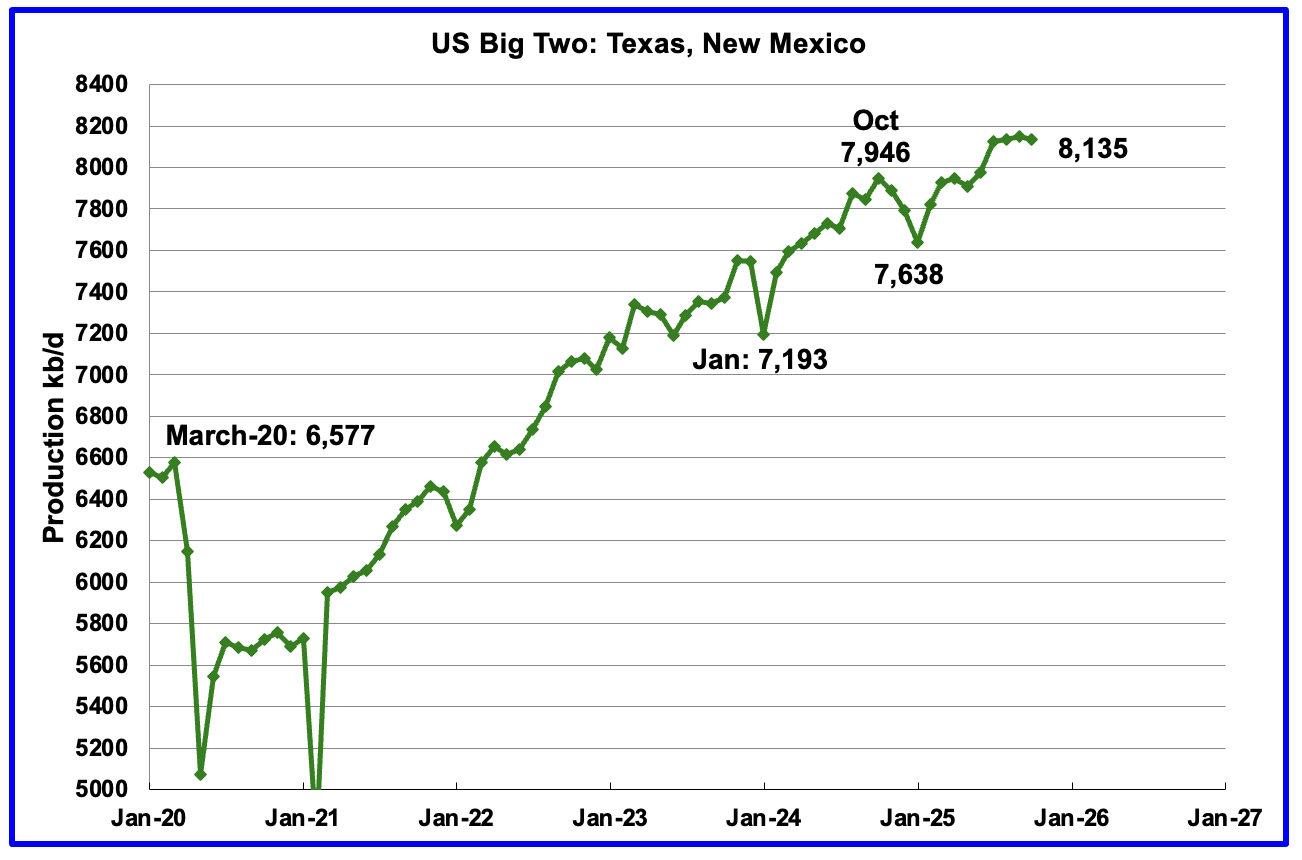
Combined oil output for the Big Two states Texas and New Mexico.
October’s production in the Big Two states decreased by a combined 14 kb/d to 8,135 kb/d. Clearly these two states were the drivers of US oil production growth up to September 2025. Is the October decline the first sign that production in these two states is close to peaking?
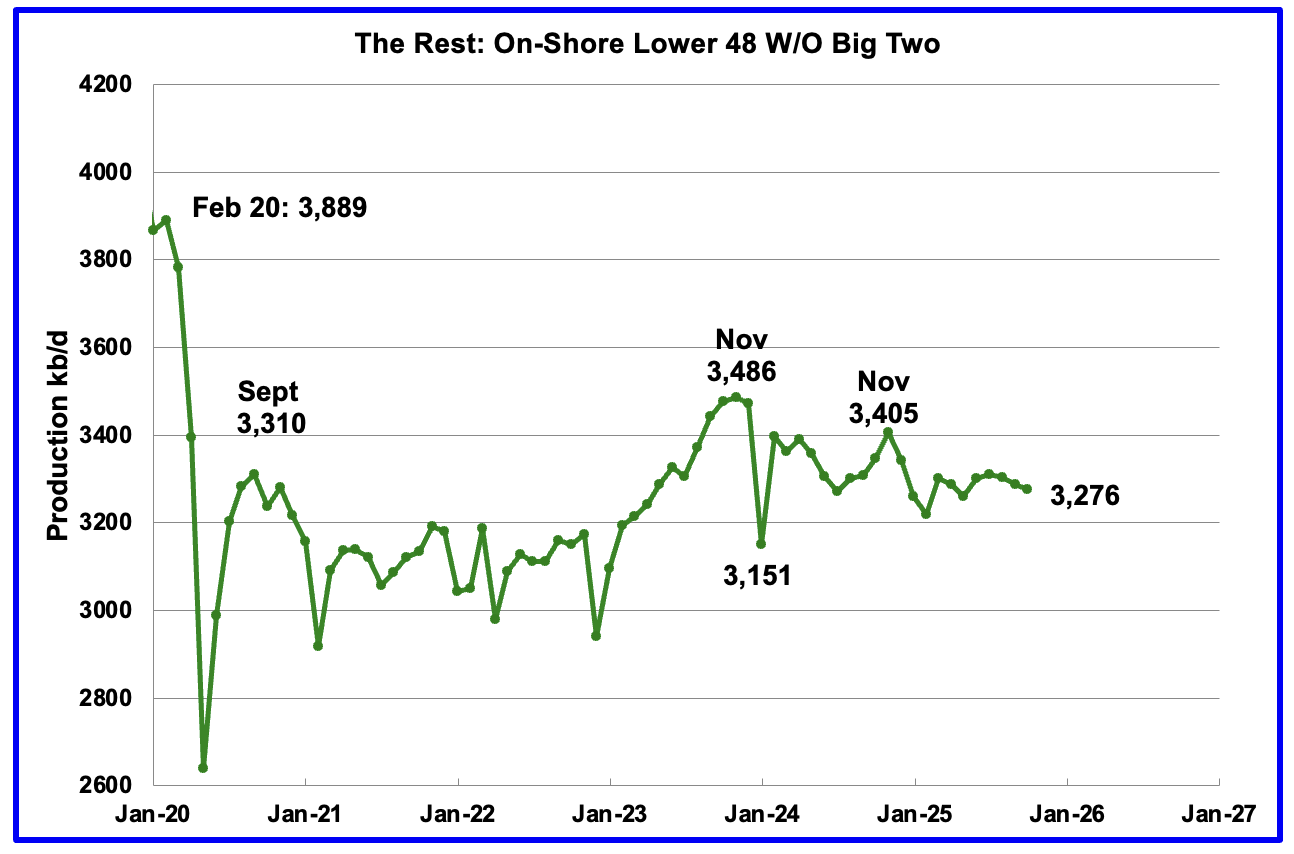
Oil Production by The Rest
October’s oil production by The Rest dropped by 11 kb/d to 3,276 kb/d and is 210 kb/d lower than November 2023.
Permian Basin Report for Main Counties and a District
This special monthly Permian section was added to the US report because of a range of views on whether Permian production will continue to grow or will peak over the next year or two. The issue was brought into focus many months back by two Goehring and Rozencwajg Reports and Report2 which indicated that a few of the biggest Permian oil producing counties were close to peaking or past peak.
A more recent report was issued and can be reviewed Here. In this report they state:
“For years now, we have outlined with what we hoped was clarity, and what we now submit was prescience, the view that U.S. shale oil, that great source of modern supply, could not grow forever. It would mature, crest, and begin its long descent. That moment, by our models and measures, has arrived: shale has plateaued, and 2024 appears to be its high-water mark. And yet, investor sentiment has scarcely been more downbeat.”
This section will focus on the four largest oil producing counties in the Permian, Lea, Eddy, Midland and Martin. It will track the oil and natural gas production and the associated Gas Oil Ratio (GOR) on a monthly basis. The data is taken from the state’s government agencies for Texas and New Mexico. Typically the data for the latest two or three months is not complete and is revised upward as companies submit their updated information. Note the natural gas production shown in the charts that is used to calculate the GOR is the gas coming from both the gas and oil wells.
Of particular interest will be the charts which plot oil production vs GOR for a county to see if a particular characteristic develops that indicates the field is close to entering or in the bubble point phase. While the GOR metric is best suited for characterizing individual wells, counties with closely spaced horizontal wells may display a behaviour similar to individual wells due to pressure cross talking . For further information on the bubble point and GOR, there are a few good thoughts on the intricacies of the GOR in an earlier POB comment and here. Also check this EIA topic on GOR.
New Mexico Permian
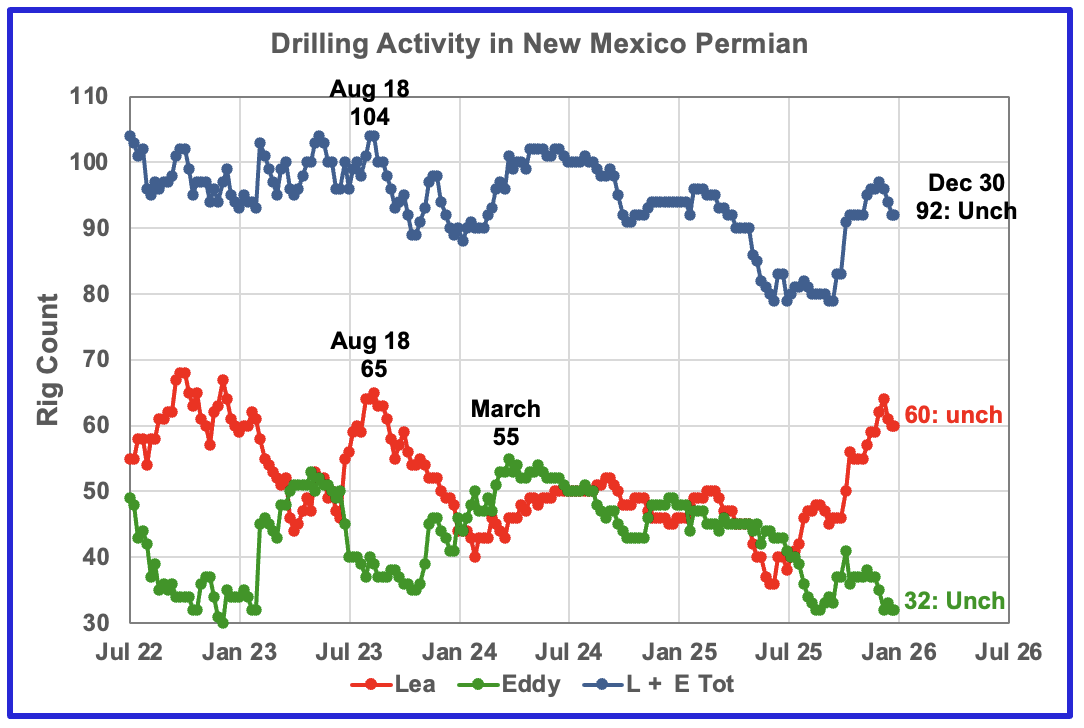
The current rig counts in Lea and Eddy counties are moving in different ways. Lea County has been dropping rigs while Eddy is holding steady. Over the past month Lea County dropped 4 rigs to 60 while Eddy has held steady at 32. Overall NM dropped 4 rigs in December to 92.
Oil Production in New Mexico’s Primary Permian Counties
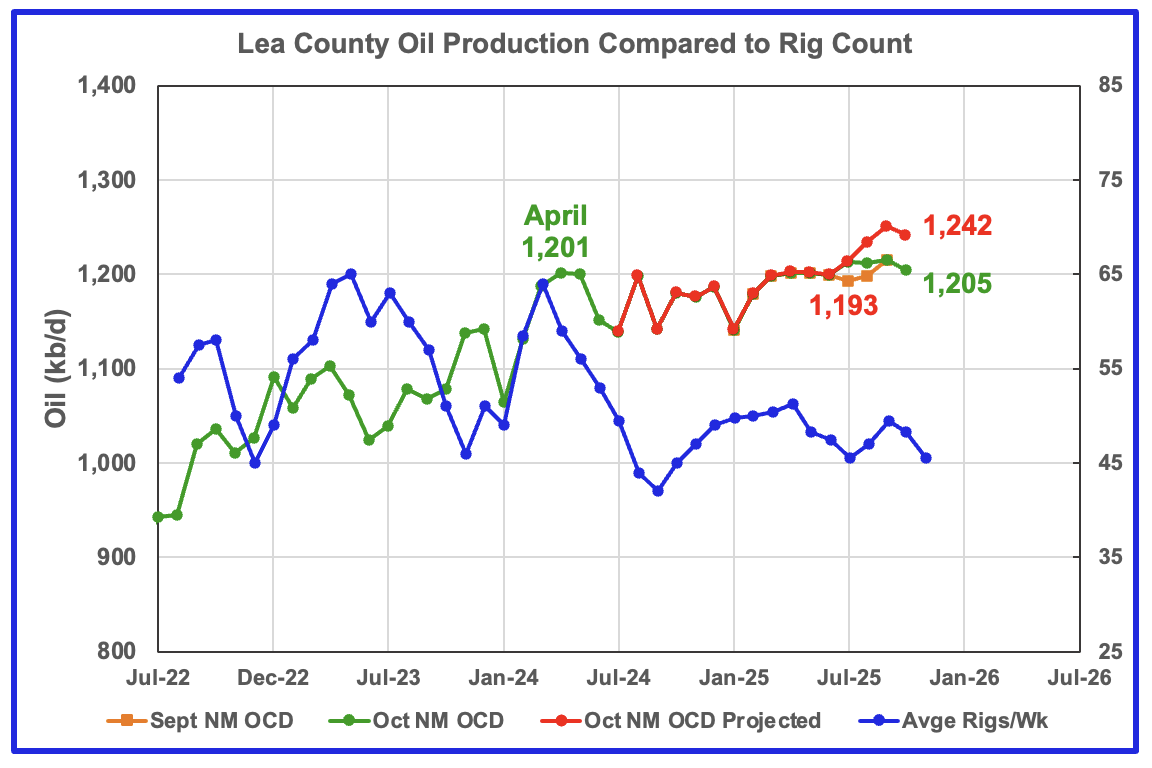
Lea County’s oil production started its plateau phase in April 2024 at 1,201 kb/d and the plateau continues to October 2025 but with a small drop of 9 kb/d to 1,242 kb/d. This month’s projected production is a bit optimistic. The gap between the green and orange graph for July and August, i.e. two to three months before the end of the month, is bit unusual since increments/revisions of the order of 16 kb/d between months rarely appear this far back and biases the projection toward being a bit optimistic. Note how there is no gap for September. For this report a better estimate for September’s and October’s projected production is 1,220 kb/d and 1,210 kb/d, respectively, a decrease of close to 30 kb/d for each month.
Preliminary October data from New Mexico’s Oil Conservation Division (OCD) indicates Lea County’s oil production dropped by 10 kb/d to 1,205 kb/d, green graph, and is a second indictor that production is on a plateau in Lea County. The October production drop could be associated with the dropping rig count that starts in time shifted October 2025.
A few months back I had the impression that Lea county was on the verge of entering a slowly declining phase. However after looking at the data over the past months showing very flat production from April 2024 to August 2025 and a rise in September followed by a drop in October, one cannot infer/see a start to slowing production. A plateau is a better call at this time. However looking at the time shifted rig graph, Lea county could be entering a temporary slowly declining phase before rebounding in February 2026.
The blue graph shows the average number of weekly rigs operating during a given month as taken from the weekly rig data. The rig graph has been shifted forward by 7 months. So the 64 Rigs/wk operating in August 2023 have been time shifted forward to March 2024 to show the possible correlation and time delay between rig count, completion and oil production.
Note that rig counts are being used to project production as opposed to completions because state completion data is not available. However completion data from the Drilling Productivity report below indicates that extra DUCs are being completed in the Permian at this time.
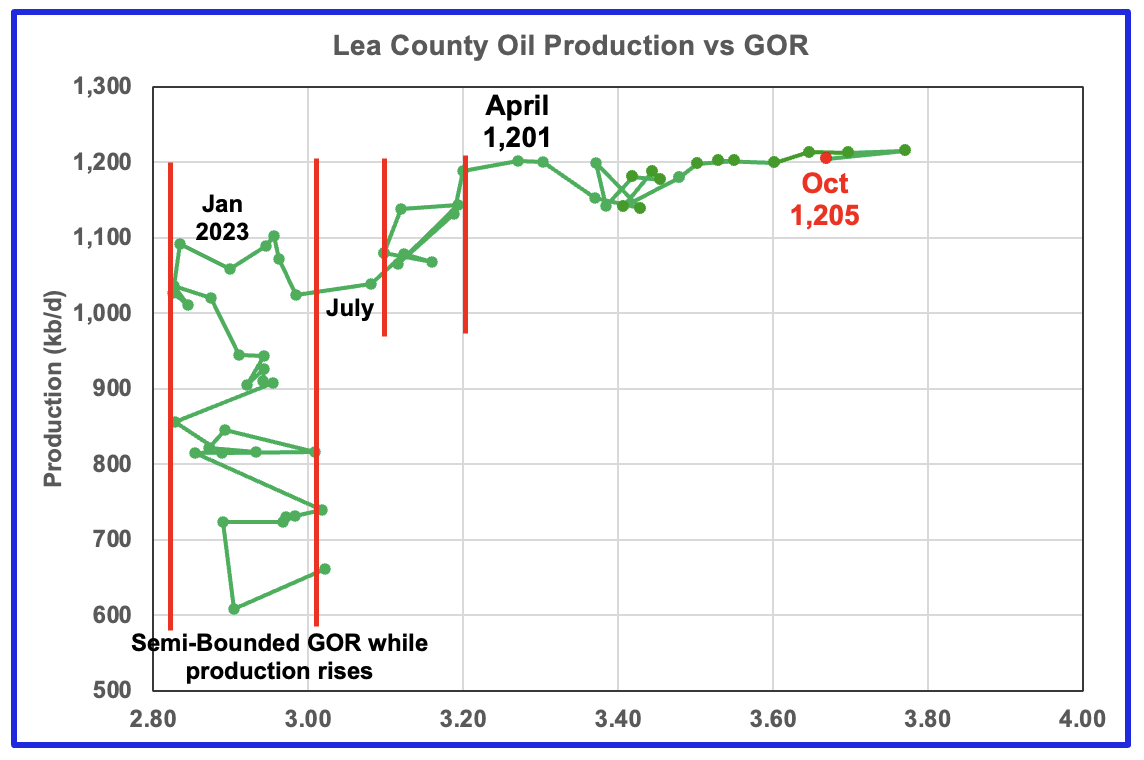
After much zigging and zagging, oil production in Lea county stabilized just below 1,100 kb/d in early 2023. Once production reached a new high in January 2023, production appeared to be on a plateau while the GOR started to increase rapidly to the right and first entered the bubble point phase in July 2023.
Since July 2023 Lea County’s production continued to increase as the GOR remained within a second semi-bounded region. This may indicate that additional production was coming from an oilier part of a layer since the GOR’s behaviour since August 2023 to March 2024 time frame appears once again to be in a second semi bounded GOR phase accompanied with rising production.
The GOR moved out of the second semi-bounded GOR region in April 2024 as production hit a new high of 1,201 kb/d. From July 2024 to February 2025 the GOR was range bound between 3.43 and 3.48 but from March 2025 to September 2025 the GOR has risen every month to hit new highs. September’s GOR was 3.77 while preliminary production increased to a new high of 1,215 kb/d. October saw both a small production drop to 1,295 kb/d and a GOR drop to 3.67.
This zigging and zagging GOR pattern within a semi-bounded GOR while oil production increases to some stable level and then moves out to a higher GOR to the right has shown up in a number of counties. See a few additional cases below. The rising GOR to new highs and flat oil production in Lea county is an early indicator that production may be close to entering a declining phase.
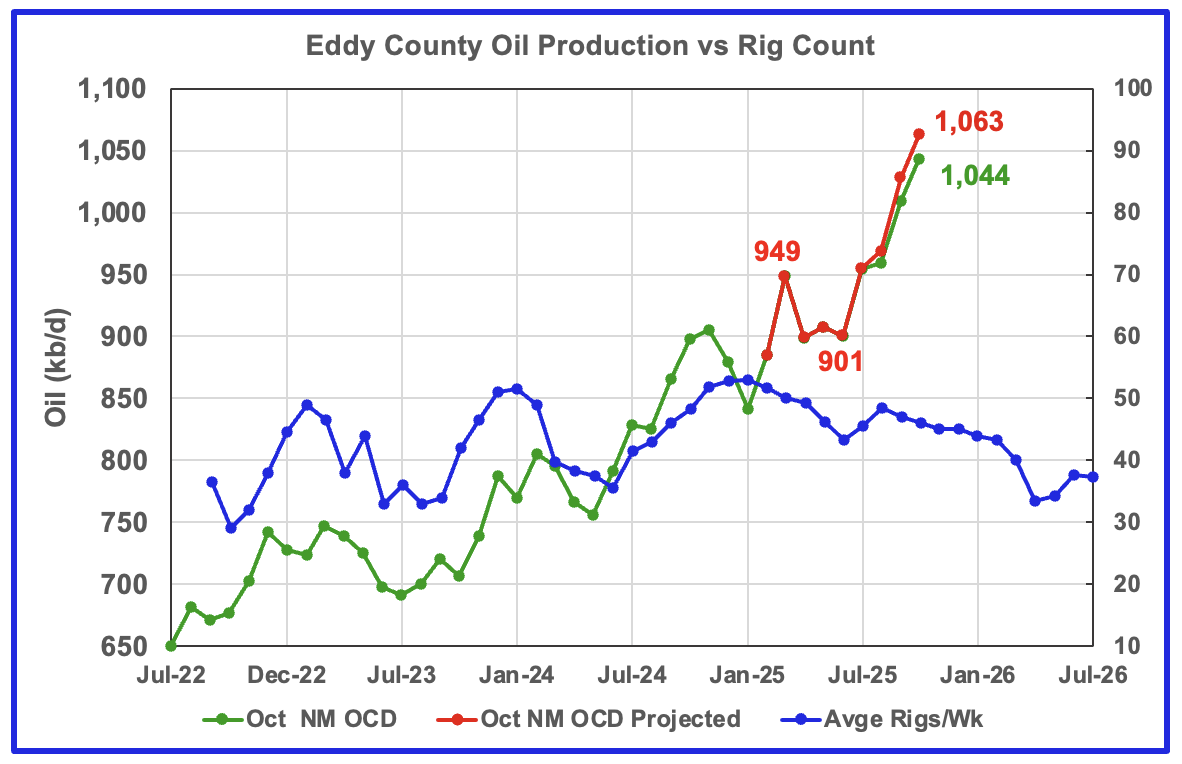
October’s projected oil production increased by 35 kb/d to 1,063 kb/d, a new high while preliminary production from the NM OCD also increased by 35 kb/d to 1,044 kb/d. Eddy county’s month over month production updates are very few and small and primarily occur in the last two or three months which indicates their preliminary production is very close to final. This month’s updates/revisions again were minimal.
Note that from June 2025 to October 2025, projected production in Eddy County increased by 162 kb/d. Over the same period, preliminary production reported by the OCD is up by 144 kb/d.
The rising production could be linked to the increasing rig count starting in time shifted June 2025. However the rig count for September and October and going forward is dropping while production continues to rise. This implies that Eddy County has been drilling in some very productive areas or been completing extra DUCs or drilling longer laterals beyond three miles.
Unfortunately an article by Mike Shellman, which I quickly scanned and hoped to quote is not available any more. As I recall he indicated that Lea County is on a plateau and that the best drilling areas remained in Eddy County. This month’s charts for Lea and Eddy counties show he is bang on. I hope I have not misinterpreted him.
In a newer Post Mike says this: New Mexico is mostly Federal BLM lands and a 1/16th reduction in royalty burdens can amount to $2MM in additional cash flow; New Mexico, Eddy County anyway, has got some room to roll, the Midland Basin, not.”
The blue graph shows the average number of weekly rigs operating during a given month as taken from the above weekly drilling chart. The rig graph has been shifted forward by 8 months to roughly coincide with the increase in the production graph starting in November 2023.
Clearly the production rise up to November 2024 is closely associated with the rise in the rig count and associated well completions delayed by roughly eight months. After November difficult to provide the primary reason for increasing production.
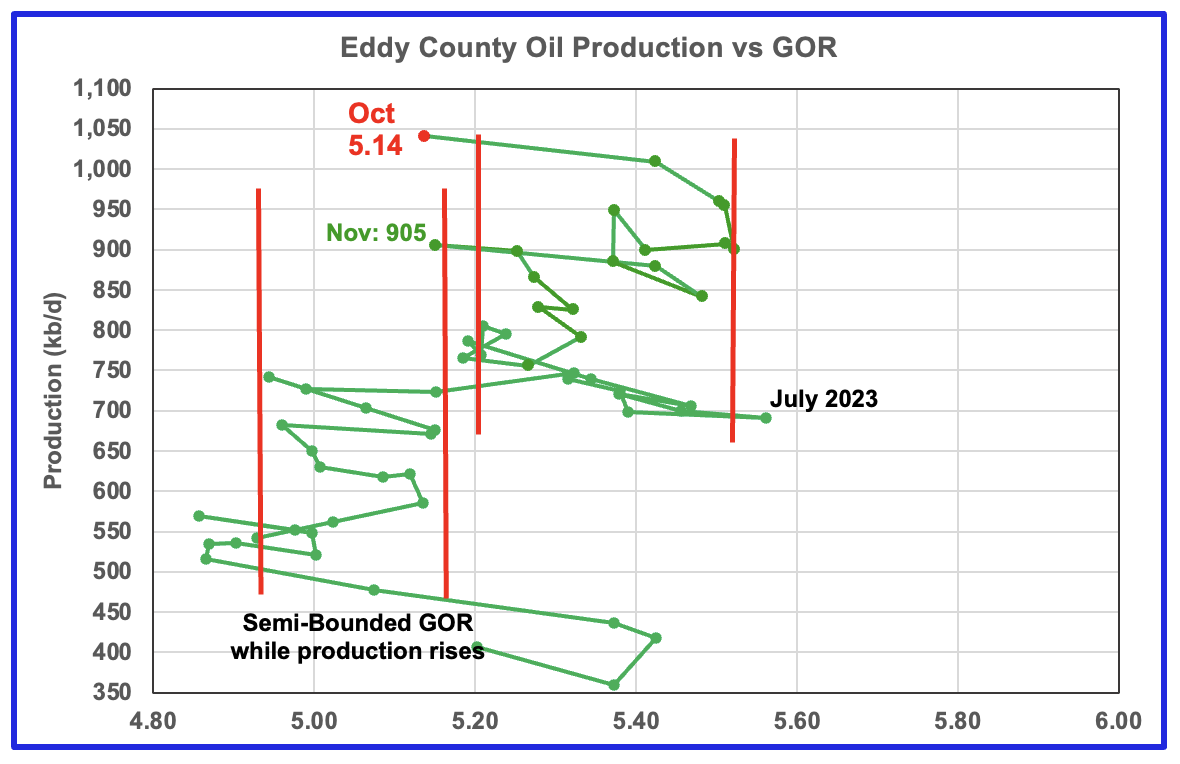
The Eddy county GOR pattern is similar to Lea county except that Eddy broke out from the first semi bounded range earlier and then added a second wider semi-bounded GOR phase. For October New Mexico’s Oil Conservation Division (OCD) reported preliminary oil production increased by 35 kb/d to 1,044 kb/d while the GOR dropped to 5.14 and dropped back into the first Semi-Bounded GOR range.
Texas Permian
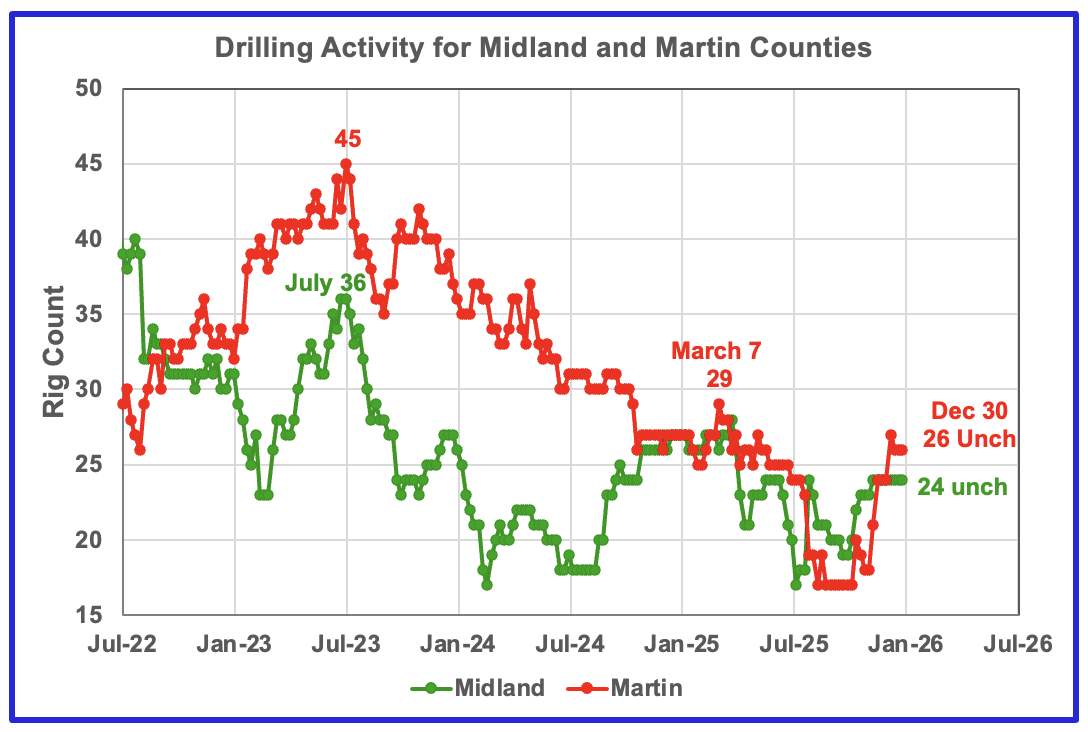
The rig count in both Midland and Martin counties has increased over the past few months. Martin dropped 1 rig to 26 in December after adding rigs in October and November while Martin held steady at 24 in November and December.
Oil Production in Primary Permian Texas’ Counties
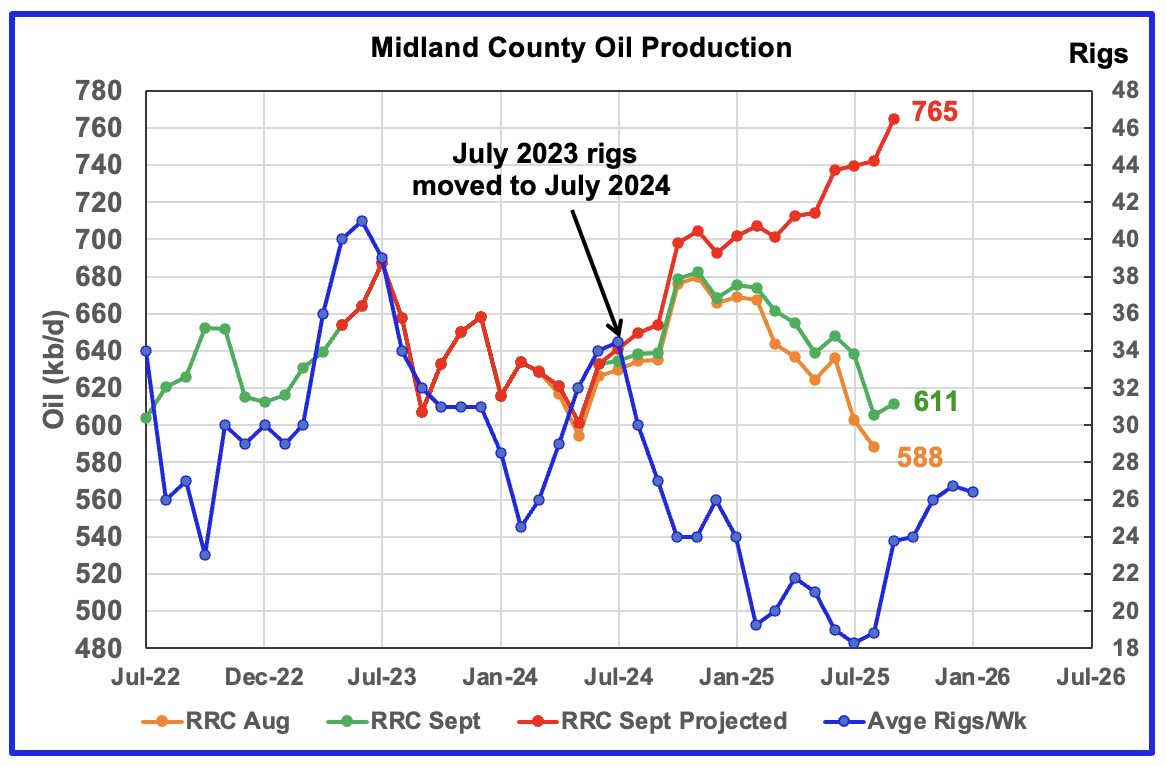
Comparison Chart: Midland chart posted in the September report.
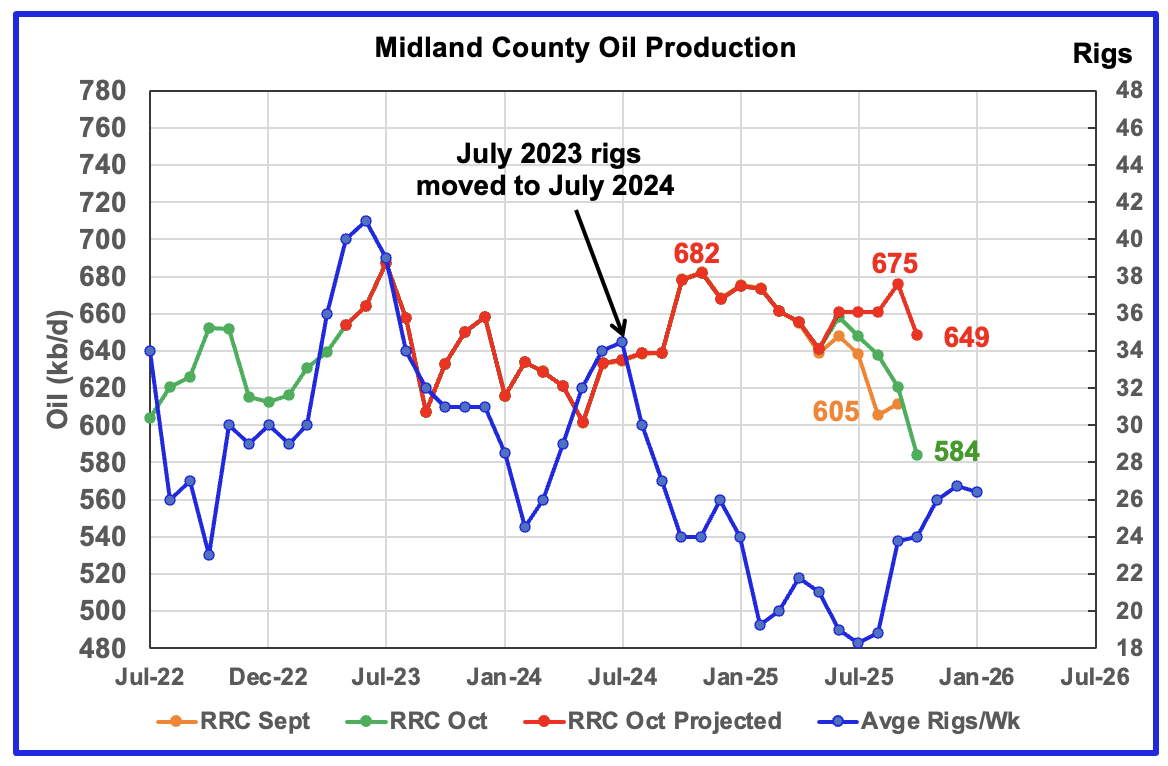
October’s projected production dropped by 26 kb/d to 649 b/d. In the previous report I noted that September’s projected production looked optimistic (See comparison chart above) and a “more realistic production projection for September was in the 710 kb/d to 720 kb/d range”. Even that estimate was too high by about 35 kb/d. September came in at 675 kb/d.
Compare the gap between the orange and green graphs in this chart with the previous comparison chart. Production revisions don’t start till June 2025 in the current chart, increasing the probability that the projection may be more realistic/accurate. The projection is indicting that at best, Midland may be in a plateau phase. The large October drop could be the beginning of a declining phase.
The orange and green graphs show preliminary oil production for Midland County as reported by the Texas RRC for September and October. The red graph uses the September and October data to project production as it would look after being updated over many months.
The blue graph shows the average number of weekly rigs operating during a given month as taken from the weekly drilling chart. The rig graph has been shifted forward by 12 months to better align with production. So the average 34.5 Rigs/wk operating in July 2023 have been moved forward to July 2024 to show the possible correlation and time delay between rig count, completions and oil production.
The 12 month rig time shift is much larger than the typical six to eight months used in other counties. It is not clear why there should be such a difference. It is surprising how the large jump of 6 rigs/wk from time shifted July 2025 to October 2025 only manages to keep production flat.
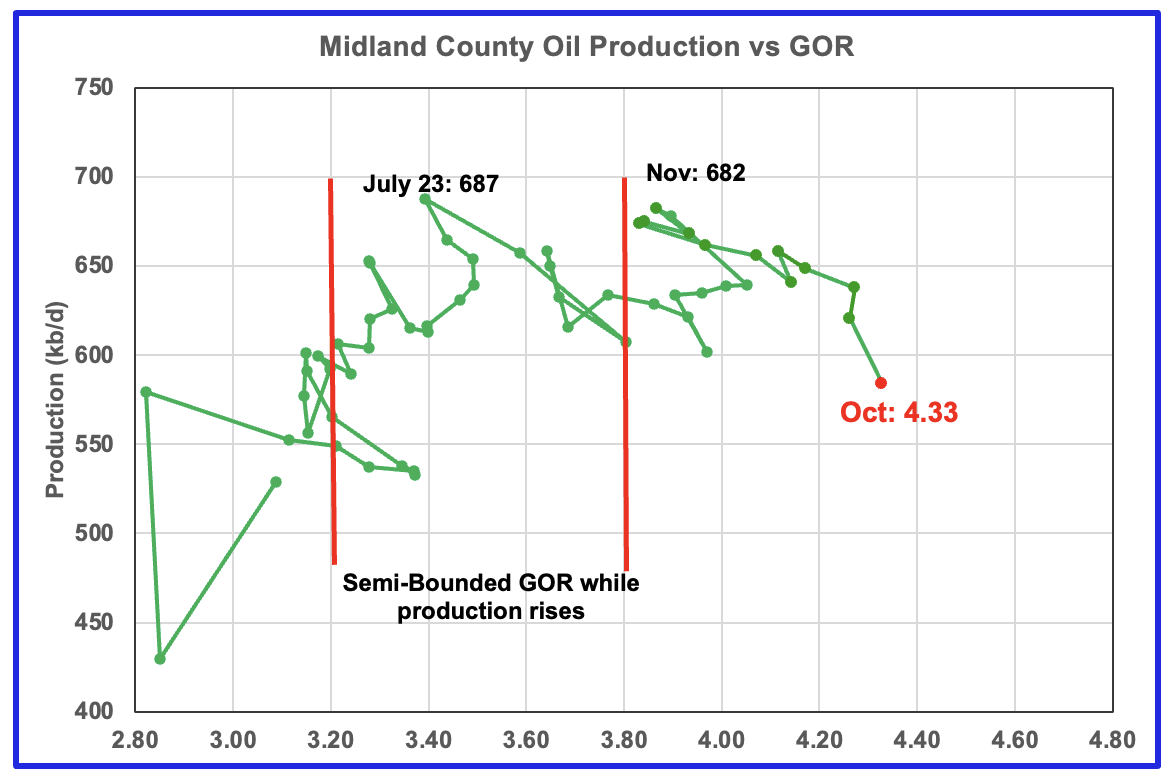
For October the Midland GOR ratio rose to 4.33 from 4.26 in September while the reported preliminary oil production dropped by 37 kb/d to 584 kb/d.
When Midland county GOR initially moved into the bubble point phase, oil production and the GOR stayed within a narrow GOR range of 3.8 to 4.0 outside of the initial Semi-Bounded GOR region from March 2024 to March 2025. However after March, the April to October 2025 GORs broke out to new highs. The October GOR rose to a new high of 4.33.
The oil production and GOR data shown in this chart are based on the RRC’s October preliminary production report.
Martin county’s projected October oil production rose by 26 kb/d to 728 kb/d. I think October’s projected production is a bit optimistic and a more realistic level would be somewhere between 700 kb/d and 710 kb/d. The October projected production is slightly optimistic because the MoM updates, the gap between the orange and green graphs, are larger than in previous months over the last three months.
The August 2024 and April 2025 peaks are close to 710 kb/d. Using a better estimate of 705 kb/d for October’s projected production and combining it with the falling rig count may indicate that Martin county may be in its oil production plateau phase.
The red graph is a projection for oil production as it would look after being updated over many months. This projection is based on a methodology that uses preliminary September and October production data.
The orange and green graphs show production for Martin County as reported by the Texas RRC for September and October. The blue rig graph time shifts the rig count forward by 6 months.
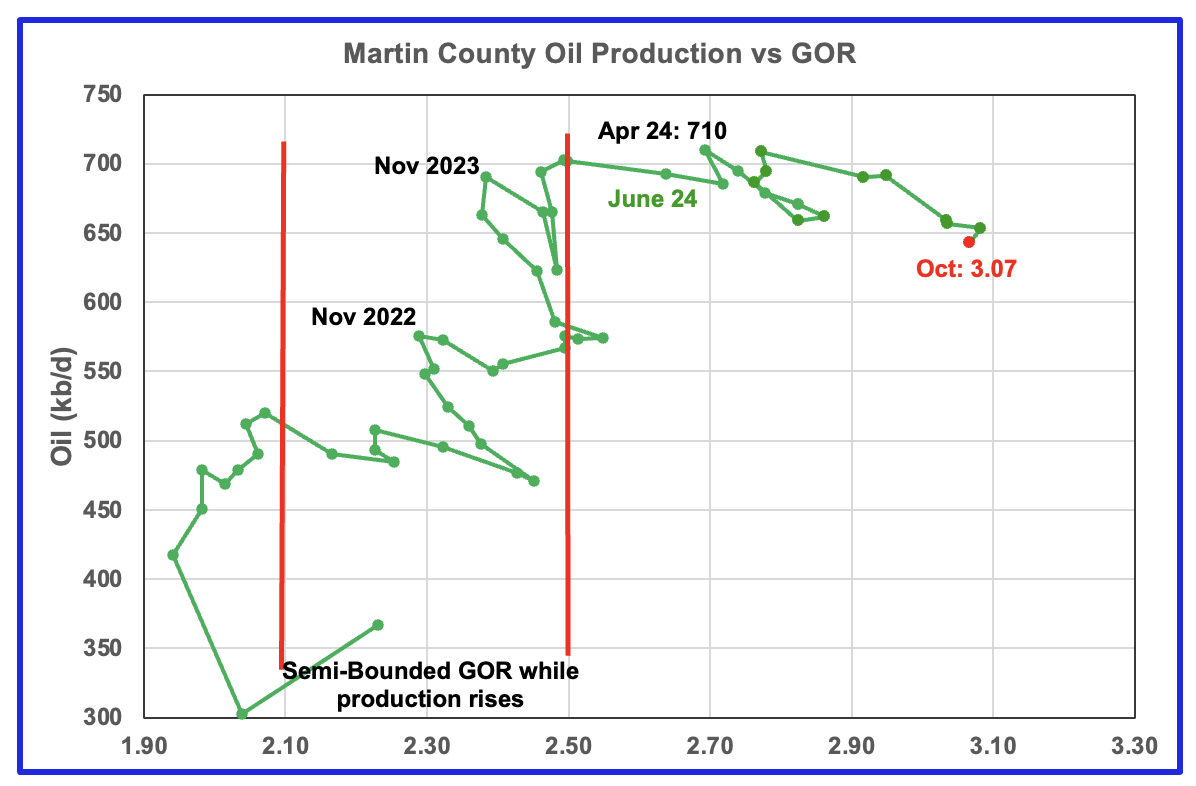
Martin county’s oil production after November 2022 increased and at the same time drifted to slightly higher GORs within the semi bounded range. However the June 2024 GOR saw its first move out of the semi bounded region. The RRC’s preliminary October 2025 production for Martin County shows a 11 kb/d decrease accompanied by a small decrease to the GOR to 3.07.
Martin county has the lowest semi-bounded GOR boundary of the four counties at a GOR of close to 2.50. The October GOR is now clearly out of the semi-bounded region. Martin County has now entered the bubble point phase that should result in oil production staying in a plateau phase before entering a slowly declining phase.
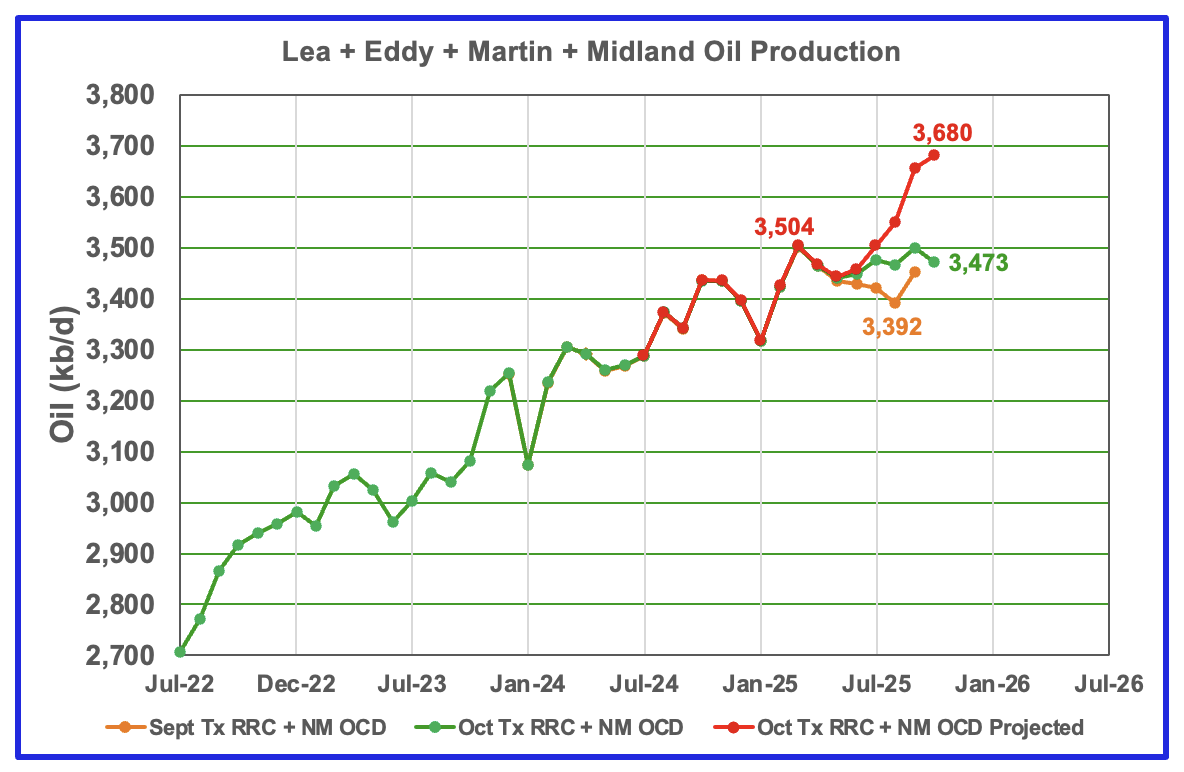
This chart shows the total oil production from the four largest Permian counties. Assuming current Permian production is close to 6,600 kb/d, these four counties account for 56% of the total. October’s projected production increased by 24 kb/d to 3,680 kb/d and is the fifth consecutive month showing increasing production.
The production projection is too optimistic by orders of 70 kb/d to 90 kb/d. October’s production should be closer to 3,600 kb/d. It is too optimistic due the under reported production of 74 kb/d for August 2025 in the last report, the gap between the green and orange graphs. Note also that March 2025 production has been revised down by 90 kb/d from 3,594 kb/d in the Sptemeber report to 3,504 kb/d in this report. The main source for production growth has been Eddy County.
The September and October initial production data are shown in the orange and green graphs respectively. The red graph uses the September and October production data to project a more realistic estimate for the final updated October production.
Findings
– The preliminary October production data for New Mexico is OK. The Texas RRC production data had MoM revisions that resulted in slightly optimistic projections.
– Lea county entered its plateau phase in May 2024. While oil production is not following the rig count graph directly, the dropping rig count has resulted in Lea County production being in a steady flat plateau phase up to August 2025. However September had a 17 kb/d production increase followed by a 9 kb/d decrease. Lea is still in its plateau phase.
– July to October production in Eddy County saw a steady increase to a record high of 1,063 kb/d and is possibly signalling the beginning of a short increasing production phase.
– Updated October Texas RRC production indicates that Midland County’s production may be in a plateau phase. The addition of six new rigs to Midland county in real August 2025 to 24 from 18 was an unexpected surprise and makes one wonder what it implies for Midland county oil production going forward after allowing for a rig count/production delay.
– Martin County appears to be in a plateau phase that started in May 2025.
Texas District 8
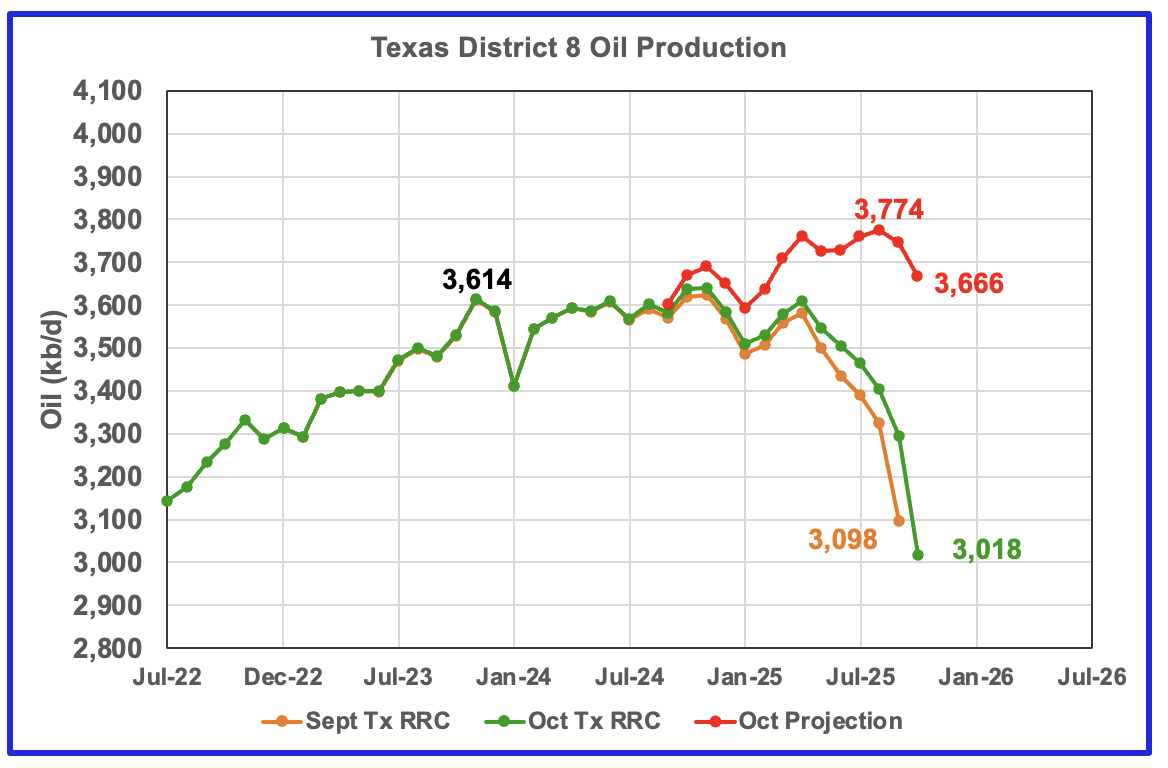
The District 8 projected production chart is now showing a plateau phase followed by dropping production. In last month’s post, I wrote: “A more realistic production level for April to July is 3,700 kb/d and 3,800 kb/d for September.” Notice that the three green peaks are close to 3,600 kb/d which maybe indicating an upcoming plateau phase.
October saw a projected production drop of 79 kb/d to 3,666 kb/d.
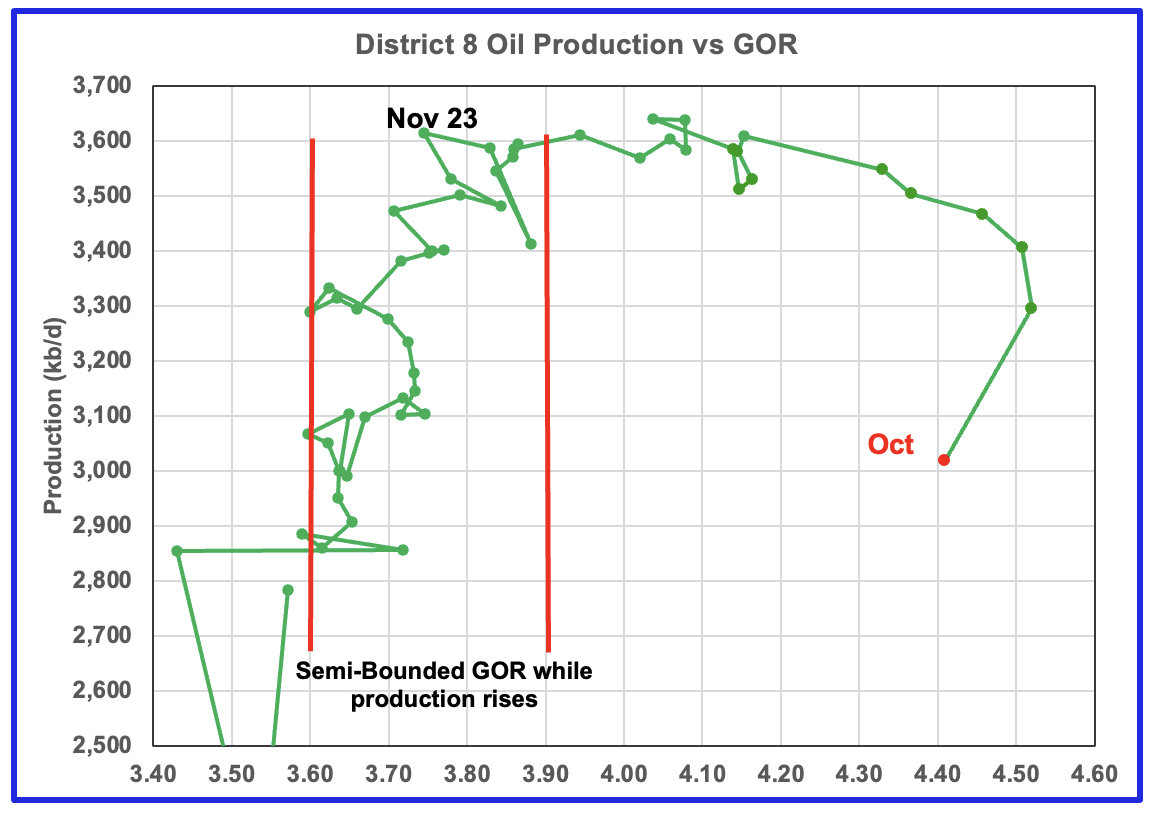
Plotting an oil production vs GOR graph for a district may be a bit of a stretch. Regardless here it is and it seems to indicate many District 8 counties may well be into the bubble point. The October GOR decreased slightly to 4.41 as the preliminary RRC production took a large drop of 277 kb/d.
Oil Production and GOR Charts for Three of the Larger Texas Oil Counties
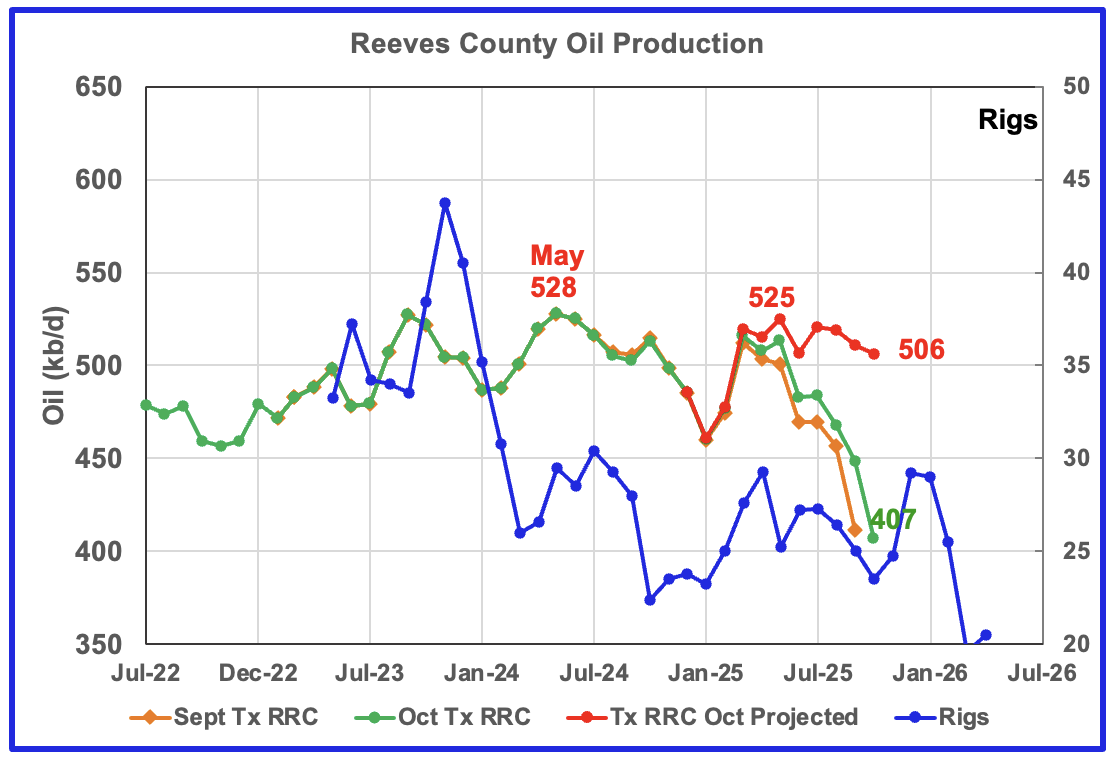
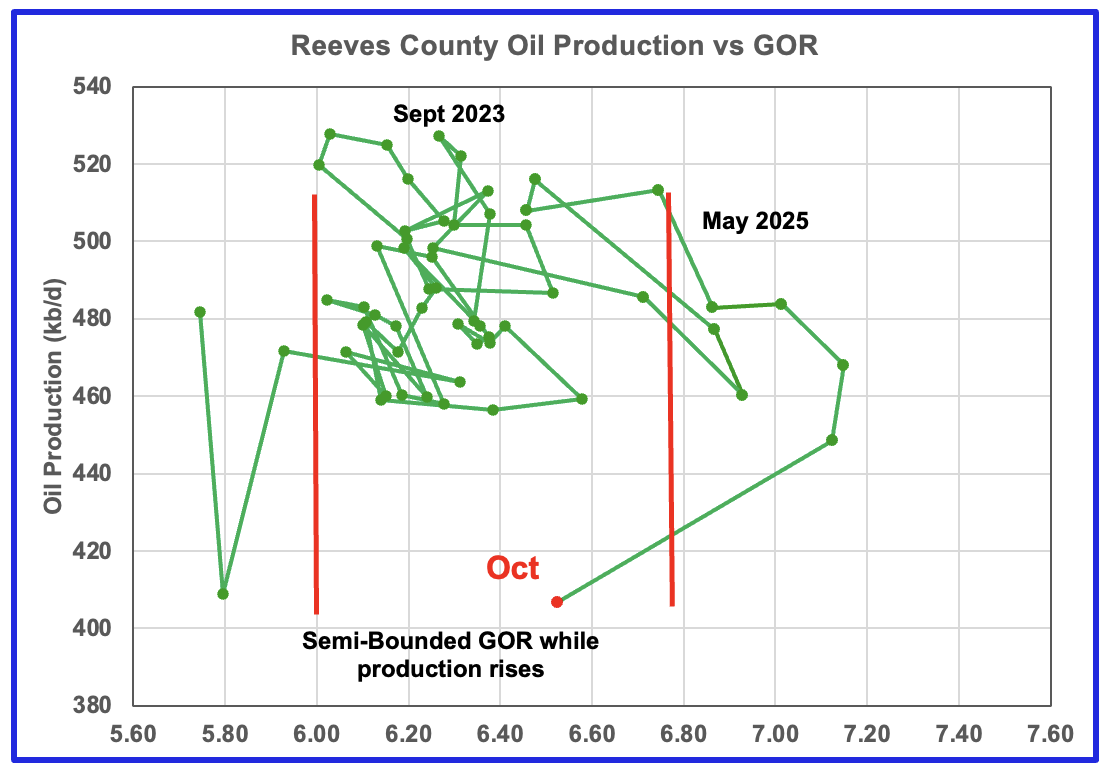
Reeves county GOR is high because it is the number one Texas county ranked by gas production. The current C + C production is almost split between crude and condensate, with concentrate about 15% higher than crude. October projected production dropped by 5 kb/d to 506 kb/d.
The rig count is time shifted forward by 7 months.
In Real June 2025, 29 rigs were operational in Reeves county. By late December the rig count had dropped to 13.
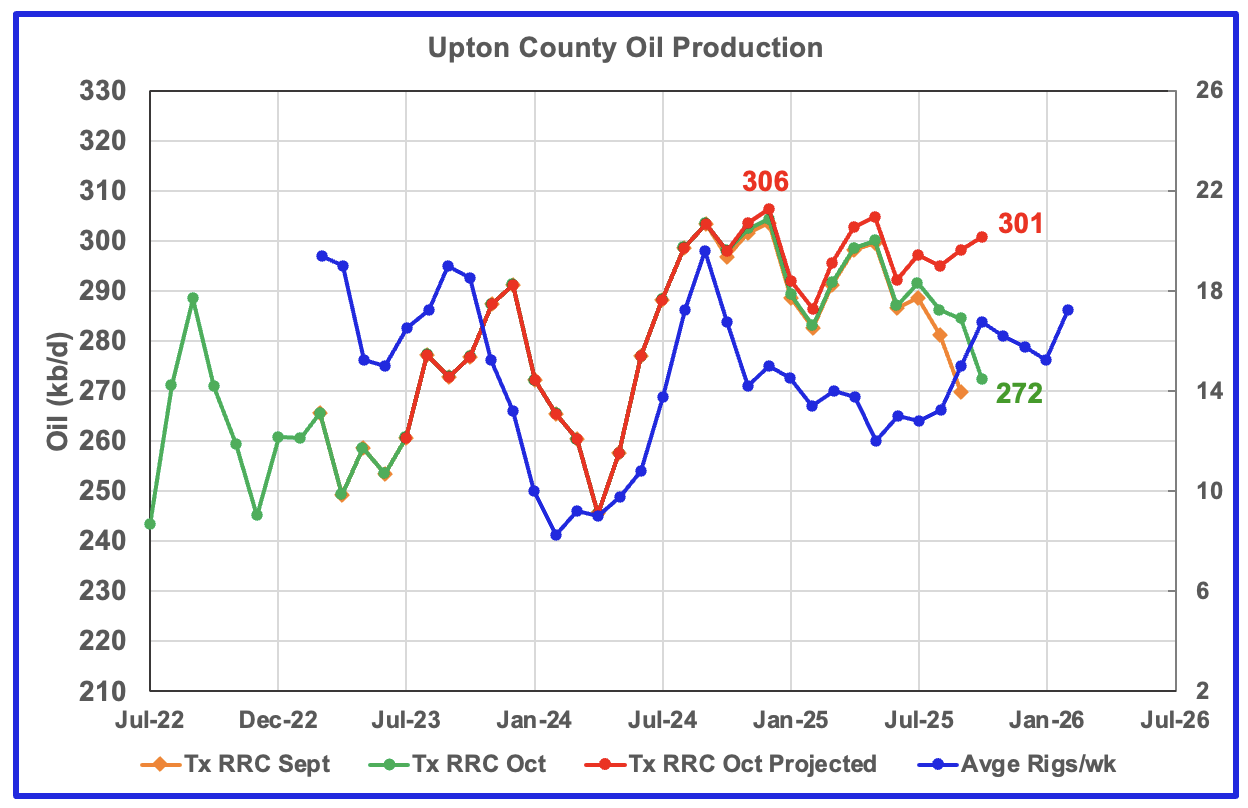
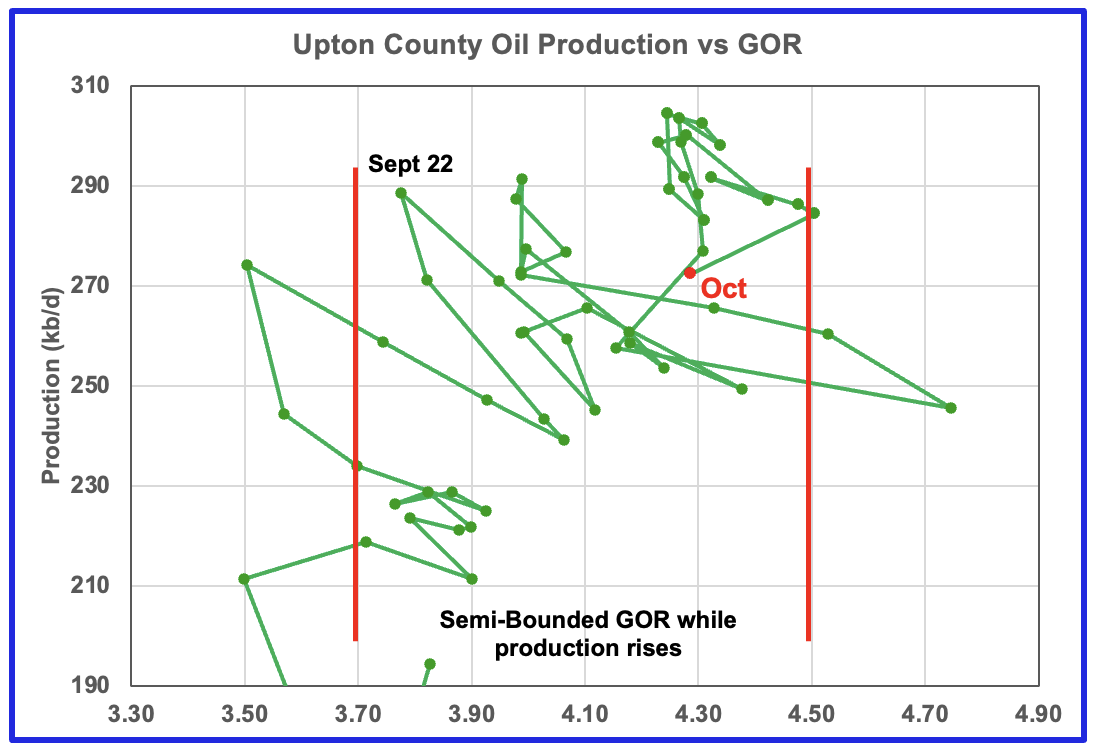
Upton County entered its slowly declining phase in January 2025. October’s projected production rose by 3 kb/d to 301 kb/d. For the next few months Upton County may see a production increase associated with the rising rig count which started in time shifted August 2025. A decline may begin in November/December.
Upton’s oil production may be on the verge of entering the bubble phase since it barely popped out of the Semi- Bounded region in September and then re-entered it in October.
Upton’s rig chart has been time shifted forward by six months. Upton began the year with 13 rigs. In real December 2025, 7 rigs were operating.
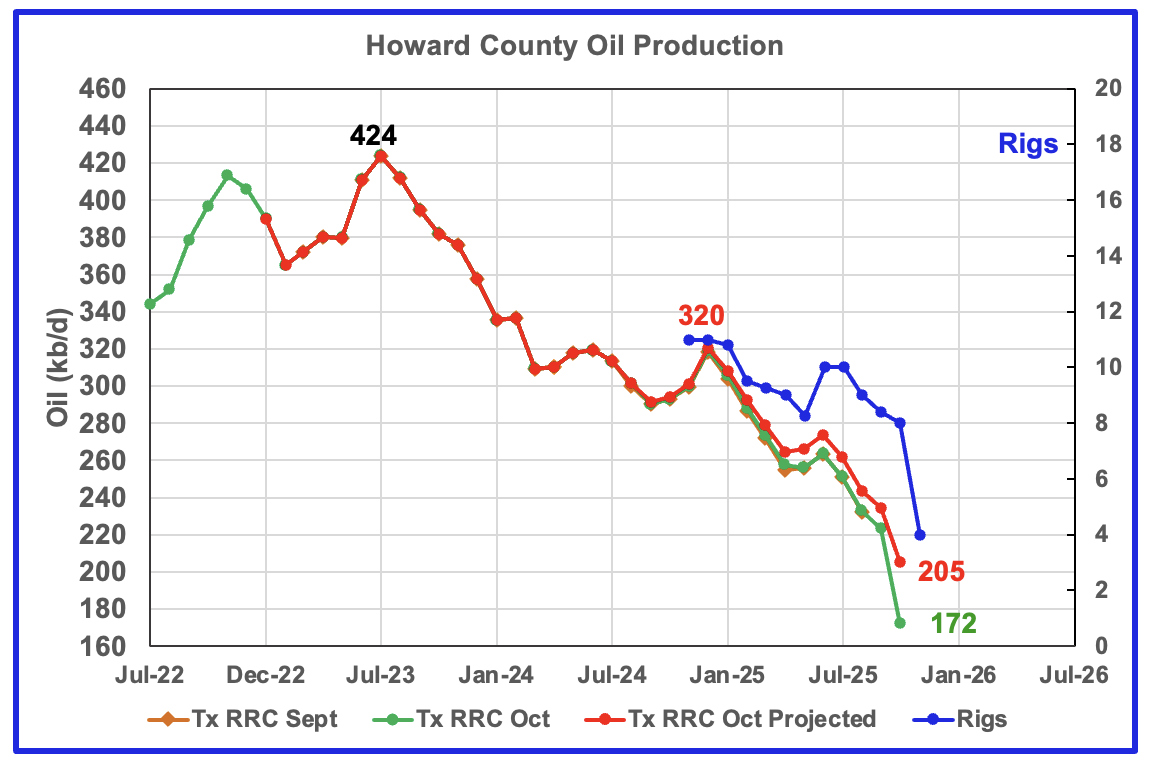
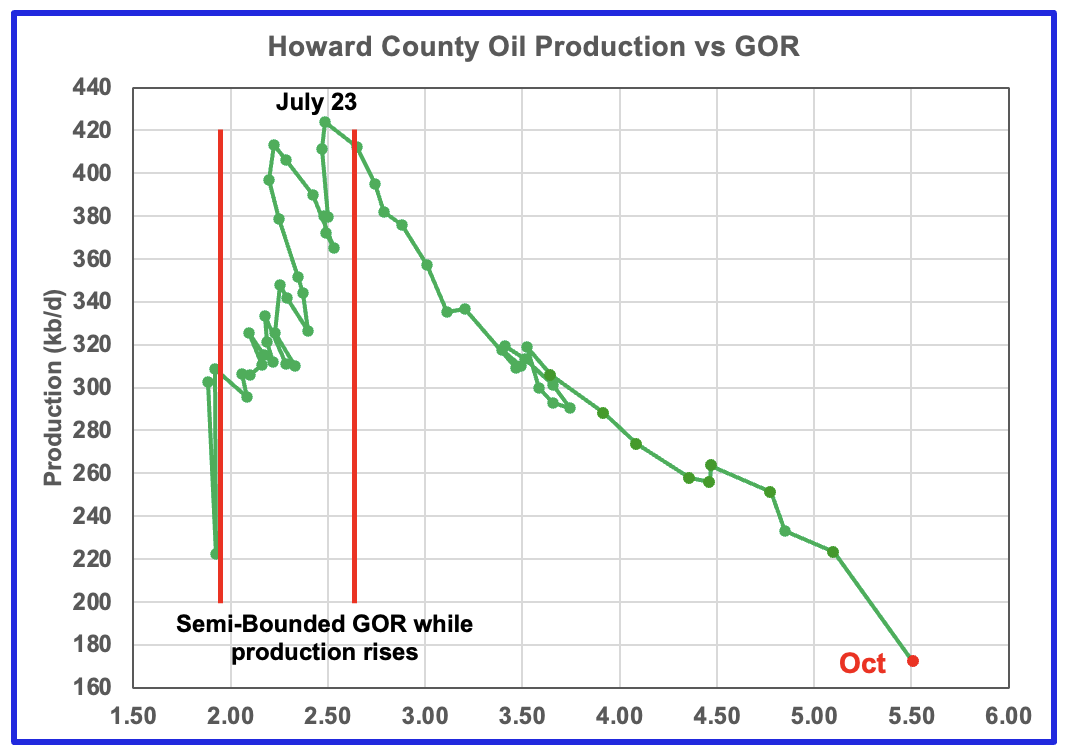
Howard County oil production peaked in July 2023 and has been in a slow decline ever since. The falling production has been falling along with the dropping rig count. In October the projected production dropped by 30 kb/d to 205 kb/d.
The rig graph is time shifted forward by 5 months.
The GOR continues to increase as production drops. The GOR ratio reached a new high of 5.51 in October.
Drilling Productivity Report
The Drilling Productivity Report (DPR) uses recent data on the total number of drilling rigs in operation along with estimates of drilling productivity and estimated changes in production from existing oil wells to provide estimated changes in oil production for the principal tight oil regions. The new DPR report in the STEO provides production up to November 2025. The report also projects output to December 2026 for a number of basins. The DUC charts and Drilled Wells charts are also updated to November 2025.
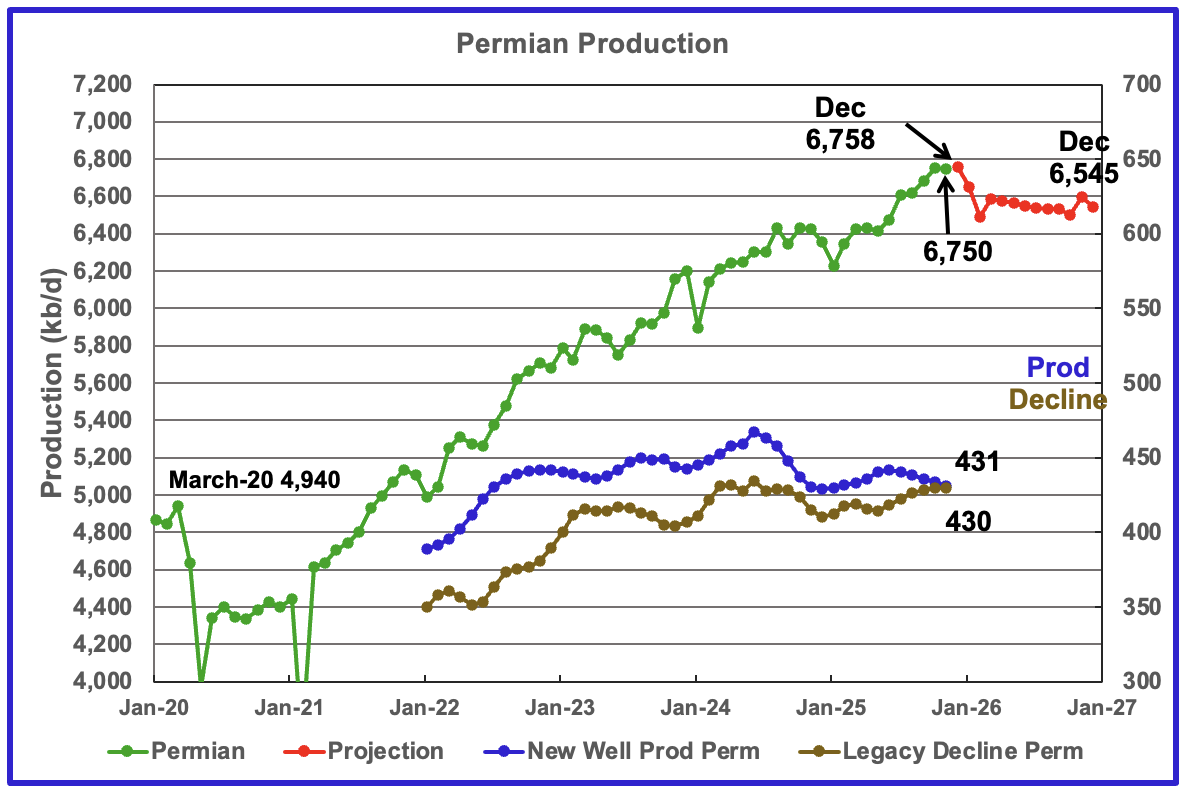
The EIA’s November STEO/DPR report shows Permian November output dropped by 4 kb/d to 6,750 kb/d. December is expected to add 8 kb/d to 6,758 kb/d and then begin dropping in January. From November 2025 to December 2026 output is expected to drop by 245 kb/d to 6,545 kb/d. Note that December 2026 production has been revised down by 26 kb/d from 6,571 kb/d to 6,545 kb/d.
Production from new wells and legacy decline, right scale, have been added to this chart to show the difference between new production and legacy decline. The gap has been getting smaller every month for the last six months and is now essentially gone.. If this trend were to continue, it portends peak Permian production.
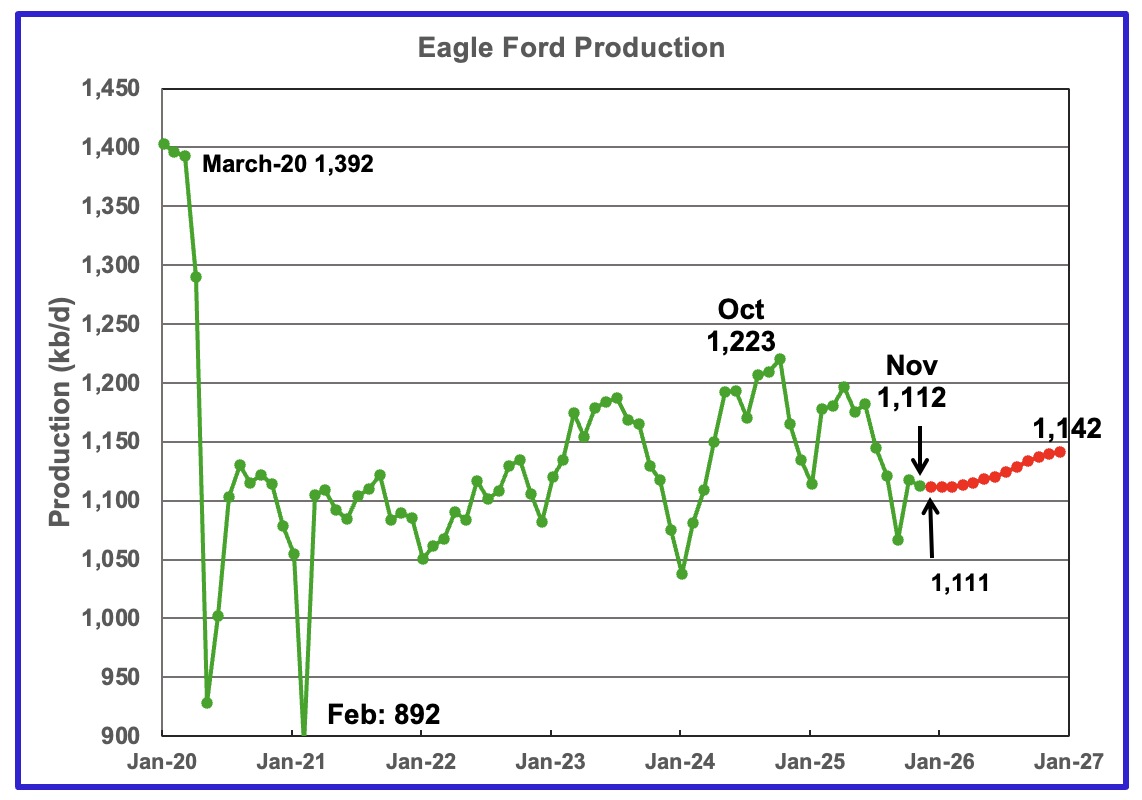
November’s output in the Eagle Ford basin decreased by 6 kb/d to 1,112 kb/d. December’s 2025 production is forecast to drop by 1 kb/d to 1,111 kb/d.
Output in December 2026 expected to be 1,142 kb/d, an increase of 7 kb/d from the previous report of 1,135 kb/d.
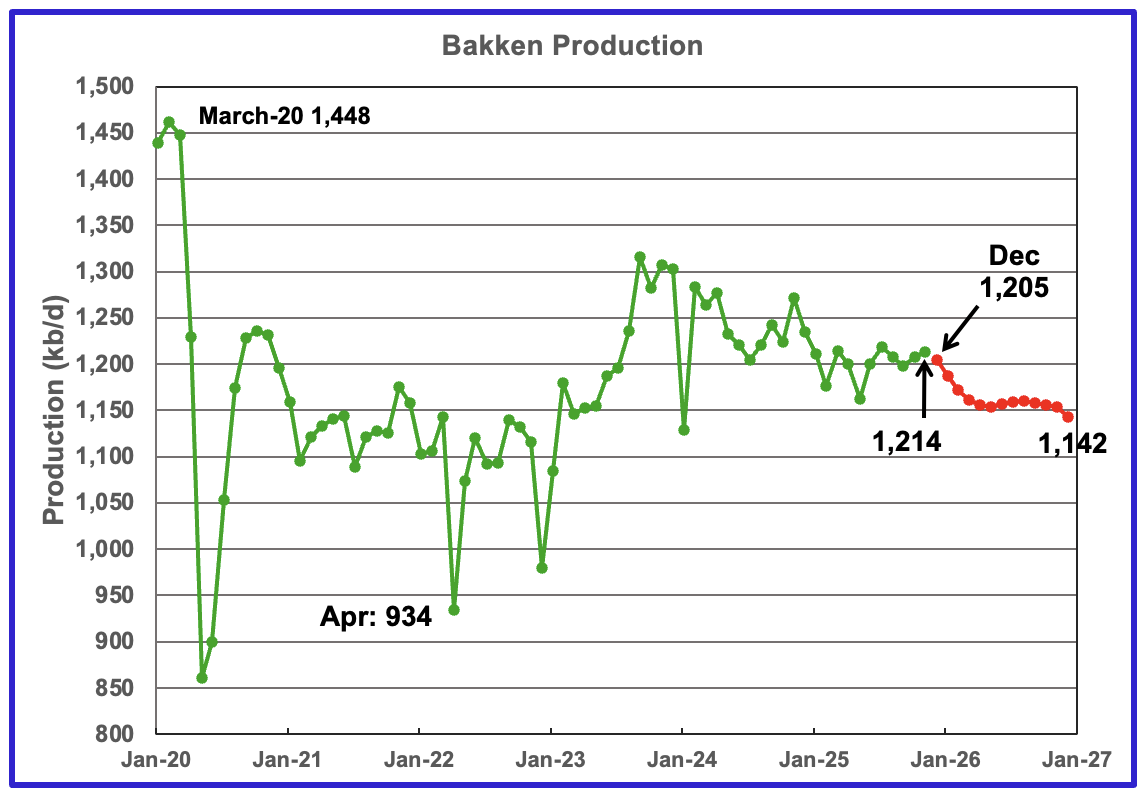
The DPR/STEO reported that Bakken’s November output rose by 6 kb/d to 1,214 kb/d. December production is expected to decrease by 9 kb/d to 1,205 kb/d. The STEO/DPR projection, red markers, shows output dropping to 1,142 kb/d in December 2026.
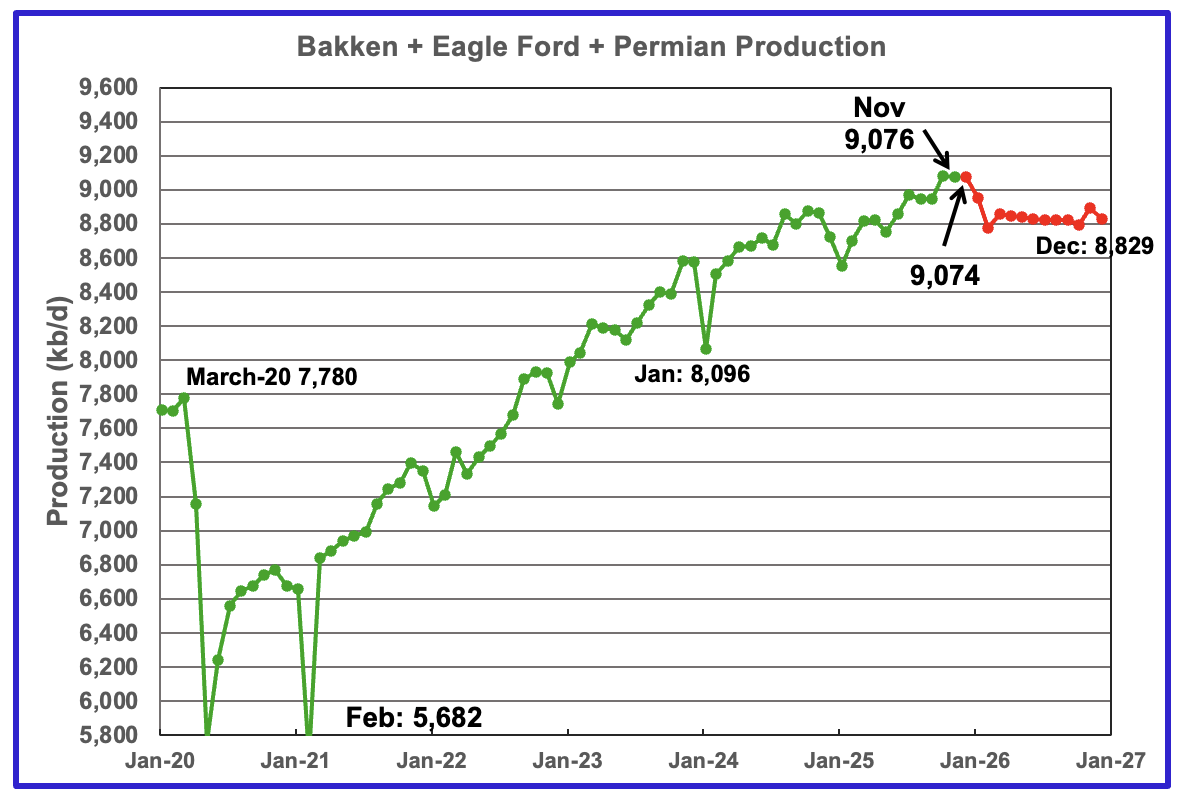
This chart plots the combined production from the three main LTO regions. For November output decreased by 3 kb/d to 9,076 kb/d. Production for December 2026 is forecast to be 8,829 kb/d, revised down by 43 kb/d from 8,872 kb/d to 8,829 kb/d.
DUCs and Drilled Wells
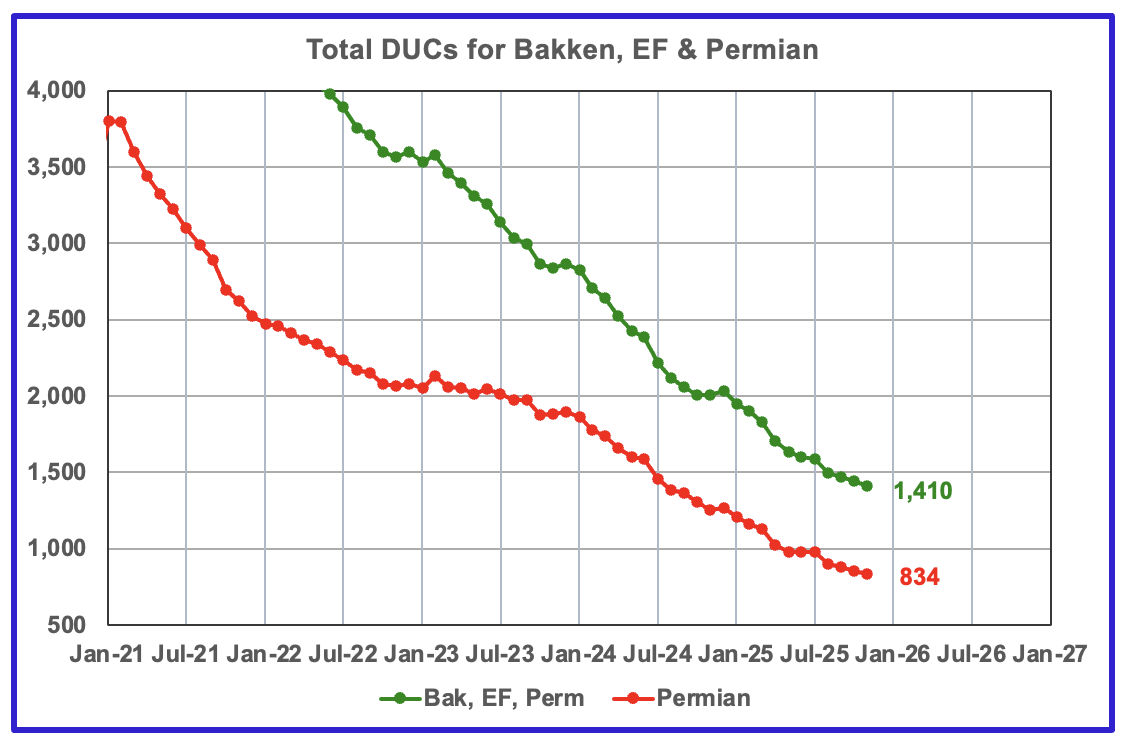
The number of DUCs available for completion in the Permian and the three major DPR regions has returned to a dropping trend. November’s DUC count for the three basins dropped by 34 to 1,410. In the Permian the DUC count dropped by 23 to 834.
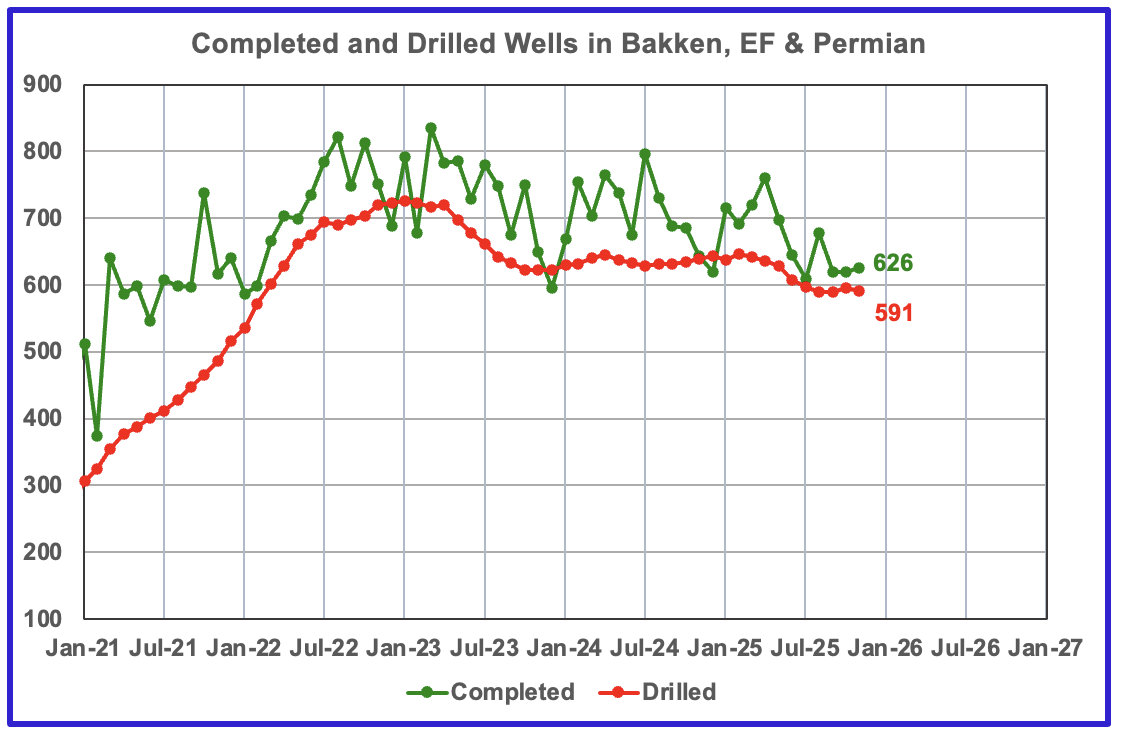
In the three primary regions, a total of 626 wells were completed in November, six more than in October. There were 591 wells drilled in November, 4 fewer than in October. For comparison, In January 2023, 722 wells were drilled.
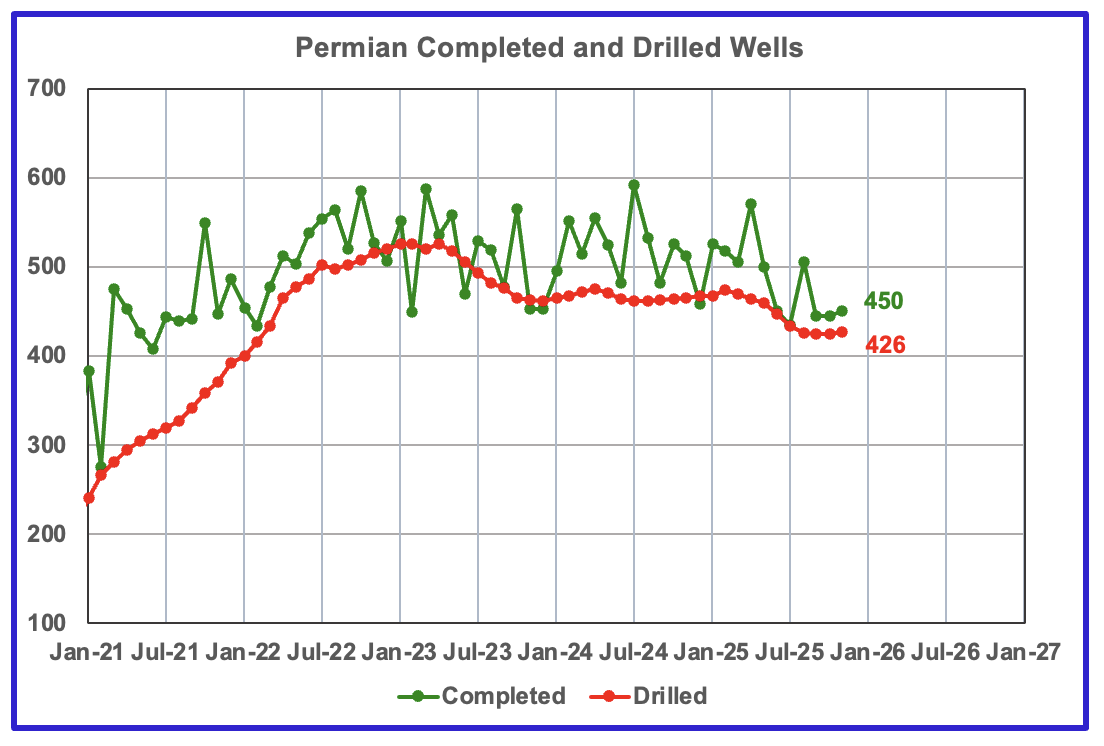
In the Permian, the monthly drilling rates have stabilized around 425 for the last 4 months.
In November 2025, 450 wells were completed and 426 new wells were drilled.
239 responses to “Record US October Oil Production”
If GOM production exceeds 2 MMBOPD for November and December, 2025 will be a record oil production year exceeding the old record of 1.90 MMBOPD set in 2019. Both years had no, or very limited, storm-related down time.
2026 should exceed 2025, again, assuming no or little storm down time.
While new fields are contributing a lot of new production, as Ovi has mentioned, there are 5 legacy fields/field complexes that continue to hang in there contributing around 700 KBOPD, or about 35% of the total GOM production.
These fields are:
Shell’s Mars-Ursa complex – 154 KBOPD – 1.8 BBO cum
BP’s Thunderhorse/Thunderhorse North complex – 153 KBOPD – 770 MMBO cum
BP’s Mad Dog – 133 KBOPD – 420 MMBO cum
Chevron and Oxy’s Tahiti/Caesar Tonga complex – 120 KBOPD – 696 MMBO cum
Chevron and Exxon’s Jack/St.Malo/Julia complex – 119 KBOPD – 509 MMBO cum.
Thanks Bob,
Do you expect GOM production can be maintained at 2000 kb/d for several years?
I think annual GOM production will hover around 2 MMBOPD through the early 2030s, and then start a terminal decline. This will be bolstered by the current new projects (Whale, Shenandoah, Anchor, Salamanca, Ballymore), the legacy projects I mentioned, and future projects including Kaskida, Tiber, Sparta and Daenerys (Talos’s 2025 discovery).
Some have thought GOM production could get as high as 2.4 MMBOPD,, but I don’t see that on an annualized basis, though there may be some months when it gets that high.
Note that GOM production will never be high enough to offset the eventual decline in the resource plays. The variability in GOM production is in the hundreds of thousands of barrels a day while the eventual decline in the resource play production will be in the millions of barrels a day.
Yeah…it’s not the Permian.* But it has done better than some of the articles on this site predicted. I still remember someone (not you), who had a great command of field names and did super detailed stacked area charts, predicting decline to 1.5 from 1.7ish (pre Covid). He laughed at EIA predicting 2.0. Then 2.0 happened. He disappeared for a few years after.
I’d also say that looking out to 2035, there are possibilities we learn something new, find something new. That area has been called dead for decades, but ended up coming back. And it has favorable geopolitics. And sort of has been a technology incubator, for ultra deep water and seismic.
P.s. Thank you for your insights and gentlemanliness.
*Then again a lot of people didn’t expect the Permian to be the Permian. Not just here, but even Mark Papa made comments about U.S. shale just being the Bakken and EF. So, there’s always some uncertainty to the upside. (The downside, depletion/decline, is easier to predict.)
Thank you Bob.
I made my first predictions of GOM oil production back in 2016. At that time, by L-M-H ranges for 2025 GOM production were 1.2 – 1.5 – 1.6 mmbopd. So even my high range estimate has been exceeded. I also thought that some of the EIA estimates were too high at that time. I made the mistake of having too narrow of a range – a common one, thinking I knew more than I did.
My 2016 EUR ranges were 30-37-47 BBO. My latest EUR range is 33-37-42 BBO. The current cumulative oil, estimated through 2025, is 26 BBO. I may be making the same mistake about EUR – too narrow of a range?
Hi Bob,
When making these estimates there is always much more room to the high side. Currently we know the minimum cannot be less than 29 Gb when we add proved reserves to cumulative output (assuming output will at least be equal to proved reserves), often there is reserve growth and 2P reserves are typically 1.5 times proved which gets is close to your low number. Medium case would often be 30% higher than my low estimate and high case about 30% higher than medium case. Even 40 or 50% might work. Taking your recent low case of 33 Gb, maybe 43 Gb for mid case and 55 Gb for high case (using 30% increments). You actually know a lot (as a former industry pro) so the narrow range may be more appropriate.
From AEO 2025, 5 cases for US L48 Federal Offshore (most will be GOM) see link below.
chart(114)
Bob
Have you seen any estimates for the decline rates for the GOM fields?
Ovi,
I have trouble uploading a BOEM decline curve analysis for oil and gas in OCS GOM/A after 2020, the upload never end up ok.
so, I managed to find the link,
https://www.boem.gov/sites/default/files/documents/oil-gas-energy/2022-2031%20Oil%20and%20Gas%20Production%20Forecast%20Review_0.pdf
see figure5,6 and table 4,5 for the legacy DCA.
Obviously, actual oil decline is slower than forecast which is based on marine sourced higher API&GOR oil.
Sheng wu,
What the data seem to indicate is that the forecasts have been more than actual output, which suggests that decline is in fact higher than estimated.
Also see this quote
“Note: the OCS, GOM Oil Production in Figure 5 excludes completions made on or after August 30th, 2021 as these did not exist at the time that the Auto-DCA algorithm was run.”
DC,
Please help me when I try to upload a file, what is the reason that I ended up unable to post or upload? the file size is under 1MB, and do I need to uncheck some pop-up?
About the DCA in figure 5 — it is for wells made before August 30, 2021, and the “green actual line” is actually higher than the “forecast black line”; but for gas, it is the opposite in figure 6.
What happened? my conjecture is that they used marine based higher API&GOR model for GOR increase, and ended up with way higher GOR estimate.
Figure 1-4 has shown forecast higher than actual production, but those are because the slower deployment of newer projects.
Ovi, thanks.
I put stuff up, and take stuff down because I am subject to plagiarism and the stealing of expensive charts all the time. People that want, desperately to be oil and gas analysts are too cheap to buy, or update their old “free” data; I have my resources and I don’t wish to be taken advantage of. I can go all the way to the top on that, like Bloomberg/Reuters and have the proof.
You don’t do that, thank you.
I will try and re-publish all the really CURRENT stuff I have on New Mexico, but you are spot on…and were two years ago: there are little to NO Tier 3/4 level drilling locations left in Lea County; EOG hammered it to oblivion. You saw where we were going two years ago. It is the first time that I’ve seen where county wide GOR was actually used as a look-see into the future, except for Midland County, which you also predicted. Lea County IS done. Thank ‘ol EOG for that. You should be commended.
Eddy is all there is left for the entire U.S. tight oil…hope.
One third of a county in S.W New Mexico, that has no frac source water, that sends all of its produced water to Texas for disposal, that will require 4-5 mile laterals to develop because of potash set asides, that with current prices at WaHa has to to flare its associated gas, or send its gas to Texas to flare. That is in deep in doo-doo already because of pressure depletion in the Bone Springs interval.
Every foreign recipient of 3.7 MM BOPD of Permian tight oil exports should be scared to death.
Jesus, how did so many Americans, like Annoying, get so stupid about one little lousy oil play? Why is it SO important to make predictions that never come to fruition?
It was the internet, and the need to be…entertained. Like video games. The internet made stupid people, stupider.
Oh Boy! Now we’ve got AI to look forward to. Hot diggity dog.
Scared to death why?
Only if you believe that OPEC has peaked which it has not.
Then there are electric vehicles, not as great a game changer as some people here think. But electric cars, vans and trucks are giving people a real alternative that they did not have before.
https://www.fleetnews.co.uk/news/global-electric-vehicle-sales-up-but-stall-in-the-us
Great stuff at Oily Stuff.
Thank you Mr Shellman.
Make sure to read the comments, lots of great charts and explanations by experts.
https://www.oilystuff.com/group/oily-stuff/discussion
To me, those wells look pretty similar.
Are the newer one slightly worse (normalized)? Sure. But on the scale of looking at different plays or the like, it’s more a story of similarity. Not some falling off a cliff.
For that matter, if you watch the 32 minute Novi webinar (I recently linked it and rewatched it), the takeaway is that even with the anti Permian hype, there’s still 5+ years of inventory, even if only T1 rock were drilled. That’s not some Hubbert dream of things falling off the cliff. At least not in the next half decade (likely much longer, as they will drill T2 and some of the T3/4 also).
Nony,
More recent analysis by Jorge Garzon suggests 52,000 tier 1 and tier 2 locations (in terms of economics when accounting for parent/child interaction, aka pressure depletion) with about 20k of those locations being tier 1, lately there have been roughly 5400 completions per year in the Permian and if we assume lateral length remains at the 2024 level EUR per well will likely decrease at about 2% per year. At $60/bo we are not likely to see many locations lower than tier 2 utilized as they won’t be profitable. We may see completions fall to about 400 per month due to the drop in rigs that started 8 month ago, there tends to be a 6 to 10 month delay between rig count changes and completion rate changes, that might extend the number of years a slow decrease can be maintained, but the longer it is maintained the steeper the decline when tier 1/2 locations run out. Also note how much 2025 normalized cumulative production decreased relative to 2024 (about 6%), this was during a period where there would have been incentive to high grade due to low oil prices, so your hope for a bump higher for EUR us not shown in the data. My 2% assumption for the decrease in new well EUR looks to be 3 times too conservative.
Steiner will just drill longer laterals und wird das alles in ordnung machen. 😉
https://www.youtube.com/watch?v=Ag4gup01QBk
Nony,
I realize you are joking, but the reality is that longer laterals tend to reduce EUR per foot, but it also reduces cost per foot and perhaps cost per barrel, at some point diminishing returns may result in higher cost per barrel and we might have reached that point especially as EUR per foot continues to fall.
Mike
Thanks. Much appreciated.
Thanks also for your deeper insight into what’s happening in Texas and NM.
Great stuff Mike
“Oh Boy! Now we’ve got AI to look forward to. Hot diggity dog.”
AI is in a massive bubble. Spent 100s of billions and make 45 billion across this industry a year.
The Data Centers are cash furnaces. They require continuous exponential investment because the equipment depreciates so fast, and we all know the electricity bill is insane.
Now using debt financing to stay afloat.
https://www.nbcnews.com/business/business-news/openais-sam-altman-backtracks-cfos-government-backstop-talk-rcna242447
OpenAI has admitted that processing more data is making things worse and they have hit a limit to what they can do and diversifyng into industries….like PORN.
https://www.forbes.com/sites/jaimecatmull/2025/08/22/mit-says-95-of-enterprise-ai-failsheres-what-the-5-are-doing-right/
MIT says 95% of AI projects fail with no return on investment.
https://www.msn.com/en-us/money/news/the-big-short-investor-michael-burry-bet-10-million-that-ai-stocks-will-crash-by-2027/ar-AA1TeclS
https://www.msn.com/en-us/money/top-stocks/michael-burry-bets-billions-against-the-ai-boom/ar-AA1TmEZP
Michael Burry who famously shorted the US housing market in 2007 and has a book and hit movie “The Big Short”
just shorted the AI industry for a BILLION dollars.
GPUs (special CPUs for AI ) depreciate in 3 years and NVIDIA are accounting for them on a 6 year scale (lieing). Burry says this is accounting fraud and overvalues their company.
Do research all these articles are out there
https://fortune.com/article/warren-buffett-cash-pile-berkshire-hathaway-earnings-q1-2025-insurance-losses/
Me and Warren Buffet are in CASH and 13 week T-bills (cash equivalents) because US stock market growth is AI
Uncle Warren and Berkshire Hathaway are going to pounce on these assets for pennies on the dollar.
https://www.planetearthandbeyond.co/p/ai-will-destroy-everything
AI will destroy the world, not with sentient robots, but by being 10x worse than the Dot Com bubble.
Unlike the Dot Com…..you can’t fix this and recover.
Don’t say Andre didn’t warn you.
Thanks, Ovi. Agreed on US peak this month probably or next (less likely). DEC had some colder than normal weather in the US, so I expect there will be a decent seasonal drop for ND, and overall US will also be down as a result. I really doubt DEC is up.
We are probably entering the slow down/plateau stage. I do not expect a Hubbert style plunge. Too much drilling going on, even if not enough to quite match decline (but pretty close). Superimposed on that will be some seasonality. But I doubt we get back what we lose in the winter, so OCT/NOV will be the peak. It’s gonna be boring.
Note: GOM has definitely outperformed what the resident peak oil expert here predicted, from several years ago. Something wrong with his method, despite the incredible knowledge of field names and the like.
interesting observation about deep water GOM/A, Venezuela and China Bohai Bay saline lacustrine,
Several very large to giant oilfields (>1~10 Billion BO) in the Bohai Sea are shallow heavy and viscous oil reservoirs similar to those in Venezuela. This includes Penglai 19-3 (4B BO), the largest discovery led by the U.S. oil company ConocoPhillips, which to this day remains the most profitable asset in ConocoPhillips’ portfolio, as well as the Luda oilfield discovered by Chevron but abandoned because the oil was considered too heavy. These oilfields are now the backbone of Bohai production, and their development costs are much lower than those for light crude. They are likely also naphthenic-rich oils formed from the decomposition residues of oils similar to those in Venezuela’s saline lake environments, transported to shallow reservoir, became separated into gas and heavy oil.
Somehow, Bohai has PDP reserve GOR even lower only 1:18, while Venezuela Orinoco has PDP reserve GOR at about 1:9.
Today, China’s capability to produce heavy oil—especially Bohai heavy oil—has improved dramatically to a level comparable to Venezuela’s, making it possible to develop Venezuela’s extra-heavy oil efficiently at lower cost, effectively reversing and intensifying the outflow of resources from what is often referred to as the United States’ “backyard.”
Based on isotope, API and GOR data, Ultra-Deep GOM/A probably is also saline lacustrine sourced oil with extra heavier oil and lower GOR than medium depth fluids, but certainly way lighter than the Bohai/Orinoco belt heavy at really shallow reservoirs, and yet they could produce at much higher rate and EUR with slower decline rate than forecast due to the extra lower API and GOR.
This is quite counter-intuitive to main stream, geologists to public media, they all originate from the conventional perception that lower API and GOR fluid can not flow effectively.
The OCS Report BOEM 2022-022, figure 1 clearly forecast continuously drop in GOR and yet higher BOPD rate, and probably even this underestimates the power of saline lacustrine sourced oil.
Nony
I agree that the US production will start with a slow decline and no Hubert plunge.
I keep wondering how many companies keep drilling to try to maintain production so that their stock price does not get hit. There are too many accounting tricks to make the books look better than reality.
All heavy oil is due to bacteria chewing the light ends of the oil molecules. The process needs oxygen.
David,
I agree that most heavy oil is due to bacteria chewing the light ends and also the long chain HCs, leaving only the heavier naphthelene, tar/asphaltene and resin.
However, there is the kinda mainstream view:
The earlier less mature or immature oil also has lots of heavier asphaltene(with oxygen), resin and naphthelene, and the oil is also heavy. This assumption is often validated by the biomarkers in heavy oils, which indicate lower maturity. But, isotope of methane, ethane and propane often give over matured fluids readings. This is why I started to suspect this “immature” heavy oil model, instead all are over-mature fluids migrated to shallow reservoirs, and biodegraded rendering biomarkers also reads incorrect values. Such heavy oil often have asphaltene levels above 5% and API below 15deg.
However, there is also the saline lacustrine shale oil that could generate close to heavy oil at mature stage.
Such heavy shale oil often have API 15 to 20deg, but they have very little asphaltene (with little oxygen in shale). Such oil when migrated to neaby reservoir, also have diagenesis conditions that preserve the heavier components, and making it possible to see quite heavy oil in quite deep formations, e.g. API20 at 4km, and maybe in the case of ultra-deep GOM, we are still seeing API<25 oil at over 9km depth.
For marine sourced oil, drilling in or close to shale indicate that even just at oil mature stage, i.e. Bakken, the oil already has API above 40deg.
Suppose Trump can “run Venezuela”: what will that mean for Gulf Coast refineries? How much Naphtha would be needed for 1 mb/d of Orinoco bitumen? Which US refineries exactly would take that diluted extra heavy oil? This would increase diesel production by how much?
Russia is soon toast.
https://youtu.be/WuTITvz4rMU
Matt, Trump will not and cannot run Venezuela. Don’t fall for his bragging. However consumption of Vz heavy for blend stock is as simple as taking off the sanctions.
I’m not sure how much would flow to the US. The market would sort it out. After all Canada is also a supplier. And somewhat captive, because they have not built enough pipes to water.
There would probably also be some market for US ultralight for Vz blend stock to export elsewhere.
Thanks OVI
About the projections. Is it really so that those are calculated based on two previous months’ data (RRC/OCD), only. So just one data update/revision. It means, if the the update is larger, the projection is high, and if the update is smaller, the projection is also low.
I am still looking for EIA Texas 2024 figures, some months are 10-50k bpd higher than Texas RRC figures. Last month RRC updated the figures slightly downwards rather than upwards. I don’t know, if the numbers can be left so that EIA and RRC have different figures or will they be made equal at some point.
Month | RRC | EIA
Jan-24 | 5,340 | 5,327
Feb-24 | 5,542 | 5,524
Mar-24 | 5,569 | 5,583
Apr-24 | 5,627 | 5,637
May-24 | 5,675 | 5,688
Jun-24 | 5,717 | 5,756
Jul-24 | 5,670 | 5,7
Aug-24 | 5,751 | 5,805
Sep-24 | 5,767 | 5,798
Oct-24 | 5,824 | 5,832
Nov-24 | 5,769 | 5,768
Dec-24 | 5,682 | 5,685
Juha
You are correct in saying: “if the update is larger, the projection is high, and if the update is smaller, the projection is also low.”
You can see the effects of that in the two Midland production charts posted above. On many charts I have to make an estimate for the over correction and provide a revised guesstimate.
It’s the nature of the beast, bad data makes for bad projections.
However this month’s Texas data was better than average and the gap between the Tx projection and the EIA is only 63 kb/d.
If you go to the 914 site, which unfortunately is not being updated any more, you can download the Comp-Stat-oil file. Click on “Crude oil comparisons with other estimates” It has tabs at the bottom for each state.
Select the Texas tab at the bottom and it will show you the latest EIA estimate and the Texas RRC estimate. I think it is late by one month. See attached picture,
You will see that that EIA and RRC data are different starting in July 2023. So basically the EIA does not update Texas before 2 1/2 years. For New Mexico the delay is one year.
Screenshot
Thanks Ovi, very nice of you 🙂
From Maryland, USA.
My nephew had a solar installation of 17 kw plus two 11.5 kw Powerwall units, which went online on December 21, 2024. The system cost $76,200 and was ground based for perfect orientation to the compass and to the horizon. I asked myself, in a world without free money and feed in tariffs, could this system produce enough electricity to earn enough money to repay the loan at a modest 5% time value of money over 20 years. I did not take into account the reduction of solar cell efficiency and the cost of the inverters which the installer said had a life expectancy of 10 years.
The principal and the interest cost over 20 years would be $120,800 and using the current cost of a kwh of $0.22 which includes all fees and charges. The system would need to generate 27,200 kwh a year to cover the suggested loan. The actual generation in 2025 was 22,700 kwh or 80% of what was needed to cover the costs.
As for my nephew, he was able to take a $23,000 tax credit off of his 2024 Federal taxes and the Tesla software operating the solar installation, feeds the grid Monday through Friday whether it needs the power or not., at the highest time of day billing rate.
My conclusion is that the solar installation, on its own, will not and cannot pay for itself but my nephew is smiling all the way to the bank.
In my work, a nearby military base offered space so we could set up two buildings to operate a long-term research facility.
As we started planning the construction, the military facilities team at the base contacted us and said that because we were going to be within a short distance of the ‘air-side’, the power line would have to be underground and that would take some time to accomplish.
The military asked us what the overall power consumption would be for all the electronics, computers, lighting, motors etc. When we gave them the numbers they proposed that we look at a solar-powered facility, and provided recommendations for solar panels, batteries, inverter, etc. Our construction group took their recommendations and built our facility on the original timetable.
It’s worked perfectly well for seven years so far.
I’ve since seen many other examples of facilities and equipment that are off-grid, and that wouldn’t have been possible in an earlier era.
Meanwhile, in the wider world-
Globally the utilities of world electrical generation capacity additions in year 2025 was
over 70% photovoltaic.
Collectively, the global electricity utility industry knows the economics of electricity generation better than any other entity. Even Ervin.
I’ve been hearing the badmouthing of NM for quite a while now. But it was up more than a quarter million bopd for the year and is up over a million bopd since Covid.
https://www.eia.gov/dnav/pet/hist/LeafHandler.ashx?n=PET&s=MCRFPNM2&f=M
Score. Board.
Will it last forever? No. But it has done pretty damn well.
Nony,
Doubtful that it will more than offset the decrease in output from the Texas Permian Basin. The STEO expects a peak soon in the Permian region for tight oil (Dec 2025 to Jan 2025). Low oil prices might reduce the completion rate as oil rig counts continue to fall.
Yeah, agreed. I’m just saying it’s done well.
A low oil price scenario with EUR decrease starting in July 2029 with 75k total wells completed, after Nov 2025 it is assumed only tier 1 ond tier 2 wells are completed (tier 1 locations run out at 75k wells). I think this scenario is very optimistic for oil prices assumed at $60/bo in 2025$. URR about 43.5 Gb total wells completed for scenario about 108k. Number of new wells on right axis is new wells completed per month. Chart at link below.
permian lowprice2601
On an unrelated matter, but one dear to my heart as an environmentalist, it should be noted that the Carlsbad Caverns was formed by sulfuric acid eating away at the limestone karst in that area of Eddy county. The primary reason Eddy county has become a tremendous sweet spot in the Delaware LTO sub-basin is due to extensive interbedding of the shale with limestone and dolomite (which is just limestone carbonate with a little more magnesium added to it). This interbedding with just the right amount of fragile carbonate gives the shale in that area its “brittleness.” When you exert fracking pressure on it, the fracture lines extend horizontally (laterally), not vertically. So the fractures merely open up more of the porous matrix of the oil-dense shale in that area.
It bears pointing out that the Carlsbad Caverns is massive, and the far reaches of it have never been explored. Most sane people won’t push their body into fissures that are barely larger than they are, but seismography will tell you where the larger voids exist. However, it is a certainty that smaller fissures run for miles. To extrapolate logic, it is damned near a certainty that at some point in the future, the oilfield is going to communicate with Carlsbad Caverns, the eighth wonder of the world.
What is happening in Eddy county is a national disgrace. I’m no geologist but even I can figure out that the more brittle the karst, the more an intrusion is likely to keep going until it meets a millions-year-old fissure extending out from the massive Carlsbad Caverns. And then it’s remediation time. In twenty years time, Eddy county will be pockmarked by a few old wells still cripping along, but thousands of cement jobs. The wellbores will still be down there, the maze from hell, collecting water and sulfuric acid, eating its way into the cavern. And that’s all she wrote, boys.
The potash mines were risk enough, though they didn’t form communications through shattered limestone-interbedded shale. Then the WIPP project was put in, which contains radioactive waste storage for much of our country. And now we are filling this area full of horizontal wellbores and blasting the limestone karst to smithereens with fracking? This is truly madness on a crazier scale.
Correction: limestone is chemically weathered, not by sulphuric acid, but by rain and soil water, which is simple water containing comparatively small amounts of dissolved carbon dioxide. Also, soil water may be acidic due to percolation through regolith and soil charged with decaying organic matter.
Northern Eddy and Lea have lots of conventional carbonate reservoirs, quite shallow, but they have lots of left-over oil, called ROZ (Residual Oil Zone) and some could be tapped by laterals with modern water fracking.
Oil markets very slightly up, after Vz raid. (The change is on the scale of normal daily variation.)
https://www.reuters.com/business/energy/oil-prices-slip-ample-supply-despite-political-turmoil-venezuela-2026-01-04/
I think markets don’t see some colossal loss (or gain) of bbls. OPEC seems to think similar as they are not adjusting loosening policy either.
I have to think Trump is dreaming with the idea of Chevron taking over the Vz industry. Look how those types of hopes worked out in Iraq. It is interesting though to see the new president backing down now.
https://www.reuters.com/world/americas/venezuelas-maduro-appear-us-court-trump-says-further-strikes-possible-2026-01-05/
TBD. TBD.
Pretty evenhanded, and decent, for MSM, article on the Vz oil industry going forward.
https://www.cnn.com/2026/01/03/business/oil-gas-venezuela-maduro
“The prospect is then how quickly could a Venezuela that is pro-US increase its production. That will be the parlor game. Perception may race ahead of reality. People will assume Venezuela can add oil faster than they actually can,” he said.
“Venezuela can be a huge deal but not for 5 to 10 years,” McNally said.”
Significant uncertainty, and even if Vz is rehabilitated, it will take a while. I guess the one plus is it was already such a small player that even if destabilization hurts production, it will not be momentous.
According to Rystad Energy, oil resources 2CPX are only 27 Gb, not 300 Gb as repeated endlessly by the media
https://www.rystadenergy.com/news/discovered-recoverable-oil-resources-increased-by-5-billion-barrels-despite-produ
Thanks Matt.
Don’t just find a strange number you like better and just run with it. Figure out what the story is.
If everyone was saying 27 and Rystad was an outlier at 300, would you take that as gospel? Or would you try to learn more?
Nony,
The Venezuela proved reserve numbers have always been suspect in my mind, ever since they added the Orinoco resources. In 1984 Venezuela’s proved reserves were 28 Gb, in 1987 the proved reserves doubled to 58 Gb (this was the OPEC nations fighting for quotas by artificially raising their reserves). Then in 2005 to 2010 they added about 220 Gb of proved reserves from the Orinoco Belt. In Rystad’s estimation the true estimate of 2PCX resources for Venezuela is 27 Gb. Likewise the Canadians claim 161 Gb of proved reserves in oil sands, but only about 19 Gb is in active development as of 2020 according to Energy Institutes Statistical Review of World Energy.
This is not news to me, I just am thanking Matt for reminding people that the 300 Gb number typically quoted for Venezuela’s “reserves” is very unrealistic.
Surprised you find this surprising. This is part of the reason that US oil companies (aside from Chevron) are not all that interested in Venezuela, along with the lack of any plan by the Trump administration for what happens after Maduro was kidnapped. The Maduro government remains in place minus Maduro, unclear that there will be significant change, oil companies realize this and the potential for political chaos. Low oil prices make it less likely the Orinoco Belt will be developed as it is expensive oil from a cost of production perspective.
That Nony is the story as I see it, generally I find Rystad’s analysis excellent.
There are also even larger 2000 GB estimate for Vz when you ask Chatbot.
There was a general oil-price driven asset bubble when oil price bubble formed from 2002 to 2014.
There is also the technology development, like shale, heavy oil now could be tapped at much lower cost per barrel than before. Especially heavy sour crude, like Canadian Oil sands and Vz heavy crude, which was much harder to produce, and only advanced countries like US could process it.
The Bohai bay heavy oil with high acid level from the largest oil field, Penglai 19-3, discovered by Conoco-Philips led operators, was not processed in China till after 2008/2009, almost 10 years after production started. Now, China Bohai bay has more than 65% crude coming from several large heavy crude fields there, all close to Vz heavy grade, maybe lower asphaltene and sulfur level, but still quite much higher than shale oil. The same refineries that process Bohai heavy crude now process Vz heavy crude.
The majority 65% of newly discovered crude in Bohai continue to be heavy crude like PL19-3 or close. The local tea-pot refineries also tuned up for such crude because of the higher naphthelene levels, could have high yield in JP8 kerosene, diesel and products that operate under extra low temperatures and yet high flash point.
So, the Vz heavy crude could only be tapped and processed by US big companies before 2008, i.e. monopoly. BTW, some of the catalyst to process such sour heavy acidic crude need large amount of rare earth. In fact, the last company that actively mining and use rare earth in US was Unocal. In 2011, CNOOC offered to buy UNOCAL, and was rejected by US congress security committee, citing rare earth. But, after merged with BP/ARCO?, UNOCAL rare earth operation was eventually shut down.
Sheng Wu,
2 TB would likely be an oil in place estimate, USGS has TRR estimate of about 500 Gb, ERR might be as high as 300 Gb, but will depend on oil prices. The 220 Gb reserve estimate for Orinoco belt was based on very high oil prices of about $118/b in 2025 $ in 2010. Maybe 20 to 30 Gb of Orinoco belt oil will eventually be produced if Venezuela get back on track which is by no means certain. I do not expect oil price to rise higher than $75/b in 2025$ in the future and prices may remain around $60/b (futures curve out to 2032), this would be lower in 2025$ as futures prices are in nominal dollars. Not clear that much of the Orinoco belt resource will be profitable to produce at the futures strip price. Time will reveal the answer.
DC,
https://tse4.mm.bing.net/th/id/OIP.-7FiPjmVgUzsl4NnlFu3nwHaDN?rs=1&pid=ImgDetMain&o=7&rm=3
The above link is the historic production figure for Venezuela since 1970, and you could see that even at the low price 90s’, Vz could produce 1.5MBOPD, and so it is not that cost is as high as Canadian Oil sands, and US companies already had the technology to tap them efficiently, and more over, there is monopoly from well-site to refineries that maximize the profit in the end.
Vz socialist government is worse than China in this respect, that they just yank the monopoly for good. The Bohai bay still have COP operating there sharing the same profit contract signed more than 30 years ago, and only changing the operator from COP to CNOOC after 15 years following the contract.
In terms of cost per barrel or profit, some sources claim that Guyana still lags behind Vz, and Exxon was forced to tap Guyana after Vz nationalized US major assets.
Sheng Wu,
Not much Orinoco oil was being produced in the 90s, Venezuela’s oil output was primarily from conventional resources before 2000.
DC,
you are right, the Orinoco Belt did not produce much in earlier 90s, but it did get to 100K BOPD in 1999 when price was very low, and now already 55% in 2024, according to link below (table of production from 2008 to 2024),
https://grokipedia.com/page/Orinoco_Belt
This means that the cost or challenges to produce is probably lower for the Ultra-heavy Orinoco Belt?
Or, just the lighter oil from the conventional Maracaibo lake legacy declined much faster after 2013 peak?
I am curious when US gulf-coast refineries tuned up for such ultra-heavy Orinoco crude, as such ultra-heavy grade did not kick in until after 2008? The Canadian oil sands got scared of the US take-over in Vz, implicating lower cost in Vz Orinoco belt?
Also interesting is that Chevron discovered the similar heavy oil in Bohai before 2000, and they had to abandon it due to low viscosity, but it is one of the major fields in production now. Obviously, the heavy oil production also got improved due to higher oil price and improved recovery technology.
“About three-quarters (around 75%) of Venezuela’s massive oil reserves, estimated at 300+ billion barrels, are in the form of extra-heavy crude and bitumen (tar sands) concentrated in the Orinoco Belt, making most of it very challenging and viscous to extract compared to conventional oil.”
Breakeven price for production? Expensive asphalt.
Make friends with neighbors- Buy Canadian.
the commons and differences between Canadian oil sand (COs)and Venezuela extra heavy OIl (VzH)
Commons:
1. API<10, or heavier than water 1.0g/cc
2. high in sulfur over 3%~8%
Differences:
1. COs: high in oxygen (2~8%) or asphaltene and bitumen, a result of even shallower depth than VzH which has oxygen level below 1%
2. a result of 1, COs viscosity is 20K~40K cp, VzH is usually below 10K cp (4~5K cp typical )
so, VzH actually don't need on-site upgrade plant to flow, just add some light diluents, but COs needs upgrade before adding diluents.
Article describing Venezuela’s oil industry at link below.
https://www.msn.com/en-us/money/markets/how-much-oil-does-venezuela-really-have-for-chevron-the-truth-matters/ar-AA1TF7qY
Article concludes with:
“If oil prices shot up to $100, producers might not be deterred by any of this. With Brent in the high $50s, Venezuelan oil may be far more trouble than it’s worth.”
Michael Ghirelli
01/05/2026
Correction: limestone is chemically weathered, not by sulphuric acid, but by rain and soil water, which is simple water containing comparatively small amounts of dissolved carbon dioxide. Also, soil water may be acidic due to percolation through regolith and soil charged with decaying organic matter.
My response: I don’t know who you are and you may know a lot about limestone, but for some strange reason the limestone karst that became Carlsbad Caverns was eroded out into giant spaces that send “nature’s wellbores” far into the surrounding area. That strange reason was due to the hydrogen sulfide in petroleum–the main reason I wrote the little article. The entire area used to be the Permian Sea, a place of deposition for millions of years. Like in most areas of high petroleum manufacture in the deep earth, there were parts that contained hydrogen sulfite, which will kill you if you drill into it without a ventilator on. There’s plenty of that in the western part of Eddy county and it rose from the deep until it met ground water, which is fairly well oxygenated. The resulting sulfuric acid eroded a massive network of caves. It’s not like there’s usually just a pocket of hydrogen sulfide and the surrounding area is clear of it. The cave network goes on and on, and many tributaries have never been explored. The oilfield is encroaching upon those tributaries, and at some point, due to tangential movement of fluids under pressure, the cavern itself is in danger of being breached. The process that created the magnificent Carlsbad Caverns was not some trickle down rainwater process; it had some help from the hydrogen sulfide present in some areas of intense hydrocarbon synthesis. My point, which I possibly didn’t make sufficiently, was that the caverns were hollowed out by a component of the rich petroleum system that we are tapping at a furious rate with two, three and four-mile laterals. I am a huge fan of oil and gas, but also of nature’s wonders, and surely to God we can find enough oil and gas to glut the market without encroaching upon one of the most marvelous structures in the world.
Gerry, oil keeps us alive. and access to power. The Caverns don’t.
Leeg,
At least 15% of oil consumption is really low value: there’s really very little value to the fuel consumption of one person in a large SUV or pickup. On average US passenger vehicles only have 1.2 people! US fleet average fuel MPG is only 23.
European light vehicle fuel consumption is only 18% of the US.
Excellent example Nick, access to power.. The power to command 1000’s of pounds of mobility on a whim. It is our birthright. Straight six pumping out 95 hp to the drive in. You and your date eating popcorn under the stars and bugs. Power to waste. Power to drain aquifers.
Sure we have a lot of room to increase efficiency. My point is that natural wonders, like the Caverns or Cedars of Lebanon, cannot compete for what is most valued.
Leeg,
I hope that’s irony or satire. I know that there are people who would say that and mean it – I’d argue that they don’t know what’s important in life.
Research tells us that’s a common problem: people buy stuff (houses, cars, etc) that don’t make them happier and often make them actually less happy. It’s really a massive social problem: for most of human history the way to make things better was to get more and better “stuff”.
That’s no longer true. Most people have enough stuff: their houses and cars are “good enough”. Bigger houses often bring under-utilized space, longer commutes, bigger mortgages, tedious maintenance, more isolation, more neighbor envy & competition. Cars are the same way: bigger isn’t better.
They need to find better ways to be happy than buying stuff: better relations with people, better work, better physical and emotional health and so on.
https://www.washingtonpost.com/climate-environment/2026/01/06/smaller-houses-happier-lives/
——————————
Not to mention that EVs are more powerful than ICEs.
Nick, oil gives people access to power. I’m speaking of watts. The ability to shoot yourself down the road at speeds way beyond what muscles can give. Also the power to pull farm equipment or bend steel.
Natural wonders do not. Homo saps will strip natural wonders in their land or across the globe for that power. Hell, a tar seep is a natural wonder.
I was responding to Gerry’s worry that the Caverns are at risk. They’re at risk like everything else in the biosphere.
Leeg,
Well, if power and speed are the important things, then EVs will take over the world very soon, because…they’re faster and more powerful than ICEs.
And then we can fuel them with solar panels, that coexist with the natural world far better than oil production and combustion.
Dennis,
USGS had a TRR of 513 BBO in 2009.
https://pubs.usgs.gov/publication/fs20093028https://pubs.usgs.gov/publication/fs20093028
Is it possible that 27 is right and 300 is wrong? Yes. Is it certain? No. Based on the TRR, I’d opt for the 300 more than the 27.
Do a little better and a little more. And keep a more open mind. Just jumping on the one of two wildly different estimates that you like better is not intellectually serious. Do more.
And no…the OPEC quota growth is not some massive inight. It’s a feather of evidence, well known to BP and the like. A very starter level of peak oil argument. Fesharaki says he made them up for some OPEC members, but he thinks the numbers are low, not high. And he knows a lot about OPEC oil. And even he is not so confident…one way or the other. (But he laughs at fuzzy logic Matt Simmons.) For that matter, I remember all the sturm and drang about Saudi Arabia…and when there finally WAS a very professional, top notch reserves auditing firm that said ~270…you all still didn’t like it…despite saying that was what you were waiting for.
Honestly, if this were something I was actually doing professionally, I would just reach out to someone at Rystad (their PR line…or just get a link of a link on LinkedIn) and get their explanation. Heck…if it really is 27, maybe the explanation adds extra insight. Or maybe they explain how there’s an apples and oranges situation. Who knows? But don’t just jump on the one (of two widely different estimates) and assume it is right AND you know FOR SURE why it is right. Go…ask questions and learn! Yes…even of the things that are “going your way”.
Isn’t the very likely explanation simply price? I’d guess that 300 is for oil at $200, and $27 is for oil at $70.
Nick, maybe. That’s probably one of several reasons to explain why each number makes sense in out’s own right. Could also be a definitional thing. Or maybe they are just competing estimates.
But, let’s find out! This is why I advocate, taking the unusual number as an opportunity for learning. Not just for “you go, girl” style cheerleading.
Heck, even if the 27 stands…you learned something. And there are many times in oil, business, military, politics, etc. where jumping on the report you “like” is a mistake. Pressure test.
Yep – we should all try to do a bit of research before we comment.
OTOH, in this case I don’t see much value in investing time: IMO Venezuela is way too chaotic for IOCs to invest much time, energy or money any time soon. I really think this whole thing is just theatre to distract from the President’s serious domestic problems.
I suppose there is a small possibility that he thinks Venezuelan oil production can be expanded quickly – he may not understand how unrealistic this is. Based on his very limited business experience running a very small real estate organization (with most major components of his RE projects outsourced), he seems to believe that countries are generally run by a single person at the top. This has been described as a “neo-royalist” approach. Thus, he thinks that making friends with Putin makes some kind of real difference, and perhaps he thinks that he can kidnap Maduro and change the whole Venezuelan government. That, of course, would be remarkably unrealistic, but then this president appears to be remarkably out of touch with the real world.
Anon
Do you actually know what Matt said about Saudi Production?
From an interview I saw he said (from memory) Saudi Arabia, 12 million yeah but various people say it should never try and produce more than that.
How much is Saudi producing?
It has not had to test if it can produce 12 million per day for a year or more. Do you know it can produce 11m/d, no you don’t, so shut up misquoting people.
Nony,
I am not doing this professionally, perhaps 300 Gb will be recovered by 2500 CE, do you believe that Rystad doesn’t do serious analysis? Yes USGS estimates 513 Gb for Venezuela’s TRR as of 2009. The estimate may not be correct and the important number is economically recoverable resources. I don’t have access to anything but the publicly available Rystad data.
Nothing about the future is certain, so expecting certainty is silly.
This older article from 2016 at link below discusses differences between Rystad estimates and the national oil estimates by Venezuela (which are esssentially resource estimates.)
https://www.fairfieldsuntimes.com/business/study-us-holds-more-oil-reserves-than-saudi-arabia-venezuela/article_1033e489-bb54-5991-98a3-4bb211887d27.html
Another article from July 2017 discussing the difference between the estimates for Venezuela’s reserves between the Statistical Review of World Energy and Rystad at link below.
https://www.spglobal.com/energy/en/news-research/blog/crude-oil/071017-venezuelas-oil-reserves-kick-into-reverse-fuel-for-thought
Dennis:
I think Rystad does serious research. So does BP. So does USGS.
The two articles are helpful, thanks.
I don’t think it is just an issue of Vz juicing the estimates, but of the economic challenges of extracting the heavy oil. For example differing hurdle at $100 oil prices and half that. There are likely also local control/political hurdles that are implicit too (non-physical constraints). If all that oil were magically transported to the USA or Canada, I suspect that solutions could be brought to bear…after all look at the development of Alberta. (Note, I’m NOT expecting local control issues to go away…look how we screwed up Iraq and Libya, rather than helping them! But I do think it’s important on a long range blog like this to consider the difference between physical constraints and societal ones.)
Again, thank you for the articles.
Nony,
Rystad CEO is a physicist, the number reported for 2PCX is based on the same set of criteria (SPE guidelines) for every nation assessed. My guess is they use the long dated futures curve to estimate future oil prices and on that basis the remaining resource for Venezuela as of Jan 1, 2025 is about 27 Gb and for World C+C the best estimate (F50) for ERR is about 3100 Gb based on Rystad’s analysis (about 1519 Gb of remaining World C+C resources in 2PCX category).
https://www.rystadenergy.com/news/discovered-recoverable-oil-resources-increased-by-5-billion-barrels-despite-produ
Count me as a small US oil producer who will be extremely pissed if US taxpayer dollars go towards funding Venezuelan oil production.
We have weathered OPEC’s opening the spigots in 1986, the Asian Flu of the late 1990’s, the GFC, 2016 and COVID. No bailouts. Just percentage depletion, which we cannot even take on leases that are in the negative during the tax year.
And now, after driving down prices by cutting some deal with OPEC, our President is discussing subsidizing CVX and COP to restart the Venezuelan oil industry.
I assume Nony would love US taxpayer dollars subsidizing Venezuela?
No. I’m pretty libertarian. Don’t want any subsidies.
But if Vz gets its act together and dumps a couple million extra bopd on the market and I’m back to getting $1.95 gas, that would be OK with me.
You’re in a commodity business, SS. Price risk is a part of the game. Nobody owes you $100/bbl.
Consumers just want it as cheap as the market can supply it. Low price wins until the market clears and supply and demand are equal.
P.s. I want cheap eggs too. 😉
You are pretty much stupid, Annoying. The comment was directed at using American taxpayer money to incentivize Exxon, Chevron, Conoco, back into Venezuela to produce more oil, lower the worldwide price, and make producing American oil even more unprofitable than it already is. Even your beloved, always unprofitable shale oil. You seem to have a reading disability.
Venezuela cannot get its oil “act” together without American money. Or, which would you prefer…Chinese money or Russian money?
Maybe you need to work harder, or get a job in the first place, so you can afford $3 gasoline.
Lower now means higher later, particularly with a rudimentary understanding of the state of the U.S, shale oil and shale industry. Get somebody to explain that to you. Try the grade school down the street. They can help.
Good Americans like Shallow Sand, and his family before him, have been dealing with political induced price volatility for over 100 years. They stay upright, carry on, and contribute. They are…productive, important people in American society. I have yet to understand what it is you contribute to society other than just being…annoying.
As long as it’s not U.S. taxpayer funding, I don’t care if the money comes from Russia, China, Exxon, Microsoft, or the Martians. And if it doesn’t and Vz doesn’t rebound, so be it also.
But of course Shallow decided to put words in my mouth “I assume Nony would love…”.
Non-oil related comment
Shallow, it’s a funny thing we still ascribe meaning to the pathological liars babbling. Donald said he discussed Venezuela with industry execs. None said he did. He babbled on about Venezuela’s resources as ours. That “we” or “the guys behind me” (Rubio) were going to run Venezuela, run the oil operations. No one is running Venezuela except Maduro’s vice president, military and the existing armed groups.
If money is flowing to Venezuela it’s bribes to these people who Donald calls narco-terrists. Should be money making time for Columbian PMCs.
Anom- “As long as it’s not U.S. taxpayer funding, I don’t care”
We’d be fools to think the the US citizen taxpayers and fuel consumers will not be paying a large fee for all of the military action, infrastructure spending, and Venezuelan stabilization/support, which is a project that will be measured in decades. We will be paying for attempts to keep the population placated. That country doesn’t have money to bulk up their infrastructure. Oil prices are low and if there are eventual profits from all of the capital input required it will not be used to pay back the US taxpayer/consumer.
How much do you think it has cost just to station that naval fleet off the coast for 3 months?
Hickory,
Yeah…I’m worried about that also. Look how much money we pumped into Iraq/Afghanistan. Or really just took a blowtorch to and lit on fire.
My hope is that this ends up like the Iran strikes…some razzle dazzle and no ongoing cash drain. Above what was already consumed. And we just dodge a bullet and things muddle along.
But I’m worried about some sort of ongoing involvement, with further costs. It’s not like Trump is some shrewd Kissinger type guy. Trump is a WWE promoter.
Hickory,
This Forbes piece
https://fortune.com/2026/01/08/us-blockade-venezuela-cost-700-million-rising-daily/
suggests the naval blockade alone has cost about 700 million to date and each extra day costs about 9 million. The operation to capture Maduro cost around 75 million and added to this would be the cost of strikes on the fishing/drug boats (maybe another 300 million).
See also
https://www.aei.org/foreign-and-defense-policy/the-strategy-and-costs-of-boat-strikes/
Today at the white house-
“Exxon CEO Darren Woods offered the starkest assessment, telling Trump in the live-streamed meeting in the East Room that Venezuela is “uninvestable” under current conditions. He said major changes were needed before his company would return to the country, and that big questions remain about what return Exxon could expect from any investments.”
Someone (us) is going to have to pay a lot to stabilize/upgrade that nation to the point where it can generate enough oil revenue to support that country and the oil companies that go to work there. Better prospects when oil gets above $80 and permian is in decline, and I suppose we’ll get there.
The major players are pissed because they were working on deals in Venezuela that now are scuppered because Trump did a dumb and kidnapped a guy without achieving anything. They can’t invest in a nation that is now definitely not friendly to US meddling, so well done there.
The smaller players are bitching because if Trump were to somehow get cheap oil out of Venezuela, which isn’t happening either way, then that undercuts the shale plays that need a stable baseline of $60 or so to remain open.
Talk about a clusterfuck. It’s achieved nothing because someone thought you just steal the leader of a country and as per chess rules, the game is won. At least when the US deposed Noriega, they actually had boots on the ground to do the regime change. The current US gov’t and military can only do high speed, low drag operator gigs where they push around a load of people and bomb some shit. Actually trying to do an Operation Just Cause or Iraqi Freedom now is probably beyond the US MIC at this point.
At the same time as they were messing about with the idea of getting Maduro, the US flung a load of Tomahawks into Nigeria with a dud rate around 60% from evidence seen with all the unexploded missile warheads found so far.
A funny moment in the Trump meeting with oil executives is when a Halliburton executive expressed interest in getting back into Venezuela. Then Trump asked him when Halliburton had left Venezuela. The guy responded saying it was in 2019 and further explained he was forced to leave because of sanctions. Trump of course sat there like a log probably not realizing those were his sanctions.
Sanctions are supposedly causing the Iraniian revolt as well, since the people protesting are not getting food imports, and the high altitude desert around Tehran is running out of water.
So it seems as if all these sanctions are directed at causing misery among the targeted population but the USA won’t dare say this.
LINK:https://x.com/KevinlyFather/status/2009799345433128998
What is the legal basis for taking 50 million barrels of Venezuelan oil?
Whoever has the biggest gun.
This is “international law”
Monroe doctrine
I mean
Donroe doctrine (“Gulf of America” Trump literally renamed this )
China redrew a map that says that Siberian Natural Gas is theirs!!!
As you suspect, there is none.
Illegalities include violating:
the US constitution, which gives the power to start a war to Congress.;
the US War Powers act, which clarifies the Constitutional provision;
US military law which forbids killing civilians (this more about the boats);
The UN charter, which forbids unprovoked aggression, and
Venezuelan law, which doesn’t allow killing and kidnapping Venezuelan citizens (how long will it take for a Venezuelan court to charge US personnel with crimes, including the US President??).
There is a legal process for dealing with unreimbursed siezure of assets (aka nationalization), and various private parties (ncluding oil companies) have claims against the Venezuelan government, but that does not allow a random grab of Venezuelan oil by the US government.
Sadly, this is a huge boost for various governments that would like to invade their neighbors, including Russia and China.
Shallow Sand. Its a really good question
in a world that respects laws, treaties, and ethical norms of behavior.
Everyone knew who voted that this president says F…you to all of that.
And yes, I remain shocked that anyone did vote for him. I had been naive enough to think that there was a line that would have never been crossed. Unfortunately, I have no trust left in this culture…and I suppose in this species all together.
I believe that Maduro should have a roommate. One who occupied the room for at least 6 years now. If not for all the collusion of the legislative branch. And now the judiciary in spades. Full immunity, full pardon power. Grand Corruption.
Shallow Sand,
See recent interviews by Steven Miller essentially saying might makes right. Seems he wants to go back to the middle ages when the World was in a constant state of war. Miller seems to believe the political philosophy of Hobbs, Locke, and Thomas Jefferson was a big mistake.
See following starting at about 5:35 on video.
https://www.youtube.com/watch?v=kLFkQbPWWDI
Dennis you really are showing your ignorance again.
The world has been at war on a global level for decades. This war has been fought by the brutal communists of Russia and China. The Russians went into the country of my family and killed and sent to concentration camps hundreds of thousands.
They tortured countless numbers of people in Poland, Hungary, Romania etc. when ten of thousands of armed troops enter a country and kill people, that’s a war.
The Chinese Maoist forces killed very few Japanese, they saved their bullets to kill millions of Chinese who wanted freedom.
China and Russia have armed groups all over the world in order to overthrow democracy.
https://en.wikipedia.org/wiki/Elections_in_Cuba
When democracy is overthrown by violence and elections are stopped then that is a war. It might not effect your little life protected by men who know the cost of freedom but it is a war nonetheless.
They do say ignorance is bliss, you are the ultimate example of that along with a few others here.
Iver, You are the fucking idiot here. You did not address Dennis’ at all. His post was about Stephen Miller and his assumption that might makes right. Miller thinks what Trump is doing is doing is perfect and right. Trump is a narcissistic fool who wants to leave a legacy of taking over Venezuela, Greenland and anything else he can.
Yet you ranted about China and Russia which had nothing to do with Dennis’ post.
You should address his post and comment on Stephen Miller’s opinion or keep quiet.
Ron
Why don’t you read what Dennis said. Do it slowly.
He said Trump wants a world in constant war. It is at constant war that is what I was addressing.
This is only some of them
https://en.wikipedia.org/wiki/List_of_wars:_1945%E2%80%931989
Ron you talk to me like that to my face you coward
Iver wrote: Dennis you really are showing your ignorance again.
Then Iver wrote: Ron you talk to me like that to my face you coward
Is that an example of irony or just the pot calling the kettle black?
Ron
Do you know what ignorance means?
Iver,
If I was a citizen anywhere is the World I would be worried that an advisor to POTUS holds the views which Miller espoused in that interview.
Do you think the World would be a better place with Trump in charge?
I do not, unchecked power is a problem whether it is Mao, Stalin, Hitler, or Trump. Unfortunately a spineless Republican party and a Supreme Court that seems to not understand the idea of checks and balances in our political system as laid out in the Constitution and precedent has left very little check on presidential power. Hopefully Republican Senators will no longer leave convicting an impeached President to the courts as this remains the only real check on Trump’s power.
Dennis
I think letting the Iranian evil government build nuclear weapons the most dangerous thing happening to start a war in the Middle East. Which would spread. President Trump did what feeble Biden failed to do. Excellent job!,
The U.S. now needs to bomb the revolutionary guard everywhere they are. To stop them spreading violence all over the Middle East.
https://iranwire.com/en/features/65737/
Letting evil groups become more and more powerful does not make the world a safer place.
World history shows dictatorships always fail economically so they start external wars to distract from their failures.
Iver,
Might does not make right, never has and never will.
“World history shows dictatorships always fail economically so they start external wars to distract from their failures.”
Exactly! Obviously, that’s why this president has started this counter-productive war – he wants to distract from domestic issues like cost of living, Epstein files, etc. He wants to distract and excite his base before the mid-term elections.
I don’t think Trump is even that shrewd to consciously do that for that rationale. Instead he is an emotional, narcissistic baby lurching into different decisions and seeking acclaim.
Dennis
You can’t even answer any of my points you are a childish man with a childish view of the world.
You have no answers to pure evil governments, you are a WW2 America first rehashed. How well did these childish views do?
President Trump is really making sanctions placed by Biden effective.
United States forces have captured an illegal tanker off Iceland.
I said over a year ago if these tankers are considered illegal by the international community they should be seized.
Without these tankers in 6 months the Russians would not be able to pay their troops and pay for all the arms that need to be replaced in
trump always charges outright
Oh, it’s the “Russia is collapsing!” argument in 2026. What a novelty we brought into the New Year.
One day, it may even be true. Remember how Russia lost over a million soldiers, ran out of all missiles and tanks and planes back in 2022? Or was it 2023? 2024?
Any minute now. Any minute…
https://archive.is/BKjuD
Article about VZ heavy crude headed to USA.
As usual, Trump is sort of taking credit for market fundamentals (a habit of his, of all politicians, but he is worse).
Overall, prices down moderately, $1.50 (maybe just from fear premium dropping, not just this deal). But also article says heavy-light differential at GOM (do I have to say GOA?) down $.50.
I actually think Trump could have accomplished all this…just by relaxing the sanctions, without a boom bang coup that is sure to freak out LATAM, who have a battered wife complex (I wonder why) about US interventions, going back over a century, and across Democraps and Repukes.
We are the “natural” consumer of Vz heavy based on our proximity, sophisticated refining sector, and need to blend with shale light/sweet. As EU is the “natural” consumer of Urals oil from Russia…just the cheapest transport path.
One thing I don’t understand is how price will be set. It seems (despite the miserable optics) that Trump intends to buy at market price and that if anything it might be higher prices for Vz (since this is a pseudorelaxation of sanctions). But if CVX/US is the only buyer how do you set price? I don’t see this as a showstopper, but curious.
Loved
“You are pretty much stupid, Annoying. The comment was directed at using American taxpayer money to incentivize Exxon, Chevron, Conoco, back into Venezuela to produce more oil, lower the worldwide price, and make producing American oil even more unprofitable than it already is. Even your beloved, always unprofitable shale oil. You seem to have a reading disability.
Venezuela cannot get its oil “act” together without American money. Or, which would you prefer…Chinese money or Russian money?
Maybe you need to work harder, or get a job in the first place, so you can afford $3 gasoline.
Lower now means higher later, particularly with a rudimentary understanding of the state of the U.S, shale oil and shale industry. Get somebody to explain that to you. Try the grade school down the street. They can help.
Good Americans like Shallow Sand, and his family before him, have been dealing with political induced price volatility for over 100 years. They stay upright, carry on, and contribute. They are…productive, important people in American society. I have yet to understand what it is you contribute to society other than just being…annoying.”
Hey, I didn’t expect any sympathy. Just know you get a charge out of super cheap gasoline, same as Trump.
Trump is so hyped about it he will use taxpayer money to achieve it. He will also cut deals with foreign countries who haven’t always been our friends to achieve it.
Well, he will be getting a lot less income tax money out of me this year. I’ve paid in enough the first 3 quarters that I probably won’t be paying any tax estimates for quite awhile.
Have to wonder what the net effect of super cheap oil, super cheap natural gas and super cheap grain is regarding US tax receipts. Does that get offset somehow?
I do wonder sometimes if cheap oil, natural gas and grain is really beneficial to the USA, as we produce and export a lot of all three?
It’s a complex question.
Low prices are very hard on producers, mildly good for consumers (which includes most Americans).
I think the Saudis are making a calculated trade-off: higher prices are likely to increase the speed of the transition away from oil. I suspect they’re very, very aware of China’s big move to electrify all land transport: light vehicles, heavy, buses, trucks, mining heavy movers, river transports, etc., etc. In addition, China is heavily expanding their EV exports to the whole world: Europe, Africa, S. America, Asia, etc.
I watched KSA in the late 70’s and early 80’s, and it seemed to me that they were careful to keep oil prices below the $40 trigger-point for viability of Coal-to-liquids (Carter made quite a bit of noise about it). I think they’re trying to do the same now.
My guess: they’re willing to go lower on price, to keep exports going longer.
I wasn’t giving YOU any sympathy, I was sticking up for MY industry to an asshole that has, for a decade, ridiculed me, and belittled me because I am a stripper well operator and incapable of offering relevant perspective into the tight oil and gas industry (thought I can buy, and sell him, with the credit limits I have on ONE Mastercard). I have had WI in shale oil wells. He has never SEEN one.
You folks love Novi, when I give you updated 10.25 Novi stuff it is backed up with 60 years as an operator, you ignore it. What…I am bias? With realized production data and not EIA BS?
Don’t flatter yourself, SS. There are thousands of us out here in the real world with no back up plans, no bail outs. Oil and gas is all we have. We’re too busy trying to make ends meet to have Stage 4 TDS.
Think about it buddy: it really IS antioilbarrel.com, ain’t it?
Mr Shellman,
I think your analysis is the best around for oil and natural gas. Loved your recent analysis of Faja and your recent comments to that forum post, always enlightening.
https://www.youtube.com/watch?v=99JWkey3_tE
5 minutes
All hope is not lost on oil prices
USA boards a Russian shadow fleet vessel.
According to this commentator,
This means game on for shadow fleets…..5-6 mbopd.
If Russia can’t use shadow fleets they might need to close down their northern siberian pipelines 1-2 mbopd which took 20 years to reopen after the fall of soviet union.
He thinks Venezuelan oil is going to 0.
Orinoco is in the Amazon, no skilled labor, no infrastructure, guerilla groups control the pipelines, etc
watch for yourself
Thanks Andre,
If this person’s (Peter Zeihan) opinion is correct, we may see rising oil prices. OPEC is pretty close to its sustainable capacity (maybe it could raise output by 1 Mbpd) so if the shadow fleet was shut down over the next few months and OPEC output increased by 1 Mb/d we would see World C+C exports fall by 4-5 Mb/d, the equivalent of World C+C output falling by about 5.4% (4.5/83). This would indeed be a big deal. It would help Ukraine in its war effort, but it also increases risk of war between Russia and NATO, if China comes to Russia’s defense we could see WW3, obviously not a great result.
Hopefully US Senators recognize his risk and Republicans find a spine.
As usual, I enjoyed watching and listening to Peter Zeihan, but as usual, he got a bit over his skis. Name me the country that will join with the USA in ridding the seas of the thousand-strong shadow fleet busily transshipping oil. Let’s see: England? France? Poland? Norway? Canada? Japan?
Golly, does that mean we have to do it all by our lonesome? We probably could but it would require every oceangoing vessel we own.
Venezuelan oil is not going to zero, because Chevron produces about a third of it, and by the time this is over they’ll be producing much more. At some point, unless the USA wants to become a pariah, it will have to somehow deliver a good percentage of the oil money to the starving class.
Hugo Chavez and Madura were both evil bastards, but there are likely layers of people who think just like them, waiting in the wings to take over. It may be that the Venezuelan people eventually decide they’d like to become a protectorate of the United States; after all, they seem to be largely happy that Madura and his wife are gone. That would be the ultimate test of the Monroe Doctrine.
He says Ukraine can bomb them cheaply with drones.
Whole series of videos on this if interested. (Youtube @Peter Zeihan)
Shadow fleets are becoming uneconomical to run and who wants to captain a ship that is being chased by the US Navy?.
I don’t see Venezuela going to zero either unless there is civil unrest…which certainly seems possible.
Who knows? Definitely not me!
https://www.youtube.com/watch?v=PDCmRzOJtq0
Ukraine bombs Russian shadow fleet tanker
Is it rabbit season….is it duck season….it is shadow fleet tanker season
Peter Zeihan is a moron. It’s a genuine waste of energy to even read his words, let alone cogitate over them.
I’d take Zeihan over Kleiber without hesitation or regret.
Zeihan really understands Geopolitics very well and has best selling books out there.
One of the few guys empahsizing “Demographic Inevitability”
Where he goes wrong IMO, is he is a little too confident in his forecasting ability.
As Gerry says, out over his skis.
Peter Zeihan has been predicting China will collapse each year for over 20 years now. Man’s an idiot.
He’s so knowledgeable about geopolitics, he forgets China and Russia share a land border and the loss of the shadow fleet tankers means nothing when you have the biggest fossil fuel pipeline projects in history being built right now between the two countries.
He’s the guy who peddles the New American Century idea whilst the US illustrates daily now that it is a dying empire that is lashing out as it loses all relevance. He’s for the birds the same as articles from Serious People who are discussing what America will do with Venezuela’s oil (nothing, because America doesn’t have Venezuela’s oil or gov’t) or how to carve up a destroyed and humiliated Russia (just ignore that Russia is taking on all of NATO without a sweat and Ukraine is going to be all over in the very near future).
I mean Andre, didn’t you in a previous thread fall for the masses of Venezuelans celebrating the removal of Maduro, which is either a) footage from people in Miami or Chile, and therefore irrelevant or b) AI generated or outright misleading as to the reasons.
Please, learn some media literacy.
But sure, put your stock in him. I’m sure it’s a comfort to rely on the Sinophobic piece of shit who embodies the neoliberal imperialist ambitions of one Donald Trump (the most imperialist president since Biden and Trump 1.0 and Obama and…).
Also love the “Maduro and Chavez were evil bastards”.
Do any of you people not get your hot takes from the CIA and US MSM? Have you opened a book or talked to the people in the nations you keep dicking over for corporate gain?
I find it really funny how bent out of shape this forum got over Trump getting elected, but actually how it’s totally fine to get rid of ” the evil bastards” just like we did with Saddam and Gaddafi and such. Great things that are definitely not the product of evil minds that pay lip service to the rules based international order until it conflicts with your nation’s priorities.
I’m going to enjoy watching America finally sundown and implode like the British Empire, hopefully without taking the rest of the world with it. The world will be a better place without constant war mongering shit heels like the US gov’t and the single most evil organisation, the CIA doing a colour revolution whenever a country decides to have free elections of people they don’t personally endorse.
Thanks Kleiber, for the reality checks provided.
“Peter Zeihan has been predicting China will collapse each year for over 20 years now”
Zeihan says China will collapse in about a decade from now because of demographics.
China imports the things it needs to survive (food, energy, etc), which limits their expansion plans.
He says pretty much same about Russia (not enough men in 20-30 range to defend the country)
He is certainly not an idiot or a piece of shit.
But he certainly gets things wrong like everyone else.
I think he offers a consistently valuable perspective.
On a matter which with I’m intimately familiar, he had a huge gap in his knowledge. A very stereotypical American gap in knowledge. For post war Austria, he was completely ignorant of the country being occupied (divided, just like Germany) for ten years after WW2. And that it had to promise eternal neutrality to get the Soviets out.
The context was discussion of why it was not joining NATO and going after Russia…and he opined on the history…but had a total clueless middle American take on things.
So….kind of a Gell-Man non-amnesia moment for me:
https://en.wikipedia.org/wiki/Gell-Mann_amnesia_effect
But enjoy your “smart for Reddit” type videos…
Andre, what expansion plans?
This is all projection. America wants Greenland, so imagines Russia and China are going to fight for it, supported by zero evidence.
The US fears China will take Taiwan by force, because that’s precisely what they’d do.
So of course the US also reckons China is going to become some global hegemon for… reasons. The nation that has not a single colonialist bone in its body is the one that is going to encroach on American turf like Red Dawn 2.0.
Because otherwise, why wouldn’t we have the MIC grift go up to $1.5 TRILLION next year? Don’t you guys have more pressing problems, like your crappy schools, infrastructure, wealth inequality, fascist cop agencies and miserable healthcare? Did you want an extra challenge by taking on the largest actually productive economies globally too?
Goddam America could have been so much better. Reagan really did a number on the place (and Thatcher on the UK, but the were already in a nosedive regardless).
“Andre, what expansion plans?”
China redrew a map of Siberia (and claimed Russian Natural Gas as theirs.)
and the
poorly named South China Sea, China claims it all theirs. Disputed by all countries in the region.
Mongolia? Australia? The Philippines, Vietnam, Taiwan have all been theatened.
Russia in the Ukraine is very obviously an attempt at expansion right in front of our eyes?
Kleiber very obviously has an Anti-American bias.
The world would be a much better place if the US Navy stopped policing the Oceans (sarcasm)
and then global trade would collapse and piracy and barbarism would take over the World.
Do you benefit from global trade Kleiber?
Yes the USA makes mistakes and biased decisions.
Offering to buy Greenland is strange but I don’t think America would slaughter innocent Greenlanders.
USA grabbed Maduro and spared the citizens. Could very easily slaughter them. But didn’t (except for a few unlucky ones). Has claimed atleast verbally to try to help them form a democracy and benerfit from oil.
That remains to be seen, but the verbage is there.
China signed a major gas deal with Russia for the Power of Siberia 2 pipeline. Why would they invade for something they already get?
The South China Sea is also home to a load of nations the US has been trying to turn against China.
Oops, looks like that’s failing too: https://www.aljazeera.com/news/2025/10/28/china-asean-sign-enhanced-free-trade-pact-as-trumps-tariffs-linger
Did Zeihan predict this? Guessing not. I think that should tell you something.
And sea disputes like this are nothing new. Look up the Cod Wars where the UK all but went to war with Iceland over such things as rights to the marine territory. Are you going to tell me the UK is a major threat to the world too?
The fact that you think Russia invading Ukraine is about expansion from the world’s largest nation that is self-sufficient in every major resource, tells me you actually don’t really know what’s going on. Please read up on the topic. It’s pretty telling you think Ukraine is about a land grab when Russia already right now has the most productive parts of Ukraine in its possession anyway. Riddle me this: what does Russia gain by invading Berlin and all of Europe as the EUro morons keep incessantly screaming about is definitely going to happen? Of what possible use does this serve? I’ll wait.
“Yes the USA makes mistakes and biased decisions.”
LOL! Good one. And then you ruminate over whether the US would murder 50,000 innocent people who are part of NATO and how fortunate the people of Venezuela were that the US didn’t do what they enabled in Gaza: a genocide.
At least we have stable shipping for world trade. Oh, wait. Isn’t the US now just doing random piracy and causing world freight rates to go up because of the genocide in Gaza and the Red Sea issues they couldn’t resolve by bombing Houthis, not to mention the tariffs demolishing any semblance of stability globally?
Thanks, America! My energy bills being 2x more than three years ago is much appreciated.
And you wonder why I have an anti-America bias.
Your country is a dangerous joke and needs to end, like all Nazi empires run by pædophiles.
Agree to disagree.
FWIW, Zeihan thinks globalisation is coming to end (has a best selling book on it ) and the US Navy will stop policing the Oceans
He thinks USA is self-sufficient with oil because of Shale. I disagree with him on this.
We shall see.
Globalisation is for sure coming to an end, that much is certain. This is the way of the mercantilist power of old, which given how Trump is playing things now, very much the plan.
I think it’s mask off time for the US as they pivot to their hemisphere of influence and do with it as they wish. Nothing else makes sense either this neocon project.
In oil news, Trump is pissed off at Exxon because they said Venezuela is uninvestable, ha.
left-extremists in Berlin blow up a transformer/power station for using FF, so many will be without electricity for the next few days.
The only way for the west to avoid suicidal destiny is to immediately award NB prize to Trump and create a new prize of Civilization Renaissance for MAGA
Sheng Wu,
Regarding Trump– there are no documented instances of an individual being awarded a major international prize (like a Nobel) for work produced during the active public progression of Alzheimer’s disease or frontal lobe dementia. The cognitive decline associated with Alzheimer’s generally makes high-level output impossible during the progression of the disease.
Sheng Wu- helpful hint.
You may want to stick to your area of expertise so as to avoid big embarrassment, and loss of credibility.
In the US we have our own form of domestic terrorism-
and her name is Christi Noem. Just ask the family of the women she had killed in Minnesota yesterday.
If they were far right terrorists, they’d have just shot a load of people instead. Much more pragmatic.
I don’t endorse this dumb action, but at least they didn’t do what every right winger would do, which is blow away a load of minorities.
NYT video on Venezuela.
https://www.nytimes.com/video/world/americas/100000010624752/why-trump-is-fixated-on-venezuelan-oil.html?campaign_id=9&emc=edit_nn_20260108&instance_id=168979&nl=the-morning®i_id=120829778&segment_id=213293&user_id=243f924e1c2948f5eb55e2456db651fb
Kind of meh on the video. Very slow delivery of obvious info and a small amount of content. And with creaky vocal fry by the speaker. Then again, midwit Yankees think NPR and NYT are intellectual. Enjoy your Wordle and your recipes!
I did like the graphic of oil production and reserves. That was powerful and well presented.
Note that there probably are a lot of people that think the geology could move resource to reserves, with investment in technology. There’s something with the 300. Essentially it is a resource/reserves question. And the history of the industry has been one of moving resource to reserves.
Even Hubbert thought Vz tar sands was significant (see page 20 of his 1956 paper) and of the order of 300 Bbo (including some Iraqi deposits) and similar in nature to Canadian deposits. He excluded tar sands and oil shales (the Green River stuff, not LTO) from his overall world estimate (which itself was way low, but that’s peak oil for you) on the belief they were too hard to extract.
WRT Green River “oil shale” he was correct. But on tar sands he was wrong…with very important production going on now from Canada and from Vz before radical socialism gutted the infrastructure.
As Wu has noted, if anything the nature of the deposits in Vz are easier to flow and require less upgrading. The issue with Vz is security (physical, contractual, “local content” rules, corruption, theft, etc.) that affects investment and maintenance.
https://www.threads.com/@geologylife a geologist from Europe
“Venezuela’s Orinoco Belt is a literal geological glitch. We’re talking 1.2 trillion barrels of extra-heavy crude packed into one 600 km strip. To put that in perspective: that is basically as much oil as every other known light oil reserve on Earth—combined! It’s the final boss of energy deposits. Having oil is one thing; moving it is another. Venezuela’s reserves are extra-heavy—think less ‘gasoline’ and more ‘cold molasses.’ Of those 303 billion barrels, only about 10% is actually viable at today’s prices. The rest? It’s basically trillion-dollar tar stuck in a broken system. A geological ‘looks good on paper’ situation that the rest of the world is now scrambling to fix. Venezuela’s oil wealth is basically a 50-million-year-old physics project. When the Caribbean plate slammed into South America, the Earth’s crust warped. It created a “foreland basin,” which is essentially a giant, continental-sized bowl. While the mountains rose up, ancient Cretaceous rocks deep underground were busy “cooking” crude. That oil then migrated up and got trapped in the basin’s porous sands. The scale is genuinely hard to wrap your head around. The real kicker: once that oil hit the shallow, cooler sands, it got absolutely raided. At temps under 80°C, anaerobic microbes basically treat light crude like an all-you-can-eat buffet. They devour the light hydrocarbons and leave behind a heavy, sulfur-laden sludge. It’s called biodegradation—nature basically ‘digested’ the good stuff and left us with liquid asphalt. So Geologically speaking, the Orinoco Belt is a mess. You’ve got the Miocene Oficina Formation—a stack of sand and shale from ancient tides—trapping oil that’s too thick to move. While most oil floats, this stuff has an API gravity as low as 4, so it literally sinks in water. Imagine trying to suck a frozen milkshake through a needle, but the milkshake is thousands of times more viscous than water and buried under a kilometer of rock. That’s the reality of Venezuela’s ‘molasses’ crude. Venezuelan oil is genuinely built different, it’s chemically cursed. We’re talking ‘sour’ levels of sulfur (up to 4%) and a molecular weight so heavy it’s basically sludge, thanks to these things called asphaltenes. It even has vanadium and nickel riding shotgun in the mix. Most refineries wouldn’t touch this because the metals would literally delete their expensive catalysts on impact.”
Some decent info in there, but then also a bit of a rant.
1. I would remind that geology teaches you about plate movements and the like. But things like production and cost of production are engineering and business problems. Being a geologist does not make you an expert here, just as being a semiconductor physicist doesn’t make you an expert on how to design a good stereo system. There is a tendency within the midwit Reddit/Twitter skeptic sphere to think that expertise in one domain applies to all, but this is a very childlike view. In reality, you hire the electrician to wire the house and the carpenter to erect the frame. And a general contractor to oversee them.
2. The 4% S is not the end of the world. It has been handled for years now from Vz and Canada. Sure, you’d prefer not to have it. But it’s just money…just some extra methane to hydrotreat it and the capital to have the right pots and kettles…and mountains of yellow stuff sitting on the dock that actually sells at negative cost now! (You pay people to take it away.) For that matter consider, that the shale boom has been extremely LOW sulfur. So average sulfur across all grades may have even been declining the last few years. I.e the system has capacity to absorb some S. In addition, many people here seem unaware that classic Kern River crude from California (a major producer since the 19th century) is about 17 API, with 4%S, (almost identical to diluted tar sands from Alberta or Vz). And the industry has handled it for well over a hundred years.
3. I don’t know about the metals either. Bottom line is they will do an assay, assess the issues and then send it to facilities that can handle it, add Nalco special treatments, alter their UOP catalysts slightly etc. And again, people have been running this oil for decades now! Vz was doing 3.5 MM bopd in the 90s. This is NOT a new field. This is not a technical problem like fusion or antigravity or the like. It’s something people have dealt with before. And…maybe “geologists” aren’t that strong at refinery engineering and refinery economics.
” how to design a good stereo system”
Specification: Stereo output available from a cartridge or head. Amplified signal into headphones or earbud.
Could do that in my sleep. Pick an op-amp with potentiometer. Perfect linear amplification, flat response across 20 Hz-20kHz. LOL. It would sound great, and then even more enjoyment since I built it myself
Try again.
Nony,
The question is whether the resource is likely to be extracted. Perhaps it will in time, even in the case of Canada only 12.5% of the resource is in the process of being developed to date in an advanced democracy. Perhaps Venezuela develops 15% of its resource in the next 50 years (higher percentage because it is easier to extract than Canadian oil sands) that would be 45 Gb, perhaps it is 50% of the resource after 100 years (150 Gb), depends on technology. The experts at Rystad have a best guess for Venezuela of 27 Gb most recently and back in 2020 their guess (2PCX) was about 44 Gb for Venezuela. Maybe Mr Shellman can ask some of his PE friends what they think about likely prospects for Orinoco Belt recovery 27 Gb or 300 Gb or something in between? I think 90 Gb (P50) with a range of 30 to 270 Gb makes sense (P10 to P90), but I am not a petroleum engineer (PE).
Amateur sleuthing through Google Maps in the Venezuela Orinoco doesn’t reveal much in the satellite imagery. It’s very easy to find areas in the Athabasca tar sands in Alberta, Canada but nothing jumps out in Venezuala tar sands, except for this region called Petrocedeño which is near the northern coast and is mainly labelled as an oil refinery. That will be the problem with Venezuela, — there are no images from Google Street View compared to neighboring Columbia, Brazil, and Guyana, and who really knows how much the guerrilla forces control the jungles and land around the Orinoco river basin. Everything seems to be speculative at this point.
The troubling aspect is that (1) I do understand that Canada tar sands ere essentially strip mined so that lots of area can be covered, but if it’s true that (2) Venezuela tar is under 1 km of rock, something will have o give to make it cost-competitive to extract — maybe a better API in Venezuela, yet I see that Athabasca bitumen is similar in quality to Boscan crude from Venezuela.. Yet Boscan is from Lake Maracaibo, which is not Orinoco, and so that may largely be developed — as always, the easiest best oil reserves are used first. Who really knows how the much larger Orinoco will play out.?
Anaysis by Rystad on what would be needed to revive Venezuela’s oil industry.
https://invezz.com/news/2026/01/06/analysis-venezuelan-crude-oil-recovery-remains-a-distant-multi-billion-dollar-dream/
Excerpt:
“The agency said that it would be possible to scale up production back to 1.4 million bpd in less than 24 months, but that would take a total capital expenditure of $14 billion. Bringing Venezuela’s crude oil production back to 3 million bpd by 2040 would require a total oil and gas investment of $183 billion over 15 years, equating to an annual investment of $12 billion, Rystad analysts further said.”
Rystad thinks output could reach 2 Mb/d by early 2030s with about $108 billion in CAPEX from 2026 to 2033 (13.5 Billion per year over an 8 year period), another $75 billion over 7 years ($10.7 billion per year) gets Venezuela to 3 Mb/d by the end of 2040.
At 3 Mb/d that is about 1.1 Gb per year. Resources may be between 27 Gb and 300 Gb, at 1.1 Gb per year those resources would last between 25 and 273 years. We could take 30 Gb as a low estimate and 3 times higher (90 Gb) as a medium case and 3 times higher (270 Gb) as a high case for Venezuela’s resources. At the medium case estimate we would have about 82 years of output at 1.1 Gb per year.
Interesting analysis of Russian Tanker capture near Iceland and its implications. at link below.
https://thenightly.com.au/politics/us-politics/donald-trump-russia-and-the-shadow-fleet-how-a-seized-oil-tanker-exposed-a-new-global-confrontation-c-21244784
Scenario at link below based on the Rystad analysis of Venezuela through 2040 with assumed continued increase after 2040 at 2026 to 2040 rate of increase and same rate of decrease after short plateau. URR of scenario is 106 Gb for Venezuelan C+C output from 2025 to 2108.
Some will believe the Rystad estimate of 27 Gb is more reasonable so that this scenario would appear optimistic to those folks, others see the many estimates of 300 Gb for Venezuela’s reserves and would consider this very pessimistic.
I tend to think we don’t really know, but expect for this scenario to be realized we would need oil prices over $80/bo. If the futures curve for oil prices is correct long term (2038 prices at $60/b in 2025$), then this scenario is likely to be too optimistic. I assume oil prices may continue around $60/b in 2025$ for the foreseeable future (say out to 2100). Under that assumption we would need a technological breakthrough to bring costs much lower for extra heavy oil for this scenario to be realized.
venezuela2601
Optimistic (unrealistic) Venezuelan scenario with cumulative output from 2025 to 2171 of 300 Gb, peak 10 Mb/d in 2088. Perhaps this would be correct in a World with oil prices at $250/bo in 2025 US$. I doubt we see oil prices rise to this level.
venezuela optimistic
so little Billion investment and so fast to get back to millions of barrels per day in Orinoco!
it took Guyana well over $50 billion and over 12 years to get to 1MBOPD.
I’m guessing there needs to be a minimum foundation of security before any investments in oil infrastructure can bear fruit. Shortest route being a more functional and repressive dictatorship than addressing the structure of corruption and violence that exists now..
“I’m guessing there needs to be a minimum foundation of security”
There needs to be physical security, sure, but there also needs to be contractual security. I suspect the IOCs are very sensitive about both, and both are a very big problem in V.
I suspect most Venezuelans are not going to be to thrilled as they come to realize just how much of the oil revenues from their oil over the decade+ is going to be taken from the country.
Not a very stable scenario.
Nony is the Grand Winner of the 2025 POB WTI Guessing Contest
The December 31 WTI closing price was $57.26/b. Nony $69/b
The average WTI price for the year was $65.39/b. Nony $71/b
Congratulations to Nony. 🍾🍾🍾
Nick G and Dennis were close second and third.
A Guess
Thanks Ovi,
Interesting that the average guess for yearly average was about $15/b too high for 2025.
Huzzah!
Congrats Annoying,
I missed it by a year. This will be the year we see 100+ a barrel oil.
My whole life, I have missed everything by a year.
Alas…..
Thanks Andrea! 😉
Can’t even remember this! But I expect I just bet the strip. Itself too high, versus events. Maybe Nick and Dennis did also and we just had slightly different calculations. Or maybe I “Price is Right”ed them, by just going slightly under them to control the entire low end of the prediction space. (Can’t recall.)
Interesting that there was not a single “short” contrarian in the crowd. I.e. someone betting well below strip. And also 4 out of 15 (more than a quarter) of the responders predicted $100+. Hmm…who’d of expected a buncha price bulls on a peak oil website? Hmm. Riddle me that, Batman. 😉
Of course there is a lot of luck and chance in these things. The EIA “funnel graph” of 90% confidence intervals shows this is quite wide as soon as you get a few months out. Very high random chances of much higher/lower prices, difficult to predict.
https://www.eia.gov/todayinenergy/images/2015.08.19/main.png
Maybe +$40 and -$30, if you look at the 12 month out contract. I.. $30-$100, with a $60 mean! (The range on the year average would be lower of course because of averaging the gyrations during the year and also some of the months being closer in time, but still…shows the dynamics of just how the random up/down risk is sort of higher than most people intuitively think.)
But. That sort of goes to why I think a high, medium, low approach should be done. And something BELOW strip should be one of the options. I don’t know how many times I’ve said on here or at SA, that not only could the strip be right…but it could even be wrong in the “too high” direction.
SA longs hate to hear that kind of talk…they just want to cheerlead their high beta CRC (for oil) and CHK (for natty) stocks and their margin-multiplied futures bets (can’t remember the names of these instruments). “Long CHK!” they would contribute to analytical discussions…just blatantly cheerleading and trying to shout down the outnumbered (in comments, not in finance) shorties.
It was a bloodbath when CHK finally crapped out. I tried to indulge myself with some schadenfreude saying “Long CHK!” to them, but most had disappeared from the discussions. 🙁
Right now, I sort of think of my intuitive high, medium, low as $75, $60, and $45. Basically strip and $15 above and below. And using round numbers for simplicity. And in the context of shale predictions, that’s really the three options I think of.
And I don’t agree with calling $45 “very low”. Sure, in the context of “producer pain”, $60 might already get called low and $45 “very low”. But I don’t have a producer (or peak oiler) bias. If anything I have a consumer/refiner bias. But anyhow, $60 is strip and middle of my three scenarios…so I would just call it “medium”, not “low”.
Long CHK — I remember that, was fascinated by CHK cheer-led shale revolution.
Another interesting piece on Venezuela-US- China and oil.
https://www.cnn.com/2026/01/08/climate/china-venezuela-oil-demand-electric-vehicles?utm_source=firefox-newtab-en-us
Makes the classic “X buys Y’s oil” fallacy that I see in so many news stories.
The answer to “who will buy it” is whoever wants to pay for the cargo. Every export terminal or midstream/producer has a marketing team.
And every refinery has a marketing person doing crude buying (and another one doing products selling). It is EXTREMELY routine for them to grab random cargoes that are looking for a home…even a slightly underpriced crude cargo is a massive boon to a refinery, which is a pass-through business (in essence). IOW, there is a massive “spot” market out there.
There are many refineries in the Atlantic basin capable of using Vz crude, especially if blended with light sweet to make medium sour (at the refinery or elsewhere, but at the refinery is the norm). Pretty much most of the refineries in Europe/US/LATAM/Africa have the capability to handle medium sour.
To the extent it is an issue, there are some refineries with more complex kit (e..g. cokers) that handle high resids volumes better. But I would not exaggerate the issue here. People have been buying Vz heavy oil for almost a century. (And buying 17 API California Kern for almost a century and a half!)
The answer is…it will get thrown on the market and consumed. Just like waterborne oil in general does.
If anything, if we take off some of the sanctions silliness, that crude will get much better prices and Vz will get more money from their oil. (There is a heavy diff right now, because of the transport hassles to shadow fleet it around.)
CNN is now biased toward US and favoring China, as Hegaseth said “disingenueous”
Sheng Wu,
I’m sorry to say it, but repeating Hegseth’s talking points is just…embarrassing. Hegseth is embarrassing. I feel bad for the military that has to deal with this extraordinarily unqualified clown. He was a Fox commentator who the president thought looked good on camera, and even for that job he was badly unqualified.
Hmm…that sounds grumpy. Why is that? Well, as a patriotic American I’m deeply embarrassed by this president.
Also, it often seems to me that this president could hardly be more biased towards China and Russia if he was on their spy payroll: everything he does helps China and Russia and hurts the US’ relative standing.
Norway published “The Shelf 2025” oil and gas status report.
https://www.sodir.no/en/whats-new/publications/reports/the-shelf/the-shelf-in-2025/summary/
New production estimates for oil + condensate + NGLs are as follows (million bpd).
They have a tendency to beat the forecasts, 2025 they did it by about 3%. Now they are projecting 2% decline for 2026 (oil + condensate + NGLs). Crude accounts approx. 90% of the figures.
2024 | 2,01
2025 | 2,04
2026 | 2,00
2027 | 1,94
2028 | 1,87
2029 | 1,74
2030 | 1,63
A couple of phrases from the summary itself:
“Both production and investments were very high in 2025. Oil production (106 million standard cubic metres is the highest since 2009. Production from the NCS (Norwegian Continental Shelf) is nearly equally distributed between oil and gas. A total of 120 billion standard cubic metres (gas) was sold, which represents a minor reduction from the record-breaking year of 2024.”
“We expect gas production to remain at this level over the next three to four years. Norwegian gas accounts for about 30 per cent of EU gas consumption, and Norway is Europe’s largest supplier after cutting off Russian gas,” Stordal says.
Concerning oil and gas:
“Toward the end of the 2020s, the Directorate expects a reduction in overall production. A number of new field development decisions will be needed in order to slow this anticipated decline. It will also be important to maintain high exploration activity. Failing to invest will lead to a substantial dismantling of the petroleum industry. “
Nick wrote:
“……. China’s big move to electrify all land transport: light vehicles, heavy, buses, trucks, mining heavy movers, river transports, etc., etc.…..”
Nick, good work from them but what about the following issues:
China’s energy transitions for carbon neutrality: challenges …China’s electrification faces challenges from grid bottlenecks due to renewable sources being far from demand centers, straining transmission infrastructure, and the need to balance intermittent wind/solar with stable supply. Problems include curtailing renewables (wasting clean energy), managing extreme weather impacts, upgrading distribution grids for two-way power flow (EVs, rooftop solar), and dealing with coal’s continued role, creating complex system balancing acts.
Han,
Those are all things that are fairly straightforward to solve. OTOH, the solutions are a complex discussion.
Take one item: transmission. A great thing about solar is that transmission and distribution can be eliminated by placing solar on rooftops, placing generation right where it’s used. That’s what China is doing: very roughly 40% of Chinese solar is on rooftops.
Similarly, two-way power flows are a great problem to have, enabling micro-grids, allowing the grid to make use of EV storage, etc.
Han. Those challenges in China that you describe are the same ones that whole will have to learn to manage for the remainder of our history. Hopefully they, along with the rest of the world, will find some workable solutions. There has been a lot of progress, learning made on these challenges over the past 5 years.
Hickory, Han,
These are not overwhelming problems. They’re basically the same things that grid managers (in the US, mostly Independent System Operators) have always dealt with.
For example, if you need more transmission, you build it. Texas did that recently to bring wind power from West Texas to population centers in E Texas. Iowa is doing that, except of course that the president is interfering. Rooftop can be a good solution, also. Sometimes building close with slightly less optimal wind/solar resources also makes sense. None of this, in the larger context, is that big of a deal.
The biggest problem with solar and wind are the episodes of piss poor output that are inevitable. The dark winter problem for solar is an economic and reality non-starter in many parts of the world.
So it is wrong to underestimate these problems.
But yes, we will learn to work with the limitations of everything, such as the roughly 6 week downtime a nuclear reactor has every 18 months for fuel rod replacement, or the occasional oil refinery explosion.
A few thoughts:
Winter isn’t as hard as it might seem. First, remember that grid planners don’t like to rely on a single source – in particular, solar will be paired with wind which is inversely correlated with solar: higher in winter, higher at night, higher in bad weather.
There’s an odd hidden assumption in many analyses of renewables: that one should only evaluate domestic resources for each country. We would never make such an assumption for FF. Renewables are far more evenly distributed than FF, but still, it’s perfectly okay from some countries to import electricity.
Solar is much more evenly distributed than FF. 95% of the population, at least, is where solar is viable even with winter – Germany is a good example. Germany doesn’t’ have the best solar or wind resources, but they’re determined to make them work.
Roughly 95% of the world’s population has better insolation than Germany: see the chart of insolation vs latitude:
More later.
IMG_5269
https://www.commondreams.org/news/trump-says-oil-companies-tipped-off-venezuela?utm_source=substack&utm_medium=email
Trump informed billionaire donors of attack on Venezuela before it happened, but not Congress!!?
Also Russians diplomats fled Venezuela a week before the attack, so Trump seems to have informed Putin too.
Or…they noted the buildup of a very unusual amount of naval assets (this is not a normal steaming location for a multicarrier strike group). Which was very well reported in the MSM. And completely obvious to any kind of intelligence organization. 😉
https://www.youtube.com/watch?v=PDCmRzOJtq0
Joe Blogs (who I think is really good on Russian topics)
says the USA has rug-pulled Chinese and Russian investment in Venezuela.
and they are pissed!!
Anyone know if Post Carbon David Hughes is still doing shale analysis. Haven’t seen anything for a couple years.
He is getting older, so maybe a health issue. But also the shale skeptic business has generally not worked out well. Instead of deflating the hype, he should have said it needed more hype..
https://www.postcarbon.org/whither-shale-oil-interview-with-david-hughes/ old, but shows his tendency.
More recent analysis by Hughes from 2021
https://www.postcarbon.org/publications/shale-reality-check-2021/
Yeah, I know his page at Post Carbon well. Used to see something new about annually. Nothing since 2021. I don’t see YT videos of him either, since 2022, which used to happen sporadically, but often.
Iran
Is this the beginning of the end for the murderers in power in Iran?
I truly hope so.
https://www.independent.co.uk/news/world/middle-east/iran-protests-latest-news-internet-blackout-b2897390.html
Trumps actions in Venezuela are inspiring people to in many countries to realise that brutal dictators can be overthrown.
Well done President Trump
Yeah, it’s inspiring to anyone spending hundreds of billions on defense. Not too practical otherwise.
Also keep in mind that the same people are still in power. Kidnapping the president is not the same as conquering the country.
Here’s the real story: Little Donny really really wants that prize.
https://www.independent.co.uk/news/world/americas/venezuela-machado-nobel-prize-trump-b2897335.html
Nice to see the Senate has the backbone to shut down this dumb adventure.
It’s amazing how shallow, weak, and corrupt this pedophile really is. Even more amazing to see his bootlickers’ mental gymnastics to justify his increasingly erratic behavior.
Alim
You are irrelevant
The murderers in Iran fear President Trump
Trump requested 1.5 trillion for military.
That should go niceley with USA almost 3 trillion medicare and medicaid growing at 9% per year.
And 1 trillion social security.
USA will need to print money to restock the vending machines at the capital building
Nothing like showing the world that international law is, and always has been a sham and that actually you can do whatever.
Oh, another Mossad backed agitation event in Iran? Will it go as well as it did last year read: not well at all?
Funny how the people of Venezuela are all rallying behind Delcy. You’d think for someone who was full in on the Bolivarian movement and a right hand to Maduro, that they’d be kinda pissed off with that.
It’s almost like the US has been trying to tear apart that country for its resources since the ’70s. Weird.
Haha, they just can’t help themselves, can they?
https://x.com/EliAfriatISR/status/2010025472273592781?s=20
Ron and people like him on TheOilDrum who claimed peak oil happened in 2008, or again in 2012 then after it shut down continued on other platforms claiming it was now 2015 and lastly 2018.
They all had one thing in common they were not oil men and they were arrogant in their own limited knowledge. I tried to explain to them that in these years politics was just as important as geological decline.
Politically driven bans on drilling would have more impact than geology. Wars and sanctions have had a huge impact on countries access to equipment and technology. On the other side a new free country has access to all these things and can reverse years of decline.
There is a good reason why global oil production is hitting highs these people dismissed. They didn’t know what they were talking about did they.
Current production is in the middle of my low and high estimates. Will it go higher? All depends on politics at the moment. As the years go by, geology will become the dominant factor.
Way you go 86million barrels per day!
Iver,
As of Sept 2025 the monthly peak is 85244 kb/d, trailing 12 month average peak is 83135 kb/d based on EIA data from
https://www.eia.gov/international/data/world/petroleum-and-other-liquids/monthly-petroleum-and-other-liquids-production?pd=5&p=00000000000000000000000000000000002&u=0&f=M&v=line&a=-&i=none&vo=value&t=C&g=none&l=249–249&s=94694400000&e=1754006400000&vb=173&ev=true
Dennis
It is now January 2026
Iver,
Reporting the data we have rather speculating on future output. We might be at 86 Mb/d. OPEC output increased by 53 kb/d from Sept 2025 to November 2025, that would increase output to 85300 kb/d if there were no decreases elsewhere, US output increased by about 20 kb/d from Sept to Nov based on latest STEO, so maybe 85320 kb/d. Unclear what has happened in the rest of the World until we have data. STEO has total World crude production increasing by 50 kb/d from Sept 2025 to Nov 2025 which is the peak up to Dec 2026 (end of most recent forecast).
We will see, STEO has World crude production decreasing by 1370 kb/d from Nov 2025 to Jan 2026.
https://www.eia.gov/outlooks/steo/data/browser/#/?v=30&f=M&s=0&maptype=0&ctype=linechart
I agree that both politics and geology will be important in determining future output. Do you have a chart of your different scenarios you can share? Usually saving in gif or jpg formats reduces size of chart to less than 55 kB which is as large as they can be to post properly in the comments.
Mike.
We own oil wells and Trump wants $40 WTI. So I don’t see the problem if I don’t like his policy in that regard.
I also don’t see why being critical of using taxpayer dollars to prop up another county’s oil industry is TDS.
I really don’t want to get into the political BS that continues to harm our country.
I don’t post here much, because there isn’t much to talk about these days. I mainly come to read the posts about where current USA production and world production is. Ovi gives a good summary in my view.
My posts are just vents. Nothing I’m adding is beneficial, I agree.
I just feel like anonymous would celebrate factories in the USA closing if the price of jeans would drop $3. My wife went through that in 1997. Because consumers deserve cheap cars, she lost her job when the auto factory she and 700 other people worked at closed and moved the production to Mexico.
Heck, Chris Wright is going around touting that they want to drop the price to make it tough on US oil companies.
I don’t see why I have to agree with that?
Shallow Sand,
Mr Shellman may have thought your comment was addressed to him, though it seemed to me you were addressing Nony in the comment Mr Shellman replied to.
Shallow Sand. I appreciate your perspective (‘venting’), and demeanor projected. We all benefit from hearing about aspects of these issues that we may not be familiar with. Thank you.
Shallow, you do not have to agree with me about anything I suggest is right, or wrong. You live in the most liberal, corrupt state in the Union, in my opinion. I don’t know how any country boy rooted in farming the land of Illinois, or extracting its minerals, who grew up in a rural environment can be proud of that. Whatever, that is for you to decide. I am from Texas; we might as well live on different planets.
Nobody here on anti-oilbarrel.com is interested in oil and natural gas, save two that I know of. Most use the forum to spew hate, divisiveness and contempt for our country. Including non-Americans from Europe and the rest of the world.
Why is that? Because they puff up like chickens about “democracy,” but after an entire year still cannot accept the outcome of an election, of a single moment in time in our nation’s democratic process. Read their shit, they are frightened like little girls. They are bitter, and angry. They don’t give a rats ass about the hydrocarbon future of our nation. They all love what you have to stay because you are liberal Democrat from Illinois who hates Trump. I can show them real data until the cows come home but they hate me because I am a conservative from Texas.
So no offense, my old friend, but I don’t have to agree with you either.
For the record, “Annoying” is a disruptor. An antagonist. He knows nothing about oil and gas. He has on more than one occasion wished you and I personally, by name, the worse because he wants nothing more than cheap oil and gas prices. If that is good with you, send him, or her, a Valentines Day card. Its not with me. He is intentionally undermining the energy future of my country by saying stupid things to stupid people who do not know any better.
Mike:
As you know our land and minerals are in S IL, KS and OK. None are a liberal bastion.
Another reason I don’t like Trump. He literally is willing to screw millions of people who voted for him just because they live in a blue state. And he’s apparently duped everyone into thinking the people of red states and blue states are a monolith.
I had a long post here, but deleted it. No need to stir up shit, that’s what the political elites want so they can stay in power.
But please be advised that you and I don’t live on different planets. I have Chicago and you have Austin. I suspect neither is anything politically like where you and I live.
I truly have no political home. I’ve seen both up close and can’t be a part of either.
I’d also say neither will accept the election of the other. We saw that to the hilt in 2020 didn’t we? To the point it’s apparently ok to attack police even though MAGA is supposedly law and order.
You know I don’t like any goons that attack police, no matter their politics.
I do know that; Shallow, what you do and do not accept.
Its OK. We’re different and we can agree to be different with the same bottom line: we both want…peace and economic stability in our country. With regard to what is best for our nation and hydrocarbons, I detest what Trump is doing. Just like you. I am an American oil man.
Its the other part of this shit forum I cannot stand. The opportunity it affords political bias…in lieu of something so important as peak affordable oil in our country. Its administrator, past and present, uses something as important as oil, to vent hate, divisiveness, and disruption.
I respect you. Let us agree that 99.99% people on this forum that wish to express opinions about our industry and its fate in the future, just 10 years ago did not know how to spell, oil. Annoying and Coffee are at the top of that list. We should not let them influence us, or interfere with real life experiences. Essentially YOU are the only contributor here that deserves to be listened to. You have a basic understanding of economics, I trust, that nobody else does here.
Good luck with that. People here look to you for answers. Or should.
Shallow, one other thing…I am sorta of sorry what I said about Illinois; sorta. Whatshisname the Minnesota Mafia guy, said some stupid shit today.
Coots use to tell me about Nigeria before we’d go over there for blowouts… if the world needed an enema… that is where they would stick the hose. He was correct.
I now feel the same way about Minneapolis. I have been there many times but have NO intention of even flying over the place on the way to Canada anymore.
Cold weather apparently makes dumb people, stupid.
Mike.
Again, don’t think all of Minnesota is like the Cities.
We used to fish Lake of the Woods and even owned a farm up there for a while back in the 1990’s.
We got to know quite a few people up in Roseau County, where Polaris was started. Super people. Tough as nails. You have to be given how cold it gets in the winter up there.
Also very talented people, the reason for the success of Polaris. Also incredible hockey up there. Many, many hockey stars from NW MN and NE ND.
Roseau, MN doesn’t even have three thousand people, but has had many play in the NHL and on USA hockey.
Unfortunately kids came along and it got a lot tougher for me to get up to Roseau County, as it is an 18 hour drive for us.
We tried to avoid the Cities because the traffic could be terrible. We’d get over to I-29 and head up that way.
Hard to beat fresh caught Walleye.
Yes, I’ve been avoiding this board mostly. Just vent some, but I can figure out better ways to do that.
Take care Mike. It’s all good.
curious who the Minnesota Mafia guy is
“Venezuela’s oil sector is deeply degraded, with production far below capacity and infrastructure in “catastrophic” condition.”
Trump Underestimates the Challenge of Reviving Venezuela’s Oil-
https://oilprice.com/Energy/Energy-General/Why-Trump-Underestimates-the-Challenge-of-Reviving-Venezuelas-Oil.html
As Anonymous pointed out below,
The problem with Vz oil is not just too heavy, it is related to the Vz socialist government radical nationalization policy in 2008-2014 which also happened in Argentina around the same time?
The Arg and Vz socialist government just felt the oil wealth is too large in 2008-2014 oil bubble and got more greedy and radical than communist China. Hope Milei and Trump could fix such problems.
While China’s Bohai bay still has contracts pretty much honored with foreign companies 30 years ago. Note that when PL19-3 had a major oil spill in 2011, the final penalty that ConocoPhillips carried was only 160million USD as 50% interest operator and CNOOC also got share close to 100 million USD. The field has been producing around 100KBOPD in the past 2 decades, and Conoco still 49% interest non-operator.
Sheng. I am sure that resource extraction would be much simpler if a country was controlled by an authoritarian in bed with the military industrial complex.
But sometimes the citizens of country find themselves unhappy with that.
I suppose there is reasonable balance to be carved out, but most countries have a hard time finding that.
Brief note to all …
Sidestepping the (seemingly ever present) slings, political jibes, ideologically based outlooks that permeate both this and SO many other online sites, I present you with a short ‘snapshot’ of current natgas production in the San Juan Basin by a small outfit named LOGOS.
They just brought online ~14,000 foot lateral with 30 day IP of ~25 MMcfd.
Just drilled – not yet frac’d – a 4 mile lateral.
Vertical depths are 6,000’/8,000′ with average cost for 10,000 footer at about 11 million dollahs.
The formation specifically targeted is the Mancos-Menefee which has a USGS TRR of 27 Tcf.
The larger San Juan Basin has a TRR of ~63 Tcf.
Doubtful that anyone here is even aware of this stuff.
Oh yeah, the Piceance Basin – just to the north – has a TRR almost triple the Mancos-Menefee in the San Juan Basin for the Mancos ALONE (exclusive of the other hydrocarbon-bearing rock in this Basin) … pegged by the USGS at ~66 Tcf.
Biggest relevance to these numbers may lie in the fact that you all deal constantly with truncated, incomplete data that might largely be sourced from prejudiced (read staunchly anti hydrocarbon) perspectives that historically have skewed ultimate ‘realities’ vis a vis oil/gas output.
(See references to David Hughes, et al above).
Expanding one’s info-gathering horizons might mitigate these constantly erroneous projections, but that could be tough to do if’n one ‘Don’t want it to be thataway’.
My 2 cents.
Coffeeguyzz,
I use the USGS estimates all the time for all of the shale plays in the US, but tend to focus on the largest plays.
Note that not all of TRR can be produced profitably, typically it is on the order of 65% or less of the mean TRR.
shale gas 2601b
Covfefe:
I’m not as jazzed by PR type wells as you. I mean, it has some informational content. But it’s definitely an anecdote (versus a holistic examination of production or geology).
But on the content, I agree that there is likely significant untapped gas potential in conventional formations like the Piceance, Manco, etc. Also the Barnett (within the Permian, Dennis…not that thing at the DFW airport, although maybe that is not considered conventional…but in any case gas-directed drilling is not a part of the “ass gas only” type Permian models).
I think it will take some price to bring that stuff in, but it’s lurking, looming. There’s also the potential of applying some shale techniques (even just hz drilling) to the conventional gas plays. So, I would not even assume that current price requirements will be the eventual ones. Look how late the Permian itself came on line as a shale play. Remember when people said shale was just about the Bakken and the Eagle Ford!? So, time matters. And yes, in theory, “they drill the best first”. But the best can change over time and not just from depletion.
Agreed on the bias. It’s basically “wishcasting”. People here (in general) are anti-FF politically. They want peak oil, want high prices, enjoy reporting decline and hate reporting increases. Look how TOD and ASPO shut down because of the shale boom…if they were just interested in oil, they would have continued doing analysis and not just in a “move the goalposts” type manner, but really curiously learning about the new industry and even celebrating it (versus slagging it skeptically as it grew).
It’s OK to have a bias by the way…but one should try not to indulge in “talking your book” when making predictions and doing analysis. Pressure test your own assumptions rather than only looking for affirmation. I was in shock, but not really, to see how there wasn’t a single person taking the “short” on price expectations. 0 out of 15.
Coffeguy,
If you don’t want to deal with political stuff, then don’t bring it up in your comments. For instance, in your comment above you grumbled about politics, then accused Peak Oil enthusiasts of being anti-FF!
From my experience with PO, I can assure you that there isn’t a general anti-oil bias, really it’s more the other way: PO concerns tend to have an oil industry assumption that oil is essential. If you make that assumption, the obvious solution to PO is Drill, Baby Drill.
Nony,
As of Jan 2024 there were 5 horizontal wells drilled in the Barnett Formation of the Permian producing 6 MMCF/d, for the whole of the Permian in Jan 2024 about 22 BCF/d of shale gas was produced from 47909 horizontal wells. So as of Jan 2024 the Barnett formation in the Permian was not really a big deal, when the EIA reports Barnett Shale Gas they are talking about production from DFW area, as there is actually some significant shale gas being produced there.
Good RBN piece on the Vz oil infrastructure problem:
https://rbnenergy.com/daily-posts
RBN tends to know way more nitty gritty than journalist types. So, some maps, facility names, etc. And giving context about what the biggest issues are.
It will go behind a paywall in a few days…so skim it now. Below are some of my takeaways, restating insights. Mixing in some of my own speculation inside [ ]s. Read the article itself if you don’t want the “Nony wasn’t born with a wrench in his hand and didn’t drill oil wells in sixth grade” non-industry-expert thinking. But I can’t help myself to want to squeeze more insight out by speculating on implications.
1. If you just want the bottom line, it’s similar to other stories in saying rehabilitating the oil industry will be a big, long, expensive challenge. But it does show evidence of knowing more details on the ground and written by “earl people”, not NYT sophisticates or poly sci type geopolitics analysts.
2. Vz oil has huge resources (“reserves”). They do note that there is some skepticism about the 300 BBO, but it is definitely big, sort of Canada scale.
[They don’t get into this more…I would not take the “27” from Rystad as some sort of geologic correction, feels much more like moving PUD to resource…you can see this with even the lower Rystad numbers declining over the years and faster than production…this feels like just having a harder stance on what a “reserve” is, that it needs an exit to port, see the same thing with differing arguments on reserves in Africa…some people go off the geology, some require a pipe to the coast before giving credit. I think on a Peak Oil website, your concern should be geologic limits not infrastructure, as the former is firm and the latter changeable. Certainly this is how Hubbert would think about it, considering things on a multidecade time scale.]
3. The oil is similar in nature to Alberta tar sands stuff, but actually a little easier to deal with. (Fits with Wu’s comments.)
4. Companies have lost a lot of money because of expropriations of various sorts over the years and will be hesitant to get involved (i.e. spend their own capital, I’m sure you could hire them…but what everyone expects is big oil investing…i.e. both their project ability AND their money).
5 Physical infrastructure has degraded because of poor maintenance and long shutdowns. There is significant work to assess and then triage (fine, fix, f*&!it) the physical pots and kettles and pipes and valves and pumps and such. [Actually I made that last part up…oh…and are we allowed to use profanity here, Dennis? I don’t mean it to shock, was just trying to act salty.]
6. The issue is not just physical degradation of machinery. The company and facilities have lost trained people for a while now and hiring has been done to bring in political chums and the like. [Probably all kinds of featherbedded people on payroll. Maybe even noshows for all I know. The more you read about Vz, that whole place seems to work by little sectors of theft and corruption, going far down into the organizations. That doesn’t go away by putting Maduro in the brig.]
7. Right now, as a result of the strike and blockade, oil exports (already low) have ground to a halt and some upstream production is shut in. Basically only CVX to GOA [I feel strange writing that] refineries cargos moving last few days.
8. Oil exports to China have stopped. These were payment for investments. Unclear how this will be handled in the future (the liability). [Have we thought this through and what is our play? If we are really going to shaft them, at least think it through. More generally, there is probably the issue of how interactions of the government in general with other countries will go, now that Uncle Sugar is mucking things up…Vz has had relations with Cuba for military and with T&T for oil stuff…and probably others…we probably can’t replace all those…so what is our plan?]
9. The country has a large refining sector (1.5 MM bopd) that at one time sold significant products into the USA. It is now operating at 19%! It will be a long difficult challenge to fix this system and some of the refineries may be better off just closed forever. As of now and in future, Vz is a consumer of products (gasoline and diesel mostly) and this may even increase if the country and its oil industry gets more back on their feet. [I don’t see this as a major issue…there is a large spot market for products, including from the USA…and it doesn’t need to come from us, but if anything might be cheaper to buy in hemisphere…there were a lot of strange ship movements that occurred because of sanctions. Anyhow, that is just commerce and LATAM is very familiar with not having refineries operate properly and having to buy spot products instead!]
10. The heavy oil needs work to move it…either upgrading [which I interpret basically as cracking, a refining type process, to lower the average molecular weight] or diluting with light hydrocarbons [naphtha type stuff)]. As of now the upgraders [crackers] are all shut down…so dilution is the way to increase production, near term. [I don’t see availability of diluent as a showstopper. They have been using Middle Eastern diluent, but might even be able to get it cheaper in hemisphere from us, with sanctions relief…don’t know, and no reason to force it. But diluent is just something to buy, just commerce. The bigger issue is probably some maintenance issues at even the mixing stations, but this will be high priority.]
11. In general, the refining sector is extremely screwed up and would take a long time to fix. So the first place for companies to invest (quickest return) would be in upgraders and dilution facilities. Not refining. Not even drilling.
P.s. RBN title is an allusion to this Bellefonte hit “Matilda take me $$$ and run to Venezuela”: https://www.youtube.com/watch?v=5j2eQUJczCc 😉
Nony,
Rystad uses SPE guidelines for all nations to evaluate resources.
see
https://www.spe.org/en/industry/reserves/
I disagree that economics should be ignored when evaluating resources.
So…that may not be consistent with a problem of looking at ultimate production (as resource moves to reserves). The classic Hubbert approach. Which is the main concern here.
Again, I don’t even mind having the SPE classification. It just shows that the difference is talking about different things. Like the African country reserves. No pipeline and you can’t book it. But a pipeline to the coast and you can. But that’s different with saying the oil is/isn’t there.
Nony,
There are SPE guidelines for reserves, contingent resources, and prospective resources.
The Rystad 2PCX is the combination of reserves (P), contingent resources (C), and prospective resources (X) at the P50 level. See graphic at link below and note that Rystad replaces the U in the graphic with an X. 2PCX=2P+2C+2X. Contingent resources are contingent if they are waiting for infrastructure so reserves are moved to the contingent resource category if waiting for a pipeline or there is no market for the product, prospective resources are undiscovered resources.
The oil that is there is called original oil in place, I try to estimate the oil that will be produced. URR=ultimately recovered resource, recovered=produced.
prms2601
There is another Vz Crude DNA reason that made Trump take over Vz.
The naphthelene-rich crude nature of Vz heavy crude, i.e. instead of long chain wax, the cyclic HCs are much higher.
It is a unique property of saline/hypersaline lacustrine oil to have have relatively higher amount of naphthelene-rich (NR) HCs, and such NR HCs could survive bacteria degradation much longer than wax, and the density is also higher. This is why in Orinoco, China’s Bohai & Junger Permian Basin, they all have shallow heavy crude with high NR HCs, and it is much higher than marine sourced oil that migrate to shallow depths and became heavy oil, i.e. Canadian Oil Sands.
Such NRHCs have higher yield in jet fuel, rubber oil, and lubricant that could require much higher and lower operation temperature range, i.e. much lower freezing point without freezing and yet much higher flashing point. In some refineries, such crude are classified as “rare earth” crude.
My impression is that overall, a high content of asphaltenes (polycyclic aromatic molecules, of which naphthalene is the simplest/smallest) is a negative, not a positive. They are harder to process and more prone to fouling catalysts.
While there may be some random advantages (higher product output), in general if you could wave the magic molecule wand and have a 16 carbon straight chain molecule (cetane, which is “perfect diesel”), you would vastly prefer that over having ugly evil 4-ring thingies also made of 16 carbons.
None of this is to say you can’t run Vz crude, especially in a modern, high complexity refinery, and with foreknowledge of the assay, so that you know what you are getting. It’s still crude. And a small quality discount will get refiners to deal with the extra hassle.
But don’t kid yourself that asphaltenes are a net positive, they are a net negative (but still one you can deal with, and the oil is still salable).
Warning: I am not a refiner. This is just my impression. I might be wrong. I’m out over my skis. I did read Lefler’s book cover to cover, work all the exercises, and corresponded with him, getting an attaboy for reporting a few math mistakes.
But again, that’s just my impression on the asphaltenes. In a way, it’s analogous to having a low API gravity (high density). Not the end of the world and complex kit refineries can handle it. But it’s not really a positive.
Similar to meat processing. The fact that less choice cuts can be processed and used is good, as they want to use/sell “everything except the squeal”. But you’d still rather have more tenderloin and less hoof, all things considered. Just because there are uses for the hoof doesn’t make animals with high hoof content good. I mean…it’s not ivory.
there is a difference between asphaltene and naphthelene HCs, both have high cyclic HCs, but asphaltene has quite high oxygen content, and that’s why it is not dissolvable in oil, and only tie up with resin and wax to dramatically increase viscosity. That’s why Vz heavy crude has lower oxygen content <1%, but high cyclic naphathelene HCs, and lower viscosity than Canadian oil sand where the oxygen levels are well above 2%.
here is the image that tells differences among 4 major groups of HCs in crude,
https://pubs.rsc.org/image/article/2017/ra/c7ra09736k/c7ra09736k-f1_hi-res.gif
and the paper describes the figure,
https://pubs.rsc.org/en/content/articlehtml/2017/ra/c7ra09736k
see that the C:H ratio of resin is actually higher than 1:1 while aromatic is 1:1 or lower?
Heavy Naphthelene HCs should be include the resin molecules, but the specific Naphthelene HCs for Vz or Bohai crude are the saturated cyclic, i.e. C:H close to 1:2, not like aromatic where C:H close to 1:1.
OK. I still suspect (but am spitballing, way past my skis) that C-16 straight chain: CH3(CH2)14CH3 is preferable to 4-ring steroid-looking monsters:
https://en.wikipedia.org/wiki/Pyrene#/media/File:Pyrene.svg
But…I am guessing. 😉
Pyrene are part of the poly-aromatic hydrocarbons PAHs, and also part of aromatics, they are not saturated, i.e. they have double/ring bond, and C:H is less than 1:1, while the saturated version of pyrene has no ring bond, and has formula C16H26, i.e. each current C with one H will have two Hydrogens and each C with no Hydrogen will have one hydrogen.
Such saturated cyclic HCs are heavy, but unlike aromatic or similar density asphaltenes, they are still liquid over a wide range of temperature, i.e. vapor pressure much lower at much higher temperature and melting point much lower below ice point, and at the same time resistant to oxygen. So, they are widely used in high temperature/low temperature lubricant, jet fuel, and vacuum seal/rubber oil.
But which is better to refine, a crude with lots of cetane (“100” on the diesel cetane index) or a crude with lots of pyrene. I just thing straight chain long molecules are pretty valuable, for diesel. But…again, I’m speculating. I mean, just showing there is a use for the pyrene is not the same as saying it is better as a crude component.
pyrene are aromatic HCs, and they tend to have higher melting point, i.e. crystalize at higher temperature, and also form soot easier when combusted.
The research of sustainable aviation fuel has been pursuing cyclic saturated hydrocarbons, like cyclohexane, it is actually called naphthelene, sounds like pyrene like aromatics, but actually saturated HCs, see,
https://pubs.acs.org/doi/10.1021/acs.iecr.5c01870
Typically, jet fuels are composed of 13–26 wt% of linear alkanes, 19–37 wt% of isoalkanes, 22–47 wt% of cycloalkanes, and 14–21 wt% of aromatics.6 Cycloalkanes are a key component of jet fuels due to their desirable fuel properties (e.g., high energy density, low freeze point, and high density). While linear alkanes have the highest cetane number among hydrocarbons of the same carbon number, they have low energy densities (Fig. 1) and high freeze point relative to standard aviation fuel specifications. Compared to linear alkanes, isoalkanes exhibit lower freeze points. While aromatics provide the majority of the volume swell for nitrile rubber O-rings and seals, they have low specific energy (energy per unit mass – see n-alkylaromatics and naphthalenes in Fig. 1), and are the primary contributor to particulate matter emissions.6,23,24 Faulhaber and colleagues investigated nitrile rubber swelling for a broad range of individual cycloalkanes and aromatics. They showed that much higher cycloalkane concentrations are required relative to aromatics for the same level of swell.
lol, I think grandpa needs to go to bed.
===
During his remarks at a roundtable with U.S. oil executives, the president announced that the companies are prepared to spend $100 billion to rebuild the oil infrastructure in Venezuela.
“The plan is for them to spend — meaning our giant oil companies — will be spending at least $100 billion of their money, not the government’s money,” Trump told reporters.
He added, “They don’t need government money, but they need government protection and need government security that when they spend all this money, it’s going to be there so they get the money back and make a very nice return. The plan is for them to spend at least $100 million to rebuild the capacity and the infrastructure necessary.”
Trump pointed to different ways Venezuelan oil can be used in the U.S., including to build roads.
He called Venezuelan oil “a heavy oil, very good oil, great oil.”
Trump added, “It’s fantastic for certain things, like asphalt roads. Best there is in the world for asphalt roads and other things.”
The Financial Times reports that U.S. oil companies won’t invest in Venezuela unless they receive firm guarantees. One investor told the paper, “No one wants to go in there when a random fucking tweet can change the entire foreign policy of the country.”
Exxon Mobil Chief Executive Officer Darren Woods, said today that Venezuela is currently “uninvestible”.
This president’s foreign policy is chaotic, irrational and counterproductive. For example, Greenland:
“The 2021 National Defense Authorization Act called for the creation of the Arctic and Global Resilience Policy Office at the Pentagon, which was set up in 2022. The office produced the Defense Department’s 2024 Arctic Strategy, dedicating Washington to increased Arctic defense capabilities, expanded collaboration with allies on Arctic security, and strengthened military readiness for Arctic operations.
The administration’s intense interest in acquiring Greenland, by force if necessary, might appear to be a natural outgrowth of the Pentagon’s work. Instead, it’s a clear repudiation of it. Not only has the demand for Greenland infuriated the same European allies on which the Arctic strategy depends, the Pentagon office itself has been quietly shuttered. In sum, even as the administration says it needs Greenland to advance U.S. security interests in the Arctic, it has closed the office set up to advance U.S. security interests in the Arctic.”
Nick G
This currently applies to everything Trump touches. Uncertainty kills investment. You don’t just invest millions and hope for the best. Due diligence is needed to estimate future profits, and that means estimating future prices.
Trump’s erratic behavior means nobody knows the price of anything in America. That is why investment outside AI data centers has ground to a halt. AI just needs chips and electricity. But even this is heavily dependent on massive increase in electricity output. The tech bros are pretending they can somehow fix that problem (and the lack of income from AI based products). They are going on about solar powered data centers in space and nuclear fusion. But those are pipe dreams, and Trump is strangling electricity production as well.
Facing an increasingly uncertain political climate, the world is slowing investment, particularly where America is involved. Turning Venezuela into a war zone is NOT going to increase oil production there. The Republicans tried the same thing in Iraq — conquer the country to steal the oil — but seem to have forgotten their failure there.
I just don’t think Trump has thought this through. He’s not a detail guy, not a planner. He’s a tweet crap in the night guy. Vz has corruption/theft issues deep into all their organizations. It’s not just an issue of firing Maduro. Massive reform of those organizations is needed and the ejection of criminal elements brought in over the last 20-30 years. Trump hasn’t “drained the swamp” in Washington. What makes him think he can do it in Vz?
He should stick to the ballroom building. I actually trust him to sweat the details on that sort of thing. Know someone who coinvested in a building of his and was very happy (and sort of surprised) how much Trump got involved in the construction project itself, not just the financing.
Trump should definitely use the combined might of the entire US military to go and grab that Venezuelan gold and make the most amazing car parks the world has ever seen.
Sure, it may cost hundreds of billions and hundreds of thousands of lives, but it will be well worth it to say they have the finest asphalt on Earth.
It’s actually funnier than that, given this assumes America could even make anything anymore. The Baltimore bridge situation shows that making money spreadsheets and Machines That Always Lie And/Or Tell You To Kill Yourself are much more America’s speed these days.
rumors go that it is all Rubio’s grand scheme — seizing Vz oil, and scare out all the left-socialists in Latin-South America, bring down Cuba, and make Latin America Great Again and Rubio will be the governor of pan-America.
Rig Report for the Week Ending January 9
The rig count drop that started in early April 2025 when 450 rigs were operating dropped this week. Drilling continues at unabated rates with WTI below $60/b.
– US Hz oil rigs dropped by 3 to 364, down 86 since April 2025 when it was 450. It was also up 2 from the low of 362 first reached in the week ending August 1. The rig count is down 19% since April.
– New Mexico Permian dropped by 1 to 91. Lea was unchanged at 60 while Eddy dropped 1 to 31.
– Texas dropped by 1 to 168. Texas Permian dropped by 1 to 133. Midland added 1 rig to 25 and Martin was unchanged at 26. Loving added 2 to 17 while Reeves dropped 1 to 12.
– Eagle Ford was unchanged at 28.
– NG Hz rigs were unchanged at 109.
A Rig
Frac Spread Report for the Week Ending January 9
The frac spread count rose by 3 to 156. From one year ago, it is down by 39 spreads and is down by 59 since March 28.
A Frac
China’s Cancer Villages (Which They Deny Exist)
https://www.youtube.com/watch?v=72FA8Sx4dh8
Another perspective of unfettered “growth” & “progress”.
You mean the thing they acknowledged over a decade ago?
https://www.bbc.co.uk/news/world-asia-china-21545868
Yeah, this is what you get from industrialisation. It’s not pretty, but no one here is so naïve as to think the world’s biggest economy somehow didn’t have the same waste issues that every other burgeoning economy had when industrialising. It’s how you deal with it that matters, and China is pretty much the only country that is anywhere near addressing climate change problems at least. This kind of pollution is also in the current 5 year plan, IIRC. Remember how Beijing and Shanghai were some of the most disgusting cities on Earth for air quality? Now look at it. Then check Mumbai.
Want to see what happens when there’s no movement on these issues, go check India. Not only is it way more polluted, they can’t even leverage economic growth as well as China did and that’s despite having a massive head start with their colonial past.
“unfettered “growth” & “progress”
Its a universal human ‘attribute’. We are all part of a death cult.
In the US, and most other countries, we outsource a big bulk of our pollution to China and other exporters. For example, Europe outsources a huge swath of deforestation on the rest of the world for lumber and food, now and over the past 500 years.
Ah but Hickory, it’s like anything now, a double standard. How dare China poison its people. Don’t they have compassion?
When America’s gov’t forces shoot a protestor, that’s because she was a terrorist agitator and deserved it.
When Iran’s gov’t forces shoot one, it’s because they hate freedom and humanity.
Hickory —
For example, Europe outsources a huge swath of deforestation on the rest of the world for lumber and food
Europe is a net exporter of lumber and food.
Alim. Thanks for prompting me to look that up.
Currently “The European Union (EU) is complex: it’s
a net exporter in monetary value and processed goods (like dairy, cereals, spirits)
but a significant net importer in terms of calories, raw materials, and protein,”
and also a big net importer of biofuel feedstock and liquid biofuel”
Mostly a political video, waxing on that seizing Greenland and Vz is Elon’s fault. Which feels like a stretch.
https://www.youtube.com/watch?v=GsA49jZtNEY
But…to tie it back to Peak Oil, the main prop for his thesis is the old Technocracy movement. And guess who was the second biggest guy in Technocracy? You’re right. Your hero, M. King Hubbert.
https://bostonraremaps.com/wp-content/uploads/2022/08/BRM4763-Technocracy-Series-A-No.-19-July-1940_map_lowres-1-3000×2086.jpg
See? USA plus CA, plus MEX, plus LATAM through Panama/Colombia, plus VZ. Plus Guyana/Suriname/French Guiana. And Greenland. And Newfoundland/Labrador (technically now part of Canada, but separate at the time).
So. I’m actually not blaming it on Elon. I’m blaming it on you Peak Oilers. 😉
Anybody seen the movie Hellfighters? (Based on Red Adair. Has a Vz oil aspect to it supposedly.)
https://www.youtube.com/watch?v=737h6nSnGqg
I just rented it and am trying to slog through. I don’t finish a lot of stuff I rent though, if it looks lame once I’m watching.
The well fires are well filmed and interesting and even some aspects of the business are shown. But the romance/family drama plot seems very cardboard. Does it pick up?
Monotonous
What is your background?
Qualifications? experience in the oil industry?
The amount you post you obviously don’t have any friends
Or are you an AI program
You got me, man.
Picture:
https://encrypted-tbn0.gstatic.com/images?q=tbn:ANd9GcQYsm5vlumbEW7qcm3rW6TWu_SpumVV9ATs_g&s
Bio:
https://www.flamewarriorsguide.com/warriorshtm/lonelyguy.htm
Anony,
IMG_2170
https://www.youtube.com/watch?v=Eb-hQpnxd88
California refineries also designed for heavy sour crude with high naphthelene cyclohexane
Import from Vz
Sheng Wu,
The California refinery situation is on track – potentially – to become one of the biggest energy stories in the US this year.
While much of the focus of your linked video was on the closure of the San Pablo Bay pipeline, a much larger situation looms precariously as Valero’s Benicia refinery shuts down in 15 weeks time (already phasing down operations).
The then-available in state refining capacity will have zero surplus capacity to meet daily consumption needs.
Any hiccups along the way (that never happens, amirite?) will result in immediate price hikes and/or gas lines forming at the pumps.
California will have a very tenuous reliance upon their marine import infrastructure capacity which has virtually no ‘extra cushion’ built in (as is implied in the video).
Addendum … almost one million barrels of crude PER WEEK is currently imported into California from Ecuador’s Amazon rain forest in the Oriente Basin.
The beyond horrific images – easily viewable online – of the sickening environmental despoilation is enough to make even the most die hard hydrocarbon boosters blanche.
Yeah, big time ‘Saving The Planet’ shit going on there.
https://www.energy.ca.gov/data-reports/energy-almanac/californias-petroleum-market/foreign-sources-crude-oil-imports
1) It’s not difficult to fact check this with a combo of Google and AI
2) You know you can provide the links
300,000 per week
Paul, what is 43,766,000 divided by 52? Is it “close to a million” or 300,000?
From that same CEC site …
2023 imports from Ecuador 46,882,000 bbl
2022 imports from Ecuador 51,974,000 bbl
2021 imports from Ecuador 52,563,000 bbl
Sheesh!
yup, I have to do all the work for you. typical
Dennis
What is your production graph of Saudi Arabia like you did for Venezuela using this figure for remaining reserves.
https://www.oxfordenergy.org/publications/saudi-oil-policy-continuity-and-change-in-the-era-of-the-energy-transition/
Assuming unrestricted production
Iver,
I doubt 297 Gb is the correct number for remaining resources for KSA. If it is about 17 Gb have been produced since 2019, leaving 280 Gb and about 3.65 Gb are produced each year. So maybe 70 year plateau, followed by linear decline over 13 years. The Rystad estimate is probably better imo.
Rystad is not much different at 283
https://www.rystadenergy.com/insights/a-tale-of-two-cities-riyadh-caracas-and-global-oil-supply-in-the-2030s
A plateau of 70 years is not a normal production curve. That is a deliberate restriction of production.
Iver,
The Rysyad 2PCX estimate for Saudi Arabia is 247 Gb at the start of 2024 (January 1, 2024)
See https://assets.theedgemarkets.com/pics/2024/20240726oil2.png
Future output is unknown. At link below is historical annual KSA C+C output from 1973 to 2024.
The Saudis have been restricting their production since OPEC was formed in 1960, doubt this changes.
ksa cc 2601
“I doubt 297 Gb is the correct number for remaining resources for KSA. If it is about 17 Gb have been produced since 2019, leaving 280 Gb and about 3.65 Gb are produced each year.”
Dennis…agreed to a sense. But you also need to consider reserves replacement. I’m not even teasing, like I usually do. Look at what has occurred to date, across all the industry, all countries. And that trend in KUW/SA/etc. is massively productive.. Clearly reserve replacement is a powerful phenomenon.
Note: I’m not making a strong argument that for sure, it has occurred. For all I know there are downward revisions, more than production. (Although in SA, the wells are so plush, it’s much less likely to have price driven downward revisions.)
P.s. It’s just a minor note. I see how the peakers drag you to more peakerish forecasts, because they hate your negative, but less than the Ace-TOD peaker norm negative. So, it’s good that you have someone dragging you the other way. I’m still in shock how not a single person took the under on oil price.
EIA Today in Energy on natural gas prices:
https://www.eia.gov/todayinenergy/https://www.eia.gov/todayinenergy/
Last year’s average, $3.52, was up from last year, significantly. However, that year, in real (inflation adjusted) dollars was the lowest on record.
Interesting to note that the $3.52 sort of feels high, based on recent trends. However it really is not, inflation adjusted. (There was abnormally high inflation 2021-2024.) In fact, last year was actually lower, in real dollars than 2012 or 2015 or 2016, which all seemed like natty was very low.
An update to World and Non-OPEC oil production has been posted.
https://peakoilbarrel.com/record-september-world-oil-production/