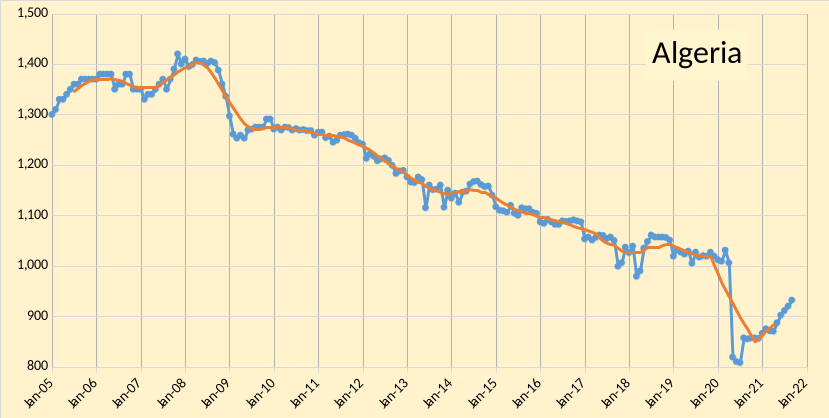
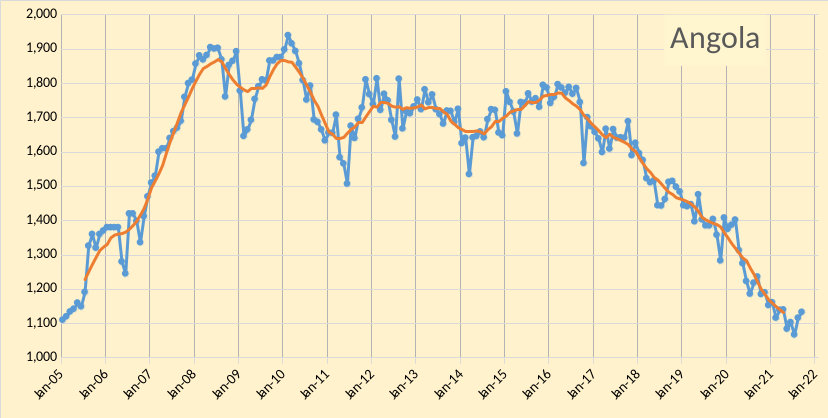
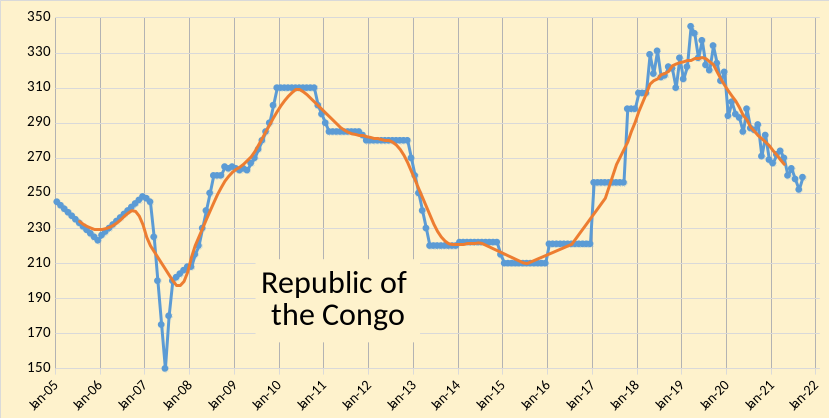
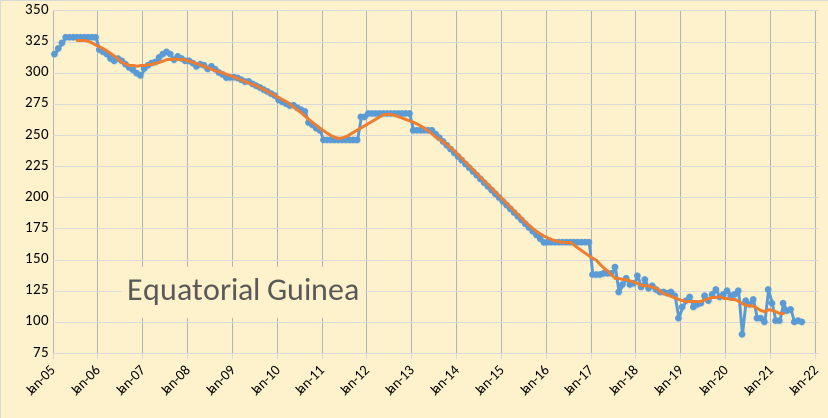
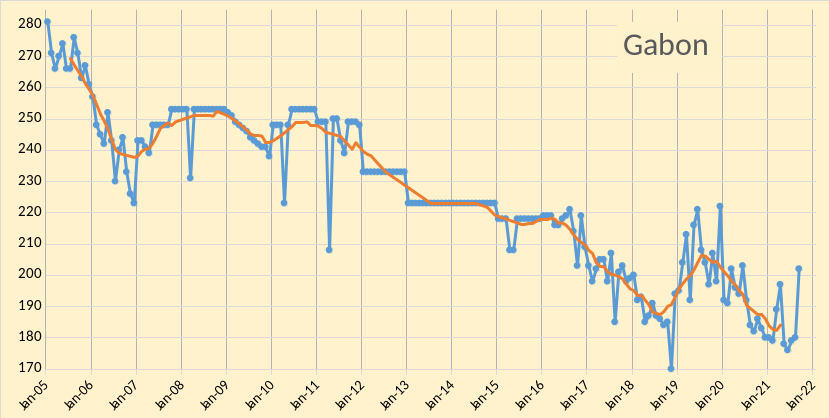
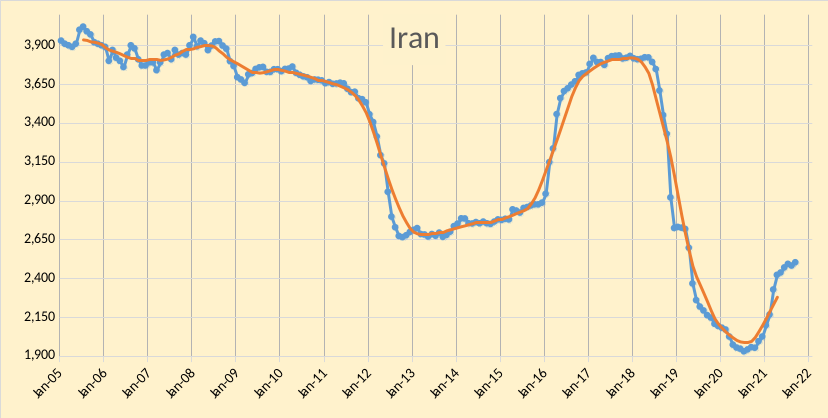
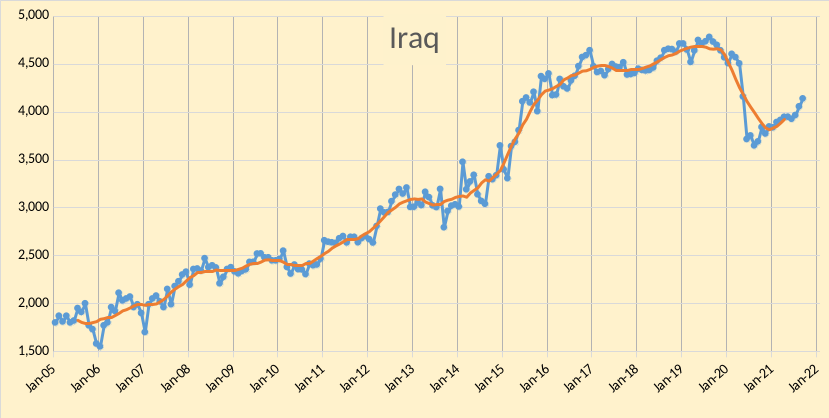
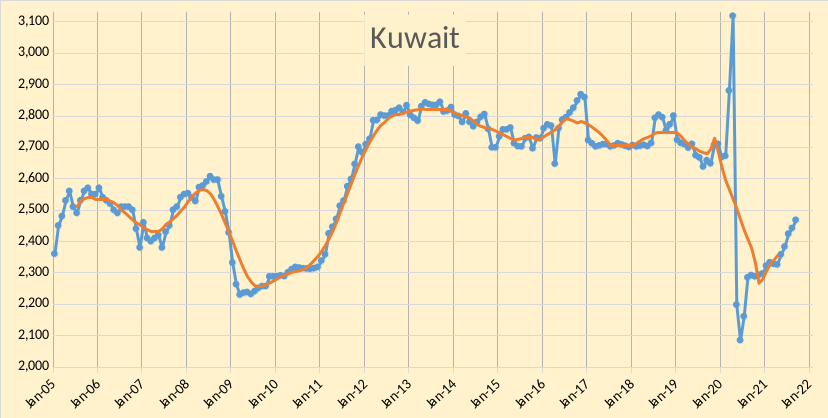
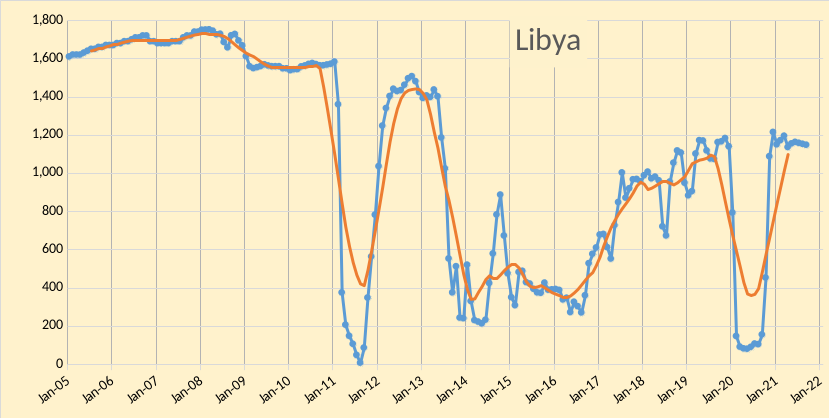
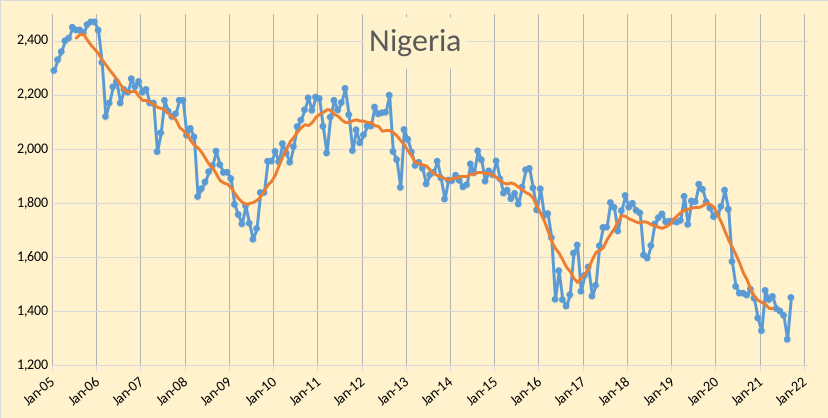
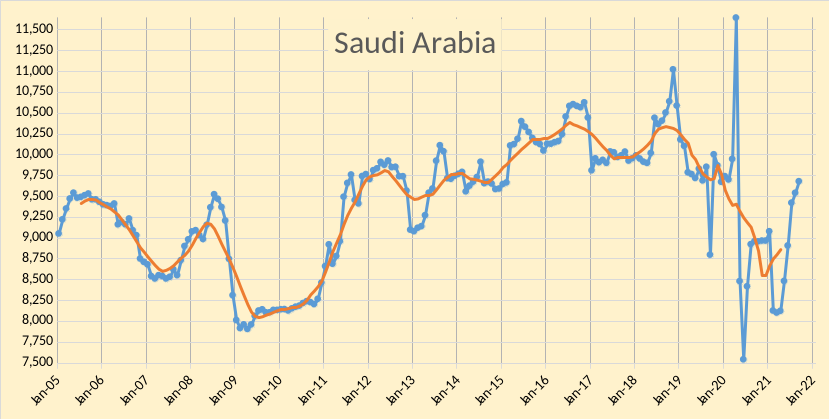
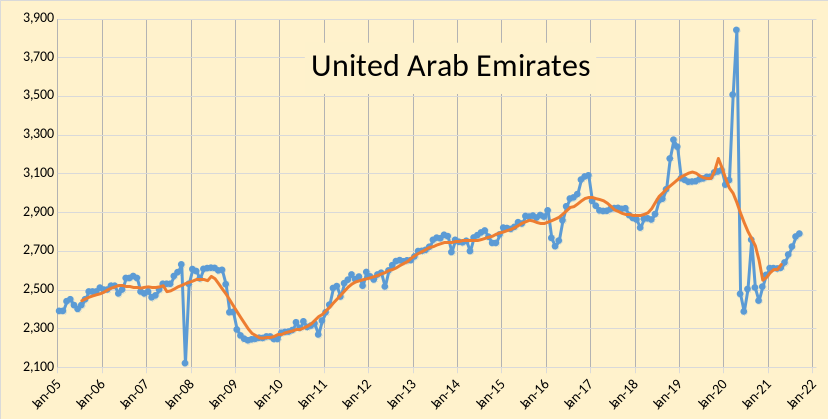
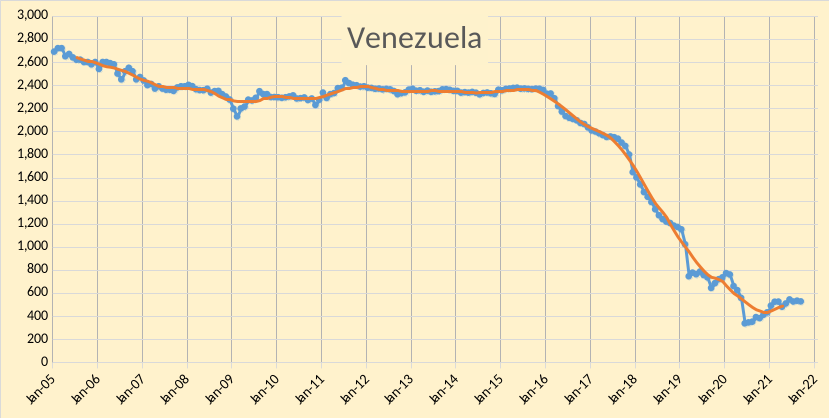
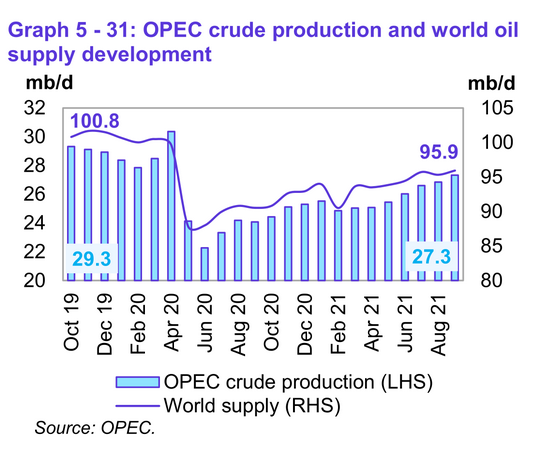
The OPEC Monthly Oil Market Report for October 2021 was published this past week. The last month reported in each of the charts that follow is September 2021 and output reported for OPEC nations is crude oil output in thousands of barrels per day (kb/d). In the charts that follow the blue line is monthly output and the red line is the centered twelve month average (CTMA) output.
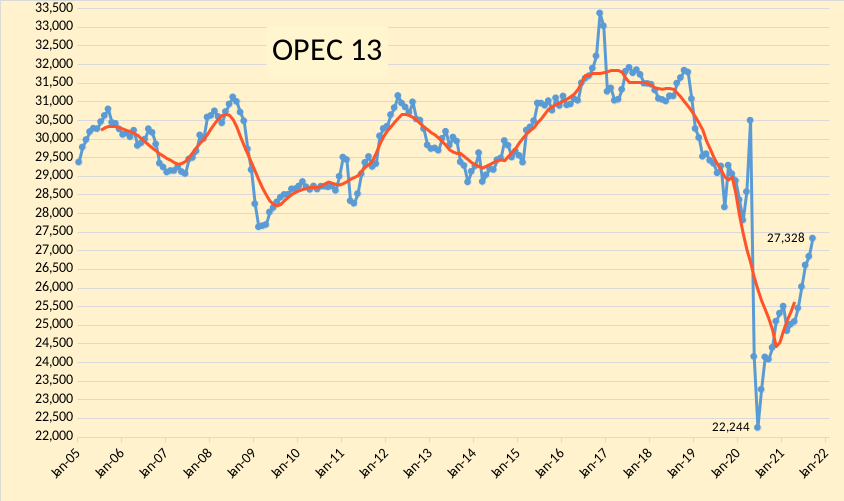
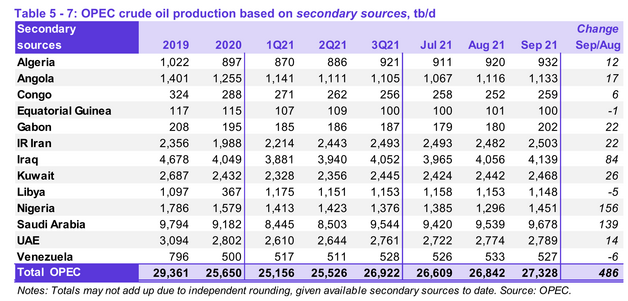
OPEC produced 27328 kb/d of crude oil in September 2021 based on secondary sources, an increase of 486 kb/d from August 2021. August output was revised up by 80 kb/d from what was reported last month and July output was revised down by 2 kb/d. Most of the increase in OPEC output was from Nigeria(156 kb/d) followed by KSA (139 kb/d), and Iraq (84 kb/d). ). All other OPEC members saw increases of less than 26 kb/d in August 2021, and decreased output from 3 nations was only 12 kb/d in total with half of that from Venezuela.
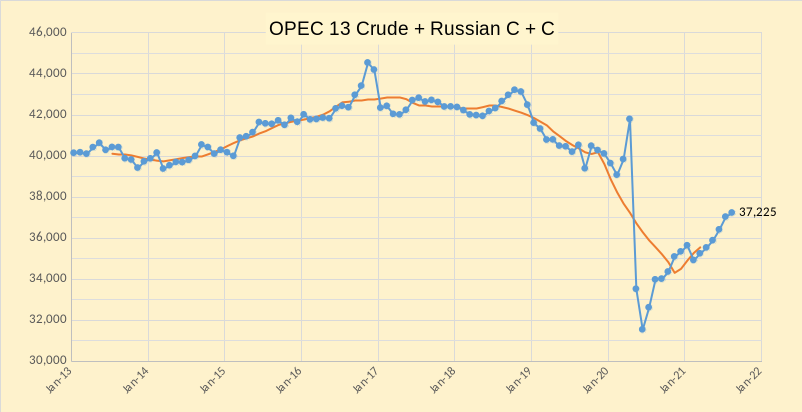
No September data has been published by the Russian Energy Ministry for Russian C + C output so the chart below updates data through August 2021 with the latest Russian and OPEC crude data.
World liquids output increased by 610 kb/d in September based on OPEC estimates to 95930 kb/d.
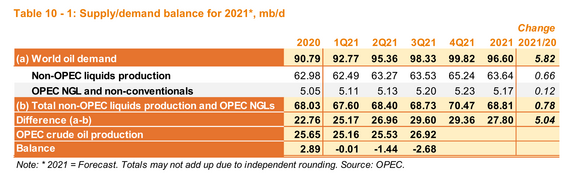
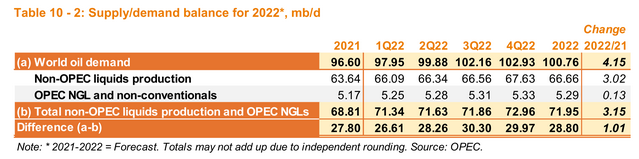
Based on the OPEC supply and demand balance for 2021 and 2022 in figures 18 and 19 above and a likely OPEC capacity of 28.4 Mb/d, it seems likely the World will be short on oil in 2022, especially the second half of the year, unless Iranian sanctions are removed. Also note the 3000 kb/d increase in non-OPEC output in 2022 compared to 2021, this seems optimistic.
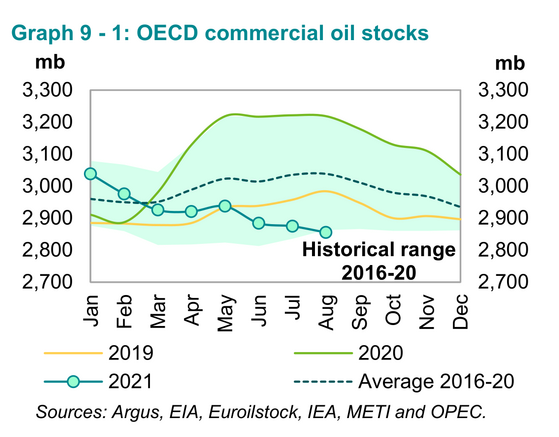
In August OECD Oil stocks fell 183 million barrels below the 5 year range, this indicates a likely increase in oil prices. Based on OPEC estimates for 4th Quarter call on OPEC in 2021 and a 4th quarter increase in OPEC output of 500 kb/d (probably optimistic, but this is the OPEC plan at present) we would see OECD stocks fall by another 137 million barrels in the 4th quarter of 2021. Unless we see a severe economic crisis near term the direction of oil prices will be up, perhaps to $95/bo in 2020 US$ for Brent by years end.
289 responses to “OPEC Update, October 2021”
China and Russia are having to help Mongolia with oil shortage. All them trucks loaded with coal headed to China use a lot of diesel. Without Russian help that coal never makes it to China. How long this can continue depends on what happens to Russian supplied energy.
I don’t read Global times. But the 75 mile long traffic jam of mainly trucks loaded with coal sparked my interest in exactly how Mongolia is able to transport all this coal.
https://www.globaltimes.cn/page/202109/1235183.shtml
Strange that they would transport coal by trucks. Coal is a low energy density fuel. Why not transport it by train?
There’s only one main railway in Mongolia. It’s called the Trans Mongolian Railway and runs north-south from Ulan Ude in Russia to Jining in China. It features a single, broad (Russian) gauge track and an antiquated signalling system. At the China-Mongolia border, the trains must switch their bogies so that they can run on standard gauge tracks that are used in China, and this process takes several hours. In other words, this railway was never developed to handle high capacity.
Thanks Frugal. The amount of energy in a truck load of coal is probably less than the energy expended by burning diesel to transport that coal.
What a waste.
EIA says there are 20 m BTU in a ton of coal.
https://www.eia.gov/tools/faqs/faq.php?id=72
A truck can haul 40 tons on the road. That is the maximum allowed in the US anyway. That’s 800 m BTUs in a maxed out coal truck.
https://ops.fhwa.dot.gov/freight/policy/rpt_congress/truck_sw_laws/index.htm#:~:text=Federal law controls maximum gross,the National Network (NN).
Diesel is about 140K BTU per gallon, and a truck might get 6 mpg.
140K*7 =1 m. 6*7 = 42, so roughly 40 miles = 1 m BTUs.
https://www.eia.gov/energyexplained/units-and-calculators/british-thermal-units.php
800 m BTU * 40 miles /1m BTUs = 32,000 miles.
By this back of the envelope calculation it would seem that a truck could go 32,000 miles on the energy of the coal it carries. But my numbers are pretty vague. For example, I doubt a 40 ton truck would get 6 mpg. Divide by 2 and you get 16,000 miles.
Factor in 35% efficiency of a coal-fired plant and you’re down to 5,000-6,000 miles.
Feel free to challenge my numbers, I m just spitballing it.
EDIT: Apparently the US average is 72 ton miles per gallon
https://www.fleetequipmentmag.com/truck-freight-ton-efficiency/
My initial calculation was 6*40 =240 ton miles to the gallon, off by a factor of more than three, not the two I guessed at.
So my new estimate is about 3000 miles as the maximum distance you can haul coal to burn for electricity.
Alim , your methodology is correct but the basic data incorrect . 40 tons is for independent trailer loads . The trucks in the photo are 3 axle rigid tippers . In Europe the maximum GVW ( gross vehicle weight ) for these is 25 tons . GVW is vehicle weight + load . I would allow for overweight ( no rules in China ) . I would base my calculation on a 20 ton load . Actually prefer 15 ton because the trucks are not carrying powdered coal but “stone or rock coal ” lumps . Volume will be larger than weight . Just my two bit , on the whole you are on the correct path .
Yes, our european Trucks are 36 ton total weight, including freight.
Diesel usage is round about 30 litres / 100 km.
Coal transport here is by (river) ship whenever possible, or by train. Transporting coal by truck is a desparate stopgap method.
You can’t calculate in the efficiency of the coal powered plant. Buring the Diesel has a similar bad efficiency.
Some power plants are already burning oil. The 1 million $ question is, how many and how much. When oil burning gets wide spread, all calculations about oil demand this winter are waste and prices positioned to shoot up.
Eulenspiegel —
It’s true that diesel burns inefficiently in a power plants, but it is even worse in a truck. So I was just ignoring that.
However I think you are right. I need to compare the electricity output with the miles driven, not the BTUs with miles driven. That raises the estimate to 9,000 miles.
About 36 vs 40 tons those are metric tons, which are about 2,200 English pounds.
I live near Garzweiler, a huge lignite mine, and they burn the stuff on site.
FRUGAL —
You said: “At the China-Mongolia border, the trains must switch their bogies so that they can run on standard gauge tracks that are used in China.”
The Trans-Siberian railway by-passes Mongolia and crosses directly from Russia into China at the border crossing at Zabaykalsk/Manzhouli. This is a direct connection between Russian and China. Manzhouli itself is in the Inner Mongolia Autonomous Region and nothing whatsoever to do with Mongolia. Perhaps you are confusing Inner Mongolia with Mongolia but, believe me, they are TOTALLY different places. BTW Having traveled along this route, and worked in the region, I know it well.
I admit there are plans to establish rail lines through Mongolia to transport products between China and Europe some day but for Russian coal they are still using the “old route”, the good old Trans Siberian Railway.
Sort of related article.
CHINA CALLS FOR HUGE BOOST IN COAL OUTPUT AT INNER MONGOLIA MINES TO FIGHT POWER CRUNCH
“Chinese officials have ordered more than 70 mines in Inner Mongolia to ramp up coal production by nearly 100 million tonnes as the country battles its worst power crunch and coal shortage in years.”
https://www.abc.net.au/news/2021-10-08/china-calls-for-boost-in-coal-output-to-fight-power-crunch/100526158
Railway West Inner Mongolia to Central China
It was built to facilitate coal transport from Inner Mongolia and Shanxi to China’s southern provinces at up to 200 million tons a year. The railway is also the first north-south railway in China that is dedicated to coal
https://en.wikipedia.org/wiki/Haoji_Railway
CHINA’s 1813.5km Haoji Railway – a north-south heavy-haul coal line – was officially opened on September 28, 2019
The electrified line runs from Ordos City in Inner Mongolia south through the provinces of Shaanxi, Shanxi, Henan, Hubei, Hunan and Jiangxi to Ji’an. The section between Taoli Temple and Pingtian is double-track, while the rest of the line is single track with provision to lay a second track if necessary. The line has a maximum speed of 120km/h.
Construction started in 2015. The project, which was formerly known as the Menghua Railway, faced some major challenges as the line crosses the both the Yangtze and Yellow rivers twice. It also passes through the Mu Us desert, the Loess Plateau, and three mountain ranges. There are 770 bridges with a total length of 381km and 229 tunnels totalling 468.5km.
The Haoji Railway has 21 terminals and has a design capacity of more than 200 million tonnes a year.
https://www.railjournal.com/freight/china-opens-1813km-heavy-haul-railway/
Here is a map
One of the main reasons for building the nearly 2,000-kilometer (1,243-mile) long railway is to ease transportation bottlenecks in the domestic supply chain. China is rich in coal — with its resource concentrated in the northern provinces of Inner Mongolia, Shanxi and Shaanxi — but the distribution is uneven.
The country is mainly served by trains hauling supply from the west to the east, including on the Daqin Railway. Coal is delivered to ports such as Qinhuangdao and Caofeidian before getting dispatched on ships to users in the south.
https://www.hellenicshippingnews.com/chinas-energy-game-plan-features-a-giant-coal-hauling-rail-line/
DOUG, I’m talking about the Trans-Mongolian railway, not the Trans-Siberian railway. The Chinese use standard rail gauge while the Russians and Mongolians use broad rail gauge. So anytime a train crosses the Russia-China border or the Mongolia-China border, you need to change bogies. I’ve traveled on both on the Trans-Mongolian and Trans-Siberian railways so I can confirm that this is true.
Eulen ,”When oil burning gets wide spread, all calculations about oil demand this winter are waste and prices positioned to shoot up. ”
Good point , needs thought . Already ad blue production is maxxed out and if diesel also then things could be very difficult .
I was thinking same thing and maybe they do use trains but currently it’s just not enough to fulfill demand so it’s also being put on trucks now.
Which all points to the the gravity of the situation and what lengths they feel they need to go to in order to get it.
Also means China is unable to get more coal supply from Russia. Which to me would make more sense than Mongolia.
I guess most Russian coal headed for China would pass through Mongolia anyway.
Peak oil , peak gas and peak electricity . The Perfect Storm . Just dusted Richard Duncan’s ” The Olduvai Theory ” or peak electricity . Duncan’s calculated peak electricity to be +6 years after peak oil . He had peak oil pinned in 2006 so for him electricity decline was to start in 2012 . Since we have peak oil in 2018 will 2024 be when the bulbs flicker . Well, electricity outrages are happening worldwide even as this posted . I think we are going to need a bigger boat .
http://www.energycrisis.com/duncan/olduvai.htm
http://www.thesocialcontract.com/pdf/sixteen-two/xvi-2-93.pdf
https://www.youtube.com/watch?v=2I91DJZKRxs&ab_channel=Movieclips
Richard Duncan always was a riot. He had North America listed for like rolling blackouts by 2012, and then sometime around 2005-6 or so he declared that because of lack of natural gas, the rolling blackouts had been moved up to 2008, with the permanents now in the 2012 timeframe. His work is a great reference for the pseudo science of faith based doom.
This is true. So many propheteers were dead wrong, or just crazy. It has pretty much ruined the credibility of peak oil analysis in the public’s eyes (even though Duncan was addressing electricity generation). End-of-the-world rhetoric has permanently alienated much of the public. “Once burned, twice shy.”
The fundamental principles have not changed: fossil energy is finite; wells deplete and roll over; reserves have little to do with flow rates; the sum of all well rollovers will mark the end of the growth in supply. Not the end of oil, the end of the growth of supply.
But no one is listening anymore, except those of us who tune in here.
Mike B , a very good assessment of what I had posted ” The Olduvai Theory ” and the response there of by Reservegrowth . My question to Reservegrowth is
1. Was Malthus wrong or early ?
2. Was Hubbert wrong or early?.
3. Was Duncan wrong or early ?.
4 . Is Meadows (LTG) wrong or early ?
5. Was Hanson wrong or early ?
6 . Is infinite growth on a finite planet possible ?
As Mike B said in his last line “But no one is listening anymore, except those of us who tune in here. ” .
There are no doomsters here . Everyone here is coming of his free will and with no agenda but to understand better the predicament that is at hand . If I am a doomster then so is Dennis because he also believes in peak oil( he says 2030, I say 2018) but he has never denied peak oil . By your definition all here are doomsters . Frankly this blog is one of the last lines of defense who make an effort to educate the asleep world as to what “Peak oil ” is and what the dynamics are . For other points on forecasting I will make a separate post .
P. S : Acknowledgement to all Dennis, Ovi , George , Ron , etc etc for all the work you guys do and that too without a fee . I know all of you are going to kill me for talking about money . Thanks to all the commentators for keeping the conversation civic .
Wrong or early? Reminds me of my short stint as a stockbroker. What most stockbrokers know is that insider traders are almost always right, and almost always early. That is they see the fate of their company, either something good or something bad, and buy or sell their own stock accordingly. But they see it happening long before it actually does happen.
I think we can see the same phenomena in our predictions about the fate of civilization. Most of us can clearly see what is bound to happen. But we underestimate the resilience of civilization to forestall the inevitable.
We are right but early.
Peak Oil would be prone to happen much earlier if it wasn‘t for the cheap interests after the crash of 2008. Fracking gave the world one decade more of oil and a heap of debt for the post oil generations (who are getting insanely indebted anyway with wind, solar and eventually fusion). Cheap energy has peaked many years ago and slowly but surely debt is working its way to the surface like the lava on a canarian island.
Predicitons are always difficult. Take as an example peak ice on the poles. It happens every year, the solar impact is easy to calculate, even climate change can be factored in, nor do there exist peak ice deniers. But it is impossible to predict the exact day or week of the peak, it simply falls into a timeframe of about two months. Same with peak oil: It will happen somewhen between 2005 and 2035 (now there are 14 years left, historically a ridiculous small amount of time). But it is more probable, that the peak will happen in the central area of the predicted time: around 2020. So here we go, 2018 is our best bet until now …
“who are getting insanely indebted anyway with wind, solar”
Funny.
According to a coal promoting organization- the Fed Government provided from 1979 to 2018 over $100 B dollars in subsidy to wind and solar industries.
https://www.americaspower.org/its-time-to-end-subsidies-for-renewable-energy/
The US spent $649 Billion on fossil fuel subsidies in 2017 alone, according to Forbes.
https://www.forbes.com/sites/jamesellsmoor/2019/06/15/united-states-spend-ten-times-more-on-fossil-fuel-subsidies-than-education/?sh=427c377e4473
Challenge your assumptions, lest they become beliefs.
WESTEXASFANCLUB —
I think the real reason for low interest rates is the flood of cheap Asian (and Eastern European) labor into world labor markets. Globalization is a giant deflation machine. The central banks are just riding the wave. They can’t raise rates.
I also think the main reason for investment in renewables is that the cost of renewables is predictable. Build a gas-fired power plant and you have to ask yourself what gas will cost in ten years. If the price crashes you’re golden. If it goes up you have a stranded asset on your hands. Any guesses on gas prices in 2031?
But you know exactly what your costs will be if you build solar. Banks like their investments to be predictable. Risk and high interest rates are two sides of the same coin.
EDIT:
Fossil fuel insiders tend to eye investment in renewables suspiciously. But those investments can be seen as bets that fossil fuel prices will be high. Investing in fossil fuel fired power plants is betting that fuel prices will be low.
I think there is a lot of confusion in public discourse about whether fuel prices should be high or low.
Interesting to note that one of the recipients of this year’s Nobel Prize in Physics was awarded for being able to demonstrate that the global warming signal was man-made and not natural — even though there is a significant fluctuating signal on top of the trend .
The argument of Nobel winner Klaus Hasselmann is thus similar to the argument used by peak oil prognosticators — that in spite of sporadic oil finds leading to brief respites, that the downward trend in oil reserves will continue. The difference is that no one will be awarded a Nobel Prize for an oil depletion analysis.
Sorry Paul , he won the Noble prize for Physics and not for Climate Science . If Sachin Tendulkar is the best cricket batsman does not mean he is also competent as Messi on the football field . It is his opinion and not his thesis on climate change . Everyone is entitled to an opinion .
Reservegrowth , China , India , Kyrgyzstan , Lebanon and now let us add Austria , Swiss and Italy . Was Duncan wrong or early .??
https://lenews.ch/2021/10/18/swiss-president-warns-nation-to-prepare-for-electricity-shortages/
https://www.ots.at/presseaussendung/OTS_20211013_OTS0162/was-tun-wenn-alles-steht-verteidigungsministerium-informiert-gemeinden-ueber-blackout-bild
Italy imports its electricity from Austria , Swiss and France . Best of luck to Mario .
Hole in Head said:
Look it up. That’s what I said. “Interesting to note that one of the recipients of this year’s Nobel Prize in Physics was awarded …. “
One can argue whether that Hasselmann is less deserving than others but don’t start by trying to condescendingly correct me for something that needs no correcting.
Why peak electricity is an issue ? 58.7% of the world’s manufacturing output is from 5 countries , USA , China, Germany , Japan and South Korea . China’s and Germany’s electric woes have often been posted here . USA’s electric grid has been rated “D” by civil engineers . My info says that only North Dakota and Wyoming are electricity surplus states , of course electricity is imported from Canada . Japan and South Korea have no coal, NG or hydropower . Nuclear in Japan is a problem after Fukushima . Both countries rely on LNG from Qatar . Highly fragile arrangement . Without electricity is no metals . Follow the turmoil in steel , magnesium, aluminum , fertiliser production as factories have shutdown . Grounds for thought .
this is worrying as th UK plans another 33GW capacity of offshore wind. Power outages will cause issues in them being built. Sure we import the tech but the countries we buy from are also having engery issues.
If the UK has a cold winter then our supply laws state domestic use gets the natgas first so industries will shut down. Back to the 3 day week perhaps.
interesting times
Forbin , adding more offshore wind capacity ??? Some will never learn even from their own mistakes.
Stupid is what stupid does — Forrest Gump
Well, Hinkley point C juice will cost UK consumers £106/MWh as of 2021, with start 2026, according to a recent update while wind presently cost less than half… The intermittancy is of course a factor to be dealt with, but there are several options there.
https://www.bbc.com/news/uk-england-somerset-58724732
Laplander , options like this .:-)
the option the UK has chosen is nat gat with 3 days reserve apparently .
nothing on the shelf at the mo although iron air batteries are looking good but you still need to charge them . And then there’s amount needed TWh of electricity . So there will be many sites as I doubt any one place would want 10’s of TWh near them in our crowded island.
“Some will never learn even from their own mistakes.”
Apparently the posting of poorly thought out notions and preconceived opinion based proclamations are exactly the kind of mistakes that people fail to learn from.
I’ll wager that the worlds utilities know just a little more than the commentators here about electricity generation and feasibility of adding specific additional capacity-
Globally- “More than 80 per cent of all new electricity capacity added last year was renewable, with solar and wind accounting for 91 per cent of new renewables…..Wind expansion almost doubled in 2020 compared to 2019 (111 GW compared to 58 GW last year).”
https://www.irena.org/newsroom/pressreleases/2021/Apr/World-Adds-Record-New-Renewable-Energy-Capacity-in-2020
This trend is just beginning and failure to acknowledge the growing strength of the industry is like pretending that automobiles weren’t feasible in 1915.
Like every other single other sources of energy, there are big shortcomings to these newer mechanisms of energy capture. But the resource is perpetual and abundant, and in large parts of the world are among the least expensive option per kWh.
The alternative to failure of deployment is not pretty, but will be great for those who hope to profit on energy shortage (they will be able to anyway) and for those whose great desire is to witness rapid onset of instability and poverty stacked upon poverty.
Hickory ,” Like every other single other sources of energy, there are big shortcomings to these newer mechanisms of energy capture. But the resource is perpetual and abundant, and in large parts of the world are among the least expensive option per kWh. ”
Hicks , why are you shooting yourself in the foot ? Big shortcomings ( your words ) and the rest is beyond me . Abundant resources and perpetual ?? I had posted this earlier but once again ” My tennis coach believes I have abundant and perpetual resources to defeat Djokovic in the Australian open and Nadal at Roland Garros . ” I must tap into them . Ridiculous .
More wind farms but from where will they get the wind ?? I have a solution , watch the video . This godman from India will help . 🙂 . He takes care of both wind and gas which Boris needs desperately .
https://www.youtube.com/watch?v=ZaZ4Dbr4RLc&ab_channel=KaliManu
P. S : I know the consequences of failure to transition , unfortunately the train has left the station .
Hicks , the truth , nothing but the truth .
https://oilprice.com/Latest-Energy-News/World-News/Coal-Generation-In-UK-Jumps-As-Wind-Speed-Drops.html
It would be funny, it you weren’t serious.
HinH- “the rest is beyond me .”
Clearly.
Or is it that you’d prefer Europe to rely more even more heavily upon Russia ?
Hicks , first the cartoon was a specific swipe at Boris Johnson whom i find a loathsome figure . Nothing against the Brits or any others . I will end with the wind turbine debate, since let us say, my views on this have already been postulated . Regarding Russia , my like or dislike ( for that matter even Mevrouw Merkel ‘s) is least important . The TINA ( There Is No Alternative ) factor is in play . Beggars can’t be choosers . Europe better get used it . See the change in tune . Some people just learn the hard way .
https://www.zerohedge.com/energy/after-rapid-fire-blame-putin-headlines-european-commission-quietly-affirms-russia-not
For the nth time ” Don’t mess Putin “
Hole in Head
Quoting Zerohedge, a Russian state propaganda outlet, to prove Putin is invincible is a bit naive. At best.
Alim . the zero hedge and media was discussed extensively on both the threads earlier so no need to reinvent the wheel . ” Don’t mess with Putin ” . Sure if you want take a chance , here is a list of some munching carpet
1. Saakashvili from Georgia .
2. Obama from USA ( over Syria)
3, All the kids from Ukraine
5. Netanyahu from Israel .
6 . Lukashenko from Belarus
7. Merkel caved on every occasion .
8. Erdogan ever in debt to Putin after saving him from the coup .
A lot of minor godfathers here and there .
Don’t say you were not warned .
Hole in Head,
Well I guess we know now wich side your bread is buttered on.
it is also fickle and built on capacity comparisons and not delivered power.
the only alternative to alternatives is nuclear and there is not much political will in the UK , then add on the white elephant of Hinckley then frankly I do not know what the UK population will do when we go through another 3 day week and the lights going out .
The US should fair better but I’m too old to emigrate now 😉
Forbin , I know how you feel . I use to visit the UK ( from India ) to buy used machines when Thatcher began the great dismemberment of British industry . Graveyards of skeletons made of iron and steel ( blood , sweat and tears of the ordinary blokes ) . What was a bounty of North Sea oil was diagnosed as a success of Thatcher’s policies . Well , the North Sea is over and so is UK . UK will be the first nation in the devolped world to go down the tube . I did a comparative study of Japan and UK in the post peak oil age and have guided a few Brits to seek better future in Canada . If you are interested ask Dennis for my e mail address and contact me . Maybe you can assist some young ones while there is still a window available , though it is very narrow .
P.S : I did the analysis for a Brit expat based in Dubai about 10 years ago .
Forbin, I would suggest some better insulation to the brick-insulated houses, and three glazed windows to start. And when there is overcapacity from wind you could make ammonia, to be used as fertilizer feedstock.
A 1m3 insulated accumulator tank with water would also deliver 70 kWhs, with a deltaT of 60C, to be used for 2-3 days or so, this was more or less standard from the 90´s in Sweden if you had a wood fired boiler, but it´s also useful for ground source heat pumps and direct resistance heating at low electricity prices.
But I think NS2 might be operational in Q1 2022, that should take the pressure of in Europe and thusly UK too for a while, so the English could book that trip to Magaluf now.
Edit, not to be rude, but the writings been on the wall for a long, long time so I have a hard time to feel sorry for the unprepared…
HiH below, but that would at least lead to a slightly lower transit loss, not sure how big though… (And a bit of a problem for Ukraine)
Edit 2, But wait, isn´t there a nuclear plant a bit north of Kiev, just some assembly required…
Laplander , NS2 is not going to bring additional gas in my opinion . It will only re route gas from the conventional pipelines via Ukraine . The UKIES were stealing and charging Russia for the privilege’s .
Laplander ” Edit 2, But wait, isn´t there a nuclear plant a bit north of Kiev, just some assembly required… ”
You mean the one they bought in Legoland , Denmark . ? Just joking Laplander . One Chernobyl is enough .
“Some will never learn even from their own mistakes.”
“Apparently the posting of poorly thought out notions and preconceived opinion based proclamations are exactly the kind of mistakes that people fail to learn from.”
This sounds a bit disparaging to the faith based belief system of peak oil doom, seems to me.
Endless growth is faith-based. Peak oil describes the way things work.
The Lima oilfield in Ohio is gone (my backyard growing up. We had no idea we were sitting on a depleted oilfield). Do you think it’s ever going to come back?
Why should other oilfields be any different?
Isn’t the sum of all oilfield peaks world peak?
And if there is no plan, couldn’t “doom” be an understatement?
I don’t know, but it doesn’t require faith.
My info says that only North Dakota and Wyoming are electricity surplus states , of course electricity is imported from Canada .
I’d be curious to see your source on that. The US does import a relatively small amount from Canada, and also exports power to Mexico, for net exports of about 39 terawatt-hours or about .5% of total consumption: https://www.statista.com/statistics/183944/energy-in-the-us-and-electricity-imports-from-1999/
https://www.statista.com/statistics/183945/energy-in-the-us-and-electricity-exports-from-1999/
Here’s more info, below. It covers the country, then each of the states – here’s quotes for the first 4 states, Alabama, Alaska, Arizona, Arkansas:
” Alabama generates more electricity than it consumes, and typically sends about one-third of its output to nearby states.”
“Alaska has its own electric grid, which means that “whatever electricity is created there is what they’re consuming,” said Glenn McGrath, a power systems analyst at the Energy Information Administration. “It’s about as isolated as you can get.”
“Arizona supplies electricity throughout the Southwest.”
“Arkansas generates more electricity than it consumes and exports power to nearby states.”
https://www.nytimes.com/interactive/2018/12/24/climate/how-electricity-generation-changed-in-your-state.html
@ Hickory: of course there are subventions for the oil industry. Low interest rates alone are an enormous incentive. And see the cost of wind and solar in proportion to their energy production: about 5% of fossile (over all, not only electricity). And please don’t get me wrong: i’m not against renewables. But they requiere a big upfront investment, nobody will deny that. And this, in a finacially unstable world, can become a serious problem.
@ WestTexasFanClub-
I agree.
The costs of replacing some of the energy now provided by fossil fuels as they deplete will be huge, from buildings that use less energy, to energy storage and better grid, to vehicles that are electric, and more.
The upfront investment has been a huge obstacle for nuclear power for example [especially after some big projects went bankrupt at rate payer expense].
I am not optimistic about that financing happening quickly or at sufficient scale, for many reasons.
Seems we are destined to learn things the very hard hard.
btw- I am texas fan club member as well, if being a Bob Wills fan counts.
Bob Wills counts. He and Jeffrey Brown (so do Buddy Holly and Roy Orbinson).
The costs of replacing some of the energy now provided by fossil fuels as they deplete will be huge, from buildings that use less energy, to energy storage and better grid, to vehicles that are electric, and more..
This is misleading. The costs are large, it’s true, but almost entirely because the energy industry is large. Maintaining the FF industry is equally expensive. And the energy industry is large because the overall economy is large. It’s all a matter of context.
The upfront investment has been a huge obstacle for nuclear power for example [especially after some big projects went bankrupt at rate payer expense].
-Conventional nuclear is requires large scale because the physics of heat engines tends to require it. That’s not true of wind and solar: wind and solar projects can be built at almost any scale. There are economies of scale, but it’s nothing like you see with nuclear.
-Nuclear is very risky because it takes a long time to build, much longer than wind & solar. A nuclear plant can take 10 years, while a PV plant can start providing power in less than 6 months and be finished in 12 months (with luck). PV and wind can be built in many phases, if desired to reduce risk.
Heck, PV can be put on a residential roof and be economic. Not even the most imaginative of dreamers thinks that will happen any time soon with nuclear.
Nick,
You might not prefer to digest the reality, but the transition costs away from depleting fossil fuel is going to be very very very high.
Like a mortgage on a house- its a 30 year plan just to get underway.
Got credit? [I ask not you, but the world in general]
We’ll see how much of it can be accomplished.
But the attempt will be made, since the failure to get the job done will result in a rapid and involuntary decline in population- to put it nicely.
the transition costs away from depleting fossil fuel is going to be very very very high.
Well, how do you know? What makes you think it will be significantly higher than the investments required to simply maintain BAU?
I agree that a crash program to eliminate fossil fuels in 10 or 20 years would entail some real costs in accelerated depreciation and stranded assets. But most capital assets are depreciated in periods of 30 years or less. Most working assets need to be replaced in that time frame.
On the other hand, the wind will probably pick up on the Atlantic coast of Europe by the end of the week.
As predicted, the wind picked up. Wind generated about 31% of German electricity today, up from 17% yesterday.
https://energy-charts.info/charts/energy_pie/chart.htm?l=de&c=DE&interval=day&datetimepicker=19.10.2021
That should put a damper on gas prices.
Full disclosure: I looked at the weather prediction before I made my original prediction.
Anyone who is interested in good weather tracking/forecast mapping site- this one is worth looking into.
https://www.windy.com/?2021102200,46.271,1.714,5
It’s a thing of the wetter pattern of the whole winter – not just a few days. Conditions will stay on – the green will oppose north stream. Let this continue over the winter, switch off the nukes on 31.12. and see how the show continues.
Yes, we’ll get a storm, and calm high pressure weather after it. And it’s still autumn. The winter is over in march.
If we get the same weather pattern in January – March(2 weeks+ high pressure weather) , we have the problem. Little wind, not much solar anyway and very cold. If they haven’t organized enough hard coal until then, we’ll see blackouts. Gas will be used for heating.
By the way, oktober had not much wind until now. The gas supply is already under pressure with this – and you can already see they use hard coal over gas. This isn’t acceptable for a green agenda – gas should be used before coal.
So far today for electricity generation in Germany wind is 55%, hard coal is 2% and gas is 3.5%.
Even solar is 7.5%, more than hard coal and gas put together, although this has been a dark cloudy day.
That doesn’t including heating gas, just electricity.
Would you care to bet whether there will be widespread blackouts in January in Germany due to lack of fuel? Never mind we can revisit it when the time comes.
Alim ,” so far ” . Care to define ? 1 hour, 1 day, 1 week , 1 month or Jan- Oct 2021 . ??? Yes , I have saved your post and we will revisit it when the time comes . Two simple quotes to explain my viewpoint .
1. The chain is as strong as it’s weakest link .
2 . A small hole can sink a big ship .
Just look at the whole Oktober so far – lots of gas and coal have been used .
Next year most of nuclear Power is gone so more coal needed.
Wow the latest plan from KSA beyond oil.
https://youtu.be/wXgzb6qedx4
Lightsout , after Space X flight I am adding this to my ” Bucket List ” . 😉
Is that the stupid things to do before we all die bucket?
Lightsout , yes . See smiley .
Peak oil is coming. That won’t save the world
More than 50 countries and the European Union have pledged to meet net zero emissions targets. If they live up to those commitments, demand for fossil fuels will peak by 2025, but global CO2 emissions would only fall 40% by 2050, far short of net zero.
If demand peaks by 2025, production will not have passed the 2019 peak by that time. However, I do not believe demand will peak in 2025. Not even close.
Ron,
Note this is fossil fuel use(oil, natural gas and coal), that is likely to exceed the 2019 peak by 2023, I agree it is not likely that we will see a peak in fossil fuel consumption by 2025, probably more like 2030 to 2035 for all fossil fuel as a transition to non-fossil fuel sources of energy will take some time. From 2011 to 2019 the average annual rate of fossil fuel consumption growth was about 1.078% per year based on BP data for fossil fuel consumption in exajoules. Consumption dropped by 5.6% in 2020 and I expect 2% and 3% growth in 2021 and 2022, by 2023 we will likely return to trend growth rate with a new peak, the growth rate is likely to slow as the world transitions to other forms of energy over the next 10 to 15 years, we could see a rapid reduction in fossil fuel use as wind, solar, and other forms of non fossil fuel energy gain momentum.
Hmm, I may think that a little bit of chaos coming along the fights for the last oil reserves available could help to achieve this goal.
Good read over at oilprice if it hasn’t been linked already:
https://oilprice.com/Energy/Crude-Oil/How-Much-Oil-Can-OPEC-Realistically-Add.html
Interesting reading. The article talks a lot about OPEC not being able to increase production due to under investment in new capacity, as if the cash pot for such things were infinitely deep. It says nothing about geological limits that in many cases preclude increasing capacity. If the UK invested more in oil ‘exploration’ do these writers seriously think that it would ever discover enough new oil in the North Sea to be a 4mbpd producer again? The same is doubtlessly true of many OPEC producers.
Ultimately, oil prices will come down as high prices lead to economic deterioration in the economy. Oil provides energy that runs the economic machine and delivers real goods and services. The economy is a thermodynamic machine that generates wealth through the action of energy on matter. This implies a ceiling on the affordable oil price per unit wealth. This ultimately limits how much cash companies and nations can pour into oil exploration, or any other energy development project.
Many market analysts talk about Peak Demand, as if it somehow separate from supply issues. But demand will always be a function of affordability. Peak demand has already occurred in most Western countries, because consumers cannot afford to pay the price for many marginal uses of energy, because those uses generate insufficient wealth to be sustainable in the face of higher energy prices. It has nothing to do with us being oh so clever and more efficient and switching to electric vehicles, which are so far only a minor part of the private transport market. Industrial economies need cheap energy to prosper. Peak demand will occur because of demand destruction. And in many places it already has.
OPEC will max out again at 42, Russia at 11, USA at 11 for a few years, maybe 2023-25, the end of the peak plateau. There is not enough oil left or investment to get it out coming down the pipe. Then the fall happens. One by one each country will become Lebanon or Haiti. Somewhere it will stop but I can’t say where. Because enough oil will finally be left to make the transition for the remaining countries. Basically Russian Roulette but with collapse.
I read this article yesterday and they are finally reporting what the Industry has been experiencing for a year. I have enjoyed this new post and I appreciate what the participants have been writing. I just got back from Italy two days ago and am back in the loop.
I think the ESG investing mantra has really limited if not crippled the recovery in the domestic fossil fuel producing industry. We are drilling up a gas field in East Texas and the lack of qualified labor and materials is severely impacting our plans for pace of development. I expect this is happening all over the US in every other oil and gas producing region.
What’s interesting to me is that in years past, if oil and gas prices were spiking like they are currently, the ramp up in drilling would have responded instantaneously. This recovery seems different. Perhaps 🤔 my analysis will be proven wrong but without a vibrant investing and banking community supporting the industry, we will continue to see moderate to negligible growth in Shale production over the coming years just as the article implies.
One other interesting observation is that the deals being presented to our group and to me as a private investor are really low quality. The generation of idea generating geologists looking for conventional reserves has all but disappeared. The LTO industry created a lot of geo-professionals that serve as development geologists with a mining type mentality.
With this recent price surge, we are dusting off some of our old conventional prospects to see if they lend themselves to exploitation through the new technologies advanced by the Shale revolution.
For a final thought, don’t think we are a bunch of doomsayers here but I would suspect most contributors to this site are generally optimists in their daily lives. I am or I would have never spent the last 40 years in the oil and gas exploration industry. I think we are a group of knowledgeable people trying to gather information and tell an honest story as we see it regarding a finite supply of one the most important resources in our world. I am hopeful that the new green wave will bring about better forms of energy that are sustainable and environmentally friendly but in the mean time this transition could be a bumpy one but it all begins with transparency and honest facts about finite supply.
Question LTO S-
“One other interesting observation is that the deals being presented to our group and to me as a private investor are really low quality.”
With that in mind, would you or are you inclined put your own savings or credit up for deployment on these projects?
I am very interested in oil & gas production but mostly development drilling opportunities. If I want to bet on the price of oil, I will buy Conoco and Chevron ( they haven’t cratered to the anti fossil fuel crowd).
If I want to make money in oil and gas, I would be very interested for example in drilling a horizontal well in a “Red Fork” field in Oklahoma to recover bypassed reserves. This isn’t sexy but it can be very profitable. I prefer conventional reservoirs because the decline curves are shallower and more predictable and I believe on a per foot total well cost way more profitable. I wonder what the shale companies will do when they can’t consolidate and production starts screaming down. These wells are not cheap to operate with sub pumps and inherent water production especially when they decline to stripper type production.
I dont know that I have answered your question but the fool I am keeps me investing in new projects because I do think now is a great time to make money. Private Equity other than a few Pros like Encap, NGP, Vitol are gone and I think this opens the market back up to people who understand the industry. However, I am very selective about these projects because a lot of what I have seen is very speculative and not very well defined (not a lot of deal generating geologists left).
I think projects like shallow sand operates can be very profitable now and in the future because his costs are contained and he runs an efficient operation. It isn’t sexy but its profitable a predictable. I advised him not to sell his production a while ago and I bet he is glad he still has it. He will do very well and is a good guy.
LTO Survivor,
Really appreciate your analysis, especially your last paragraph. Your insider knowledge is just so important to this site IMO.
I think the world of all of you guys on this site. I learn so much and never cease to be impressed by the posts and the incredible knowledge regarding other parts of the world and alternative energy which I am keenly interested in. We have been so profligate as a nation in our use of energy and the day of cheap energy is coming to an end. I do have a lot of hope that there will be solutions to keep the human race alive and this website gives me a lot of hope as we all struggle to tell our story but willing to embrace new solutions. I am feel lucky to have a forum to discuss these topics. I can assure you they are seldom discussed in Bank Boardrooms or Private Equity Investment committees. I was always shocked at how little knowledge bankers and Investors had about the true inner workings of the worldwide and domestic exploration and production industry. I made many decisions based on the information I gleaned from this site. It was very helpful in my career.
Dennis’s OPEC 13 Crude + Russian C+C shows a gradually decreasing production from around 43 mmbpd at the end of 2018 to 40 mmbpd at the beginning of 2020 when the pandemic hit. Does anyone know what caused this 3 mmbpd decrease?
Frugal , Occam’s Razor ” The simplest explanation is the best explanation ” . They are maxxed out .
Frugal,
OPEC reduced output in 2019, also sanctions on Venezuela and Iran had an effect, those two nations alone dropped about 900 kb/d in 2019, the rest was OPEC cuts in output.
Is gas really heading to $2 a litre in Canada?
How the hell did we get to US$200 oil? In April 2020, West Texas Intermediate (WTI) was selling as low as US$20.10 a barrel!
It’s an enormous understatement to say the formula for oil pricing is complicated. First, though, as Rozencwajg pointed out a year ago, exploration for new reserves was already dwindling pre-2020. COVID-19 then put what we all thought was going to be a long-term damper on demand. Exploration, especially in the U.S., was even more severely curtailed.
Instead, we got a much-more-rapid-than-expected return to boom times, followed by an increase in American oil imports. As recently as April 2020, the US was exporting as much as 2.3 million barrels per day (B/D); 18 short months later it’s a net importer to the tune of 1.7 million B/D. Meanwhile, demand in China may have been as much as 1.4 million B/D higher than it was in pre-pandemic 2019. Globally, Rozencwajg says that the oil market is actually 1.2 million B/D in deficit, “the highest reading on record.”
In the article, it states the Canada is going to adopt the Clean Fuel Standard. The purpose of that standard, when proposed by California, was to reduce the use of Canadian oil sands in their gasoline and diesel. The Canadian government is now taking another shot at Alberta without most Canadians realizing this is the objective. It should be noted that the US has not adopted a clean fuel standard.
In my opinion Canada is the most likely country to experience a banking crisis over next two year’s. They are way over leveraged debt to income and as China chokes on it’s lack of energy. CCP is likely to around up the wealthy in China MBS style.
All that hot money that flowed from China into Canada over last two decades will flow back home.
Canadian real estate is guaranteed by government so there will be a shit load of real estate being transferred to their central banks balance sheet.
China’s energy problem is everyone’s problem. It’s just most people don’t see what is coming.
Yes I agree that Canada is in a massive real estate bubble, similar in scale to the 2006 US housing peak. Debt to income ratio’s are at record highs, and the federal government has and continues to run underrepresented deficits. The only things currently holding back an economic collapse are record low interest rates and continued borrowing by both government and consumers. The government is paralyzed and has no idea how to stop this cycle, possibly realizing that the only effective cure is a deep recession but this isn’t palpable to the population. I’m really surprised on how long you can kick the can down the road …
HHH and Frugal , thanks for your inputs on Canada . i knew their were problems but not the depth as you have outlined .
BIS publishes 5 metrics of economic health which if one is checked predict a 50% chance of banking crisis to follow. Canada currently checks 4 out of 5 boxes. The fifth, housing affordability, is unchecked only because Canada has had high prices for so long. The metric compares to Canada’s recent history – and so would otherwise check 5 out of 5.
https://www.youtube.com/watch?v=hZhV5dXgSTM
Dennis
Looked into where that OPEC 3.0 Mb/d increase was coming from for 2022. Below are the main contributors. The year end output’s for 2021 and 2022 are in the first two columns. Looks like OPEC is expecting big increases from the US and Russia. I guess OPEC still accepts the US estimates.
21 22 Change
US 17.6 18.4 0.8
Canada. 5.5 5.6 0.2
Norway 2.1 2.3 0.2
Brazil 3.7 4.0 0.2
Kazakhstan 1.8 2.0 0.2
Russia 10.8 11.8 1.0
Total 2.6
Ovi,
Thanks.
Russia looks unrealistic to me, US might be reasonable when we figure in growth of NGL from increased natural gas output, I perfer to look at C plus C rather than all liquids, that is a problem with both OPEC and IEA analyses.
About Kazakhstan, the increase is perhaps impossible as the oil productions of their different fields decreased due to the decline of the ressource and the investments necessary to increase the production will be carried out in the next two to five years. https://www.upstreamonline.com/production/kazmunaygaz-suffers-oil-production-slump/2-1-1047192
The higher oil price goes the more problematic it becomes for China to do massive stimulus that keeps global growth in positive territory.
WTI is on its way to $84 this morning. Government spending is only thing that keeps global growth from contraction. Now think about all the trillions in government spending since March 2020.
If your government you have to figure out some way to get inflation and oil prices under control in a hurry before this becomes a crisis.
A crisis will solve high inflation and oil prices but crisis tend to make changes to those who are in power.
I think oil price is their least problem at the moment – the coal and gas scarity has already lead to factory shutdowns. No stimulus can fight this. And coal and gas has rocketed even hight (in % ) than oil the last year. Oil isn’t on ATH in the asian region, gas and coal is.
At least they still get all the oil they want.
India is shutting down factories, too, because of coal problems.
So where does the price of coal,NG and oil go if they put the pedal to the floor on stimulus? If prices are high now and they do more stimulus therefore create more demand then they really are going to have problems.
You can’t do stimulus in this environment. Or it’s suicidal to do so.
Yes, that’s totally right.
Here they discuss now to cushion the population from the rising energy prises – welfare benefit receivers should be paid by the state, for the rest they want to lower fuel taxes so nobody should notice the rise.
When every country does this, and does much stimulus I can see a big comic style “BANG” this winter.
Propably they’ll shut down some industry – as already done in China. Everyone needing Aluminium gets a big problem for example.
Here something from Zerohedge:
https://www.zerohedge.com/commodities/la-nina-sparks-early-freeze-china-coal-supplies-languish
Looks like China take big money in it’s hand to buy any energy now – this gets interesting. Every LNG vessel, including from the USA, now goes to Asia – Europe will have to fall back to Putin.
Unless the wind picks up. Even your god Putin can’t stop the North Sea wind.
Yeah, when we get a long russian high (meterologic, not wodka) we get problems.
Nice thing to hope to have storms the whole winter long, and parts of autumn. “Hope” is not that reliable. Since we have zero green energy storage, the coal and gas has to be powered on the moment the wind fades.
And why god – I don’t like Putin. But the EU needs the russian gas. Germany could have started fracking, the netherlands has closed their fields because of earthquake fears – so russia is the only dealer left in town. And asia is buying all the LNG this winter, so good luck to catch the few tankers left on the market for big money.
PS: Looks like we get La Nina conditions this winter. This trends to cold northern winters, with low wind. Better have these gas caverns filled.
How about power when I need it, not when nature decides to throw a storm system my way and cause damage?
If nuclear power was discovered now, we’d be hailing it as a miracle solution to climate change. Instead, we’re telling people to bend over and take the costs of a system that falls over in fair weather.
This is fucking insanity, and I say that as a massive proponent of averting climate change. The radio today was full of people here going on at length about how they can in no way afford the heat pumps we’ll be forced to buy, along with EVs, to deal with decarbonisation. Gov’t is putting up £5k towards a thing that costs at least ten grand. It’s absolutely farcical.
I guess people must have a load of savings I’m missing out on, because I sure as shit cannot afford to get any of these alternatives people keep harping on about. Must be great having spare cash to revamp the entire heating and transport setup one has.
Kleiber —
>How about power when I need it, not when nature decides to throw a storm system my way and cause damage?
The energy is there when it is there. And when it is there, it is the cheapest around. The current electricity system is based on the idea that the cheapest energy is the energy with the steadiest output, basically because it depends on keeping water hot.
That is changing. The cheapest energy is now intermittent. You can build a plant (like nuclear) that needs to have a steady output to be cheap, but it will lose money when renewables kick in.
Those are the cards that the current state of technology have dealt us.
With less OPEC oil production spare capacity than claimed by OPEC and estimated by the IEA and others, the world oil supply is less certain and potentially closer to insufficient versus rising demand. With observed low elasticity of demand of oil consumption, a tighter oil market than consensus could result in much higher prices if supplies were to be disrupted or demand were to grow more than expected. Having seen this already with European and Asian natural gas and coal, and with a potential surge of oil demand for power generation this winter, the risk of an oil price shock is real and worth serious consideration.
https://bisoninterests.com/content/f/opec-spare-capacity-is-insufficient-amid-global-energy-crisis
Oil prices climb as Covid recovery, power generators stoke demand
Oil prices hit their highest level in years on Monday as demand recovers from the Covid-19 pandemic, boosted by more custom from power generators turning away from expensive gas and coal to fuel oil and diesel.
Hi all,
Ovi asked me about oil price and its effect on the economy.
I took annual real GDP in 2010 $ from world bank and realoil prices from BP stats and found annual growth rate for World real GDP and did a linear regression against oil price for 1974 to 2019 data. See chart below.
The regression shows no significant statistical correlation between oil price and World real GDP annual growth rates over the period covered (1974 to 2019). The p value for the F statistic is 0.61, any value above 0.05 indicates no significant statistical relationship for the regression.
Thanks Dennis.
Good to have facts to base understanding on.
Do you think that this lack of correlation will continue over the next decade, in the face of depletion that will begin to affect the oil supply available to many countries?
For all those who have previously stated that oil price will not climb, or that global economy (and oil demand) will never recover from Covid- perhaps time to re-evaluate your beliefs, or assumptions if you prefer.
It is noteable to see how so many tend to intermingle their assumptions with their beliefs, as if they are one and the same. I guess that just how ‘believers’ operate.
Hickory,
The only thing we can say for certain is this is what the relationship has been over the 1974 to 2019 period, the future relationship is unknown, things might change or they might not, at the World level I suspect oil prices will have only a small influence on economic growth, note though that I am often wrong, these relationships are far from simplistic and a simple single independent variable linear regression misses many factors.
Ovi also suggested I try this analysis for the US only because lower fuel taxes lead to a bigger change in consumer fuel prices as crude oil prices change than would be the case in European and other OECD nations where fuel taxes are higher (so the percentage change in petrol price in response to rising crude prices is smaller than in the US.)
The analysis shows statistical significance at the 95% confidence level, but not at the 99% confidence level, the significance for the F statistic is 0.028, a value less than 0.05 indicates significance at the 95% confidence level and a value less than 0.01 indicates significance at the 99% level. There is a correlation but not a strong one (99% confidence).
Chart below I did not label axes etc, but the vertical and horizontal axes are similar to previous chart, data is for 1974 to 2019 and for US real economic annual growth rate (vertical axis) rather than the World.
I won’t disagree with your findings on GDP at all. But really it’s a meaningless metric because of how it’s counted. One would believe everything is ok if the only thing we looked it is GDP.
Heck China just printed a 4.9% GDP. Must mean things are great there. 😁
Sorry, Dennis, but your image for world GDP says nothing. What about this one ?
The diagram for the sum of five areas shows two times, that a high oil price results in a drop of car sales: first time in 2018 to 2020, a second time in 2021. And it shows twice, that low oil prices are required for growth: in 2015 to 2017, and at the end of 2020 to 2021.
Berndt,
Not sure that motor vehicle sales is a great proxy for economic health. Real GDP annual growth rate is not a perfect measure, but it is a better measure of of economic growth than vehicle sales in my opinion.
Does the price of oil affect real economic growth at the World level? Statistically from 1974 to 2019 the answer is no.
HHH,
Monetary policy affects inflation, but when we use constant dollars as is done here, the “printing” of money is not part of the analysis. Also note that debt at the World level is money that is borrowed from other humans as long as there is no interplanetary lending and so far the numbers there are pretty much zero.
Commercial banks print money when they make loans. Central banks don’t currently have power to print money. They create bank reserves out of nothing. But until they are made legal tender they aren’t money and they aren’t inflationary in any way. They are deflationary as they are used to hold long term interest rates near zero.
Bank reserves never leave the central bank. Or get into real economy. The bonds the FED buys are second hand bond that were already bought by a primary dealer. Doesn’t increase money supply only redistributes dollars that already exists.
Banks can buy anything with bank reserves.
They need them to transfer money to other banks – otherwise they are broke. So in normal times they are inflationary – in the old time (before 2007 and the QE) the amount of bank reserved defined the amount of possible credit money in the system – round about 1:10 of bank reserves vs. credit money (with other regulatories). Tightenening them was the tool to combat inflation. They have been limited additional in this time – it wasn’t possible for a bank to just take a bond and lend a reserve againt it when there wasn’t a free reserve available.
But now they created too much, nobody can take that much credit. There are enough free bank reserves to create a hyper inflation out of the clear sky when the belief at the money fails.
Now it’s a case of: you can lead a horse to water, but you can’t make it drink.
First they wanted to create inflation with the bond buying, later they had to control long term bonds to avoid everything crashing down because of too much dept.
Also the current car market is pretty wild. For example German car sales are back down to the numbers of the mid nineties. Even stranger, 30% are plugins. The number of good old fashioned combustion engine vehicles sold hasn’t been this low since the late sixties.
Meanwhile the head of the world’s biggest car company is publicly demanding from his engineers that final assembly costs of EVs be cut by two thirds. Strange days indeed.
Plugins are easy to explain.
The buyers take the free government money – tax credits, price subventions and additional company car tax credits.
The reduced sale is easy to explain, too. Try to buy a car – there is a thing called “chip shortage” reported since at least the last 6 months everywhere. It’s real. Car companies drop shifts or close factories temporary.
Easy to explain, perhaps. But apparently not easy to predict. I can’t thank of anyone who saw this coming a few years ago.
Dennis . automotive industry is 30% of the world’s GDP ,if no autos then what ? Yes agreed GDP is not the perfect parameter but we work with data we have, EIA and IEA are all we have for the oil industry
and we use them as a base inspite of defects .
Hole in head,
Lots of stuff can be produced besides cars, such as heat pumps, solar panels, wind turbines, and plenty of stuff we have not yet imagined. There was a time when there were no cars, there were more buggys pulled by horses, and saddles etc, things change. The drop in 2020/2021 is due to supply disruptions worldwide due to the pandemic, eventually these will ease.
This is true so long as the overall trend is in the direction of more – more use of resources and energy.
I don’t know of any example of declining aggregate consumption of energy and resources in a functional society. This of course doesn’t mean it’s impossible. I remain skeptical, based largely on the .99 correlation between energy consumption and GDP.
I think we have to go this way regardless, but assume some degree of depression, social and economic collapse (or more charitably “transformation”) is baked in the cake.
Blondbeast,
Note that energy can be produced with other means besides fossil fuel. As fossil fuel prices rise there will be more incentive to invest in cheaper energy sources. Less fossil fuel has been used per unit of real GDP over the lost 10 years compared with the 1984-2010 period (about half as much). As we transition to electric transport, wind, solar, hydro, nuclear, and geothermal power, as well as better buit buidings and more heat pumps for heat, less and less fossil fuel will be needed. In fact prices of fossil fuel will start to fall due to lack of demand by 2035 and much of the resource will become a stranded asset.
@Dennis
It may be true that high FF prices incentivize investment in other forms of energy production it remains to be seen whether these sources are cheaper in an environment where high FF prices also mean that less money in total is available to be spent on anything at all.
My statement regarding energy use was about total energy, not fossil fuels. Even though I don’t accept your assertion about decoupling (Váden et al., 2020a) if I assume your statement is correct the correlation is only weakening, during a time period where clean debt adjusted GDP is also decreasing.
In 2020 127 GW of solar 111 GW of wind power generation were added, along with 60 GW of fossil generation. https://irena.org/publications/2021/March/Renewable-Capacity-Statistics-2021 Of note, this was accomplished by a fossil fuel economy. There is an important difference between a change in the % mix of newly added capacity vs either an actual decline of FF usage, or a decline in total energy production.
I’ll have to credit that since we’re speculating about the future we’ll have to wait and see. If we have a year in which no new fossil capacity is added and the economy continues to function, I’ll owe you a coke. If we have a year in which the above obtains and also the total amount of all-sources energy used globally decreases, I’ll eat my hat and go long ESG.
*Industry note: On a commercial scale I do indeed see increased application of heat pumps at a staggering pace. I also see decreased application of end-user solar (admittedly grid scale has increased as noted above), including less solar thermal and less geothermal than my firm designed in the 2000-2010 period. This has corresponded to less available grants. I’ve also noticed many building rating systems focusing less on brute energy efficiency and more on nebulous qualities such as wellness and indoor air quality. Of note, our current energy codes still base energy savings on a cost basis – dollars vs btu’s…when comparing energy saving designs vs baseline buildings – a tragedy my firm campaigns against as at least locally gas is cheaper. (e.g. an energy savings target of 10% above code minimum is based on saving 10% of the cost of energy, not the annual btu’s or kw. This math still favors natgas in most of our markets nationally)
Blondbeast,
I look at actual solar and wind output rather than capacity. I agree energy and GDP are highly correlated, but where the focus here is peak fossil fuel, often readers equate energy with fossil fuel only so I am pointing to actual data on fossil fuel. Future data we have to wait for.
blondbeast,
Wind and solar consumption in EJ (adjusted by BP to make equivalent to fossil fuel primary energy) from 2011 to 2019, average growth rate was 16.9% per year. (see chart below)
If we assume this rate continues until 2035 and then falls to 10% from 2036 to 2047, we get 48% of the 2019 level of fossil fuel primary energy use (490 EJ) from wind and solar in 2040 and 94% of the 2019 fossil fuel primary energy consumption in 2047. These estimates are likely too optimistic.
“Also note that debt at the World level is money that is borrowed from other humans as long as there is no interplanetary lending”
Dennis, this has been repeatedly shown to be false. A large amount (most?) debt comes from money that was created out of thin air at the time a commercial bank gave someone a loan. Debt as money lended from one person to another is an outdated idea that is mostly no longer true in the modern economy.
This from the Bank of England explains more: https://www.bankofengland.co.uk/quarterly-bulletin/2014/q1/money-creation-in-the-modern-economy
“Commercial [i.e. high-street] banks create money, in the form of bank deposits, by making new loans. When a bank makes a loan, for example to someone taking out a mortgage to buy a house, it does not typically do so by giving them thousands of pounds worth of banknotes. Instead, it credits their bank account with a bank deposit of the size of the mortgage. At that moment, new money is created.”
This new money is only “borrowed” in the sense that the borrower has to pay it back… But at no point did some other account balance go down in the process of creating that debt.
They need the banknotes in form of central bank liquidity when the credit taker buys the house.
That’s why banks can go broke – when they could create real money out of thin air they couldn’t go broke. They would just create new money to pay all their bills.
Yes they can put a million $ in your bank acount with a key stroke – but this money exists only in the bank.
To get central bank reserves they either already own them, or swap in cash (cash is direct central bank money) or take a AAA+ bond as a security to lend them. That’s why government bonds are so important, and the shortage of them can lead to problems.
Nikko,
In the case of a mortgage the real asset in a piece of property is the collateral for the loan, if the mortgage is not paid the bank gets the house and in many cases people (wealthy individuals pay cash for property and their bank balance does indeed change. There is also a lot of corporate debt in the form of bonds and a lot of government debt also in the form of bonds, this debt is indeed paid for with bank balances.
Debt can indeed be a problem for financial institutions when assets are inflated and when borrowers can no longer pay their debt due to an economic down turn they will not own a foreclosed property with equal value to the debt owed. This can cause banks to fail.
Blondbeast , I don’t know anything about insulation ( never needed it in India) . Just scanning the net and came across this regarding Boris Johnson’s directive to replace all gas boilers with heat pumps . Quite a critic .
https://notalotofpeopleknowthat.wordpress.com/2021/10/20/this-heat-pump-scheme-is-a-bung-to-the-rich/
The replacement/renovation issue is indeed a big equity problem, as are EV subsidies. These favor higher income brackets who can either afford the purchase (and enjoy the subsidies) or have access to credit.
I was referring mainly to multi-family new construction housing in the U.S. I see most urban developments using VRF heat pumps.
We have designed a few large conversions from chillers to heat-pump style chillers.
HiH, no AC then either I suppose?
Since it quite stupid not to insulate an airconditioned building.
Laplander , no AC . My dad constructed the house with high roofs , several windows and good cross air ventilation . However the temperatures in 1990 in Delhi was upper limit 38 degrees centigrade . Now at peak it is 48 degrees . Because of all the cement and asphalt ground temperature is 52-53 degrees centigrade . F***ing hell on earth .
@laplander: One of my partners is from the Delhi area. According to him most AC being added in India is being added by individuals to existing condos. Whether it’s foolish or not to insulate can be looked at from many factors – (comfort, climate concerns, etc.) but what tends to be used by individuals is the cost of energy vs first cost. In the absence of building code requirements the only folks deciding otherwise tend to be wealthy, concerned with ecology or both.
Don’t get me wrong I advocate for superinsulation every day. I’m in the process of superinsulation and existing cabin for my own permanent residence. The main logic for me is reducing heating needs for an all electric building to make solar affordable and reduce wood heating needs to a minimum. I do not plan on AC. Windows and ceiling fans.
Peak cars in 2017 . Am I correct ?
The OICA gives numbers for world car sales.
Interesting chart to put it mildly.
Plenty to ponder and speculate on
-will the global sales going forward ever be higher than it was in 2020?
-is the decline in sales an indication of peak prosperity (for the 99.7% of ‘commoners’)
-will the global passenger miles traveled by road have peaked as well? [I doubt it]
-is this decline in new vehicle purchase a deliberate choice to delay until more/better/cheaper electric vehicle choices are available in a few more years?
-does this reflect the reality that modern vehicles endure so much longer than those produced in the last century, and thus the interval needed to replace a prior purchase is greatly prolonged?
Hickory, my first diagram shows that the oil price is a significant input for the number of car sales. I assume, in the second diagram the same input is valid. Cars get too expensive for people.
So, my opinion is:
-the decline in sales is an indication of peak prosperity (for the 99.7% of ‘commoners’ )
Berndt,
Oil prices were lower in 2019 and 2020 than in 2018. Car sales decreased. Is your thesis that lower oil prices result in lower car sales? Seems counterintuitive.
If I do a regression on OICA data from 2005 to 2020 and real oil price data there is no statistically significant correlation, p-value of the F statistic is 0.308, any value of 0.05 or more indicates no correlation at the 95% confidence level.
Dennis,
First: Car prices change with inflation. It makes little sense, to use inflation correction for one axis and no correction for the other one.
Second: Averaging of data makes effects unrecognizable. Monthly data contain much more information than annual data.
Third: Time exists. Time dependent effects exist. It makes no sense to mix old data with new data.
Monthly data for car sales before 2015 are different to data after 2015. After 2015 a significant correlation between oil price and sales exist. The more expensive oil is, the less cars are sold.
Interestingly, a lot of information can derived out of the diagram. If we use three time spans, we get three linear fits.
The cross of each fit line with the y=0 axis allows to calculate the oil price which limits car sales growth. Above the price, sales decrease, below it, they increase.
Span……Total cost Oil..Daily C&C Prod…Price Brent
…………………G$/d……….kbbl/d……………..$/bbl
2016-2018…4,78………..81592………………59
2019-2021…3,96………..78517………………50
Now the limit is 50 $/bbl. Oil prices higher than 50 $/bbl result in a decrease of sales.
Error in graph: First time span is 2013-2015
Berndt,
Car sales is in units of cars sold not dollars, already corrected for inflation. So not correcting for inflation would be the mistake.
We do not have car sales for all of 2021, so no good data point for 2021. Also the car sales are lower in 2021 due to a chip shortage unrelated to cost of oil.
Monthly data tells us little because car sales are seasonal. If we are going to claim that the relationship is “total cost of oil” (defining what this is would be helpful) to car sales then time is not part of the equation, the relationship should be invariant with time.
You used annual data in your second chart, as did I. I don’t have acccess to monthly data.
So what is the p value for the F statistic for each of your linear regressions? Is the null hypothesis rejected at the 95% and 99% levels?
Berndt,
I define total cost of oil in constant 2010 $ as World C+C output times average annual oil price. I have looked at annual passsenger car (PC) unit sales data from 2005 to 2020 and found the annual change in PC sales for 2006 to 2020. Then a linear regression on delta PC sales vs total cost of oil per day (for the World) . I find that the p value for the F statistic of the regression is 0.16, it needs to be less than 0.05 to reject the null hypothesis (no correlation) at the 95% confidence level (for the 99% confidence level it would need to be less than 0.01).
Passenger car sales are seasonal, so unless we try to adjust for this seasonality, monthly data tells us little.
The last diagram now with R2-values.
The monthly car data is from CEICDATA, with the most recent data from local associations like VDA, CAAM, ACEA, FADA and FRED. Because the data car data vary very much from month to month (seasonal effect), i use for each monthly value in the diagrams the average of the last 12 month. (Centering of the monthly data might increase the R2-values)
The total cost of oil (G$ per day) is the product of daily oil production in barrels times average price for the month in $. Both values are from EIA. I use the product of oil production times oil price because i want to have all three things: number of cars, price and production in one diagram.
The oil price varies with inflation, and car prices vary with inflation. Because both are affected, i have not included any inflation correction in the car sales diagram.
berndt,
It makes sense to use real GDP in economic analyses because inflation varies randomly over time, if we are using unit car sales, real GDP is the only numbe that is sensible.
Also the fact that you need to use 3 different lines for your data over an 8 year period suggests there is no statistically significant relationship. What is the r squared for all of your monthly data from 2013 to 2021? Note r squared is not enough to determine statistical significance, you need to look at the p value of the F statistic (sometimes labelled in spreadsheet regressions as “significance F”. If this value is more than 0.05 it indicates no statistically significant correlation at the 95% confidence level. Also any value greater than 0.01 indicates no correlation at the 99% confidence level.
Run a simple regression it takes two minutes in a spreadsheet and let us know what you find.
Dennis,
the determination of R2 for the whole nine years 2013-2021 gives 0.008. I am quite sure, this value will hold if i include all car sales data beginning in 1900, even if i include data from the roman empire.
For me much more interesting are the values of 50$ in 2020 and 59$ in 2017. The last one is 64$ if inflation corrected. Both values give the limit for car sales growth. The diagram shows Brent prices together with the Limits for cars. The limit values are nearly on the quadratic fit line for Brent prices. So, not the oil maxima prices are most important for the car industry, the average is.
Comment: At the moment it is not possible to attach the graph, i will try again later.
I have no luck in attaching my image. The procedure, which always has worked, doesn’t function today.
https://assets.wallstreet-online.de/_media/1591/board/20211022084833-brent-price-cars-en-211022.png
Berndt,
Image has to be less than 53 kB in size, sometimes saving as a gif reduces size, sometimes jpg is smaller tha png, in some cases you need to edit image to reduce resolution. I have tried and failed to fix this problem in WordPress, sorry.
I have reduced the size from 65 kB to 50 kB.
Now it works,
Dennis —
I think a more interesting chart would be real GDP vs change in real oil price.
EDIT: Another idea would be to compare each year’s growth with the change in oil price the previous year, in case the shock of sudden price changes takes time to show itself in the GDP numbers.
Alimbiquated,
I took % change in annual real oil price in year = y-1 vs % change in World real GDP in year y from 1980 to 2020, to avoid very large changes in 1974 (217%) and 1979 (103%) which tends to skew the analysis. The regression on all data from 1962 to 2019 does not reject the null hypothesis (no correlation) at the 95% confidence interval. Chart below is 1981 to 2020 (for change in real GDP) and 1980 to 2019 (for change in real oil price).
Thanks Dennis.
I guess the conclusion is that there is no obvious correlation between oil price and economic growth.
Alimibiquated,
Not from 1961 to 2020 and the real oil prices experienced over that period. Things could potentially change at higher oil prices. We cannot predict the future very well.
“I guess the conclusion is that there is no obvious correlation between oil price and economic growth.” 1961-2020
Although at much higher levels of oil price as we may see in the coming decade that conclusion may not hold true.
One might say that the theory hasn’t really been tested hard in the past 60 years.
Hickory,
Possibly correct, though annual average oil prices in constant dollars have fluctuated quite a bit.
Yes, and what i meant by a hard test was oil pricing well above the prior levels seen in the past episodes of escalation.
I don’t know if we will see that, but I think it is more likely than not. I also think that the high pricing will be sustained for many years.
The correlation between oil price and economic growth will be tested in this decade I suspect.
Hope to be wrong.
Hickory,
In the chart below I assume oil prices rise to $155/bo in 2010 $ by 2035. The oil share of world consumption is real oil price in 2010 $/ b times World output of C plus C divided by World real GDP in 2010 $. Note how high the oil share was in the 1979 to 1984 period compared with 2020 to 2035. World income is much higher today than in 1980 so we could potentially afford much higher oil prices, so $300/bo in 2010 $ in 2035 might not be a problem (I assumed 2.5% World real GDP growth from 2023 to 2035, whch might be optimistic, generally real GDP for the World has grown at about a 3% rate for 1984 to 2019). If prices went to $400/bo in 2010 $ we might be in trouble, but I doubt we get there between now and 2035 when oil demand is likely to fall faster than the supply of oil which will cause oil prices to drop.
So correct me if I don’t have this right-
As you depict it, there is enough global prosperity now and up to at least 2035 to absorb oil price increases up to say $200/barrel [in $2010] without curtailing demand?
That is hard for me reconcile with what i have assumed to be true.
What is the 2021 $dollar value in $2010 dollar terms?
Thanks.
Hickory —
if oi was at $200 a barrel what would that mean at the pump? In America maybe $7 a gallon? Seems manageable.
Also high oil prices would certainly create investments in fuel savings.
Hickory,
The chart uses price increases from $100/bo in 2010 $ in 2024 to $155/bo (2010 $) in 2035 with prices rising by $5/bo each year from 2024 to 2035. If prices in 2035 were $300/bo the oil consumption share of World income would be 6.66%, similar to the level in 1981. This might cause disruption, but frankly I doubt oil prices will get to that level (though $150/bo seems likely imo).
I expect that demand will be curtailed by higher oil prices, enough so that supply and demand are balanced.
The $200/bo in 2010 $ would be about $237/bo in 2020 $. $1 in 2010$ about the same as $1.187 in 2020$.
The correlation is between the derivative of oil prices and world GDP.
Schinzy,
OIl price is not a smooth function so derivatives are not possible. Perhaps you mean change in oil price vs change in real GDP.
There is no correlation over the 1961 to 2020 period. See chart.
Also for the regression the p value of the F statistic is 0.265, to reject the null hypothesis at the 95% confidence level the p value of the F statistic should be less than 0.05.
Try world GDP(t+1) vs ( P(t+1)+ delta P(t)) where t is the year.
Schinzy,
It is unclear why one would choose such a formula, sounds like somebody tried a bunch of possibilities until a significant statistical relationship was found, then created a story to match.
Data mining of that sort tells us little. Note that for 1974-2019 there is no statistically significant relationship, but for 1961-2019 there is. To me the 1974 to 2020 period is of greater interest, things changed when OPEC started curtailing production. The chart below shows the model prediction for real GDP vs actual real World GDP from 1974-2019, the model result is not very good in my opinion. Oil price and change in oil price the previous year is not a good predictor of real GDP.
No Dennis,
I have not tested this combination, but I expect something like it to work and if it worked it would tell us a great deal. My intuition is that a smaller (larger) economy decreases (increases) the price of oil, therefore I expect that the coefficient of P(t 1) be positive. I expect that a rise (fall) in the price of oil causes the economy to contract (grow) next year so I expect that the coefficient of delta P(t) be negative. Testing the model would show that my intuition is consistent, or not, with empirical data.
Schinzy,
For the period I used (1974-2019), neither coefficient was statistically significant.
You should try it, you can get GDP data from World bank and oil price data from BP stats, I think you will find the data does not support your hypothesis.
OPEC plus oil drilling activity from Baker Hughes (they don’t have numbers for ex USSR bloc) does not have the shape that would indicate they are going to be able to continue adding production.
This graph also shows the Y-axis zero so the suppression is significant and not an optical illusion.
The Jodi oil storage is showing continued decline through to July 2021 and I’d expect it might accelerate from there over the last two months (though the caveat is that Jodi can be late with lots of the data).
Also looking at the stocks decline and the increase in NG production, and hence condensate, in 2016 to 2018, and the increase in tar sands around then I wonder if the real oil only production peak wasn’t a bit earlier than November 2018.
I cannot make heads or tails of this graph. All the very pale colors run together. (I have slight defective color vision.) I think they are mostly Saudi Arabia but I am not too sure. But I can see that storage was cut in half between 2015 and 2019, just before the covid demand collapse. Then they leveled off.
But yes, George is correct. It looks like the actual peak in crude oil production was actually 2015, not 2019.
For crude only I think you can pick any of 2015 to 2019. Given the accuracy of the data its has been a virtually flat plateau for those years. Late 2018 still looks like the peak but its just a blip between two dips (I can’t remember but was this OPEC manipulating things prior to an important meeting to decide production levels?)
I got the crude only number by using EIA C&C minus NEB oil sands numbers, minus Jodi gas and recent condensate-to-gas ratio to give condensate production, minus annual average stock change from Jodi primary and secondary stocks.
The details are a bit unclear. OPEC (KSA) increased in response to the Iran sanctions. However, they overcompensated. Trump initially claimed Iran would not be allowed to export any crude but then changed his mind (as he do from times to times…). Some say the Saudis got upset by Trumps behaviour, who knows?
Great stuff George, thanks. From early 2015 to early 2020, I think I would call that a five-year bumpy plateau.
George,
Where do you get the condensate to gas ratio? Typically (except for OPEC) we have C C or C C NGL data reported, I have never seen a source for condensate only at the World level.
What units are shown in this chart?
Probably kb/d.
Below is Saudi Arabia by itself.
Over the last two years, Jan 19 to Dec 2020, stocks dropped at the rate of 2,738 kb/mth. However, the drop has slowed in 2021. Jan stocks were close to 138,000 kb and August was 135,000 kb, or a drop rate 375 kb/mth or just 1/7 of the previous year rate.
Does the decline in 2020 and 2021 indicate that SA needed cash to meet its social payment commitments? It also indicates they were dumping oil into the market and this may have made the price drop worse.
World oil stocks
It’s a yikes from me.
Not much is happening in North Dakota. They were down almost 57,000 barrels per day in July and recovered 30,622 of that in August.
Below is all North Dakota according to the Director of Energy. The red line is the Drilling Productivity Report for all the Bakken. That includes the Montana part of the Bakken but not North Dakota conventional wells, which the blue line does.
Ron,
The DPR includes conventional from the Bakken/Three Forks region, it is likely that most of North Dakota output would be included in the DPR for Bakken plus Montana’s output. I don’t believe there is much North Dakota output outside the DPR region. Not sure if that is also the case for Montana.
I don’t believe there is much North Dakota output outside the DPR region.
Dennis, North Dakota conventional production is not outside the Bakken-Three Forks area, it is very much inside that area. From the Director’s Cut Bold mine.
August 34,323,696 barrels = 1,107,216 barrels/day +2.8% RF+1% NM 1.220.000
1,066,115 barrels/day or 96% from Bakken and Three Forks
41,101 barrels/day or 4% from legacy pools
(all-time high 1,519,037 BOPD Nov 2019)
By legacy pools, he means conventional wells, usually found along the anticlines inside the Bakken area. These are not fracked wells in source rock but conventional wells in reservoir rock.
Ron,
My point was simply that the DPR includes all oil output (conventional and tight oil) in the Bakken/Three Forks region.
You said:
That includes the Montana part of the Bakken but not North Dakota conventional wells, which the blue line does.
You say above the DPR does not include the North Dakota conventional wells in the Bakken region. That is incorrect.
See https://www.eia.gov/petroleum/drilling/pdf/dpr_methodology.pdf
from that doc (page 3)
Thus the data used by the DPR, along with the DPR estimates of current and future oil and gas production for all seven Regions, include not only the production from the “headline” formation (e.g., Bakken), but also the production coming any other formations within that region.
China curb fertilizer exports: https://www.bloomberg.com/news/articles/2021-10-19/china-s-curbs-on-fertilizer-exports-to-worsen-global-price-shock?sref=5dj0X2VO
If I remember correctly, similar events took place durring the (previous) food price crises when some countries curbed exports of food and inputs.
Dennis
Here are two competing and opposite forecasts for oil demand going forward. Any thoughts on which one is more likely. Your forecasts peak in the late 20s to early 30s.
“If all today’s climate pledges are met, the world would still be consuming 75 million barrels of oil per day by 2050 – down from about 100 million today,” the agency said last week, adding that demand would fall to 25 million barrels a day if countries followed its “pathway to net zero” by quadrupling investments in renewables and halting new fossil fuel developments.
The U.S. Energy Information Administration’s latest International Energy Outlook offers a dramatically different perspective on future fossil fuel demand. It projects that, “if current policy and technology trends continue,” global energy demand will increase 50 per cent by 2050 as populations increase and living standards rise in the developing world. Under the EIA’s Oct. 6 outlook, “both OPEC and non-OPEC oil production grow over the projection period, but OPEC production grows at almost three times the rate of non-OPEC production between 2020 and 2050.”
https://www.theglobeandmail.com/business/commentary/article-canadas-banks-join-mark-carney-signaling-a-shift-from-the-wests-fossil/
Ovi,
The EIA international energy outlook is ok to about 2030, beyond that point oil output will decrease. I assume the first quote is from the IEA, that is much closer to being correct. Note that my model has World liquids output at 60 Mboe/d in 2050 and World C plus C at 50 Mb/d in 2050, the URR of the C plus C model is about 2900 Gb (this includes about 150 Gb of extra heavy oil and 100 Gb of tight oil output). Peak of World C plus C is in 2026 at 86 Mb/d.
Chart below compares EIA’s International energy outlook for C plus C with a recent oil shock model. Units on vertical axis are millions of barrels of crude oil per day.
Dennis
Thanks. Quite a difference in outlook.
The more I read these days on the poor planning going into Going Green and the changes that have to be made to the infrastructure, the more I think that demand will peak in the mid thirties and the fall off will be slower than shown in your model.
Might look like mid way between your model and the EIA.
Ovi , sorry there is no midway . Either you are dead or you are alive . Models are to be followed but not to be believed .
P.S : You can argue that between dead and alive is comma , but do we really wanna go there .
Ovi,
I am in rough agreement with your take on it.
Although I see the problem with the attempt at transitioning to other energy sources much more than a failure in planning – including failure in urgency, in group decision making and public understanding of the scope of the problem, and in political mechanics [at least in this country- others can speak to there own]
Also, we may run into a failure of funding. That may prove to be a huge hurdle.
Sorry friends , one can justify the failure for transition by any metric . I call it the ” blamethrower ” , but all will bear the consequences of this . I have said that the period for transition does not exist especially after what we are now experiencing in the energy world currently . It is a scramble to collect ” scraps at the bottom of the barrel ” . Amazing even for an old-timer like me . Buckle up .
If we include AVs in the EV transition starting in 2029, AVs would travel about 45,000 miles per year as autonomous taxis or Ubers replacing 3 vehicles rather than 1 as an EV so the replacement of vehicle miles travelled by EVs would be far quicker. Scenario shown below.
Ovi and Hickory,
For oil I used a transition to EV model to come up with 2033 or so for oil demand to fall. Other energy sources have not been analyzed, but not that consumption of solar power has been increasing at annual rates of 30% and wind at about 15%, should those rates continue, a big chunk of demand for coal and natural gas used to produce electricity will disappear, also the electricity produced is competitive and will become cheaper.
For EVs the scenario below is my best guess, the supply curve is what could be produced at a high oil price level and the demand curve is the quantity of demand at high oil prices, when demand is below supply oil prices will fall and demand might rise a bit above the demand curve shown due to lower oil prices.
Ovi,
Note that I do not expect a demand peak in the mid 2030’s, the peak in demand will match the peak in supply in 2026, then high oil prices will destroy enough demand to keep supply and demand in balance as supply declines from 2027 to 2035, in 2035 I expect demand will fall at a faster rate than oil supply and oil prices will need to fall to reduce oil supply to match demand.
Below is an updated ev transition model with plugin sales growth falling from 40% in 2021 (the rate from 2014 to 2020 was 37% on average) to 35%, 30%, and 25% each year from 2022 to 2024 and then by 1% per year from 2025 to 2036. In my view these assumptions are likely conservative (if you owned a Tesla M3 or MY you would understand that EVs are far superior to ICEV). The EV transition model below updates the earlier model from July 2019 with more recent data. Demand for oil starts falling faster than oil supply in 2037, and I assume no autonomous vehicles (AV) are approved prior to 2037 in this scenario (an assumption of earlier AV approval accelerates the transition by a factor of 3 as each car would account for 45k miles per year rather than 15k).
The EIA doesn’t drill any wells. This is a funny chart. The EIA is clueless. Less drilling rigs= less production replacement. I have had a problem with the EIA and their worthless predictions for the last five years. They should stick to the production reporting business and not wade into the waters of predictive science.
LTO survivor,
The EIA scenarios for future output assume supply always increases to meet demand and they seem to believe the reserve estimates from OPEC which is likely to be a poor assumption. Up to 2030 their forecast seems reasonable, after that not so much.
Details at link below
https://www.eia.gov/outlooks/ieo/
India doubles down on its call to OPEC+ to boost production, complaining about high oil prices. With that, we have the world’s 1st (U.S.), 3rd (India) and 4th (Japan) largest oil consumers formally asking the cartel to boost output faster.
Florian , there is no spare capacity . Many have been shouting about it . Now Mr Kaplan comes with a bombshell that the peak is not 2018 but 2015 . Anyway as per Frugal post KSA have said ” Your request is under consideration ” . Shout all you want , we have arrived at peak everything . Peak oil ,peak gas , peak coal , peak cars and peak smartphones . Some choose to be blind and them I cannot assist .
https://www.statista.com/chart/12798/global-smartphone-shipments/
Hole in head,
Note that Mr Kaplan excluded extra heavy oil from his chart, there is no particular reason to do so. If extra heavy oil production was included the peak would be 2018, for now. It is likely to be exceeded in the future.
Dennis , ok but he included what Mr Matt Simmons called ” oil stained brine ” .
Hole in head,
He excluded condensate and tried to estimate crude only for the World, excluding oil sands output from Canada, not sure what the oil stained brine is about or if it is included in Mr. Kaplan’s estimate.
Saudi Arabia Says OPEC+ Is Powerless to Ease Gas Crisis
(Bloomberg) — Saudi Arabia said any extra oil from the OPEC+ cartel would do little to bring down surging natural-gas prices.
“We see our role as extremely limited,” Saudi Energy Minister Prince Abdulaziz bin Salman said during the CERAWeek India Energy Forum on Wednesday. “The issue is not the availability of crude oil. Even if we made it available in tons and tons, who’s going to burn it? Who is in need of it? And are they in need of crude or in need, for example, of gas?”
Not sure if this is an admission by Saudi Arabia that they have peaked?
World: Could you spare a little more oil, mate? Getting a tad dicey here with the ol’ economy.
KSA: lol, nah, I’m good.
Permian Basin Horizontal oil rig count with linear fit to Oct 9, 2020 to Oct 15, 2021 data, annual increase over that period about 111 HOR per year, suggesting an increase to about 415 rigs in 18 months if the trend of the past year continues. This is similar to the rig count in May 2019 and would be enough rigs to keep Permian output increasing as DUC count starts to dwindle, the trendline is extrapolated forward by 2 years for illustration purposes, clearly future rig counts cannot be known in advance.
Data in chart from Baker hughes pivot table for North American rotary rig count
https://bakerhughesrigcount.gcs-web.com/na-rig-count?c=79687&p=irol-reportsother
Another stupid chart. Oil is at $80 per barrel and gas at $6 dollars. If we had a healthy industry the rig count would be at 500 Rigs today. There is a labor shortage, equipment shortage, steel shortage and investor shortage and pretty soon a drilling inventory shortage.
LTO Survivor,
I agree the trendline is not likely to be followed for horizontal oil rigs after October 15, 2021, but aside from the red trendline (based on data from the past 53 weeks) the data in the “stupid chart” can be found at link below. See link labelled “North America Rotary Rig Count Pivot Table (Feb 2011 – Current)”
https://rigcount.bakerhughes.com/na-rig-count
Dennis there are much fewer players, less capital and fewer drilling locations. I don’t believe the chart. Just my opinion.
LTO survivor,
The rig count does not increase overnight, oil prices have increased pretty rapidly (doubling in 12 months) and investor sentiment has changed so E&P producers are being more cautious than usual. If oil and natural gas prices remain high the rig count may continue to increase in the future, if future energy prices decrease then rig count will stagnate or decrease. Chart below has Permian rig efficiency (wells drilled per horizontal oil rig) from 2017 to 2021 using baker hughes rig count data and shale profile spud data from Jan 2017 to Jan 2021 and EIA DPR DUC data for wells drilled from Feb 2021 to August 2021.
On average we have 1.17 spuds per horizontal rigs rotating over the Jan 2017 to August 2021 period in the Permian basin.
Global energy consumption vs population size.
Realize that the consumption is in part derived of estimated data, especially prior to 1900.
Also, this is not just oil- it is all sources of energy.
I predict population decline to occur more quickly than the current estimates which are based on broad demographic factors rather than incorporating hard limits to growth- like energy supply.
The forcing of population decline will be …whats the word?…painful.
Poverty is. So is warfare. Sorry.
Hicks “The forcing of population decline will be …whats the word?…painful.
Poverty is. So is warfare. Sorry.”
100 % in agreement with you . Too many people still in the denial stage .
The graph shows that Energy = Population.
Yep, once you get beyond stone age life-style.
Early copper production was likely the first episode of deforestation for industrial purposes.
It is estimated that the copper production in Cyprus between 1300 and 1000 B.C. completely deforested the island for smelting (up to 17 times in one report I saw) and it took something like 1000 years for the forests to recover.
Interesting history- https://psmag.com/environment/peak-wood-and-the-bronze-age-14363
Don’t forget the Roman Empire mines in Spain etc. People have this rosy view of classical civs like they couldn’t impact the world like we can now. Someone should remind Britons that the country was practically denuded of forests hundreds of years before the digital era.
However, no city on Earth was a large (population) as Rome until London around 1900.
1500 plus years.
What a graph! We better find those giant abiotic oil deposits and make fusion enery work ASAP.
Beg at china for the thorium reactor. There’s enough of the stuff around for the next few 100 million years.
1ton of thorium contains the energy of 27 million tons of coal. And the stuff is not that rare – much of the earth heat comes from thorium decay.
They just started testing a prototype in china.
Well, they are testing a prototype but actually it’s, a priori, a repetition of the MSRE (Molten Salt Reactor Experiment) which was operated between 1964 and 1967. At the beginning of the 2000s, French scientists of the LPSC (Grenoble) made an assessment of the MSBR (Molten Salt Breeder Reactor) based on the MSRE and discovered by simulations that the concept was not satisfactory due to several flaws : the amount of fuel that must be retreated daily is too large, the graphite which moderates the neutrons (thermal spectrum) has to be replaced periodicaly (radioactive wastes) because of the damages due to the radiations and the counter-reaction coefficient is slightly positive, which means that the reactor is slightly instable. They had the curiosity to see what was happening if the graphite was removed completely and they discovered that in these conditions, the reactor behaved better in all respects. As a consequence, the International Forum Generation IV withdrew the MSBR from the list of the type of future reactors to be studied and replaced it by the MSFR (Molten Salt Fast Reactor) as defined by the French scientists. So I don’t expect much from the Chinese experiment.
Have you looked at the projects under development by NuScale and Terrapower of the US?
The NUScale technology is obsolete : it is a water cooled reactor, under the requirements of the International Forum Generation IV. And several flaws of the design raised safety concerns. About Terrapower, it’s a MSFR with a chloride salt (probably NaCl) with an Uranium/Plutonium fuel cycle : NaCl/U(238)Cl3/Pu(239)Cl3. That’s the kind of technology which should be studied and used instead of the obsolete PWR.
Molten salt reactors are overhyped. Think about it. The reactor vessel has to withstand chemical attack from literally hundreds of different molten actnide and fission product halide salts, in various oxidation states, for a period of decades. It’s a tall order indeed. Most likely, you will discover serious life-limiting corrosion and stress corrosion cracking issues, that will close the plant decades before intended. Another significant issue is poor breeding ratio. If you are looking to expand nuclear reactor capacity rapidly, you face a shortage of reactor grade plutonium.
It is because of issues like this that most fast neutron reactor programmes focused on liquid metal cooled reactors, especially sodium. Sodium is compatible with steels and the hard neutron spectrum allows excellent breeding. Look up ‘Plentiful Energy’ which tells the story of the US Integral Fast Reactor programme.
None of these exotic reactor programmes has really gone anywhere since the 90s because of a complete absence of political support for further development. The IFR was close to commercialisation when it was cancelled by the Clinton administration. Who needs enemies with wallys like that running your country?
@Tonyh. You are speaking of ”hundreds of different molten actinides and fission products halide salts”. 1) The actinides and the fission products are not molten. They are dissolved in a molten salt (NaCl, BeF2/LiF, etc.). The actinides and others are under the form of (something)Cl3 or (something)F4. Of course, they are gaseous fission products but that’s not a problem. 2) To treat the wastes contained in the molten salt, part of the salt (40L for a 1 GWe reactor) is reprocessed daily to set aside what is not useful (the lanthanides, the tellurium, the sulfur, …) and reintroduce in the system what is useful (the fuel and the transuranium elements) and if necessary fresh fuel. About this, that can be fuel but it can also be fertile material (U 238 or Th 232). As a matter of fact, it has been calculated that for a 1 GWe MSR using NaCl/U(238)Cl3/Pu(239)Cl3, it would be necessary to introduce every year … 1,4t of U 238 to keep the reactor running. When you have a stockpile of 300.000 t of U 238, like in France, you have a perspective… 3) The corrosion is of course a concern. The elements of the installation are subjected to high temperatures (750°C), chemical corrosion from various elements (not hundreds, only a few that you can count on your hand) and hard neutronic irradiation levels. I don’t know if you know but the Russians have decided (project MOSART) to build a 1 GWe MSFR with online retreatment using transuranium elements as a fuel. Before that, they spent several years studying the materials and selecting the best ones to withstand the problems of corrosions and neutronic irradiation. I don’t think that if the materials were so fragile that they could collapse like you wrote, they would have started the construction. I based my words on scientific publications
Can you recommend a document available online that would bring me up to date please? Do you have a recommendation on what the best technologies to pursue might be?
The chinese want to produce them in mid size in factories – so they can roll out them fast. So it’s a new approach. Like the windmills – put together giant size preproduced elements at the site, not builing it at the place like current nukes.
I think in the last 20 years materials for containing the molten salt have improved. It’s at least a good try – when it works all coal will be phased out.
Solar and wind are not more advanced at the moment – the number of productive big storages is exact the same as the number of working thorium reactors. 0.
And it’s worth a try . Fuel is enough available.
I don’t know how advancrd they are. I think they should know the french results.
I hope very much they succeed. Thorium can‘t be weaponized and never blows up as far as I know. Many advantages …
How long will it take to build a serious number of those reactors? Will there run hundreds of them in 2040? And why didn‘t they try it earlier? Thorium has been discussed for decades …
Exxon thinking of walking away from 30bn worth of projects:
https://www.wsj.com/articles/exxon-debates-abandoning-some-of-its-biggest-oil-and-gas-projects-11634739779?mod=hp_lead_pos1
” Exxon Mobil Corp.’s XOM 0.03% remade board of directors is debating whether to continue with several major oil and gas projects as the company reconsiders its investment strategy in a fast-changing energy landscape, according to people familiar with the matter.
Members of the board—which includes three directors successfully nominated by an activist investor in May and two other new members—have expressed concerns about certain projects, including a $30 billion liquefied natural gas development in Mozambique and another multibillion-dollar gas project in Vietnam, the people said.
Oil and gas prices are at multiyear highs, and the world is experiencing a shortage of fossil fuels as economies emerge from the pandemic. But it takes years for such energy megaprojects to produce additional supplies, and more years after that for the investments to pay off.
Exxon board members are weighing the fate of future projects as the company is facing pressure from investors to restrain fossil-fuel investment to limit carbon emissions and return more cash to shareholders. Environmentalists and some government officials are also pressuring the company to produce less oil and gas.”
Rgds
WP
I wouldn’t own any company oil or otherwise that borrows money to make dividend payments. This company has been destroyed by incompetent decision makers for the last 20 years,
White House says continuing to press OPEC to address oil supply issue
Cracks are showing up. Oil fund manager Eric Nuttall highlights one OPEC member that doesn’t have the capacity that it purports.
In 2022, if we find out that OPEC+ wasn’t really holding back that much oil, then we could see +$150 oil.
Yeah, but like, $150/bbl. oil will mean more oil comes to market, and thus the problem is solved once and for all.
Kinda like how COP26 will solve climate change.
https://www.youtube.com/watch?v=OqVyRa1iuMc
We might should hit the brakes on the $100 oil talk. All the stimulus is gone. We getting close to GDP contraction.
Projections I’m seeing are dismal. 0.2% dismal
I’ve given up predicting oil prices, except short term.
Frugal,
And your short term prediction for annual average oil prices in 2022 is…?
OK, $90/barrel average for WTI in 2022. I could be wrong though.
A comment on OFW sums it all .
” prices for the existing oil are bid up until it busts the economy, but not nearly enough to replace the depleting wells? “
I hear the inflation narrative. And I’ve been long inflation. But economic data is rolling over. Couple more months and FED will likely have to walk back the tapering of QE and interest rate hike narrative. But that won’t stop the numbers from tanking.
Without the massive government handouts the inflation likely gives way to economic contraction over next three months. And everyone will be sitting around scratching their head like Wtf? Where did the inflation narrative go?
I can tell you one thing if interest rates don’t head lower soon demand for mortgages is going to tank.
People are talking like it’s a forgone conclusion that oil prices can only go higher from here. I see a lot of headwinds in the way.
HHH I couldn’t agree more.
HHH and LTO Survivor,
Consumer demand is quite strong and the shortage of workers is likely to put upward pressure on wages which feeds more consumer demand. Why is the supply chain having difficulty? In part because the increase in consumer demand is unprecedented since the great recession (2008/2009) particularly for durable goods excluding transportation (which has been affected by a chip shortage causing a lack of supply of new vehicles).
Care to venture a guess on oil price in 2022? I think $90/bo /-$5/bo is the likely average annual oil price for Brent crude in 2021 US$ for 2022.
That’s not what I hear. I have heard repeated calls on various outlets about businesses not having the money for such wage increases, which is the big underlying assumption here to prop up this endless growth spree. If companies cannot pony up the cash from somewhere that doesn’t mean significant increases in costs to the consumer, then things do not go on in some virtuous cycle that magically enable $90+ bbl. oil. Strangely, the HGV and other worker deficit is not being addressed readily, despite it being critical to economic activity. Why don’t the businesses just pay more?
There is also the fact that a great many things are not as they were pre-pandemic. The world went from having ample supplies of things to not. So everyone just decided to blow a lot of money on things, or are there other bottlenecks? The car situation, for example, is purely down to a lack of capacity in semiconductors. The fertiliser shortages and smelting of various metal ores and poly silicon is down to a deficit in cheap industrial energy from NG to coal now. Oil, it seems, isn’t even the most important factor to keep track of now.
HHH, “I can tell you one thing if interest rates don’t head lower soon demand for mortgages is going to tank.”
Bullseye .
https://wolfstreet.com/2021/10/21/fear-of-rising-mortgage-rates-meets-fizzling-pandemic-frenzy-prices-of-existing-homes-fall-for-3rd-month/
My dad is pestering to get me to remortgage immediately (I am due anyway by March) before the BoE raise rates. I told him if they did that to any appreciable degree to stem inflationary pressure, we’d have bigger problems than my higher interest rate payments per month.
HHH,
30 year mortgage rates are about 3%, this is not very high, I recently did a refi at 2.25%.
Also housing prices are up (existing homes) by 1.77% in September
https://www.economy.com/united-states/house-price-value-for-existing-homes/seasonally-adjusted
new home prices up by 1.21% in August
Also housing starts and permits are down, which would tend to reduce supply and increase price further (this may simply be seasonal as things wind down in the north during winter.
https://www.economy.com/united-states/house-price-value-for-new-homes/seasonally-adjusted
Dennis do you have any idea how many MBS ( mortgage back security) are pledge at REPO market as collateral for a loan?
If your home isn’t paid for there is likely a security attached to your loan that a bank or whoever owns the loan has pledged in a REPO market for a loan. And you have no idea about it.
Your home is collateral for not only your loan but now their loan. And it’s totally legal.
Higher interest rates lead to a revaluation of underlying collateral not only for your loan but there loan also. Rising yields is a problem. Cause by inflation that nobody is talking about.
FED really can’t afford to allow a reprice lower of home values.
HHH,
The repo loans are not my problem, that is the bank’s problem, I have in writing that loan is financed at a fixed rate of 2.25%. The secondary market is a concern for the entire World economy and no doubt should be regulated with greater care.
The free market fundamentalists think differently, but the GFC showed such fundamentalism to be bonkers.
I get that you refinanced. Everybody that could has. And since mortgage rates tend to track 10 year US treasuries yields. As long as bond yields are rising so will mortgage rates.
Try selling your home to someone who has to pay 100-200 basis points higher of interest on the loan they get. They can’t afford your price.
In a housing market that is short on supply, prices tend to go up. In this market many sellers are getting bids above asking price as buyers are afraid they will be outbid by others, also a lot of buyers are paying cash.
Update on Permian basin from Enno Peters at link below is interesting especially the future scenario presented.
About this scenario he says:
In this scenario, tight oil output would set a new record of 4.5 million b/d by the end of the 1st half of 2022, and it would exit next year at almost 5 million b/d. You can see that New Mexico is responsible for most of the growth.
https://shaleprofile.com/blog/permian/permian-update-through-july-2021/
Reading from the chart it looks like he has output at roughly 5600 kb/d in Dec 2024, my medium oil price model has a somewhat different path and is a bit more conservative with output at just under 5270 kb/d in Dec 2024, so much for wildly optimistic scenarios. My medium scenario in chart below for comparison with Mr Peters’ scenario. My scenario reaches 5600 kb/d in July 2025 and peaks in 2033 at 6800 kb/d followed by rapid decline to 1200 kb/d by Dec 2040 and to 149 kb/d by Dec 2045.
So WTI is down 2.5% today on absolutely no news whatsoever.
HHH,
The Entire Oil and Energy Market is considerably OVERBOUGHT currently. I believe we are going to see a significant correction in the Energy Stocks in the next few weeks. Of course, the oil price and energy stocks can continue even higher, but the Oil Stocks today are behaving the same way the Gold Stocks were trading last year when Gold reached $2,000.
steve
Stevie Bling, you are entitled to your opinion even when it’s wrong. There could be a short term correction(a buying opportunity), but the oil energy stocks are going higher and my ticket destination says big money at HB’s Bank of America. It’s time to get on the money machine locomotive before you get left at the station.
XOM, CVX, OXY and COP will turn on the Permian tap as the market tightens and they can pick that bling right out of your pocket at the gas station. The last 7 years of freeloaders riding on the cheap oil express are over. We are headed back to an under supplied market similar to the 2004 to 2014 era.
HHH,
I believe it is called profit taking.
Believe there is all little more too it than that Dennis. This was carry trade unwind.
Yen currency crosses. The yen component has been getting sold as yields on 10 year US bonds have been rising. It’s part of the inflation trade. Rising yields equals weaker yen as Japanese banks load up on treasuries when yields rise.
Last 3 weeks yen has gotten crushed. And is way over sold so yeah profit taking. But is this the Japanese investor saying yields are peaking and inflation peaking?
The “profit taking” argument for declining prices makes no sense – not now or ever.
If you own an asset and you have a profit you sell, but that is because somebody else is buying.
The symmetrical description then if asset prices go up is that it is because of “profit making” and that is nonsense.
Prices move because at a given price there is an imbalance between buyers and sellers (either way). Why that is is unknowable.
Rgds
WP
That depends on liquidity. If a price is going up, say, then it could be that a great many people are caught on the wrong side, having expected it to drop. Once they get cold feet or even margin called, they have to sell, which can then have price shoot lower as they unwind their positions and the counter-party buys up those sold lots.
How fast this happens and at what point it stops is purely a function of what volume is available in the market. If there are simply no interested parties offering up liquidity at a price just below where the shorters puked their positions, then down it goes further until it hits the bid wall again.
You’re right in that there are always equal buyers to sellers, which is sometimes a thing people get wrong about dual auction markets (one cannot sell without a buyer and vice versa). However, it doesn’t mean that both see eye-to-eye all the time, and there may simply be inadequate volume at certain prices to stop initiative buying/selling outside of an agreed balance area. The price of oil dropping so quickly would be because of one of those voids being hit, as the price chewed through prices and liquidity that it then didn’t have to support it when it ran out of said liquidity above.
Well put.
Rgds
WP
Weekend peak,
Ok we will go with more sellers than buyers, but I think the reason is because people think prices have reaced a top and are selling to lock in profits. Possibly there are fewer buyers that believe oil prices will rise further.
This is not hard stuff to understand.
I think that is essentially impossible to guess people’s motivation as to why they either buy or sell.
One doesn’t even know who is buying or selling or what their cost basis is. Or if their position is a hedge against something else.
There are so many unknowns that opining on why prices are increasing or decreasing seems to be a waste of time.
Rgds
WP
Because oil, like most markets now, is open to pure speculation, one cannot assume price movements are indicative of sentiment in the energy market.
Mark Douglas, a well known trading mentor from years ago, had a good anecdote about a guy who usually had massive positions in the futures market for some commodity. Someone told him they could predict the price because of some fancy maths and predicted it would move one way. The guy who traded the market picked up the phone and made a massive trade that moved the market the total opposite way because of his size. Totally out of the blue.
The point is, you have various timeframes and reasons from multiple players in the market to take account of. Everyone from oil companies to hedgers in energy to pension funds to retail speculators and prop firms. So it is never really a good indicator of value of the commodity traded, especially given how vital oil is.
Yes , I know it’s zero hedge but the MSM is too busy discussing CRT , LGBTQ , Trump and vaccine mandates .
https://www.zerohedge.com/commodities/jpm-we-could-be-just-weeks-away-cushing-being-out-crude
After the forthcoming flop Christmas sales , 2022 will be the year that energy issues will take over just like Covid was for 2020/2021 . More clicks to POB are welcome .
HOLE,
Yes, I have seen that article and while we could see lower Cushing Inventories, higher oil prices tend to hurt demand too. So, we must consider that when thinking that inventories are just going to go down because Americans don’t care about gasoline prices.
steve
Steve , I know , I know . The link is not for guys like you who are awake it is for those who are asleep and also for those who are sleeping with their eyes open . 🙂
ExxonMobil Saves Face With ESG Cover To Exit Its Failed Mozambique LNG project
Why? Energy Giant Total declared “Force Majeure” April this year on its Mozambique LNG project due to an Islamic insurgent attack.
$20 billion Project now on HOLD… LOL
https://twitter.com/SRSroccoReport/status/1451228266811912193
steve
Steve , EROEI rules and so does King Diesel .
H.I.H
Agreed
https://www.dailymail.co.uk/news/article-10117649/California-town-sees-gas-hit-alarming-7-59-gallon-4-higher-average.html
gas 7 dollars a gallon in California
“Gorda is notorious along the California coast for some of the highest gas prices in the country, an apparent consequence of the town’s remoteness and whereabouts in the Golden State. ”
Almost 2 hr drive north to sizeable town- Monterey.
Less than 100 people live there. Much less.
Peak Oil in 2024.
European oil majors, including BP (BP.L) and Royal Dutch Shell (RDSa.L), are spending billions of dollars to reduce their dependency on fossil fuels and grow their focus on renewables.
But Morgan Stanley’s own analysis of 120 oil firms indicates total capex stagnating below 2019 levels even in 2023 and those figures include renewables investment, implying flat oil and gas capex and a peak in oil supply around 2024, they said.
https://www.reuters.com/business/energy/doom-boom-energy-stocks-power-out-covid-shock-2021-10-21/
We may have reached it in 2018 already.
OIL SYSTEM COLLAPSING SO FAST It May Derail Renewables Warn French Government Scientists Bold mine.
A team of French government energy scientists are warning that the collapse of the global oil system is coming so rapidly it could derail the transition to a renewable energy system if it doesn’t happen fast enough. In just 13 years, global oil production could enter into a terminal and exponential decline, accompanied by the overall collapse of the global oil and gas industries over the next three decades.
But this is not because the earth is running out of oil and gas. Rather, it’s because they are increasingly eating themselves to stay alive. The oil and gas industries are consuming exponentially more and more energy just to keep extracting oil and gas. That’s why they’ve entered a downwards spiral of increasing costs of production, diminishing profits, rising debt and irreversible economic decline.
The implication is that global energy shortages and price spikes will be a taste of things to come if we stay dependent on fossil fuels. Yet a growing narrative has instead wrongly pinpointed the ‘clean energy transition’ as the culprit.
The part I put in bold is the very definition of peak oil supply.
Yes- these set of statements ring true to my ears.
Not what i want to hear, but what is going on.
At the same time the global population is growing and
covid energy demand suppression will be fading over the 18 months.
As said here before, it will take sustained higher energy prices to spur escalation of both fossil fuel and other energy source capex and development.
I think that price scenario is on track to play out, and players in the game with good projects will attract much capital.
The declining EROI of new production explains why it is increasingly difficult to find a price that is both affordable to consumers and profitable for producers. Falling EROI has made economic growth effectively impossible in OECD countries since 2008. Amongst ruling elites, there appears to be very little awareness of the importance of energy as the master resource that enables all economic activity. Governments tend to look upon economies as financial systems, in which energy is just another input. This puts them at a loss to explain how 13 years of effectively sub zero interest rates and massive expansion of money supply, have failed to stimulate robust economic growth. We have seen booms in asset prices and limited growth in services. But the real goods economy of all OECD countries, have been static or shrinking since 2008.
Has anyone (e.g. Ovi) seen any study on what rising natural gas prices means for the oil sands, and more importantly what falling EROI ( down to 3 by 2050 if I understand the article above correctly) would mean for the future. About a quarter of the calories in synthetic crude/bitumen from the oil sands is directly from natural gas (taking a third of Canada’s production at the moment) – i.e. it’s just arbitrage of turning energy in gas to energy in liquids. Overall I’ve seen EROI estimates for oil sands as low as 1.5 to 2. Oil Sands plants are designed for 50 years so the natural gas supply issue is going to appear within the life of existing plants. The oil sands business dynamics are different from those for conventional, and more so tight, oil (i.e. no need for exploration, heavy dependence on gas prices, long plateau periods before decline, little in fill drilling, no tie backs, reliance on export pipeline capacity etc.) The majors have mostly pulled out, I don’t know of any significant capacity additions being planned, and with nat gas prices rising faster than oil prices (or are they in Canada?) the operators left could be losing profitability. Could all the fields become white elephants with stranded assets some time in the future, irrespective of climate change arguments?
George, I read somewhere that the Canadian oil sands consume something like a third of all the natural gas consumed in Canada. If this is true, the current high natural gas prices would definitely increase extraction/upgrade costs.
I would yhink they might use raw bitumen as an energy input rather than nat gas at some relative price point. Wherever it is profitable to do so.
Dennis
As best I know, bitumen does not burn. What they have talked about is using the carbon/coke that is removed from the bitumen by the Cokers as a source of fuel. However that was pre-CC and concerns with CO2 emissions.
One company started to process the coke to recover titanium. Not sure where that ended up.
George
I have prepared an answer but cannot post it. I have forwarded it to Dennis and Ron in the hope that they can fix the problem. I deleted the first post because of an error. Now I can not post the fixed one since the site says, duplicate post.
>falling EROI
EROI is irrelevant to the oil industry because oi is not a good source of energy. Oil’s primary use is to store energy in light vehicles, like a battery. The value of a battery is not its EROI, but its ability to deliver energy to some niche setting.
Oil also fills s a few more niches, like diesel generators on islands where coal delivery is expensive, but other than that it can’t compete with coal, and hasn’t ever been able to.
Oilmen sometimes refer to the oil industry as the energy industry, but this is a misnomer.
George
As you are aware, there are two types of oil sands operations. Mining and Steam Assisted Gravity Drainage (SAGD). SAGD also used in the California Kern field.
For mining operations, a good number to use was 1 GJ of NG per barrel of Syncrude Sweet Oil (SCO), which is very close to WTI and biased toward diesel. See attached chart taken from a 2007 report from Canadian Oil Sands which owned 38% of Syncrude and was ultimately taken over by Suncor. Their year over year range for GJ/b was from 0.88 to 1.15 of SSB (Syncrude Sweet Blend)
As I recall one barrel of oil contains close to 6 GJ. So just counting NG, the EROEI is 5/6. Throw in diesel for the trucks and shovels to mine and transport the sands and electricity to run the plant. How much could it add.
Attached is a table of 2015 Canadian Oil Sands fuel costs that shows the cost of fuel for one barrel of SCO. $2.12 for NG and Diesel.
The fine print below the picture states:
Reflects energy generated by the upgrader that is used in the bitumen production process and is valued by reference to natural gas and diesel prices. Natural gas prices averaged $2.71 per GJ and $2.68 per GJ in the three and nine months ended September 30, 2015, respectively, and $3.94 per GJ and $4.63 per GJ in the three and nine months ended
September 30, 2014, respectively. Diesel prices averaged $0.66 per litre and $0.69 per litre in the three and nine months ended September 30, 2015, respectively, and $0.94 per litre and $1.04 per litre in the three and nine months ended September 30, 2014, respectively.
Using those costs, COS must have increased its EROI over the years. (2.12/2.71 = 0.78), not counting diesel. I think they added a solvent at the beginning of the process where they dumped the Sands into the hot water to melt the bitumen from the sand. I recall something about a Parrafinic process.
On the SAGD side, the NG is used to melt the Oil sands underground and then pumped up to the surface using submersible pumps. I am not sure but I think that I read at one point that the SAGD people also started to use a solvent in their process. Then you have to add in the energy used to go from bitumen to SCO. Not sure how much NG is required to get one barrel of bitumen to the surface.
I recall when NG was cheap, the SAGD companies would say their process was more cost effective. When NG climbed COS would claim their process was moe cost effective.
Table 1
Table 2
Here’s the article that I may have read a few years ago:
Oil sands production using nearly one-third of Canada’s natural gas
CALGARY — Nearly one-third of the natural gas burned in Canada last year was used to produce oil from the oil sands, according to the National Energy Board.
The federal regulator says nearly 2.38 billion cubic feet per day or a record 29 per cent of purchased natural gas was used for oil sands production in northern Alberta in 2016. That compared with 730 million cf/d or 12 per cent of total demand in 2005.
Overall Canadian natural gas demand increased over the same period by 34 per cent to an estimated 8.27 billion cf/d from 6.17 billion cf/d.
Natural gas is largely used in the oil sands to generate steam to inject into underground formations to thin the heavy, sticky bitumen crude and allow it to be pumped to surface. The growth in so-called “thermal” projects is the main driver behind increased oil sands demand for natural gas, the NEB says.
Frugal
In the mining operation, NG is used at the front end to heat the water to separate the bitumen from the sand. It is also used by the Cokers to remove carbon from the bitumen.
A tid bit. For some unknown reason, each grain of sand is surrounded by a thin layer of water and then the bitumen. That is why they drop the oil sands into the hot water, The bitumen separates from the grain of sand and it floats and the sand sinks. That layer of water makes all the difference.
Ovi,
A tid bit. For some unknown reason, each grain of sand is surrounded by a thin layer of water and then the bitumen. That is why they drop the oil sands into the hot water, The bitumen separates from the grain of sand and it floats and the sand sinks. That layer of water makes all the difference.
I’ve heard that the Orinoco deposits don’t have a layer of water around the sand grains like the Athabasca bitumen does. This makes it more difficult to separate the sand from the heavy oil. So Valenzuela’s extra heavy oil won’t be cheap if it’s ever extracted at a high rate.
Frugal
The water makes quite a difference. Orinoco is just extra heavy oil.
Ovi, are you sure that the Orinoco extra heavy oil isn’t mixed with sand? My impression is that it’s similar to the Athabasca deposits and that’s one reason why it hasn’t been heavily extracted.
Frugal
This is what Dr Google says
“The Orinoco Belt consists of large deposits of extra heavy crude..
Ovi, this link labels the Orinoco deposit as tar sands.
Venezuela Tar Sands
Maybe somebody here can clarify this.
Frugal
This statement sounds like it is extra heavy oil.
“Venezuela’s Orinoco Belt occupies a much smaller footprint than tar sand basins in Canada and is easier to extract and export because it is warmer, closer to the surface, has more uniform viscosity, and can be more easily transported.”
Venezuela is heavy oil, it can flow unassisted so is closer to conventional oil than to bitumen (which is defined as having viscosity greater than 10000cP I think, but might be 100000). Venezuela has something called Orimulsion which is oil/water/heavy metals emulsion and is really difficult to separate and it used to be that the only economic use was to burn it directly in power stations, but the heavy metals and other contaminents made that unattractive (I don’t know if any newer applicable technologies have come along).
NG Cost in Canada at the delivery point in Alberta over last five years in Can dollars.
https://economicdashboard.alberta.ca/naturalgasprice
George
Looks like I got the EROEI upside down in the post above. I should have written that the EROI is 5, based on natural gas only. The diesel would lower it further.
Thanks for the replies. I think some of the overall EROI has to be from the original construction of the plant, and the EROI of the gas used has to be included, which is why the chande mentioned in the paper is of interest, and any raw bitumen exported to refineries has ro have additional energy used in processing.
The rig count for the USA fell this week:
https://oilprice.com/Energy/Energy-General/US-Oil-Rig-Count-Slips-For-The-First-Time-In-Six-Weeks.html
So something seems stalling. Perhaps the supply problems reached even the drillers.
Isn’t this what those with first hand knowledge and therefore might be expected to know, like LTO Survivor and Shallowsand, said to expect to start happening, even before the supply chain issues?
Why oil stocks at the Cushing, Okla. WTI delivery point appear to be ‘basically empty’
Backwardation in the futures contracts for U.S. benchmark West Texas Intermediate crude oil implies a shortage of supplies at the Cushing, Okla. delivery hub for the contracts, an analyst told MarketWatch on Friday.
We now have a new estimate of when Saudi Arabia will run out of its last drop of oil-
“The crown prince of Saudi Arabia said on Saturday that the world’s top oil exporter aims to reach zero-net emissions by 2060”
New posts are up.
https://peakoilbarrel.com/norway-part-ii-production-and-wellbores/
and
https://peakoilbarrel.com/open-thread-non-petroleumoctober-23-2021/