A Guest Post by George Kaplan
Annual Production
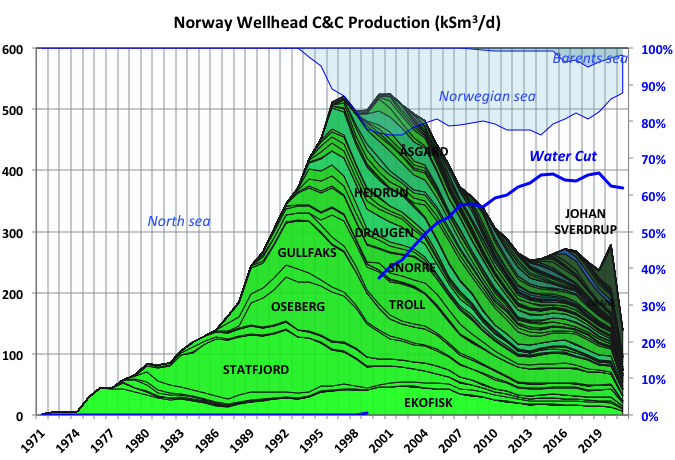
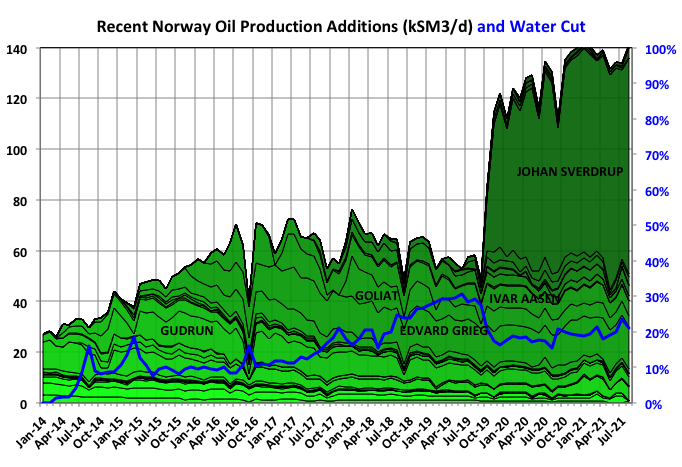
Overall Norwegian oil production peaked in 2000 but, thanks to the Johan Sverdrup discovery, it is heading for a secondary peak in the next couple of years. Phase I of the development started in 2019 and has design capacity of 440kboed (70kSm3/d) and Phase II is due in late 2022, raising the total capacity to 700kboed of which 535kbpd (85kSm3/d) is crude. The development uses predrilled wills over which the platforms are installed and tied-in, so ramp up was, for Phase I, and will be, for Phase II, rapid. To find a field this size in a mature basin (it is in the North Sea) is unusual, possibly unique so far in offshore oil developments.
For some years Troll has been the largest single oil producer, coming from horizontal oil wells exploiting the oil rim in one half of the field, but recently Troll III was started which produces from the gas cap above the rim, so oil production will now fall.
In the chart green bands are fields in the North Sea, blue-green those in the Norwegian Sea, and the couple of thin blue ones those in the Barents Sea. The 2021 values are only through July.
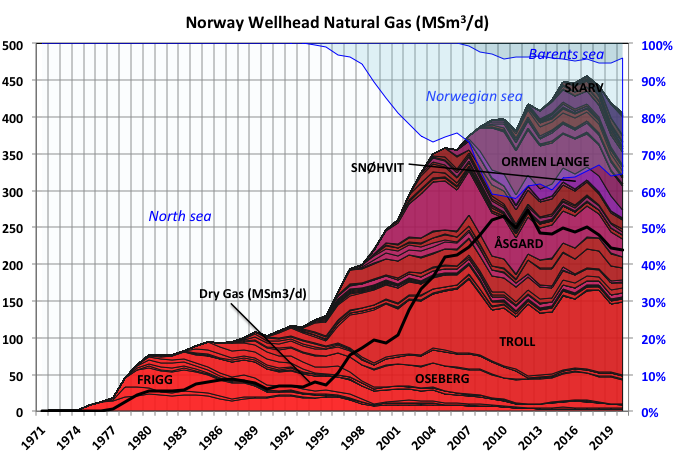
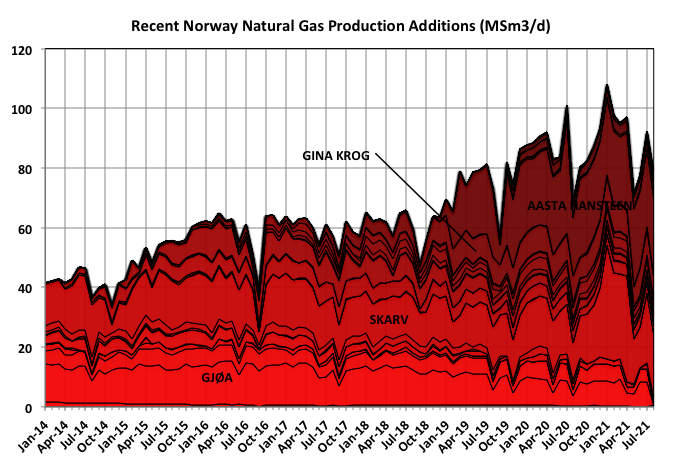
Norway was late in developing its dry gas facilities, possibly because it has no need for domestic fossil fuel based electric generation as it has huge hydroelectric resources. However since Troll came online there has been a fairly consistent split of 2 to 1 between dry gas and associated gas. Most of the gas flows to continental Europe via gas plants on the Norwegian coast and pipelines to the Netherlands and Belgium.
Ormen Lange, in the Norwegian Sea, feeds the UK exclusively via the Nyhamna gas plant and Langeled pipeline. Ormen Lange is in decline and wet-gas subsea compression is being added to maintain production and increase recovery (FID was approved in September this year and start-up is expected in 2024). Two smaller fields have been tied-in to feed Nyhamna as capacity has become available: Aasta Hansteen in December 2018 and Dvalin, nominally in November 2020. While Dvalin was declared as having started hardly any production has been recorded since because excessively high mercury levels were found initially and the production wells were shut-in. There has been no news released as to when production will resume = presumably any fix will require installation of offshore or onshore treatment facilities that will take several years to complete (offshore this would be at Heidrun, which is the intermediate platform for gas production).
Recent Monthly Production
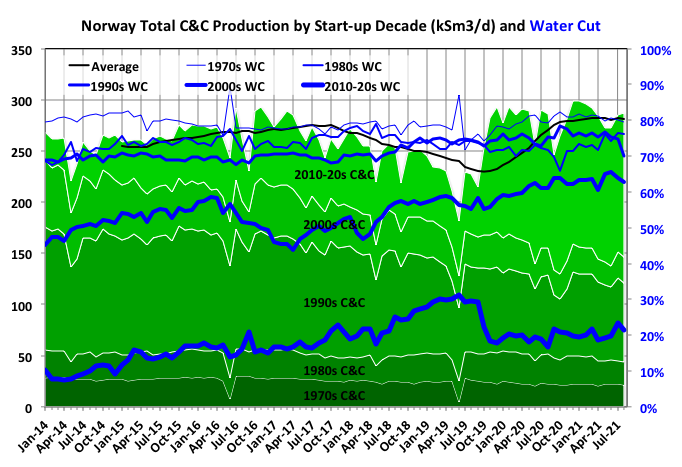
The mature giant fields from the 70s and 80s have maintained steady C&C production in recent years, albeit with plenty of in-fill drilling and brownfield redevelopments. The medium fields and smaller tie-backs started in the 90s and 00s have declined more rapidly but the production has now been more than replaced by Johan Sverdrup and production will grow further with a number of start-ups being clustered because ov Covid delays and Phase II of Johan Sverdrup expected in late 2022.
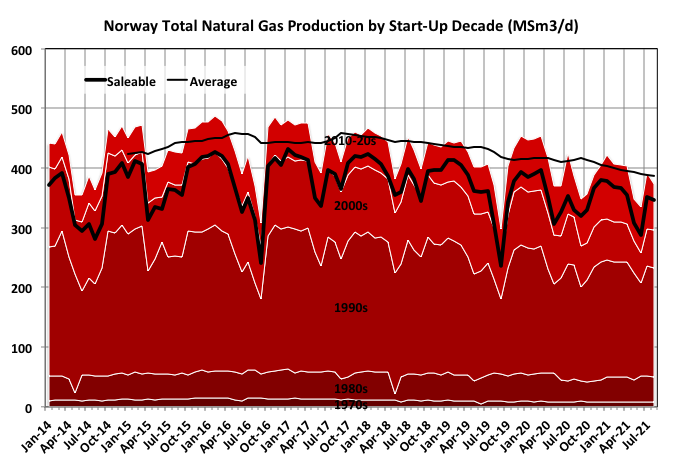
Natural Gas production has been, and still is, dominated by Troll and Ormen Lange, both started in the 90s. Peak was in 2016 and, so far, decline has been faster than the growth phase, which is unusual in offshore basins for oil or gas. The difference between wellhead production and sales is mostly re-injected gas; Norway has a high carbon tax and there is relatively little offshore flaring and many of the platforms use electricity from on-shore rather than using fuel gas for platform turbine generators.
Recent Start-ups
The chart below shows fields started since 2010 and highlights how anomalous the Johan Sverdrup discovery was. The other recent fields show typical late basin life features, i.e. they tend to get smaller and decline faster, usually without long plateaus. Even here though, because of opening of new developments in the Barents Sea, the overall decline rate is less than would be seen in a single basin.
The Duva field was started in August 2021 and is expected to ramp to 30 kbpd. The Gjøa field, mainly a gas producer, had been shut down in March to allow tie-in of Duva but is now returning to production.
Gas developments in the cold of the Baltic Sea are quite difficult and so far the relatively low amounts of associated gas from oil projects have had to be reinjected. This may not be the deal recovery method for reservoir management. I don’t know if the gas is used for pressure support or is injected it other formations (usually waer flood only schemes are preferred) but without a pipeline system to shore ….
Reserve to Production Ratios
The fields with solid bars have R/P ratios calculated by simply dividing the estimated reserves at the end of 2020 by the average production through that year. Those with open bars are either in development or have had extensive shutdowns in part of 2020.
Crude and Condensate
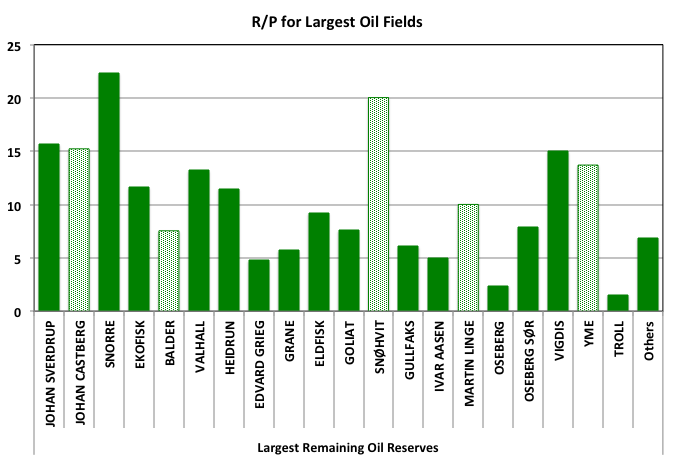
R/P for Johan Sverdrup will drop to around 12 when phase II comes on line, which implies a fairly short design plateau.
Balder was the first field found in the North Sea, in 1966, but was not developed until the late 90s. Its initial development went poorly, with cost and schedule overruns, but reservoir growth has been significant and a large redevelopment is in progress, with a revamped FPSO to be installed in place of the existing one which is now approaching thirty years old (and was originally designed for Asia, a much more benign environment than the North Sea). The redevelopment is also experiencing delay and cost inflation (so far at 38%).
Yme is a relatively old field, previously shut down as uneconomical and now going through its second attempt at a revamp (the first failed because of structural problems with the platform that was installed). Approval has been given for start-up, which is likely to be announced soon. Martin Linge was started up in July this year after some delays and an ownership change during construction.
Johan Castberg has experienced two years’ delay in its development from design and welding problems and Covid and will start in late 2024 with 200kboed design throughput. Not shown is the the Breideblikk field, which was not in development when the last reservoir estimates were issued and is due to start in early 2024 at around 80kboed, but will be dependent on the available production capacity of the Grane platform to which Breideblikk is being connected via subsea wells and flowlines.
It is notable how many of the mature giant fields still appear in the top twenty list (e.g. Gullfaks, Ekofisk, Oseberg, Snorre).
With these new fields and other, smaller start-ups (Rolsvnes in August this year, Nova, Fenja and Frosk next year, Dvalin condensate at some point) Norwegian production will rise significantly over the next two years. However, without new discoveries the backlog for new development gets a bit sparse subsequently (see below and previous post for comments on how exploration success rates have been falling).
The last remaining resource discovery large enough to support a stand alone development is Wisting, which is currently in FEED with FID expected in late 2022. It is in the Barents where most projects have had problems in development (e.g. Johan Castberg) or with operational failures (e.g. Snøhvit, Goliat).
Natural Gas
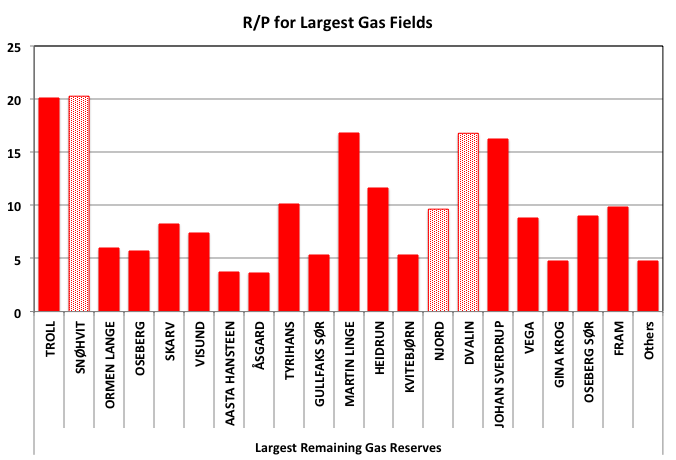
Snøhvit has been shut down because of a fire since September 2020, so its expected production has been taken as the average of 2018 and 2019. Dvalin was nominally started up in 2020 but has barely produced any gas (see above) so its production has been taken as its design capacity, allowing for some downtime. Similarly Njord is a redevelopment project and has no applicable production data so its design capacity has been used.
Wellbores
In the chart below the left hand axis shows wells drilled (dry tree and subsea are stacked) and the right hand axis shows the wells active at the end of the year (not stacked).
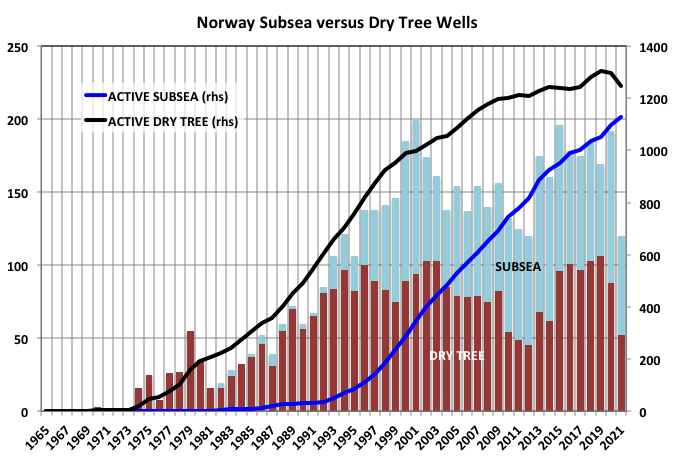
Subsea development well drilling really started in the 1990s, before that most wells were drilled from rigs on large platforms with integrated drilling, wellhead, production and accommodation systems, which extracted oil and gas from giant fields.
On average subsea wells have a shorter life than platform wells, where it is easier and cheaper to conduct work over activities and which will access larger reservoirs on average, as a significant proportion of subsea wells will be tiebacks. For Norway to date, for plugged wells, the difference is striking with dry tree wells lasting 10.8 years and subsea wells only 6.2, which may explain, in part, the increasing pace of drilling in recent rears
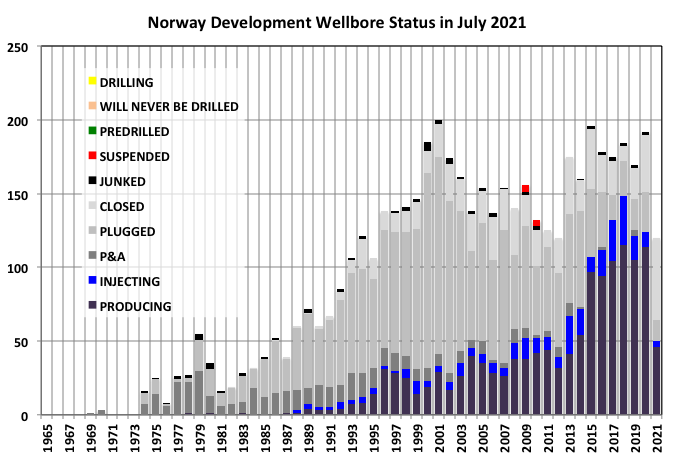
This chart shows the current status of the development wells that were originally completed in the year shown. There are large numbers of plugged but not yet abandoned wells. I don’t know if these could easily be recompleted if the oil price increased enough to make them economic or if they are just waiting for the right resources or timing before they are finally abandoned. A rising proportion of the most recent wells are likely to be shorter life subsea tie-ins as shown in the previous chart.
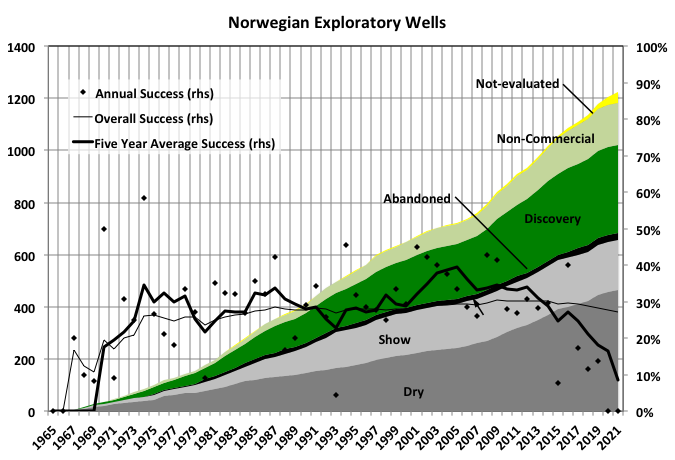
The success ratio is the proportion of all the exploration wells drilled that produce economically viable discoveries. This was fairly constant at around 30% until 2010, but has been steadily falling since, and if the trend continues will reach zero before 2030. It is not quite as bad as it looks as some, but probably a lot less than half, of the “not-evaluated” finds will become discoveries. The chart illustrates why just quoting dry hole numbers can be misleading, wells may also indicate “shows” (i.e. there may have been resources there once but they have escaped) or non-commercial quantities, which will not be known without some initial conceptual design and which may depend on oil price, though often there will be an obvious limit imposed by a low EROI (although in the analyses it will be couched in economic rather than energy terms).
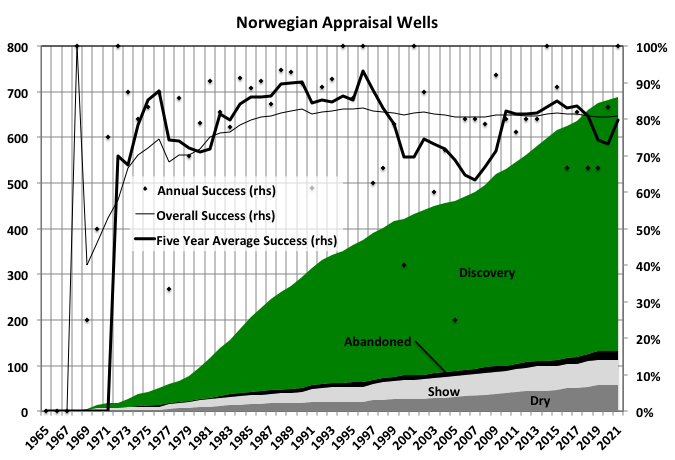
Success rates for appraisal wells average around 80%, which is what would be expected: much higher and it wouldn’t be worth doing the appraisal, much lower and the geologists and reservoir engineers wouldn’t be doing their jobs properly.
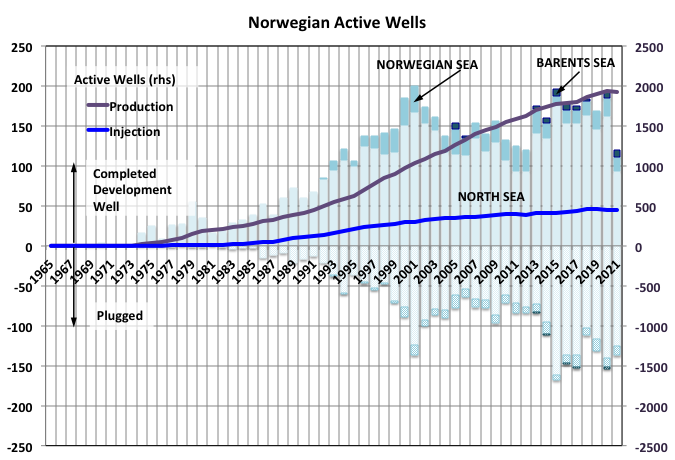
It appears that the number of active wells has peaked or at least plateaued in the last two or three years. P&A activity really picked up starting around 2015, possibly stimulated by the price crash, which may have pushed some marginal wells into being non-economic, however 2021 has shown another jump, in the first half at least, despite the price rises seen so far.
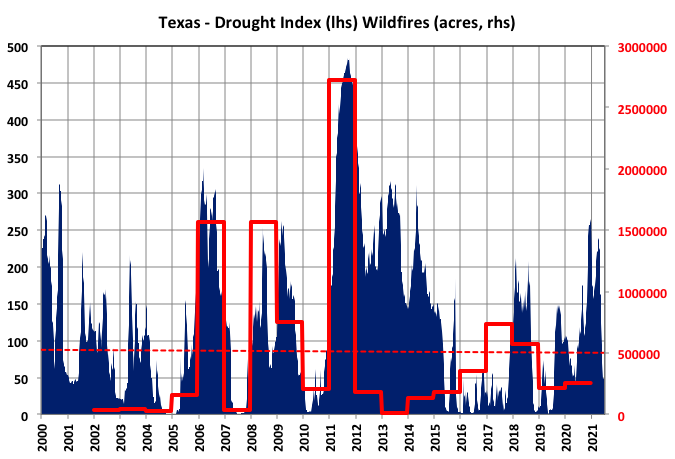
Off-topic Finish: Western USA, Temperatures, Drought and Wildfires
Wildfires and droughts in western USA have been mainstream news for several years now and have generally been linked to a warming climate. There is a lot of good data available now but wildfire coverage only goes back twenty years.
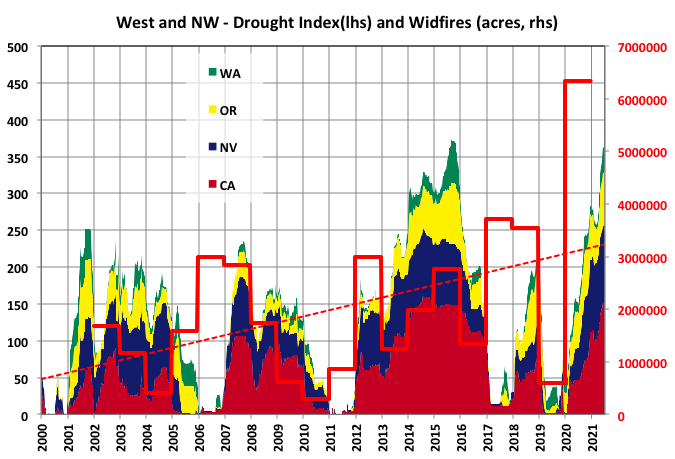
For the data below wildfire numbers are from the National Interagency Fire Center drought data from the US Drought Monitor and temperatures are the twelve-month running average maximum daily temperature from NOAA.
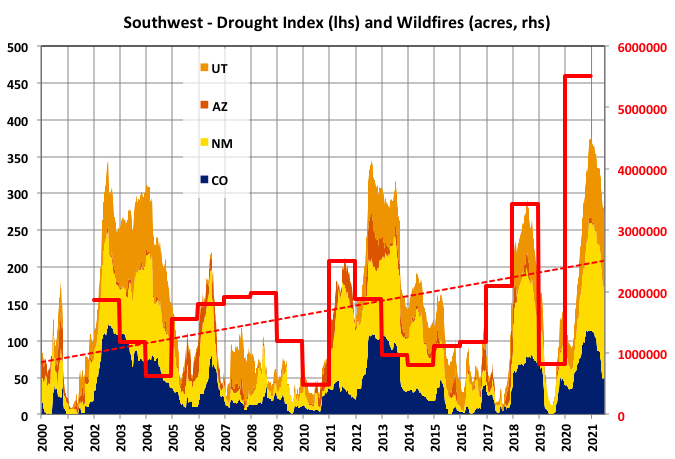
The drought index is the Drought Severity and Coverage Index (DSCI) from the US drought monitor, this is DO (abnormally dry) areas times one, D1 (moderate drought) times two, D2 (severe drought) times three, D3 (extreme drought) times four and D4 (exceptional drought) times five, all divided by the total area so it runs from 0 to a maximum of 500. The index is updated weekly, but the wildfire data is only available as a yearly total.
There is less of a correlation between the drought index and wildfire extent than I had expected. In all areas there can be years with extreme drought but low wildfires and fairly wet years with extensive wildfires. Even changing the weighting given for the different drought categories (dry to exceptional) doesn’t improve things much. However overall the trend is for rising drought and wildfires in the west (California and Nevada), northwest (Washington and Oregon) and southwest (New Mexico, Utah, Arizona and Colorado).
Three of the four droughts in the west since 2020 have lasted four or more years, which may be a concern now as the current one is only in its second year and, so far looks more severe than previous ones.
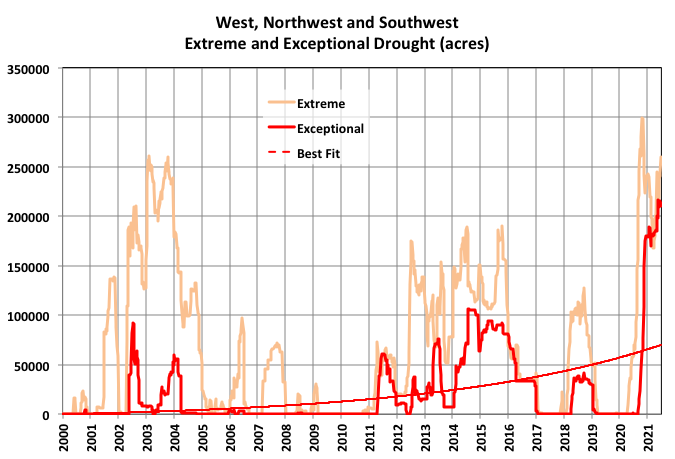
As the mean of a bell curve moves linearly then the marginal events will change exponentially and, although twenty years is not long enough to give clear indications, there are indications that the extreme and, especially, the exceptional drought areas for the west, southwest and northwest areas are starting to show signs of exponential growth, as does the acreage of wildfire coverage (another indicator of extreme response), which are not good signs for the future. This year, so far, would seem to be continuing the exponential trend and may end up the worst year ever in the west. There would then be a better than even chance that each year would be worse than the last. For example if drought and wildfires have got worse by a factor of five with a 0.5C increase in temperature over two decades (an entirely subjective guess) then they will be twenty five times worse by 2040 ( given a steady rate of temperature rise – it will probably accelerate though), which I’d suggest would be entirely unmanageable and render large parts of the areas as unlivable in anything like the current population dnsities, and certainly non-productive as agricultural centres.
Texas had one of the worst combination of droughts and wildfires in2011 but otherwise the is not much of a correlation or noticeable trend in each measurement (I don’t know but it could be that the stochastic effect from hurricane driven precipitation introduces a lot of noise in the data).
Temperatures and Droughts
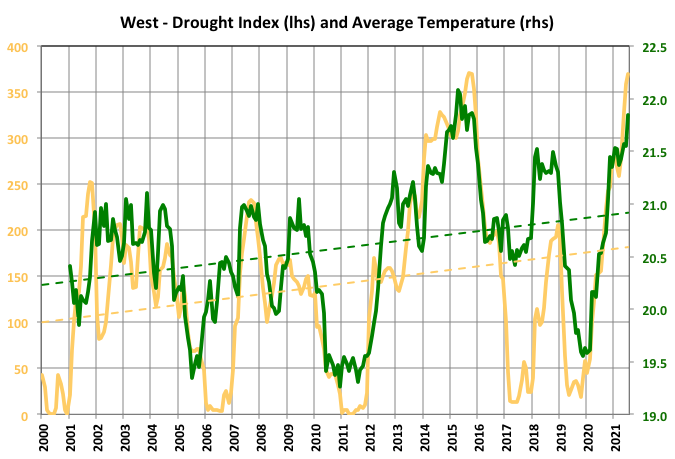
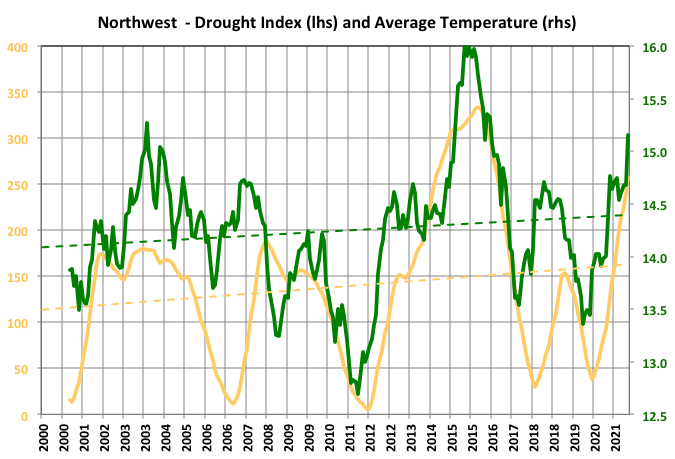
For the west and northwest there is quite strong correlation between temperatures and the DSCI with both rising steadily. The drought index and temperature are both given as monthly updates of a twelve month trailing average. If you take enough averages you can often create correlations out of nothing so treat accordingly, but the annual seasonality has to be taken out of the numbers somehow.
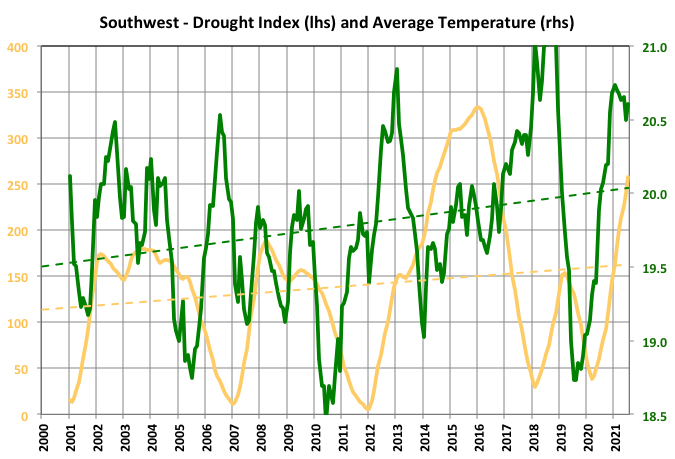
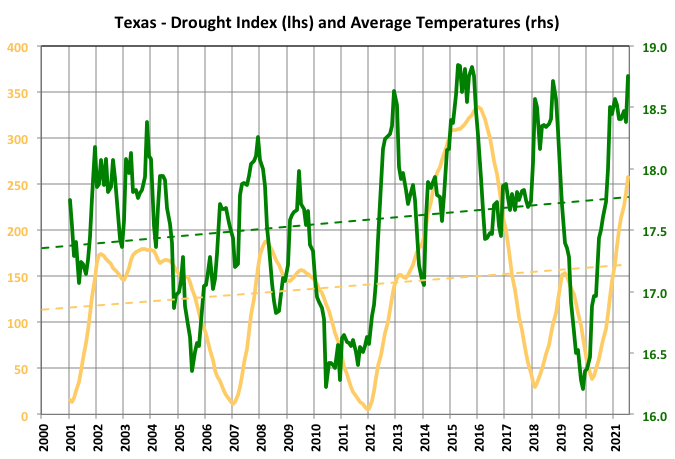
In the southwest temperature and drought are rising but a direct correlation is less clear and in Texas as the average temperature continues to rise it is less clear that there is a trend for drought index.
Here are a few interesting links concerning wildfires:
Radio Ecoshock – This was from 2018, it is amazing how much has changed since, e.g. then the emphasis was on Indonesia and the tropics, now Siberia is the centre of action – larger than all the other fires on earth; then tipping points were possibilities under consideration, now we’ve probably passed a few.
133 responses to “Norway Part II – Production and Wellbores”
At end of previous post’s comments there was mention of most recent rig counts for US.
In the past 12 months the horizontal oil rig count increased by 219 rigs from 178 to 397. The annual rate of increase (using OLS on the weekly data is an annual rate of increase of 213 horizontal oil rigs per year.
I have included a chart that shows what would happen to the rig count if the trend continues, note that the trend is likely to change if history provides any guide to the future. As always the future is not known.
The US horizontal oil rig count was above 600 as recently as March 20, 2020.
Dennis
The supply shortage may lower that slope over the next 6 months and also drive daily rates up as rig demand increases.
Ovi,
Could be, it had no effect over last 6 months and oil prices were lower and DUC counts were higher. We will see.
If rig rates rise less than oil prices then it may still be profitable to keep increasing the rig count.
Dennis
I think there was a rate change starting back in April. Looking at the US oil rigs, I see a definite break in the slope in April. From September 2020 to April 2021, oil rigs were being added at an average rate of close to 5.66 rigs/wk. From April to October the rate dropped to 3.66 rigs/wk. The drop in the weekly rig rate is much more pronounced in the Texas and Permian data.
Note that while you looked at horizontal rigs, my numbers are for all oil rigs.
It might be helpful to chart the changes instead of the total counts.
Alimbiquated,
I looked at delta horiz oil rigs for 12/23/2020 to Oct 22, 2021, the trend was down at o.6 horiz oil rigs per year over that period. That is the slope was decreasing by about half a rig per year, R squared was 0.0019, so probably not a statistically significant result.
Ovi,
The relevant figure is horizontal oil rigs because most of the increase in US output is from tight oil wells drilled with horizontal oil rigs.
Here is US horizontal oil rigs from Dec 23, 2020 to Oct 22, 2021, I don’t see a break in April for this data.
Annual rate of increase based on OLS trend is 188.5 horizontal oil rigs per year.
Ovi,
Looking back at your chart the rate of increase for US oil rigs is 3.66 per week which is 190 oil rigs per year, so about the same as the estimate for horizontal oil rigs over the past 10 months (annual rate of increase of 188.5 horizontal oil rigs per month). Are the lines on your charts ordinary least squares (OLS) linear trends? These are the trendlines which are plotted by spreadsheets when a linear trend is chosen.
Dennis
The main demand for new rigs is in the Permian. That is where a demand change would show up. Attached is a plot for the Permian horizontal oil rigs. I wonder if the directional rigs should also be included since they are also horizontal.
The slopes in my original chart are just a lazy man’s first point, last point average estimate and that is why I say “close to”. The main interest is the slope so I just report the slope
In the attached chart for the Permian I have temporarily moved out of my lazy man mode and added the LS equations. I do not like the way Excel calculates the LS so I do it myself from basics.
I prefer the equation form shown in the chart. Put in zero for X and that should give the constant on the chart where the equation starts. Takes a bit longer and the result is not significantly different than the lazy man’s way.
As you can see, 3.38 rigs/wk down to 1.19 rigs/wk
Ovi,
Clearly when we look at the data there is demand for horizontal rigs in basins besides the Permian basin. Using US horizontal oil rigs from April 9, 2021 to Oct 22, 202, I get an annual increase of 178 rigs per year or 3.43 rigs per week, you get 1.19 rigs per week for the Permian basin, I am surprised by this result, but the fact remains that horizontal oil rigs have increased by 2.2 rigs per week in basins besides the Permian.
Perhaps directional rigs should be included, though on the Permian basin there are very few directional oil rigs.
Dennis
Definitely something to keep tracking.
So when one adds those two rates 2.2 plus 1.19, one gets 3.39 rigs/wk.
Ovi,
That is simply because of rounding errors.
The number I quoted for all US horizontal oil rigs is correct. With no rounding it is 2.24 rigs per week for non-Permian US horizontal oil rigs in the US over the April 9 to Oct 22 period, based on Baker Hughes data.
Dennis,
When I look at the charts, yes it is feasible for the horizontal Rig count to continue to rise. My only question is that without Private equity engaged due to ESG investing as well as many Banks withdrawing from the industry sector for the same reason plus due to some bad years and finally investors in Public companies are demanding dividends over growth, I dont know where the money, labor and equipment will come from to get to the 2020 level.
Maybe I am too skeptical but I feel there has been a shift in this industry. There was so much capital set on fire over the last five years that I dont think the industry will return to business as usual. On paper your chart looks realistic but most CEO’s I know have PTSD from the roller coaster ride from the past 5 years and they are determined to pay down debt, pay dividends. Therefore the continued ramp up in rigs will rise but only modestly.
LTO Survivor,
You no doubt are correct as you have far better insight into the industry than me.
My thinking is that oil companies can finance new wells out of cash flow at current oil prices. I would think a few more months with oil prices at 80 to 90 per barrel or higher might change industry sentiment.
Average WTI oil price was about $50/b from Jan 2015 to Dec 2020. The next 5 years oil prices are likely to be $80/bo at minimum (average price over the 5 year period).
Even if rigs grow at half the rate of the past 12 months we will see output increase, especially given the increased earnings that will accrue at $80/bo.
The article below gives a flavor for expected third quarter earnings. We will know more in a week or 2.
https://www.nasdaq.com/articles/excitement-builds-as-big-oil-prepares-to-release-earnings-2021-10-20
LTO Survivor
Are there many companies that make new rigs? Are they also facing parts shortage issues. What is the delivery time gap from Order to Delivery?
Ovi, it would be my guess that there would still be hundreds of rigs sitting idle in storage yards. I doubt that there would be any new rigs needed for a couple of years yet. Perhaps not even then if things slow down.
Ron
I wonder if these older rigs are up to today’s requirements. I have read that the latest rigs are more powerful to get the days down. Also they are more mobile and controllable remotely.
Ovi,
The rigs worked fine in 2019/2020, most of these have been stacked and probably most can be put back into service, some of the oldest rigs may need to be upgraded, but there is plently of idle equipment. Shortages are mostly in steel tubing and labor, perhaps new pumping equipment is also a problem (I think shallow sand may have referred to this recently). No doubt there is much that I am not aware of, as oil pros often point out. I will let them fill in what I have missed.
LTO Survivor,
Permian horizontal oil rigs have increased at about 60 rigs per year during the April to October period, that would take Permian rigs to about 307 by Oct 22, 2022 and to 367 by October 2023 (if that rate continued for the next 24 months). If WTI remained at $85/bo, perhaps the horizontal rig count might continue to increase. Can you define a “modest increase in rig count”? Maybe 30 rigs per year?
George
In the previous post it was stated:
Thanks for the replies. I think some of the overall EROI has to be from the original construction of the plant, and the EROI of the gas used has to be included, which is why the chande mentioned in the paper is of interest, and any raw bitumen exported to refineries has to have additional energy used in processing.
It is not clear to me why original energy in constructing the plant would be used in calculating today’s EROI. If a new plant were being built today, add it in. I guess it depends on which way an analyst would want to bias the result.
What is more relevant today is the marginal EROI of an oil operation. As companies make improvements, it is the marginal EROI that determines whether their operations are moving in the right direction.
Drawing the system boundaries to determine EROI is difficult; Charles Hall had a couple of chapters on it in his book. However the main aim of the analyses are intended to find how much energy is available to society. Therefore for an oil field all the energy that would have been available to society had the field not been developed needs to be summed over the full lifetime and compared to the amount of energy finally available (e.g. at the forecourt). I think Hall gave an example something like including the energy use to produce that proportion of food used by the worker who produced the car that the site manager used to drive to the field when the production facilities are being built. The 1.5 to 2 EROI estimates would only be achieved by taking the widest of envelopes.
Of course just looking at current EORI has its uses as well as sunk costs are of no interest for the future.
Does this answer the question? I find a lot can be lost in the shorthand of blog comments, there’s a kind of history of previous comments that isn’t neccessarily shared by all parties involved in an exchange.
George
Yes it does put it in perspective.
In looking at that French paper posted in the previous post a little more closely, I noticed that one graph had the EROI of the oilsands at 5 from 1950 to 2014. Oilsands production only became serious around 1980 when Sunoco took a serious look at them and found an economic way to make synthetic crude. Before that it was mostly lab research. I think the EROI drops after 2010 as more SAGD projects started. There are only three companies with open pit mines Suncor, Esso (Cdn Exxon) and Canadian Natural Resources.
In checking the CNR site I found the reference to parafinic process I made in an earlier reply.
“Canadian Natural’s oil sands mining portfolio includes its 70% operated working interest in the AOSP mines and 70% non-operated interest in the Scotford Upgrader, located north of Edmonton. Combined, the two mines at the AOSP produce diluted bitumen via a paraffinic froth treatment process.” Not sure if this is part of the hot water process or totally different. Maybe you could clarify.
Thanks for the update George, a lot of interesting stuff!
Regarding the snövit outage, would anyone venture a guess on impact on nat gas prices in Europe?
Does not seem to be a major source, but when you´re close to peak demand/supply even marginal supply affects price, and often in a disproportionate way from what I´ve learned.
Have also been following water levels and fires in CA, as well as tropical cyclones in the atlantic etc. from afar, so interesting read there as well! I guess the Internet is both a blessing and a curse…
About wild fires: to get big and nasty they need the components fuel, heat and wind.
I think you can have the right combination even in a relative wet year. But for records you need all 3 at the max.
I have read somewhere that the old natives didn’t settle in some fire prone regions – these fires have been there always.
There is even fire vegetation – plant that grow only after a fire.
It would imagine that as temps and precip changes the forest veg in Cali will adjust to being more like that found in Mexico, and the forest veg of BC will adjust to be more like that in Cali. You get the idea. Lots of burn off and, over time, regen with new species.
Its basically relative desertification you are describing and the process is well beyond the early stages.
I have studied plant geography at the university level, and rambled far and wide for decades in the west. It doesn’t take a very experienced eye to see the shift in vegetation in so many places. Dry forest/grassland going to chaparral, wet forest going to dry forest, etc.
It s a widespread browning process, with gradually drying soils and certain increase in flammability.
But this Sunday Calif is going to get a serious dumping of rain in many locations of the the northern half. Newsworthy. Mark it in the books.
Interesting times for plant geography. Thanks for the tip!
Here’s a story on the pending rains.
https://weatherwest.com/archives/11466
There are other ways of getting rid of carbon. For example termites eat a lot of wood. fungus and beetles also do a lot of work.
But fire kills termite. So maybe the termite dominate when there are relatively few fires, but when people start fires all the time, the termites are squeezed out and fire takes over.
Another issue is logging. Old trees, and thus long undisturbed forests, grow less quickly than young forests. Loggers cut trees before they get too old, because growth rates slow. So the rate at which forests accumulate carbon depends on how mature they are.
The fact that fire vegetation exists doesn’t really show that there have always been a lot of forest fires — just that there have always been some. There are plenty of marginal species in any ecosystem.
Someone asked in the previous thread what percent of oil is used by the oil industry itself. Here is one number:
Their research found that 15.5% – more than a tenth – of the energy produced from oil worldwide is already necessary to keep producing all the oil.
https://bylinetimes.com/2021/10/20/oil-system-collapsing-so-fast-it-may-derail-renewables-warn-french-government-scientists/
It’s not clear whether that is just production or production and distribution. Also I would have said “nearly one barrel in six” not more than a tenth.
Anyway, they claim that the shift from conventional oil to shale, deepwater and tar sands is reducing the EROI significantly.
George your reports are always so very well done, and this no exception. I learn a lot about how things work just reading your comments. Many thanks.
The National intelligence Council of the US Fed government has just issued a report with a lot of observations about energy, including oil, prospects out to 2040. The focus is on issues affecting national security and on climate change. Very interesting reading, and solid observations/projections in my eyes.
‘Climate Change and International Responses Increasing Challenges to US National Security Through 2040’
for your reading pleasure-
https://www.dni.gov/files/ODNI/documents/assessments/NIE_Climate_Change_and_National_Security.pdf?mkt_tok=NjU5LVdaWC0wNzUAAAGASC-XlUWakh8_kVkegnrDxVl42rZEQgS433Z5l5TqdvaNFuVlRA6XgytIF4SWOylei5FFXqiY8Acio6CmEXtezLHu65OFMjskRnVC-29f
Praise indeed, thanks. I’ll look at the report with interest. Something that may be similar by the sound of it is from Chatham House (so leaning towards UK/EU) is: https://www.chathamhouse.org/2021/09/climate-change-risk-assessment-2021
The impacts from climate change will be mitigated by harnessing the potential of privately funded technological and scientific innovations, not by reading drivel published by clueless bureaucrats.
Nightlight, no one is claiming that reading anything will mitigate anything. But without the full cooperation of world governments, nothing will ever get done. But for sure privately funded technologies will not do a damn thing. Private money is only interested in private profit.
Your post does not read like someone who wishes to post constructive criticism, but a government-hating cynic. You should familiarize yourself with the National Intelligence Council before you call them “clueless bureaucrats”. They are anything but.
”Private money is only interested in private profit.” Perhaps. Their future private profits will be to preserve their business. In a world where countries GDP will decrease because there is no more oil to run the machines, I think that private money will accept to pay more taxes to pay for local energetic transitions and maintain economic activities. Because, otherwise, there will be no more economlc activities and private money will dye.
I can’t seem to find it now but I remember a cartoon where a CEO was telling his underlings something like this:
“Our research indicates civilization will collapse but also indicates there are considerable profits to be made in pre-collapse adventures.”
If you really think that private companies, not just fossil fuel companies, and their suppliers, will put the environment over profits, you are seriously mistaken. Shareholders demand profits and the vast majority of them are climate change deniers anyway.
http://www.derekchristensen.com/wp-content/uploads/2014/12/shareholdervalue.jpg
Or this.
I didn’t say that they will put the environment over profits. The point is, if they don’t participate in the global effort to mitigate climate change and solve the problem of energy shortages by agreeing to cut their profits by paying their taxes properly, states will have no money to carry out energy transition and they will disappear in the chaos induced by climate change and in the economic depression caused by oil shortages. Thus, if they are rational, it is in their interest to think in this way, not in short-term profits. In France, private owners of business and business executives are increasingly interested in the topic of increasing energy restrictions due to the declining oil and gas supply in Europe because they want their business survive this.
Nice one George,
About Johan Sverdrup, phase one production capacity was increased in two phases and its now actually producing 535.000 boepd and phase two has also been increased to about 755.000 boepd. Worth mentioning is perhaps also that the field is currently running an opex of about $2/barrel.
About Edvard Grieg i saw it had a r/p of 5, field came online in 2015 and was expected to remain on plateau until mid 2018 before starting its decline, expected water break through don’t happen sofar and field is still on plateau and reserves have been written up. Production is actually going to be increasing in the near future as production is now limited by platform capacity that is shared with the Aker bp Ivar Aasen, as Ivar Aasen now starts to decline more platform capacity will be available for Edvard grieg witch have higher capacity in wells but has until now been limited by capacity sharing. As more capacity now becomes available Edvard Grieg will be able to increase production. The new higher plateau should last about 3 more years, then there is a number of tie backs from close discoveries that will hold that higher plateau until at least 2026 i expect.
So for this field production wont drop of as fast as current r/p might indicate. Im pretty sure there will be other write ups of the original field reserves also.
Great post George, thank you!
Thanks for he feedback. For the R/P calcs I made some allowance for the plant availabilty over the year rather than just using the nominal nameplate (e.g. 95%) – I don’t know if this may explain some of the figures better.
Do you get the impression that Johan Sverdrup has been built for a shorter life cycle than would have been in the past for a field this size (maybe for fear of stranded asset issues)? Or it may be they’ve learnt from previous projects where it was found that you could initially produce a lot more than the nominal design capacity, and economically it makes sense to front load production.
George,
No in this case it is simple debottlenecking of the process facilities that has taken place, wells had higher capacity than facilities original design specs. But as you say there is economy in producing more early, that said this field will be produced very responsible and i expect over 80% of resources will be produced over entire field life, i also expect the fields total resources to grow with time compared to official figures today.
Field will probably produce for 30-40 years, it was a truly unique find, that size and that quality in a very mature area.
Saudi Arabia commits to net zero emissions by 2060
The world’s biggest oil exporter, Saudi Arabia, has pledged to cut its carbon emissions to net zero by 2060.
Crown Prince Mohammed bin Salman said the Gulf state would invest more than $180bn (£130bn) to reach the goal.
But he said the kingdom would continue to produce oil for decades to come.
Yeah maybe they’ll be out of oil by then.
Gonna need way more oil rig theme parks to offset that oil dividend loss.
Saudi Arabia has plans to build a futuristic city dubbed The Line. Because the shape of the city is a 120 mile long straight line. All the transportation is to be done underneath the city and it’s all electric as I remember.
When Saudi oil production rolls over instead of building mega futuristic city’s they will be using all those built up US dollar reserves just to keep food on the table for a little while longer
There is a lot of things that countries say the are going to do. But then there is a disconnect between what they think they are going to do and what reality dictates they are going to do.
In my opinion, Saudi Arabia has at least four big problems:
1. Theocratic government.
2. Entitled population.
3. High birth rate.
4. Lack of water.
Number 1, 2, and 3 are cultural and can change in a hurry, while number 4 will force things.
Cave Men with Rolexes.
Others may be:
Maximum daytime temperatures that may soon become unliveable.
Shiite vs sunni strife and conflict with Iran.
Various elite factions that are getting fed up with MbS.
MbS himself.
Reliance on a huge migrant workforce for the basic day to day services (and in the armed forces I think).
An unwinnable war in Yemen, and its legacy of disaffection.
I’ve posted this before, but Western Saudi Arabia doesn’t actually lack water. Quite the contrary.
https://www.youtube.com/watch?v=Sw0JFK0r3F4&ab_channel=AbdelwahabAlshawwaf
A year later:
https://www.youtube.com/watch?v=JLVlc3fETrk&ab_channel=ShuqFaqat
The solution the Saudi government has come up with is to build huge aqueducts to move fresh water into the Red Sea as quickly as possible.
https://html.scirp.org/file/82777×12.png
At the same time, they are burning diesel to distill seawater from the Red Sea into fresh water as quickly as possible.
http://www.sawaco.com/
Not a great plan.
Another idea is this:
https://www.youtube.com/watch?v=T39QHprz-x8
At the same time, they are burning diesel to distill seawater from the Red Sea into fresh water as quickly as possible.
No, they never burn refined fuel in their boilers, well except naptha, on rare occasions, to desalinate water. They either burn natural gas or crude oil.
Everybody seems to be screaming inflation. Price action on dollar index is bullish. Points to a move back to 99.00-100.00 range.
Which is a sign of not enough dollar liquidity. Which FED is fixing to compound that issue. Buy tightening monetary policy.
I see the supply side issues just like everyone else. But high prices are running into not enough dollars. Banks are record long safe liquid assets. US treasuries. Banks just aren’t going to do inflationary money like the did in the 70’s. They’d bankrupt themselves as all them bonds lost value.
Something big breaks in next 12-18 months. If inflation continues. Or deflation wins out and prices go back down. Due lack of dollar creation to push prices higher.
If the later happens oil prices come back down and oil production stays flat or down.
Are there really that much $ needed for a high oil price in the current enviroment?
Oil producer countries have all tight balances – so the billion $ they get for the oil get dashed out in short time again, covering their basic needs.
SA needs 80-90$ oil to even out, Iraq is even higher as far as I know. So the oil money won’t pile up there this time, but come back to the international pool fast.
You can create inflation with little money but high volocity – or deflation with much money but everyone hoarding it.
So I really don’t know – looking at the $ volume alone isn’t enough.
But I’m with you – I think something will break in the next 12 months. And in my opiniona it will this winter – depending if the energy crisis will worsen or not, depending on the weather.
What’s important now – China has stopped exporting magnesium. Without magnesium, plane, car an truck production will come to a halt. Magnesium is a plentiful mineral, but 90% of smelting is done in China due to low energy prices and high waste tolerance.
https://www.ft.com/content/100d4fea-d626-415d-b314-7f06a094cc42
The articles say Europe, but I think this will spill to the USA, too.
No natural gas for plastic no magnesium for aluminum mean no EV’s get produced in Europe. Forget about the chips needed .
Large disconnect between what everyone expects to happen and what will actually happen.
It’s not even clear that all this coal China is importing at any cost is going to make a big difference or not. They only import around 6% of what they use. The problem is clearly supply at home not imports.
China is also selling US debt to get US dollars btw. Means they don’t have enough dollars.
Thanks George K.!
The natural gas outlook in Norway is undoubtedly more bleak than the oil outlook. That is from current production levels. Looking at the whole picture, oil production hit a peak around year 2000 while gas hit a peak more delayed around 2017. Speaking about oil, around 2000 the oil price was too low and the expansion of production in the North Sea was contributing to that. So it no surprise that the O&G industry put on the breaks back then, given that offshore O&G is more expensive than onshore. After that it seems that a significantly lower plateau production for oil is actually maintained from let’s say 2012 to now, and probably throughout this decade. Gas is more of a problem and will come down from the top. Troll with the phase 3 build out will maintain plateau production for another 5-7 years Equinor says, and the whole gas infrastructure in Norway will last to after 2050 based on the Troll field alone.
Looking at the future, Equinor is focusing exploration around Castberg, Wisting, Goliat and Snøhvit. The three first are oil and two of them in the Barents sea. Snøhvit is LNG and sensibly more exploration around this area and also to preserve the resource over time is a priority. The pipeline to shore is already built, 143 km, so additional resources are more cost efficient. As it currently stand, there are more activity to uphold oil production in Norway at least this decade and spilling over into the 2030s. The question is more how high oil & gas prices will play in going forward. Maybe more gas/condensate projects will be considered. Almost certainly the high current gas prices will spur more activity. Btw. the Dvalin gas field is expected to come online 2H 2022 according to Wintershall, with Dvalin north around 100 mil barrels of oil equivalents (with a high uncertainty range). I don’t know how much of the Dvalin field that is condensate, rich gas etc.
Thanks for the info. From the NPD figures Dvalin is 2 – 3% liquids, but I notice it is shown as oil, not condensate or NGL. I am not sure what that implies – an oil rim?
Are you saying there is exploration for gas at Snohvit? According to Baker-Hughes there hasn’t been a gas rig drilling in the Norwegian area since 2013, which seems a bit suspicious. I know there are other gas discoveries there that can be developed as the main field declines.
Are not all four of the fields you mentioned in the Barents? Albeit Snohvit is quite south.
Fair questions.
Castberg is way south west in the Barents sea as it is defined, 100 km from Snohvit by looking it up. I was a bit unprecise, so it is good that someone corrects me. The weather is milder there compared to more east, so better for natural gas.
As for exploration around Snohvit, it was an official comment from Equinor. So they are in fact going to explore there most likely. Which makes sense given the infrastructure in place.
When it comes to Dvalin North Wintershall released the following, which doesn’t make it any clearer:
Wintershall Dea discovers significant hydrocarbons at Dvalin North
May 20, 2021
Wintershall Dea Norge AS found significant gas, condensate, and oil at the Dvalin North prospect in the Haltenbanken area of the Norwegian Sea and will consider a tieback to the operated Dvalin field.
OGJ editors
Thanks Kolbeinih and Baggen , priceless information .
Depending on exactly where WTI price closes today. You’ll get a set up that can be shorted. Looks like a shooting star in over bought territory. RSI negative divergences.
Pull back should come. But must see where close is first.
Settled unchanged at $83,76. Now what?
I shorted the crap out of WTI. Might not be a long term trade. I set stop loss above todays high and I plan to let it run until some support shows up then I take profits.
I have enough technical evidence to take a short here. I’ve been trading 2 1/2 decades.
And oil isn’t the only thing that is overbought and looking at the very least primed for a pullback. Notice I’m not saying oil is heading into a bear market. Yen crosses are also pointing to a pullback which would mean treasuries are likely oversold and yields will likely correct lower.
A pause in the inflationary trend is what I’m seeing and saying.
Russian September output up 290 kb/d. Not sure where they are relative to their OPEC plus allocation.
Ovi, is the difference between EIA and Russia Ministry numbers due to counting different things?
Frugal,
The difference is likely due to different ways of counting condensate. Most nations include all pentanes plus in their condensate estimates. The US for reasons of history (I think) count only lease condensate in crude plus condensate estimates and pentanes plus that extracted in natural gas processing plants are counted as part of NGL (though the two products are identical from a chemical perspective).
In my opinion Russia (and Cannada) do this correctly, the US undercounts C plus C due to its strange methodology.
For reference pentanes plus output for the US from natural gas processing plants was 637 kb/d in July 2021. It looks like the data in the chart gives about 400 kb/d for Russia in Sept 2021.
Frugal
EIA arbitrarily deducts 400 kb/d from the Russian numbers. I think it is their rough estimate of the condensate that comes out of NG wells. It’s the only thing I can think of since it is the same every month.
Since January 2018 the difference between the EIA’s estimate and that of the Russian Oil Minister has been exactly 404 thousand barrels per day. Now how could it be exactly 404K barrels per day if they were counting condensate, or anything else, differently? Forty-two months straight and it never varied by even one barrel, always exactly 404K barrels per day. Nothing comes out that close.
I have no idea why the EIA just subtracted 404K barrels per day from the Russian Minister’s data, but I don’t think it was because of a different way of counting anything.
Note. From January 2013 through December 2017 the difference varied from a high of 598K barrels per day to a low of 281K barrels per day. They were obviously measuring something, then they just stopped. Then in January 2018, the difference was 404K barrels per day with no variance. I think they were, at first, measuring something then just got lazy. I think they are just guessing, but why I have no idea.
US tight oil output official estimates are out for Sept, US total was 7410 kb/d in September, Permian was 4255 kb/d. US output up by 245 kb/d over past 6 months (march to september 2021) and Permian output up by 251 kb/d. Chart below has OLS trendlines for US (top line), Permian and non-Permian (lowest line), slopes are 433 kb/d per year, 517 kb/d per year, and -84 kb/d per year respectively.
Dennis, my favorite poster.
Phantom is absolutely obliterated.
https://i.ibb.co/wrdPV83/619-F2-FDD-FE2-D-40-F1-868-B-18-CC61936-BF8.png
EIA data is becoming increasingly out of whack with the state level data showing collapse. RRC shows Texas production falling this year while EIA shows a large increase.
The EIA definition of oil production is “The amount of such production for a given period is measured as volumes delivered from lease storage tanks (i.e., the point of custody transfer) to pipelines, trucks, or other media for transport to refineries or terminals with adjustments for (1) net differences between opening and closing lease inventories, and (2) basic sediment and water (BS&W).”. EIA is counting storage tanks not production.
Recent data from EIA, RRC and Enverus (formerly drillinginfo) for Texas at link below (see TX tab in spreadsheet called “comparison with other estimates”)
https://www.eia.gov/petroleum/production/
Over the Jan 2020 to March 2020 period the EIA estimates for Texas C plus C were about 0.6% higher than the Enverus estimates and 1% higher than RRC estimates. The RRC often has revisions to data as late reports get filed and corrected going back at least 12 months and sometimes up to 18 months.
Sam does not seem to understand that the storage tanks at leases get filled from production, they hold the oil temporarily until the oil gets moved to trucks and/or pipelines.
EIA has always reported oil production in this way, the data is not perfect, but it is pretty good.
The EIA aslo does a 914 survey of the largest oil producers that account for 90% to 95% of all oil production in Texas, then based on historical data they estimate output, this is done because particularly in Texas the data from the past 6 months or so reported by the RRC is not very good, Texas has hundreds of thousands of wells to keep track of, not an easy task.
One issue this blog doesn’t address at all is biofuel. It costs 10mwh to make a ton of corn. It takes a ton to turn 20api WCS to 2mwh light oil for diesel, then that stabilizes 5x more heavy products. If the economy ran on heavy oil alone, used to produce ethanol, it would fail.
Currently there is a biodiesel shortage because lowering crude api and high growth in Canada and Iraq is increasing demand. Eia does not even track biodiesel inventory.
Another thing is diesel generators. America has 2 million trucks running 50k miles per year at 5mpg. That’s 1m bpd diesel. Only 20% of diesel consumption is accounted by trucks and the rest is these diesel generators in oil and agriculture nobody talks about.
Sam , the sum of both your posts is a word called “Logic ” . Apparently that seems to be in short supply worldwide . Thanks for broaching areas that have not been discussed here earlier .
The EIA’s Monthly Energy Review is out. The data of the chart below is through September 2021. They have production down 126K barrels per day in August and down 475K barrels per day in September. This was because of the hurricane. However, those two months are only estimates based on the weekly estimates. Those estimates are almost always wrong. I think when the final data comes out you will find production was down a lot more than that.
Anyway, US production was not going gangbusters even before the hurricane.
Ron
The October STEO has August output coming in at 11,058 kb/d, 123 kb/d lower than the MER. Sounds like you are betting on the STEO. September is 10,563 kb/d.
No, I completely forgot what the STEO had to say. I was just betting that the hurricane hit was a lot worse than the MER had it to be.
Interesting to note today that Stephen Schwarzman who has sold off all of his exploration and production energy platforms now says we are going to run short of energy because there is no new capital to “drill holes”. I was on the front line with these characters who pivoted quickly to ESG investing so they could raise more capital to earn their 2% management fee. Their pivot to green energy is the next scam Wall Street will inflict on our economy. They are in part responsible for starving the industry from precious capital for reserve replacement. Fink at Blackrock is saying the same thing as they dumped fossil investments as quickly as possible over the past few years. It is stunning that endowment funds, pension funds continue to invest in these know nothing funds.
The Shale industry is the ultimate red queen. I will not be shocked if production stays flat for a while and then plummets even with rising crude oil and gas prices as “quality” inventory depletes rapidly. Pressure depletion never sleeps.
What is with oil investment world wide? All the state owned oil companies, the gulf states, Russia and the asian producer should be somewhat independend of the US and European green do gooders?
But they are under invested at the moment, too – only the Russians I don’t know. In all other oil states the CAPEX hase done a nose dip the last years.
Or are the big oil companies like Exxon too involved there, and they get too green, too.
There is written “oil crisis” in fat letters all over it – the up and down in oil prices the last 10 years now takes it’s toll.
But only when the US oil production falls too fast, we’ll see 200$ oil and chaos in developing countries. Demand is very unflexible in the short and medium term.
(Then we’ll see more vehicles as I have seen in Bulgaria 15 years ago: Taxis with butan bottles strapped on).
Once again- there are trillions of dollars looking good solid return on investment.
Oil, solar, copper, or whatever.
“China aims to have non-fossil energy consumption exceed 80% of its total mix by 2060”
Well, I’ve got some tough news for China, and all the other countries who will be competing with it for energy imports over the next 4 decades.
If they don’t move that 80% goal up to about 2040, then they are going to be very short on energy-
making this current shortfall in coal look like childs play in comparison.
The effect of that energy shortfall will ripple through the world in very disruptive ways.
And over a 100 other countries will be facing the same challenge, but with much less competitive muscle.
Shale gas well video FWIW:
https://www.youtube.com/watch?v=zDxoGqpU5wA
The “lower for longer” narrative for oil prices has suddenly turned to “higher for longer”, which are just as worthless. Oil supply-demand-price dynamics are inherently unstable. A particular element contributing to this is the inelasticity of oil demand. This means high prices are needed to dampen demand but also that relatively small changes in demand can have very large impacts on price (e.g. a 5% demand drop for Covid has momentary 50 to 100+% effect on prices). The most likely next demand impact will be from a recession, maybe caused by prolonged fuel shortages, but recession seem impossible to predict. Pundits who achieve the feat get lauded for a few years but don’t seem to be able to repeat it so I think luck plays a big part.
Another destabilizing effect is the long led times between discoveries and production. In the past when the belief was that growth of wealth and oil use would grow for ever investors were prepared to bet on this long term cycle to some extent even as oil prices cycled through highs and lows. Now that seems to have changed, so rather than this destabilizing things it may be acting as a damper on all activity. It will not be evident one way or another except in retrospect in a few years’ time.
There used to be a negative feedback mechanism that could dampen out some of the price swings, which was OPEC spare capacity that could be increased or decreased to change supply over two to six months. For one reason or another this mechanism is not now available to anything like the same extent. Tight oil has been cited as a possible replacement mechanism but its difficult to see how it has had the same calming influence.
I think we are heading for high volatility, which will tend to militate against long-term investment (probably exacerbated by there being fewer places to invest with low discoveries in the recent years meaning a short inventory of projects ready for development and the few new exploration areas being quite unattractive with high risk, high upfront costs, low EROI). I can see however the argument that we’ll end up in prolonged low prices with society in depression/recession low investment (and what there is ultimately coming from governments rather than private funds, however this is presented for public consumption).
George. Very good post.
The only certainty is volatility.
I recall a long time financial TV talking head stating in 2016 that WTI would never be above $44 again in his lifetime.
No reason to pay attention to these types. They cannot predict oil prices any better than if I do it by throwing darts at a dartboard with different prices taped up on it.
George,
The price of oil was low for a fairly long time (most of the period from 2015 to 2020 (with a brief spike in 2018). I think the higher for longer theme, with some volatility (maybe +/-15% around an average price of $90/bo) is likely to play out from 2022 to 2025.
In general recessions and other shocks cannot be predicted and these will cause random volatility. Oil prices have not been stable for the last 47 years, I do not expect this to change.
Lots of potential for oil demand to be replaced by electric transport. In the US there are at least 3 EVs with range over 238 miles and a base price of around 32500 after the 7500 US tax credit, the cheapest Tesla has a cost of 45000 (no rebates on Teslas) with a range of 260 miles.
The average selling price for new personal vehicles in the US has risen to about 45000 in 2021.
ShallowSand (or LTO) – I don’t know what your experience was but I got the impression OPEC started losing control around 2005 – coincidently or not the year of peak conventional oil. Before that it kept prices around $20, the stated aim was to stop non-conventional oil being developed and taking OPECs market share. I think there was more to it than this but nevertheless it kept prices stable and low, maybe too low – the late 90s had prices below $10 for a time I think, which was pretty devastating to project plans for a few months. After 2005 all sorts of things took off (good for me at the time) with Deep water, oil sands and a bit later LTO. Other things played a part (e.g. I think China demand ahead of the olympics has been given as a reason for the $147 peak) but I know the feeling in the industry was different after 2005 than before, and in retrospect the price crash in 2014 might have been inevitable from then on.
George- ” I can see however the argument that we’ll end up in prolonged low prices with society in depression/recession low investment..”
As I see it, the world could arrive at that scenario by two different paths-
One being a shortage of energy that results in chronic widespread energy poverty and with all the ramifications for economic health that would ensue. For this to play out, there would be a long preceding period of high prices that fails to stimulate enough production to meet demand. We could be entering the early part of that phase now. For this scenario to happen the situation would be one where there was not enough capital to generate supply and not enough prosperity to sustain demand. And not enough transition time or conscious imperative to switch away from the current status of near absolute dependence on fossil fuel.
The second path has very different route cause of poor demand than energy shortage/poverty. Drop in demand would come from economic damage/poverty due to things like financial mismanagement (ala 2009), pandemic (ala 2020), widespread warfare/civil wars or more failed states, cyber sabotage, or other limits to sustained growth.
I don’t know what the likelihood of traveling these paths are, but the risk is not small.
Monetary stimulus or QE is still at full blast $120 billion per month. And growth is decelerating and will continue to decelerate.
Central banks are about to get caught with their pants down. And everyone is going to see it. Economy going to slip into contraction. With QE at full steam and interest rates at near zero.
I’ve thought that the futures market might be another source of instability in the oil price that’s getting worse, but don’t know enough to be sure. When OPEC had more ability to control things just the threat of it acting might have dampened things down but that has largely gone.
Ultimately I think price depends on how dollars are created and destroyed. Right now the majority of dollars in the banking system are created by commercial bank’s. They are liabilities of commercial banks.
Ask yourself how much more credit can be piled onto the record amounts of both corporate and private debt. Think balance sheet recession where corporate and private debts get deleveraged is at our doorstep.
Lack of energy is exactly what triggers it. And it will be up to government spending to bailout the economy. Because FED is at zero bound on interest rates.
Good luck with the needed government spending. That’s about all that can be said.
HHH, the CB’s are approaching their D-Day . Their “transitory inflation ” narrative has failed . This is like the failure of the Maginot Line in France during WW II . Shortly someone is going to shout ” the Emperor has no clothes ” and then the fun starts . Where is my popcorn ? 🙂
They have to keep telling that, otherwise there could be no QE and interrest rate should be at 7%. That’s how you fight an inflation of 5%+.
But nobody could pay that interrest now, so there is no inflation. At least only temporary one.
If interest rates move in any meaningful way. Like 30 year fix mortgage moves from 3% to 5% The underlying collateral goes down in value. Same with bonds. All of which are pledge for loans.
How many entities have pledge collateral to borrow money to go long oil futures? Is a good question. When the trade goes against them they get blown out their positions. And price of oil falls. That is the risk you have to take to be long oil.
When interrest for real estate goes to 5÷ we’ll see an epic real estate crash. Nobody can finance this overpriced stuff at 5÷.
And when this happens, a lehman on crack and meth, we’ll see panic QE.
US banks alone own over 4 trillion in US debt. If the collateral gets revalued lower. It takes banks down.
Central banks are between rock and a hard place. They need inflation to go away ASAP.
HHH , does inflation care what the CB’s think ? After all it is a genie let out of the bottle by them . Unfortunately the genie is now Frankenstein out of control . Watch out .
P.S : I am in agreement with your view point .
The most likely scenario is higher demand and higher prices for all things energy for the next couple decades anyway, as I see it.
Many collapse scenarios can be imagined, but human population peak (and demand peak) is much less likley to happen in the short run.
Excellent points Hickory and George. I gave up oil price predicting years ago. I agree with you both about volatility and I don’t see how this economic growth can continue in spite of the many structural problems in the system but I have given up predicting that as well. I do however agree that the inventory of quality projects not in deep water or other expensive and remote regions is quite limited. The real issue lies in the current state of the oil Majors who have been responsible for generating so many of the worlds larger discoveries over the past 50 years. These companies are being dismantled by activist shareholders and public pressure. Until this onslaught is either reversed or abates, I believe the world will continue to be under supplied with fossil fuels. I may be wrong about this as well but it sure seems to be an impactful shift in the traditional oil&gas exploration industry.
Hickory – I don’t think there’s much doubt we’re heading for a shortage of energy and widespread poverty, it’s just a question of whether it’s 1, 10 ot 50 years. Renewables can’t even replace fossil fuels as of now, they certainly can’t do it while accommadating a growing population, growing aspirations to middle class life styles, the chinese belt and road projects, replacing crumbling infrastructure all over the worlg, the biggest indeustrial project ever seen to take CO2 out of the atmospher and letting Bezusk reach for the stars. I don’t understand how this can support real rising prices (i.e. not hyperinflation) but then the economy seems able to do very strange things that I am by no means the only person not to understand.
George I agree that we are close to entering a phase of contraction- of global population, of energy supply, and of ‘real’ economic measure. We are deep into population overshoot not just based on energy but also in many other ways.
The big questions, in addition to timeframe as you mentioned, also revolve around the rate of decline and the manner in which people, regions and nations will manage themselves.
The big aspect of this new unfolding period of peak energy and population, and then decline, is how certain regions will do so much better than others, partly based on the [mis]fortunes of geography and partly based on decision making.
Nothing new in that regard, but the now emerging issues are nothing like the past millennia. Just how does a culture manage contraction in anything like an orderly and civil manner? My base assumption is that none do. Heck, we generally don’t even manage ourselves in an orderly and civil manner when the times are good (stable or growing economic scenario).
Regarding perpetuals (renewables if you must), I’d sure as hell prefer to live in a region that went whole hog on deploying the various energy capture systems at scale [solar, hydro, wind,geoth] rather than one that didn’t. Thats not a complicated notion, but many people somehow don’t seem to understand it. It shouldn’t be expected to ‘save the world’, but it could make a world of difference in your (everyones) particular region.
Nice post, Mr. Kaplan.
I see corporations and institutions making PR hay over divesting from fossils and reducing CO2 output; governments making a show of combating CO2 with regulation and investment in RE; vehicle manufacturers switching to all electric platforms; and of course suppliers being punished for their overly enthusiastic promises of LTO riches.
The net effect of which is the shorting of investment in fossils right when we need them to make the transition. It is a train wreck right into Tom Murphy’s Energy Trap.
https://dothemath.ucsd.edu/2011/10/the-energy-trap/
I wonder how much the concentration of wealth in fewer hands is affecting investment? Is there a point where they start concentrating on protecting whaat they have instead of looking for new opportunities? Or lose interest in the earth and look to the stars instead?
I think Tom Murphy, Tim Watkins and Tom Morgan, maybe with a bit of Alice Friedermann) cover the aspects of energy/economics/environment that we face as well as any.
Yep, EnergySkeptic.com is a morning stop for me.
The taxation of unreasonable wealth is going to take up speed a lot of places. Property tax, progressive income taxes etc. Even in China there is a clamp down on private wealth. The wealthy goes in protection mode, but they have to yield to public pressure. That is, if income inequality is too big. It is much more pleasant to be rich if everybody are getting more prosperous.
The investments are probably going to be more defensive for a part, combined with the most popular “party as long as it lasts” investments available. Ride the positive sentiment. The split between the two is unknown.
I have been partying since 2005 when Colin Campbell called peak. Another 15 years would be nice but this time I think the games up.
COP 26 is being held in Glasgow . The world’s largest producer of FF energy , Russia and the world’s largest consumer of FF energy China are absent . What a joke . 🙂
On the idea that fossil fuels will become “expensive”, I looked back at history for fossil fuel prices using BP data. Note that I assume when people believe that we will be short on fossil fuels that they may also think that fossil fuel will become more expensive. Here I look at expense as a function of income where it is assumed that output (GDP) is roughly equal to income at the World level.
Only a complete data set for oil, gas, and coal is available from 1987 to 2020. For oil we have prices back to 1861, but I used oil data from 1974 to 2019, for gas we have data from 1984, but I assumed the ratio of oil to gas price was the same as the average over the 1984-1990 period to extrapolate the gas price from 1974 to 1983, a similar method was used for coal prices by using the gas to coal average price ratio from 1987 to 1993 to extrapolate the coal price from 1974 to 1986. In the chart below the extrapolated estimate is indicated in red (it can be ignored if my extrapolation seems dubious). I believe energy prices were relatively high in the early 1980s, possibly not as high as I have estimated as a share of income (difficult to say without the actual data).
It seems possible that if energy prices rise as a share of income in the future, that more wind, solar, geothermal, hydro, and nuclear power may be produced and in addition that energy produced will be used more efficiently.
Certainly there will be lower thermal losses from wind and solar and electrically powered land transport will also have far lower thermal losses than ICE powered transport, particularly as electric power moves to a higher proportion of wind, solar, and combined cycle natural gas.
The share (of the pie) spent on fossil fuels may be artificial low in the recent time period (2014-2020). Just because it could be – due to the high oil price in the 2011-2014 area and shale oil expansion in the US. The reduction in fossil fuel affordability will probably be linked to some form of energy poverty (even if mild some places), since fossil fuels are linked to just about everything in the economy. The wages are not increasing in the same pace.
Dennis- consider
Much of the world income that you use as a proxy for GDP or global wealth is sequestered into the accounts of a few thousand people/private equity. If you remove this sequestered wealth from the equation, the outcome looks much different- much higher energy expense/commoner GDP
And the expense will be getting higher regardless of the choices that are made.
I think we should acknowledge that all future fossil fuel production will be much more expensive than has been the case in the past, with all of the low hanging and even much of the higher hanging fruit having already been harvested or already in the pipeline.
And likewise, almost all efforts to replace depleting supplies of fossil fuel with other forms of energy will take a high level of expenditure, considering the systems replacement that will be required. I say almost because some things will end up being less expensive- such as energy cost/mile for electric transport when supplied by wind in a windy area or solar in a sunny area.
Hickory,
Wealth is a stock, income is a flow, many miss this distinction.
See
https://www.forbes.com/sites/oliverwilliams1/2021/06/10/worlds-wealth-hits-half-a-quadrillion-dollars/?sh=3fcc0df8309d
World Wealth is about 430 trillion and about 25% is held by high net worth individuals.
Income is a different measure, about 87.4 trillion in 2019. The distribution of income between nations and individuals is very unequal. In the US median personal income is about 36k in 2019 and average income is about 63.5k. For the World average income in 2019 was about 11.4k, median World income was about 2.5k in 2017 ( I cannot find a more recent estimate).
I agree future fossil fuel extraction may indeed be more expensive, though it will depend in part on demand. The increase in wind and solar consumption as well as the move to electric land transport may reduce demand for fossil fuel to less than supply by 2035, prices for fossil fuel will fall and only fossil fuel that can be extracted profitably at the lower price will be extracted.
Note also that coal has mostly been the lowest cost fuel, but natural gas has in many cases been the lowest cost source of electric power (in part due to greater thermal efficiency of newer natural gas power plants.) Solar and wind in areas with good resources have been able to compete because they are lower cost sources of electric power, as fossil fuel prices increase and costs for wind and solar continue to decrease the process of wind and solar replacing coal and natural gas will continue.
Good points.
The optimal case is something to strive for. Renewables replacing fossil fuels at a steady rate, knowing that electrical cars use 1/3 of the energy compared to combustion cars (minus the consumption connected to the heat pump in the car, or the AC in the car), and that heat pumps reduce energy consumption with 1/2 overall dependent on a lot of factors, is a goal (I just repeat the message once more, because it is important to do so).
For as long as possible, for places that can. When I say “for as long as possible”, some places can prosper, but I fear many places will not.
Wind power and solar power together with hydro power (more and more pumped), battery storage and demand adoption for some part can make the grid dependent in the 80%+ range on renewables. It is more to come to terms that fossil fuels are used to stabilise the grid in the future as a priority, along with using it on air transport and even sea freight.
Well, it is more to come to terms with declining energy available. Thankfully, it is a slow moving process the way I am thinking. I might even be wrong and surprised to the upside – I hope so.
Kolbeinih , sorry boss . We are now on the downward slope of “peak oil ” or “peak energy ” . On the downward slope the negatives accelerate . So what you hope for ( a slow moving process) is nothing but a false assumption (hope) . Buckle up .
As mentioned before, and below, there is a solution to grid stability that only takes a bit of investment for the grid owners to solve, namely HVDC. And also, a resistance heater in a water accumulator does not care one tiny bit about the grid frequency…
Just a small remark, but in general, we are up for a rough ride.
Hole in head,
I disagree. Renewables can ramp up.
Dennis , “Renewables can ramp up ”
A few years ago a gentleman came up with a slogan ” Yes ,we can ” . Didn’t do much of the ” can” , at least in my opinion . Oft quoted ” If wishes were horses , beggars would ride ” .
Hole in head,
See BP data for Solar and wind energy consumption. From 2011 to 2019 wind power consumption increased by more than a factor of 3 and solar power consumption increased by more than a factor of 10, average annual growth rates of 14% per year for wind consumption and 28.8% per year for solar consumption over the 2011 to 2019 period. Over the 2011 to 2019 period the average price of fossil fuel (average of all three weighted by consumption) was about $8/GJ, in 2018 the average price was $7.60/GJ and in 2012 the average fossil fuel price was $10.86/EJ. I expect fossil fuel prices will rise in the future (2022 to 2030 period) so that the rapid growth of solar and wind will continue as they will be cheap substitutes for fossil fuel. Slope of lines in charts below is annual average growth rate (multiply slope by 100 to get growth rate in %).
Someone with an ear to the ground , torn jeans and goo on his face got something to say .
https://www.oilystuffblog.com/forum/forum-stuff/so-far-3q21-earnings-no-looky-so-good
If you are having trouble finding companies with great earnings then just check out Enphase [ENPH]
They happen to be an innovative company in a very rapidly growing industry.
Chart below looks at the percentage of World income spent on oil consumption fro 1965-2020. No extrapolation needed as we have all the data in this case. World GDP from World Bank.
Interesting chart. Thanks for posting.
Dennis, this is a very different chart than the one you posted at 8:12am (here 2020 is about 1.4%, in your previous chart it’s almost 4%). What gives? Which is the real one?
PS OK, I get it. This chart is income spent on oil consumption; previous chart is fossil fuel consumption. I got there eventually! Thanks for the charts 🙂
All of Dennis charts are as Mr. Perry Mason would say ” incompetent , irrelevant and immaterial ” . I am in India on a family visit . Price of petrol here is $ 1.55 per liter . Unaffordable . New business . All shopkeepers lining the roads go and buy 200 liters of petrol in a drum (barrel ) . Repack in 250ml,500ml, 1 lit used cola, juice and water bottles and resell the petrol . 250 ml at $0.45 , 500 ml at $ 0.90 and 1lit at $ 1.80 . The consumers are usually motorbike and scooter owners . Why ? They do not have $ 7.50 to pay at the pump (minimum 5 lit) . Each user calculates how much petrol he will need during the day and buys accordingly .I have seen car owners buying $3.60 of petrol from the shops . The key have been lamenting is affordability . Who buys petrol for $ 0.45 in the West ? Whosoever made these calculations has no idea about how 50%+ of the population in Eurasia live . More disturbing for me is the CNG/LNG situation . India is dependent upon Qatar for 100 % of LNG . Qatar missed 6 shipments under its long term agreement ( why not ? Spot prices are higher than the agreement price . Better to sell on the spot market ) . Result the public transport system ( only CNG allowed for buses, taxis and auto rickshaws ) is breaking down because of non availability and high price . I see queues kilometers long waiting to get CNG . However more worrying is what high LNG prices are doing to agriculture . Now is the sowing season the urea prices are sky-high but at least there is no shortage . DAP( Di Ammonium Phosphate) is another story . China stopped the export of phosphate to all countries last month . Acute shortage in India . Stand in a queue from morning to evening and you will be lucky to get a bag . Farmers suicide has hit an all time high . Cannot afford major inputs viz diesel, fertilizer and pesticide . 2 farmers died waiting in line for DAP . All the charts you post have no relevance from were I am today . Apologies for being offensive but there is difference between statistics and actual facts . This will explain my very first sentence .
Hole in head,
The chart is based on World income and world consumption. The numbers for individual nations will vary widely depending on income, taxes, and consumption.
For india the chart would be different and it would also be different if one used median income rather than average income (though we would also need to know median consumption, not clear we have data on that).
There are many nations and each will be different. Feel free to create a chart for India.
Indian share of income spent on fossil fuel is no doubt higher than the World average.
Its a story of haves and have nots.
Applies to money, food, energy, good land, and materials.
Its the big story of human history.
The prosperity extending to more than just the upper crust, as we now have in many places throughout the world, has not been the norm in human history.
It should not be surprising to see backsliding on generalized prosperity if energy shortage gets rolling, some countries more quickly and more severe than others.
This is the kind of scenario where we would expect widespread internal disarray.
Governments do fall and countries do fail when prosperity and a sense of fair treatment decline.
[a majority of us in the US feel like we have just been through a 4 year term of early stage internal disarray, and it wasn’t pretty and it came within an inch of moving far beyond an early stage]
On the other hand, there is a form of energy technological revolution in progress. An individual person who owns a sunny roof or yard can now generate enough energy to not only survive but to flourish (household and transport energy supply), becoming their own independent power producer. Same applies on a neighborhood or community basis.
The social implications of this empowerment is grossly underestimated by those who have not glimpsed the possibility. The effect of paying yourself for your energy consumption is dramatic.
Dennis , thanks for retrieving this .
You are wlecome.
Energy poverty = real poverty . Last message on this post .
The numbers vary widely from year to year, but the cost to produce that oil does not. So what we’re seeing is a a measure of how profitable the oil industry is.
I recently asked Enno Peters what his supply projection for the Permian would look like if 300 rigs were operating until Dec 2029 (extending the projection he had done recently up to Dec 2025 for another 60 months).
His answer is at the link below, see the comments.
https://shaleprofile.com/blog/permian/permian-update-through-july-2021/
I superimposed the image on a chart with my medium oil price Permian scenario (ERR=44 Gb) which has all Permian debt paid back by December 2025 (this estimate has been revised). The maximum completion rate for my scenario is 525 new wells per month and the scenario uses a relatively low TRR of 50 Gb (USGS mean TRR estimate is about 75 Gb with a 95% probability the TRR will be more than 45 Gb).
My medium oil price scenario with maximum completion rate of 525 new wells per month (Aug 2025 to Dec 2032, with completion rate decreasing to zero by June 2036 and no wells completed after that month).
Output of Enno Peters’ Permian projection is approximately 6500 kb/d for Dec 2029, my scenario about 6600 kb/d.
Emissions to be a factor in drilling lease sales
The federal government will consider contributions to national greenhouse gas emissions as it prepares to sell oil and gas drilling leases — and could ultimately put off selling certain parcels as a result.
The Bureau of Land Management (BLM) said that it will consider the contribution towards national greenhouse gas emissions for the first time as part of forthcoming environmental assessments for proposed sales that would be held in early 2022.
This really makes a lot of sense. Stop production in the US so that you then need to ask OPEC, Please sir increase your oil production for us???? Oh and by the way, we get to use the oil and it won’t be added to US emissions? Aren’t us Greenies clever?
https://thehill.com/policy/energy-environment/579125-biden-administration-to-weigh-national-greenhouse-gas-emissions-for
Dennis , two of my comments vanished when I hit the “post comments ” button . Why ??
Hole in head,
Not sure, maybe the ghost in the machine? There is a comment from 1:43, is there still a problem?
Dennis , one of my comments was during the afternoon (Europe) . I thought maybe I made an error , but after my comment at 1:43 I posted another one and was extra careful . This also vanished . It also occurred in an earlier post OPEC update 2021 but I ignored it .
Apparently, there´s a glitch in the matrix…
I also made a reply to Kolbeinih that vanished, regarding grid stability, short conclusion in that case, the answer is HVDC.
Be well!
The US production post will appear somewhere between 12:00 noon Saturday and Midnight.
For those whose comments have been disappearing, I may have found the problem.
Hopefully my solution will help.
Please let me know if there continues to be problems with disappearing comments.
A new thread on August US oil production has been posted.
https://peakoilbarrel.com/august-us-oil-production-drops-due-to-hurricane-ida/
A new open thread Non-Petroleum has been posted.
https://peakoilbarrel.com/open-thread-non-petroleum-10/