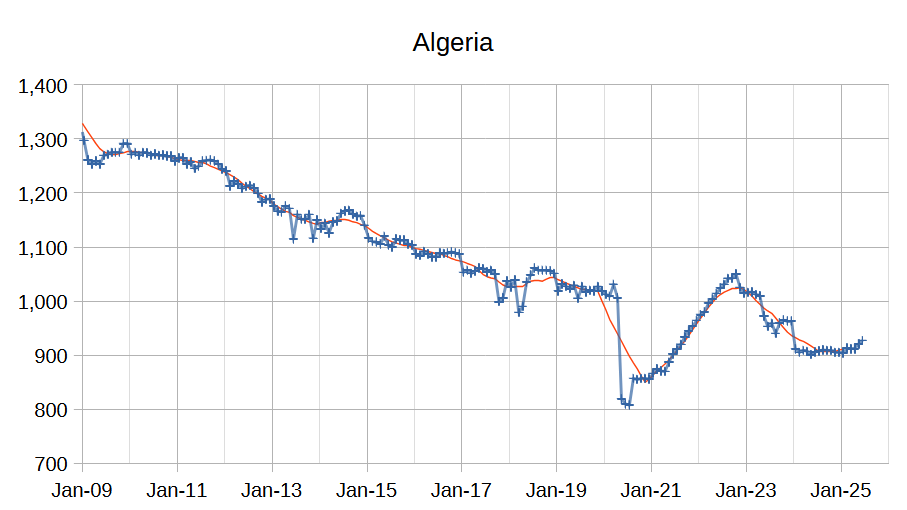
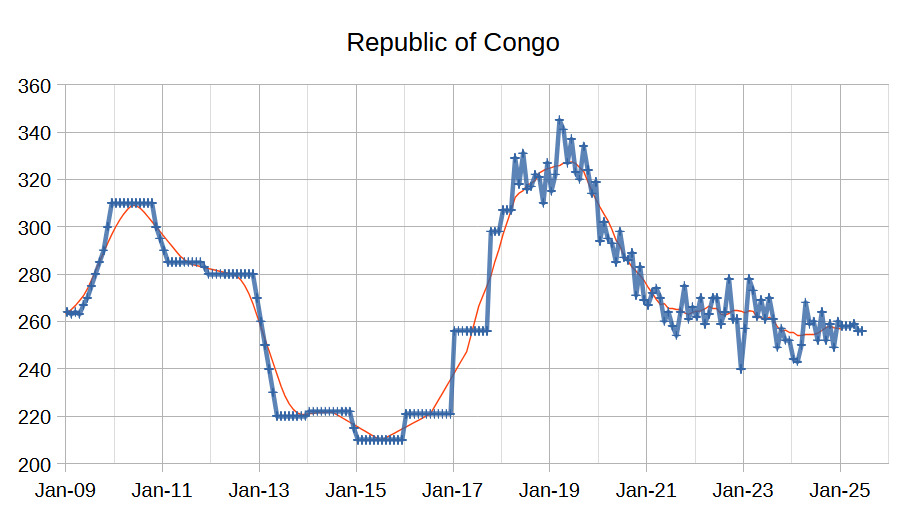
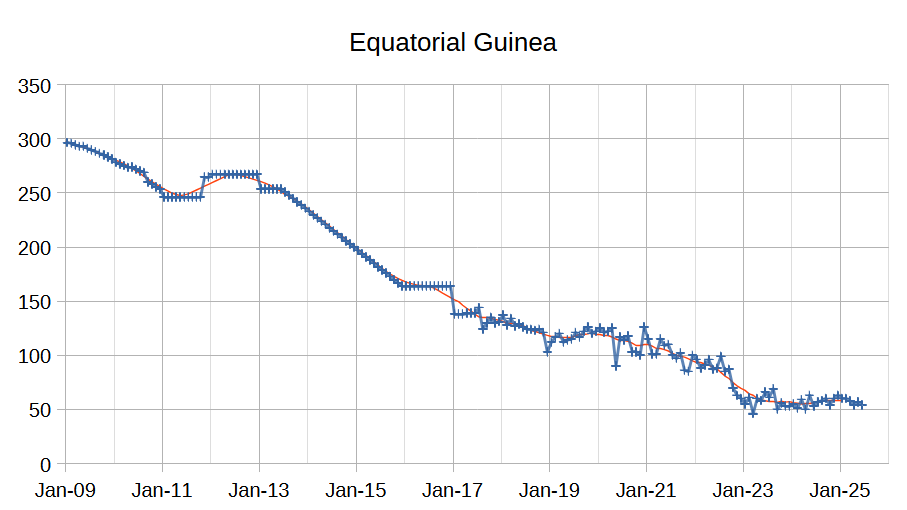
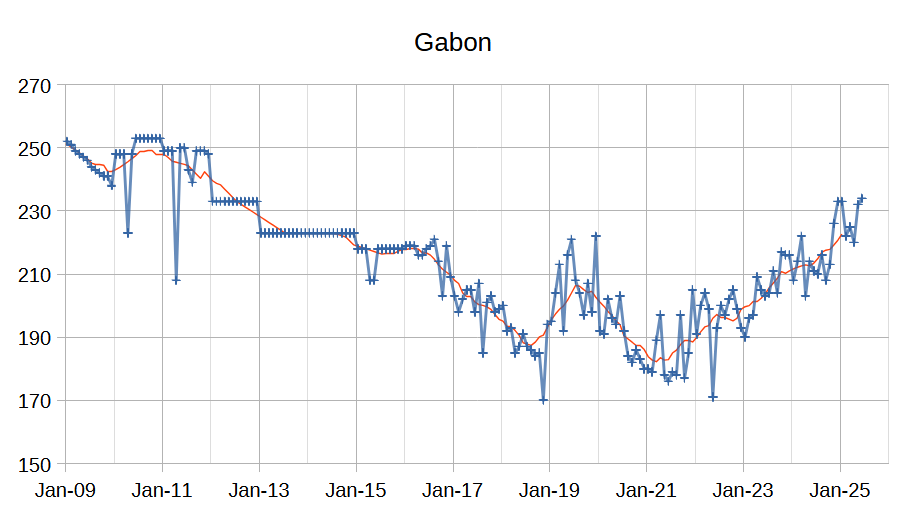
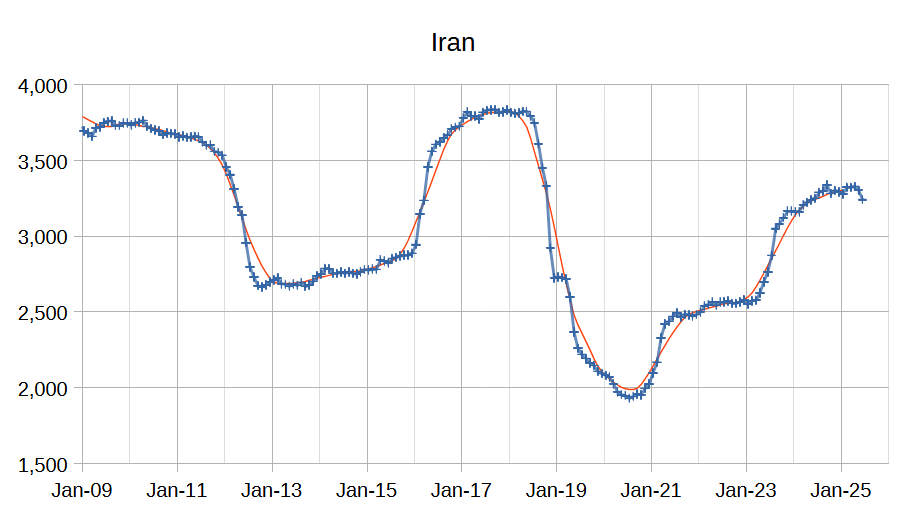
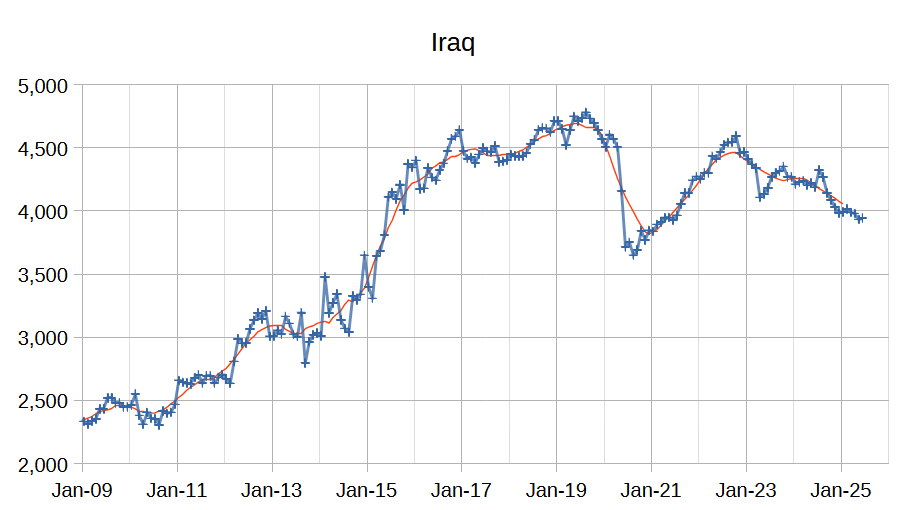
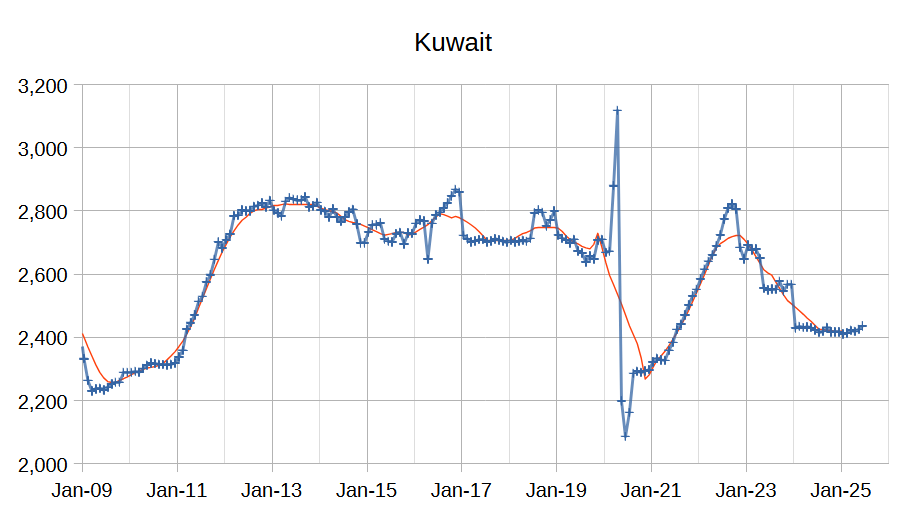
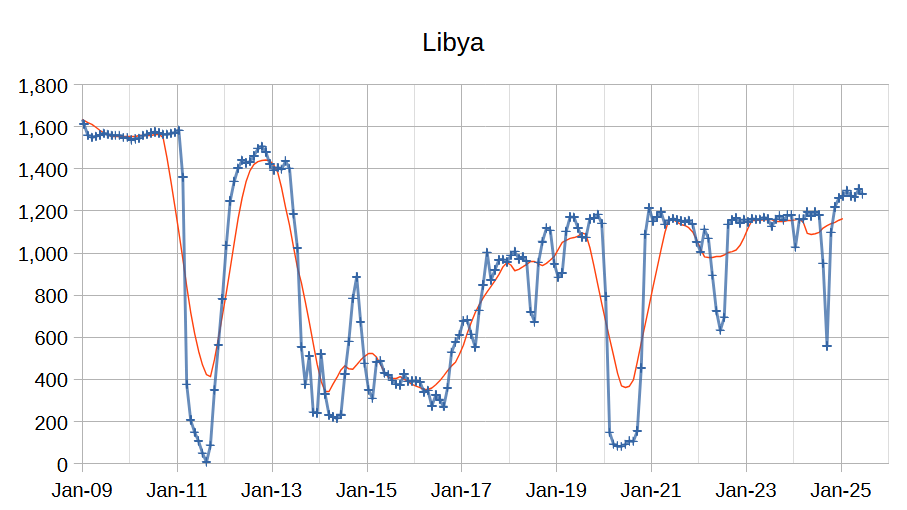
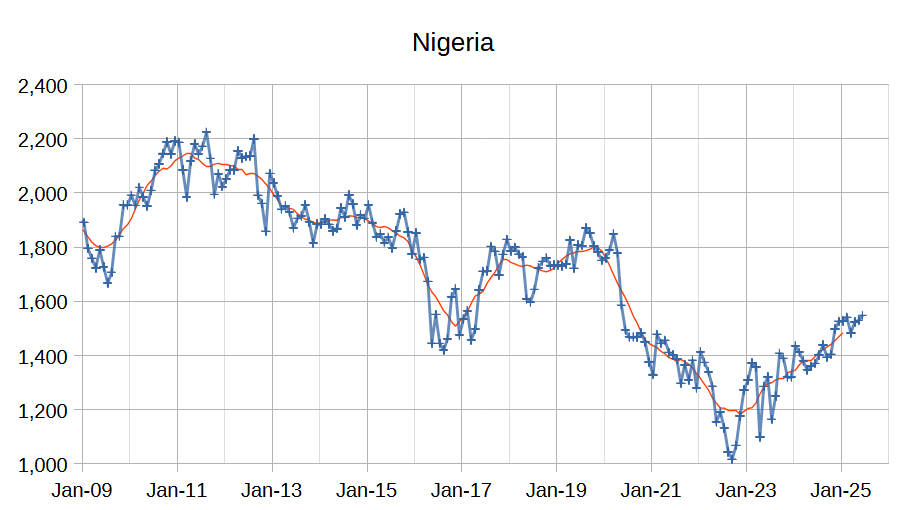
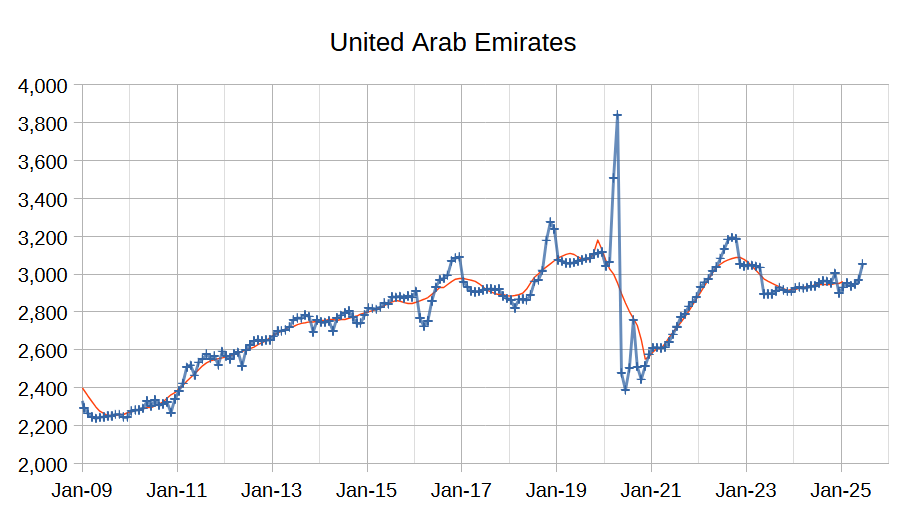
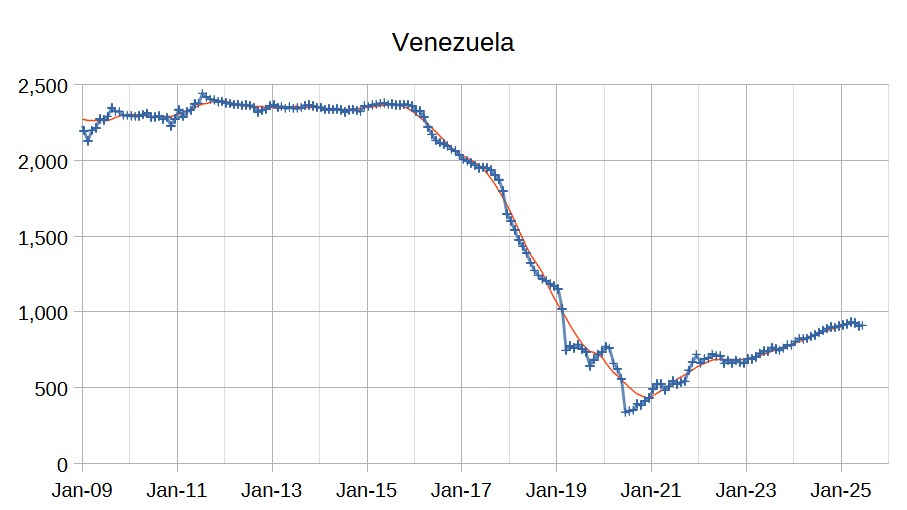
The OPEC Monthly Oil Market Report (MOMR) for July 2025 was published recently. The last month reported in most of the OPEC charts that follow is June 2025 and output reported for OPEC nations is crude oil output in thousands of barrels per day (kb/d). In the OPEC charts below the blue line with markers is monthly output and the thin red line is the centered twelve month average (CTMA) output.
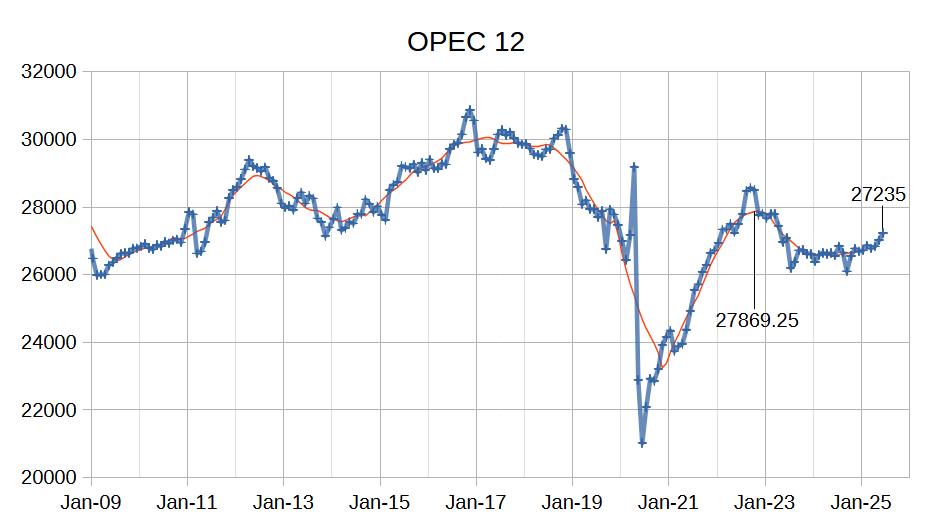
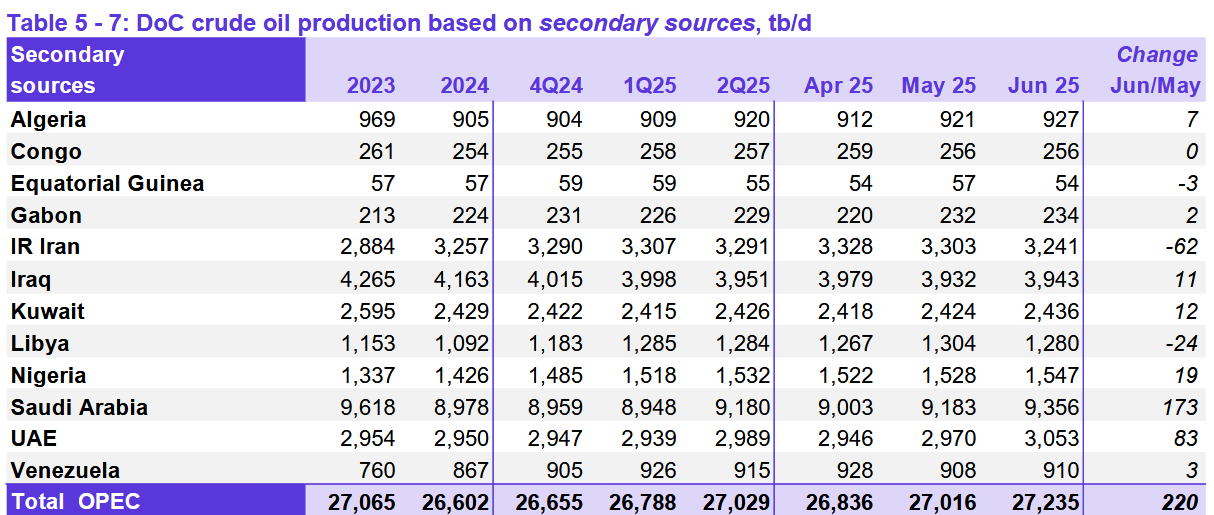
OPEC 12 output for May 2025 was revised lower by 6 kb/d and April 2025 output was revised lower by 2 kb/d compared to last month’s report. OPEC 12 output increased by 220 kb/d with the largest increases from Saudi Arabia (173 kb/d), UAE (83 kb/d), and Nigeria (19 kb/d), Kuwait (12 kb/d), and Iraq (11 kb/d). Iran (62 kb/d) and Libya (24 kb/d) saw decreased crude output, all other OPEC members had small increases or decreases of 7 kb/d or less.
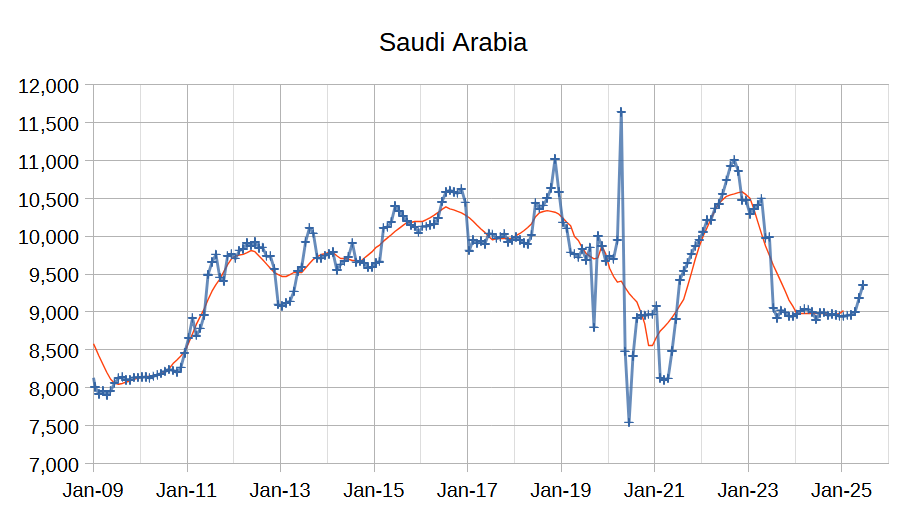
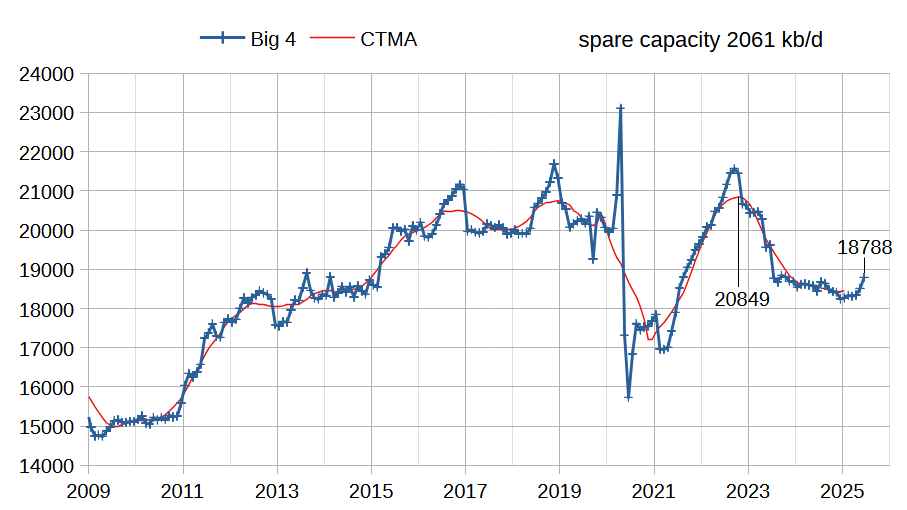
The chart above shows output from the Big 4 OPEC producers that are subject to output quotas (Saudi Arabia, UAE, Iraq, and Kuwait.) After the pandemic, Big 4 average output peaked in 2022 at a centered 12 month average (CTMA) of 20849 kb/d, crude output has been cut by 2061 kb/d relative to the 2022 CTMA peak to 18788 kb/d in June 2025. The Big 4 may have about 2061 kb/d of spare capacity when World demand calls for an increase in output. Note that peak capacity might be as much as 2200 kb/d higher for a single month, but the important number is output that can be sustained for at least 12 months. My estimate is based on output that have been proven over 12 months rather than capacity that is claimed.
OPEC has announced plans to increase output at about 411 kb/d each month from May to July 2025, and an August increase of 548 kb/d which would increase output by about 1781 kb/d. For the OPEC Big 4 output is expected to increase by 929 kb/d over the next two months spare capacity will fall to 1132 kb/d, based on my estimate of OPEC spare capacity. It remains to be seen if the OPEC Big 4 can return to their previous centered 12 month peak attained in November 2022, Iraq may struggle and there may be only 500 kb/d of spare capacity beyond the August 2025 target output (19717 kb/d for Big 4).
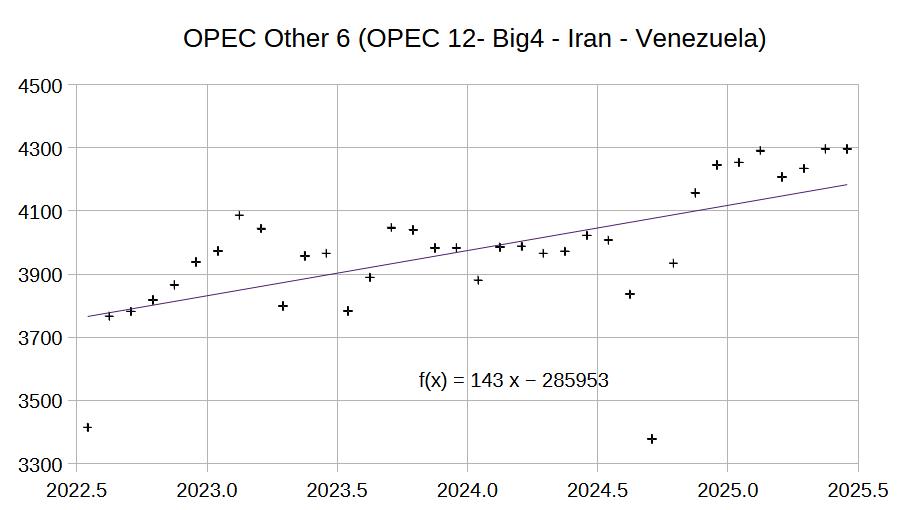
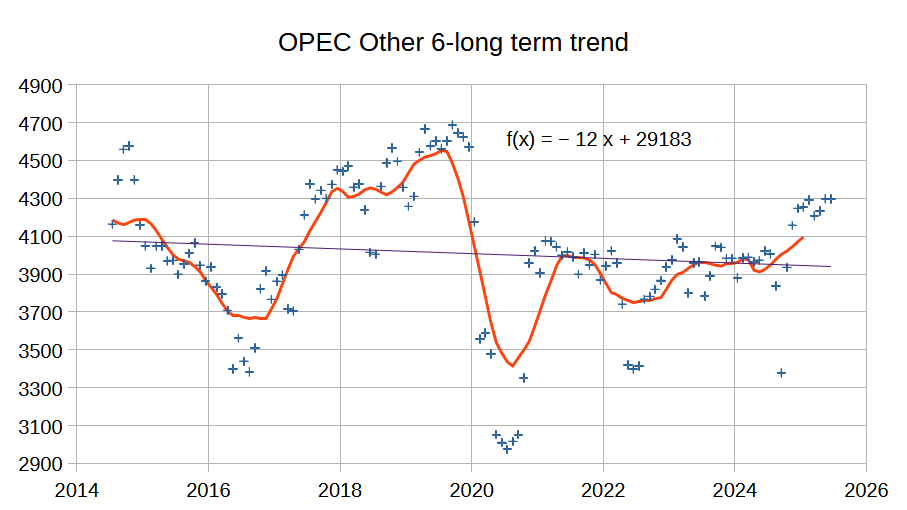
The chart above shows the average annual increase of 143 kb/d for the Other 6 OPEC group which excludes the Big 4 and Iran and Venezuela. Iran and Venezuela have seen their output rise over the past 3 years at an annual rate of 432 kb/d which I believe will fall to zero in the near future. The chart below shows the long term trend for the OPEC Other 6 which is roughly flat (a small average annual rate of decrease of 12 kb/d over the past 11 years.) I expect the Other 6 will see their output return to this flat trend in the next few years.
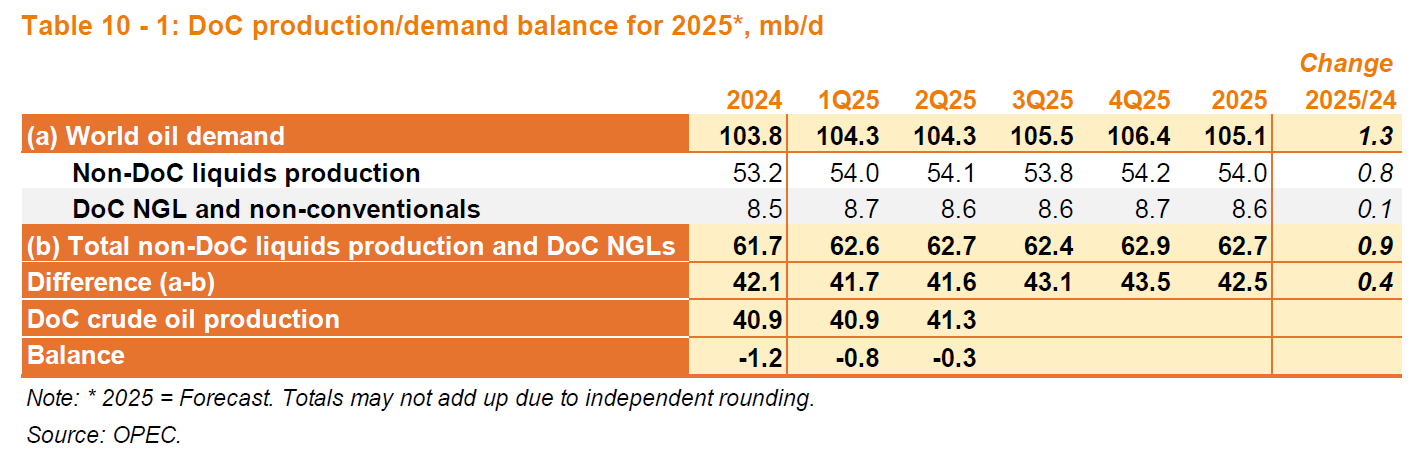
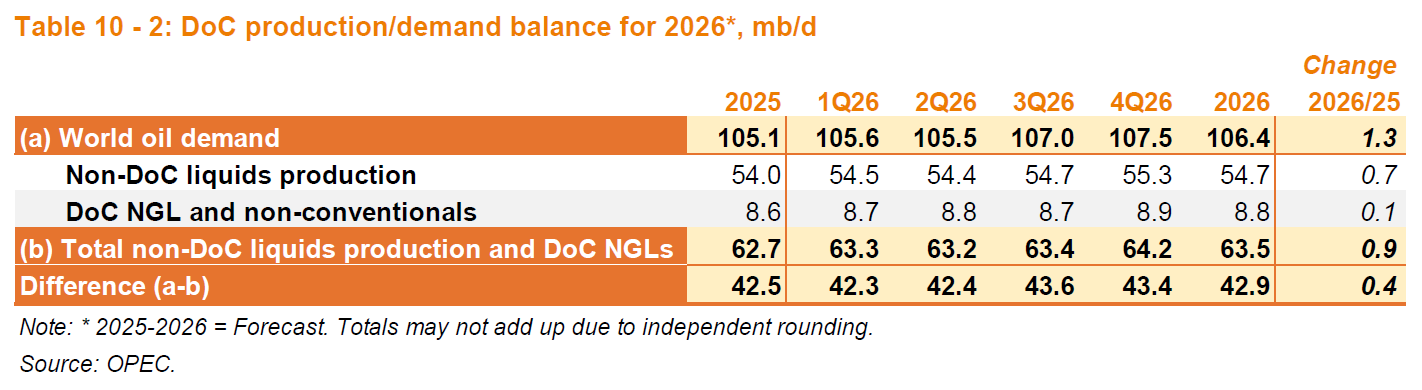
The World liquids demand forecast is unchanged from last month. Non-DOC liquids and DOC NGLs output has been revised higher this month compared to last month by 200 kb/d in 2024, 300 kb/d in 2025, and 200 kb/d in 2026.
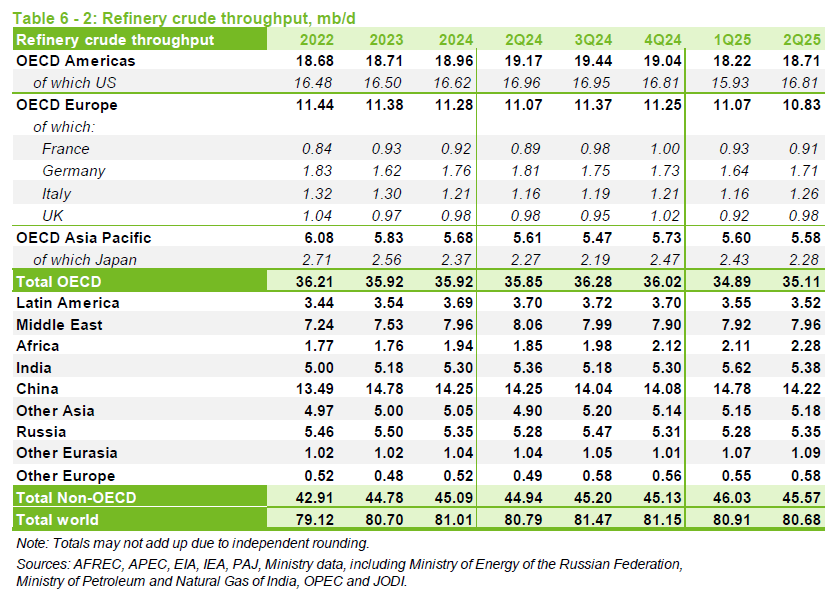
Refinery crude throughput is a better way to determine World demand for C+C (though imperfect because some crude is burned directly in power plants in the middle east.) OPEC data shows the peak was 81.68 Mb/d in 2018. For the most recent 4 quarters the average refinery throughput was 81.05 Mb/d, the previous 4 quarters had average refinery throughput at 81.08 kb/d and 2024 had refinery throughput at 81.01 kb/d, so only about a 40 kb/d increase in the annual average over 6 months which suggests another 8 years to return to the 2018 peak if the recent rate of increase (over past 6 months) in refinery throughput continues for the next 8 years.
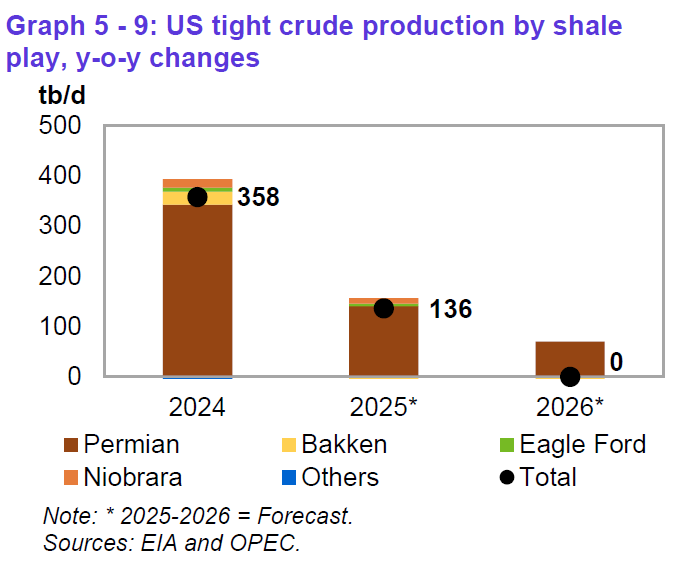
The OPEC forecast for annual change in US tight oil output has been revised from last month’s MOMR with 2024 lower by 2 kb/d, but the forecast change in US tight oil output in 2025 and 2026 remain thae same as last month’s forecast.
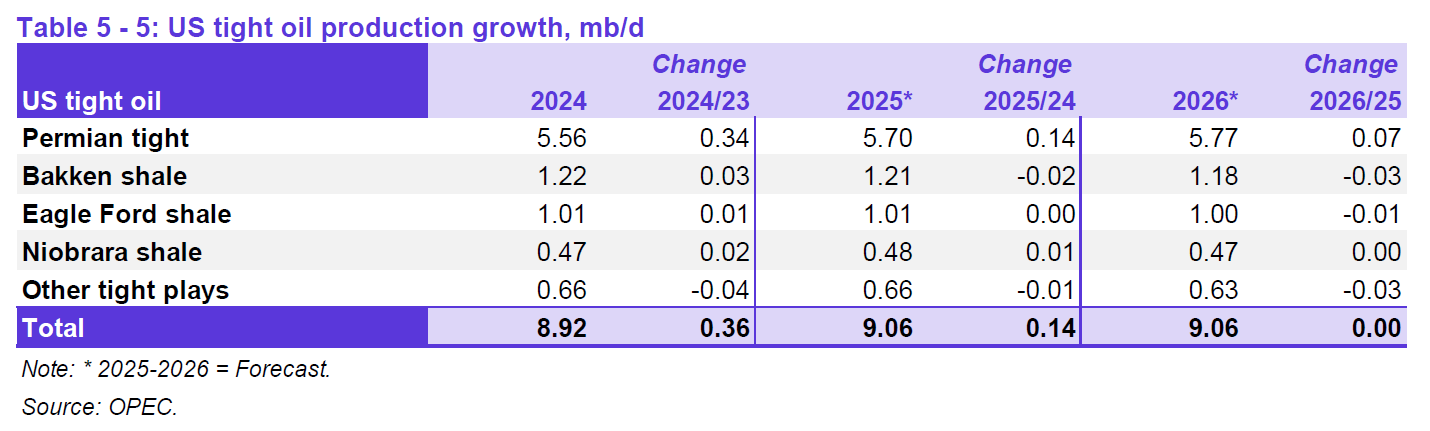
All of the tight oil increase in 2025 comes from the Permian Basin and in 2026 Permian basin output increases by half as much as 2025, but other tight oil plays see decline equal to the Permian increase so that over all there is no increase in tight oil output in 2026.
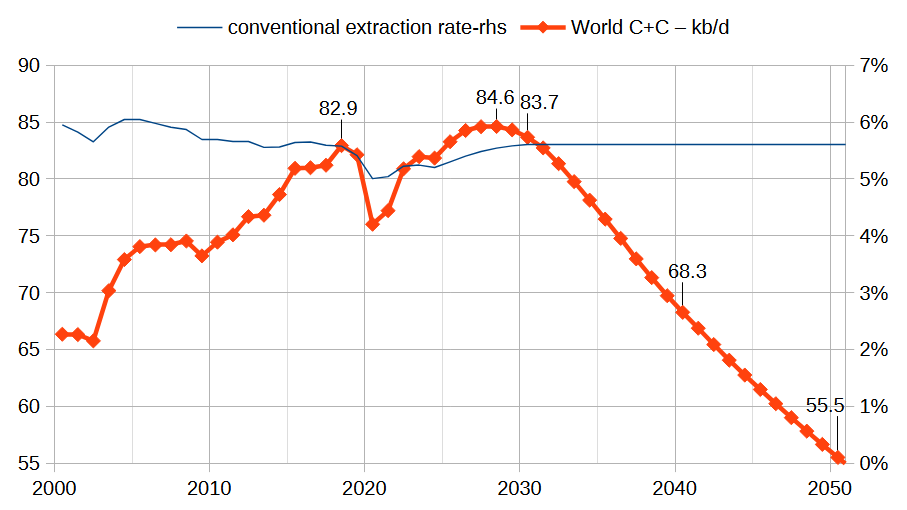
The increases in OPEC output as well as continued increases from Argentina, Brazil, Canada, and Guyana (recent annual increases at about 500 kb/d for all 4 of these nations) lead to a new peak in 2028 at 84.6 Mb/d in the scenario presented above.
117 responses to “OPEC Update July 2025”
Thank you Dennis,
However, you used to also post their inventory estimates chart, I was looking forward to it…
Kdimitrov,
An oversight on my part, sorry. Stocks are near the 2023 level and below the 5 year average. That average is skewed higher by the very high stock levels during the pandemic. In terms of days of forward consumption OECD total stocks were 88 days for 25Q1 and were at 87 days from 2022 to 2024, so for OECD stocks they are at normal levels. Visibility for Non-OECD stocks are not very good, not much information in MOMR on that.
Just realized I haven’t posted this chart since last April, sorry you have missed it, I will try to remember to include it in the future. My reasoning for dropping it is that OECD consumption has become a small part of World consumption, the missing stock levels for the non-OECD makes it feel like we aren’t seeing the whole story. Stocks are really difficult to track at the World level based on the publicly available information that I have access to.
Thank you very much Dennis!! You’re the best!
You are welcome.
Thanks Dennis,
This is the TRR and ERR for Vaca Muerta according to bing ai.
Vaca Muerta TRR and ERR Estimates
Technically Recoverable Resources (TRR)
Oil and condensate: 14.4–15.9 billion barrels (BBOE) of undiscovered technically recoverable resource for the Vaca Muerta Formation
Dry gas: 38–46 trillion cubic feet (TCF) of undiscovered technically recoverable resource
Economically Recoverable Resources (ERR)
At present, major public assessments do not explicitly publish standalone ERR estimates for Vaca Muerta. ERR depends heavily on commodity prices, cost structures, fiscal terms, and technological improvements.
As a rough rule of thumb drawn from analogous North American shale plays—where economic recoverability often ranges from 30 % to 60 % of TRR under mid-$50–$60/barrel oil and $3–$4/MMBtu gas environments—the potential economic tranche might be:
Oil (ERR): approximately 4.5–9.5 billion barrels
Gas (ERR): approximately 12–28 trillion cubic feet
These ranges should be refined through project-level economic modeling that incorporates local drilling and completion costs, breakeven price hurdles, and government royalties.
Not sure how accurate the info is.
Iron Mike,
Below is what I got from another chatbot on VM TRR and ERR, note that it fails to give the updated TRR&ERR numbers although mentioning expansion of oil window, especially lower API (down to 23). Looks like your Bing AI chatbot now gives new updated gas TRR at much lower than the 2013 EIA number of 308TCF, while similar oil TRR number to 2013 EIA number of 16 GBO.
1. Vaca Muerta’s Resource Potential
Recent assessments (2025) indicate that the formation spans ~30,000 km², extending beyond Neuquén into Río Negro, Mendoza, and La Pampa provinces 4.
Original estimates (pre-2025) suggested 16 billion barrels of technically recoverable oil and 308 trillion cubic feet (Tcf) of gas (US EIA, 2013). However, recent findings suggest these numbers may be underestimated.
2. Revised TRR & ERR Estimates
Oil TRR: New drilling data (2025) shows that lower-API crude (down to API 23) is now commercially viable, expanding the recoverable resource window by 10%.
Gas TRR: With improved hydraulic fracturing and well designs, gas recovery rates have increased, though exact updated figures are not yet publicly detailed.
ERR Adjustments:
Break-even costs for Vaca Muerta oil are ~$36/barrel, making it one of the most competitive shale plays globally6.
The Vaca Muerta Sur pipeline (expected 2026) will double export capacity, further improving economic viability 57.
3. Production Growth & Future Projections
Current oil output: ~757,000 bpd (Dec 2024), with 40% coming from Vaca Muerta68.
Projected 2030 output:
1 million bpd (oil) and significant gas expansion, potentially making Argentina a top global shale exporter67.
If infrastructure (pipelines, LNG terminals) expands, gas exports could surge, particularly to Europe and Asia.
The references for low API oil:
https://mase.lmneuquen.com/vaca-muerta/pablo-bizzotto-vaca-muerta-insights-el-sur-del-shale-puede-ser-mejor-que-el-norte-n1182535
https://neuquenweb.com/bizzotto-ceo-de-phoenix-el-sur-de-vaca-muerta-puede-ser-mejor-que-el-norte/
https://www.youtube.com/watch?v=GbIWloQMrx8
according my research, the black oil window acreage in VM with superior EUR almost doubled,
https://www.linkedin.com/pulse/low-gor-black-shale-oil-news-from-vaca-muerta-rio-negro-sheng-wu-5fhpc
Sheng Wu,
I have no knowledge of the play or its geology, but according to this article published on 22nd of May 2025:
https://oilprice.com/Energy/Crude-Oil/Record-Oil-Output-Positions-Argentina-as-a-Key-Energy-Player.html
It says:
“The shale oil lifted in the Vaca Muerta has an API gravity of 39 to 42 degrees, indicating it is light, with a sulfur content of less than 0.5%, which is particularly sweet, making it highly desirable for refiners seeking to produce low-cost fuels complying with strict modern emission requirements. ”
Which is the opposite of the first link you posted. Weird.
They probably made a mistake i think, your research and the links you posted with Phoenix resources CEO clearly hint at medium-heavier oil being present in the formation.
I can’t believe the breakeven price is so low. Quite incredible.
Iron Mike,
I used to be aligned with the mainstream shale oil model, i.e. shale oil has to be light tight oil (API>40) with high GOR (>500scf/bbl) in order to be productive, it is like the 10-commandments. So, for Vaca Muerta which has shale oil from low to high API and GOR, the starting point was in the high API and GOR part, i.e. Loma Campana (LC), and most operator that has acreage in lower GOR &API dare not say that they have lower GOR&API (yes, that’s why you see VM still reporting 39~42API oil even they have best API <35 oil acreages) , same for the Uinta Operator in US, even when they have higher EUR with lower API).
Often such low API (<35) &GOR (<350scf/bb) oil are hypersaline lacustrine shale oil and have high wax and and they look like impossible to flow or just like wax when shown in room temperature, e.g. the picture in the link below.
https://rbnenergy.com/sites/default/files/field/image/picture2_3.png
Or, you could find the video by Mike in Oilystuff about the production of high wax oil in Uinta — just unbelievable that such oil could be productive!!!
The fact is that all the wax have high pouring/melting point and therefore they look choking up oil flow on surface, but under reservoir temperature over 80degC, all wax flow as well as regular oil with same API.
In China, and US, although EIA gave potential shale oil in China almost as high as US, the mainstream geologists all believe that shale oil has to be high API & GOR in order to be productive, but even Peter Zeihan knows that China oils are generally much thicker (low API) and hard to flow/produce, and therefore he discount China's shale oil potential. The widely accepted reason behind this low API and GOR oil for majority of China oil basins has been "low maturity". However, when I logged the isotope of associated gas in China's Permian (Xingjiang, Jimusaer) and US Permian (Midland), they have actually the same reading i.e. the maturities are the same. Just the Hypersaline lacustrine oil in China's Permian has obviously lower GOR and API than US counterpart. Such low GOR API oil are almost free of bubble point death problems, and so in China, few geologists ever worry about bubble point death ever since oil production in China for past 50 years, while it has been the most worrying thing in US.
I developed a new model in 2023 after convinced by success laterals in China since 2018 and VM since 2019, see youtube,
https://youtu.be/TCWyziJdZk0
Another hard to believe feature for low GOR&API oil is that they (research which does not seem to be green-washed) claim low carbon footprint than US LTO with higher GOR and API, and my guess is that the EUR is higher and lifting carbon footprint lower, and probably the lower GOR means leaking and flaring less a problem.
Sheng Wu,
That is really interesting stuff thank you for the information.
Just out of curiosity, is the Shale formation in China (Xingjiang, Jimusaer) & the U.S Permian both made in during the same geological period (i am assuming the Permian) ? What about Vaca Muerta ?
Also the youtube link you sent me is wrong, it is some guy measuring his laptop adaptor voltage with a multimeter.
Iron Mike,
Sorry that I gave the wrong youtube link, and here is the correct one,
https://youtu.be/2wwoUOT4rGE
The Permian shale formations in China & US are both in the same Permian period, within the 47million years period. Vaca Muerta was formed during Cretaceous, the same period as many of the large oil fields in both sides of Atlantic when the Gondwana split to form Atlantic, but VM was actually first connected to the Pacific ocean, and then closed when the Andes mountain started to rise.
Somehow, major shale oil fields (VM and AIKE) in Argentina have hypersaline lacustrine source rock, indicated by high wax level and low API and GOR oil even when drilled to the source rock and deep formations. For example, VM started in the LC with higher GOR as US LTO formations, but the oil are generally much heavier with API # lower by 6~9degrees for the same GOR, the Eagle Ford 1~2MCF/bbl fluids has API in the 47~52deg, but in VM it is 38~45deg. This higher API help lower the bubble point and improve the EUR, although this effect is not as strong when the GOR gets much lower down to 300MCF/bbl and API at around 25~30degrees.
Sheng Wu,
Thank you for your input and knowledge. Much appreciated.
So your contention is low API & GOR oil is “greener” and might be a solution to reducing emissions ? Is that correct ?
Iron Mike,
The low API&GOR shale/tight oil has high diesel content, and could compliment the Light Tight Oil which has the “diesel-shortage” feature that Art and many LTO bashers like to poke at, or many analysts also claim that shale revolution could not solve the diesel shortage, and diesel is the bridging fuel to all electrified future.
So, I am trying to brand low API&GOR shale oil as the “greener” bridge.
Also, for some subtle reasons, the low API&GOR shale/tight oil also features lower carbon footprint as some researhers claim.
Just posted in Linkedin with picture and video of low API&GOR shale oil, they are like magic fluids,
https://www.linkedin.com/pulse/low-api-gor-shale-oil-from-vaca-muerta-rio-negro-shengli-sheng-wu-u4zec
In Vaca Muerta, the low API and GOR acreage could pump the associated gas back into the bore hole, and foamy fluid will form and the production is significantly enhanced. Whereas, it does not work well for fluids with GOR over 500scf/bbl.
Sheng Wu,
As always, I appreciate your professional contributions to this site.
The last sentence in your linked post kind of rocked me as I have always been highly impressed by the original (circa 2014) presentations out of the Tarrytown office of Dresser Rand when they introduced the concept of their micro LNG plant called LNGo.
The info touted the hardware’s ability to produce on-site supercritical field gas which could be somewhat easily re-injected back downhole to effect highly productive EOR.
Made sense to me.
This approach seemed to be further validated by the results of Liberty’s Stomping Horse EOR project wherein the recovered oil was strongly weighted towards the heavier ends.
Again, this seems understandable as the larger, heavier molecules would likely clog the pore throats … leading to the ever-lighter primary production that is seen everywhere.
The ‘good stuff’ is left in the ground … mebbe 90% of the OOIP.
The idea of re-injecting field gas in supercritical form appears to address several of the physical issues that water and/or field gas currently pose.
Hess is currently engaged in a pilot emulsion-type EOR project in the Bakken.
Liberty’s phase 2 EOR project supposedly prompted incremental recovery of close to 100% over original EUR projections.
Shortly down the road, successful EOR results are likely to be announced – with some mixed sentiments from the upstream boys – as a doubling of oil output potential is the last thing that they would want – from an economic perspective – in this already over supplied market.
Dennis will need to redo his charts when this narrative unfolds.
Coffeeguyzz,
I adjust my charts when hope becomes reality and not before. Much depends on demand for oil and the price of oil. Abundant supply as you foresee implies low oil prices and perhaps EOR for tight oil won’t pencil out. I doubt we see much of it at $70/bo in 2025 $. Perhaps it works at $200/b, but you don’t seem to see this as likely and I tend to agree due to a transition away from oil to other forms of energy for land transport.
COFFEEGUYZZ,
Thanks for your encouragement and forever postitive spirits and valuable information!
I am surprised that Bakken could also have emulsion-type EOR and will dig in, and compare to the gas-lift in the low GOR-API shale oil in VM.
Medium and heavy oil wouldn’t flow from shale.
Its light, high gor volatile oil.
Iron Mike,
I haven’t looked at Argentina closely.
Chart below has the trend for Argentina, Brazil, Canada, and Guyana from mid 2020 to early 2025. Future as always is unknown.
Longer term annual rate of increase for these 4 nations (2015 to 2025) is about 311kb/d (Guyana started producing oil in 2020).
Over the mid-2020 to early 2025 period the annual rate of increase for Argentina, Brazil and Canada was 366 kb/d and the longer term rate for those 3 nations (2015 to 2025) was 247 kb/d.
Aslo there may be some new production from Suriname (right next to Guyana) in the future and perhaps some new offshore production in Africa.
Dennis,
So you are seeing a secondary peak at 2028. I can see this happening if some 3rd world countries start rapid industrialising and becoming emergent economies. Oil companies might lobby politically to increase demand for their product.
Covid, recessions and declining birthrate growth rate has delayed p.o. Seems like we will continue BAU and continue using ffs until something seriously breaks. I dont subscribe to your premise that we electrification will save the day, though i am open to not being able to predict the future so you could be correct.
I suspect that we will see the oil consumption trend change in a major way (drop) due a severe economic contraction before the production otherwise drops below 82 Mbpd, but I certainly don’t know when in particular.
I have been very wrong about oil price, expecting sustained high prices to make a big appearance this decade.
And about one or two other things my wife would assert.
Hickory,
You are much smarter than me, my wife would assert one to two million other things I have been wrong about. I also have been wrong on oil prices in the past and expect this will continue in the future.
US re-industrialization with AI boom could help do a new peak FF for US alone from 2028~2038?
The rest western countries, if they choose suicidal policy like IEA then probably they will become 3rd world countries soon.
https://oilprice.com/Energy/Energy-General/US-Vows-to-Quit-IEA-of-the-Agency-Keeps-Pushing-Green-Transition.html
Sheng Wu
Suicide or not, the world is adding a gigawatt of solar capacity every 15 hours, and the trend is accelerating.
Because solar has zero marginal cost, it pushes any fuel based electricity generation out of the market when the sun is shining. Because solar has such wild swings in production, it subsidizes batteries, another zero marginal cost energy source.
You can see this in Inner Mongolia now, which is rolling out vast solar farms. That suppresses fuel based generation and causes wild swings in price — they go negative just about every day now. The result is massive investment in batteries.
Suicide? Maybe. But it’s hard to see a market-based solution. It’s going to be a rough decade for anyone selling fuel unless they have government protection.
China already dominates solar and probably ultra-high voltage transmission.
The west needs to have a different competing technology path, or will get lost if following solar.
The past left-extreme policies, or the Inflation Reduction Act failed to give a viable solution, if not only more unreliable and expensive energy supplies.
Alimbiquated,
Can you provide a source for a couple of your PV installation rate numbers in different posts here? In particular that:
1. Global additions of 1GW / 15 hrs
2. China addition of 93GW in May, or 1GW / 8 hrs.
Also, I presume that you are citing nameplate numbers that do not reflect actual capacity factor right? Big numbers regardless, just looking to make sure I understand your source(s) and numbers.
OK, so let’s look at Our-World-In-Data which cites its sources as Ember (2025) and Energy Institute – Statistical Review of World Energy (2025).
They show PV production growing at an annualized rate of 27% from 2014 to 2024 to a total of 2,131 TWh in 2024. Amazing. An increase of 474 TWh from 2023. Depending on the average global capacity factor that does look to be in the ballpark of 1GW nameplate per 15 hrs mentioned by Alimbiquated.
here is the solar installation in China for the past 3 years, and it is not sustainable.
The top 26 companies in Solar lost total 25 Billion USD in the first half year 2025, and they have stockpile of polysilicon that could feed production for 4~5 months.
Thanks Sheng Wu.
Interesting and appears to match the May 93GW nameplate that Alimbiquated quoted. Incredible even after considering the capacity factor. Do you have the source link for this and your financial numbers?
Of course the current paradigm isn’t sustainable. However this is a step in the right direction. Strong EROI above net energy cliff, energy source able to be used without the losses inherent in combustion and a move away from the Faustian bargain of fossil fuels. China has obviously made some good strategic decisions regarding energy policy.
SHENG WU
You are right about the financial losses in the Chinese solar industry. I also expect quite a few companies to go down.
I doubt it will stop the growth of solar, however. Solar reminds me of the hard drive industry, which has grown with insane speed for decades on the corpses of manufacturing companies.
T Hill,
here is a link to the 93 GW report.
https://www.bloomberg.com/news/articles/2025-06-23/china-solar-additions-surge-to-record-in-may-ahead-of-deadline
Yes May was a record, for the simple reason the guaranteed feed in tariffs changed in June.
In June China’s solar installation was down to 14GW, a long way down from 93GW..
https://www.energyconnects.com/news/renewables/2025/july/china-s-june-solar-installations-plummet-as-new-rules-take-hold/
With the new cuts to subsidies in both China and the USA, I would expect the growth rate of solar to slow massively. The next couple of years is clearly going to show that we can’t and wont have a renewable future as they can’t compete on an EROEI basis with 24/7 coal and gas. The storage component to overcome intermittency is also clearly too great and only happens because it’s highly subsidised.
We reached the pinnacle of our civilization with a lassez faire arrangement of new added fossil fuels, that allowed huge excess of energy for the rest of the economy. Sure it’s cost us greatly by wasting valuable depleting resources while damaging the climate and environment, but it’s how we got here.
Adding new market rules and huge monetary subsidies to give renewables an advantage does not change the reality of much lower EROEI for renewables.
It’s going to be a rough decade for anyone selling fuel unless they have government protection.
I think that’s a stretch Alimbiquated. New UN data has revealed that, despite major advances in renewable energy, electrification and energy efficiency, fossil fuels still supply 80% of the world’s energy. On the liquid front EV sales have turned down, Gasoline hybrids are taking over from them, but ICE cars, trucks, buses, earthmoving, farming, etc are still the most popular choice by far in western nations. Unfortunately I can’t see demand for oil falling anytime in the foreseeable future?
https://www.edie.net/un-report-how-to-get-past-fossil-fuel-additions-to-a-meaningful-energy-transition/
THOMPSON
I guess I wasn’t being very clear. I also expect consumption of fossil fuel to remain unsustainably high (from an environmental point of view).
What I meant is that I think renewables and batteries will put a damper on profits. The fossil fuel industry has been among the world’s most profitable for well over a century. I expect those profits to decline.
Energy profits will decline not because renewables are cheaper but because they are spreading rapidly and operate with near zero marginal cost.
Zero marginal cost (where all the cost goes into the initial investment) is an inherently low profit business model. Marginal costs, not total costs, form the floor market prices tend not to sink below.
I hear counterarguments like “solar is only spreading because of subsidies”. It doesn’t matter whether that’s true or not. It’s still spreading.
When the sun shines, owners of solar start producing electricity at zero cost (at the margin). Nobody buys fuel to heat up water. So they will just dump that onto the market at any non-negative price they can get, pushing down fuel prices.
Carrying water for the rich rulers of the United States, I see.
Just keeping your head down and work for the man, Asian techno peasant.
IRON MIKE
some 3rd world countries start rapid industrialising and becoming emergent economies.
Which countries do you have in mind? China has been all the demand growth there was since 2000, and I guess people saw it as inevitable. But China may be the last country to bootstrap itself on oil burning.
Some of the best performing low income countries are noticeably moving away from combustion engine transport. This includes government policy to reduce iol dependency.
Vietnam:
https://news.imotorbike.com/en/2025/07/hanoi-petrol-motorcycle-vietnam/
Ghana:
https://www.vanguardngr.com/2023/03/ghana-removes-fuel-subsidy/
EV sales are increasing in many low income countries.
https://www.iea.org/data-and-statistics/charts/electric-car-registrations-and-sales-share-in-selected-countries-2020-2024
Other countries from Columbia to Uzbekistan are moving in the same direction. It’s a widespread trend. The change to electric two-wheelers is faster than to four-wheelers, and two-wheelers are more heavily used in low income countries.
Meanwhile demand is flat or falling in China and the OECD. I am not bullish on oil demand. It’s hard to see where it will come from.
Alim,
I am not sure about any of it but there seems to be plenty of 3rd world countries where standard of livings could improve in expense of environmental damage of course.
I think India will at one point overtake China in FF consumption, maybe Bangladesh and Sri Lanka or some north African countries also start industrialising, since they have the resources for it, they just need the government to implement it.
Let’s say i am hypothetically right. The transport industry as you say might be orientated towards electric but all other activity such as city building, town planning, infrastructure projects, farming, medicine etc will all use FFs, which will drive up demand. Also with such a scenario, increase trade will also use more FFs. With increase standard of living and wealth people will start travelling more etc etc at least for the short-med term.
On OECD and China, demand will most likely continue to fall since birthrates are declining. At one point we might even see peak consumerism in these countries. But big business lobby will probably stop this by increasing immigration to those countries to drive up demand for their goods and services.
In saying all this i can see why you aren’t bullish on oil demand given your world view.
But also take into account Dennis’s OPEC update that we are commenting under. World total liquid fuel production and demand continues to increase. And oil and resource companies are still producing the harder to reach oil. Even coal companies might make a big comeback for data centre powering. So i am personally on the fence until i see a radical tide change.
Iron Mike
I think there is an unspoken assumption that developing countries will follow the path of rich countries, because that’s the only way to do things.
But the truth is that developing countries develop by importing what developed countries do now, not what they did, fifty, a hundred or two hundred years ago. Steam trains helped make America great, but they are no longer relevant. Developed countries aren’t trying to sell them to developing countries any more.
Most countries in developing Asia, Africa and Latin America trade with China more than any other developed country. That even includes India. Developing countries are likely to use the tech that China exports to them to build their economies.
And what is China pushing? EVs, electric trains and solar energy.
Alim,
I dont agree with your view, for me its partial and not whole.
Yes China exports to all the countries you mentioned.
And what does China import ? Petroleum and liquid fuels is at least in the top 3. What else ? Iron ore for infrastructure and steel for domestic use and exporting, agricultural products, mining minerals and metals for building electronics and all the tech you are talking about. Most if not all those activities is done by fossil fuels or require fossil fuels in one or several stages.
EVs and electrification in China is worthwhile because they manufacture everything domestically. And obviously it is profitable for them to do so. They aren’t doing it for philanthropy or because they care about the environment or climate change, they are profiting off the green gravy train. And incase you missed my post in the last thread, as of 2023 China energy mix was over 87% from FF.
https://www.iea.org/countries/china/energy-mix
The way you guys talk is as if China has transitioned entirely to renewables and isn’t using any FF. Bloody over 87%!
Look if you have any other country in the world who is not a manufacturing powerhouse, Doesnt have cheap labour, doesn’t have the infrastructure to produce at a mass scale. If that country is sitting on a mountain of gas or coal, it would be cheaper for them to exploit the domestic resources rather than buy solar panels on a mass scale from China. That is my contention, i could be wrong but that’s how i see it, i don’t believe in blanket statements such as “renewables are cheaper everywhere”. It depends on the specific location we are talking about and the various factors specific to that location. The earth is not a static place, it is extremely dynamic.
Iron Mike
The fact is that China did use coal and oil to grow its economy, but it is not exporting that model, because times have changed.
Consider the case of Pakistan. 10-15 years ago China sold Pakistan a bunch of coal fired power plants to deal with their rolling brownouts, aka “load shedding”. It didn’t work very well as demand kept growing faster than supply, mostly thanks to the spread of air conditioners (also from China).
But a few years ago Pakistan started importing solar panels. This was mostly for rooftop solar. Check out the satellite imagery of Karachi. Pakistan installed more solar than Germany in 2024. Now the load shedding problem is diminishing, but the coal fired power plants are going bust. In fact the grid is sort of failing.
Here’s an interesting article about the story:
https://www.weforum.org/stories/2024/11/pakistan-solar-power-energy-transition/
Meanwhile China is still burning lots of coal to meet its rapidly increasing electricity demand, but also installing solar at a mad rate. In May installations hit 93 GW. May has 31 days, so that’s 3 GW a day or one GW every 8 hours.
Put another way, that May installation rate for solar only in China only was more than a terawatt a year, though it may not be maintained. Compare that with the current generation capacity of the United States, which is about 1.2 terawatts.
https://en.wikipedia.org/wiki/Electricity_sector_of_the_United_States
Times are changing. The trusty old “that has happened yet so it will never happen” argument doesn’t work in an environment like this.
The China boom started about 1980. Coal was a cheap way to fulfill the country’s growing energy needs. Since then the price of solar has fallen about 99.8%. The price of coal has not. There is no reason to expect the next generation of development to repeat the previous ones.
China’s current panel production capacity is about 1.5 terawatts. That means Chinese companies will be looking to export at least a half a terawatt of generation capacity this year.
Alim,
The Pakistan story is quite incredible, just read an article on it. Some quotes from the article:
https://www.japantimes.co.jp/environment/2025/07/17/energy/pakistan-solar-national-grid/
“Residents have taken the decision out of clear frustration over our classical power system, which is essentially based on a lot of inefficiencies.”
“Last month, the government imposed a new 10% tax on all imported solar, while the energy ministry has proposed slashing the rate at which it buys excess solar energy from consumers.”
The governments instable grid high electricity prices to collect money has caused people to move away from the grid. It is a unique situation here, in which the government now instead of giving incentive to move away from the grid is punishing people using solar by proposing 10% tariffs it seems as well as reducing the $/kWh rate of solar back to grid. Quite unbelievable and sad.
Times are changing. The trusty old “that has happened yet so it will never happen” argument doesn’t work in an environment like this.
I agree, i never posited that it won’t happen. I just don’t know and yet to be entirely convinced.
Iron Mike,
I simply think we will electrify as resources deplete, timing is unknown as I also lack clairvoyance.
Iron Mike- to Dennis “I dont subscribe to your premise that we electrification will save the day”
I have no comment on anything being saved,
but will point out that 1-2 Mbpd of petrol consumption is currently being offset by EV, and to a lesser extent nat gas vehicles , currently in the world.
By 2030 the predictions are that about 5 Mbpd of petrol demand will be offset by global EV, with about 1/2 of that being in China.
That degree of offset by 2030 will be a significant feature of the overall demand/supply curve. Imagine the scenario/charts with an extra 7 Mbpd demand for oil on board, if the offset was not present.
Why do I say 7 Mbpd rather than 5? Simply it takes 7 barrels of oil to derive 5 barrels of transport fuel, considering that gasoline and diesel comprise just about 70% of the refined product output.
post script side comment- also realize that by 2030 there will be an escalating frenzy developing in the global EV industrial supply system as countries around the world see the decline in oil production capacity staring them in face, especially the petrol importing countries which comprise the vast majority. Will be interesting to watch. Hats off to China.
Hickory,
1-2 Mbpd of petrol consumption is currently being offset by EV, and to a lesser extent nat gas vehicles , currently in the world.
I am not seeing that in the data though. I might have missed it, how are you drawing that conclusion ?
You wouldn’t see the avoided petrol consumption in oil data since you would be looking for a clearly defined hole in sloppy data.
So if we want an estimate we have to rely on sources who attempt to tease these thing out based on what data is available, which of course is also very sloppy. But if you do post the question to the web and try to stick with reputable sources you get numbers in the 1-2 Mbpd ball par.
This is not to say that EV’s have made oil consumption do down, rather that it is not quite as high as it otherwise would have been, so far. Early trend.
Iron Mike,
World C plus C production has been pretty flat from 2018 to 2024, where the historical rate of growth from 1982 to 2018 was at an annual rate of about 800 kb/d. So the lack of growth may imply some transportation demand for the products of crude has been replaced by electric transport.
At the end of 2024 there were about 39 million battery electric vehicles on the road. let’s say each of these displaced an ICEV that averaged 30 MPG and travelled 12k miles per year. That is 400 gallons per vehicle or 9.52 barrels per vehicle times 39 million is 371 million barrels per year. Divide by 365 days per year and we have about 1 MB/d of fuel demand displaced. This ignores the plugin hybrids (about 21 million of these) or about half as many as BEVs. If we assume 50% of miles come from ICE and 50% from battery we would have another 0.25 Mb/d of fuel consumption displaced by plugin hybrids. That would bring the total at the end of 2024 to about 1.25 Mb/d of reduced fuel consumption. Over time this number is likely to increase.
DC,
At the end of 2024 there were about 39 million battery electric vehicles on the road.
At the same time how much ICEV are there ? Has that level dropped in that past recent years ? There could be just more cars on the road! Doesn’t mean ICEV oil consumption is decreasing necessarily. I understand your hypothetical that those EVs are taking the demand away from the liquid fuels. What would be a signal is if ICEVs are decreasing.
It is actually quite complex.
Maybe one way would be to see how many registered EVs in a given year vs how many registered ICEVs in a given year. And include hybrids and gas maybe in that. See if ICEVs are in negative growth or no real movement, while the whole stock is increasing or around the same might signal ICEV decline.
Global data would be limited for sure. Maybe we can look at that domestically. Just off the top of my head if EVs are increasing while ICEV remain steady & total registered vehicles are increasing it means there is just more cars on the road. Doesn’t mean oil consumption is decreasing necessarily.
Look if we really care about climate change, a better approach would be to reduce vehicles on the road period. And decrease overall consumerism. Anything other than that is us wanting our cake and eating it too in my worthless opinion.
Iron Mike,
Yes fewer ICEVs on road would be a good thing, the point you seem to be missing is that the claim is simply that consumption would be higher if there were fewer EVs and CNG vehicles. The process will take time.
Also if we look at the trend in gasoline and diesel fuel consumption from 1982 to 2019, the average annual rate of increase was about 668 kb/d, from 2019 to 2024 the rate of increase was about 167 kb/d, so something has changed, some of the change may be more people driving EVs and the use of CNG in trucking.
A second factor is ICEVs becoming more efficient with more hybrid vehicles sold. My Prius averaged over 50 MPG and my Camry Hybrid about 40 MPG. This also is a factor in reduced oil consumption.
Yes hats off to China for convincing people they are becoming an eco state.
https://blog.agchemigroup.eu/chinas-dirty-industry-coal-to-chemicals/
The fact is the Chinese dictatorship has enabled an industrial complex to pollute the soil and consume fresh water to dangerous levels.
https://www.bakerinstitute.org/research/how-chinas-water-challenges-could-lead-global-food-and-supply-chain-crisis
Iver. China is a big oil importer and they don’t enjoy that costly and vulnerable position. So their industrial policy is a very rational response to their situation.
And yes, the whole earth is grossly overpopulated with our very destructive species.
Also taking bite out of oil demand is the presence of nat gas vehicles-
“The world’s total CNG vehicle fleet was 22.3 million, which covered 2% of all vehicles” with Iran, China and Pakistan being the top three countries.
In the US there is increasing penetration in the local heavy truck fleet used for garbage hauling-
“Mar 3, 2021 — Currently, as much as 30 percent of North American routed solid waste fleets are CNG” and over 60% new sales are CNG.
Iron Mike wrote:
“So you are seeing a secondary peak at 2028. I can see this happening if some 3rd world countries start rapid industrialising and becoming emergent economies.”
Another peak in 2028 possible because (besides industrialization) of the expansion of the middle class in for example China, India, and some African countries. Transportation burns by far the most crude oil derivative products
“Countries experiencing rapid industrialization are often termed Newly Industrialized Countries (NICs), a category that includes nations such as China, India, Malaysia, Thailand, the Philippines, South Africa, Turkey, Brazil, and Mexico.“
Iron Mike,
Note that the Scenario for World C plus C presented in the post assumes OPEC fully unwinds the cuts put in place after 2022. This assumption may prove to be incorrect, in which case output would be lower at the peak. As always my scenario is certain to be incorrect.
Rig Report for the Week Ending July 18
The rig count drop that started in early April when 450 rigs were operating, continues but the drop is slowing.
– US Hz oil rigs dropped by 3 to 380.
– New Mexico rigs were up 1 to 81 while Texas dropped 4 rigs to 204. Texas Permian dropped 4 to 166.
– In Texas Midland was up 1 to 18 while Martin was flat at 24. Loving added 1 to 21 while Reeves dropped 5 to 23
– In New Mexico Eddy was unchanged at 40 while Lea added 1 to 41. Lea is down 9 rigs from the end of February while Eddy is down 5.
– Eagle Ford added 1 to 34.
– NG Hz rigs added 10 to 104. Of the 10, 2 were added in Texas and 3 in New Mexico.
Frac Spread Report for the Week Ending July 18
The frac spread count dropped by 6 to 174. It is also down 54 from one year ago and down by 41 spreads since March 28.
Stupid qiestion. When will the number of fracspreads be close to zero?
Jean
I checked some older records and here is what I found.
December 23, 2015, 180 spreads and climbing after that.
May 15, 2020. Depth of Covid. 45 spreads and starting to climb.
So spreads today are back to the late 2015 levels. However I don’t think we can compare today’s spreads with those in 2015. Some of today’s spreads are Triple Fracs.
“Chevron will boost the so-called triple fracs — fracturing three wells with one frac spread at one time — to more than half of its wells in the Permian basin, a Chevron executive told Reuters, amid efforts to reduce the costs and times of fracking at the world’s top shale basin.
Chevron plans to use triple-frac on between 50% and 60% of its wells in the Permian, up from 20% of wells “triple-fracked” last year, Jeff Newhook, a completions operations manager at the U.S. supermajor, told Reuters in an interview.
The triple-frac reduces by 25% the time to bring wells to production. This leads to a 12% drop in Chevron’s cost per fracked well in the Permian, Newhook said.”
https://oilprice.com/Latest-Energy-News/World-News/Chevron-Expands-Triple-Frac-to-Half-of-Its-Permian-Wells.html
Well I was telling you guys this for years. While being called full of shit, among other things by you “enlighten folks”, turns out I was right. The difference between those that make a living at being right and most of you is measured in millions if not billions of $$$. Yes being right has its own rewards but coming back to laugh at you goobers is almost as sweet! I must admit with the energy demands of AI and the necessity of staying ahead in the global landscape pushing the climate change narrative off most media outlets, rather than the merits and facts, I will take it. No matter what the future holds hiding in a sod houses with power off and on by windmills and solar panels was never going to the answer. Going into the future with the mental and intellectual capacity to problem solve and an economic system the fosters and encourages that ,is the answer. Sadly, that leaves most here up the proverbial creek with no paddle.
https://oilprice.com/Energy/Natural-Gas/Natural-Gas-Dominance-Unchallenged-in-Global-Energy-Landscape.html
You call yourself Texas Tea, but yet solar and wind have experienced tremendous growth in Texas.
How do you explain that? A conspiracy by Texas Democrats?
Should we just take all that solar and wind off the grid in Texas? Answer the question and own up, don’t be shy.
very easy its called government subsidies. oh yes I am extremely maga, I hope that there is not one more windmill ever built in my beloved state. and now that they actually have to return a profit, they won’t. corruption is not a one party monopoly… texas is full of corruption or lets be kind, a dumpa$$ political class that will sell their sole for a free drink!
“climate change narrative”
A phrase brought to you directly from the MAGA war on science vocabulary
Texas Tea,
Natural Gas will also peak, probably around 2036 to 2040 at 476 BCF/d (gross gas minus reinjected gas). URR about 19000 TCF.
For natural gas scenario above the average growth rate is about 0.55% per year from 2024 to 2037 and about 0.65%/year from 2024 to 2034. From 2034 to 2042 output is pretty flat going from 473 BCF/d in 2034 to 476 BCF/d in 2038 and returning to 473 BCF/d in 2042 with average output over the 2034-2042 period at 475 BCF/d.
more charts, much like more cow bell, means nothing. Dennis apparently you believe charts, not science, not technology, not geology tell the future, if you were not such a nice guy I would call you a dumbsh!t. also I don’t take the time to post but nuclear here and around the world is on the move… nat gas to nuclear like I have said for years, is the overwhelming statical path to be the winner. As much respect as I have for Elon, to the degree solar plays a role it will depend on further technological advances. Wind is the 60 year super model the no one pays for anymore.
Texastea,
The chart is based on science, geology, and technology. It uses discovery data, historical output, and the Shock Model developed by Paul Pukite. See the book he published at a University Library
https://search.lib.utexas.edu/discovery/search?vid=01UTAU_INST:SEARCH&sortby=rank&lang=en&query=any,contains,1079007160
or
https://search.worldcat.org/title/1080633923
I think it will be every type of energy that is used. Including nuclear, solar, wind, batteries, and fossil fuel. There will be less natural gas than many foresee and exporting a dwindling resource is a poor plan in my view. In 10 years or less the LNG facilities will find there is not much gas to export and will be faced with stranded assets.
https://www.zerohedge.com/markets/chevron-nears-peak-permian-production-shifting-growth-billions-cash-flow
golden age of us energy has arrived
Texastea,
We will see how they do at keeping costs low as they run out of room in the sweet spots.
The IEA claims that global spare capacity including storage is 7 mmb/d and will reach 8 mmb/d by 2030.
https://iea.blob.core.windows.net/assets/493a4f1b-c0a8-4bfc-be7b-b9c0761a3e5e/Oil2024.pdf
Refineries are moving towards producing more chemicals and less road fuels due to the increasing sales of electric vehicles. It is predicted that by 2030 electric vehicle sales will approach 40 million per year.
Peak Oil which was a real concern 20 years ago is now little more than a footnote. Being overcome by new production technologies, but more importantly by new power technologies giving people transportation options we did not have before.
Iver,
There is a big disconnect between OPEC and IEA views of future oil demand. EIA forecast is between those, perhaps the average of all three might be a reasonable estimate, we don’t really know.
D C
You recently said that these organisations had access to vast amounts of expensive information. That they had detailed information of how much is produced by every country.
Now you are saying something quite different.
What is the disconnect in terms of barrels per day?
Iver,
They have access to proprietary databases that I don’t have access to, the conclusions one reaches from the data can vary. The IEA expects World liquids demand to be 103.7 Mb/d in 2025 and 104.4 Mb/d in 2026, OPEC forecasts World liquids demand of 105.1 Mb/d in 2025 and 106.4 Mb/d in 2026. The US EIA forecast for World liquids demand is 103.5 Mb/d in 2025 and 104.6 Mb/d in 2026, fairly close to the estimate from the IEA.
Dennis
Interesting information in Table 10.1. OPEC is really optimistic regarding production growth. From Q1-2025 to Q4-2026, 3.3 Mb/d of all liquids growth.
This month there has been a bit of controversy in what the IEA and OPEC report for crude production, especially for Saudi Arabia. It appears that the IEA reports production while OPEC reports supply to market.
“Riyadh is arguing that the standard practice – measuring oil production – wasn’t appropriate for the month, and that they should instead adopt a different metric called supply-to-market, said several people at the firms, who asked not to be identified as the process is private.
The Organization of the Petroleum Exporting Countries assesses members’ output using an average of external firms – made up of consultants and media outlets – known as secondary sources, and publishes these in a monthly report that is closely watched by traders.
The International Energy Agency – which OPEC dropped as a secondary source in 2022 – reported on Friday that the Saudis surged production by 700,000 barrels a day in June to 9.8 million, as the country led a rush by Gulf nations to export barrels out of the region during the Israel-Iran conflict. That would be in excess of their current quota.”
Attached is a table that compares June’s OPEC crude production as reported by the IEA and OPEC. There is a surprisingly large difference for the bigger producers. The IEA has much higher production for Iraq, Kuwait, UAE and SA, in total more than 1 Mb/d.
Also included in the last column is the potential December target production for a few of the OPEC countries. Those targets do not appear to be much of a stretch.
https://www.rigzone.com/news/wire/saudis_ask_opec_watchers_for_data_change_to_abide_by_quota-12-jul-2025-181121-article/
Ovi,
I agree the OPEC estimates seem optimistic, perhaps much of the growth is NGL.
Ovi,
I think it best to compare 2024Q4 to 2026Q4 due to seasonality. For 2024Q4 output was 105.5 kb/d according to the December 2024 MOMR and the current MOMR forecasts 2026Q4 as 106.4 Mb/d for total liquids, so an increase of 900 kb/d over two years when comparing the same quarter (fourth quarter in this case). That estimate seems pretty reasonable at 450 kb/d per year especially considering the rapid growth in natural gas output which leads to high NGL output growth.
Great insight from Novilabs
Headline
This is exactly what Scott Lapierre predicted, but ignored by Scott Sheffield, boss of Pioneer Resources 1~0 years ago.
They over drilled 30~50% wells and got 30~50% less.
Isn’t this part of why he sold Pioneer to XOM?
Thanks for the graphs – could you please explain how you read the graphs to the right?
Global refinery runs hit an all time high.
https://www.iea.org/reports/oil-market-report-july-2025
Also in the same update;
“Observed oil inventories surged by 73.9 mb to 7 818 mb in May, led by OECD commercial product inventories and crude in non-OECD countries”
Those who were so sure peak oil happened in 2008 or 2018 have be proven wrong and electric vehicles have made the issue almost irrelevant.
https://www.precedenceresearch.com/electric-vehicle-market
Ivor,
Peak conventional happened long time ago. The talk back then was about that. Shale is just the end game, if we don’t count Green River of course.
Yes, I count 2007/8 as the peak, for several reasons. Primarily because the wheels have been falling off the world’s economies since then. If shale counted it would have brought prosperity but it’s just the dregs off the bar at closing time. EROEI is all that matters now. How much conventional oil is being wasted to drag unconventional out of the rocks by fracking? All that sand and chemicals, endless train trips, endless pads built across the nation. It leaves nothing for society as a whole after the services and parasites are paid. Otherwise we’d have new highways and bridges and cheaper food wouldn’t we. Just like we had in the original oil boom.
I can’t believe how everyone got sucked in by the shale ‘revolution’
Thompson,
Much of the fracking these days is electric with the electricity produced with natural gas, coal, wind, solar an nuclear power so although energy is used to produce tight oil, the energy does not necessarily come from oil. EROEI might be useful on a society wide basis, it is much less useful when applied at the individual product level (for oil production for example).
DC.
… At the end of the day, everything we build comes from oil and gas and coal, even solar panels from China.
But you can’t just isolate a well and say we run it on electricity. Was it drilled with electricity? Was the concrete made and the pad poured with electricity? Is the oil shipped to the ports on electric trains or diesel trains? Diesel I assure you.
Frac sand is a high-purity quartz sand that is injected into wells to blast and hold open cracks in the shale rock layer during the fracking process. That sounds energy intensive!
Many thousands of tons of sand — often 10,000 or even 15,000 tons! — are used per well in West Texas and southeastern New Mexico.
The cost of frac sand is usually priced per ton. Prices can range from:
Silica Sand: $25 – $50 per ton
Resin-Coated Sand: $45 – $100 per ton
Ceramic Proppant: $60 – $200 per ton
How does this sand get to the wells? Diesel trucks and trains naturally, after being dug up by diesel powered machines. And how does it get “into” the wells? It’s pumped down with vast volumes of water. Fracking requires a lot of water. More than 100,000 gallons of water are used to create a fracking well. Where does the water come from DC? Do you think they lay pipes all over the countryside, or ship it to site with diesel trucks? So you see a vast amount of diesel and other energy is consumed in this process of extracting oil from a single well, that will last only a short time. Shale wells have an extremely short lifespan. On average, production drops by more than two-thirds after one year and 95% after six years.
Transporting frac sand to remote drilling locations can increase the cost, especially if the sand travels long distances by rail or truck. Freight costs can sometimes exceed the cost of the sand itself, especially for companies located far from frac sand mines.
https://rbnenergy.com/enter-sandman-atlas-energy-brings-an-innovative-sand-solution-to-the-permian-basin
https://pontotocsandandstone.com/cost-of-frac-sand-load/
https://www.reuters.com/breakingviews/heart-us-oil-boom-is-slowing-2025-05-05/
During early May of this year, here in southwestern Pa. A natural gas well had 14 full sized diesel trucks delivering sand and water. From source to well, the trucks drove the 30 mile round trip 24 hours a day for 14 days. Making some reasonably guesses, it’s not unreasonable to figure those trucks consumed around 10,000 gallons of diesel.
The classic textbook for classic coventional fracking teaches that the proppant (sand here) should be uniform shape (best is sphere) and size (the narrower distribution and larger the size, the larger the porosity after settled in the fracture, and therefore providing largest permeability), and they also have to withstand the pressure in the fracture (which in the case of most shale basins at 10K feet and overpressured at 1.3, this implies ceramic.
And it is true all Bakken laterals prior 2013 are based on ceramic expensive uniform spheres). BTW, Bakken applied zero knowledge of Barnett shale revolution, and the production formation rock is tight feldspa and dolomite, not shale as in Barnett.
The Barnett revolution in ~2000 called for minimal or no need for proppant, and only more water — which is totally against classic textbook. But when revolution spread to Haynesville, given almost twice as deep and 4 times higher pressure, ceramic proppant was a must, and much less fluid was used, indeed water in Barnett was replaced by Gel as prescribed by textbook. The result is the first round fall of Haynesville in 2013-2014.
The back to Barnett revolution happened after 2015 oil price collapse, and ceramic proppant and gel were too expensive and Liberty brought the soul recipe of Barnett revolution to Bakken — slick water and sand. Then, slick water and sand were widely used in Permian, Marcellus and every major basin shale and tight oil and gas development, including the revival in Hanynesville in 2015/2016. Yes, Haynesville started to use high quality remote sand even though it is obvious even the highest quality sand can not handle the pressure in Haynesville. Imagine all the investment in ceramic proppant became obsolete.
Then, in 2019/2018, more and more basins started to use local (within 100 miles, instead of 100s miles) white or just ok quality sand, still meshed uniform size, and dried. Imagine all the investment in high quality white sand became obsolete.
Then in 2023/2024, local wet sand (non-meshed, not-dried and even non-dried with dirt and dust) are used, like the bulldozer exhume a sand like dirt near the well and unload it to the wellhead. They claim it has low carbon-footprint, and imaging all the investment in local sand became obsolete.
Thompson,
Diesel is a very convenient fuel to use, but the growth in diesel use has been much slower than the growth of the economy in constant international dollars (which uses purchasing power parity rather than market exchange rates).
DC
–Diesel is a very convenient fuel to use, but the growth in diesel use has been much slower than the growth of the economy in constant international…
To chart a real economic commodity against the constantly changing metrics of the financial economy, or a new theory such as PPP, doesn’t say much. The GDP value of most western nations now is radically different to what it was in 1990. Not because of booming real economies, but by adding things like insurance payments, stock market transactions, mortgage products and the like to bolster the figures. It’s a form of statistical sweetening that makes incumbent political parties look good because the economy is “getting better”.
But it’s only in the financial sector that these benefits are seen, down in the real economy bridges roads and electricity grids are falling apart and millions struggle to pay their bills. Something that was certainly not the case in 1990.
Diesel use has increased steadily over the decades and I seen no reason for it’s decline other than there not being enough coming out of the ground. It’s the master resource for any developing nation or one hoping to maintain it’s level of development.
Thompson,
The Purchasing Power Parity concept has been used for quite a long time, from Chat GPT Summary:
PPP-adjusted real GDP data was first used in the mid-20th century, but became widely adopted in economic research and policymaking starting in the 1970s, especially with the publication of the Penn World Table and the work of the International Comparison Program.
This is the measure preferred by those who study international economics.
Stock Market transactions are not a part of GDP. Nor are sales of old goods such as an existing home, though the real estate agents fees and closing costs would be a part of GDP for services rendered. GDP measures output of goods and services.
Lack of infrastructure investment is simply a matter of poor governance, elect more competent members of government and things may improve.
Diesel Fuel consumption for World from 1980 to 2024 in kb/d. From 2015 to 2024 the average annual rate of growth was about 0.28%.
Klim
I watched quite a few ASPO presentations and most started to include all forms of liquids early on.
https://www.youtube.com/watch?v=EIJ2AkebgyI
The graph Kjell presents includes NGL, Deep water, Heavy etc. and presented a peak in 2010.
Very similar to this.
https://www.researchgate.net/figure/World-oil-production-ASPO_fig3_237323890
They believed that the U.S would be down to 3 million barrels per day by now, what is it actually? 19mmd/d of total liquids.
The entire Middle East should be producing only 13mmb/d and have no spare capacity. In reality it is producing over 20 and has several million of spare capacity.
IEA were overly optimistic at the time as were others, but ASPO were badly wrong on the downside.
IVER,
Yes ASPO in 2004 believed the C plus C resource was only 2000 Gb, so they were about 1000 Gb too low and did not foresee how important unconventional oil would be (adding about 200 to 300 Gb of crude) and inconventional gas also added quite a bit of NGL, they also underestimated the conventional resource and future deepwater discoveries.
In general the future is difficult to predict. In addition concern over peak oil led to changes in consumption with more efficient vehicles and EVs being developed in response (also in response to climate change). So in some cases analysis of the future affects future action and thus changes the future, knowing in advance what the response may be is not possible.
The aspo Conference was in 2012.
They had not changed their predictions much in 8 years.
Even when tight oil was obviously changing the picture.
Iver,
The chart you linked was from a 2005 paper.
Here is I post I did in July 2012
https://oilpeakclimate.blogspot.com/2012/07/further-modeling-for-world-crude-plus.html
It was an underestimate of World C plus C as I did not anticipate the rapid increase in tight oil and extra heavy oil over the next 14 years.
In the blog post I left out my high scenario for the 2795 Gb URR estimate, it is included in the chart below, original spreadsheet at link below
https://docs.google.com/spreadsheets/d/1BsDCkGQyCnCYbVNCPaEDu-OMngosda3U/edit?usp=sharing&ouid=105320434049434900507&rtpof=true&sd=true
The medium scenario was my best guess in July 2012, it was an underestimate, but the high scenario was a bit higher than reality with 2018 output at 85 Mb/d and 2024 output at 85 Mb/d, peak was 2021 for the high scenario at 86 Mb/d.
The EIA expected tight oil production would increase to 1.3 Mb/d by 2029 in their Annual Energy Outlook from 2012.
https://www.eia.gov/outlooks/archive/aeo12/pdf/tbla14.pdf
and table 14 in spreadsheet linked below.
https://www.eia.gov/outlooks/archive/aeo12/excel/aeotab_14.xlsx
Tight Oil reference case from AEO 2012. By December 2012 I was paying attention to tight oil, but had much to learn. I was focused on only the Bakken and Eagle Ford at this point, this was where most of the US tight oil was being produced at that time.
https://oilpeakclimate.blogspot.com/2012/12/quick-update-to-tight-oil-models.html
In December I would have had October production numbers and currently the data says we had more than half of US tight oil output from Bakken and Eagle Ford (61%) of total. The data may not have been very good at that point.
Klim,
Green river kerogen is unlikely to ever be produced, that’s an energy sink rather than a source of energy, if used to try to produce liquid fuel. Potentially it could be burned like coal in a power plant to produce electricity, but from what I have read it would be far more costly than coal and would only be used in that manner if coal depletes enough to make it viable. We have a lot of coal in the US so it would be the year 3000 before that would be necessary. Not counting kerogen is the sensible move.
Big drop in North Dakota C+C production in May. Down 60,529 barrels per day.
Ron
Here is some background info.
“It is down about 5.16 percent from April to May, or about 60,000 barrels per day,” Anderson said. He said that was due to three main reasons.
“April completions were low, so May production was affected by those completion numbers,” Anderson said. “Number two, there was a lower oil price environment in April and May, and certain operators decided to curtail some production in certain areas of the state. You also note there was a slight rig count decrease.”
But Anderson said there is some better news.
“It’s my understanding that the operators who curtailed production are actually starting to turn those wells back on line, in this slightly better price environment,” Anderson said.
https://news.prairiepublic.org/local-news/2025-07-24/may-oil-production-numbers-for-north-dakota-just-over-1-1-million-barrels-per-day
Thanks Ovi. I read the article. It was very interesting. They have no idea where Chevron and Hess will invest theit money, They hope it will be in North Dakota….. They hope!
OPEC Reports a Global Oil Production Decline in 2024
By Irina Slav – Jul 03, 2025, 1:06 AM CDT
https://oilprice.com/Latest-Energy-News/World-News/OPEC-Reports-a-Global-Oil-Production-Decline-in-2024.html
Article is not well written, compares crude only vs total liquids vs total liquids demand. For the casual reader an absolute mess.
Updated US shale gas scenario with detailed scenarios for Marcellus, Utica, Haynesville/Bossier, and Permian and an approximation for other shale gas plays. Peak in 2026 at 93 BCF/d for dry shale gas in the US.
That’s eyebrow-raising, Dennis.
You have Haynesville growing for another 20 years… other authors claim that is near peak now….
OTOH, you have a very precipitous drop in Permian…. Given Ovi’s bubble-point charts of rising GORs, what does that say for Perm oil? You must have Perm oil going down to zero pretty soon, based on that…
Here is my Permian tight oil scenario, I assume GOR increases over time for the Gas scenario, about 55k wells completed as of June 2025, total wells completed for this scenario about 94k (another 39k wells after June 2025.
I assume oil and natural gas prices remain under $75/bo and $4/MCF.
The Haynesville/Bossier model may not be realistic, the URR is about 50% of USGS mean TRR estimate.
An alternative Haynesville/Bossier scenario that might be more realistic.
Using the Alternative Haynesville/Bossier Scenario above we get the following for US shale gas (other scenarios same as before), URR= 830 TCF.
Label for Haynesville should read Haynesville/Bossier.
Dennis,
That natgas production chart may become THE most wildly inaccurate projection that you have ever made.
Just … wow.
I realize that your focus has mainly been on oil and that you are working with limited data, but for you to suggest that the Mighty M will drop from ~25 Bcfd to ~10 Bcfd in about 6 years’ time is a beyond preposterous claim.
Some recent, real world data …
A ‘new’ kid on the block Greylock Production – has joined Seneca and CNX as the only operators currently targeting the Utica in Pennsylvania.
Greylock has 2 wells online in Potter county (3rd tier rock, certainly, by App Basin standards).
Both wells are approaching 2 Bcf in 3 1/2and 4 1/2 months online, flowing on restricted choke at 16 MMcfd, and should easily become the highest producing Potter county wells in a few years’ time.
The current leader – from JKLM, Terry Pegula’s now-dormant outfit) – is a Sweden Valley well approaching 10 Bcf cum.
About 60 miles west, Seneca continues to methodically bring online productive Utica wells in the fringiest northwest portion of the App Basin crescent. A 6 well pad – with the wells turned inline sequentially over a ~3 to ~10 month time-frame – has seen a couple of choke-restricted wells hit ~20 MMcfd over a 30 day calendar month.
All 6 wells should hit 6 to 8 Bcf cums within first 12 months’ production.
Again, this has been considered goat pasture-like acreage awhile back.
But … enough of my ‘cherry picking’. Let’s go to the other end of the spectrum and look at a currently producing Mighty Marcellus well located in Centre County … so far off the fairway that it cannot even qualify as Bumfuck Egpyt territory.
The Snowshoe Unit 2 was drilled and frac’d WAY back in 2012 …archaic by today’s standards.
With a cum of 3.3 Bcf – about $10 million dollars gross revenue at 3 bucks per – this well still produces over a half million cubic feet per day, 20,000,000 cubic feet per month, or about $60,000 PER MONTH gross revenue with minimal operating costs.
Dunno ’boutchoo, Dennis, but 60 thousand smackeroos each month would make for a very happy Coffeeguyzz. (There are a half dozen other active wells in Centre County at the 3 Bcf cum mark.)
Long story short, Dennis, it should be blindingly obvious that ultimate hydrocarbon recovery from this region will dwarf many current conventional estimates.
This from the guy that claimed that the Bakken would produce at least 30 Gb. Average well productivity is the important metric, not a few of the best wells you can find online. My scenario for the Utica uses an average well EUR of 12 BCF and for the Marcellus scenario the average well EUR is 16.5 BCF. Marcellus scenario has ERR at 183 TCF and Utica scenario ERR is 98 TCF fo a total Appalachian URR of 271 TCF. Current cumulative marketed production is about 111 TCF from both plays. If we assume peak occurs at 50% of URR, that would be at 135.5 TCF. In the past 12 months cumulative output from the 2 plays was about 11.3 TCF so we should be at peak in 2 or 3 years.
Gross revenue doesn’t matter much if taxes, royalties, operating costs and over head are equal to the gross revenue then profits (net revenue) are zero. Also keep in mind that the price at the wellhead is what matters and for small producers this might be $2/MCF rather than the $3/MCF that you quote.
Dennis,
1,500 Trillion feet recoverable from the Utica and Marcellus is what the 2021 NETL assessment calls for. Highly respected outfit, NETL. Main author is Boswell.
The assessment (45 page pdf) concisely presents the USGS and EIA’s assessments (along with BEG’s, WVU, and others) and includes a brief smattering of Geneseo/Burket production.
This paper includes real world examples – including an 8 well pad in Lycoming county – that ALREADY significantly surpasses presumed output from the USGS/EIA analyses.
Yeah, well over 1,000 Tcf is likely to emerge from the AB over many, many decades to come.
Thanks for the reference Coffeeguyzz. Good stuff.
Coffeguyzz,
I will go with USGS and Patzek.
Generally only 50 to 65% of TRR is profitable. We will see who is right, look back at your Bakken claims that we’re 3.5 times too high. Maybe if we divide your 1000 TCF estimate by 3.5 we will arrive at a realistic estimate, that would be about 285 TCF, similar to my estimate.
For Marcellus Saputra et al, 2021 have about 180 TCF, my guess is that Utica will be about half of Marcellus.
https://fossil.energy.gov/app/DocketIndex/docket/DownloadFile/771
Link above for Saputra paper. This does not make the very basic mistake that Boswell makes in assuming that undrilled areas will have output similar to sweet spots.
Also URR never reaches TRR, when economics is considered URR iis never more than 67% of TRR, and a more typical number is
60%.
Coffee,
The nice thing about looking at things through rose-colored glasses is that all those red flags just look like …. flags.
Rig Report for the Week Ending July 25
The rig count drop that started in early April when 450 rigs were operating continues and drops to another recent low.
– US Hz oil rigs dropped by 5 to 375, down 75 since April when it reached 450.
– New Mexico rigs were unchanged at 81 while Texas dropped 5 rigs to 199. Texas Permian dropped 2 to 164.
– In Texas Midland was flat at 18 while Martin dropped 1 to 23. Webb county dropped to 3, down 4 from 7.
– In New Mexico Eddy dropped 1 to 39 while Lea added 1 to 42.
– Eagle Ford dropped 4 to 30.
– NG Hz rigs added 3 to 107.
Frac Spread Report for the Week Ending July 25
The frac spread count dropped by 6 to 168. It is also down 69 from one year ago and down by 47 spreads since March 28.
I will go with USGS and Patzek.
Generally only 50 to 65% of TRR is profitable. We will see who is right, look back at your Bakken claims that we’re 3.5 times too high. Maybe if we divide your 1000 TCF estimate by 3.5 we will arrive at a realistic estimate, that would be about 285 TCF, similar to my estimate.
New posts are up
https://peakoilbarrel.com/short-term-energy-outlook-july-2025/
and
https://peakoilbarrel.com/open-thread-non-petroleum-july-26-2025/