This is a guest post from Jean Laherrere. There are 12 graphs in this post. I have added a “continue reading” break in this post after the first three. I will do this for all long posts.


This is a guest post from Jean Laherrere. There are 12 graphs in this post. I have added a “continue reading” break in this post after the first three. I will do this for all long posts.
THC Add up the tank volumes 14 + 10.5 + 5.9 = 30.4 Mbs. Regardless Cushing is a big beast
On reaching new highs in production: Quite a few conventional wells (and the rare unconventional) are choked back for longevity.…
From Energy Aspects: “China has not stopped buying crude. It has stopped buying crude for now. What our proprietary data…
Hi Ovi, If Canada’s premier crude oil storage hub only has a capacity of 20 mmbbls, Cushing really is a…
Neither did I?
98 responses to “Oil peak in North Dakota & Montana”
Great post!
I said the Bakken would post in 2014 as well.
I’d like to suggest something to all the graphing guys out there with their projections.
There is understandably a focus on initial production per well per each layer of geology. And similar focus on decline rate in year 1 thru oh, maybe 3.
It would be particularly useful for there to be some focus on wells drilled 4 years ago, or 5, but strictly provided they were wells with multi stage fracking, which my recall is was just getting started then. A fairly substantial impact on these projections is the ultimate total recovered and these areas under the far right portion of the curves is a big determinant of that. Long term history data for even that area and that geology didn’t come from multi stage fracked wells. So . . . we may now be able to start getting that.
Watcher,
Rune Likvern is the only person I know of who has this detailed data. It takes quite a bit of digging in the NDIC database to get this information. My understanding is that the number of wells meeting the criterion of multistaged fracked wells that have been in production for 5 years is fairly low, probably about 400 wells at most (only about 500 wells were added in 2007 and 2008 in the Bakken). Any wells starting production after Dec 2008 would be less than 5 years old, this is a pretty small number of wells to get an idea of the long term production profile, if we add in 2005 and 2006 to the mix it only bumps the number of wells up to 600 wells at most.
DC
Yeah, I understand that. It doesn’t have to be a purely statistical grab of substantial sample totals. The point of the exercise would be shale oil declines in the out years perhaps as a function of particular geology. Meaning 400 samples is plenty if 30 from one geology behave in a given fashion while 50 from another geology behave in a different fashion. Get that, and of course the sub surface geology maps and then you have some solid basis for projections.
One has to presume the companies have this. And projections.
No doubt the oil companies do have this information. It is proprietary and is not shared. If you can find it I would love to see it. At this point we can only guess at what happens beyond year 5, and even years 3 and 4 have pretty limited data.
DC
Jean,
Excellent charts… thanks for the great work. I did have a one question. Why have you chosen the 2.5 Gb figure over Dennis 8.4 Gb as ultimate reserves in the Bakken?
steve
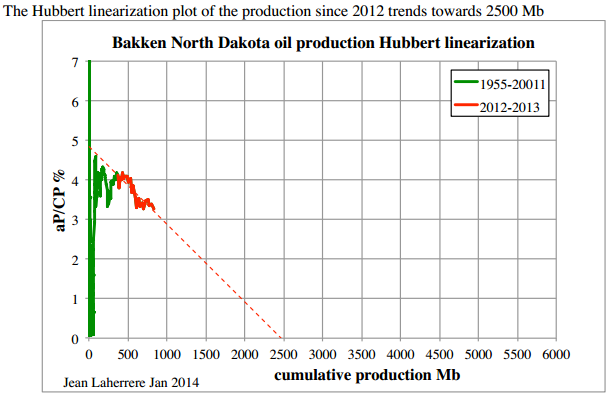
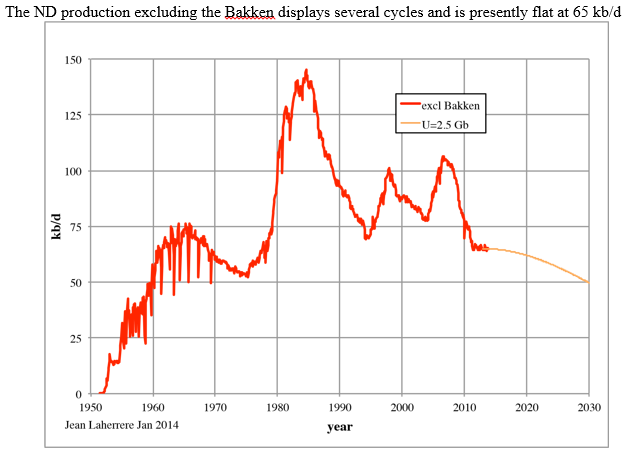
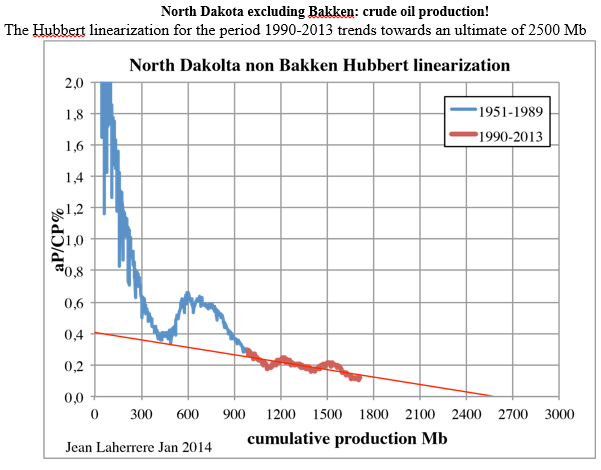
Steve, he really didn’t “choose” 2.5 Gb, that is what the Hubbert Linearization pointed to. That is also what the non-Bakken linearization indicates also. So the two combined would equal 5 Gb. The non-Bakken has already produced 1.7 Gb.
Ron,
Okay… thanks for the response. Well, let me ask this question. What would be the more accurate representation of future production… Jean’s chart or Dennis?
steve
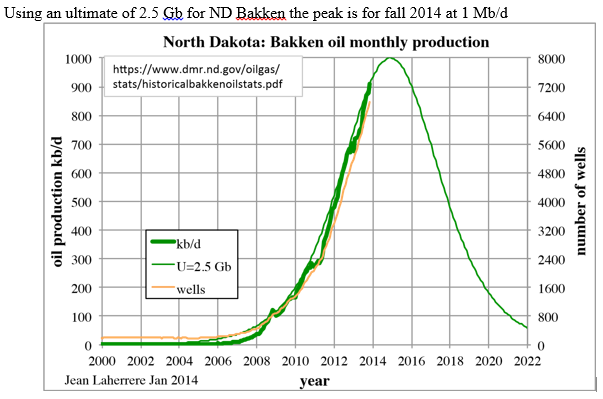
I haven’t a clue. But understand Jean is predicting when the Bakken will peak but is not actually “predicting” the ultimate production. He is simply showing you what the Hubbert Linearization indicates.
This was, of course, the motivation for noting that we just about now start having data that can be informative about ultimate recovery.
Ron,
Thanks again. Whatever the outcome, it looks like things are going to get interesting from here on out. I believe it was Euan Mearns who stated on this blog that there would be enough drilling rigs to increase either Shale Gas or Shale Oil to the optimistic assumptions made by the industry… but not both.
steve
Hi Steve and Ron,
Take a close look at the Non- Bakken Hubbert Linearization and note that at different points in time one would get very different results for a URR using Hubbert Linearization. When cumulative production was at 400 Mb the HL pointed to a URR of 500 Mb, when it was 1100 Mb, URR about 1200 Mb, and now it looks like 2500 Mb.
The question then is why would one believe the Bakken HL that points to 2.5 Gb, maybe down the road the HL will point to something 3.4 times higher than 2.5 Gb (which is less than the factor of 5 increase we see for the non Bakken HL, from 500 Mb to 2500 Mb).
DC
Jean Laherrere just posted me this.
Ron
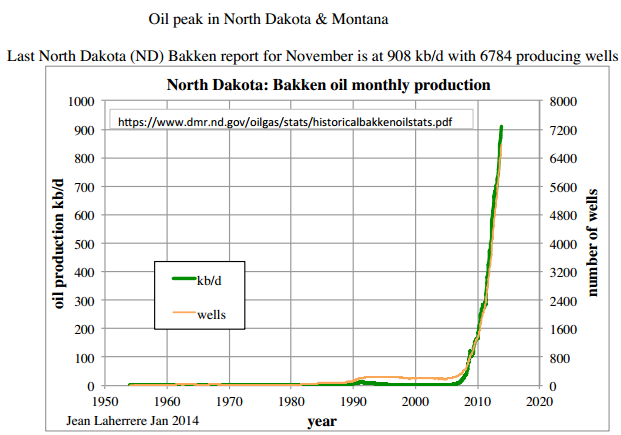
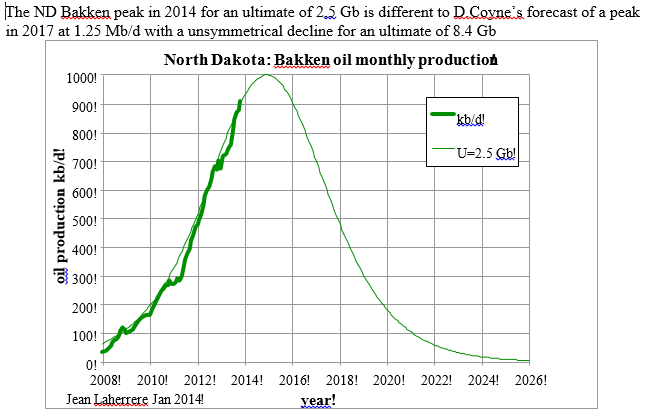
I do not trust the Hubbert linearization because often there are several linear cycles or the trend is curved or bumpy it is interesting to see the second approach which is to correlate oil production and n-umber of rigs but there are two assumptions the shift (one year for Montana and two years for ND) and the levels of the two peaks.
Using only one approach is uncertain but uncertainty is reduced by using two approaches
best regards
jean
This is a very important post. It goes into my fracking lectures immediately, and it also serves as a minimum time frame for the wheels coming off, since fracking in the US appears to be keeping the global production curve flat to slightly rising, with the important expectations built in to that.
BTW, I heard somewhere that California had vast (?) shale oil potential but water scarcity is a problem there. Why not truck or pipe in seawater from the coast? Adds to EROEI problem, of course.
D3PO,
Not sure what the chemical reasons are, but I believe fraccing requires fresh water. The guar gum they use will thicken in sea water, so it can’t be that. So it must be to do with some other of the chemical cocktail they add to the mix.
So the drillers are going to be competing with the farmers and the towns poeople for the scarce California fresh water supplies. The drillers would most likely out compete the other if it turned to a price war, so it will become a war of politics and votes.
Australia will have the same problems if/when we go down the shale route in any big way.
David Hughes’ Drilling California report is here along with a two part investigative piece which features him. Worth watching…
Hughes interviewed on California shale report at Kern Golden Empire
Post Carbon Institute 2013-12-03
Excuse me, it serves as a maximum time frame, as other factors could trip up the paradigm in the meantime.
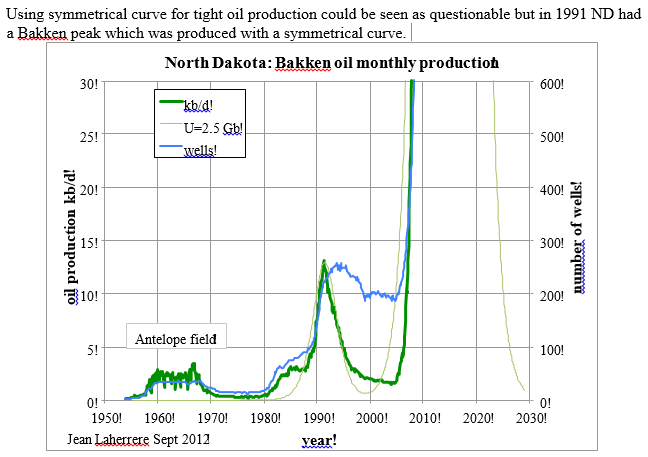
Thanks, Ron and Jean. The production boomlet ca. 1991 courtesy of Gulf War I is interesting, I’d noticed the corresponding one for the Austin Chalk but had never zoomed in far enough on ND to see if something similar happened. Charting production and price per month in that era would be interesting/instructive. Doubtless drillers went nuts in other states at the same time too, and if prices had been sustained likely we could have seen an earlier manifestation of what we’re seeing now, contrary to the ignorant claims that recent gains are courtesy of advances in tech.
Believe it or not, that would make the drilling (even more) uneconomical; also consider the political climate in CA. Have you followed any of the news about the headaches involved with the Keystone line? Now do the same in far more densly populated/enviro-conscious California. Yes, it’s just water for the fracking OH MY GOD EARTHQUAKES THINK OF THE CHILDREN OMG! California Water Crisis May Head off Potential Oil Boom – NASDAQ.com. Read the Chris Nelder article linked there too, which covers recent work by Dave Hughes on the Monterey Shale.
Japan Posts Record Annual Trade Deficit as Import Bill Soars
By Chikako Mogi and Keiko Ujikane, Bloomberg, Jan 26, 2014 7:51 PM ET
Japan reported a record annual trade deficit last year as energy shipments and weakness in the yen pumped up the nation’s import bill.
— snip —
“It’s hard to anticipate when Japan can emerge from trade deficits at this point,” said Takeshi Minami, chief economist at Norinchukin Research Institute. “If a trade deficit as a result of high energy import costs makes Japan look like a high-cost country, it may discourage moves by companies to have production centers in Japan and undermine Abenomics.”
Sorry… Here’s the link,
http://www.bloomberg.com/news/2014-01-26/japan-record-annual-trade-deficit-shows-import-drag-on-recovery.html
TransCanada Working to Restore Gas Service After Pipeline Fire
By Hugo Miller Jan 26, 2014 10:27 AM ET
TransCanada Corp. (TRP) says it’s working with Manitoba Hydro to restore regular natural gas service to nine communities in the central Canadian province after an explosion on one of its pipelines forced a shutdown on the line.
— snip —
About 4,000 homes in the nine communities don’t have heat, according to the Canadian Broadcasting Corp.
Scientist’s report casts doubt on Clark’s LNG figures
MARK HUME, VANCOUVER — The Globe and Mail, Published Tuesday, Jan. 21 2014, 10:44 PM EST
But David Hughes, a geoscientist with the federal government for more than 30 years who now works as a private consultant, says in a report posted online that the numbers do not add up.
“The LNG export plans of the B.C. government are unlikely to be realized at the scale envisioned and must be seriously questioned,” he says in his report, BC LNG: A Reality Check.
— snip —
Mr. Hughes said the NEB has been approving export permits at an unsustainable rate.
“The NEB appears to have violated its mandate to ensure Canadian energy security by approving seven LNG export applications, which [would permit exports that] add up to more than the current gas production of all of Canada,” he states.
From David’s report…
I ran the Hubbert linearisation myself last week. I found the same results. So far so good. Nevertheless: an extrapolation of a short sequence of more or less linear data points to a far away crossing with the X-axis is a tricky business. It is better to build the Hubbert curve with an assumption of U. I ran the model with U=3.7 Gb. Why 3.7 Gb? It’s an assumption. And it is somewhere in between Laherrere and D.Coyne so it must be right… The main reason for the 3.7Gb is: it gives a good fit with the data.
More important: I recognised some bumps in the data. During the winter the oil production grows less fast. These bumps seem to have a seasonal cause indeed. So I adapted the Hubbert curve by adding a sinus with an amplitude proportional to the value of the Hubbert curve.
In the chart you see the data in red. The Hubbert curve and the season effect model show up in blue and green respectively. You may see that the season effect model fits the data really well.
The proof of the pudding may be the eating, I believe the proof of the model is the way its first derivative fits the way the data change. On the right hand scale I plotted the first derivative and the change in the data. I took the 5 month moving average to get rid of the noise.
During a significant period the first derivative changes form positive during summer to negative during winter. This means the oil production will show several distinct peaks. It will be a bumpy ride, whatever the value of U will turn out to be.
Conclusion: Peak enthousiasts should remember: “One swallow doesn’t make a summer.”
Here is the chart, I hope…
Hi Verwimp,
Nice Job. There are a number of critiques of the Hubbert Linearization technique by Stuart Staniford, Robert Rapier, and Paul Pukite (aka Webhubbletelescope). The bottom line is that it tends to miss the mark quite often, particularly if we are basing it on a short time interval such as two years. Another consideration is that about 0.35 Gb of C+C had been produced from the Bakken by Dec 31, 2011, and proved reserves for Bakken ND were about 2.2 Gb at the end of 2011 (difference of 2011 and 2004 reserves, I assume all reserves added from 2005 to 2011 were from the Bakken/Three Forks. see http://www.eia.gov/dnav/pet/hist/LeafHandler.ashx?n=PET&s=RCRR01SND_1&f=A
So 2.55 Gb of ND Bakken C+C either produced or in proven reserves by Dec 2011.
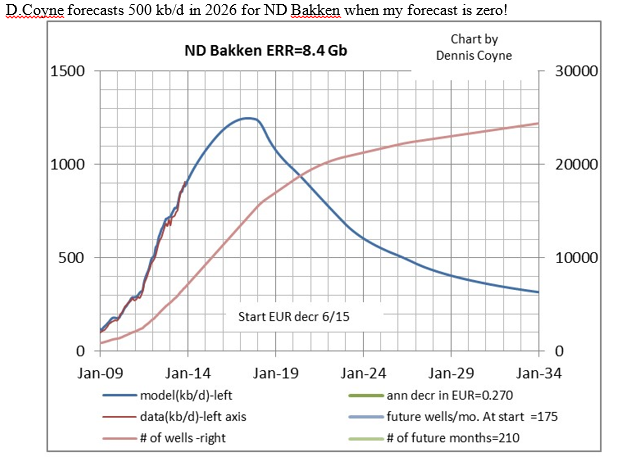
If the URR of the Bakken Three Forks is 3.7 Gb, this implies that discoveries and reserve growth in the ND Bakken/Three Forks will be no more than 1.2 Gb. The most recent estimate of the Bakken/Three Forks by the USGS(US Geological Survey) was for 5.8 Gb of undiscovered technically recoverable resources(TRR) with a 95 % probability that the undiscovered TRR would be more than 3.5 Gb
(URR=6 Gb=3.5+2.5). My 8.4 Gb ERR scenario is based on the USGS mean estimate of 8.4 Gb for the Bakken/Three Forks. I have created a very low ND Bakken/Three Forks scenario with a TRR of 4.2 Gb which likely has 99 % probability of being too low.
This scenario assumes the EUR of the average new well starts to fall in Dec 2013 and reaches is maximum rate of decrease by June 2014 (an annual rate of decrease of 40 %). Note that a decrease of the average new well EUR is a shift of the well profile curve, rather than a movement along the curve (where we see the decline rate high at first and lower in later months). The rate of decrease in new well EUR is how long it takes to shift from a higher to a lower well profile. See chart below.
DC
Hi Dennis, Thanks for your comment. The main purpose of my analysis was not to predict the absolute peak, nor to predict wether the downslope will be symmetrical or not compared to the upslope. Others do that kind of analysis better than I do, I presume. The main purpose was to model the seasonal effect. And to show clearly that during the period surrounding the peak, a number of distinct peaks will most probably occur. During that period there is virtually no growth in the Hubbert curve, so the change is driven by the seasonal effect. The same series of ups and downs can be added to your assymetrical model as well.
I believe at least one of the datapoints in the coming 4 months will be lower than the previous one (or it will be revised downwards.) There will be comments about the death of ND Bakken shale oil, but these comments will turn out to be an exaggeration. Nevertheless it will take some time to recover from this winter. It will be more difficult to recover from the next winter (’14-’15) and it needs a lot of extra U in the model to bring the fall 2016-peak to a higher level than the fall 2015-peak.
Data are interesting, but the way they change is intriguing!
Verwimp,
Yes I liked the ups and downs of your analysis, in practice it will be somewhat more random than the sinusoidal shape of your seasonal estimate, but yours is more realistic than the smooth shape of my curves which attempt to show a possible trend (if the assumptions of the scenario are nearly correct which has a pretty low probability), if one took the centered 12 month output in order to smooth the data it would probably follow my smooth curve closely (if the assumptions were correct), the month to month data are always noisy, and there are the seasonal effects which your model does nicely.
DC
On the chart above the x axis was poorly done as pointed out by a helpful person.
a better chart can be found at the end of the comments.
Here’s another piece this one from Forbes that is exactly like every other piece I see in the msm about the price oil in the one respect that probably matters the most; the msm writers seldom if ever mention depletion of conventional old oil fields.
http://www.forbes.com/sites/jamesgruber/2014/01/26/shale-oil-charlatans/
As a matter of fact they manage to avoid mentioning depletion in the same fashion as the referees of a so called professional wrestling match manage to miss seeing the bad guys cheat.
If they do mention it, they poo poo it as a figment of the imagination of peak oil nuts.
They are in fact so good at failing to take depletion into account that the public isn’t aware that it even exists.
Well OFM, while it doesn’t get into depletion, this is actually a jaw-droppingly accurate depiction of EROEI, and he at least tests the waters regarding talking about the impact that is having, and will continue to have – such as ending economic growth as we have known it for 250 years. As one who has regularly bashed the MSM, and especially the official business wing of the corporate media, I have to give credit where it’s due. I never thought I would see such an honest discussion of, as he puts it, ‘the real (energy) economy’ vs. the money economy in a publication such as Forbes. Wow. I wonder how many who read it will really ‘get’ it?
I must agree about the author getting into ereoi. You’re right of course that in terms of the usual standard of business magazine journalism, this is an exceptionally honest article.
And to give the author all the credit possible we need to consider the fact that he is probably flying about as close the sun as he can without getting hauled into the editor’s office and having the law laid down it no uncertain terms in regard to the corporate line.
Forbes isn’t Mother Jones and sure as hell isn’t in business to upset the business as usual applecart.
The advertisers are all big businesses with joined at the hip to the status quo and they are as afraid of Peak Oil as any backwoods preacher is afraid of the devil in the flesh.
But it still tees me off that writers for a big time business publication skate around the fact of depletion as if it didn’t exist.
I read the article and was shocked that Forbes published it! The information in it is from a publication called “The Perfect Storm” by Tullett Prebon. This is a great summary of energy and finance. Tim Morgan actually has a blog called “Surplus energy economics” which while in it’s infancy, looks like it will be a good site to read.
Anyway, I think that a lot of the information expressed in this article will fly over the head of the average Forbes reader. Gross generalization here I admit, but I imagine most of the readership would have a poor grasp on science / energy and the implications of what this article is suggesting. Still, it’s nice to see this view getting a least a little bit of air-time rather than the usual cheer leading about ‘energy independence’ ‘shale’ etc etc.
http://surplusenergyeconomics.wordpress.com/
The Perfect Storm: (ftalphaville.ft.com/files/2013/01/Perfect-Storm-LR.pdf)
The truth always comes out eventually and if you look for them there are some cracks beginning to appear in the walls of the forted up denialist business community.
I don’t have any problem reading this particular article as being just such a crack and might have said so in my original comment except for the fact that I got to worrying about my breakfast burning and cut it short.
Personally I don’t know the composition of the readership of Forbes but judging from the ads it must be managerial to a considerable extent and well to do across the board which indicates a well educated readership. This leads me to think that a considerable portion of the readership has the background necessary to understand and appreciate the article.
Of course it goes without saying that the ability to understand and the desire to do so are two entirely different things.
For a manager to act on such information as is involved in this sort of issue he would have to be at the very top of the heap and things would have to be going very well so that he could be looking well ahead of the next four quarters.
the Perfect Storm is a good read!
Your link was broken, the pdf is here as well:
http://www.tullettprebon.com/documents/strategyinsights/tpsi_009_perfect_storm_009.pdf
A friend who is a business type sent me this link about a book that is about the response of the business community to climate change.
http://thepenguinpress.com/book/windfall-the-booming-business-of-global-warming/
I haven’t read it.
But the reviews and the excerpts are impressive and if nothing else the book appears to prove beyond any doubt that there are some very large and very well known businesses that are taking climate change seriously enough to put megabucks into exploiting the business opportunities associated with it.
It might be worthwhile to point out that the big boys are just as happy getting rich during a bust as a boom.
We should’t ever forget the classic cartoon from the New Yorker iirc in which the manager is speaking to the board saying something along this line;
The bad news is that the world is ending in a year but the good news is that the business opportunities are excellent .
This content of this link is not directly concerned with the content of this forum but it is relevant in at least one respect.
The speaker has great deal to say about how people in and outside of any particular field think about the future of that field .
Her thoughts and research along these lines are highly relevant to our own understanding of the way people perceive peak oil and their response to it.
It’s well worth the time to watch it based on it’s educational value regardless of the field one works in since it applies across the entire width and depth of the economy.
http://www.usnwc.edu/Events/ELS/Edie-Weiner—A-View-from-the-Future-.aspx
There’s another lecture on the same site (Naval War College ) by Jeremy Jackson on the state of the oceans which every one should see even though it has nothing to do directly with oil.
If one happens to get into a discussion with a hard core right winger about such subjects as climate change and environmental degradation these lectures are powerful ammo because such people often believe the American armed forces army,navy, and marines sit to the right , left , and directly behind the throne of God and are thus infallible and so necessarily must be taken seriously even on topics such as global warming.
I haven’t yet watched the others but it’s an excellent bet they are all highly relevant to understanding the current state of the world.
Continuing the links to Tim Morgan’s excellent work, if you have not seen it there is a terrific summary here (and I think the Forbes article discussed above may also have drawn on this):
http://surplusenergyeconomics.files.wordpress.com/2014/01/brief-guide.pdf
Thank you! Single best short read on Energy and Economics yet.
I agree Patrick that it was an interesting piece.
It seems to point to a problem with the Euro Zone especially. If the countries with the big financial/real economy mismatch had their own currency, they could inflate their way out of this problem.
I have always thought that it was the real economy that was important. It is too bad that Monetarism has become all the rage in economics, it seems the knowledge of the past has been lost.
Trying to boost an economy by low interest rates when an economy has reached zero interest rates is like pushing on a string. We knew in 1936 when Keynes published The General Theory that fiscal policy was the way forward in this situation.
I also fail to see how the excess financial claims really matter much. Most of these claims are held by wealthy people, some of these claims will be proven worthless and will be defaulted on, the lenders will be sorry, the borrowers will be pleased, the real economy will be unaffected and life will go on.
The stuff on EROEI and the inverse concept was very good.
DC
The Eurozone’s single currency is just as inflexible as the US is with its. Yes there are more people there, but there’s even more still in China under its currency. I guess it just means failing sub-economies get eviscerated like Oklahoma in the 30s, the post bellum South, and the PIGS of southern Euro-land now.
There’s a good series of articles by Ugo Bardi on Italy at:
http://cassandralegacy.blogspot.co.nz/2014/01/italys-slow-collapse-how-declining.html
http://cassandralegacy.blogspot.co.nz/2014/01/the-other-side-of-peak-italys-collapse.html?utm_source=feedburner&utm_medium=feed&utm_campaign=Feed:+CassandrasLegacy+(Cassandra's+legacy)
They’re driving like it’s 1967 but with 10 million more people! These kinds of changes will come to all of the west over time, even the US, even Australia, and NZ [currently doing less worse than the others by recent massive lift in exporting to China, but both hugely vulnerable to increase in oil cost and declining EROEI]
We just have to make much more effort to detach our economies and especially productivity from liquid fuel dependency.
The difference between the Eurozone and the US is quite large concerning currency. When a country does not have control of its money supply it is very constrained in what can be done with monetary and fiscal policy to help get the economy back to full employment. In the US if one area of the country is doing badly, there are income transfers from areas that are doing well to areas that are not through unemployment insurance, food stamps, medicaid, and other social programs. In Europe, if Germany is doing well and Greece is doing badly, there are no income transfers from Germany to Greece. If Greece had its own currency, moderate inflation would enable it to get its wage structure back in line with Germany’s and become more competitive. Wages tend to be very rigid in the downward direction and if wages have risen too high in nominal terms (which is the case in most of Southern Europe) the remedy is inflation. The Germans hate inflation and they have effective control over the Euro, so very low inflation is what we will see and it will be a long time before southern Europe will recover. The Euro was a very bad idea and since 2009 we have seen the reason why, maybe by 2019 after 10 years of no growth, Greece, Spain, or Portugal will throw in the towel, the sooner the better.
I agree we need to reduce our dependence on fossil fuels, only a World War 2 level crisis will get people to wake up.
DC
U.S. Solar Jobs Grow 20% to More Than 142,000 Last Year
By Ehren Goossens, Bloomberg, Jan 27, 2014 3:08 PM ET
Neil Young, the oil sands and the damage done
by Andrew Leach on Wednesday, January 15, 2014
We’ve come a long way from the days when then-Premier Ed Stelmach declared environmental damage from the oil sands to be a myth. Around that time, in its approval of the Kearl oil sands mine, for which Phase I started last year, a Joint Review Panel concluded that, “the project is not likely to result in significant adverse environmental effects.” But, the panel evaluating Kearl raised a flag, saying that, “with each additional oil sands project, the growing demands and the absence of sustainable long-term solutions weigh more heavily in the determination of the public interest.”
We’ve now reached the point—the panel evaluating the Jackpine Mine left no doubt—where significant environmental consequences will occur in order to not (and, I kid you not, these are the words used) sterilize bitumen. Reading the Report of the Joint Review Panel (warning, it’s a slog) will be eye opening. Let me give you a couple of excerpts, in case you can’t spare the time:
— I’ll leave it to you to read the bullet points —
Don’t stop reading before you get to the good parts:
– Although the Panel has concluded that the Project is in the public interest, project and cumulative effects for key environmental parameters and socioeconomic impacts in the region have weighed heavily in the Panel’s assessment;
– All of the Aboriginal groups that participated in the hearing raised concerns about the adequacy of consultation by Canada and Alberta, particularly with respect to the management of cumulative effects in the oil sands region and the impact of these effects on their Aboriginal and treaty rights.
It’s these last two that have got us to where we are today—to a First Nation challenging the government in court for a decision that it made which valued bitumen over the environment and their traditional territory and for not fulfilling its constitutional duty to consult on that decision.
The decision on this project will, in all likelihood, go all the way to the top court in the land. The decision which really matters, however, will be the one you take: is it justified, in your mind, given the circumstances?
Speaking of oil sands, you ain’t seen nothing yet:
AL to examine ways to harvest oil sitting underneath state
Governor Robert Bentley said there are 750 billion barrels of oil underneath Central and North Alabama. Now he is exploring ways to harvest it.
Now folks that is a lot of oil. It is two thirds as much oil as OPEC says they have and about twice as much as they actually have. And is is about twice the proven reserves as all non-OPEC nations combined. And the governor ain’t messing around, he has allocated a huge budget to go after this oil:
The governor recently budgeted $1 million to explore how to go after the oil sands.
A million bucks, wow!
“The thing we have to consider is these are oil sands, which are really different than pockets of oil, but I can tell you there’s a lot of oil in North Alabama,” said Bentley.
The governor said there is no timetable on when we could see that 750 billion barrels of Alabama oil harvested.
No timetable but you can look for the world to be flooded with oil from Alabama soon, very soon. And one more thing, we have an idiot for a governor.
What does a million dollars get you in Alabama?
I take it that you think a million dollars is a lot of money in the oil patch. It ain’t.
I took AWO’s question as a joke question, not getting it but waiting for somebody to post the answer, something alone the line of the sarcastic remark ” that and a quarter will get you a cup of coffee” or an ancient one common to every large construction job I ever worked on.
“whadaya get when ya cross a ( insert name of appropriate trade ex pipe fitter) pipe fitter with a chimpanzee? A retarded chimpanzee!
I know that a million wouldn’t go far. Poor attempt at humour. : )
The question remains why nobody has yet found nor extracted any of this oil? Hopefully some keen reporter will in the near future ask this question to the governor.
Or maybe he’s confusing billions of barrels with millions of barrels, a common mistake by the uninformed.
Record Warmth in Alaska Contrasts Cold Wave in Eastern U.S.
By: Christopher C. Burt, 8:36 PM GMT on January 27, 2014
The warmth over Alaska, the Arctic, Greenland, and Iceland, while so cold in the eastern U.S., can be illustrated by this 500 mb anomaly map [see image below] of the northern hemisphere forecast for February 1st and produced on January 27th. Note how the polar vortex has been split into two lobes. I am not sure how unusual or not this is. Map courtesy of Guy Walton.
Meanwhile, of course, California has seen an unprecedented 14 consecutive days of record-breaking high temperatures including several all-time monthly records such as the 79°F (26.1°C) at downtown Sacramento on January 24th which smashed by 5°F the previous warmest January temperature of 74°F (23.3°C) set on January 12, 2009. Records at downtown Sacramento go back to 1877.
December Arctic Sea Ice News
Arctic sea ice extent for December was 12.38 million square kilometers (4.78 million square miles). This is 700,000 square kilometers or 270,300 square miles below the 1981 to 2010 average, making it the 4th lowest December extent in the 36-year satellite data record.
Just yesterday at I was griping about the msm never saying the “d” word but also that the truth always eventually comes out.
I never expected it so soon but the “d “word has made an appearance in the first few lines of a major article in the Wall Street Journal which is as main as mainstream can get and a publication which plays second fiddle to nobody at all in the business press, not even the Old Gray Lady.
http://online.wsj.com/news/articles/SB10001424052702303277704579348332283819314?mg=reno64-wsj&url=http%3A%2F%2Fonline.wsj.com%2Farticle%2FSB10001424052702303277704579348332283819314.html
The actual bulk of the info and commentary is devoted to the extraordinary costs involved in bringing on any major new production other than tight oil these days and there is no tight oil cheerleading .
The d word depletion is mentioned only very briefly a couple of times almost as if it were a dirty word but if there is an audience any where that should get it in no uncertain terms , it is the readership of the WSJ.
This is not to say that I expect this paper to give up cornucopian cheerleading; that would be naive in the extreme.
Joe Sixpack the hack journalist that supplies ninety nine percent of the business commentary for ninety nine percent of the msm can be relied on to miss this one article among fifty others telling us how great things are going to be in a few more months and dutifully pass on the pablum.
But the little WSJ bird is chirping loud and clear in the ear of the audience that it is most proud of , namely the managerial class that runs Wall Street.
If there is “anybody” any where outside forums such as this one capable of understanding what these costs mean in terms of the quantity and the price of oil available in the not very distant future that “somebody” should be the people on the boards of directors of the Fortune 500.
Hell’s bells , even an old farmer educated in a cow college and second hand bookstores can get it.
But we can be sure the vast bulk of the msm will overlook these costs and the d word as reliably as the sun coming up until a few weeks before peak oil becomes so obvious that even a Tea Party type will be forced to recognize it .
More news
http://www.telegraph.co.uk/finance/newsbysector/energy/10601899/Iraq-and-Iran-plot-oil-revolution-in-challenge-to-Saudi-Arabia.html
No serious reference to depletion in this article.
Still more news
http://www.brandeis.edu/now/2014/january/habibi-iran.html
If it can be done, I hope somebody can explain the reasoning behind this final sentence.
” American oil firms are lobbying the U.S. government to lift the ban on crude oil exports in effect since the 1970s, to take advantage of currently high oil prices in in the international market.”
Just how can an American barrel of crude be shipped overseas and sold more profitably than it can be sold to an American refinery buying crude from overseas?
We’re still importing millions of barrels a day and most likely will be until such time as nobody will accept our electrons in exchange for their oil.
This defies common sense on the face of it since the American crude is already on hand and imported crude must be shipped here at considerable expense while the domestic crude revenue would also be reduced to the extent of the cost of shipping it in the opposite direction.
Maybe it has to do with currency exchange rates or taxes but I suspect it has no real basis in fact and is a propaganda ploy of one sort or another.
It’s a question of who makes more money, the bakken producer or the refiner who gets bakken lto at a discount. The refiners are saying exports are a bad idea.
I posted a graph of diesel versus gas prices the other day to point out the spread. American consumers can buy cheap gasoline compared to diesel because the refiners can buy cheap lto and export the diesel fraction for a premium to Europe where cars run on diesel, and sell the gasoline in the U.S. where cars run on gasoline. Gas is the loss leader in a way.
The refiners are quite happy with the situation, and if American consumers were energy literate they would recognize that this was good for them too. The intense PR spin by the producers unfortunately plays on the consumers ignorance. Not the first time.g
Read chris nelders latest at get realist.com
Getrealist.com
http://www.getreallist.com/
fixed link 🙂
I think it is more about the API of the shale oil being higher than is optimal for the Gulf refineries. It is more cost effective to import low API oil that better matches the refinery configuration, and export high API oil to Europe, which are simpler refineries which will pay a premium for higher API.
It is a mute point whether the overall increase in efficiency of the refinery process is more or less than the energy cost of shipping the oil several thousand miles.
Gulf refineries are awash in domestic light oil in their mix of crises. They are set up for heavier mixes. As a result there is too much of light oil depressing prices.
Why the U.S. should not export oil
Chris Nelder, Smart Planet, January 27, 2014
Lifting the moratorium on exporting crude oil would benefit producers in the short term, but at the cost of America’s long-term energy security.
The U.S. oil industry has a very tricky needle to thread right now: It must convince the American public that exporting crude oil is in its best interest, when it is not.
The reason the industry wants to export crude oil is simple. U.S. refineries can’t use all the crude coming from shale plays like the Bakken formation in North Dakota and the Eagle Ford in Texas. This boom in “tight oil” has created a bit of a glut for those specific grades of “light, sweet crude” because before the fracking revolution, most of the domestic refining complex was reconfigured to take in heavier sour crude grades of the sort we import from places like Saudi Arabia and Venezuela.
The oversupply has forced tight oil producers to sell their crude to refiners at a discount to the U.S. benchmark grade, West Texas Intermediate (WTI). For most of the past two years, for example, Bakken crude has sold for $5 to $15 per barrel (bbl) less than WTI.
Not only does the glut limit the profits of tight oil producers, it also threatens their ability to maintain their drilling rates, which are funded primarily with debt.
Chris ends his post with…
Senator Ron Wyden, D-Oregon, has scheduled a hearing on the oil export question for Jan. 30. If you care about your future, I suggest you let your elected representatives know that saving some of our remaining oil for a rainy day is a better idea than lifting the crude export ban so we can suck the shale dry tomorrow. Out there in the not-too-distant future is not just rain, but a flood.
Thanks
Both you guys.
I’m familiar with both these arguments from reading this site as well as some others and both of them make good sense to some extent.
Farmers are well aware that the big guys outnumber us little fellas by a hundred thousand to one because there are that many of us for every major buyer and that allows them to manipulate the price of grain in their favor to some extent.
There aren’ t that many refineries and it is a sure bet that there are a lot less owners of refineries than that. Some companies might own half a dozen or more.
If the transportation bottleneck is bad enough and the the tight oil guys are numerous and hungry enough then the handful of refineries so located as to have easy access to the North Dakota oil are in a position to skin the producers since they can buy elsewhere but the Bakken guys can’t sell elsewhere without “eating ” the excessive shipping costs.
There are some local guys growing potatoes here commercially for the first time in sixty years or longer because the growers up north that can grow them cheaper than we can have to pay more than twice as much to ship here now as they did a couple of decades back.This makes local potatoes competitive again.
But that argument doesn’t apply to any other American crude so far as I can see because I don’t see or hear anything about the other producers having market access problems.
If there is any true competition for crude among refineries then this squealing about exporting isn’t going to do the tight oil folks much good over the long run because somebody will overhaul a refinery or two to take advantage of the price difference and the price of Bakken oil will go up to market parity.
I can see a good competitive niche for the folks refining Bakken crude and exporting diesel but I can’t see that exporting Bakken crude will help Bakken producer much because if the Bakken oil lasts surely somebody here will invest in some refinery capacity optimized for it.
But exporting might make the Bakken people a lot of money in the short term since it would force the current buyers to pay the world price for Bakken crude .
Am I in the ballpark?
Just to lighten things up a little
http://www.salon.com/2014/01/28/german_barn_explosion_caused_by_90_farting_cows/
I have met a few German tradesmen thru the years and if anybody can and would build a dairy barn tight enough to hold cow farts until the methane concentration reaches potentially explosive levels it’s the Germans.
In my experience it would likely be hard to even get your breath in such a barn full of diary cows and your eyes would water so badly you would be not only blind but also in considerable pain.
I suspect that there is more to this story than meets the eye at first glance but it is not likely we will hear the rest of the story.
It does serve to remind us of the potential for energy conservation; it would be technically possible to build sewage plants in or under large cities and harvest enough methane to heat the city if all the buildings were well insulated as well as recovering the nitrogen, phosphorus ,potassium and trace elements for recycling .
Mister Farmer,
One needs to keep in mind that every process of separating things that were mixed up, requires energy. Only if one of these things is an energy source itself (eg methane) you have a chance to have an energy conservation story. Otherwise you are only fighting entropy. And that consumes energy. Recovering the nitrogen, phosphorus ,potassium and trace elements for recycling out of whatever, can only be profitable if the energy cost stays lower than the value of the recovered materials. To put it in another way: the entire recycling business will suffer from declining EROEI, from rising energy prices, from dwindling demand and so on. From being one of the flagships of “sustainable development”, that sector may be one of the firsts to close its doors. Just because it is so energy intensive.
Well…..You might be right sometimes about recycling being an early casualty of high energy costs because some things really can’t be recycled economically.
But in most cases where it is practiced on a large scale recycling is practical and quite often actually profitable . Scrap metals, wood, paper, clothing, and some other things come to mind right of the bat as things that are being recycled profitably today.
And in other cases recycling still makes sense because even though the recovered materials aren’t worth enough to cover the cost of their recovery the business or community avoids the expense of disposal.
My local town used to haul all the leaves and branches put at the curb to the land fill but now this waste material is sold cheap to local gardeners and landscaping companies and homeowners who take the larger pieces of wood for firewood for a nominal fee to cover the cost of the wages of the attendant at the recycling yard. This has proven to be a lot cheaper than landfilling this organic waste.
Sewage is another waste product that is actually better thought of as a resource because the plant foods in it are worth more than the cost of recovery already after factoring in the cost savings involved in disposing of the remaining waste after the good stuff has been stripped out.
The energy cost involved is less than the energy cost of manufacturing nitrates and mining and processing the phosphorus and potassium.
And as energy costs rise the advantages involved in recycling sewage will grow.
But the really important fact is this one.
Phosphorus and potassium aren’t optional consumer good; they’re absolutely essential industrial farm inputs and if we farmers can’ t get them by the millions of tons annually then people are going to starve in short order.
There’s no shortage of nitrogen free for the taking in the atmosphere but converting it to usable nitrates is an extremely energy intensive process and recycling nitrate from sewage an energy efficient process.
And without the nitrates we also buy by the millions of tons annually …billions of people starve within the first year.
These three inputs are as necessary these days to commercial scale farming as warm clothing is to an Eskimo.
We aren’t going to have any choice about recycling them in another few years.
“people are going to starve in short order.” That is the classic Malthus story. Still valid in my opinion. “billions of people starve within the first year.” sounds a little bit rough. I believe the downslope of our civilisation will mirror the upslope. And since we have a lot of non-essential use of energy and other resources (phosphorus, potassium, …) mankind will take the oppportunity to adapt, altough there will be severe accidents: regions where the refugee camp will be the new normal; regions where people starve indeed.
Hi All
Following up on previous discussion of nat. gas flaring in ND v TX – headline out tonite 5:30pm on NYT.com –
Will be interesting to see how the effort is working out over the next year or so. Seems doubtful that it will matter in the “next six years” timeframe discussed in the article, assuming we expect peak Bakken @ 2015 or so and rapid decline thereafter.
Crap!
Industry in North Dakota to Cut Flared Natural Gas
Hi KC your first link worked fine, unless Ron fixed it.
DC
Shell reports:
http://www.bloomberg.com/news/2014-01-30/shell-ceo-pledges-spending-cuts-asset-sales-to-restore-profit.html
Production down 5% in the 4th quarter, and trying to sell of assets in Ohio.
I thought that’s where all the companies working in Pa had gone because they couldn’t make money in Pa?
We need to be posting all these links on msm forums as well as posting them here in the Church of The True Believers of PeaK Oil.
I’m personally doing so.
How about the rest of us?
Hi OFM,
peakoil.com gets a fair amount of traffic so you could post some of that stuff there. Also they have Rockman there, I have tried to get him to post here, but he prefers peakoil.
They do have a few people at peakoil that are more optimistic about our fossil fuel prospects.
DC
Another big Natgas storage withdrawal, 230 BCF last week.
In any case, the US recrossed the 20 TCF/year mark (dry natural gas production) in 2008. Looks like 2013 will be flat with 2012, slightly over 24 TCF. Let’s assume that the decline rate from existing wells in 2008 was 18%/year, and let’s use the 24%/year number for 2013 that Citi Research came up with (this would be the year over year decline in Natgas production if no new wells were completed in 2013, versus 2012.) This implies that we lost about 10 BCF/day in 2008 and about 16 BCF/day in 2013 (declines from existing wells).
I don’t know what current Marcellus numbers are, but it looks like the play produced around 8 BCF/day in 2013. The above numbers imply that in order to maintain about 66 BCF/day, we have to put on line the productive equivalent of the 2013 production from the Marcellus–every six months.
WSJ: Supplies of Natural Gas Tighten
http://online.wsj.com/news/articles/SB10001424052702304632204579340981992232384?KEYWORDS=natural+gas
Excerpt:
Some industry watchers expect natural-gas storage to be significantly lower than average at the end of the winter, prompting concern that inventories still may be low by next winter.
Storage levels could fall below 1.2 trillion cubic feet by the end of March, said Anthony Yuen, energy strategist at Citigroup, C +0.25% meaning that producers would need to supply more than 2.5 trillion additional cubic feet to bring storage back to October 2013 levels.
If storage levels aren’t replenished by next winter, natural-gas supplies could be “uncomfortably low” in some areas of the country, sending benchmark futures prices higher, Mr. Yuen said.
Refilling storage caverns could be difficult if producers don’t ramp up drilling, Mr. Yuen said. “There has been a lot of talk about, when some price levels have been reached, that maybe producers will come back in” to produce more, he said. “But the market has not really seen that.”
Looking at the EIA electricity generation report data for 2013 November year-to-date (so not the full year, but eleven months of it) natural gas use for electricity generation fell by 9% over 2012 (same 11 month period.) And this is before nat gas prices really ramped up. I expect even less electricity is being produced by natural gas right now. If nat gas use for electricity hadn’t fallen, prices today would be even higher.
The bad news is, about half of this electricity generation was replaced by coal. (More bad news is hydro didn’t do so well in the West last year and total hydro electricity generation for the country was down 5 million megawatt hours.) The good news is roughly a quarter of the natural gas use was replaced by an increase in non-hydro renewables and another quarter was replaced by a combination of reduced consumption and increased nuclear. (Not sure how I feel about new nuclear being brought on line given we still, even after all these years, have no plan for how to deal with the radioactive waste.)
The irony about coal, at least in Wyoming, is that that state has such great wind resources, it could make more money building wind turbines and exporting electricity that way than by the energy intensive mining and railcar shipment method (or mining and burning in a power plant method) that they use now. However, although Maine, New Hampshire, Massachusetts, Vermont, New York Pennsylvania, Illinois, Indiana, Michigan, Ohio, Iowa, Kansas, Minnesota, Nebraska, Oklahoma, Texas, Colorado, Idaho, Montana, Nevada, California, Oregon, Washington, Alaska and Hawaii all increased their wind capacity last year, it looks like Wyoming may have take a turbine or two down.
I’m starting to see that California is looking at another perfect storm for power generation this summer. Unless we get a spring rain miracle, hydro generation will absolutely plummet due to almost-empty reservoirs and zero melt from snow-pack, just in time for our annual summer peak power demand to feed all the air conditioning. That means the inefficient NG peaking plants will work overtime, right when NG suppliers are trying to replenish storage. And we can’t shift NG base load to coal. Coal base load generation isn’t really an option in CA any more – it’s pretty much gone due to due to CA environmental regulations. NG, hydro, biomass, wind, and solar are it. Electric rates could take a real hit. It will be interesting…just ask Gray Davis…
I agree that hydro will be sadly lacking in California this summer. However, hydro only supplied about 10% of California’s electricity in 2013. Renewables supplied 14% and will probably be up to 16% in 2014 (although one huge drawback with our weather lately has been the absence of wind.) What California does do is import massive amounts of electricity from other states (22%) and I bet this will increase in 2014. The amount of electricity that California imports is, for example, greater than either the states of Oregon or Colorado consume in entirety. What happened last year is that hydro being down in both Washington and Oregon led those states to burn more coal so they could have electricity available to export to California. So California can claim to burn little coal, when, in fact, it has just pushed the coal use to other states.
If I were Governor Brown, I would have big trucks going through cities and suburbs this spring offering flat out cash to people turning in refrigerators ($200), window air conditioners ($100) and incandescent bulbs ($1). A heck of a lot of little-used second refrigerators might mysteriously disappear from people’s garages this way, to everyone’s benefit.
Hydro is a bit less in %, but it is more dispatchable than PV/wind. And of that 14% renewable, wind is way bigger, kWh-wise, than PV in the summer, but doesn’t match the instantaneous peak kW demand well. During peak cooling weather cycles, the on-shore flow that drives most of CA’s summer wind power at all the passes largely shuts down during mid-day through late afternoon. That’s when power demand soars and dispatchable power like hydro and peaking NG turbines must come into play. Until a viable economic large-scale energy storage system evolves for PV/wind and makes renewables dispatchable on-demand, CA’s energy portfolio will continue to heavily depend on conventional power plants.
Plus, we no longer have San Onofre.
Surely California is not unlike Australia in having peak aircon demand and PV available sunshine nicely coordinated? In Australia dispersed PV is smoothing this demand peak efficiently, note this isn’t a buildout that replaces baseload but one, despite it’s relatively small size, that still deals with this seasonal stress on the system.
Will be interesting to see how far this can go. It is, of course extremely disruptive of the current distribution biz model which relies on profit taking at the margins. Big coal in Australia wants PV restricted!
http://peakenergy.blogspot.com.au/2014/01/solar-saved-southern-states-from-new.html
Shell pulling out of the project in Alaska:
http://www.rigzone.com/news/oil_gas/a/131346/Shell_Stops_Alaska_Program_in_Year_of_Hard_Choices?
Gents, I think it would give this blog and the news herein a lot more credibility and clarity, if we could manage to stay away from unrelated topics such as Anthropogenic Global Warming and climate.
I am sure there are thousands of sites/blogs out there with singleminded discussion around AGW and the climate. Would be great if we could have one place like this that deals with the very serious issue of Peak Oil without mixing in all that crazy voodoo magic about evil humans warming the planet.
Otherwise the whole issue gets buried in a “David Icke” like fog of madness.
Thanks and Regards,
Raul
James Hansen and David Icke are not exactly contemporary science figures.
Kinda like comparing Rasputin and Einstein.
Hi Raul,
I am not sure how one can detach a conversation regarding the oxidation of 85 million plus barrels of organic liquids a day from anthropogenic climate change. The two issues are fundamentally tied.
Best,
Tom
Make no mistake humans are warming the planet. But it is just silly to make the claim that because we say they are warming the planet we also mean they are evil. Absurd!
I know of no person who claims that people are evil because of what we are doing to the world. And to say that we who are aware of anthropogenic climate change would claim all those people who contribute to it are evil is a just an absurdity.
Though I believe strongly in anthropogenic climate change I don’t think there is a damn thing we can do about it. It is way too late, in my opinion, to change the direction the world is heading. That is exactly why I don’t talk a lot about it. Howeverit is a subject that is welcome on this blog.
Ron,
I am glad that you are calling the shots as it pertains to “Comment Material” on your site…..lol. I believe in human induced climate change. I imagine the debate on this issue will continue until all doubt is removed.
Of course…. by then, it will be too late.
My point was Steve, that it’s already too late, way too late. I find the idea that we can somehow stop this thing… I cannot find words to express it. But it would be truly hilarious if it were not so sad.
Ron,
Actually, I totally agree with you about the ITS TOO LATE.
steve
Unfortunately the two concepts are intrinsically linked. I enjoy data and science, the data unanimously supports AGW. I personally think AGW will become a defining issue in years to come, as will peak oil in the medium term.
AGW consensus:
http://www.slate.com/content/dam/slate/blogs/bad_astronomy/2014/01/14/climatedenial_published.gif.CROP.original-original.gif
PROPANE SHORTAGE WAS PREDICTABLE
Tomorrow’s Gas Price Today (Jan 22, 2014)
AND THIS JUST IN …… Apparently the Federal Minister for Natural Resources … the same guy who forgot to tell Canadians they wouldn’t have enough energy to make it through this winter stated in the House of Commons that “Ontario can regulate propane prices ” and that he will have the NEB and Competition Bureau look into this. He need only read what’s below here and look at TGPT’s informed suggestions.
Nice deflection Minister Joe Oliver, but the buck stops with you. No amount of regulation by Ontario is going to stop a propane producer from Alberta or Saskatchewan from selling away all the fuel we need to survive here in Canada. Rather than lecturing other countries on approval of oil pipelines, your first responsibility is to ensuring adequacy of supply for Canadians for something as basic as heating. Your failure to take of an alarming shortage of propane, information provided you the National Energy Board, which you are directly responsible for, suggests incompetence and dereliction of duty. Its called Ministerial Responsibility. You took an oath to uphold it. Exercise it rather than pointing a finger elsewhere. It’s cost Canadians in rural Canada enough already.
The authour has a few suggestions about what needs to be done here in Canada. His last one explains why I found it so hard to find up-to-date price data for propane in Canada.
TGPT’s SOLUTION –
(4) RESTORE THE CANADIAN PETROLEUM MONITORING AGENCY, CANCELLED BY THE HARPER GOVERNMENT UPON TAKING OFFICE IN 2006 , WHICH LIKE THE US WEEKLY PETROLEUM INVENTORY REPORT, PROVIDED THE MARKET WITH CREDIBLE, VITAL AND TIMELY DATA ON CANADA’S CURRENT PETROLEUM SUPPLY AND DEMAND STATUS.
The link is to the site’s domain where the post was located, so don’t count on that link going to the above content.
I always wondered what it would take for them to lose the vote of rural conservative voters. With two months of real winter to go up here it’s a good bet this’ll become a big issue.
Hockey Stick graphs courtesy of the EIA’s TWIP propane page!
Holy… the NEB predicts propane storage heading down to an empty tank by the end of winter.
Liquefied Petroleum Gas (LPG) Underground Inventories in Canada
Chart is from the propane tab of the 2014 sreadsheet.
The cold outlier
Izabella Kaminska | FTAlphaville | Jan 30 09:43
… However, over the short term, with stocks at the lowest seasonal level since 2001 and two months or more of winter still left, the US propane market could still be in for a volatile few months.
— snip —
Meanwhile over in natural gas world: [go check out the charts in Izzy’s post]
In other words, the swing ‘shock absorber’ factor needs to be increasingly covered by domestic production. The colder it gets, the greater the call on domestic marginal production, which is a new dynamic for a market that has been in structural surplus since 2008.
What they’re worried about, however, is that despite the rise in prices, the curve has not moved significantly enough to incentivise spending from producers on additional drilling. More worrying still, it’s not even moved enough to encourage greater amounts of storage — implying something of disconnect between demand expectations and futures prices.
As they noted:
We might soon find out at what price producers consider it profitable enough for them to start drilling for dry gas again. Art and David weren’t wrong.
Don’t know much about the storage issue Izzy mentions, anyone?
[…] the 2005 peak in conventional oil production well in advance, used the same modeling techniques to predict future production from the Bakken Shale. His call? A production peak in the fall of this year, with steep declines after that. He’s the […]
[…] {6} http://peakoilbarrel.com/oil-peak-north-dakota-montana-2/ […]
[…] In the short term, the critical issue is energy, and specifically oil. Global oil production peaked around 2005, stayed on a plateau for a few years, and has started to decline. The difference has been made up by shale oil production and fracking; you’ve almost certainly seen or heard media pundits claiming that these tools will solve our energy problems. This isn’t true, however; it’s a lie circulated by speculators hoping to make a profit out of government and investor desperation. Oil as we generally understand it is getting harder and harder to obtain; the old, easy-to-access reserves are in decline, and newer sources are incredibly difficult – and incredibly expensive – to exploit. This infographic from the Wall Street Journal shows clearly how the oil companies, despite spending vast sums of money, haven’t managed to produce any more oil. The majority of existing oil fields, by contrast, are now owned by their national governments – who now have a vested interest in keeping prices high. Very soon, the shale oil boom will pass, and worldwide oil production will decline precipitously. […]
Apparently D. Coyne can’t get his x axis labeling right. Why should I believe a guy who can’t even work an excel spreadsheet?
Hi LJR,
I assume you are talking about the chart in the comments, or did you not like that I did not label the x-axis as being the Month and Year which seemed blindingly obvious. If you meant the Chart in the comments, I agree that was badly done, since J-10, could be Jan, June or July 2010. Thanks for pointing it out.
Remember this is a very pessimistic scenario, the probability that output will be greater than this scenario is about 99 %.
[…] • North Dakota & Montana Oil Peaks Seen For Fall 2014 (Jean Laherrere) […]