A post by Ovi at peakoilbarrel
Below are a number of oil (C + C ) production charts for Non-OPEC countries created from data provided by the EIAʼs International Energy Statistics and updated to November 2020. Information from other sources such as OPEC, the STEO and country specific sites such as Russia and Norway is used to provide a short term outlook for future output and direction for a few countries and the world.
This November post will primarily update the charts from the October report that was posted late on Saturday, February 20. The comments in the October post were up to date as of February 19 and so will be largely copied over to this post and updated where appropriate.
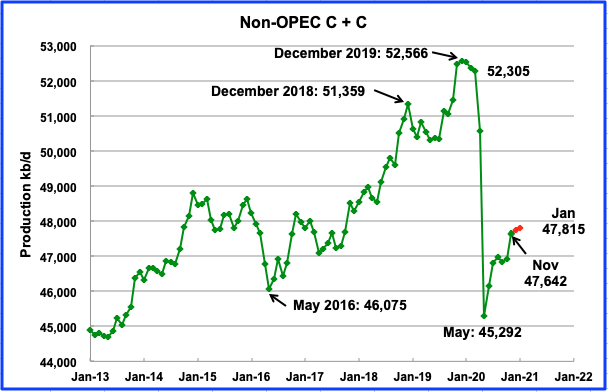
Non-OPEC production reached its current lowest production rate of 45,292 kb/d in May 2020. According to the EIA, November output increased by 706 kb/d to 47,642 kb/d from October. The November increase of 706 kb/d largely reflects the increase in US output associated with the GOM coming back on line in November after hurricane disruptions.
Using data from the February 2021 STEO, a projection for Non OPEC output was made to January 2021. Output is expected to increase slowly to 47,815 kb/d.
Ranking Production from NON-OPEC Countries
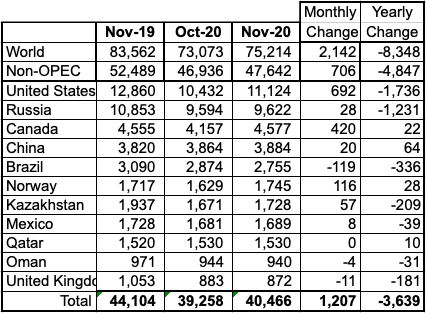
Above are listed the worldʼs 11th largest Non-OPEC producers. They produced 84.9% of the Non-OPEC output in November. On a YoY basis, Non-OPEC production decreased by 4,847 kb/d while on a MoM basis, production increased by 706 kb/d to 47,642 kb/d. World YoY output is down by 8,348 kb/d.
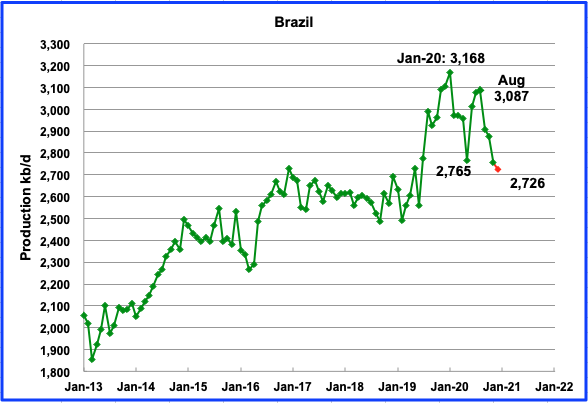
The EIA reported Brazilʼs November production was 2,755 kb/d, a drop of 119 kb/d from October due to planned field maintenance in the Tupi and Buzios oil fields, according to OPEC, and the presence of Covid on their sea platforms
According to this source December’s output dropped by an additional 29 kb/d to 2,726 kb/d, (Red Markers). Maintenance and Covid could be continuing issues.
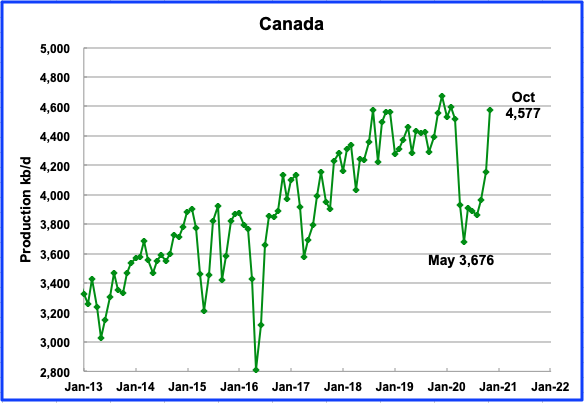
The EIA reported that November output increased by 420 kb/d to 4,577 kb/d. One possible explanation for the sudden output increase is that most of Canada’s crude oil exports are heavy oil and US gulf coast refiners have substantial need for heavy crude to feed to their heavy oil refining capacity. Venezuela and Mexico, two other heavy oil producers that supply the US are experiencing declining heavy oil production, leading to increased US demand for Canadian heavy.
Below is a table of crude exports to the US from a range of countries.
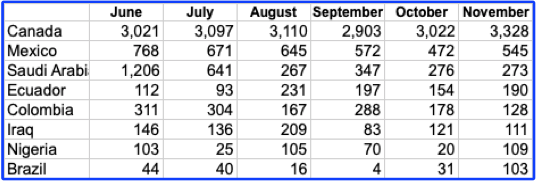
Canada is the largest exporter of crude to the US. Note how Mexico and Saudi Arabia exports have dropped since June while Ecuador’s have increased. The 1,206 kb/d of imports in June for Saudi Arabia is related to their production surge in April of 2020. A more typical monthly import number in 2018 and 2019 would be between 500 kb/d and 1,000 kb/d.
According to this source, the US did not import any oil from SA in the first week of January for the first time in 35 years, a reversal from just months ago when the Kingdom threatened to upend the American energy industry by unleashing a tsunami of exports into a market decimated by the pandemic.
The decrease in Saudi Arabia imports raises the question of whether SA sees the quickest way to get WTI and Brent prices into their preferred price range is by reducing crude sent into the US. SA fully understands the impact of the release of US inventories every Wednesday at 10:30 by the EIA. Current US inventory is only 14.4 Mb higher compared to 1 year ago. In July inventories were higher by 100 Mb.
Oil exports by rail to the US in November were 173.1 kb/d, up from 92.8 kb/d in October and up from a low of 38.9 kb/d in July. Two companies ConocoPhillips and Gibson Energy have developed a new and safer way to ship oil by rail to the US.
Oil/bitumen from the oil sands in Northern Alberta is transported by pipeline to Hardisy Alberta. The bitumen must be diluted with diluent, approximately 30% diluent and 70% heavy crude. This type of transportable crude is identified as Western Canada Select, WCS. It is then put on trains and shipped to the US. The new idea is to remove the diluent in Hardisy and then ship the new variety of heavy crude as a nonhazardous commodity into the US.
The project calls for construction to begin in April, with the diluent recovery unit (DRU) in service sometime in the second quarter of 2021. A subsidiary of ConocoPhillips has agreed to process 50,000 barrels per day of inlet bitumen blend through the DRU, according to USD, a master limited partnership formed by USD Group, and Gibson, a Canadian crude oil-focused infrastructure company.
The DRU will produce DRUbit, which USD describes as “a proprietary heavy Canadian crude oil specifically designed for rail transportation.” The product enables the crude or bitumen to become a nonhazardous, nonflammable commodity, according to USD. The producers hope the project will serve as a way for heavy Canadian crude to get to the U.S. Gulf Coast in a manner that’s economically competitive to pipelines, in part because it can use the existing railcar fleet. CP has also said the product will allow 30% more crude to be loaded in each tank car, making the rail costs more competitive with the pipeline.
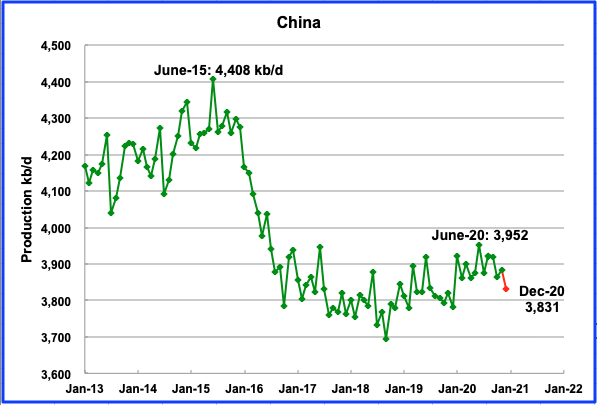
The EIA reports that Chinaʼs November output increased by 20 kb/d to 3,884 kb/d from October. This source reported crude output for December dropped to 3,831 kb/d. (Red markers).
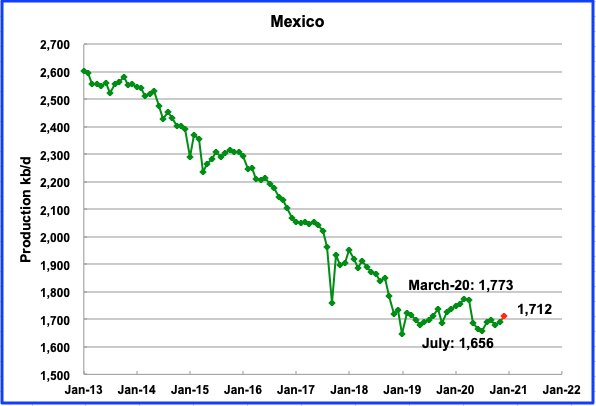
Mexicoʼs production increased in November by 8 kb/d to 1,689 kb/d, according to the EIA. Data from Pemex shows that production in December increased to 1,712 kb/d (Red markers).
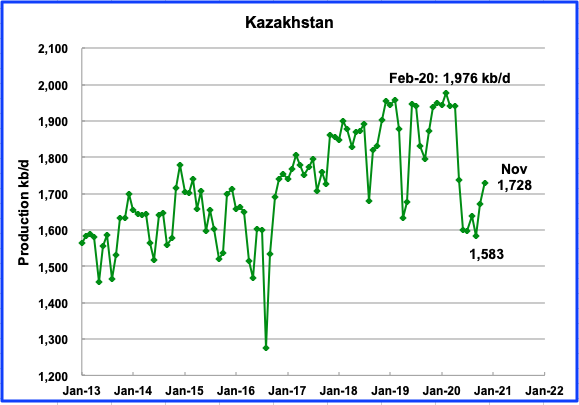
Kazakhstan’s November output recovered by 57 kb/d to 1,728 kb/d. The big drops in May and June were associated with their commitment to reduce output to the members of the OPEC + pact. In the last OPEC + meeting they were permitted to increase their output.
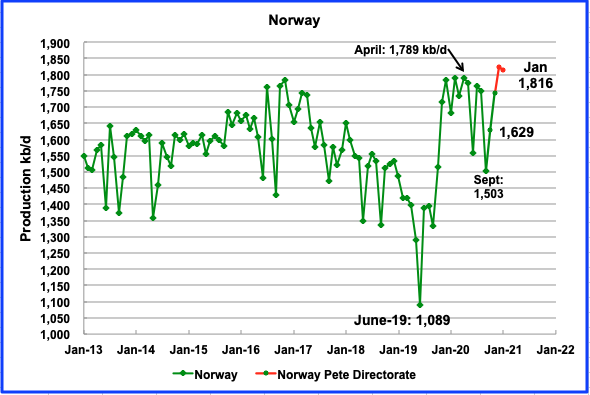
The EIA reported that Norwayʼs November production was 1,745 kb/d, an increase of 116 kb/d from October. Low production in September was due to annual maintenance.
According to the Norwegian Petroleum Directorate’s (NPD) February report, oil output increased by 79 kb/d to 1,824 kb/d in December and decreased by 8 kb/d to 1,816 kb/d in January. In October 2019 the Johan Sverdrup started phase one production with an expected maximum output of 500 kb/d. In September 2019, Norway’s output was 1,333 kb/d. Adding 500 kb/d would bring Norway’s output to 1,833 kb/d. It appears that target was achieved. January 2021 production was 1,824 kb/d, essentially on target.
In the previous NPD reports, they made the following statement: “On 29 April 2020, the Government decided to implement a cut in Norwegian oil production. The production figures for oil in “Month” include this cut of XXX,XXX barrels per day in the second half of 2020.
The January report just states: “Oil production in January is equal to the NPD’s forecast”. This means that Norway is now back to full production and is not contributing to the OPEC + output reductions.
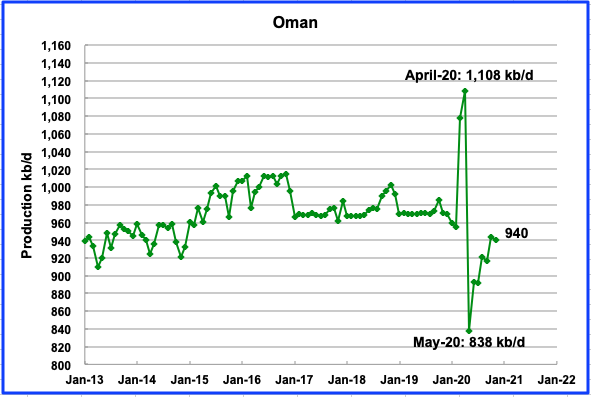
Omanʼs October production decreased by 4 kb/d to 940 kb/d.
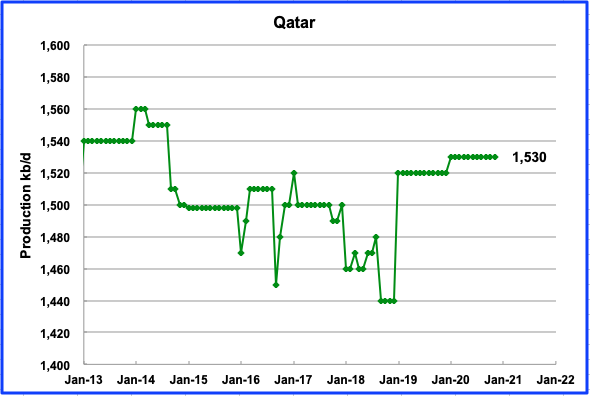
Qatar output remained steady at 1,530 kb/d
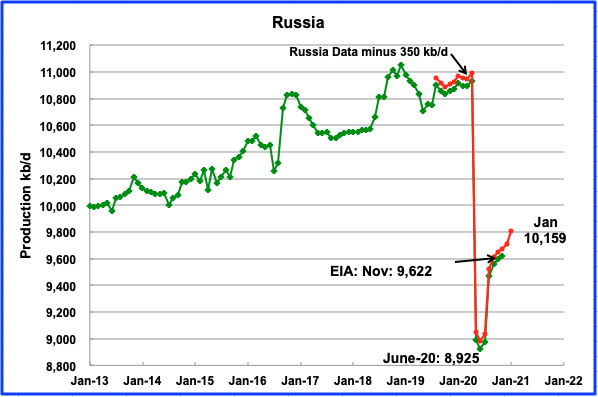
According to the Russian Ministry of energy, Russian production increased by 100 kb/d in January to 10,159 kb/d. According to OPEC, production in Russia is expected to average 10,200 kb/d in 2021, slightly higher than January’s output.
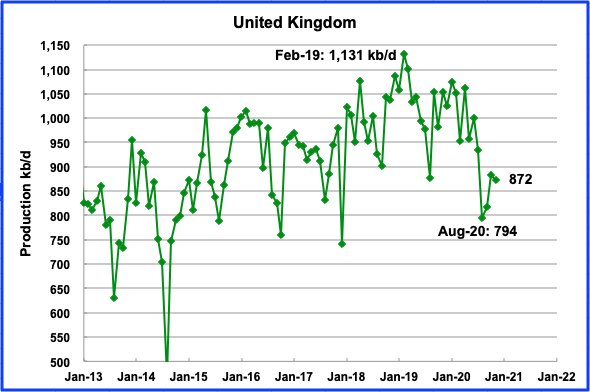
UKʼs production dropped by 11 kb/d in November to 872 kb/d. The recovery from September to October was due to the completion of some of the planned summer maintenance and appears to be continuing. According to OPEC, UK production is expected to average slightly over 1,000 kb/d in 2021.
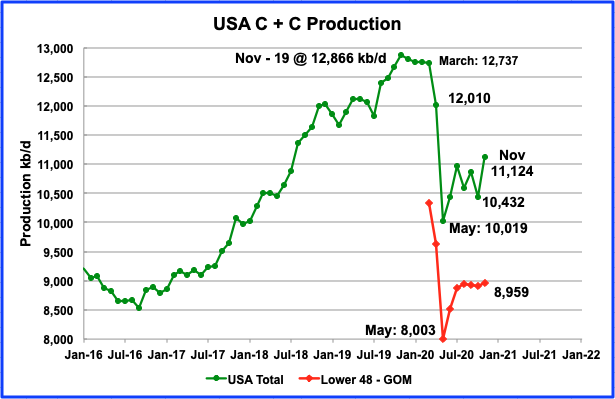
Novemberʼs US production increased by 692 kb/d to 11,124 kb/d from Octoberʼs output of 10,432 kb/d. Novemberʼs increase was largely due to the GOM coming back on line after being shut twice because of the October hurricanes. The effects of shutting the GOM can be seen in the November onshore L48 production red graph which has been essentially flat since August at 8,959 kb/d, 13 kb/d higher than August. Of the 692 kb/d November increase, the GOM contributed 645 kb/d, 93.2%.
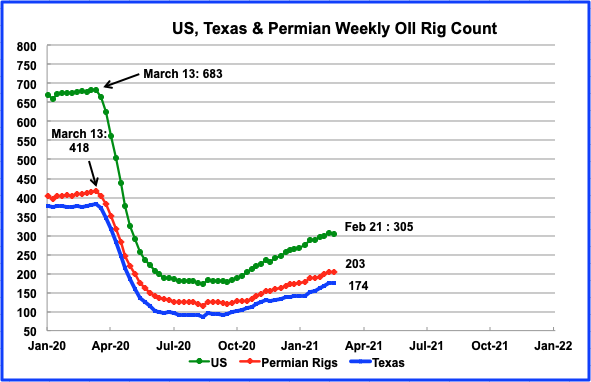
As noted above, there has been essentially no increase in oil production in the onshore L48 since August. During August there were close to 180 rigs operating in the US. By November the US rig count had increased to close to 235. The increase in rigs was only sufficient to offset the continuing decline in the previously drilled and producing LTO wells.
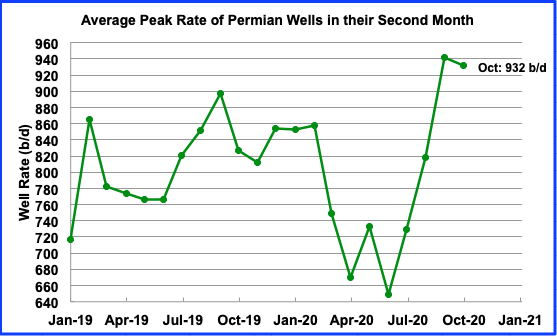
This chart shows the peak production that Permian wells achieve in their second month. The data was taken from ShaleProfile. It is an indicator of the progress that drillers have been making in increasing the efficiency of their drilling operations. September was the highest rate achieved at 941.7 b/d. It is not clear whether the increase is associated with longer laterals or whether the drilling area of these new wells has a higher oil quality/density than previous areas. These 2020 wells are producing more oil, total barrels, than last year’s wells up to November.
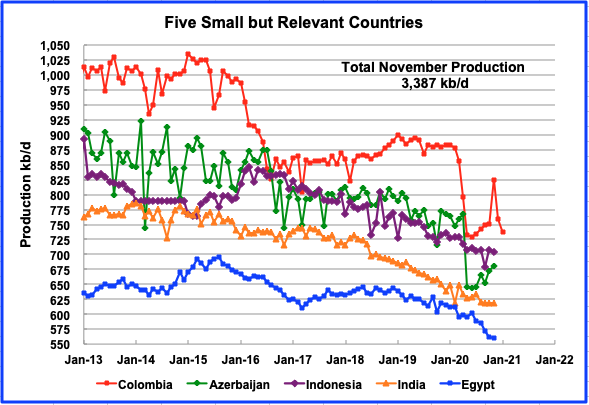
These five countries complete the list of Non-OPEC countries with annual production between 500 kb/d and 1,000 kb/d. Their combined November production was 3,387 kb/d up by 77 kb/d from Octoberʼs output of 3,310 kb/d. Columbia and Azerbaijan appear to be recovering, however the EIA data for November is not consistent with data from Hydro Carbons Columbia (HCC).
The HCC reported November production increased to 761 kb/d, according to this source. However the EIA is reporting November production of 824 kb/d which is not consistent with the later source. For January, the HCC is projecting a production drop again. (Last red markers for Columbia). Is the HCC just reporting crude??
World Oil Production
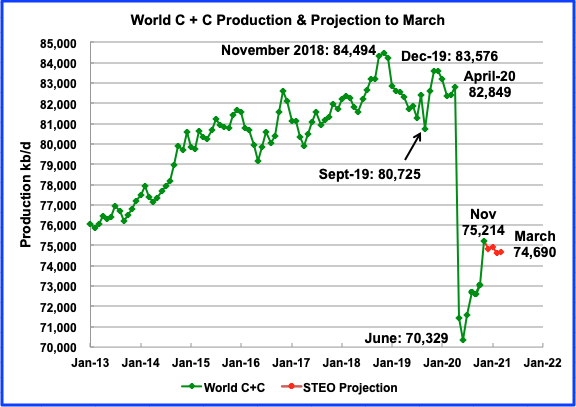
World oil production in November increased by 2,142 kb/d to 75,214 kb/d according to the EIA. The biggest contributors were US (692), Canada (420), Libya (650), Norway (116) and Iran (114).
This chart also projects world production out to March 2021. It uses the February STEO report along with the International Energy Statistics to make the projection. It projects that world crude production will drop from November to March by 524 kb/d to 74,690 kb/d in March.
43 responses to “November Non-OPEC Oil Production Jumps”
JFF
If you look at Dennis’ earlier OPEC post of February 14, you will see that the total production chart shows that OPEC has taken approximately 5 M b/d off the market. Check the Russia chart above and they have taken close to 2.2 Mb/d, as of November, off the market. Also there are other members in the OPEC plus group, such as Kazakhstan that also cut back. Kazakhstan has cut back about 200 kb/d. Those three account for close to 7.5 Mb/d.
To close the 9 Mb/d gap that you have noted, that may need to come from the US. Checking the US chart above, you will note there is an approximate gap of close to 1.5 Mb/d between March 2020 and November 2020. So if world demand gets back to the levels of March 2020, US production will have to get back to producing 12.8 Mb/d to avoid a world shortage.
http://peakoilbarrel.com/opec-update-february-2020/#more-30333
This reply has appeared out of place. It responds to JFF’s comment below.
Thanks again Ovi.
Schinzy
Much appreciated.
George Kaplan reviewed for us Brazil in late 2018. He showed the chart below which I take a as proxy for oil production. The pre-salt in the Santos Basin is the biggest future upside for Brazil. George’s chart shows a peak in the 2026 time frame or so.
So,, while alot of the countries above are past their peak in oil production, and, taken as a whole, they are past peak, Brazil probably is not past peak.
From today:
Petrobras shares slump as Brazil’s Bolsonaro doubles down on intervention
Petrobras shares plunged 21% on Monday, wiping out 70 billion reais ($12.7 billion) in market value, as Brazilian President Jair Bolsonaro again slammed its pricing policies after he replaced the state-controlled oil company’s market-friendly CEO with a retired army general.
Shades of Venezuela.
Opposite ends of the political spectrum.
But both vertically organized.
SouthLageo.
Maybe Dennis should ask George for a Brazil update. Opec is indicating that there is a lot of activity in the pre-salt basin. However, some of that activity continues to be affected by the presence of CV on the platforms.
“Incremental production is anticipated to come from several project ramp-ups such as the Berbigao/Sururu and Atapu fields, each having a peak capacity of 150 tb/d, which started in 4Q19 and 2Q20, respectively. In addition, Petrobras will start to produce oil from two large projects – Sepia and Mero I – each having 180 tb/d peak capacity, and both scheduled to start in 2H21.
Thank you for the post. I observe this. After a fall of 13 million barrels / day in April 2020, production, after an increase by 5 million barrels / day until November 2020, will again decrease modestly until March according to EIA estimates. It must therefore be understood that if oil production remains at this level, which would not surprise me with less shale oil and less Russian oil, we will now have to make do with more or less 9 million barrels / day in less production (roughly 10% less production compared to 2019). We are approximately at the production level of 2013. However, between 2013 and 2019, a certain number of machines (planes, mopeds, cars, boats, whatever you want) have been added to the existing fleet of machines in 2013. The day the owners of the machines want to make them work, for example, after the COVID crisis is over, there will be no fuel to operate these supernumerary machines. You will imagine that under its conditions, with an Asia, in particular China, which literally drinks petroleum products, it should come as no surprise if there are some which lack fuel.
JFF
If you look at Dennis’ earlier OPEC post of February 14, you will see that the total production chart shows that OPEC has taken approximately 5 M b/d off the market. Check the Russia chart above and they have taken close to 2.2 Mb/d, as of November, off the market. Also there are other members in the OPEC plus group, such as Kazakhstan that also cut back. Kazakhstan has cut back about 200 kb/d. Those three account for close to 7.5 Mb/d.
To close the 9 Mb/d gap that you have noted, that may need to come from the US. Checking the US chart above, you will note there is an approximate gap of close to 1.5 Mb/d between March 2020 and November 2020. So if world demand gets back to the levels of March 2020, US production will have to get back to producing 12.8 Mb/d to avoid a world shortage.
http://peakoilbarrel.com/opec-update-february-2020/#more-30333
Ovi, that depends on where you are measuring from.
Ron
Looks like I need to have my eyes checked. I misread both the OPEC chart and the Russia chart.
Off of Dennis’ OPEC chart I took November 2019 as the OPEC capability relative to the January 2021 gap. It is 4.0 Mb/d not the 5.0 Mb/d stated above. The gap between where Russia is in January relative to November 2019 pre CV peak is 1.1 Mb/d, not 2.2 Mb/d as I posted above. Combining those two gives 5.1 Mb/d.
Checking the gap between Jan 2021 and November 2019 on your chart, shows a gap of 5.0 Mb/d.
So the potential supply demand gap may show up sooner, say mid 2023, than most people/analysts expect. I wonder how much this small gap is associated with the bullish WTI/Brent call by GS.
“Oil has surged this year after Saudi Arabia pledged to unilaterally cut 1 million barrels a day in February and March, with Goldman Sachs Group Inc. predicting the rally will accelerate as demand outpaces global supply. Russia and Riyadh, however, will next week once again head into an OPEC meeting with differing opinions about adding more crude to the market.”
https://www.bloomberg.com/news/articles/2021-02-22/goldman-sees-oil-supply-response-lagging-behind-demand-rebound
Why Saudi Arabia wants to cut again in its production : !?!? If oil prices are climbing, that’s going to delay the revival of OECD economies. The current ”low” prices of oil are not due to a surplus of production in the oil market but due to the sluggishness of oil demand in OECD countries with the covid pandemic. Hampering oil demand is not going to be productive : ?!?!?!?
JFF
It is my understanding that the SA extra cut of 1 Mb/d is just for February and March. These are typically the two lowest demand months of the year.
“The combination of a colder-than-normal winter across the Northern hemisphere, Saudi Arabia’s unilateral 1 million barrels/day production cuts in February and March, and last week’s production cuts in the U.S. have all helped speed up the rebalancing process.”
https://www.fxempire.com/forecasts/article/buoyant-oil-market-looks-to-opec-for-confirmation-702683
JFF
Here is the latest update regarding April output.
“OPEC+ oil producers will discuss a 500,000 barrels per day (bpd) increase in the oil output from April, Reuters reported on Wednesday, citing OPEC+ sources familiar with the matter.”
https://www.fxstreet.com/news/opec-weighs-boosting-oil-output-by-500-000-bpd-from-april-reuters-202102241842
Thanks for these informations, Ovi.
A change of thinking at one corporate board wrt LTO.
“Pioneer will limit production growth to 5% a year over the long term and plans to pay back three-quarters of its free cash flow to shareholders rather than spending on new drilling, Sheffield said.”
https://www.rigzone.com/news/wire/is_us_shale_no_longer_a_threat_to_opec-24-feb-2021-164722-article/
The EIA reported weekly inventory and production numbers this morning. While crude inventories were up 1.3 Mbs, overall total stocks (-0.2 Mb) and including SPR (2.6 Mb) were essentially flat relative to last year. Both were down 13.8 Mb this week. In the week of June 26, 2020, total stocks, including SPR were 2,107.2 Mb, up by 159.9 Mb over June 28, 2019. Last week total stocks including SPR were 1,922.5, down by 185 kb relative to June 26, 2020. The monthly draw from June 28, 2020 is roughly 23 kb/mth.
On the production side, output was down by 1,100 kb/d to 9,700 kb/d.
Frac spread falls off a cliff last week because of Texas deep freeze, down 75%. Be interesting to see how long it takes to recover. Word is a lot of those pipes they pump water through for fracking are busted. Might take a few weeks or more.
https://oilprice.com/Energy/Oil-Prices/A-Key-Fracking-Indicator-Just-Hit-Record-Lows.html
Stephen
Attached is a chart. This means that 120 frac spreads have been disassembled in one week. Difficult to understand. Are these old frac spreads that will never come back?
What the hell happened here?
Ron,
The arctic weather in Texas shut down fracking operations, the weather will warm, repairs will be done, and the frack spread count will rise to the 160 level over the next 4 to 6 weeks.
WTI settled at a new recent high today and is close to the previous high of $65.70 on April 22, 2019.
Just in case anyone has any faith in the EIA’s Monthly Energy Review. I can say they are a lot better than they were just a few years ago.
Ron
It looks like the MER has reduced the November PSM output by 500 kb/d. That’s a pretty big reduction. See what comes in the PSM on Friday.
I don’t understand what data you are looking at Ovi. 11,124 barrels per day is 194 barrels per day above what the MER had for November last month. However, 11,124 barrels per day is the exact figure the PSM had last month for November. The MER always winds up with the exact numbers the PSM has. But they estimate the last two months or so and their estimates are often off by one or two hundred barrels per day.
Ron
I just looked at the left column of the MER. I did not see that there was a separate column for Alaska. My Bad.
Yeah, the left column is the US minus Alaska. That sometimes confuses things.
Here is a headline
China announces MASSIVE oil & gas discovery in Bohai Sea
Here is the fine detail: “The well was tested to produce an average of approximately 1,980 barrels of crude oil per day. ”
https://peakoil.com/geology/china-announces-massive-oil-gas-discovery-in-bohai-sea
I wouldn’t say that is a huge discovery in the grand scheme of things. Less than 1 billion barrels TRR, which might increase over time, but still, the world consumes ~ 35 billion barrels annually.
Iron Mike,
I focus on crude plus condensate, the peak 12 month average output was roughly 30 Gb. All liquids includes propane, ethane, butane, and biofuels, crude plus condensate matches the consumption of gasoline, diesel, jet fuel, and residual (or bunker) fuel at the world level quite closely. Much of the rest of “all liquids” output is bottled gas.
I agree a 1 Gb discovery is not very significant.
Exxon takes Canadian oil sands off its books in historic reserves revision
Exxon counted the equivalent of 15.2 billion barrels of reserves as of Dec. 31, down from 22.44 billion a year earlier, according to a regulatory filing on Wednesday. The company’s reserves of the dense, heavy crude extracted from Western Canada’s sandy bogs dropped by 98%.
Exxon has enough reserves to sustain current production levels for 11 years, down from 15.5 years a year ago, based on Bloomberg calculations.
Pollux
Note that XOM has just taken the oil sands off their books. They are still producing the oil and if prices continue to rise, they will add them back into their books. It’s just an accounting exercise forced by the SEC. Many years back the SEC would not allow oil sands to be counted as part of an oil companies reserves. Eventually they had to relent as the price of oil rose.
Ovi.
You are correct. The annual average oil price is used in calculating reserves. Prices in 2020 were the lowest since 2003. 2020 averaged $39, versus $41 in 2004 and $31 in 2003.
The majors (XOM, CVX, BP, RDS and TOT) lost $76 billion in 2020. They were able to make decent profits in 2003 and 2004.
Producing oil has gotten very expensive for all companies.
I recall in 1997 making a decent profit while selling oil for around $18-20 per barrel. On the same leases in 2020, the $15 per barrel price we received for April oil paid in May was horrific. The $20s prices for March, May and June oil were also a big loser.
I recall through the 90’s local producers saying, “If oil would only stay above $20, I’d be happy.
Now, it doesn’t appear $50 WTI or below is profitable for most new US oil wells, offshore or on.
Thanks Shallow sand.
I hope things are working better at $60/bo for WTI (recent spot price), maybe that’s about $55/bo where you produce at the well head? I doubt we will see $100/bo for WTI (in 2020 $) in the next 5 years and maybe never, we might see $75/bo for WTI (also in 2020$) perhaps from 2022 to 2032 (with some ups and downs from $70 to $80/bo for the 12 month average WTI price in 2020$). That’s my guess, likely wrong.
Dennis.
I have posted before that I have no good feel for anything about oil prices except they will be volatile.
I did think that prices would improve with the election of Biden. But not this fast. And Biden’s election isn’t the only factor.
Ovi
“…if prices continue to rise, they will add them back into their books”
The big question is, will prices continue to rise?
For example, Gail Tverberg writes the following in her last post:
Why Collapse Occurs; Why It May Not Be Far Away
“My view is that most of the resources that seem to be available will be left in the ground because of low prices and problems associated with collapse, such as failing governments and broken supply lines.”
Gails version of why oil may be left in the ground is one way the future can pan out.
Alternatively, some oil may be left in the ground because the extraction/refining of particular resources ends up being more expensive than other transportation methods (electrical).
I see this alternative scenario as more likely, now that a entirely viable alternative method of transport has emerged. Test drive a Ford Mustang to understand.
This will be a historically wild decade when it comes to shuffling of the big underpinnings of the transportation industry worldwide. By 2030, you will not recognize the landscape, if you are looking from the viewpoint of the last decades.
I am still expecting excellent prices for oil producers in this decade. Just the hunch of an observer.
Nigeria losing 200,000 b/d to crude oil theft as sabotage grows: NNPC
Nigeria is losing an average of 200,000 b/d of its crude oil production to theft, state-owned Nigerian National Petroleum Corp. said Feb. 25, indicating a surge in pipeline sabotage in the West African country.
The loss, which NNPC said resulted from sabotage attacks on pipelines and illegal pilfering by thieves, represents a quantum leap compared to the industry average of 70,000 b/d of crude output lost to theft as of August 2020.
Russia February Oil Output Falls Despite Increase in OPEC Quota
The February average equates to 10.093 million barrels a day, based on a 7.33-barrel-per ton conversion ratio, which is about 77,000 barrels a day lower than in January.
15$ minimum wage increase will be a game changer. Most people will get this wrong because we haven’t had inflation since the 70’s. This will change the entire cost and price structure of everything. It won’t be just bring those who make less the $15 hr up to $15 hr. All those currently making $13-$18 an hr will go to $20-$24.
More dollars chasing the same amount of goods and services. Equals inflation. At same time taxes are going up for the wealthy. The smart wealthy will exit debt and stock markets and front run that inflation by buying commodities. I think oil will go to over $150 by 2026-2027.
And it won’t be supply and demand driven.
US crude plus condensate 12 month centered average output in kbo/d.
Peak was October 2019 at 12475 kbo/d.