A guest post by Ovi
All of the oil (C + C) production data for the US state charts comes from the EIAʼ’s Petroleum Supply monthly PSM. After the production charts, an analysis of three EIA monthly reports that project future production is provided. The charts below are updated to September 2021 for the 10 largest US oil producing states.
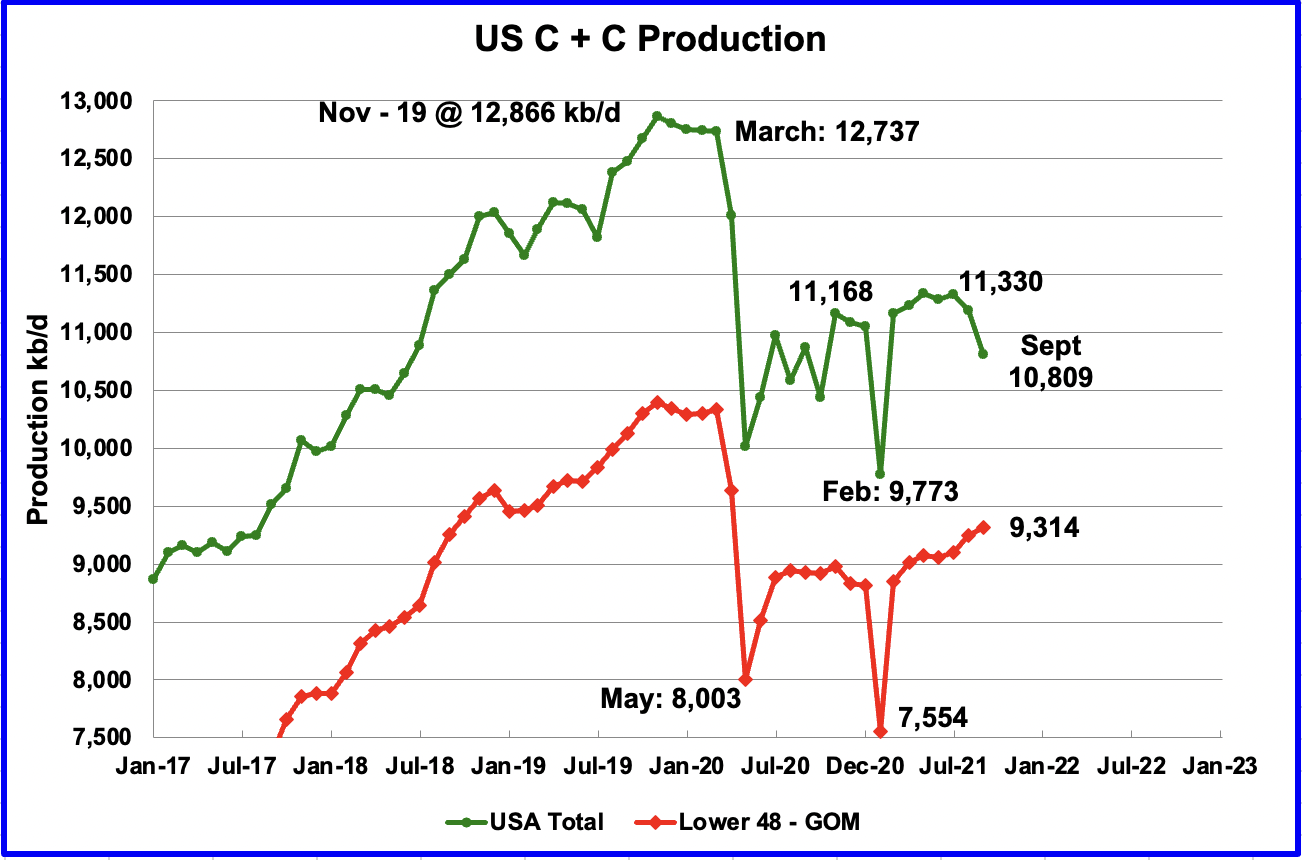
U.S. September production decreased by 380 kb/d to 10,809 kb/d. The drop is largely due to Hurricane Ida’s impact on GOM production. The GOM output dropped by 464 kb/d due to unexpected and extensive damage to platforms in the gulf.
While overall US production was down, a better indication of the health of US oil industry can be gleaned by looking more closely at the onshore L48 states. In the on-shore lower 48, September production increased by 63 kb/d to 9,314 kb/d. The main contributor to this increase was Texas. Texas’ output offset some the GOM’s steep loss.
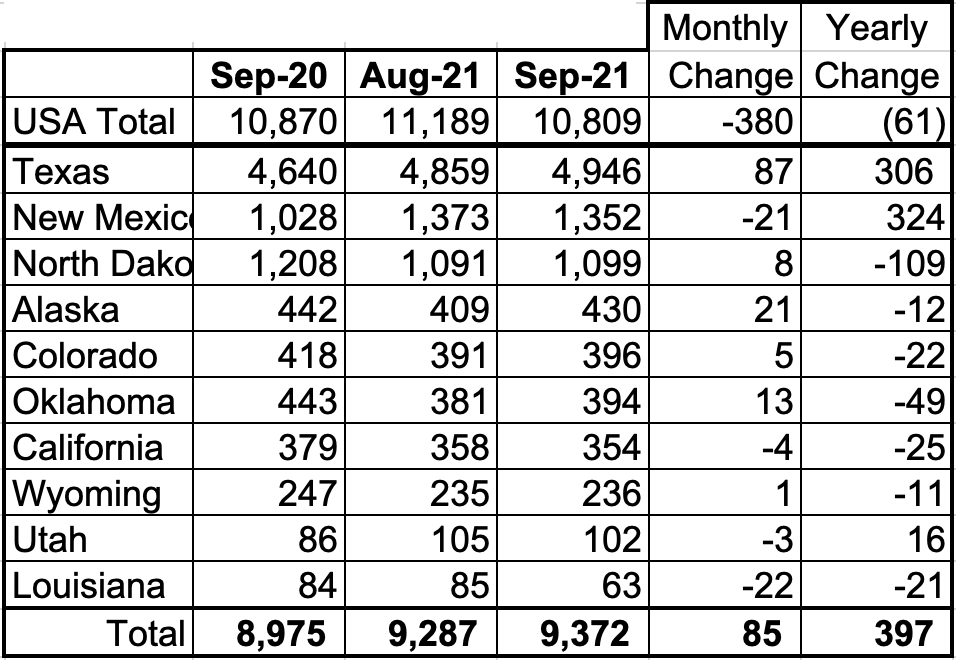
Listed above are the 10 states with the largest US production. These 10 accounted for 86.7% of US production out of a total production of 10,809 kb/d in September 2021.
Of the 85 kb/d increase from these ten states, on a MoM basis, the majority came from Texas with 87 kb/d. On a YoY basis, US production decreased by 61 kb/d.
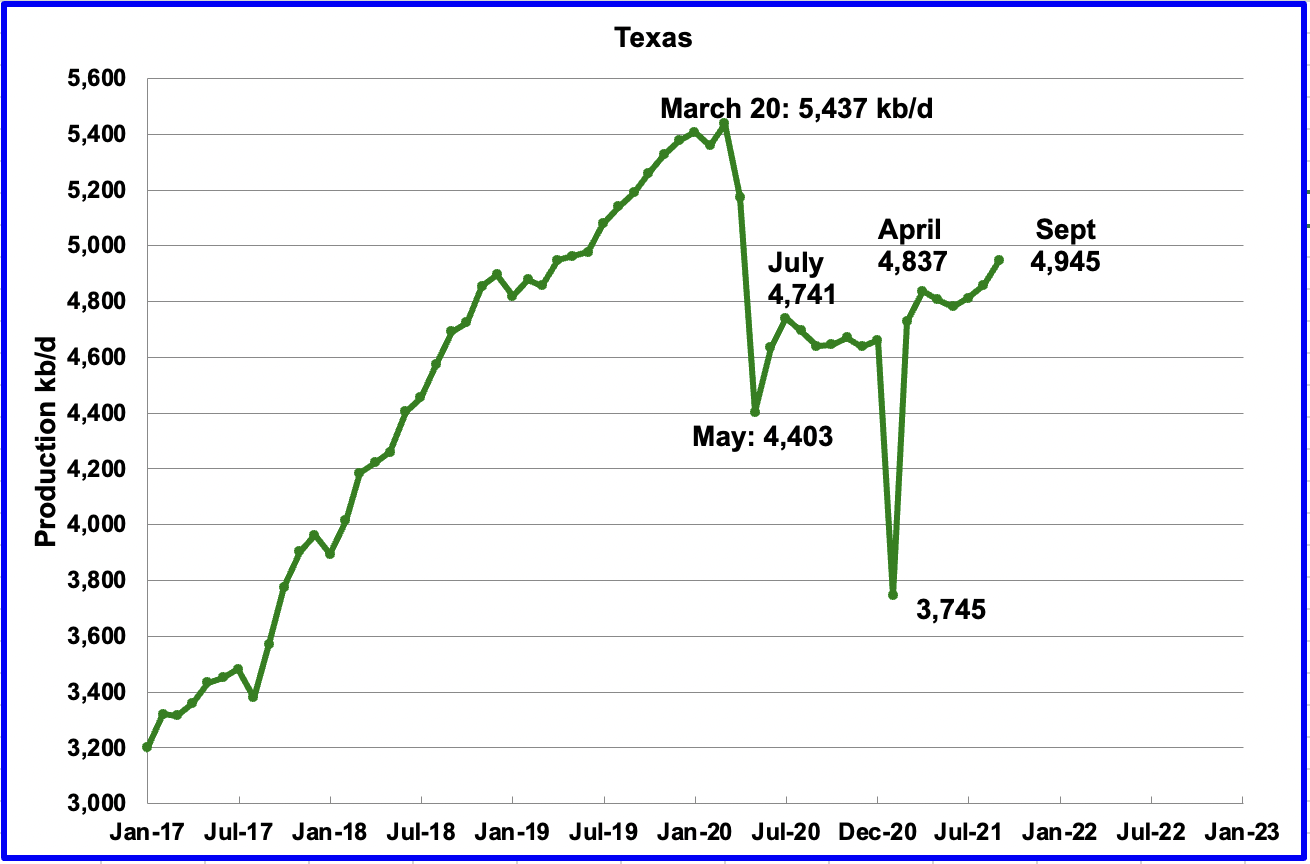
Texas production increased by 87 kb/d in September to 4,945 kb/d. Relative to July 2020, production is up by 204 kb/d.
In August there were close to 211 oil rigs in operation in Texas. By the week of November 26, 252 rigs were operating and production has started to increase. Based on the DPR report below, the increase is coming from the Texas side of the Permian.
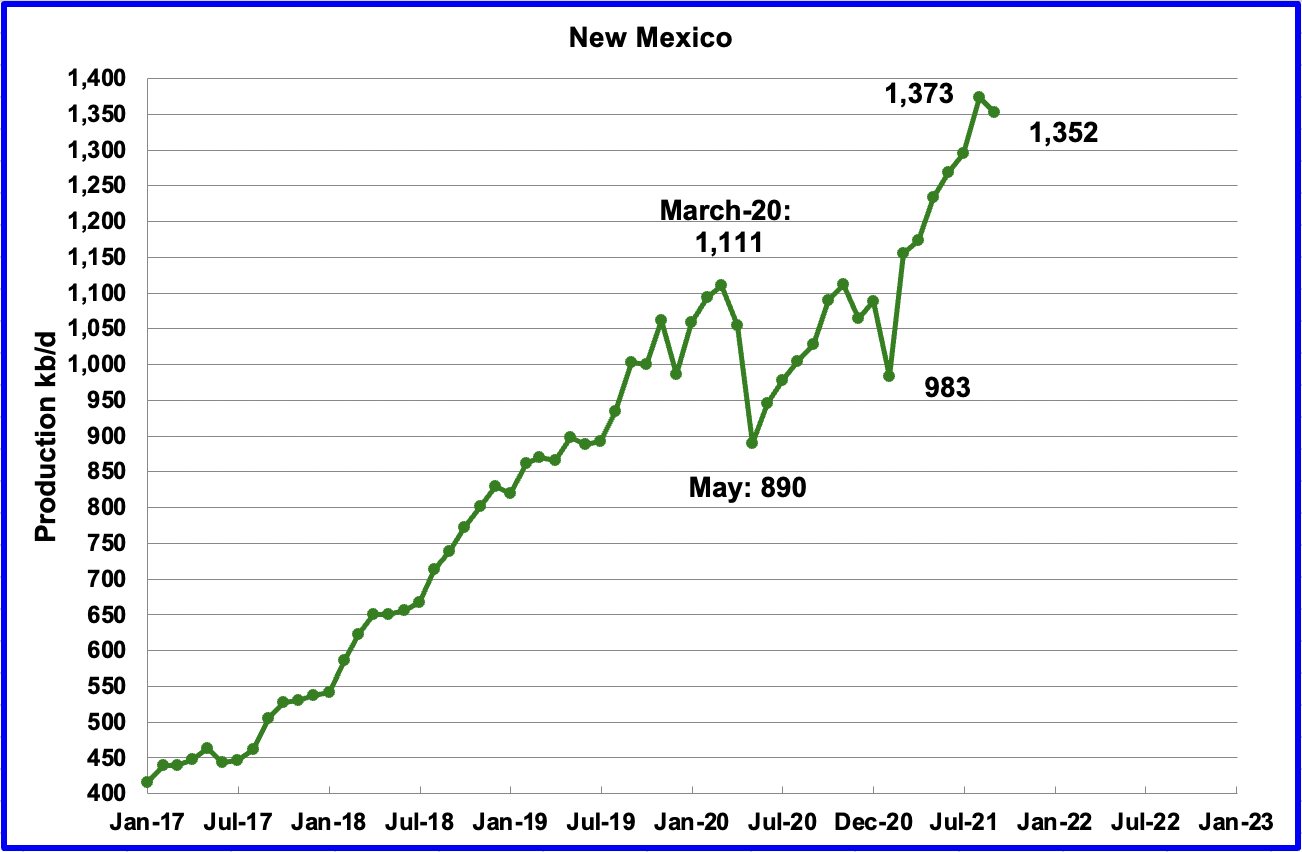
September’s New Mexico production unexpectedly dropped by 21 kb/d to 1,352 kb/d. While September is showing a drop, it should be noted that August’s original 1,346 kb/d was revised up to 1,373 kb/d in today’s PSM.
While 75 rigs were operating in July, by September they had increased to 82. It is not clear why New Mexico’s output dropped in September.
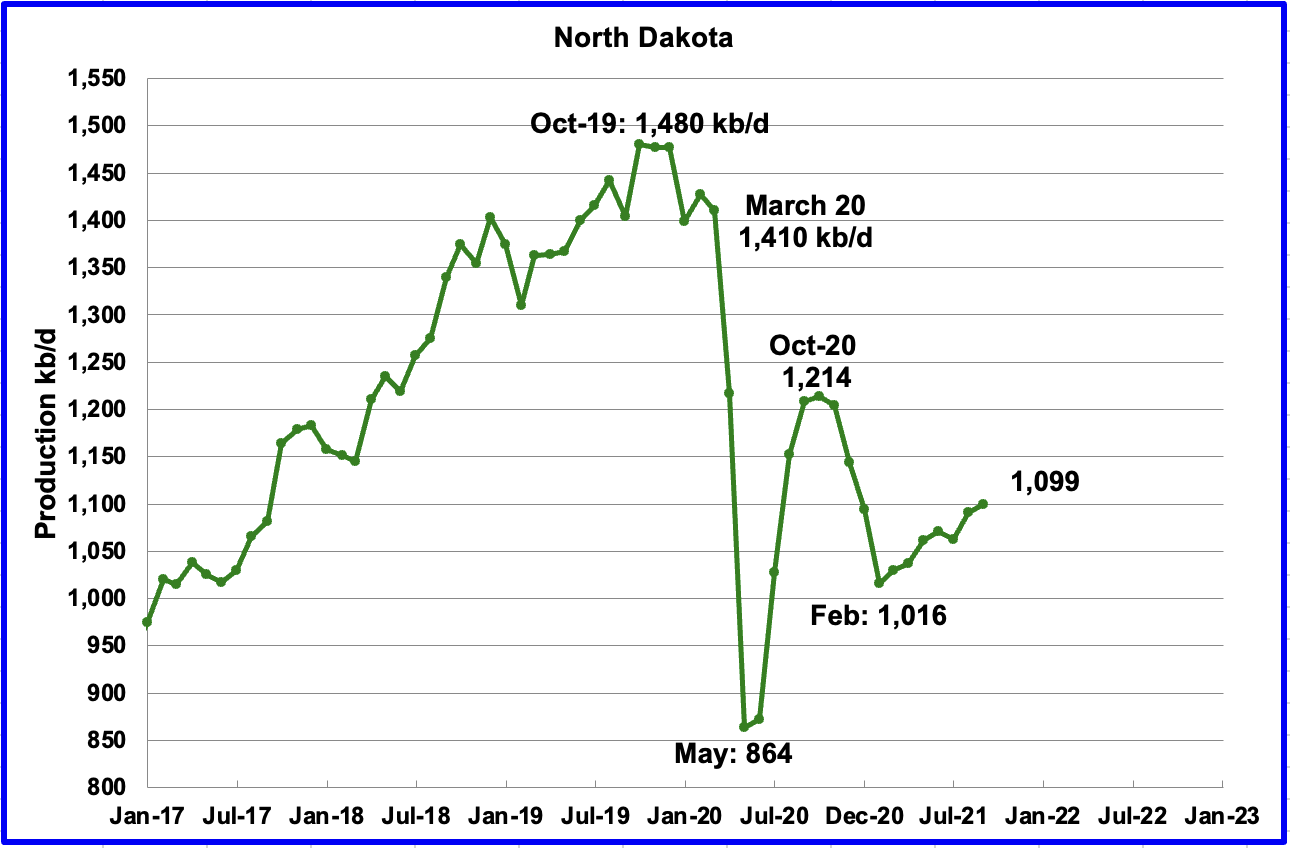
According to the EIA, North Dakota’s September output was 1,099 kb/d, an increase of 8 kb/d over August. While the EIA is showing an increase in output from February to September of 86 kb/d, the DPR report in Section 2 below only shows an increase of 19 kb/d over the same time frame.
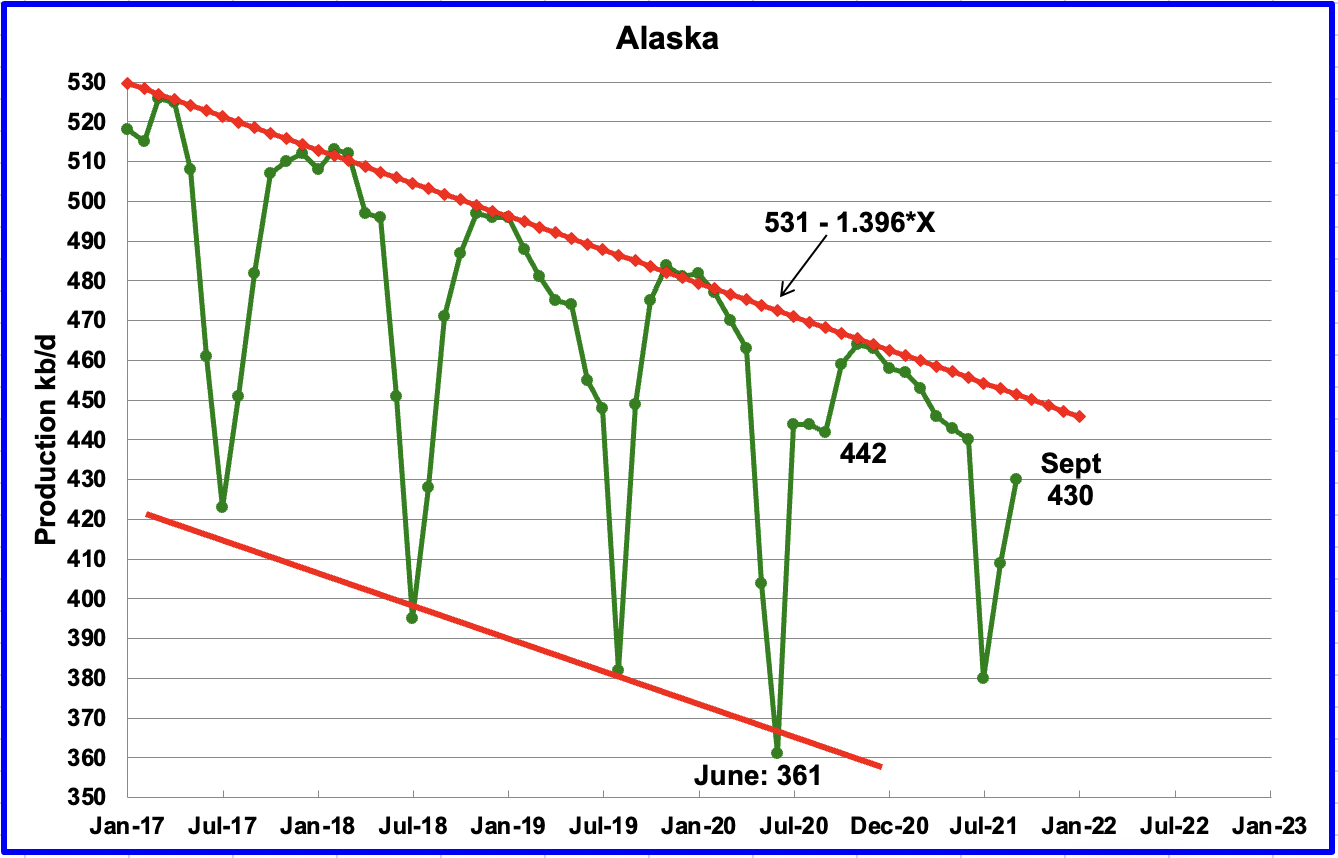
Alaskaʼ s September output increased by 21 kb/d to 430 kb/d as maintenance declined. One year ago, production was 442 kb/d. Interestingly, this years June and July outputs did not get down to the level of previous years.
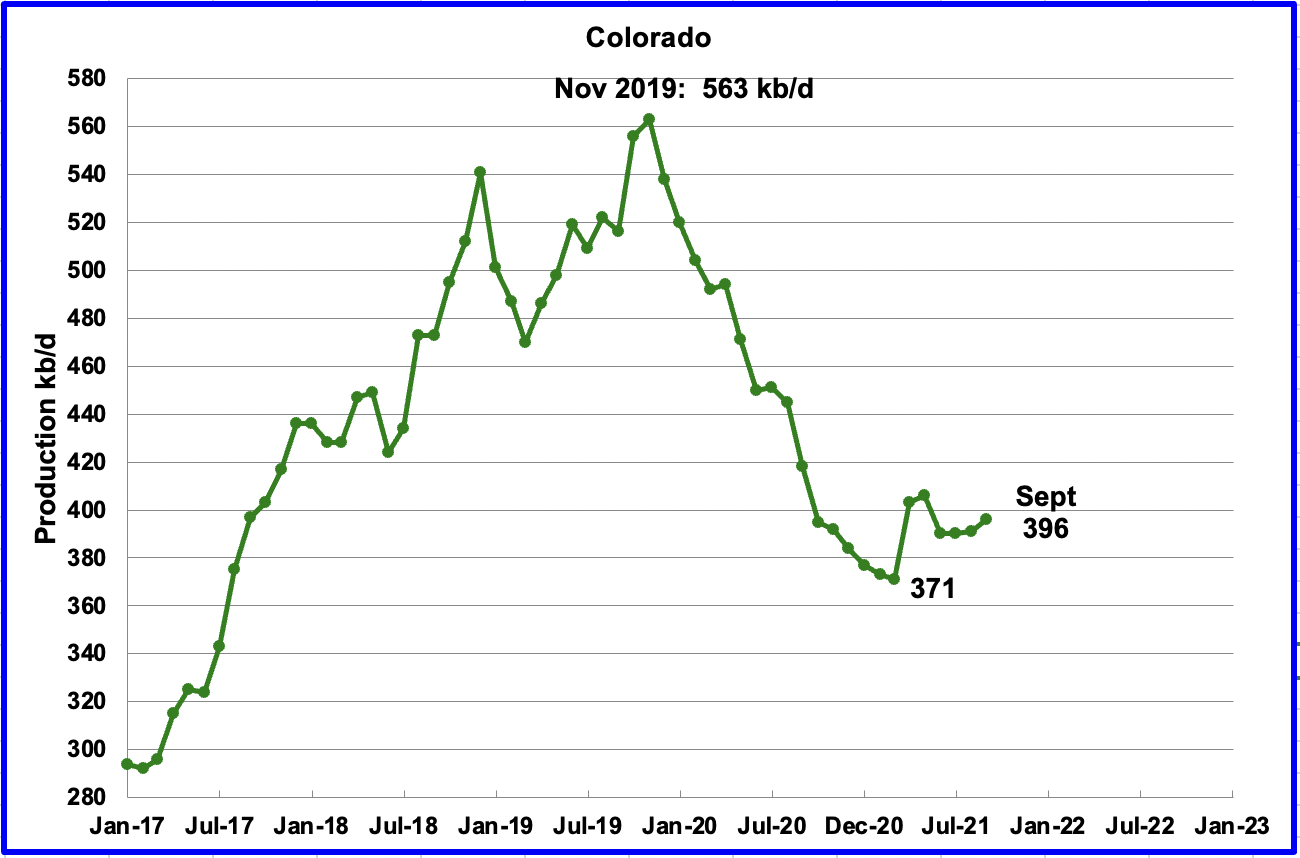
Coloradoʼ s September output increased by 5 kb/d to 396 kb/d. Colorado had an average of 10 rigs operating in November up from 9 in September and October.
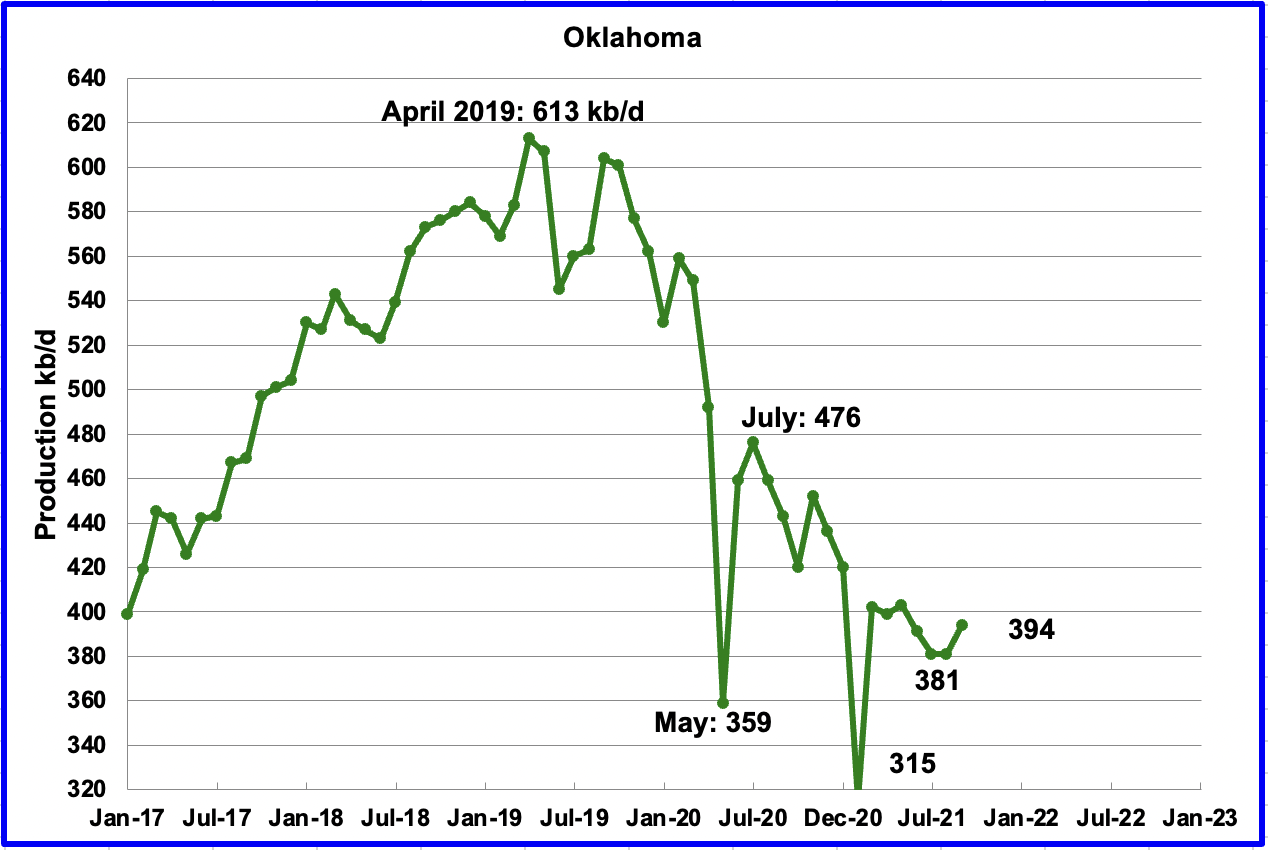
Oklahoma’s output in September increased by 13 kb/d to 394 kb/d.
During August, Oklahoma had 29 rigs operating and by September they increased to 33. For the week ending November 26, 44 rigs were operating in Oklahoma. Will this increase in rigs be able to reverse the extended decline that has set in?
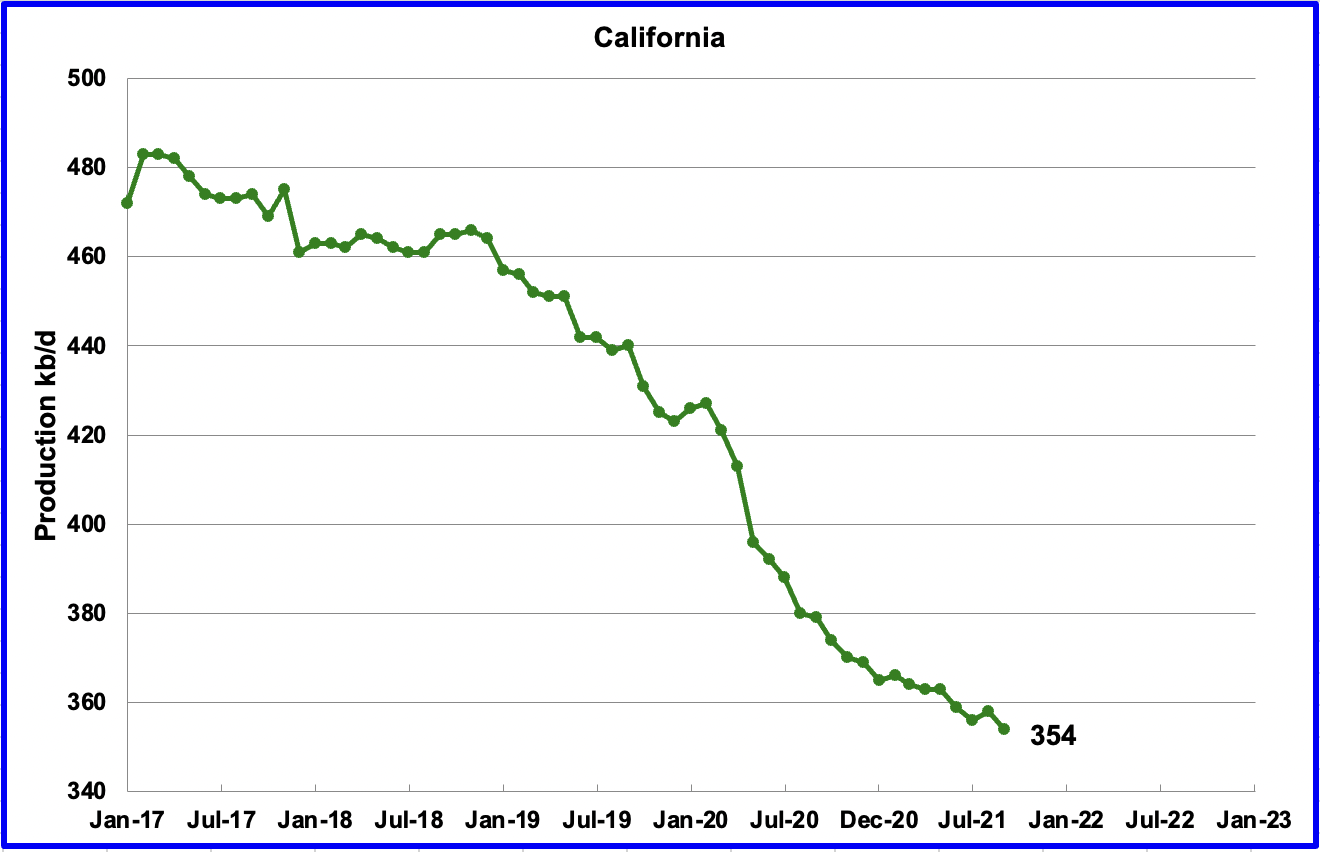
Californiaʼ s slow output decline returned in September. Output decreased by 4 kb/d to 354 kb/d.
California had 4 rigs operating in August and September and has slowly increased them to 9 in the week ending November 26.
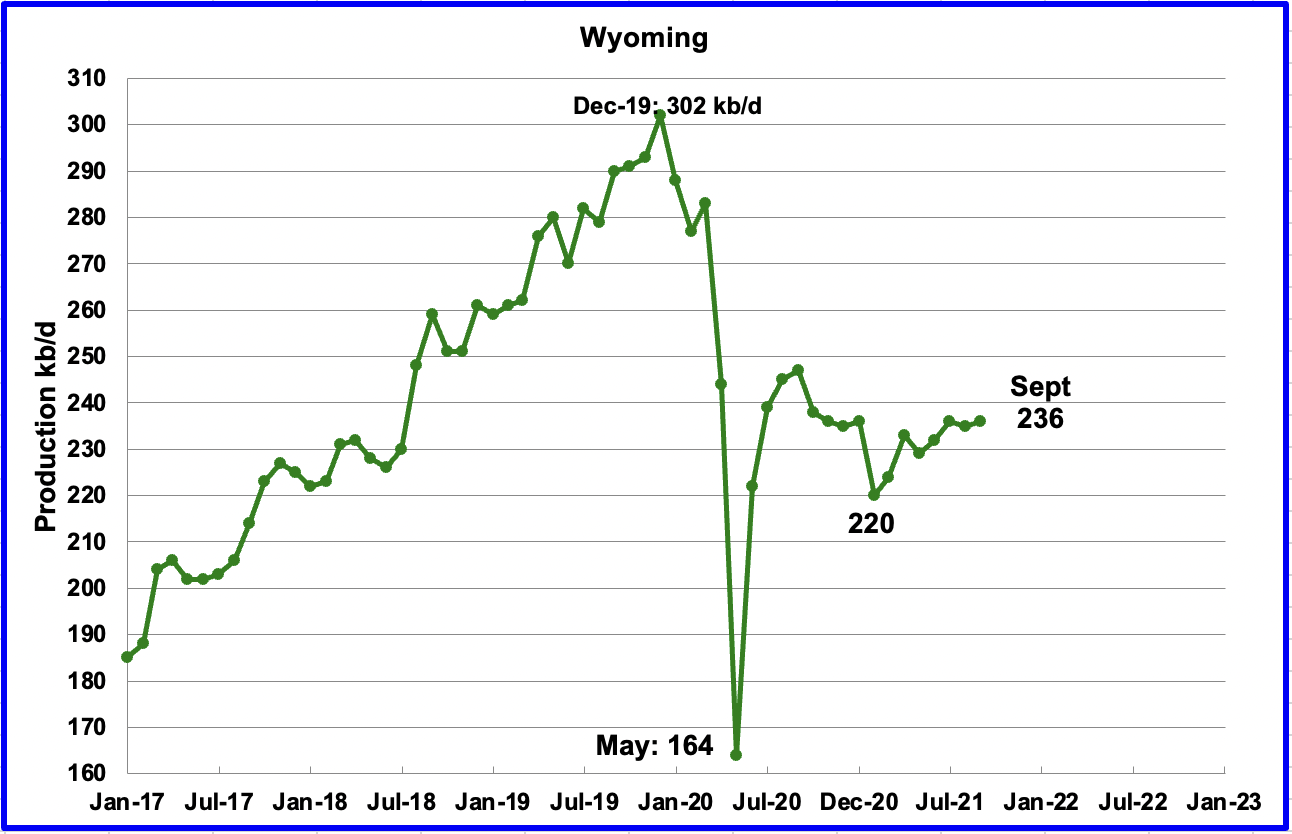
Wyoming’s production in September increased by 1 kb/d to 236 kb/d. Wyoming had 17 oil rigs operating in September but they decreased to 13 by late November.
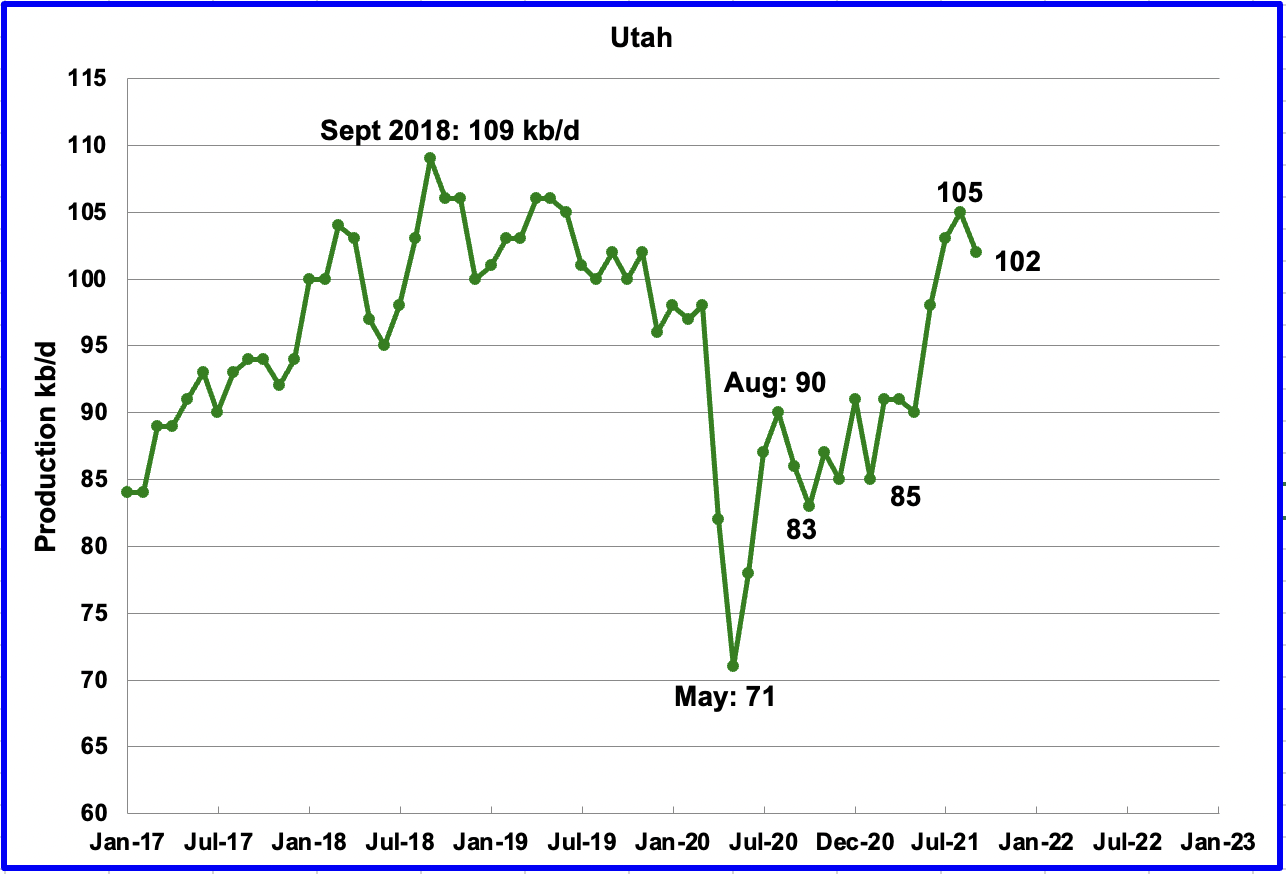
September’s production decreased by 3 kb/d to 102 kb/d. Utah had 11 oil rigs operating in September and by the end of November the number had dropped to 8.
According to this source, boom times are returning to Utah.
While state and industry leaders forecast doom for energy development and rural employment from Biden’s moratorium, which they characterized as a “ban” on development, the exact opposite appears to be happening. Utah’s oil and gas sector is waking up from its pandemic-induced slumber despite obstacles put up by the climate-friendly Biden administration.
So what’s going on? The price of oil has shot past $70 a barrel. Energy companies are acting swiftly to increase production while prices remain high, said the Utah Division of Oil, Gas and Mining.
The boom is proof that financial incentives drive energy development in Western public lands states, not executive orders from the White House, according to Landon Newell, a staff attorney with the Southern Utah Wilderness Alliance.
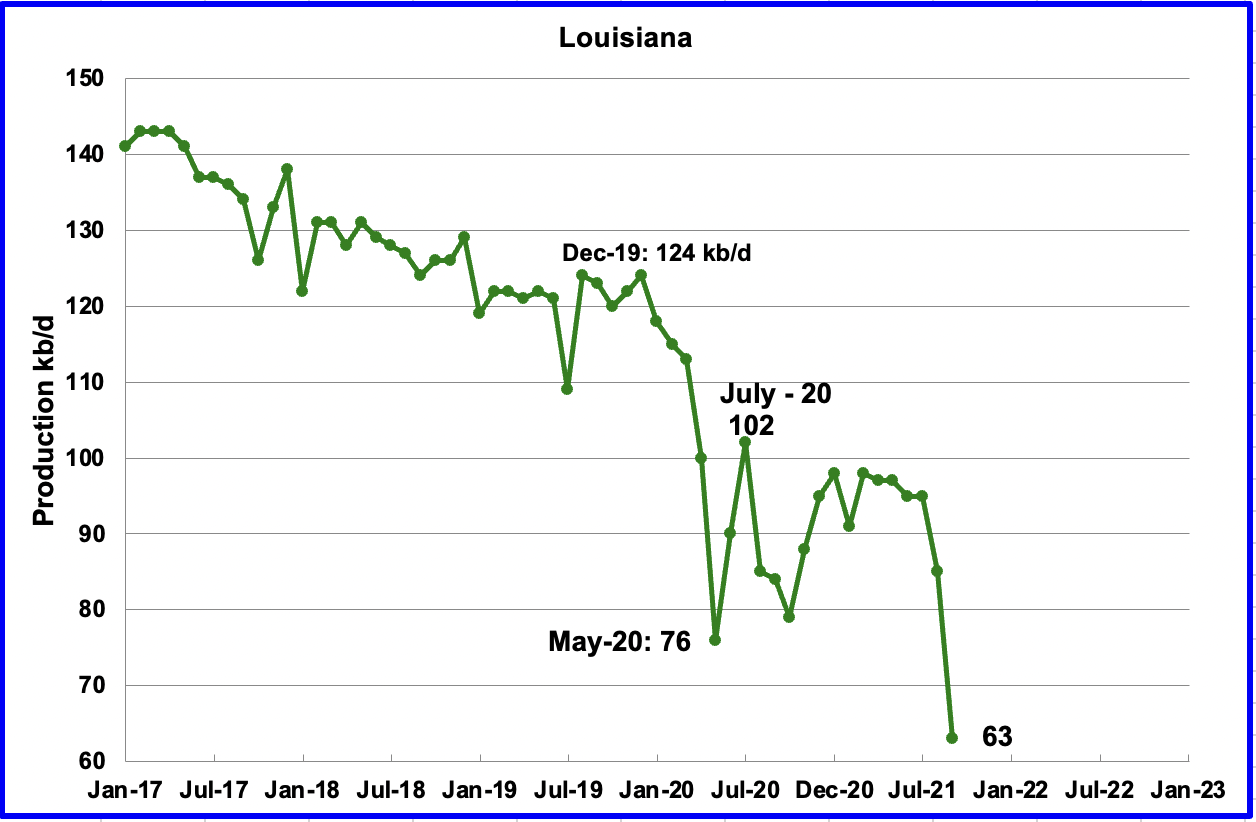
Louisiana’s output dropped by 22 kb/d to 63 kb/d. Louisiana was one of the hardest hit states by hurricane Ida in late August.
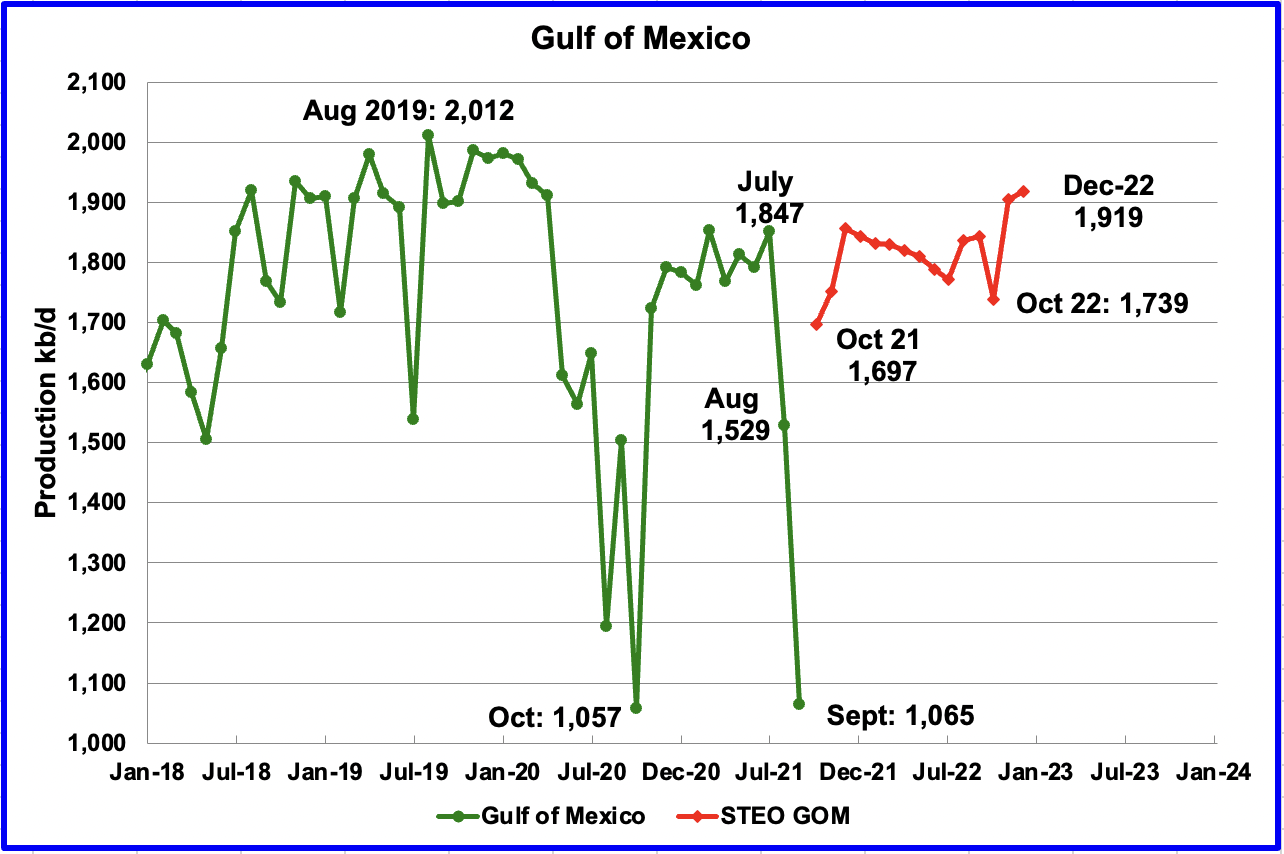
Production from the GOM dropped in September by 464 kb/d to 1,065kb/d. If the GOM was a state, its production would normally rank second behind Texas. In September, hurricane Ida caused oil production to drop below both New Mexico’s and North Dakota’s.
The November STEO projection for the GOM output has been added to this chart and projects output to be 1,919 kb/d in December 2022. The September output forecast for the GOM by the STEO was 1,080 kb/d, a very good estimate, off by only 15 kb/d.
A Different Perspective on US Oil Production
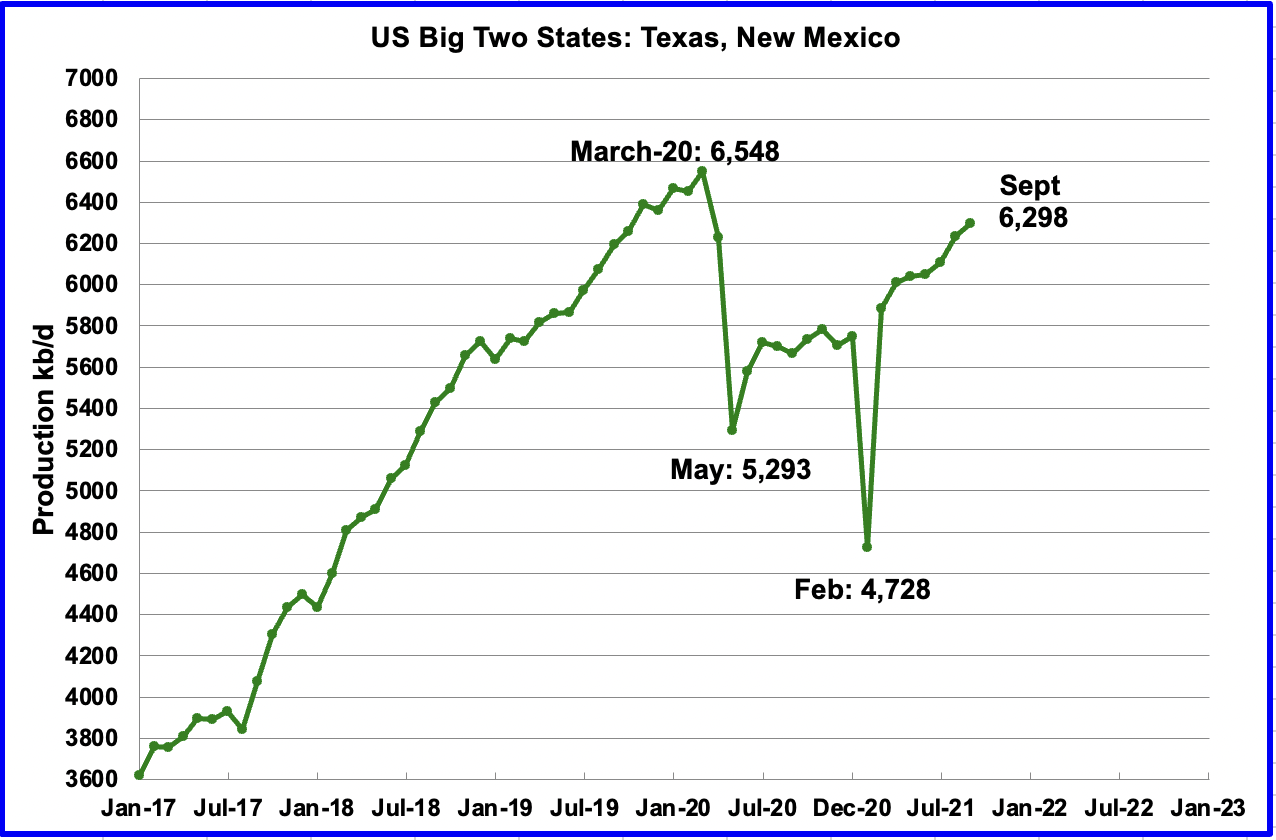
Big Two states
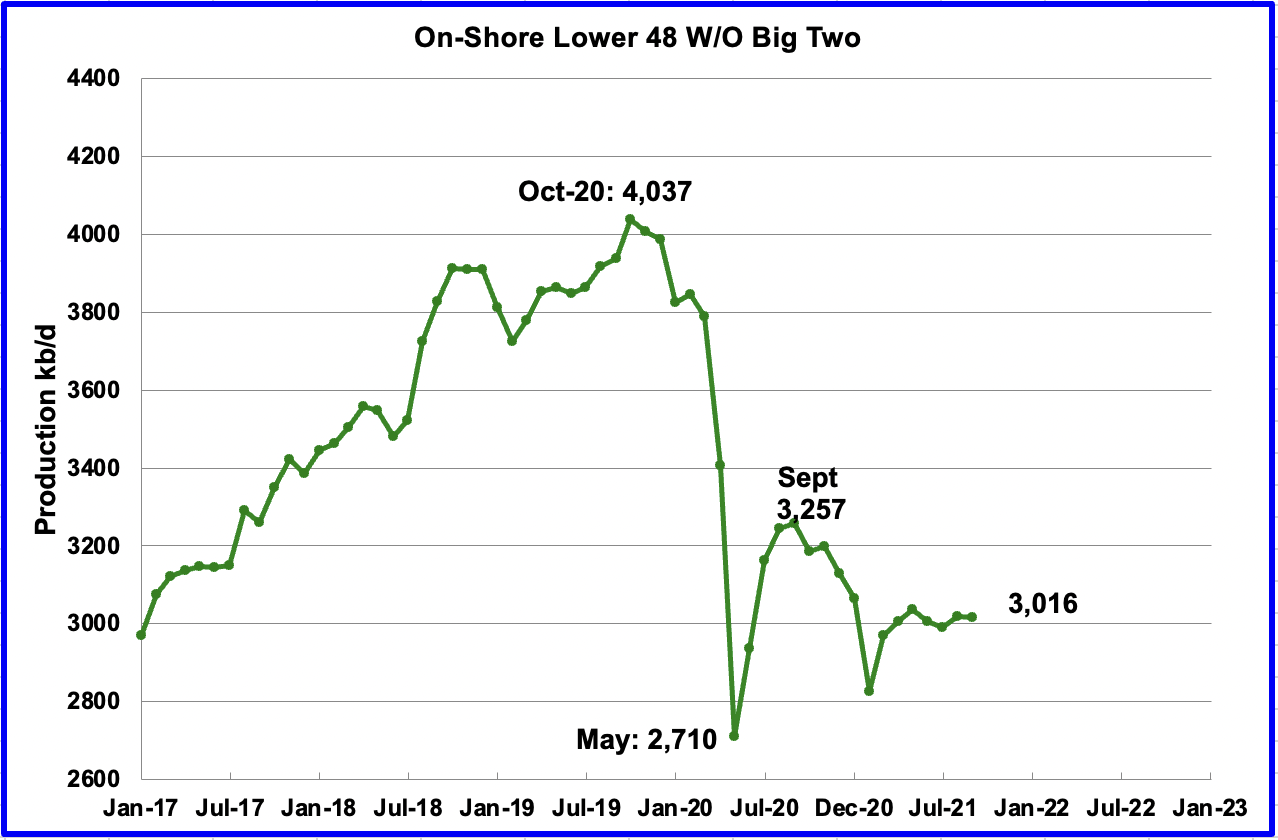
The Rest
To get a different perspective on US oil production, the above two charts have broken US production into “The Big Two” and “On-Shore L48 W/O Big Two”
The production increase in the the Big Two is growing primarily due the increase in the Permian. The rest of the L48 states have shown an overall decline of close to 250 kb/d since September 2020. However since April, production has been essentially flat at slightly over 3,000 kb/d.
1) Short Term Energy Outlook
The STEO provides projections for the next 4 – 16 months for US C + C and NGPLs production. The November 2021 report presents EIAʼ’s updated oil output and price projections to December 2022.
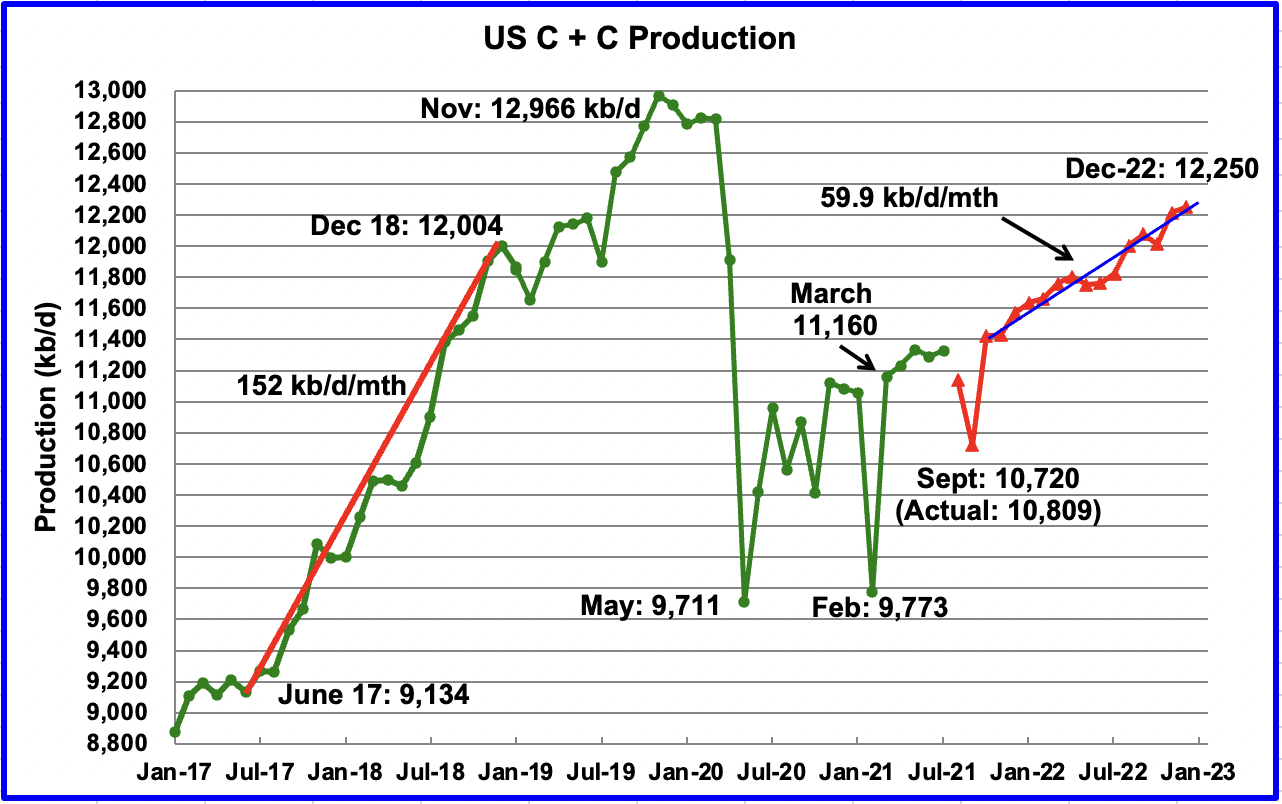
There has been a major upward revision to US output in the November STEO. The projected December 2022 output has been increased by 200 kb/d over the estimate in the October report. Also the December 2021 output forecast has been revised up by 300 kb/d. The two upward revisions come from rising tight oil production associated with increasing rig counts.
From October 2021 to December 2022 the average monthly increase is expected to be 59.9 kb/d/mth up from 49.6 kb/d/mth in the October report.
September 2021 output is projected to hit a low of 10,720 kb/d due to hurricane Ida. The weekly estimates issued by the EIA for September gave an average output of 10,680 kb/d, 80 kb/d lower than the STEO. Actual September output was higher at 10,809 kb/d.
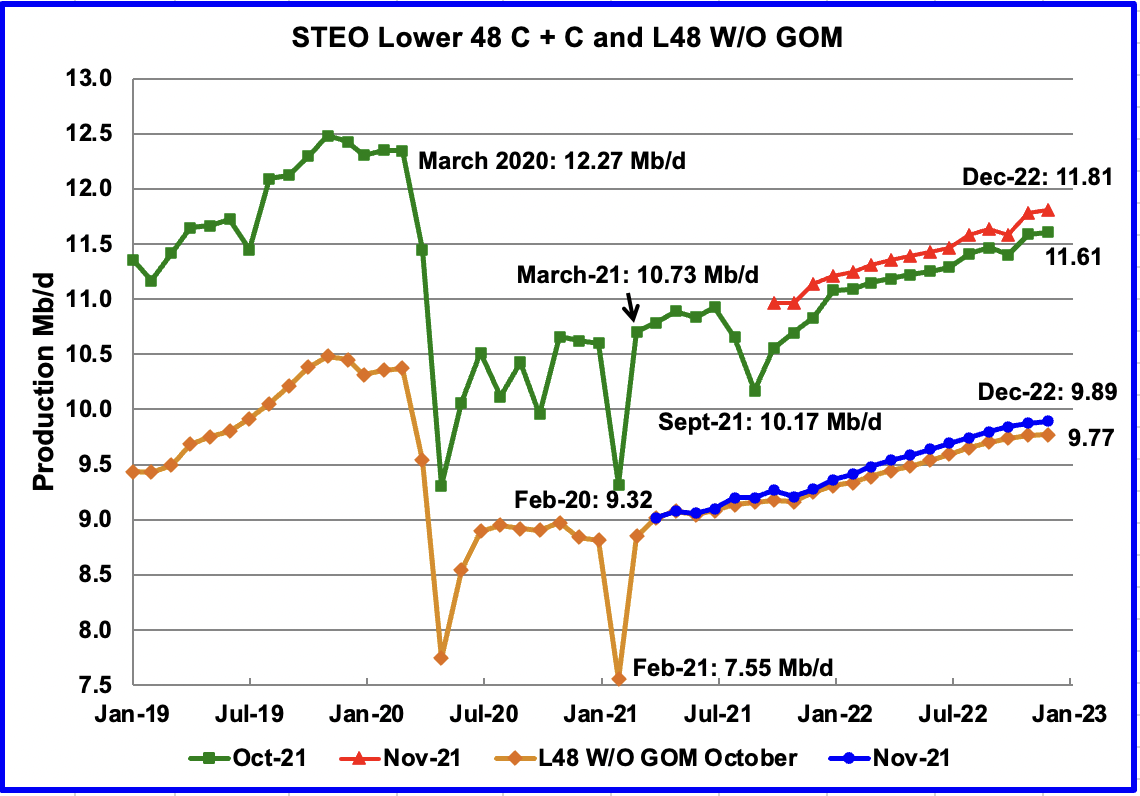
This chart compares the STEO forecast from the October report with the current November report to better illustrate how the output forecast for December 2022 changed. For the Lower 48, the December 2022 output has been revised up by 200 kb/d from 11.61 Mb/d to 11.81 Mb/d. For all of 2022, production was revised up due to an expected increase in drilling and the associated tight oil output.
The November STEO output projection for the Onshore L48 states has also been revised up. For the Onshore L48, the output projection for December 2022 has been increased by 120 kb/d to 9.89 Mb/d. However, note the slowing output growth in the later months of 2022.
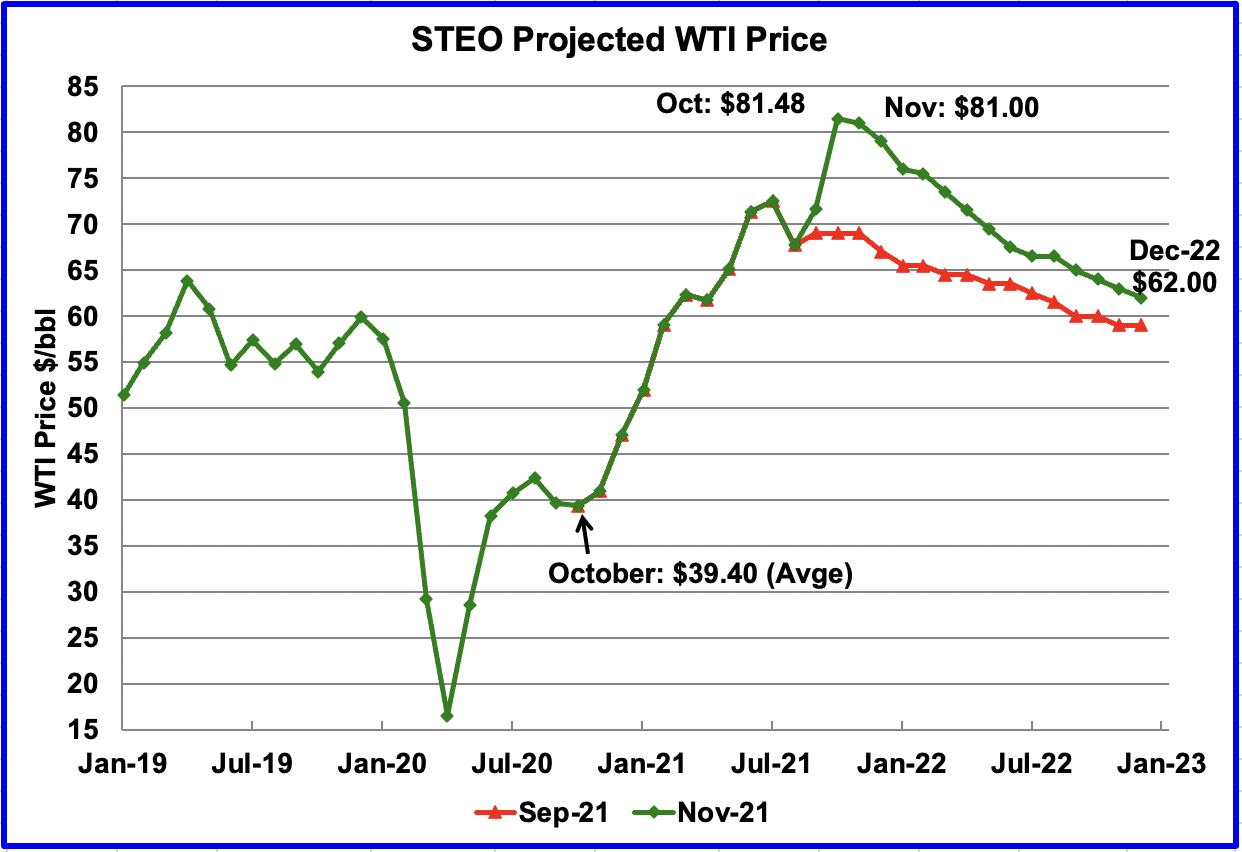
The November 2021 STEO oil price forecast continues to show a steady decline from the peak of $81/bbl on average in November to $62/bbl in December 2022. The big forecast change for WTI occurred in updating from the September report to the November report. Note that on the day when the STEO was completed, November 4, the WTI settled price was $78.81/bbl.
The January WTI contract settled at $66.18 on November 30, $10 lower than the EIA projection of $76.00 for their January forecast.
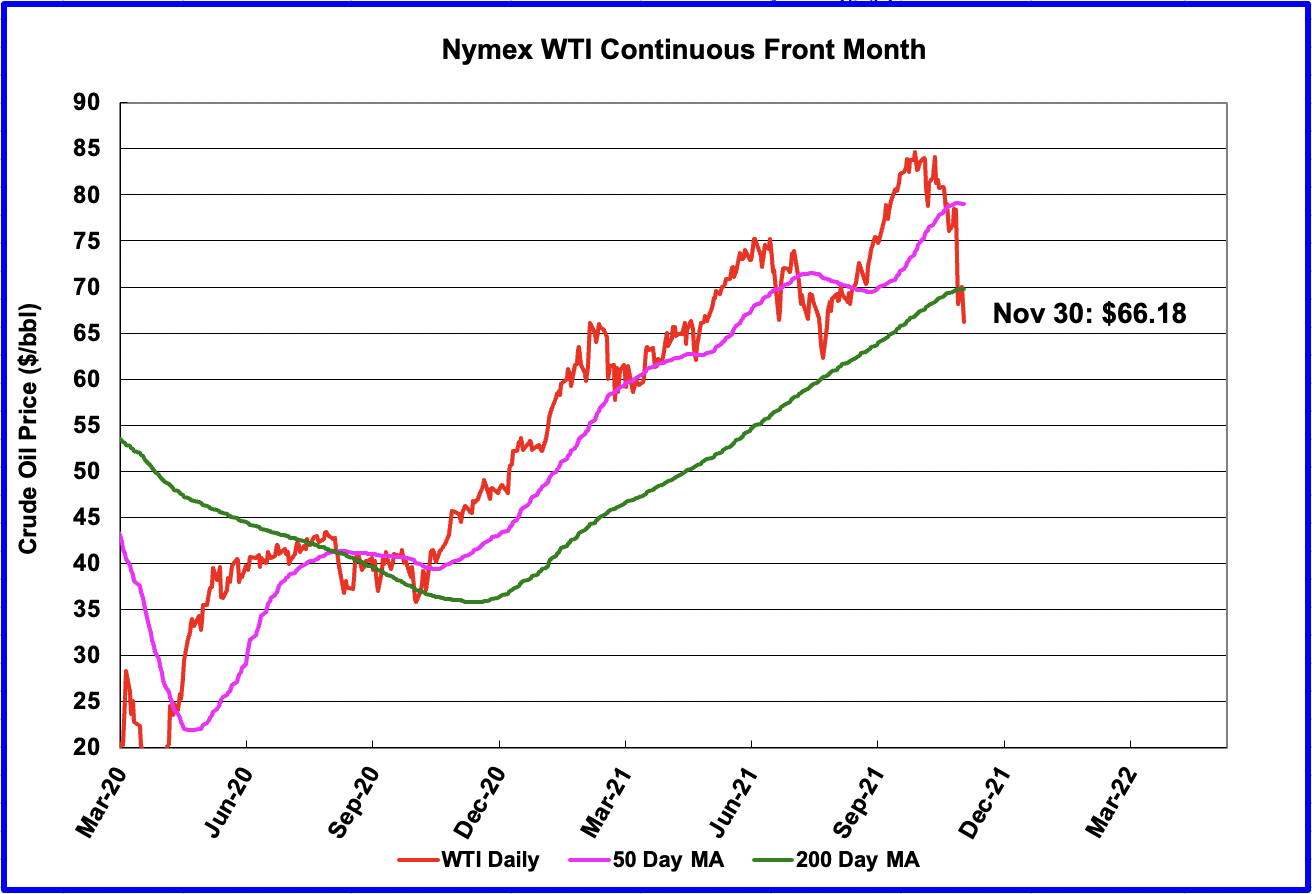
WTI on November 30 settled below the 200 day moving average. The drop can largely be attributed to the announcement of the new Omicron covid variant and its potential/unknown impact on the economy.
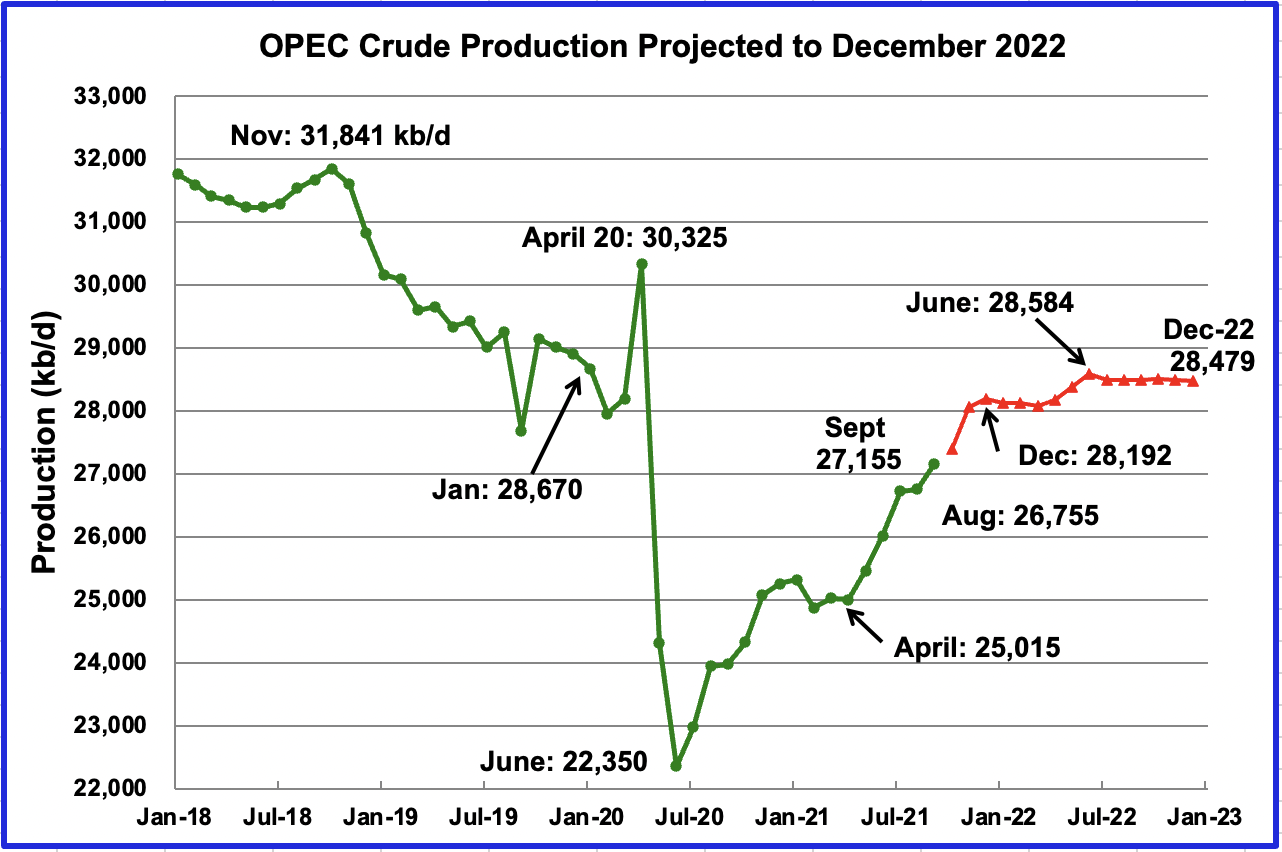
This chart shows the STEO’s November forecast for OPEC crude output to December 2022. OPEC’s output is projected to increase from April 2020 to December 2020 by close to 3,200 kb/d, which is roughly 100 kb/d more than forecast in the October report.
From March 2022 to June 2022, The EIA shows OPEC production increasing from 28,070 kb/d to 28,580 kb/d, an increase of 501 kb/d. No country specific data is provided to explain the source of this extra crude.
For October 2021, the EIA STEO forecast production to be 27,395 kb/d. Actual October production as reported by OPEC was 27,453 kb/d, higher by 58 kb/d. Amazingly accurate projection by the EIA.
According to this source, OPEC pumped 27,740 kb/d in November. The survey found, a rise of 220 kb/d from the previous month but below the 254,000 increase allowed under the supply deal. The STEO projection for November is 28,064 kb/d, 324 kb/d higher than reported.
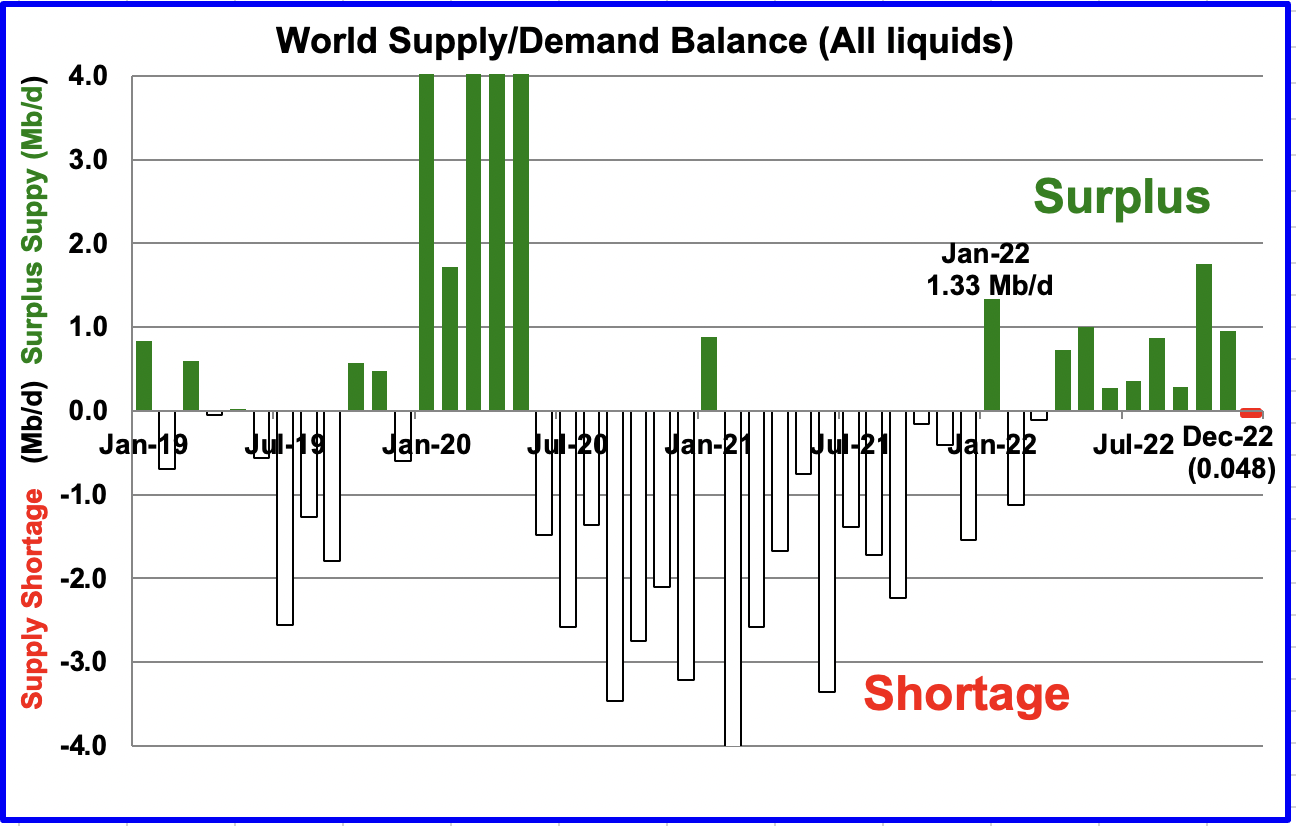
This chart show the historical supply/demand balance up to October 2021 and after that, the EIA’s forecast out to December 2022. From April 2022 to November 2022, the STEO is forecasting an average surplus of close to 778 kb/d.
This expected surplus, along with the variant, Omicron, and the SPR release may make OPEC + reconsider their planned 400 kb/d production increase for January 2022 at their December meeting.
January 2022 is expected to be the first month with a surplus of 1.33 Mb/d since July 2020, followed by deficits in February and March.
2) Drilling Productivity Report
The Drilling Productivity Report (DPR) uses recent data on the total number of drilling rigs in operation along with estimates of drilling productivity and estimated changes in production from existing oil wells to provide estimated changes in oil production for the principal tight oil regions. The November DPR forecasts production to December and the following charts are updated to December 2021.
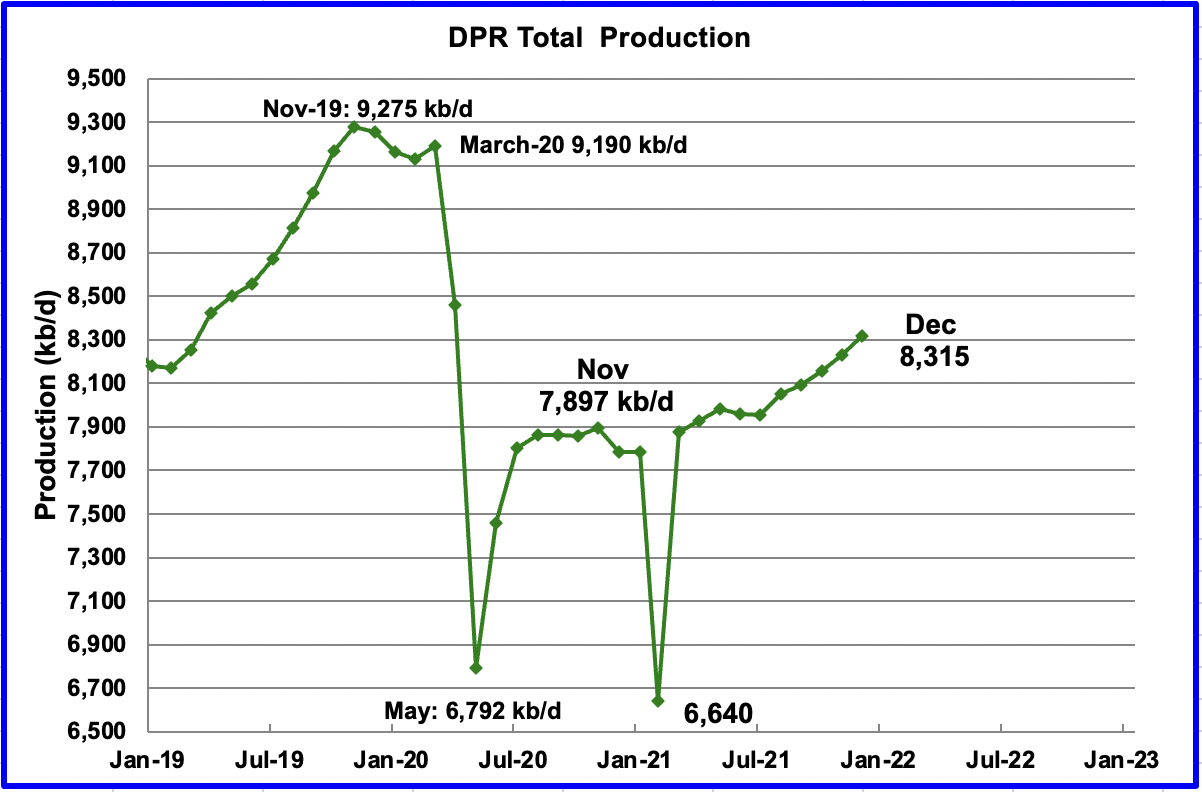
Above is the total oil production from the 7 DPR basins that the EIA tracks, projected to December 2021. Note that the DPR production includes both LTO oil and oil from conventional fields
The DPR is projecting that output for December 2021 will increase by 84 kb/d over November to 8,315 kb/d. From August to December, output in the DPR basins is forecast to increase by 361 kb/d or 72 kb/d/mth and appears to be accelerating since December added 84 kb/d. The Permian basin is the primary contributor to the production increase.
If the average output rate of 72 kb/d/mth were to continue, this would add 864 kb/d/yr to US production, which could potentially begin to disrupt world oil supply and cap the increase in the price of oil to below $100/bbl.
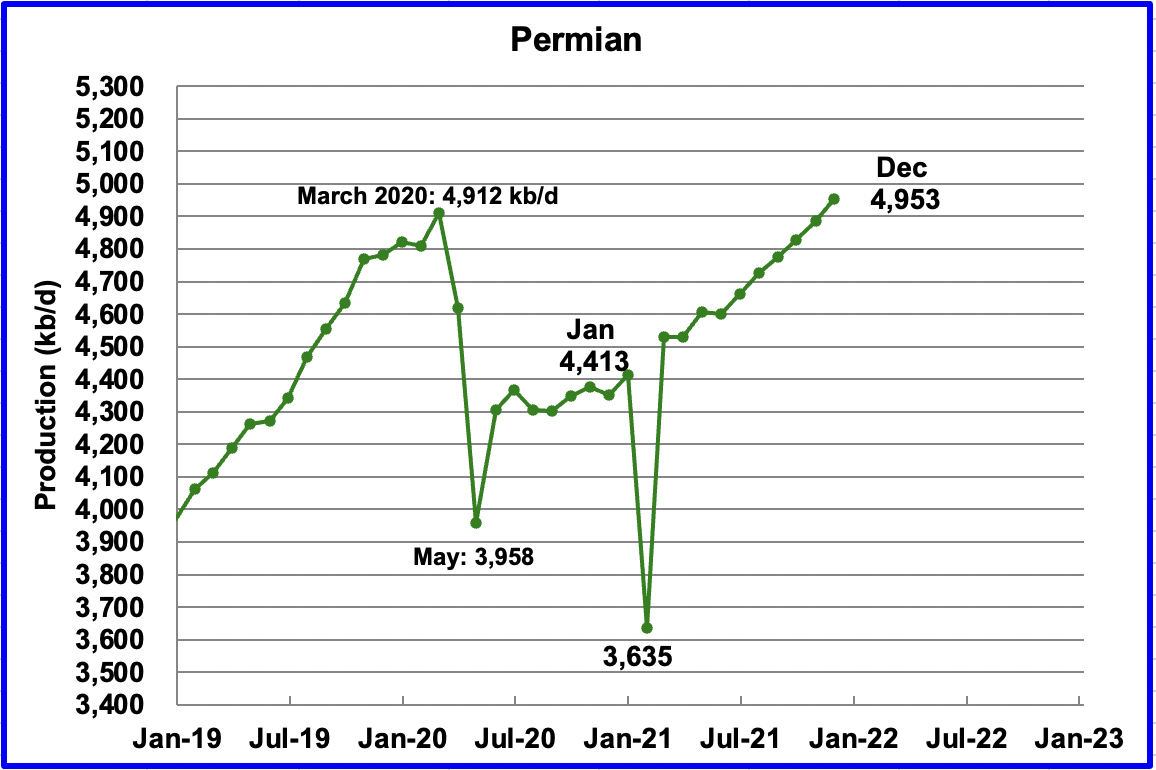
Permian output is projected to reach a new production high of 4,953 kb/d in December. In December output is expected to be up by 67 kb/d over November. From June to December production is forecast to increase by 353 kb/d or at an average rate of 58.8 kb/d/mth.
During October, 295 wells were drilled and 402 were completed. The completed wells added 301 kb/d to the forecast October output. The decline was 249 kb/d which resulted in a net increase of 52 kb/d. It is the completion of the additional 107 DUCs, over and above those drilled, that accounts for the increase in the production in the Permian.
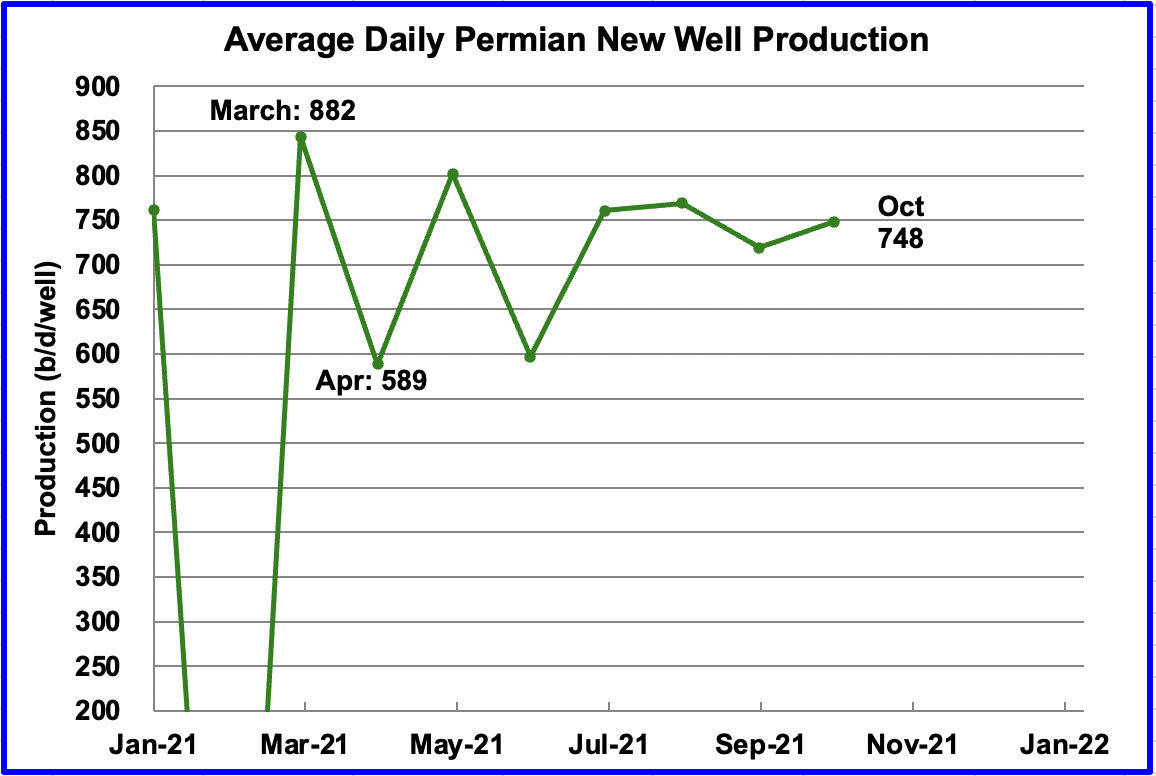
This chart shows the daily production from the average new Permian well tracked on a monthly basis. The daily output from new Permian wells was divided by the number of completed wells, as reported in the DPR and DUC reports.
For instance, during October, the new wells produced 301 kb/d from 402 wells for an average of 748 b/d. The DPR back checks their earlier estimates and it appears that the average output is bouncing around 700 kb/d.
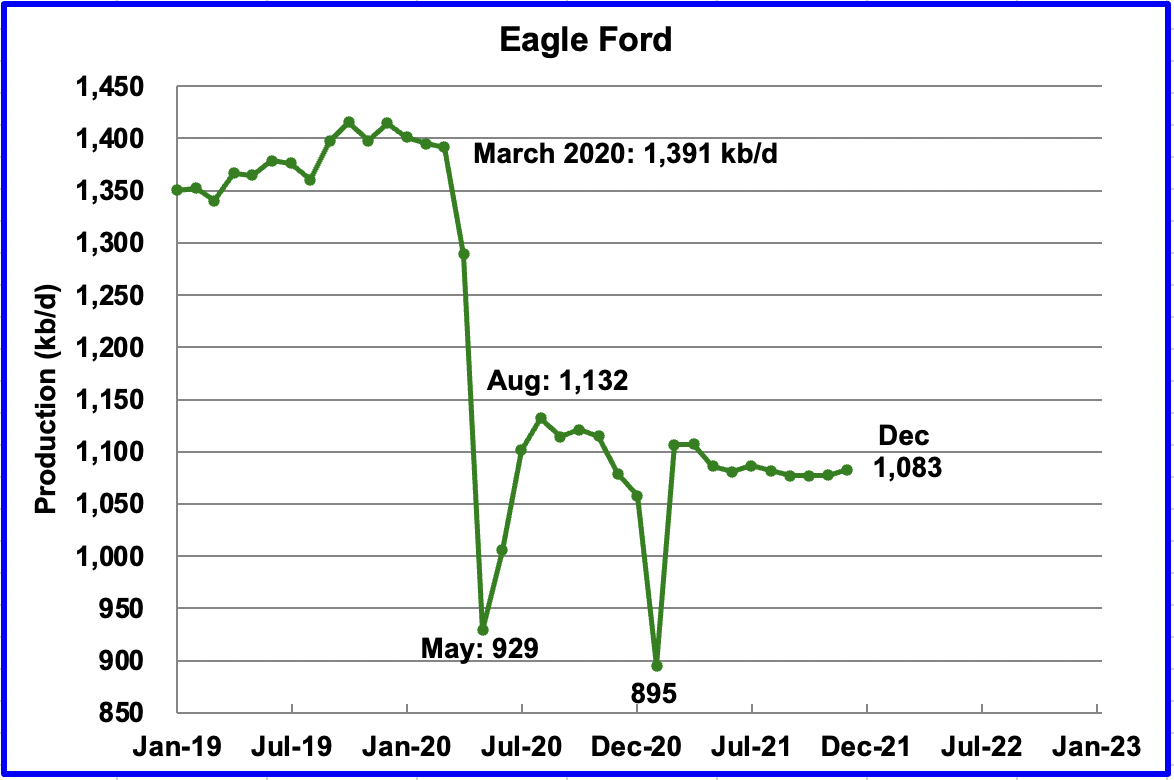
The dropping trend in the Eagle Ford basin for 7 months has turned into an increasing trend. For December output is expected to increase by 5 kb/d to 1,083 kb/d.
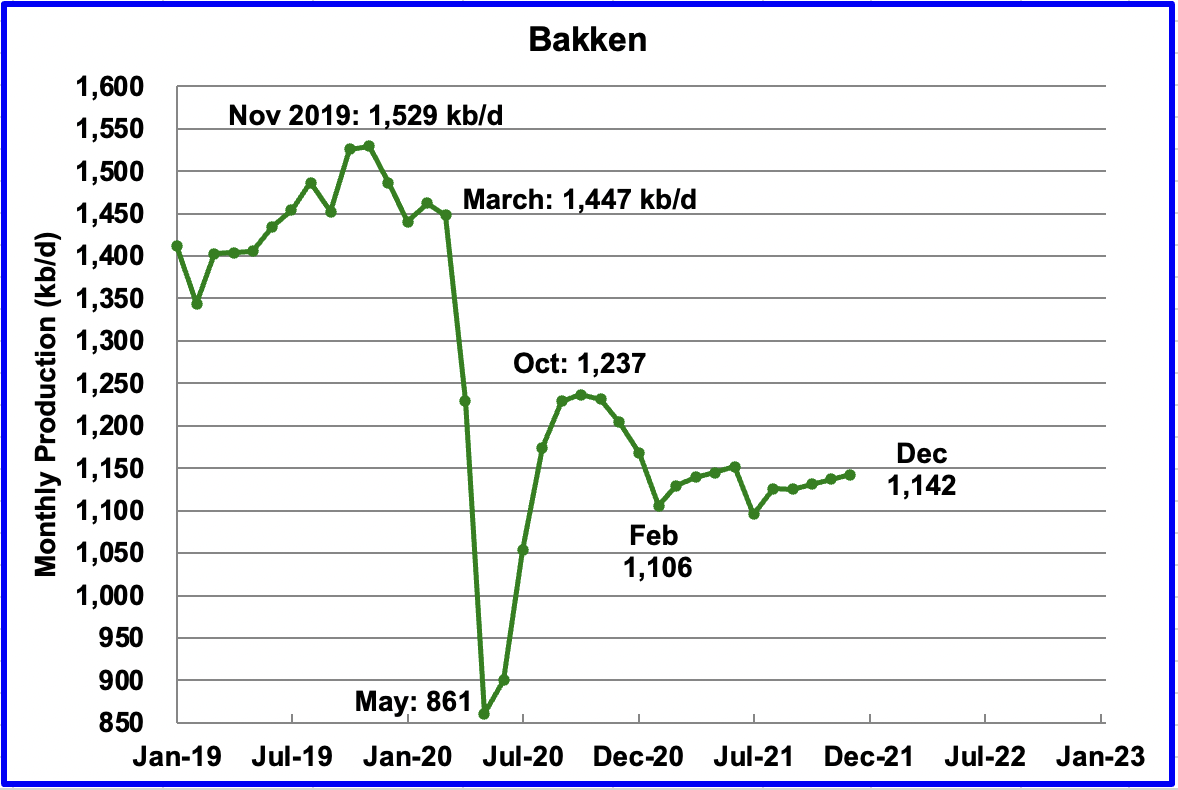
The DPR forecasts Bakken output in December to be 1,142 kb/d an increase of 5 kb/d from November. Note that the expected December output is 95 kb/d lower than October 2020.
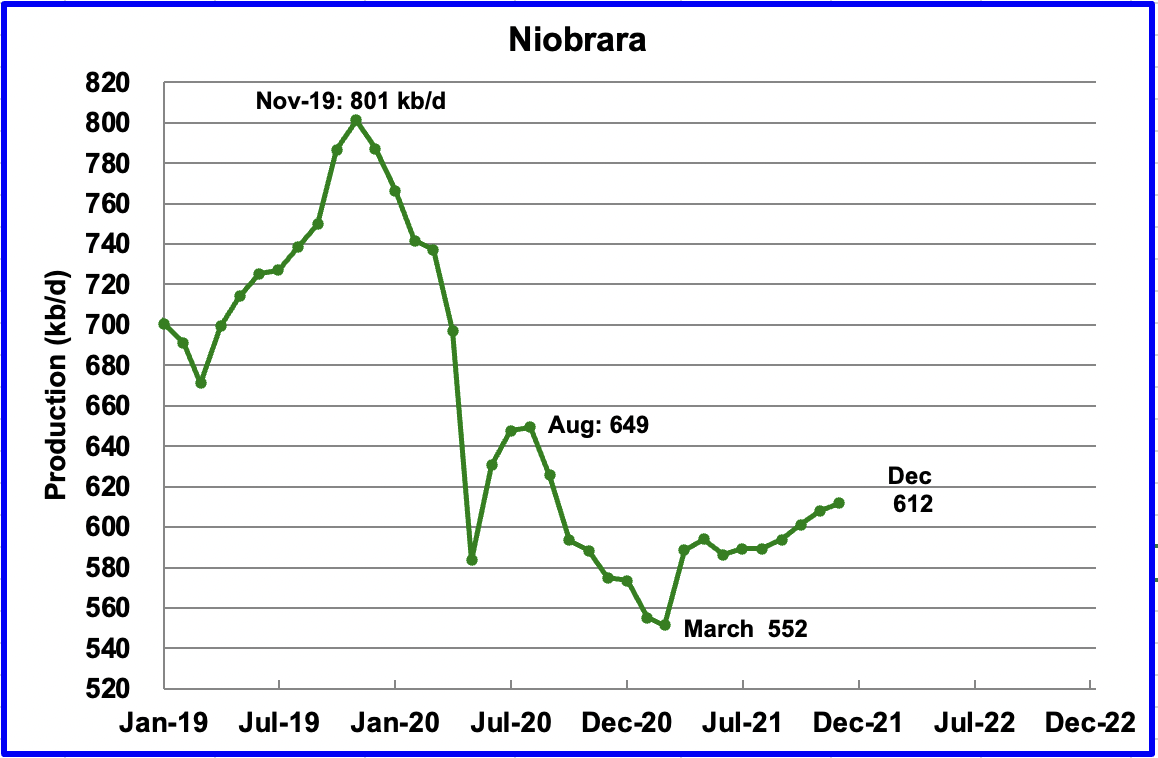
Output in the Niobrara reached a new low in March 2021 of 552 kb/d. Since then, output has been rising. December is expected to add 4 kb/d to 612 kb/d
The Niobrara is spread over Wyoming and Colorado. In June, 7 oil rigs were operating in the Niobrara. From August through November, the rig count had increased to 12. Ten rigs were in Colorado and two in Wisconsin.
– DUCs
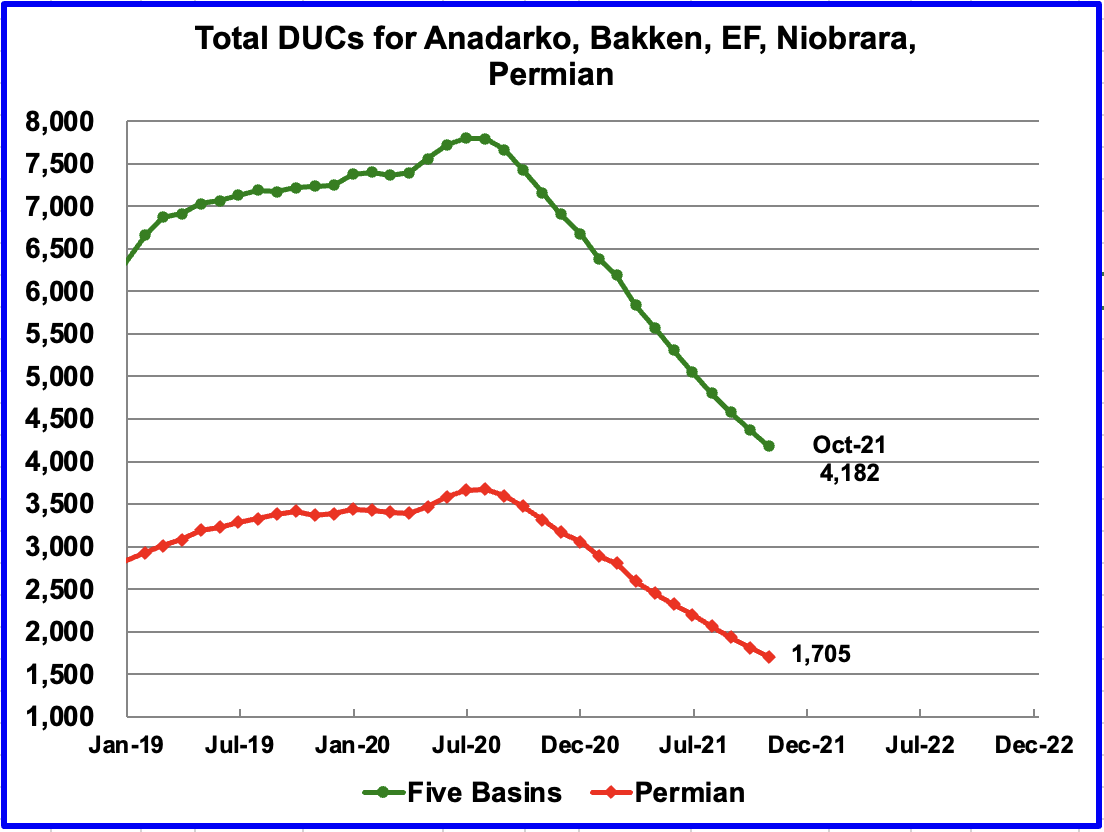
In these five primarily oil basins, the completion of DUCs has started to slow. For example, in March 354 wells were completed. By August completed DUCs had dropped to 225 and in October they dropped to below 200 to 191.
In the Permian, 107 DUCs were completed in October, down from 130 in July and August. If Permian DUCs were to be completed at the latest rate of 107/mth, that translates into a 16 month supply, assuming the remaining 1,705 are all commercially viable DUCs.
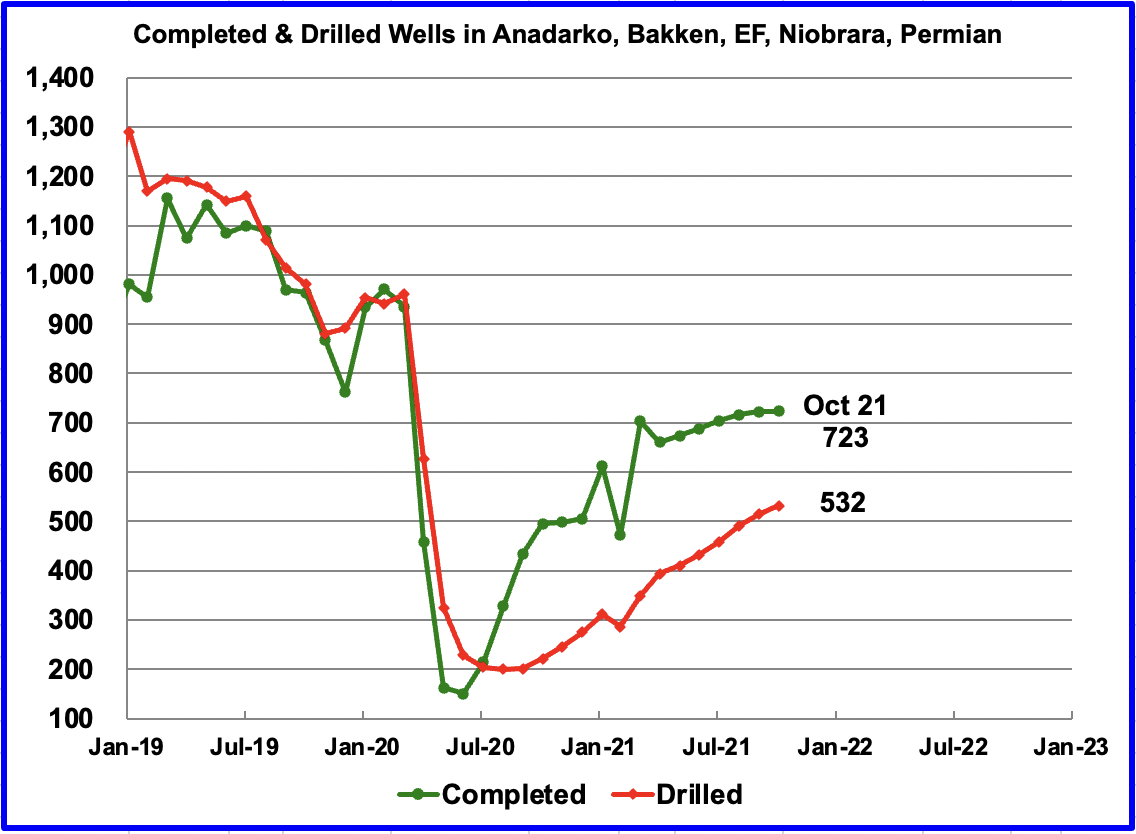
While the completion of DUCs has slowed, it needs to be noted that the overall completion of Wells has also slowed in these five oil basins. To compensate, drilling has increased. Completions increased by 1 in October while drilled wells increased by 17. If the completion of wells is starting to plateau, is this an early sign that LTO production will plateau next?
Is the slowing of well completions due to lack of frac spreads, rising completion costs, independent drillers reaching their limit, the oil majors limiting their oil development spending or lack/shortage of skilled labor?
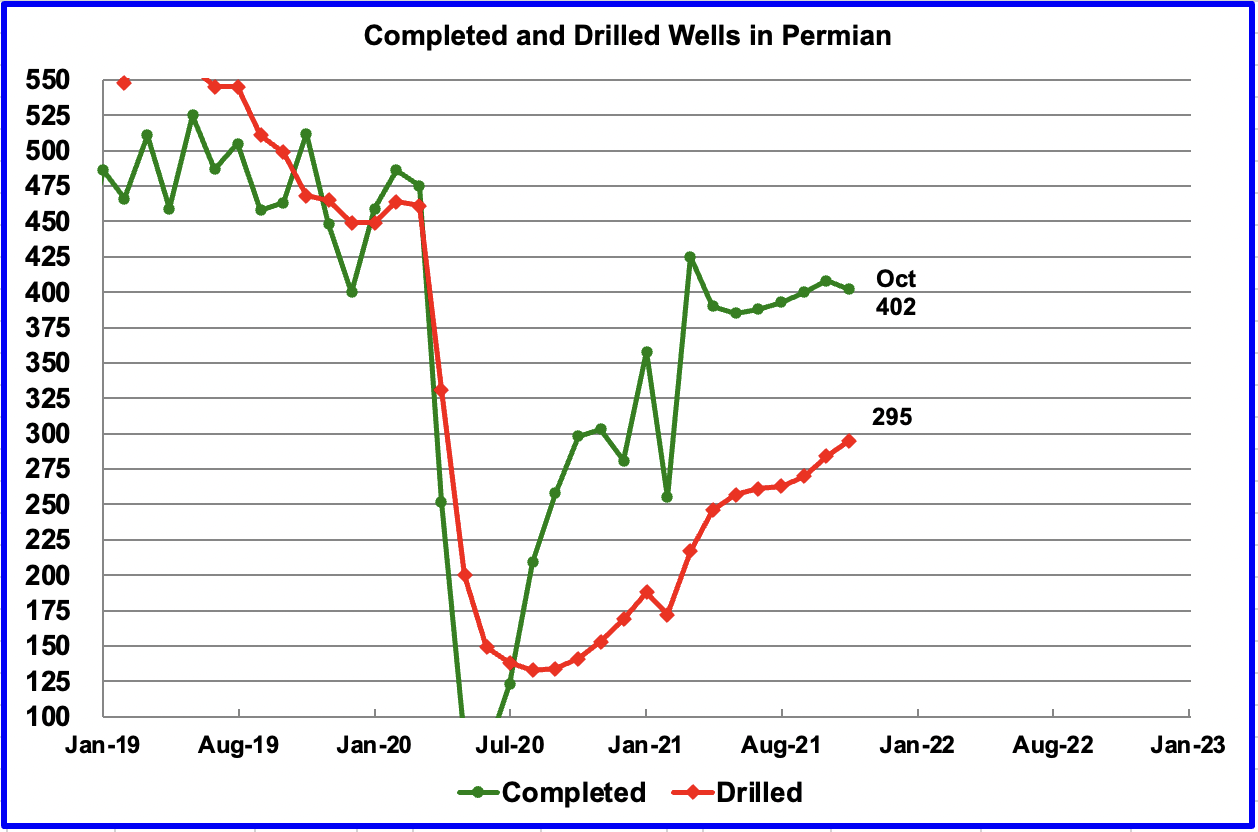
In the Permian, a similar slowing trend in completions is developing. From June to September, the average completion rate of DUCs was 129/mth. In October, 124 DUCs were completed. To offset the reduction in DUCS, drilling is increasing.
As can be seen in this chart, in the August to October period, the number of drilled wells increased at a higher rate than in the May/July period. Is this higher drilling rate related to the increasing price for WTI?
Also the DPR expects the number of completed wells to drop by 6 in October to 402. This is surprising. What is the significance of increased drilling and decreased completions in the Permian?
It is the monthly completion of DUCs that accounts for the increase in production in the Permian and the other oil basins.
3) LIGHT TIGHT OIL (LTO) REPORT
The LTO database provides information on LTO production from seven tight oil basins and a few smaller ones. The November report projects the tight oil production to October 2021.
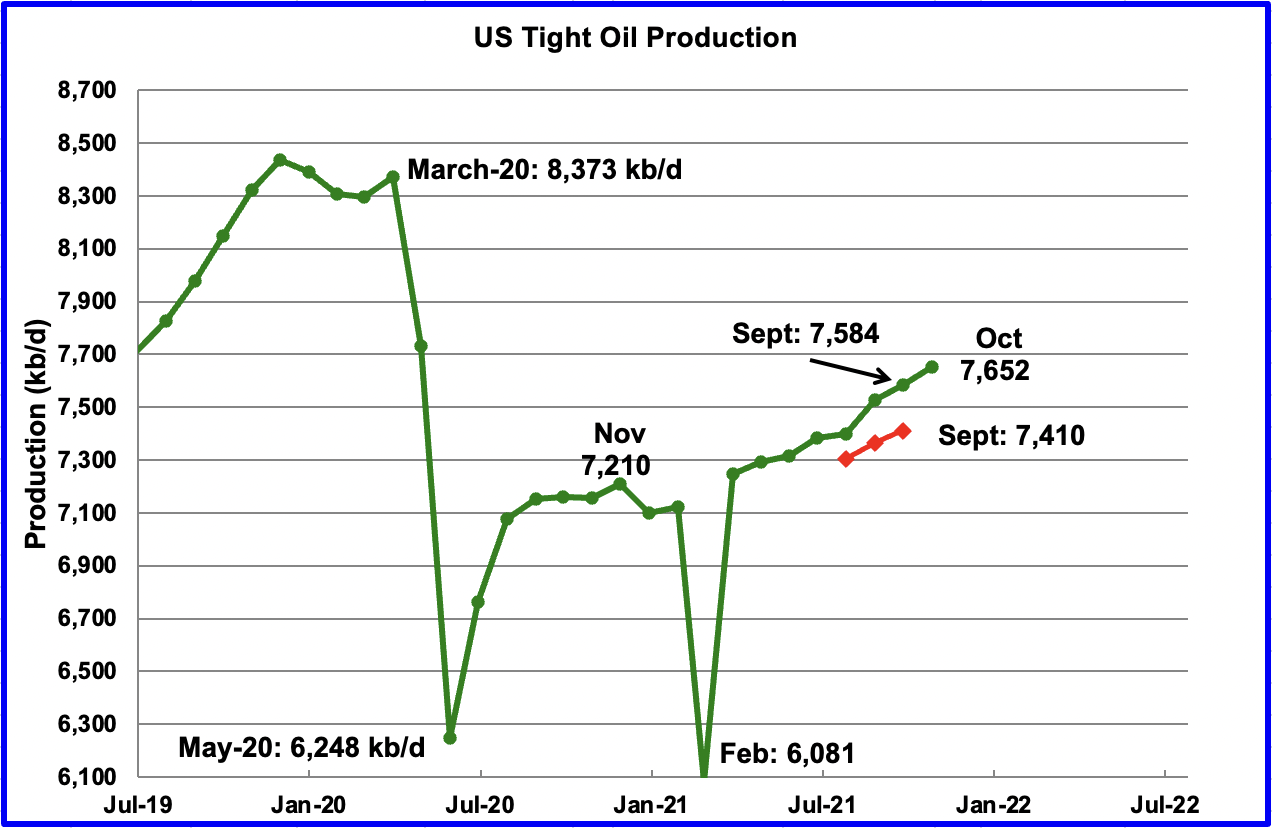
The November LTO report reversed the downward revisions of the October report by making bigger revisions to the upside. For instance, July was revised up by 95 kb/d and September was revised up by 174 kb/d. The three point red graph shows the previous October LTO forecast.
October’s LTO output is expected to increase by 68 kb/d to 7,652 kb/d.
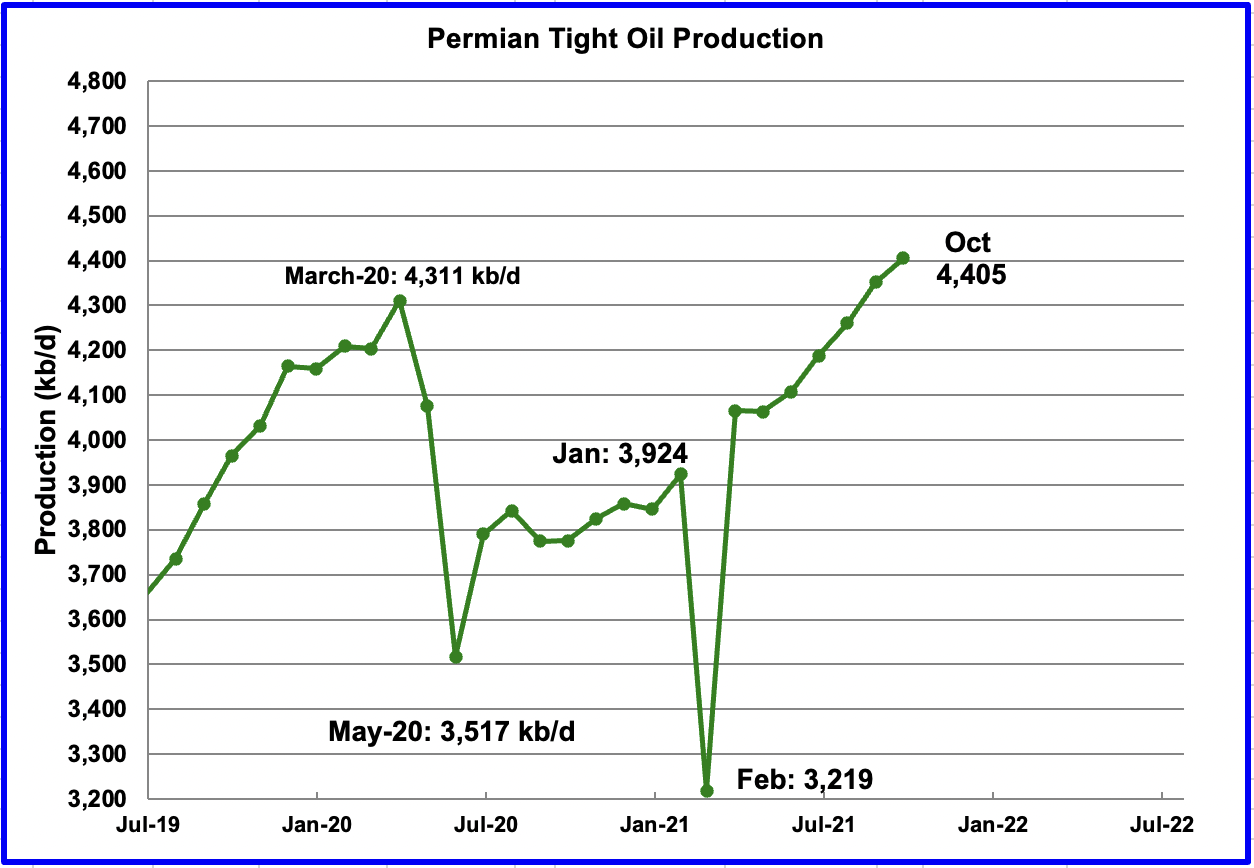
Permian LTO output reached a new high in October of 4,405 kb/d, an increase of 53 kb/d. From May to September Permian output grew at an average rate of 74 kb/d. October’s increase of 53 kb/d may be a precursor for a slowing trend.
As noted above, the completion of Permian DUCs are a major contributor to rising LTO production.
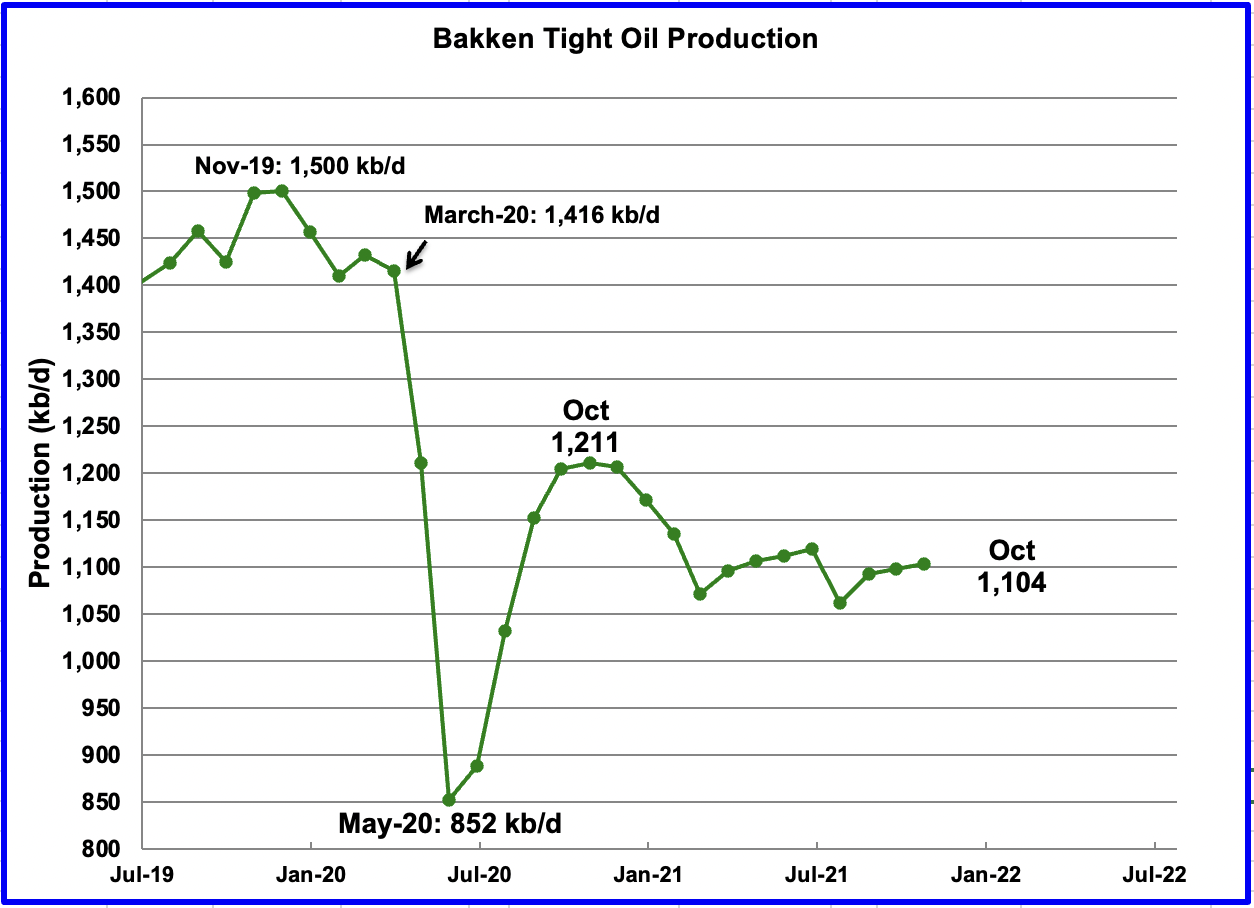
The Bakken’s October output increased by 6 kb/d to 1,104 kb/d.

The Eagle Ford basin is expected to produce 954 kb/d in October, unchanged from September. However, the November LTO report decreased the expected September output from the last report by 24 kb/d to 954 kb/d.
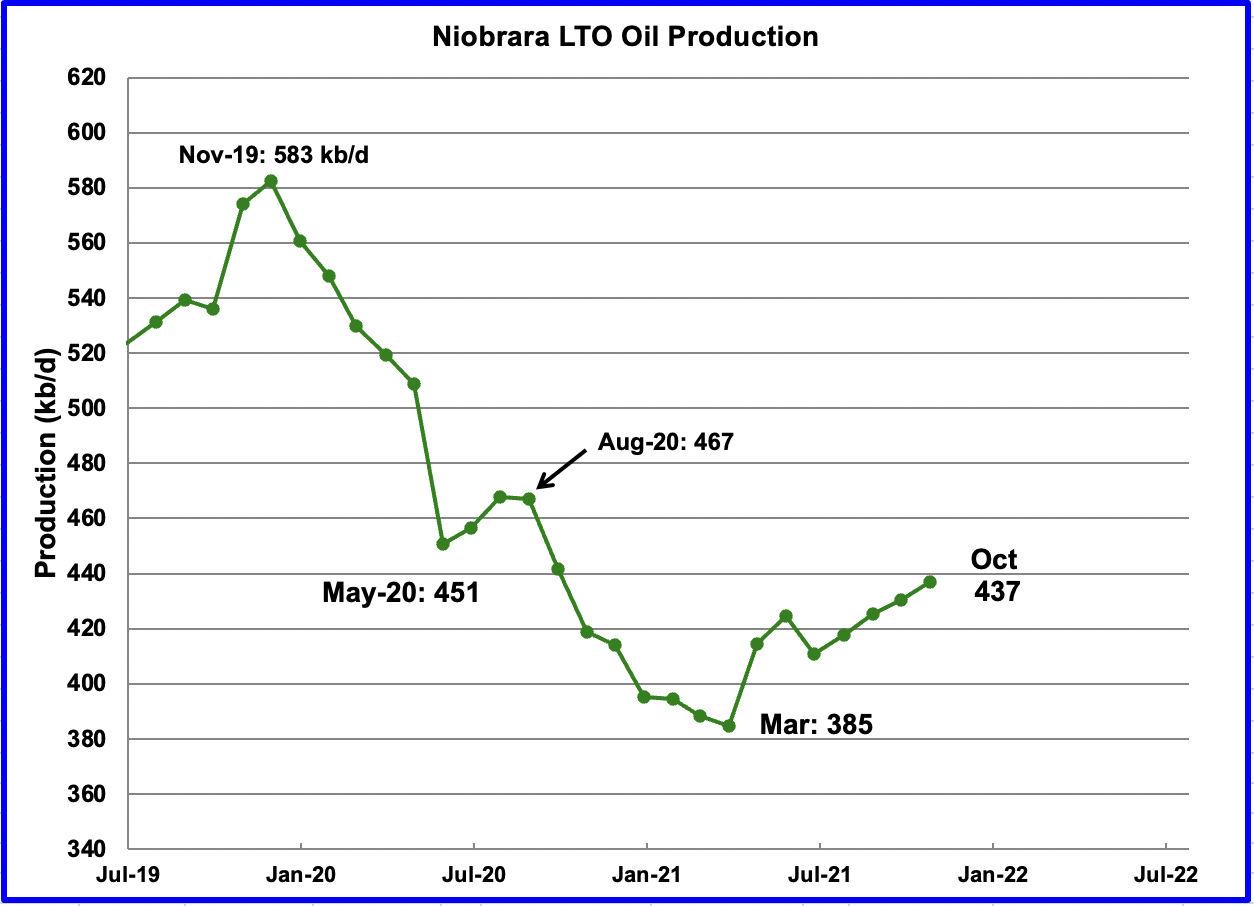
Output in the Niobrara in the latest LTO report in showing steadily increasing production since July. October output is expected to be 437 kb/d, an increase of 7 kb/d.
The rising output can be attributed to the increase in rigs from 7 in June to 12 in November.
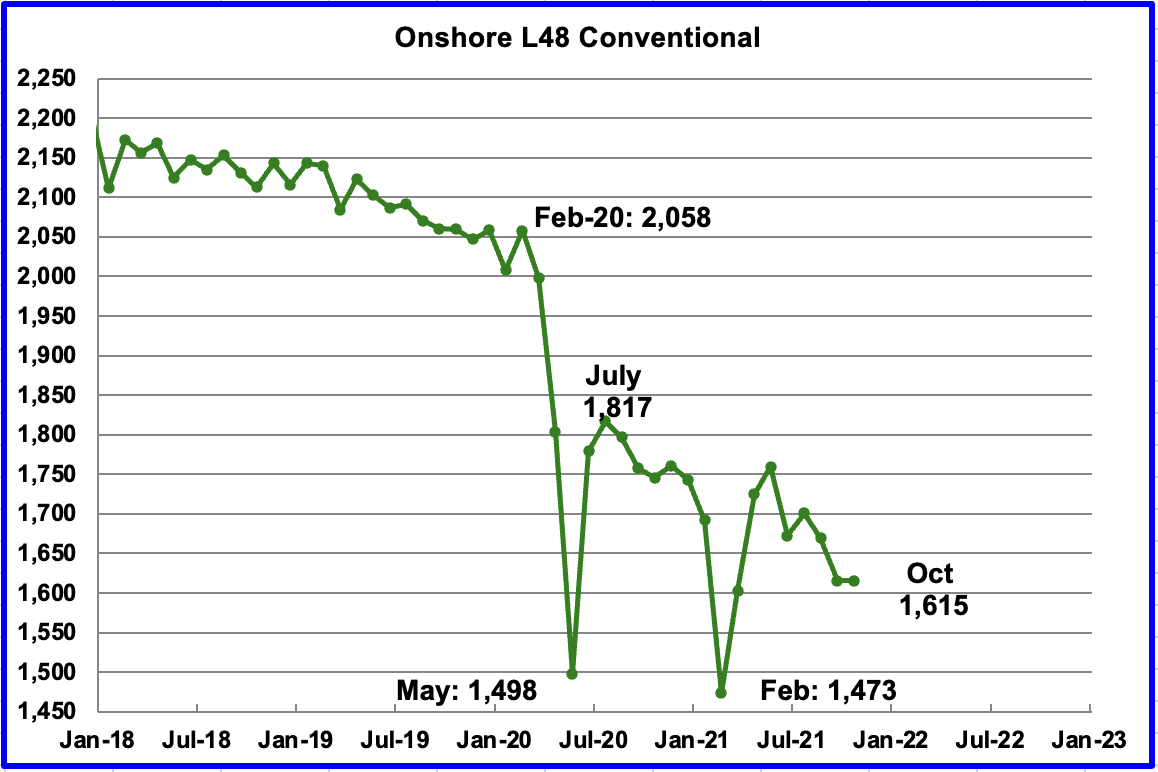
Conventional oil output in the On-shore L48 is essentially unchanged for October at 1,615 kb/d. This estimate is based on a combination of the expected October LTO output and the November STEO report that has a forecast for the US On-shore L48 output for October 2021.
In the November LTO report, LTO output was revised up as noted above. This upward revised output has resulted in a decrease in conventional oil output in the onshore L48. The September conventional output of 1,748 kb/d in the October report has been revised down by 132 kb/d to 1,616 kb/d in the November LTO report.
The other characteristic that has changed in the November report is that the L48 conventional output now shows a steady decline of close to 36 kb/d/mth from May to September. This is the first month in which an extended steady decline has appeared.
However, a note of caution is in order. Since conventional output is the difference between two large numbers, both subject to monthly revisions, conventional output can show big changes from month to month.
4) Rigs and Fracs
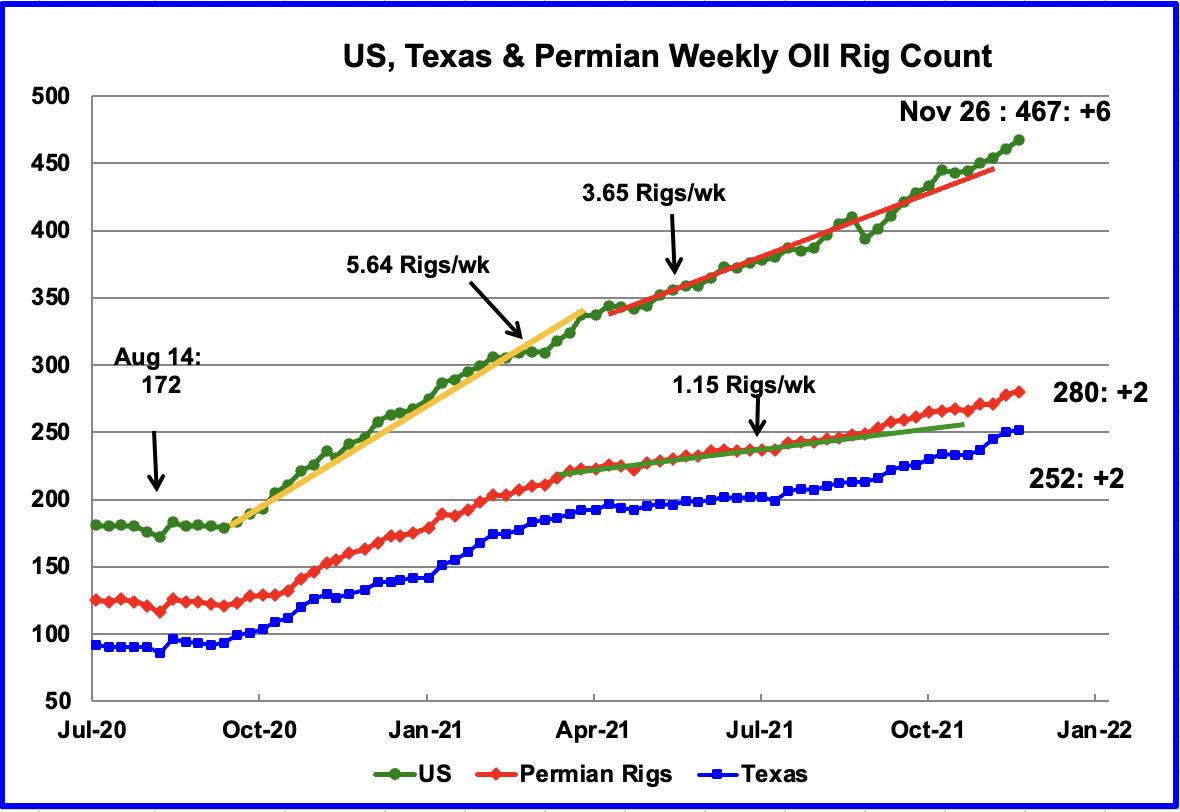
Since the beginning of April, the US has been adding oil rigs at a rate of close to 3.65 rigs/wk. Of these, the Permian has been adding 1.15 rigs/wk over the period April to early September. This means that more rigs are being added in other basins and states.
Since the end of August, it appears that the addition of rigs in the Permian basin and Texas has accelerated over the average rate as the red graph appears to be breaking away to the upside from the green trend line. Could this be related to the increasing price of WTI?
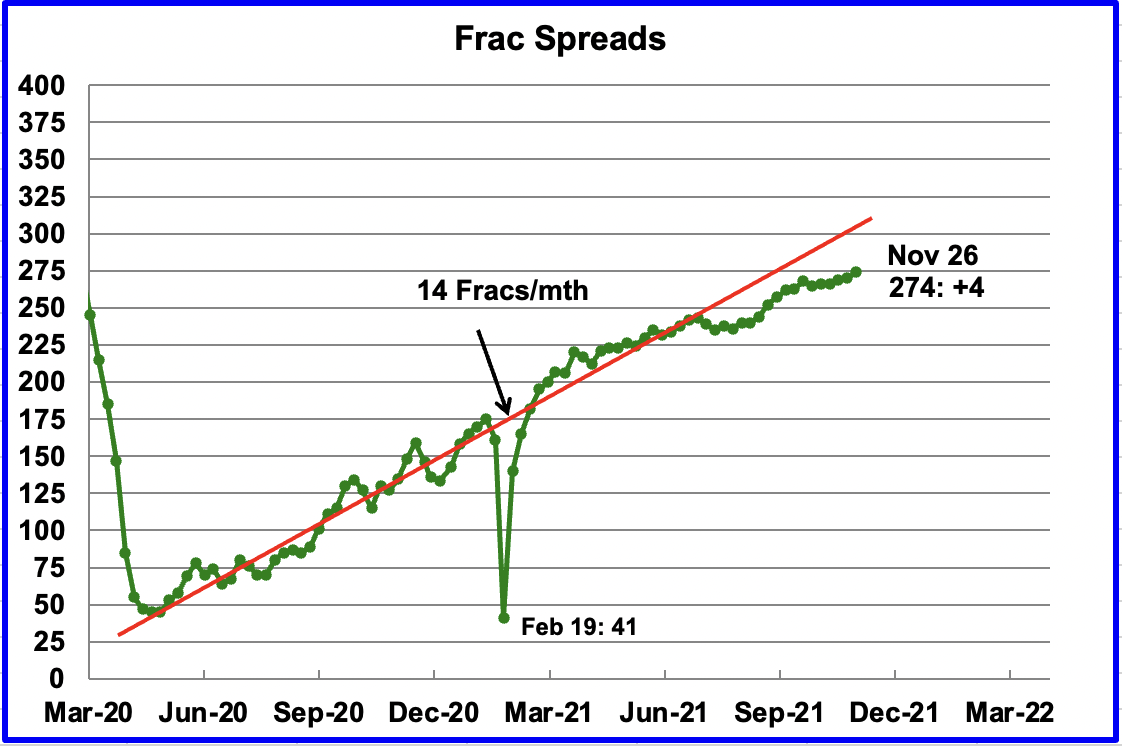
Starting from the week of July 23, 2021, frac spreads were not being added at the previous rate of approximately 14 spreads per month. Was the slowing due to Covid, not sure? However, starting in mid September, there are indication that frac spreads are being added at close to the previous rate of 14/mth. For the week of November 26, 4 frac spreads were added.
Note that these 274 frac spreads include both gas and oil spreads, whereas the rigs information is strictly for oil rigs.
Non-OPEC Production W/O US
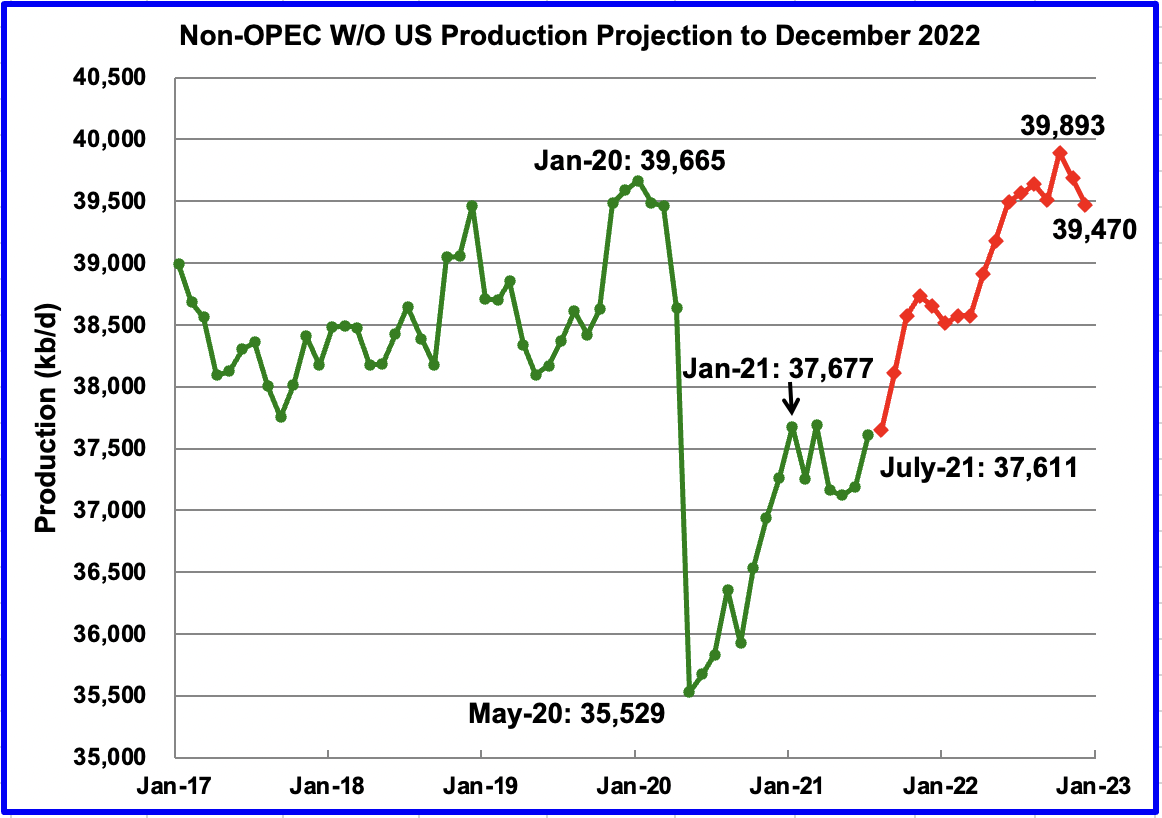
Non-OPEC oil production W/O the US increased by 420 kb/d to 37,611 kb/d in July according to the EIA.
This chart also projects the production out to December 2022. It uses the November STEO report along with the International Energy Statistics to make the projection, red markers. It projects that Non-OPEC oil production W/O the US in December 2022 will be close to 39,470 kb/d.
The current December 2022 forecast is 195 kb/d lower than the January 2020 peak of 39,665 kb/d and 423 kb/d lower than the October 2022 peak of 39,893 kb/d.
237 responses to “Hurricane Ida Collapses US September Oil Production”
Oil Prices Projected To Hit $125 In 2022
Crude oil could soar to $125 per barrel next year and $150 in 2023 due to OPEC’s limited capacity to boost production, JP Morgan analysts said in a new report.
“OPEC+ is not immune to the impacts of underinvestment…. We estimate ‘true’ OPEC spare capacity in 2022 will be about 2 million barrels per day (43%) below consensus estimates of 4.8 million,” the team, led by Christyan Malek, wrote, as quoted by TheStreet.
Thanks Ovi , hell of a lot off work . What brand of whiskey do you drink ? 🙂
HIH
I like Crown Royal for a break. I do a bit very day to to stay busy in these trying times.
I drink Canadian blended whiskey, any kind of Canadian blended whiskey, they all taste the same. I found the cheapest stuff in the store is every bit as smooth as Crown Royal. And I am not joking. Notice no smiley face.
Friends , drinking Laphroig single malt Scotch . Highly peated and highly smoked in sherry casks . I have no problem in sending you friends a crate but I am afraid the custom guys will down it all before it gets to your abode .:-) See if you can get it at your local store . If not , let me know . All dispatch risk is to my account . ” Work is the ruin of the drinking glasses ” . Peak oil is now in the rear view mirror ( except for Dennis ) , let us enjoy the post peak period until it lasts . Cheers , Prost , Egysegdre and whatsoever .
P.S : My offer also includes Dennis in appreciation of all his work .
Yep, thanks to Dennis flow rates are staying high. We’re now entering year 4 after current peak (ACP) and the only thing for sure ist, that we will enter year 5 ACP within 365 days. Nothing beyond that date I can see with much certainty. But rum also helps a lot in these dry times to steer clear.
Westtexasfanclub,
Peak was Nov 2018 for centered 12 month average of World C plus C production, my expectation is that the Nov 2018 peak will be exceeded in 2023 or 2024, so it will be 5 to 6 years before the peak is surpassed (on the basis of centered 12 month average World output of C plus C).
Just as Powell will use the new variant as an excuse to not raise interest rates and continue QE , so will OPEC+ use this as an excuse to not raise production and disguise their decline rates .
The oil price now is too low for Saudi-Arabia. (Brent 71.42 $) They require at least 82.44 $.
https://fred.stlouisfed.org/series/SAUPZPIOILBEGUSD
They are forced to cut production.
Ovi, great report.
Powell is on a suicidal path lately. They are set to discuss a increase in the pace of taper at December meeting.
It’s all going to blow up in their face over next 6 months. Expect volatility in markets over next 6 months. Wild price swings.
HHH, I feel the same . If he increases interest rates this will cause asset prices to fall ( equities and stuff ) leading to margin calls in an overleveraged market = crash . Do the taper = crash because of the lack of daily dose of heroin required by the markets . I hate to be in his shoes .
I think there is a really good chance that certain markets and prices fall far enough to make the FED reverse course. Those levels and prices haven’t been reached yet though.
Maybe lower $50 oil and a few more thousand points off the stock market will make them reverse course.
Permian production to the moon! Is this for real?
Greenbub,
Permian may peak around 2029 at 6000 to 6600 kb/d, see comments down thread. Other tight oil basins will start declining by 2026 and US tight oil output may peak around 2028 at roughly 9600 kb/d.
Greenhub
it is all about DUCs at the current time. About 6 month from now we may begin to see the effects of slowing DUC completions.
Ovi,
It is pretty clear to me that if rigs continue to increase the DUC count will stabilize. Note that every completion of a tight oil well is a DUC completion. What matters is the change inthe DUC inventory, completions decrease this inventory and spuds increase the inventory, more rigs means more spuds.
Six months from now the DUC count will be changing slowly, if we assume completion rate remains at 400 new wells per month in the Permian basin and rig count continues to increase at the average rate of the past 11 months (about 1.67 rigs per week on average).
If instead the tight oil well completion rate in the Permian basin increases by 5 wells per month, the DUC count will stabilize in 12 months, if rig count continues to increase by 1.67 rigs per week and wells are drilled at a rate of 1.3 wells per rig each month on average.
A continued drop in oil prices is likely to change things, but my guess is that oil prices will bounce back as the omicron variant scare subsides.
”What is the significance of increased drilling and decreased completions in the Permian?” Thanks for the post, Ovi. About your question, let me guess. What kind of drilling are they doing? Are they drilling true new wells or are they drilling secondary wells around the newly completed DUC to extract oil to the last drop from them? I can’t answer the question as I am not an oilman in the field.
Just saw a crew of about 10 being moved from New Mexico up to North Dakota, so some resources going that direction as well.
Excellent work Ovi. US conventional production at <2mb/day. That is an 80% decline from peak. In the shale patch, the number of DUCs continues to plummet. The US shale basins are clearly showing signs of depletion. Non-OPEC oil production is going to take a hammering in the next few years. Not good for anyone with a mortgage to pay. Like me 🙁
TonyH
Non-OPEC without the US appears to be heading for a plateau possibly in 2023. The rest of the US output except the Permian may continue to be flat going forward. That leaves the Permian and a few OPEC countries to make up for increasing demand and decline replacement.
Oil Production Oct. -Nov;
How reliable is that data? That is a pretty crushing decline in Algeria, one would expect to see something about it in the media.
Yes, Algeria is down and her quota is down from 1057 to 972. The new information is breaking of Russian oil by regions.
Here is the January 2022 Opec and Opec plus “Required Production” aka Quotas
Algeria might make 972 Kb/d by January. They were only 28 Kb/d short of that in October. But as for OPEC 10, they were 1,492 Kb/d short of their goal of 24,554 January target in October. That means they need to increase production by half a million barrels per day each month before December. That just ain’t gonna happen. They will not get even close. They produced 23,061 Kb/d in October.
so where does that leave the All Liquid supply/demand balance chart above? Certainly seems to be trending to surplus.
Twocats,
Demand estimates may be too low and OPEC plus may produce less than many anticipate. Potentially there could be a surplus in first half of 2022, by 3rd Quarter 2022 there will be a serious shortage at $80/b.
Great job Ovi.
Thanks.
You asked about what happens to tight oil output if completion rate remains constant, if we also assume rig efficiency and new well productivity (aka average well EUR) remain constant, then based on the analysis of Enno Peters we get the scenario below.
https://public.tableau.com/shared/K7Z3JQGT6?:display_count=y&:origin=viz_share_link&:embed=y
Chart below is fuzzy, better image at link. Completions=734, rigs=506 from Jan 2022 to Dec 2025, tight oil output reaches previous peak of 8.7 Mb/d by Dec 2024 for this scenario. Note that October 2021 completions are estimated to be 948, with rig count at 475, the scenario expects completion rate to decrease in November to 836 with 506 rigs operating.
Tight oil output reaches 8.96 Mb/d in Dec 2025 for this scenario.
Dennis
Thanks. Output increases at a much slower rate than currently indicated.
What is the scenario for the Permian, if completions stay in current range.
Permian scenario from shaleprofile at link below (sharp image). Completion rate assumed to be 342 per month with rig count at 267 from Jan 2022 to Dec 2025, output reaches 5404 kb/d in Dec 2025, peak was March 2020 at 4454 kb/d based on shaleprofile estimate, the previous peak is surpassed in May 2022 in the scenario below with output at 4463 kb/d.
https://public.tableau.com/shared/SGYH9W45N?:display_count=n&:origin=viz_share_link&:embed=y
The shale profile projection can be extended to Dec 2029, Permian output reaches about 6000 kb/d at that point.
My scenario assumes well completions continue at about 400 per month (DPR estimate for Oct 2021) until mid 2023 and then completions increase to 525 per month by mid 2025 and remain at that level until Dec 2028 and then decrease. See right axis of chart below for well completion rate. I also assume that new well productivity decreases over time. Cumulative output from Jan 2000 to Dec 2052 is about 42 Gb for my scenario, peak output is 6600 kb/d in late 2029 and early 2030.
This scenario is based on an expectation that oil prices are likely to average $95/bo or more from 2023 to 2028, though the actual scenario uses an oil price assumption of $75/bo maximum for Brent oil price in 2020 US$/bo. All debt held by tight oil producers in the Permian basin is paid off by the end of 2025 for this scenario. All wells completed in the scenario can be financed from operating cash flow, annual interest rate is assumed to be 7.5%, natural gas is assumed to sell at $3.50 pe MCF at wellhead and NGL is sold at 35% of the price of crude.
From Jan 2010 to June 2036 about 111 thousand horizontal tight oil wells are completed for this scenario, with no wells completed after June 2036. From January 2010 to September 2021 about 33 thousand horizontal tight oil wells were completed in the Permian Basin.
Correction to comment above, I said “all wells are financed by operating cash flow”, but should have said “after Sept 2021, all wells in the scenario are able to be financed by operating cash flow. The scenario is set up as if the entire Permian basin tight oil production operation was run by one big company from Jan 2010 to Dec 2052, obviously this is not the case, but it makes the model less difficult.
Dennis
The one thing I like about your scenarios is that US annual growth falls in the range 300 kb/d/yr to 500 kb/d/yr. This means that if world demand going forward gets above that level, OPEC plus will be on the hook to make up the difference and we will see how high SA can really go.
Ovi,
I expect we will also see increased output from Norway up to 2025, and from Canada, Brazil and Guyana, along with output from OPEC plus.
George Kaplan has a forecast for Brazil
https://peakoilbarrel.com/brazil-summary/#more-30556
Canada reference scenario at link below
https://apps2.cer-rec.gc.ca/energy-future/?page=scenarios&mainSelection=oilProduction&yearId=2020§or=&unit=kilobarrels&view=&baseYear=&compareYear=&noCompare=&scenarios=Reference&provinces=ALL&provinceOrder=YT,SK,QC,PE,ON,NU,NT,NS,NL,NB,MB,BC,AB&sources=&sourceOrder=
Norway forecast from NPD at link below
https://www.norskpetroleum.no/en/production-and-exports/production-forecasts/
For Brazil in 2025 output is at about 3100 kb/d rising to 3400 kb/d in 2028.
For Canada 2025 output at 5580 kb/d, rising to 6000 kb/d in 2028.
For Norway 2025 output is about 2080 kb/d, my modelling suggests a small decline of 106 kb/d by 2028 or about 35 kb/d each year from 2025 to 2028.
In 2019 the output of Brazil, Canada, and Norway combined was 8833 kb/d, in 2028 the forecasts suggest combined output of 11374 kb/d, about 2540 kb/d higher than 2019.
Note also the World annual peak in C plus C output was in 2018 and these 3 nations had output of 8633 kb/d that year. Output in 2028 will be about 2927 kb/d higher than 2018 according to the forecasts.
I forgot the US which will be 1997 kb/d above the 2018 average output level in 2028, adding this to the Brazil, Canada, Norway estimate brings the total to a 4924 kb/d increase in C plus C output in 2028 above the 2018 level of output in these 4 nations.
This gets us pretty close to the 87 Mb/d output I expect, if OPEC plus can offset any decline in the rest of the World besides OPEC plus and Brazil, Canada, Norway, and the US over the 2018 to 2028 period.
Dennis , ” If wishes were horses , beggars would ride ” . QED .
P. S ; Apologies to George Kaplan because I have a lot of respect for him .
Hole in head,
I use the analysis of George Kaplan(Brazil), South LA Geo(GOM), Enno Peters (tight oil), NPD (norway to 2025) and my own tight oil analysis and analysis for Norway from 2026 to 2060. The shock model for Norway is shown below, URR is 43 Gb for my scenario, the NPD says the TRR is about 53 Gb (best guess estimate).
On oil price-
“In a world that really reopens — which is a big ‘if’… Oil prices could move “a lot higher” from current levels given the world’s deep reliance on fossil fuels and may hit $150, says Christopher Wood from Jefferies.”
All depends on how Omicron variant (or others) pans out.
Excellent job Ovi.
Hickory
I think the big question going forward is going to be “Will covid become as common as the seasonal flu”. Will the new normal be a combination Covid and Flu world? We have adapted to yearly flu shots. Will this anti covid Vax movement subside to a more normal level going forward?
Agreed.
Eventually those who have not been vaccinated will get some immunity- often the hard way.
May take a very long time and do a lot of prolonged damage to the world economy.
The antviral drug that Pfizer has in development bears watching.
Hicks , you are behind the curve . 2020 , 2021 were a washout . The start of 2022 is a disaster with the new variant . What is a ” very long time ” for a patient in the ICU or suffering from terminal cancer ??
The economy is dead ( I posted in the last thread $ 31 trillion printed by CB’s to keep it in coma ) we must now await the death certificate .
Hole in head,
World Real GDP growth will be about 5% in 2021, CB printing has little affect on real GDP unless they are trying to slow things down with very tight monetary policy (US Fed in 1980s), increased real economic activity is spurred by actual spending by consumers, businesses, and governments. The expectation for 2022 is about 4% growth and then the World will continue to grow at 2.5% to 3% through about 2026.
As World population growth continues to slow, growth in real GDP will also slow down, in addition as the World becomes wealthier, growth rates will also slow down. So we would expect real World GDP growth to slow down to 1% per year or less as population peaks and as non-OECD income levels start to appoach OECD income levels. From 2010 to 2019 World real GDP per capita grew at about 1.8% per year, US real GDP per capita grew at 1.5% per year over the same period and EU real GDP per capta growth was 1.4%/year.
Dennis , ever hear of the term ” base effect ” . Feb 2020 was when Covid was announced
after the Chinese New Year . 2020 the world went into a lockdown , the system crashed and that is the base for year 2021 ESTIMATES are based which will be revised downwards . You believe the idiots at IMF , WB, OECD ?? These are the organisations along with UN, WHO, EU , ECB that rejected politicians and failed economists go to earn tax free fat salaries and pensions . Here is an example . I can give here links galore on the failure of IMF and WB forecasts .
https://www.imf.org/en/News/Articles/2019/10/01/sp093019-The-IMF-and-the-Greek-Crisis-Myths-and-Realities
Hole in Head,
World real GDP fell by 3.2% in 2020, then might rise by 5.9% in 2021 and by 4.9% in 2022 and be back on the 3% growth trend from 2010 to 2019. Growth might also be more or less than this. Forecasts of the future are always wrong, infinite possible forecasts, only one actual forecast is correct. Probability that any future forecast is correct is exactly zero.
This is pretty basic statistics.
Note that actual US real GDP growth over the past 4 quarters has been about 4.8%, and if the GDPNow forecast is correct, 2021 US real GDP growth will be 6.1%. US real GDP fell by about 2.3% in 2020 from the 2019 level.
Data at the World level is harder to get on a quarterly basis.
For EU real GDP fell by 4.2% in 2020Q4 from 2019Q4 and from 2020Q3 to 2021Q3 EU real GDP has grown by 3.8%.
Hi Dennis,
I am curious why you think that central bank printing has little effect on GDP. As I understand it, printing by central banks works to elevate demand, which will lead to increased production and thus increased GDP. An increase in debt would appear to have the same effect. I thought this was the exact reason why Central banks print during recessions… To stimulate demand and thus help the economy recover. Am I incorrect?
Niko,
When nominal interest rates approach zero monetary policy becomes ineffective. We have been pretty close to that point for many years. Increased money supply often leads to a decrease in the velocity of money and little affect on economic output at low interest rate levels.
In this situation the extra money in circulation just sits in bank accounts and monetary policy is ineffective.
Search on zero lower bound for more information.
https://www.federalreserve.gov/econres/feds/how-effective-is-monetary-policy-at-the-zero-lower-bound-identification-through-industry-heterogeneity.htm
Hole in head,
See
https://www.atlantafed.org/cqer/research/gdpnow
Excerpt:
The GDPNow model estimate for real GDP growth (seasonally adjusted annual rate) in the fourth quarter of 2021 is 9.7 percent on December 1, up from 8.6 percent on November 24. After this morning’s Manufacturing ISM Report On Business from the Institute for Supply Management and the construction spending report from the US Census Bureau, the nowcasts of fourth-quarter real personal consumption expenditures growth and fourth-quarter real gross private domestic investment growth increased from 7.9 percent and 12.5 percent, respectively, to 9.6 percent and 13.1 percent, respectively, while the nowcast of fourth-quarter real government spending growth decreased from 2.9 percent to 2.5 percent.
Also see
https://www.imf.org/en/Publications/WEO/Issues/2021/10/12/world-economic-outlook-october-2021
excerpt
The global economy is projected to grow 5.9 percent in 2021 and 4.9 percent in 2022, …
Note that these are real growth rates adjusted for inflation.
There goes the growth story .
https://www.zerohedge.com/markets/fix-imf-warns-it-will-downgrade-global-growth-due-omicron
For a more balanced perspective
https://www.reuters.com/business/omicron-variant-likely-usher-growth-downgrades-imfs-georgieva-2021-12-03/
Many people don’t take zero hedge seriously, it is like getting your reporting from facebook.
Dennis , so zero hedge is Facebook then is Goldman Tiktok ? Smell the coffee .
https://ktvz.com/news/2021/12/04/goldman-sachs-cuts-us-gdp-growth-forecast-for-2022-over-omicron-fears/#:~:text=The%20firm%20now%20sees%202022,3.3%25%20before%2C%20Briggs%20said.
I am no longer concerned by this C19 clade. I can only speak for myself. The danger seems to arise from a bradykinin storm, which is suppressed by adequate Vit. D.
I caught the disease early in 2020. Odd experience – cough and strange smell. Of course no info. published in those early days.
I made the decision to not accept any vaccine until more information became available.
That was 21 months ago. Since then I have carried on as normal. Going to work offshore, looking after my family.
Nothing I have read suggests to me that I need a vaccine. The virus mutates, or someone does it in a lab. Either way, I am now three doses behind and counting.
Many vaccines are effective and a great benefit to society. I have yet to be convinced that corona viruses, and this particular one, can be suppressed in this way.
Everyone will make their own decisions. I like to think that civilised societies can accept this.
Well, as long as whenever you’re closer than 10 feet to another person, you don’t breathe out…
Same experiance here, and I agree. No offshore work for me, but I´ve kept to the distance recomandations, working from home as much as possible etc.
I have yet to be convinced that corona viruses, and this particular one, can be suppressed in this way.
Julie, a woman I grew up with, believed this way, too, and refused to be vaccinated. You’ll notice the past tense.
She was on a vent for three weeks. She’s dead now.
Yeah, the death rate for vaccinated people seems to be roughly 15% of the death rate for non-vaccinated, and that’s not adjusted for the fact that vaccinated folks tend to be older and more vulnerable.
I’ve had pcr’s and lateral flows from time to time.
I’ve been amongst tens of thousands of people over the past year and a half. Many will have been carrying the virus. I am often surprised at who just manage to develop symptoms. People in remote places.
The point I am making is that I am not concerned by any risk, and that I would not put others at risk. Why take test?
I am 68 btw. Supposedly in a more vulnerable group.
Two related thoughts on people who aren’t afraid of Covid-19:
In his essay “The Black Power Killings in Trinidad”, V.S. Naipaul ponders the question of why comfortable middle class people would put themselves in so much danger. He speculates that people who have lived a sheltered life tend to be fearless, because they never experience the consequences of bad decisions. It seems safe to walk on the wild side in the third world if you know you have a plane ticket home in your back pocket.
Second: When you hit your thumb with a hammer, you shout something about severe threats like deadly disease, gods, or body secretions and other taboos like sex. This is true of all cultures. It’s what linguists called a “linguistic universal” — something all languages have in common.
But which thing do you shout? You can tell what people are really afraid of by having them hit their thumb with a hammer. For example, Americans (and other English speakers) used to say “god damn” and “hell” a lot, but now they say “fuck” instead. You even hear “for fuck’s sake” (or FFS), replacing “for god’s sake”. This shows the they no longer fear their traditional gods, but are uptight about sex, and is supported by observations about decreasing church attendance and the mult-billion dollar meltdown of American media after Nipplegate, and the anti-gay hate campaigns.
Going back a little earlier, people used to say “A pox on you”. With the help of mandatory quarantines and vaccines, the United Nations World Health Organisation wiped the pox out, so nobody is afraid of it anymore, and the phrase packs no punch. Instead, you hear “Fuck you”.
Combining these two thoughts, you can see how middle class people are failing so miserably to take the pandemic seriously. Having never faced a pandemic, it’s easy to imagine that things like Ebola only happen to poor people. The problem is that there is no plane ticket home in this case. The pandemic has come to you.
One off-topic remark about the the Trinidad story: V.S. Naipaul’s thoughts are insightful, but he might have missed a few key facts: The thriller “The Bank Job”, starring Jason Statham, and based on a true story, says that the victims of the killings were MI6, and Princess Anne’s pecadillos, not Black Power, were at the center of the affair. Anyway the movie and the essay make a great combination.
I would say Covid was a dud, there are around 8-9 billions of Homo Sapiens around, so clearly much, much too many for the planet. I guess ark B construction got delayed…
Btw., I´m scheduled for a covid shot next week, but only because a co-worker is freakin out over omikron.
Edit: I vote for Laproaigh, or Lagavulin, unfortunately my ones are empty… (still got beer)
Edit2: I´m quite sure I will much more likely die from a heart problem than covid, but that´s life, the backlog of smaller problems like cancer, including leukemia, stroke from various reasons etc. will rise quite a while while the covid-scared will walk around looking for the next shot.
In the US, covid in 2 years has killed about 800,000 people, more than AIDS has in 35+ years.
And this is just the start.
AIDS has killed more globally.
And in the US over 150,000 kids have lost a parent or grandparent to Covid so far
Laplander,
I´m quite sure I will much more likely die from a heart problem than covid…
That is quite right. And perfectly beside the point.
If you get Covid, to whom do you spread it? Will they live?
Also: very low death rates times very high infection rates equals a ghastly number of deaths.
Laplander —
You might think Covid is a dud, but then so is terrorism. Terrorism just doesn’t kill anyone by comparison. It doesn’t stop people from peeing their pants about it. The bizarre shoe removal ceremony at the airport shows how irrational people can get. It would be just as effective to sacrifice a goat to the peace god at full moon. But people can’t see that because they are locked into a specific cultural mindset.
Covid-19 have killed millions of people, and there is an easy (partial) solution: Vaccination and mask wearing. There is absolutely no rational basis for not doing it. In East Asia, nobody much have a problem with mask wearing. It’s a cultural thing.
There are other examples of course. For example, American drivers kill tens of thousands of pedestrians and cyclists every year. The primary reason is poorly designed streets and vehicles. This could easily be fixed, and would have a lot of side benefits, like improving property values in inner cities and the finances of those cities. But Americans just don’t seem to be able to get their brains around it.
It makes no sense to ask how many people are dying of Covid without comparing it to other threats to life and limb.
Furthermore, it’s important to remember one reason it is a “dud” is that measures have been taken to prevent it from being worse. Imagine surviving a car crash because you are wearing a seat belt and using that as an excuse to claim seat belts are useless and car crashes aren’t dangerous.
At what production level (i guess really it’s about the velocity of crude through the pipeline) will Alaska stop shipping in the winter?
Rgds
From 1988 to today, the speed of the oil through the Trans Alaska Pipeline has slowed by a factor or 4. In other worlds, it now takes 4 times longer for the oil to reach Valdez. The longer transit time means that the oil has more time to cool, and it’s bad news if the oil “freezes”. They’re taking about installing heaters in some pump stations to prevent this from happening.
Ironically the thawing permafrost is causing the ground under the pipeline to thaw and the supporting columns to sink into the ground. They have actually installed freezers in some location to prevent this from happening. There’s also talk of reducing the diameter of the pipe.
All around, major investments will be required to keep the oil flowing.
Frugal , you are correct all the way . I was not aware of this idea of reducing the diameter of the pipe . Well , let us put this in file 13 ( also called the waste paper basket ) when WTI is < $ 70 . Some ideas are just stupid , but then Gump said " Stupid is what stupid does " 🙂
Hole in Head. In 2019 as part of a vacation in Alaska I drove most of the length of this pipeline — it’s huge. What stuck me most was the large number of heavy tanker trucks driving along the pipeline route. But they’re not full of oil, they’re full of diesel, and the diesel is going north, the opposite direction of oil in the pipeline. Everything related to the Trans Alaska pipeline operation and oil extraction on the North Slope runs on diesel: pumping station, heaters, freezers, oil rigs, separators, heave equipment, electricity generation for equipment and workers, …..
The main community at the end of the Dalton Highway on the North Slope is called Deadhorse, and it was buzzing with activity. An enormous amount of money is spent every day to produce 400,000 barrels/day.
I was in Alaska in 1968, before the invasion of oil workers.
Very cool!
Socially, oil destroyed the Alaskan vibe.
Northern BC is much better.
But this is just my view– others may disagree.
The quantity of energy used to extract oil and gas represents currently 15% of the energy produced by the extracted oil and gas.
My understanding is that they have installed one or two more heaters along the pipeline to warm the crude. Changing the pipe diameter I think is out of the question.
Thanks for all the replies.
I just found this link – relatively recent:https://www.alyeska-pipe.com/wp-content/uploads/2021/04/PP-Flow-Assurance-4-21-B.pdf
It looks like the lack of heat issue also impacts water separation and wax separation. No mention of reducing the diameter though.
rgds
WP
WEEKENDPEAK: If you look at the picture where the pipeline is above ground, you’ll see a bunch of rectangular white plates sticking up above the pipeline. These are radiators used to dissipate the heat from the support columns so that the heat is dissipated into the air instead of the ground, thereby preventing the underlying permafrost from melting.
Ovi, thanks for the great work. It seems like the Permian is blowing through DUCs and production is steadily moving up. Nothing but sunny skies ahead. The other basins not so much. I am mostly interested in the Permian production per well which seems to be tailing down as I anticipated. It will be a key component to production growth in the Permian over the next 3-5 years before the locations are all gone. The recent pullback in oil prices does not bode well for the production growth model. LTO growth will stall at these prices.
From shaleprofile US report on Nov 4, 2021 linked below
https://shaleprofile.com/blog/us/us-update-through-july-2021/
Productivity of new wells in cumulative output per 1000 lateral feet over first 12 months for major tight oil basins in chart below from Enno Peters Nov 4 blog post. Note that a sharper image can be found at original post linked above.
Thanks Dennis
LTO Survivor,
Thanks for your comments they are very helpful. I agree at $65/bo tight oil will likely stall or decrease. My hope is this downturn in oil prices is temporary. Are your Permian wells in the Midland or Delaware? Can you reveal which county most of your operations are in?
I understand of course that you may not be at liberty to answer.
We sold the company. They are in the Delaware. I won’t say the county because they are all over.
Thanks. When you say there are 3 or 4 years of locations left, is that for all of the Permian or is it Delaware basin only?
Talking of Delaware and Permian .
https://www.oilystuffblog.com/forum/forum-stuff/two-basins-not-one
Not sure if this has to do with the problems Shallow Sand has reported.
“The oil and gas industry risks a huge workforce shortage as more than half of workers in the sector seek to move into the renewable energy industry, a survey published on Tuesday showed. The survey conducted as part of a report by recruitment firm Brunel and Oilandgasjobsearch.com showed that 43% of workers want to leave the energy industry altogether within the next five years. When asked which sectors they’d pursue employment opportunities in, 56% of those working in oil and gas said renewables, compared to 38.8% last year.”
Published by Reuters.
Hickory.
People are going into many areas.
I know former oilfield workers who now work at various types of factories, a state prison, an oil refinery, building construction, farm hand, Pepsi distributor, highway department and an auto mechanic.
I am sure if renewable jobs pay well, people will leave the oilfield to work there too.
Working on an oil rig is very hard work. It has a very uncertain future.
For those is Texas and New Mexico, where are all of the hands coming from to work on all of these rigs and frac crews being added? Are there a lot of migrant oilfield workers there?
We don’t have migrant oilfield workers, but do have a lot of migrant workers in the ag sector and a lot of immigrants work in the meat packing plants.
Chart below from November 2021 Shale Insight Report from shaleprofile
https://shaleprofile.com/reports/the-major-tight-oil-basins-update-november-2021/
The chart has data from the 4 major tight oil basins, Williston, Permian, Eagle Ford and DJ-Niobrara grouped by year of first production, over 79900 wells are included in the data set.
Dennis does this mean the wells are being capped once they get down to about 3-4 bpd?
Stephen Hren,
No the ends of the lines are simply the end of the data set, also note that the axes are daily output in bo/d per 1000 feet of lateral on vertical axis and cumulative output per 1000 feet of lateral on horizontal axis.
The average lateral length has increased over time, so it is hard to compare one year with another, it may be an increase from about 5000 feet to 9500 feet (though that is a guess, I don’t have access to the full shaleprofile.com data set).
If my guess of roughly 5000 feet in 2010 is correct, that would suggest the oldest wells from 2010 in the chart would be at about 15 bo/d on average, note there is a skewed spread in actual well output so these wells might have a median output of 10 bo/d with about half of the wells with higher output and half with lower output. Again I am guessing because I do not have access to the full data set.
Link below is to the average Permian basin well that started producing in 2009, at 141 months the average well that started producing in 2009 was producing 7 bo/d (based on 107 horizontal tight oil wells that were completed in the Permian basin in 2009). Cumulative output was only 106508 bo at 141 months on average for those 107 wells.
https://public.tableau.com/shared/H8TGWG4K9?:toolbar=n&:display_count=n&:origin=viz_share_link&:embed=y
Looking at well status for 2009 wells we find 32 of the 107 wells completed in 2009 were inactive in August 2021, in Sept 2020 37 wells were inactive (plugged plus temporarily inactive), if we take the average of about 35, then we have 72 producing wells on average at 141 months, total output is 107 times 7= 749 barrels then we divide by 72 producing wells to get 10.4 bo/d per producing 2009 well at 141 months (excluding inactive wells). Note that this is an approximation. Note also that the longer lateral wells from later years will be more expensive to operate than these shorter lateral (possibly 5000 feet or less) wells completed in 2009. For that reason knowledgeable people expect the newer wells at an average lateral length of over 9000 feet will be shut in at 20 bo/d, possibly as high as 25 bo/d. I use a 20 bo/d estimate for my scenarios for well shut in in the Permian basin based on comments by oil pros.
Oil hit $62.50 this morning. Has bounce since.
The OPEC+ alliance approved an increase in production of 400,000 barrels per day for the month of January.
Current Price WTI. $66.85 Up $1.28
I reviewed OPEC production likely in the future along with the decline rate of declining oil output nations. This was added to my expectations for future output from Brazil, Canada, Norway, and the US. I have not included potential future output from Guyana, which might add another 1000 kb/d by 2028. The revised Oil shock model is below, with peak around 85 Mb/d in 2026/2027. The estimates for this model are fairly conservative, I would not be surprised if this proves to be an underestimate of future output in 2026/2027 which might rise to as much as 87 Mb/d with expanded capacity from the large middle east producers between 2021 and 2027.
As a reminder the extraction rate on right axis is from conventional oil resources (C plus C only) and does not include oil sands from Canada or Venezuela or tight oil output. The extraction rate is the reciprical of R/P where R represents proved producing resrves of conventional oil and P is the annual production of conventional oil (both in barrels per year).
Question for those who live in Europe-
How does it look from your perspective to see the US under Trump and Biden trying to assert its displeasure over the Nord Stream 2 Nat Gas pipeline from Russia to Germany?
To me, it seems like this is none of the US’s business. Its not our energy security at risk.
aside- That chart resonates with me Dennis, for what thats worth (a few spare pennies).
Politically, the general feeling is of the US no longer being interested in Europe. Their focus is now on China and the Pacific. That trend became obvious during Obama’s tenure and has deepened since. Europe feels pretty much on its own against Putin.
Gas is a different story, as the US is simply trying to find buyers for what is perceived as an abundance of “shale” gas. They even started a war in Ukraine to disrupt the gas trade between Europe and Russia. That will prove to be unnecessary as Europe is going “all in” with gas.
Imports from North Africa are in decline, and Russia is getting close to export capacity, extraction from the North Sea declines as fast as ever. And in the meantime half of Europe quits Nuclear and Coal. Europe will need more gas, a lot more gas. Therefore, Putin or no Putin, Nordstream or no Nordstream, there won’t be much alternative to source ever more liquefied gas from overseas.
The intentions of the Russian leadership regarding the transit of gas through Ukraine are understandable and they are supported by the majority of citizens. All arguments of Vladimir Putin about a cheaper route are a disguise of intentions. The transit agreement will expire in 2024. Most likely, it will not be extended. And most likely it can persist. in much smaller volumes.
It may even stop altogether. It is important to understand that all regions of Ukraine are supplied with gas from pipelines from the Russian Federation.
The interruption of transit will cause a catastrophe. It will be necessary to redirect flows and import gas from Europe, where there is no gas. Ukraine’s own production is less than half of the consumption (17 billion cubic meters). The 5-year transit agreement was pushed by Western countries under pressure, which otherwise
In the case of Nordstream 2, it will not be implemented. It expires in December 2024. Even if the Nordstream 2 is frozen altogether, the transit through Ukraine in the amount of 40 billion cubic meters will most likely not be resumed. I believe that the subject of bargaining for transit will be a peaceful solution to us in the east of Ukraine.
There is information about the start of designing a new gas pipeline to China “Soyuz Vostok” and its design should be completed in 2022, the capacity of the first line will be 50 billion cubic meters.
Its resource base will be the region where more than 80% of gas in the Russian Federation is produced – the West Siberian oil and gas basin, from where gas is supplied to Western Europe.
Thank you for that comment – very insightful.
rgds
WP
When we see Europe embrace wind and solar at a far faster rate than US, it’s important to keep in mind that this is also a race for energy independence since they know they have almost zero fossil fuel reserves outside of Norway.
Thanks Hickory,
It has not received the usual comments about how crazy it is.
Chart belw compares the “low scenario” that you like with my previous scenario which is labelled “high” in the chart below. Note that I did not include Guyana in the analysis which I have read is likely to produce 1 Mb/d by 2028, including Guyana would put the peak at close to 86 Mb/d (roughly between the low and high scenarios).
Neither of these scenarios is likely to be the correct scenario out of an infinite number of possible scenarios.
Just found this on Suriname which borders Guyana in northeastern South America where it says Rystad expects 650 kb/d from Suriname by 2030, so for Guyana and Suriname combined we might see up to 1750 kb/d by 2030, neither of these nations are included in my analysis suggesting a 2027 peak at 85000 kb/d, so including these would push my estimate closer to the “high scenario”.
https://oilprice.com/Energy/Energy-General/Is-This-South-Americas-Last-Great-Oil-Boom.html
https://oilprice.com/Energy/Crude-Oil/Guyana-To-Become-The-11th-Country-To-Produce-Over-1-Million-Barrels-Of-Oil-Per-D.html
Oh, I didn’t mind. I disapproved this project as well as it means more dependence from Russia. Actually, it is more a German problem than an European problem. Indeed, Germany electricity consumption is roughly equal on a day-to-day basis but the production of renevable electricity is chaotic and completely unpredictable. As a result, to provide a nearly constant electricity production, Germans need a flexible mean of electricity production. By now, it is gas and coal, the remaining nuclear electricity production being constant. They want to phase out nuclear plants and later coal-fired power plants. As a result, Angela Merkel has decided to implement the construction of the NS2 pipeline in order to maintain the current level of electricity production because she knows (that’s something obvious in any case) that the leaders of the industrial corporations would move their factories from Germany if they had to support the chaotic supply of electricity from the renevable energy. But apparently, Angela Merkel has had other ideas about all of this because the federal governement provided a few fundings for the development of a concept of molten salts reactor (Dual Fluid Reactor).
Hickory
It is about protecting the Ukraine and the fear of Russia using gas supplied through N2 at some future date for leverage, just like they did when they cut off gas to the Ukraine.
https://www.euronews.com/2021/09/10/nord-stream-2-construction-completed-but-ukraine-pledges-to-continue-fight
https://www.nbcnews.com/news/world/nord-stream-2-pipeline-certification-suspended-germany-rcna5676
Yes, and I certainly understand the geopolitical concern. I wouldn’t want to be dependent on Russia for fuel, and the arrangement puts Russia in the drivers seat in a big way. I wouldn’t be the least bit surprised if they move on the Baltic countries in this decade.
But as I see it, the choice is for Europeans to make.
We here in N America have a lot of domestic fuel, so its easy for us to take a strong position on this.
A luxury that the Europeans (aside from Norway and a few others) just don’t have.
Good points, Hickory. Europe imports about 40% of production plus imports from Russia. UK has indirect dependence on this gas. Russia has been a dependable supplier for 40 years, which should not be jeopardised.
Any threat to disruption of this supply would increase price volatility. One of the issues that has arisen recently over the NS2 pipeline, and suggestions that supply may be subject to manipulation as a bargaining chip, is that Gazprom states that it prefers to sell under long term contract and to not sell into the spot market, where the UK has being buying gas in recent years.
The storage facility in an old gas field, Rough, was ended in 2017 when control equipment wore out, making Britain more dependent upon spot prices. This year of course has seen a four-fold rise in wholesale price, which has left a severe mismatch in domestic gas price, subject to government cap, and the price paid by private supply companies, especially those that have failed to hedge forward. The average domestic price being paid at present is less than half the wholesale price. Some industries have been put under severe pressure, such as fertiliser producers.
Britain imports LNG from around the world, but the trend towards lower carbon energy sources around the world has increased natural gas demand.
Common sense says that NS2 will start supply and will be a valuable addition to Russian gas imports into Europe. It will reduce the threat from disruption to the Belarus and Ukraine pipeline routes. Natural gas will be a major source of European energy for many years to come.
Excepted Eastern Europe. Excepted Baltic countries, all countries of Eastern Europe (Finland, Poland, Slovakia, Czech Republic, Hungaria, Romania, Bulgaria) are increasing their production of nuclear power. Furthermore, 4 of them are preparing (V4G4CE : Poland, Slovakia, Czech Republic, Hungaria) a demonstrator (project ALLEGRO) of a Gen IV nuclear reactor cooled with helium following a revised concept coming from a project of the CEA. I don’t think that they are doing all of this just to consume more Putin gas.
Wait a second ! My old country Finland is not part of Eastern Europe.
OK, Scandinavia. But that doesn’t change the fact that the government is willing to increase the production of nuclear electricity, which will enable Finland to get ride of the use of gas (coming from Russia) and coal (coming from Russia and Poland) and reduce the importations of electricity (for example, from Russia).
On blocking the transit of gas through Ukraine. In that case, Ukraine began to withdraw more gas than it was in the agreement of the Russian Federation in response to reduced the volume of injected gas by the same amount. Ukraine did not stop taking volumes, the Russian Federation did not stop to reduce the injection. As a result, the transit stopped. The negotiations were decided In general, this is a long history. Until the 2000s, no measuring devices were installed on the volume of pumping at the border of the Russian Federation and the border of the EU with Ukraine. There were constant disputes that were resolved in favor of Ukraine. This problem was long-lasting and numb, constantly sabotaged by the leadership of Ukraine, there were constant write-offs debts for consumed gas by the Ukrainian side. There are many stories.
Alexander Shpilman: Forecasts of Russia’s oil supply for 30 years are not accurate
03 December / 12:24
Tyumen. Deputy Prime Minister Alexander Novak, speaking at the Russian-Chinese business forum, said that Russia’s provision with oil reserves under current conditions and production levels is about 30 years, gas – 50 years.
This assessment was commented on by an expert from the State Reserves Committee and the Oil and Gas Information Agency, director of Shpilman Brothers LLC, Ph.D. D., Honored Geologist of Ugra Alexander Shpilman:
– I do not advise evaluating the development of the industry according to the statements of politicians. The provided figures for the provision are a direct division of reserves by annual production. Its figure is known – it is just over 500 million tons of oil per year. For 30 years, this level of production will require 15 billion tons of reserves. There is about that much. But you need to understand that if you predict oil production by 2050, then such arithmetic does not work. And that’s why.
It is necessary to assess the rate of production, drilling, drop in initial production rates, and much more. And these are just technical factors. But there are also political aspects – the fight against the “carbon footprint”, the economic struggle of the Anglo-Saxon countries with Russia, etc. This must also be taken into account. So just taking and dividing the proven reserves by the annual production rate … this is a very easy but not accurate way.
Modern Western hysteria with a “carbon footprint” will pass in 10-15 years, but will cause a slight reduction in oil consumption. I think it is necessary to build a policy and make forecasts based on the fact that by 2050 Russia will provide mainly domestic consumption, that is, 250-300 million tons of oil production per year. For this level of oil production, reserves are still sufficient.
I would like to note that today production in the main oil-producing region of the country – Ugra – is steadily growing. In the Khanty-Mansi Autonomous Okrug, 1.5 million meters are drilled (in October 1 million 599 thousand meters – editor’s note) production drilling per month. This is quite enough.
You should not listen to various “consultants” that like to scare politicians and readers with the idea that a crisis is brewing in the industry. Indeed, production in Yugra fell to 510 thousand tons per day in June 2020 due to the OPEC agreement. But today it has grown to 615 thousand tons per day, which in recalculation will give 224 million tons at the end of the year. Oil production in Ugra is almost restored. In 2021 alone, seven new fields were put into development in Yugra.
Alexander Opritov,
Can you comment on the following paper
https://www.oxfordenergy.org/publications/the-future-of-russian-oil-production-in-the-short-medium-and-long-term/
Authors conclude as follows on page 22 of the paper:
Overall, then, it would seem that Russia does have the opportunity to meet the Russian Energy Minister’s target to keep oil output over 11 mb/d for the next decade. Indeed, if the country’s import substitution strategy is a success then it could even exceed the target, as there is little doubt that the resources are in place. A combination of performance enhancement at existing fields, exploitation of EOR techniques and hard-to-recover reserves, plus some efforts to maintain offshore oil output should be enough to meet the overall goal. Perhaps the more interesting question, though, is what could happen if sanctions are lifted. At that point, the potential of all these resources could be released rapidly, leading to a surge inoutput towards 12 mb/dor above.
the last figure in the paper is Figure 18 reproduced below.
Does this seem reasonable from your perspective?
Supposedly there are about 11000 million tonnes of oil resources in Russia, if we had 500 million tonnes per year produced from 2022 to 2030 that would be about 4500 million tonnes, lets assume a simple linear decline over 20 years from 2031 to 2050, that would result in cumulative production of 500 times 20 divided by 2 or 5000 million tonnes, this would require no new discoveries or reserve growth and there would be 1500 million tonnes of oil resources remaining in 2050. This assumes the 80 Gb Russian oil resource estimate I have read about is accurate.
Denis thanks for the article. It is foolish to comment on anything, this is a scientific study. I would trust the conclusions. Regarding Novak’s assumptions about maintaining production of 550 million tons of oil per year until 2030, I do not believe in this. Table 10 on page 11 coincide with my assumptions regarding oil production in RF. The technologies and competencies of Russian oil production companies in the Arctic seas will be developed more slowly than production will fall. The exemption from the mineral extraction tax does not compensate for the initial costs of developing new fields in the Arctic.
I suppose that there are three uncertain years ahead, when the conflict in the east of Ukraine could affect international relations with the Russian Federation. In 2024, the contract on gas transit through the territory of Ukraine will end. By 2024, the crisis may be defused or aggravated, and new sanctions against the Russian Federation associated with it. the sanction (if it happens) will lead to the arrival of Western companies and the stabilization / slowdown of the decline in oil production in the Russian Federation
Alexander,
My guess is that you may have more insight into the Russian oil industry than me, I thought you might have caught glaring omissions in the paper that I might have missed.
Thanks.
Hello Alexander , 3 years in the current situation ? ? The Tuesday meeting between Biden and Putin will be the decider . My favorite blogger Andrei Martaynov put it correctly “escalations can only be stopped by two means: negotiations or war. If the former is made impossible, the latter becomes inevitable. ” . Sincerely I hope sanity prevails in Washington that is doing nuclear like war exercises 20 Km from the border and escalating the situations . I am surprised by the EU ‘s action . Are they not aware of the 4 Chernobyl’s in the pipeline ? The world is upside down . They say ” Hope for the best and prepare for the worst ” . How does one prepare for a mushroom cloud ???
hole in head. There is no need to be guided by what the Russian or Western mass media convey to us.
All of them are engaged in their political preferences. You can try to understand something based on what is really going on.
This is how I understand and see what is happening (of course I could be wrong):
-In the Russian Federation, there are many different political trends, Putin has many enemies, both Western supporters and patriots (let’s call them that). They plan the future policy of the Russian Federation in different ways.
-Putin after 2014 wanted Ukraine to seize the rebellious regions in the east, while a prerequisite was that there were no political cleansing. This condition makes a peaceful solution still impossible.
-Crimea, the Russian government will not give up under any conditions, including a full-fledged military conflict with the West.
-The solution to the conflict in the east is possible with the adoption of an amnesty to the rebels or the immigration (which is unlikely) of Ukrainian coloborationists to Russia. In today’s reality, a concession by either side will entail political problems to the side that made concessions. I think that the Russian government is waiting for the end of the transit agreement and wants to exchange a new one a treaty for a peaceful solution.
I could write more about relations between the two states if I was asked, because if I write it myself, it will be propaganda
Sorry Alexander , “the sanction (if it happens) will lead to the arrival of Western companies and the stabilization / slowdown of the decline in oil production in the Russian Federation ” . Incorrect . You cannot beat mother nature ( geology ) . Russia is now past second peak . Nature bats last .
Arctic cannot be devolped until oil is $ 200 per barrel . Forget it . No exceptions . Majors , RF or any Tom , Dick and Harry .
hole in head. Yes, of course you are right. I saw optimistic estimates that by 2035 they plan to produce 1 ml / bbl per day on the Arctic shelf. I don’t believe it. There are shallow depths, but perennial ice reaches 3 meters in thickness.
Thanks for your insights Alexander,
but you severely misjudge this particular issue-
“Modern Western hysteria with a “carbon footprint” will pass in 10-15 years”
Forgive Hickory, it’s not me, but Alexander Shpilman. Although I agree with him. I remember how in the 80s-90s there was a problem: the fight against ozone holes, the rejection of freon in refrigeration units. Now they have forgotten about it. Believe me, new ones will appear. problems and the media will take care of it.
Thanks for the clarification on source of the comment.
Nonetheless, I stand on my statement.
Alexander , this time you disappoint . ” Experts ” . ?? Like ” I am science ” , Dr Fauci . Yesterday is not today and today is not tomorrow . Everyday as the lies of the ” oil onion ” are pealed the world is going to shed tears and we will know who was swimming without underwear . Latest being the bogey we have XXX mbpd in surplus capacity in oil . Heck CH4 or natural gas . What was the world doing ? NG = food . 80% of the world ‘s protein is dependent on the Haber Bosch process to produce ammonia . Ad blue ? The trucks stop running . Where were the experts ? Sleeping or checking their bank accounts for the lobbying checks ? This is in no way reflection on all the other info you provide on Russia which is invaluable and for that my ” Spasiba ” .
This gets interesting . Follow the money .
https://www.oxfordenergy.org/about/benefactors/
There was also a time when horse manure was one of the biggest problems facing modern cities. Tragically, everyone has forgotten this struggle.
And don’t get me started on the war on lead paint.
Leaving shit behind that you didn`t bother to pick up had a different meaning then, just saying..
Something to keep a eye on is Singapore’s refining capacity. If they are unable to secure enough natural gas to keep those refineries running like normal. Then their problem becomes Asia’s problem.
LNG is causing problems in India at the height of the sowing season . Black market is at 100% of the govt set price . Acute shortage of fertilisers . Rationing is in affect .
https://www.youtube.com/watch?v=JNpN–LtPog&t=28s&ab_channel=IndiaToday
https://www.wionews.com/india-news/shortage-of-fertiliser-poses-fresh-problems-for-indian-farmers-ahead-of-sowing-season-428749
Shell pulls out of Cambo oil field development https://www.bbc.co.uk/news/uk-scotland-59512742
Well. Remember when they talked about oil investment being needed to grow production?
Cambo crunch
Shell’s decision to pull out of the project to drill the Cambo oil field has ramifications that the establishment media refuses even to acknowledge. The fact that Big Oil was even prepared to consider opening up Cambo is a measure of how desperate things have become. The field – which the industry and the media mendaciously refer to as in the North Sea – is below the Northeast Atlantic, directly in the path of the Gulf Stream, and regularly pounded by gale force winds and forty-foot waves. More to the point, the field is a tiddler by North Sea standards – containing just 170 million barrels of oil equivalent and 53.5 billion cubic feet of gas. Oil deposits – beneath a seabed more than 1,000 metres below the surface – are in small, unconnected deposits within tortured geological formations.
With oil prices doubling and gas prices rising four-fold in 2021, and with economists predicting $100 per barrel in 2022, the field – which will probably never be drilled – may have briefly appeared viable. But Shell – like Chevron before them – will want stable oil prices well above the $86 peak reached in October before committing to such a high-risk endeavour.
While “green” groups have welcomed Shell’s decision, with Friends of the Earth Scotland ludicrously claiming it as a victory for “people power,” the reality is that we are now reaching the economic limits of oil extraction. Put simply, it will cost more money – which is a financial proxy for energy return on energy invested – to get the oil out of the Cambo field than the oil is worth – particularly if the cost of decommissioning is factored in.
There is roughly as much oil – including the source rock – beneath the Earth than humans have extracted during the industrial revolution. But almost all of what is left is beyond geological and technological reach. This said, there are still enough supposedly proven reserves to allow us to raise the global temperature by another couple of degrees before we’re done. The trouble is that these calculations – included in the IPCC’s worst-case scenarios for climate change – ignore the economic – energy – limits on oil extraction. Much of the oil that is being treated as recoverable is locked up in small and difficult fields like Cambo, which are simply too expensive and too risky to ever be recovered. This, in turn, means that the entire world economy now depends upon bigger, cheaper, older and depleting oil deposits. This, in turn, tells us that we will indeed, be transitioning to a “net zero” economy… just not in the way the World Economic Forum and the bright green crowd imagined.
Courtesy Tim Watkins .
Ad Blue shortages in Korea , China and now Australia .
https://www.abc.net.au/news/2021-12-03/diesel-crisis-adblue-shortage-supply-china/100673482
If anyone is interested in legacy Bakken production, EOG has 7 wells for sale.
James Hill 4-10H Kittleson Slough Field
Clayton 1-35H Little Butte Field
Clearwater 4-11H Clear Water Field
Clearwater 3-12H Clear Water Field
James Hill 5-24H Ross Field
Crow Foot 2-20H Clear Water Field
Crow Foot 1-17H Clear Water Field.
For these 7 wells the last 6 months average gross production is 16.80 BOPD, 23 MCFPD and 188 BWPD.
The wells were completed in 2009, 2010 and 2011.
The royalty burdens range from 17-22%.
I suspect they may end up needing to pay somebody to take these wells, or will have to just plug them.
I wasn’t aware that 1-5 BOPD Bakken wells were being produced.
I would also note if you look at recent monthly production reports for EOG’s Parshall Field, you will find numerous SI and TA wells.
Parshall was the gold standard ten years ago.
Not so sure this data bodes well for the future of the Bakken.
Shallow,
Thanks for the data. But, how can this negatively impact the future of the Bakken when Harold Hamm stated back in 2011 that there were 24 billion barrels of reserves, when only 4 billion barrels have been extracted to date? 🙂
steve
Is this one of those reserves vs resources issues?
SRSROCCO,,
The Hamm claim of 24 Gb was always considered bunk by me. My estimate has mostly been in the 8 to 9 Gb range for North Dakota(ND) Bakken/Three Forks URR, that would leave 4 to 5 Gb to be produced, my most recent ND Bakken/Three Forks scenario has a URR of 7.9 Gb with current cumulative output at about 4 Gb, leaving about 3.9 Gb to be produced. On right axis is wells completed per month and Brent oil price in 2020 $, left axis is tight oil output in kb/d.
I assume these wells are shutin at 7 bo/d which may be too optimistic, when I change the assumption to wells being shut in at 10 bopd, URR falls to 7.7 Gb. If we change the assumption to wells being shut in at 15 bo/d URR falls to 7.4 Gb.
Dennis.
EOG has 495 wells in Parshall. I counted 156 that were either temporarily abandoned, shut in or had 0 production in September, 2021.
Many other wells under 100 BO for September and many more under 600, which is less than 20 a day.
Is there some reason to think this won’t hit the more newly developed fields in this decade?
To me Parshall isn’t that old, 2008 isn’t that long ago?
Any Bakken boosters out there want to take a crack at this?
Shallow sand,
Chart below has my estimate for the average 2018 ND Bakken/Three Forks well.
EUR is 360 kb at 145 months from first flow with well plugged at 10 b/d, EUR=347 kb at 111 months and 15 bpd, and EUR=337 at 91 months and 20 bpd. Note that overall output in terms of URR changes only a bit as we assume wells are plugged at higher volumes, I assume high oil prices would tend to increase the life of these wells ceteris paribus.
Shallow sand,
Some years EOG did not have good results in Parshall field. For wells operated by EOG in that field that started flowing in 2010 (47 wells) only 16 of 47 were still producing in Sept 2021 with 6 wells plugged and 25 wells inactive. The 47 wells have an average output of about 7 bpd at 141 months for total of 329 bpd, since only 16 were operating in Sept this would be 329/16 or about 20 bpd for producing wells. Other years such as 2008 were much better so there is a lot of variation from well to well as I am sure you already know.
Some of the early estimates were way off (average EUR estimates of 600 kbo) in part because they assumes very low terminal decline rates (6% per year) and 30 year well life, wells will probably last on average 10 to 15 years before being plugged.
For ND Bakken/Three Forks wells that started producing in 2001 (only 40 wells) about half were still producing in Sept 2021. Average production for all 40 wells was about 6 bopd, for producing wells only output average was about 12 bopd for Sept 2021.
Dennis.
I don’t analyze this stuff as closely as I need to and really need to spend some more time on shaleprofile.
However, I think Mike’s point for years is just what you refer to and Baggen states below.
The power points assumed a low terminal decline. But that doesn’t seem to be happening? Or is this just Parshall specific?
We probably really don’t the complete answer yet across all shale fields, but it seems there are a heck of a lot of “old” wells that just keep on declining over 10% annually, even after they hit flow rates below 25 BOPD.
I had assumed a few years ago that these “old” wells might be a good long term investment, assuming a high oil price environment.
Now, that is no longer appears the case. It appears to me almost all of these wells in all basins will be below 10 BOPD in 15-20 years of completion. Many will be below 5, and even then will not be “leveling out.”
It’s not easy to make money on 1 BOPD wells that are vertical holes less than 1000’ deep. Impossible to do that with these shale wells, even with oil over $100 per BO.
I figured Bakken wells might be best long term? Are you seeing things differently?
I will add I took a look at Whiting Sanish wells. There are a lot more shut in there too than I expected, plus a lot more under 20 BOPD than I expected.
Marathon at Reunion Bay didn’t look as bad, but appears they have been doing a lot of re fracs?
Grail also not as bad, but isn’t it starting to show signs of the same thing as Parshall and Sanish? Some SI wells.
Just FYI, for my area to have ten year old wells SI would mean major league issues assuming $60 WTI.
Shallow sand,
I have assumed for many years that terminal decline for tight oil wells will be 10 to 15% annually, based on comments by Mike and others these wells are not likely to be a good long term investment as stripper wells. My scenarios typically assume the wells are shut in at 10 to 15 bpd, but based on recent comments by Mike I have modified the Permian scenario to use 20 bpd as the economic limit. I have not made this modification for the Bakken, Eagle Ford, or Niobrara.
Yes the power points are crap. I use the shaleprofile data for my models, but note that Enno puts zero values in for inactive and plugged wells to avoid survivorship bias, this works for a basinwide model approximation, but for individual wells you need to look at individual well data. I don’t have access to that data, but my guess is that these low output wells will be more of a liability than an asset.
Scenario above has oil prices rising to $93/bo in 2020$ for WTI.
Corrected Bakken scenario below with lower oil price scenario which matches EFS and Niobrara scenarios downthread.
Updated Eagle Ford Model below using same oil price scenario as Bakken scenario above. Current cumulative Eagle Ford tight oil output about 4 Gb with about 23 thousand wells completed through October 2021, scenario has about 8000 more wells completed from Nov 2021 to March 2030 with no more completions after that date. URR is about 7 Gb by Dec 2045 when all tight oil output ceases. Note that the oil price scenario is conservative with maximum WTI price of $68.50/b in 2020 $ from August 2021 to July 2035, then oil price falls to $28/b by Jan 2039 and remains at that level.
Updated DJ-Niobrara Model URR=2.5 Gb, cumulative tight oil output through Oct 2021 is 1.3 Gb with 10850 wells completed up to Oct 2021. The scenario has a total of 16730 wells completed from Jun 2006 to Sept 2028.
The final tight oil scenario is a catchall for “Other US tight oil”. This model is not as good because I do not have very good data on completions and costs so it is a very rough estimate. URR is 7.8 Gb with cumulative production up to October 2021 of 3.6 Gb, past peak was 1200 kb/d in September 2019 and expected future peak for this scenario is 1236 kb/d in Jan 2026, cumulative output will be about 5 Gb at the end of 2025. Completion rate returns the the average level from mid 2017 to mid 2019 by Aug 2023 for this scenario and remains at that level until Jan 2026 and then decreases to zero by June 2028 when the last “other US tight oil” well is completed.
The most recent Permian scenario can be found at comment linked below
https://peakoilbarrel.com/hurricane-ida-collapses-us-september-oil-production/#comment-730900
The revised scenarios above are combined with a recent Permian Basin scenario (medium oil price maximum Brent at $75/bo in 2020$) for all of US tight oil (the Permian, Bakken, Eagle Ford, Niobrara, and other US tight oil scenarios are summed to get US tight oil). Then a centered 12 month average (CTMA) is calculated for both data (from shaleprofile and EIA) and the modelled scenario and plotted on chart below.
The scenario URR from Jan 2000 to Dec 2052 is 69 Gb, peak is in 2027 shown on chart and the CTMA for US tight oil at the current World C plus C peak in November 2018 is also shown on the chart, the difference is about 2160 kb/d. In my opinion this scenario is conservative as I used oil price scenarios with maximum oil prices of $75/bo in 2020 $ or less. My expectation is that average oil prices between 2022 and 2028 are likely to be more than $90/bo in 2020 US$.
For May 2021 (last data point for CTMA) the value is 7243 kb/d, the model scenario CTMA for May 2021 is 6906 kb/d, roughly 340 kb/d too low.
Shallow,
This is interesting, the wells are more or less dead after 10 years and clearly at present time an economic liability and as you said it will be plugging or paying someone to take it.
So done and over in 10 years, in power point its 30 years+ to reach those EURs in the presentation. Also keeping in mind that these wells were drilled before those that were drilled after for a reason. Reality and power point not coming together again.
Thanks
Permian Basin: Where does all the water needed for new wells come from, now that drought water restrictions are in place? I presume not a lot of drilling is going to happen next year, unless there is record rainfall soon.
The water comes from the ogilaga aquifer in the shallow sands which is all over West Texas. I have always been an advocate of water recycling.
From USGS-
“How and where do drillers dispose of waste hydraulic fracturing fluid?
Most of the water and additives used in hydraulic fracturing (or “fracking”) remain deep underground in the geologic formation from which the oil or gas is being extracted. But some of the fluid, mixed with water or brine from the formation, returns through the well to the surface and is referred to as “produced water”. After a well is brought on-line, large volumes of produced water (primarily composed of the injected fluid) are generated.
Produced water is often disposed of by injecting it into deep geologic formations via wells that are specifically designed for that purpose. In some cases, produced water can be treated and reused to hydraulically fracture another well. In other cases, the water is clean enough to meet regulatory standards and is discharged into local watersheds. Practices vary between regions, depending on regulations, geologic conditions, and water availability. ”
btw- the Ogallala aquifer is the irrigation and drinking water source for west Texas and on average “The Ogallala has an average 29 m [94ft] of saturated thickness; however, excessive pumping has caused a depletion across much of the Great Plains. In Texas alone, the saturated thickness has declined >15 m [48ft] since predevelopment in the 1950’s ”
Finite resource, like oil.
My two cents on new virus variant. Doesn’t matter if it turns out to be more mild. It’s going to infect way more people whom will have to quarantine.
It will be more economically disruptive than previous variants. So supply shocks to get worse over next 12 months.
Permian tight oil trend from April to October 2021 based on official EIA tight oil estimate.
Annual rate of increase about 836 kb/d over that 6 month period (using OLS trendline for estimate), of course trends often change so this rate of increase is not likely to continue for long.
This is worrying not only for Europe but for the world . Chernobyls in the pipeline and all what MSM talks about is invasion .
https://iwpr.net/global-voices/ukraine-faces-winter-energy-crisis
Southwest Louisiana is becoming the LNG powerhouse of the United States and could become the LNG powerhouse of the world. There are currently 2 operating LNG facilities, with a bunch more in the queue. My question is – is there enough domestic gas supply to support all of these LNG facilities?
Attached is a link to a recent article about this.
https://www.americanpress.com/2021/11/24/lng-export-heavyweights-cameron-parish-has-become-a-major-world-player/
SLGO,
Sort answer … yes
While that linked story contains a number of factual errors (and, arguably, a huge omission by not emphasizing the imminent FID for the Plaquemines Parish project), the availability of economic natgas extends out several decades … possibly a century.
On this very site a few years ago, an industry participant expressed disbelief that the Appalachian Basin could annually produce 7 Tcf.
The tri state region is now producing ~ 12 1/2 Tcf every year, could easily produce more to supply Northeast markets if pipe was available, and West Virginia has recently passed Oklahoma to become the #5 natgas producer in the US.
While there are so many data points to buttress my stated position of abundant supply that it would be tedious to list them all, a few highlights might provide ‘food for thought’ …
Deep Utica production has quietly restarted in Southwest Pennsylvania (SWPA) with little fan fare as – presumably – operators do not want to repeat the debacle from 6 years ago wherein stupendous IPs were trumpeted only to have the wells plummet in output after a few months. (Cracking the code may play a role here).
The Barnett – having its TRR doubled to ~52 Tcf by the USGS, still sits on the sidelines for activity as other basins – notably the Haynesville/Bossier – offer better economics.
The Mancos B in western Colorado may arguably hold the best gaseous hydrocarbon rock in the country (payzones are several thousands of feet thick) but takeaway constraints plus having to compete with the Permian have stifled development. This is apt to change as three – for now – west coast Mexican LNG plants are in various stages of development (Ensenada, Puerto Libertad, and Topolobampo).
Within 5 to 7 years, these plants could possibly be exporting ~40 mtpa (million tonnes per annum) of US sourced natty. (One mtpa can equate to 140 million to 160 million cubic feet per day depending upon process use).
One HUGE consequence of the current global natgas situation is the gross under investment in new resources around the world.
Domestic output declines (coinciding with rising consumption) range from Thailand, Philippines, Pakistan, Viet Nam, Europe (despite sitting atop vast amounts located in the Bowland and Weald Basins) and many, many more.
(Brazil’s output – while facing dramatic increase in consumption – is uncertain as the capture/disposition status of the pre-salt natty still seems undetermined).
Bottom line … you ain’t seen nothing yet.
(Final aside, SLGO, if you are RM, I thank you for your informative online contributions over the years. If not, thanks for your input, anyway. Always great to see views from knowledgeable sources).
(…) Domestic output declines (coinciding with rising consumption) range from Thailand, Philippines, Pakistan, Viet Nam, Europe (despite sitting atop vast amounts located in the Bowland and Weald Basins) (…) You are speaking of shale gas. But in Europe, you are not in the USA : Europe is more densely populated than the USA are, especially in the USA areas of gas extraction. The implementation of gas shale in the area mentionned, for example, would trigger conflicts with the population living above the gas shale fields because of problems of water use sharing issues, problems of gaseous chemicals release in the heavily populated areas mentionned, problems of contamination of water tables in case of wells failure, problems with the increase of circulation of trucks carrying the fracking fluids and so on. The areas concerned with these supposed gas reserves are not gas fields. Do you understand?
JFF , no . he does not .
Mr. Fleury,
Virtually every concern that you have listed has either been addressed, ameliorated, or completely bypassed with the ongoing adaption of drilling/completion/development techniques that continue to emerge in the unconventional hydrocarbon universe.
While a great many intelligent, well meaning people continue to choose to be mis/dis/un informed regarding the particulars in these activities (as is abundantly clear by your listing of ‘issues’ surrounding the truncated Bowland development by Cuadrilla), I am heartened that the US industry is facing diminished competition as a consequence of these sincere, albeit misguided, concerns.
As I have no intention of becoming embroiled in these ongoing, unnecessary, fruitless online discussions, I`’ll not comment further on Europe’s largely self created energy situation but for a final observation expanding upon another poster’s comment regarding the Groningen shut down … to wit, MANY factors come into play and interact in ALL human activities.
When the time arrives that people are impoverished, hungry, cold due to affordable energy deprivation, human responses adapt.
I suspect that that time may be drawing near and the outcomes may manifest as abruptly discontinuous vis a vis the orthodox ‘narrative’ these past few decades.
Good luck, Mr. Fleury.
Coffeeguyzz-
your perspective is appreciated.
SouthLaGeo,
I imagine more exports are likely to result in higher natural gas prices in the US as natural gas will become more of a World market like the oil market as LNG facilities expand.
My guess is the people financing these LNG trains believe there is enough natural gas for a decent return on investment.
As you no doubt know there were about 465 trillion cubic feet of proved dry gas reserves at the end of 2019 in the US, 2P reserves were likely about 651trillion cubic feet.
In 2020 about 33.4 trillion cubic feet of dry natural gas was produced in the US. So with no increase in consumption we would have about 20 years of reserves.
Note that from Jan 2013 to Sept 2021 dry natural gas output has abben growing at an average annual rate of 4.6% per year.
If we assume output continues to grow at 4.6% per year and no discoveries and no reserve growth (a very conservative assumption likely to be incorrect) then 699 trillion cubic feet of natural gas reserves would be produced by 2034, as we only currently have booked about 650 TCF of 2P reserves this seems to be a problem.
No doubt the TRR estimates are higher, but I don’t have a good handle on those. Would need to research further.
2019 USGS study has mean TRR for marcellus at 96 TCF
https://pubs.usgs.gov/fs/2019/3050/fs20193050.pdf
For Utica USGS has mean estimate of 117 TCF
https://pubs.usgs.gov/fs/2019/3044/fs20193044.pdf
Typically ERR is about 70% of TRR with favorable prices so perhaps around 140 TCF will eventually be added to 2019 2P reserves from these basins. Add these and the 52 TCF mentioned by coffeguyzz, lets call it 200 TCF and add to 2P reserves of 650 for a total of 850 TCF, by 2037 under my previous assumptions (4.6% annual output growth) cumulative output form 2020 to 2037 is 907 TCF. So 17 years and we may be done.
The resource is not infinite, the century estimate by coffeguyzz is bunk.
Thanks for the comments to you all.
Regarding US gas – Dennis, you’re right. The folks financing these Southwest Louisiana LNG projects must believe the reserves are there. I guess I wonder – will there still be enough gas there in 15-20 years?
Coffeeguyzz is convinced there is. In your comments above, I believe I was the one who was amazed at the volumes of Appalachian gas being produced,,
Coffee – I used SouthLaGeo while working. Since I’m retired now, and have been for over a year, I can go by Bob Meltz.
Bob,
I just realized I forgot about declining conventional natural gas which has been declining at an annual rate of 7% per year since 2009, so the shale gas needs to replace that falling output (in 2022 it will be a decrease of 1.3 BCF/d conventional NG output will be about 18.5 BCF/d in 2021. I define conventional natural gas as any gas that is not shale gas. In September 2021 81% of US natural gas output was shale gas.
Hmm. What about the demand side? Gas is going to face growing competition from cheaper wind and solar in many places. And, of course, at some point carbon prices will start to reflect the true cost of CO2 (and other) emissions, and gas will have real trouble competing. Even if NG sticks around as a seasonal backup, that won’t be a really large volume form of demand…
Nick-
Nat Gas consumption is on a long and big uptrend, both in the US and internationally. That will continue indefinitely (or three decades whichever comes first, or last) until supply depletion or population decline kicks in. Regardless of wind and solar deployment.
The collective human animal is an insatiable energy hog.
Thats my take on it.
The collective human animal is an insatiable energy hog.
Have you looked at the trends for OECD countries? Falling oil consumption. Stagnant electricity consumption. Falling coal, being replaced by growing NG, wind & solar.
There’s no sign of insatiable energy demand, just people who want the services that energy tends to provide: transportation, HVAC, etc. They don’t care about energy inputs, just the services, and their demand for the services has pretty much levelled off: stagnant vehicle sales, vehicle miles traveled, etc.
Energy growth is coming in developing countries, which want more basic goods and services.
NickG,
Eventually the growth in the demand for natural gas may slow down as solar,wind, hydro, and nuclear ramp up. For now consumption has been increasing through 2019 (I leave off 2020 due to pandemic). In the mean time net exports of LNG have been increasing rapidly, at the World level consumption of natural gas has been growing at 2.9% per year on average from 2009 to 2019. For the US, growth in natural gas consumption was 2.66% over the 2009 to 2019 period. The growth rate will likely slow as more solar and wind and other substitutes for natural gas are developed, I imagine in the electricity sector, coal will be replaced first and then natural gas, but this will depend on future policy and prices which are not known.
Dennis,
That makes sense. I was hoping that you might have a spare moment to do a quantitative model…
The US seems instructive: electricity consumption has been flat for the last 10 years, yet NG has been growing. That means that NG is displacing other things, specifically coal. Wind and solar are also growing at the expense of coal. Those trends can only continue for so long. As you describe, coal will be eliminated, and then NG will be the next thing to decline.
It would be interesting to do what you normally do: project current growth rates for a few years, and guesstimate when growth might start to taper off, and see when we eliminate NG (or get close).
The worlds primary energy consumption is up, up , and up.
With natty [nat gas] being the biggest growth source over the last two decades, increasing from 24 to 39 TWh
Here is some data/chart info to make it clear (despite what anyone might want to be the case)-
https://ourworldindata.org/energy-mix?country=#energy-mix-what-sources-do-we-get-our-energy-from
Hickory,
How does that data show that NG won’t be replaced by wind & solar?
Nick,
I would need to update some of my models. A rough idea below with Natural Gas peaking for World in 2040 due to supply constraint. Model has coal peak in 2022, oil peak in 2026 with coal replaced first, oil next and natural gas last to reduce carbon emissions to atmosphere (coal having highest carbon emissions per EJ consumed, followed by oil and then natural gas). Demand falls below supply of natural gas in 2051, based on my quick model.
“How does that data show that NG won’t be replaced by wind & solar?”
Gradually, global fossil fuel consumption will be much lower as a result of depletion.
Solar and wind will make up some of the shortfall, more effectively in some regions than others.
In the meantime, there will be a series of jolting shortfalls of energy supply as demand of 8 plus billion people will continue to grow and will outstrip supplies.
Deployment of solar and wind, despite excellent pricing now standard in much of the world, is far too slow to catch up with depletion of fossil fuels.
That is the hard truth of it.
Dennis,
Thanks. If it’s convenient, could you add break that line into two, one for NG supply and the other for demand, or something like that showing the shortfall between the two?
I know that this involves enormous simplification and a lot of assumptions about prices, supply and demand elasticity, etc.,
Nick,
Basically natural gas is supply constrained up to 2050, in other words higher demand simply drives up natural gas prices and destroys demand, after that when natural gas supply falls sharply from 2051 to 2055 (and beyond) it is due to a lack of demand as non-fossil fuel start to supply most of the World’s energy demand.
Hickory,
Taka a look at solar and wind consumption growth at BP stats. From 2011 to 2019 solar consumption grew at about 29%/year on average and wind consumption grew at 14%/year on average. See chart below, data from BP.
Thank you all for the comments on this.
Dennis, you’re right – those financing LNG projects, whether in southwest Louisiana, or anywhere, must believe the gas reserves are there, or will be there, to make the projects work.
While I don’t question the reserves you show, I do question whether a 4.6% annual rate increase is reasonable – that would have US gas production over 60 tcf/year by 2029. I don’t know,, maybe?
I wonder what others, like the EIA, project for long term US gas production?
SLGO,
Quick follow up to the LNG link …
Venture Global just announced the go ahead for CP2, another 20 mtpa project to be sited next to the Calcasieu Pass operation.
Combined with the Plaquemines Parish plant, 50 mtpa total could be in production by 2027 from this company.
This amount exceeds the much touted Qatar expansion of 49 mtpa.
(For context, 1 mtpa equates to roughly 150 million cubic feet per day depending upon processing particulars. This one company, Venture Global, is on track to use 7 1/2 Bcfd, which is 2 1/2 times current daily Bakken production).
FWIW, I have always been confident of the USGS’ work with respect to TRRs, but their Marcellus analysis is a glaring exception. Their parameters are simple, clear, and concisely presented on their site, but they are wildly divergent from proven, historical production records. I would imagine Enno’s site would corroborate this. (I use PA DEP production numbers).
To claim that the Haynesville/Bossier is over 3 times larger than the Marcellus strains credulity.
In fact, with annual Marcellus production about 10 Tcf, the USGS would then project less than a decade remaining of Marcellus production. This is preposterous.
For contrast, the West Virginia University folks claim recoverable from both the Utica and Marcellus being in the 800 Tcf range each.
Coffeeguyzz,
I remember you defending Hamm’s ridiculous estimates for Bakken (30 Gb or some such nonsense), note that the highest estimates are not necessarily correct.
Keep in mind that for the Marcellus at the end of 2019 there were 139.4 TCF of proved Marcellus reserves, 2P reserves would be about 40% higher, so about 195 TCF, then we add the undiscovered mean TRR of 96 TCF and we have almost 300 TCF of recoverable resources for the Marcellus. For the Utica we have about 48 TCF of 2P reserves at the end of 2019 and undiscovered TRR of 117 TCF for a total of 170 TCF, total appalachian natural gas resource would be 470 TCF if all of it is recoverable.
For all of the US shale gas 2P reserves are about 500 TCF and undiscovered TRR for all USGS assessments from 2000 to the present is about 1600 TCF, some of the undiscovered TRR will not be economically recoverable and some of current reserves might be included in the older UTRR estimates from 2000-2018. Probably 1300 TCF+/-200 TCF would be a reasonable guess for current shale gas resources.
Conventional natural gas 2P reserves are about 200 TCF, I doubt there is significant undiscovered conventional natural gas in the US that will be economically recoverable.
So total US natural gas resource of perhaps 1500 TCF+/-200 TCF.
Pennsylvania shale gas production in Sept was at an annual rate of 7.45 TCF per year.
Most of this gas is produced from the Marcellus basin which might have 300 TCF of remaining resources, at current rates of output (Sept 2021) that would last for 40 years or so.
If Pennsylvannia’s output continues to grow at 15% per year (annual average growth rate from Jan 2013 to Jan 2021) and shale gas output continues to be primarily from the Marcellus, then resources are exhausted in 2034, if the USGS mean UTRR estimate is correct. So somewhere between 13 years and 40 years depending on growth path of future Marcellus output.
Dennis,
I believe you omitted West Virginia’s ~2.7 Tcf annual production from your above example.
The vast bulk of this output targets the Marcellus formation.
(Ohio’s ~3 dozen Marcellus wells produce negligible output, but this liquids-rich horizon is apt to increase somewhat in the near future).
Coffeeguyzz,
Yes I was using data on Pennsylvannia from shaleprofile (latest post).
Probably should have used EIA data, which for past 12 months has averaged 9.24 TCF of shale gas output from Marcellus, so 300/9.24=32 years. Also from 2015 to 2021 Marcellus output grew at an annual rate of 9.8%. If that continued in the future Marcellus cumulative output from Jan 2021 to Dec 2036 would be about 320 TCF.
So 14 to 32 years of Marcellus resources left, if the mean USGS UTRR estimate is correct and all of the UTRR is economically recoverable.
Thanks for the correction.
Coffeeguyzz,
I cannot find a paper with 1600 TCF of resources from Marcellus and Utica, can you post a link?
One paper cites 490 TCF for Marcellus, from 2011 USGS study that has been superceded by a more recent 2019 USGS study, see page 3 of paper linked below
https://cigru.wvu.edu/files/d/8bf674ed-befd-4b70-b1c3-800534598c1e/adecadeofmarcellus.pdf
The most recent USGS studies for Marcellus and Utica were published in October 2019, at the time the papers were being written only Dec 2018 reserve estimates would have been available.
Marcellus mean undiscovered TRR=96 TCF
Utica mean undiscovered TRR=117 TCF
Total UTRR=213 TCF
see
https://www.usgs.gov/news/usgs-estimates-214-trillion-cubic-feet-natural-gas-appalachian-basin-formations
You might have been thinking of the now discredited EIA report from 2011, which had 472 TCF of UTRR for the Northeast US shale gas at the end of 2008. This was the same report that had the ridiculous estimate for the Monterrey tight oil, it was essentially a paste up of investor presentations and was crap. The estimate should be ignored.
https://www.eia.gov/analysis/studies/usshalegas/
For Dec 2018 reserves see spreadsheet at link below
https://www.eia.gov/naturalgas/crudeoilreserves/archive/2018/excel/table_4.xlsx
Marcellus reserves were 135 TCF at the end of 2018
Utica reserves were 24 TCF at the end of 2018.
Total Appalachian shale gas reserves=159 TCF
Reserves plus UTRR for Appalachia are 159 plus 213 = 372 TCF.
About 45 TCF of shale gas was produced from the Marcellus and Utica plays from Jan 2009 to Dec 2018, if we add this to the estimate above we get what the estimate should have been on Dec 31, 2008, which is 417 TCF, note that very little shale gas was produced before Dec 2008 in the Marcellus or Utica, about 0.018 TCF. Thus the URR for the Marcellus and Utica would be no higher than 417.018 TCF.
From Jan 2019 to October 2021 about 32 TCF of shale gas was produced from the Marcellus and Utica plays. That leaves about 340 TCF of resources from these two plays. For the past 12 months annual output from the Marcellus and Utica has been about 12 TCF per year, about 28 years of resources with no increase or decrease in output.
A better estimate would be to assume there is a future increase (for the past 3 years the rate of increase in output has been about 4.4%). I assume a 4% increase from 2022 to 2026 followed by a slower linear increase at 0.25 TCF per year until peak which I assume occurs at 60% of URR or when cumulative production reaches 250 TCF. For this scenario that occurs in 2033 with output at 16.35 TCF per year (44.8 BCF/d). Decline after peak is assumed to be gradual for a few years before becoming linear (for simplicity).
Scenario for shale gas output assuming a URR of 417 TCF for Marcellus and Utica in chart below, obviously like all scenarios of the future, this will be incorrect. It does not utilize well profile or completion data, simply historical production and reserve and resource estimates.
Dennis,
Ultra quick, time constrained response …
“A Geologic Playbook for the Utica Shale…”. This is a 2015 report issued by the West Virginia University. ~200 pages long, crammed with eye-glazing charts, graphs, Fred Flintstone terminology that only an uber Rock Doc could love.
The ~20 page executive summary might satiate (kindle?) a casual observer’s curiosity, but the hard historical production data ALREADY surpasses much of the baseline profiles used in this report’s analysis. From memory, last sentence from summary states Utica recoverable at 780 Tcf, comparable to the Mighty Marcellus.
Of particular note for anyone following this still-emerging (Utica) resource … virtually all of the US government maps depicting the Utica have already been made obsolete as current, online production includes wells beyond the USGS’ depicted footprint. (This is especially true in NEPA … Northeast Pennsylvania).
Of special , relevant interest, perhaps, is the successful half dozen Utica wells developed by Questerre just south of Montreal (that is Oh Canada, Montreal) back in the 2008 timeframe.
To say the Utica/Point Pleasant resource is an unknown entity would be stating the obvious.
I’ll not even go into the uncertainties surrounding the Trenton Black River which, today, has producing wells in Michigan, Kentucky (from memory, and upstate New York.
Coffeeguyzz,
A quick look at the paper reveals that they have used wonky well profiles with harmonic decline (hyperbolic decline with b=1) that assume the wells will produce for 40 years.
A more realistic model would use an exponential terminal decline rate of 11%.
I trust the USGS estimate much more than the paper you cite, another problem with such estimates is they often take results from sweet spots and assume the sweet spots are much larger than is justified.
One can find data at shale profile to do a better analysis, the west virginia university study is not done very well in my opinion.
Thanks for the title
links below
https://www.wvgs.wvnet.edu/utica/playbook/pb_9.aspx
and
https://www.wvgs.wvnet.edu/utica/playbook/index.aspx
SouthLaGeo,
From Jan 2005 to Sept 2021, the average annual growth rate in US natural gas output has been 4.154% per year. If we use that growth rate for future natural gas output growth for US we get cumulative output of 1000 TCF from 2020 to 2039. US output grows from 33.4 TCF in 2020 to 72.4 TCF in 2039. The LNG exports need to come from somewhere and US consumption of natural gas has grown at about 1.8% per year from 2001 to 2019.
The EIA AEO 2021 has dry natural gas cumulative output of 1195 TCF from 2020 to 2050 for the US. For 2020 to 2040 the estimate is 860 TCF. Note that often the EIA estimates are very optimistic especially after 2030 for oil.
The AEO has US dry natural gas output growing by 2.8% per year from 2021 to 2026 and then at the lower rate of 0.6% per year from 2026 to 2050. My expectation is a peak around 2032 followed by decline in output at 3% per year.
Found this
https://certmapper.cr.usgs.gov/data/apps/noga-summary/
See province totals for shale gas where for US the mean estimate is 1600 TCF for undiscovered TRR.
Let’s say 2/3 is economically recoverable, that would give us about 1000 TCF, note that these assessments are from 2000 to 2021 so some of the undiscovered TRR in these assessments would be a part of current reserves plus cumulative production so more analysis would be needed.
Took a look at LNG exports from the US, they have been growing at a 40% annual rate from Oct 2017 to Sept 2021 on average, obviously the rate will slow in the future. In the past 12 months LNG exports were about 3419 BCF, imports of LNG for the past 12 months (Oct 2020- Sept 2021) were only 27 BCF, so net exports of LNG were 3392 BCF, roughly 3.4 TCF.
I don’t expect anyone to care but Aramco inventory is collapsing, all their production is coming out of there, supply will collapse in a few months.
L , backup your statement with a graph or data . It would clear the fog .
Hole in Head
I have a hunch that L is an unwelcome guest on this site that sneaks in every so often.
When the Eurodollar futures curve becomes inverted like it is now. Everybody should pay attention. Global dollar market is telling you bad things are coming. Those who make the loans in the Eurodollar market are telling you bad things are coming.
Last two times it inverted were prior to 2008 and Dec 2018. But there is one big difference between then and now. We have inflation now. Might not be inflation as defined as monetary inflation. But inflation nonetheless and the supply side shocks aren’t going anywhere. FED stepping into save market is a problem. Because if they save it inflation really gets out of control.
This is a huge problem for asset prices. And will also be a problem for those who are betting on higher oil prices.
I’m looking for a WTI dip back into $40’s maybe lower.
And btw if FED hadn’t of stepped in to save the day in late 2018 early 2019. 2008 would have happened all over again
HHH,
Guess you should be shorting oil, but then, you’d be left with only your shorts.
Already did Dennis. I exited trade after a 12% down day. You’d know that if you actually paid any attention. I shorted both oil and US stocks within a week of each other because the technicals were good to do so. And I’m pretty sure I commented on here the exact days I put the trades on. I took profits on the oil trade and left my short on stocks open.
Which you’d also know if you paid any attention at all. Heck Dennis if you got your head out your ass and actually listen to what I’ve been telling you could make way better forecast and charts.
HHH, that was ugly. Have you been drinking?
I agree with John . The last para was uncalled for and out of line . Sarcasm is ok but abuse not . However I think this is a ” one off ” . HHH is a very sane and decent commenters on this blog and contributes a financial angle to oil that most do not have knowledge about . I am sure he will restrain in the future ,
HHH,
Yes I know you made those trades, if you believe your forecast of $40/bo you could make more money if you really believe it.
Not really interested in short term price movements, so when do you expect to see $40/bo oil?
Everything from treasury bonds yields to Eurodollar futures is screaming no growth in the near future and not only that but something bad is brewing. Gold and the dollar are both screaming hey this is contractionary.
Dennis seems to have on his rose colored glasses. Wasn’t trying to be ugly. Was trying to wake Dennis up to reality. Sustainable higher oil prices just aren’t in the cards.
Price of oil is screaming hey this isn’t sustainable. It’s telling you that right now and it’s falling on deaf ears around here.
What were going get is less oil production and lower prices. Because the so called growth we’ve had over last two years was stimulus checks. Those are in rear view now.
Real economy falls of a cliff from here unless more checks are handed out. Which isn’t going to happen. Because of supply side shock inflation.
Watch incomes go down dramatically from here as people went back to a job and now have less income than when staying at home. Even with the tightest labor market we’ve seen in a long time putting upward pressure on wages.
Fact is we need lower interest rates to spur money creation or credit growth. Otherwise markets and prices drop.
HHH,
We will see. If we predict a severe economic down turn all the time, we would eventually be correct. Let’s say we had predicted a negative annual growth rate for World real GDP (using market exchange rates) every year from 1960 to 2020. We would have been correct in 2009 and 2020 and wrong every other year. A success rate of 3%.
Down turns will occur, predicting accurately when they will occur is not very likely.
I will note that when asked when you expect $40/b or less for WTI there was no answer, the future is not a good answer.
HHH , agree with you on all facets including Dennis’s rose colored glasses . 🙂
Hole in head,
Most people expect growth see
https://www.atlantafed.org/-/media/Documents/cqer/researchcq/gdpnow/RealGDPTrackingSlides.pdf
The consensus estimate is 5% for 2021Q4 US economic real GDP growth, the GDPNow model from Atlanta Fed has estimate at over 9%.
As for me, I cannot predict the future, more of a no glasses view (gray and fuzzy). My vision is very poor, I am the guy they made that joke about where the response to being asked to read the 3rd line on the chart at the end of the room is “What chart?”
Comment by Dr Mamdouh G Salameh, International Oil ….>
‘Having done a lot of research and analysis for years about Saudi proven oil reserves, I reached the final conclusion that Saudi reserves couldn’t be more than 55 billion barrels (bb) rather than the 266 bb the Saudi have been claiming for years.
The article was posted in September 2019. Since then SA pumped close to 6 B barrels of crude. I guess that means that SA reserves are now down to 49 B barrels.
Who knows what the actual Saudi reserves are? My guess is around a quarter their official reserves or about 70 billion barrels but I wish the Saudis would simply show their cards.
WTI had a gap open higher this week. There is major support where buyers are around call it $65. Which is why it bounced. Oil bulls are going to try to defend it. But if this gives way. If price closes gap and a heads lower. Look out below.
Dollar looks like it corrected sideways instead of down to clean up some of the over bought price action on daily chart. If it continues on higher into 100.00 range on dollar index we are going to get a continuation of the risk off move we are seeing. And likely lower oil prices.
And I’d say this is more the FED’s hawkish tone to tame inflation than it is virus concerns at moment.
From a pure macro point of view when it comes to the overall picture and where markets and prices are headed. You can’t ignore China.
I still believe they are the domino that takes everybody with them as they fall. They have an internal debt bubble priced in their own currency that is that unprecedented. Evergrande is just tip of iceberg. Local governments within China have 8 trillion dollars of debt liabilities on their balance sheets.
Money or I should say US dollars flow into China two different ways. The obvious is through trade. But the other which is really important is through investment. And the reason those dollars flow to China is because they have higher rates of return. Higher interest rates.
Well when China starts cutting rates towards zero to support this massive internal debt load. Those investment dollars no longer can make the same return. So they not only stop flowing in. They start flowing out.
Which leaves rest of world with less dollars. As China has less dollars to import raw materials with.
And dominos fall. Leading to global economic contraction and low oil prices.
I understand where you are coming from, but I don’t think I’m going to bail. Going to stay in the commodities and ride the wave. I think we will continue to see volatility in oil and grain.
Farmland has really spiked, all over the US best I can tell. Have sat in on some auctions, primarily due to curiosity, but did place a couple unsuccessful bids.
Class A farms in the “Triple I” corn belt are now selling for over $15k per tillable acre. Class B in these regions are many times selling for over $10k per tillable acre. Even dryland on the edge of the desert is high. Same with the land in the cotton and rice areas. And forget the irrigated land in the Western states, obscenely high.
On the flip side, oil assets continue to be depressed, at least the few sales I am aware of.
I have read doom and gloom predictions since I started investing. When I started investing the Dow was below 4,000. I didn’t sell in 2008. Maybe I should now?
The best rate of return I am getting on cash is 0.75%. So my inflation adjusted return on that has been very negative.
If I’d stayed in cash the last 30 years I’d have missed out on a lot. I know this is crazy, but looking back I feel a little bit happy I hung on during the hard times in oil, grain and the stock market. Am still clinging onto the hope of one more big run in oil, so at least we can finish off the plug fund.
Future predictions are almost always wrong. I have no clue what’s going to happen. The only prediction I am willing to make is volatility. Too many computers are at the wheel of trading. But I might even be wrong on that one, lol.
I do like your posts, HHH, even if do not necessarily agree. Keep in mind Dennis readily admits he doesn’t know what the heck is going to happen either. I suspect Dennis is probably a conservative investor, other than he has kicked butt on paper on his TSLA stock. In fact, I have also, through a couple of mutual funds that I have bought and held, and that have gotten tech heavy. That has recently showed as TSLA and others have fallen.
Shallow sand,
I own a couple of shares of Tesla, but most of my portfolio is S&P 500 with a bit of mid cap ETFs, I am mostly in stocks, but not a lot of individual companies mostly broad market ETFs (either S&P 500 or total stock market).
If I were a more aggressive investor I would be long on oil until 2028 to 2030, long term it will be a winning bet. If oil prices were to dip to $60 per barrel or lower in the next few years, it would be a great entry point.
In my view the chance that we will see an annual average WTI price of $40/bo or less between now and 2028 is less than 1%.
As you know I never get oil prices right.
Chart below has annual spot price for WTI, from 2004 to 2021 only one year (2020) had annual oil prices under $40/b in nominal terms. If we did real oil prices in 2020 $, the last time the real WTI annual spot price in 2020 $ was under $40/b was 2002. I agree oil price will be volatile, but the range will be $60 to $120/b in 2020$ with the long term 5 year centered average oil price around $90/bo from 2023 to 2026.
Notice that from 2005 to 2020 10 years had annual oil prices above $60/b and 6 years had annual oil prices below $60/b. I expect oil supply will be short for most of the period from 2022Q3 to 2028Q2 and oil prices are likely to be high as a result.
Short term fluctuations in price (less than several months) are relevant to computer traders only,
not investors or the those in the industry who are making planning decisions.
Does anyone here really give a crap about short term fluctuations in oil price, bit coin or pork bellies?, except perhaps for their personal short term dance.
Personally, I don’t care about anyones short term dance.
Hickory,
For those in the business the monthly average price makes a difference as that is often what serves as the basis for the price they are paid for their output, or that is what was explained to me by shallow sand (and no doubt there are many details I am not aware of). Probably when looking at P/L at years end for taxes the annual price may be good enough to roughly estimate how the year has gone. But month to month changes in oil price are no doubt a headache for cashflow. Last I heard I think shallow sand can live with $65/b, though costs have been rising and may have pushed the “breakeven” oil price up to $70/b at wellhead. By breakeven, I mean an oil price where it is barely worth it to stay in business, you can make a dollar, but things are tight.
I think $75 to $80/b is probably a bit more comfortable, but that’s a guess on my part as I have never produced oil.
Yes.
Business hedging and investment decisions are not made on the [minute or daily or multi-day] timeframes as has become fashionable to speculate about among a few on this site, and which has nothing to do about energy supply/demand issues. Its just chatter.
Up today…lower on Wednesday…
China cuts RRR by 50Bps . So lowering of interest rates begins .
Effects won’t appear over night. They also got aways to go before they reach the lower bound on interest rates. And matter fact mr. market likes it for the short term. Which it should. But long term. As rates get ratcheted down dollars stop going to China in search of yield.
They don’t really have choice though unless they want to watch it unravel now instead of later.
Low oil prices are always nice – for some. The counter argument is that instability in oil investments after your 40 dollar WTI prediction occurs is going to lead to an even further sharp cliff in oil supply than baked into the cake with only sad faces thereafter. So, the question is more; is it wise for the western nations to press oil prices too much down. I really have no idea. Let’s see what happens, but I am skeptical about sub 60 dollar oil prices at this point.
Energy crisis: Will a green transition throw the global economy into recession? | Business Beyond
Energy prices have surged this year as countries and households confront shortages of oil, gas and coal. In this episode of Business Beyond we look at some of the major factors behind the energy crunch, from the role of green policies to Russian gas maneuvering to China. Who is to blame? And how will the crisis impact plans to give up fossil fuels?
Always a mess .
https://www.vanguardngr.com/2021/12/subsidy-hits-n199bn-as-nigeria-records-zero-revenue-from-oil-export/
https://economictimes.indiatimes.com/industry/energy/oil-gas/sudan-owes-ongc-videsh-560-mn-in-unpaid-dues-govt/articleshow/88123110.cms?from=mdr
Latest update for GDP Now from Altanta Fed for real GDP nowcast of seasonally adjusted annual growth rate for 4th Quarter of 2021. The difference between a nowcast and forecast are explained at link below.
https://www.atlantafed.org/cqer/research/gdpnow
Excerpt
The GDPNow model estimate for real GDP growth (seasonally adjusted annual rate) in the fourth quarter of 2021 is 8.6 percent on December 7, down from 9.7 percent on December 1. After the December 1 GDPNow update and subsequent releases from the US Census Bureau, the US Bureau of Economic Analysis, and the Institute for Supply Management, the nowcasts of fourth-quarter real personal consumption expenditures growth and fourth-quarter real gross private domestic investment growth decreased from 9.6 percent and 13.1 percent, respectively, to 8.6 percent and 11.3 percent, respectively, while the nowcast of the contribution of the change in real net exports to fourth-quarter real GDP growth decreased from 0.42 percentage points to 0.36 percentage points.
There is also a chart that shows the GDP Nowcast over time (Oct to Dec) and the Blue chip consensus forecast (about 5% on average with a range of 4% to 6.7%). More information at link above. Next update on Dec 9.
https://www.zerohedge.com/energy/california-addicted-oil-amazon
Blah blah Ecuador. 3rd largest Latin America oil producer. Recently started drilling in a national park to keep a presidential promise to double oil production (currently 450ishK bpd). California the major recipient. Enviro types stomping feet.
Nothing will happen.
Watcher,
… and the Atlantic Mirage is – right this moment, December 7 [Pearl Harbor anniversary for the diminishing few who still care] – discharging a cargo at New Haven, Connecticut of Ultra Low Sulphur fuel oil that came directly from Primorsk, Russia.
This is one of 4 shipments arriving in New York/New Haven that originate at the Primorsk refinery bringing desperately needed (and expensive) fuel to the Northeast.
Just yesterday, the head of New England’s ISO (grid manager), gave an unprecedented announcement (warning?) that blackouts may emerge this winter should cold temperatures appear.
This, while a bicycle ride away from the Berkshires would take one to Susquehannah county, source of some of the cheapest, most abundant gaseous hydrocarbons on the planet.
As Oscar Wyatt said “I hope they are chipping their dogs off the trees”. The incredible wealth lost by Western NY mineral owners due to the fracking regulations is a tragedy. Poor bastards look across the border to all those massive gaswells in PA and cry.
YX,
Yes.
And when I used to try to put some of these hydrocarbon development consequences into Real World examples (i gave up long ago), I would steer people to the online images of the brand new, world class high schools built in tiny Watford City and Williston, North Dakota.
Unencumbered by anxieties of under heated classrooms, replete with amenities such as computer, art, athletic resources by which the kids could enjoy their educational experiences way out in the middle of nowhere, one had the sharp contrast with a middle school in Connecticut (can’t recall the name).
There, the city leaders were reluctantly preparing to dig a hole and emplace a huge underground propane tank – to be restocked for decades by diesel burning trucks – so as to keep the kids warm as a nearby pipe lateral was being denied permits. (Fortunately, the short pipe was eventually built).
When enough people experience – first hand – both the pros and cons of these never-ending arguments, a strong consensus may emerge that will steer future developments.
A few cold, dark, frozen/broken water pipe nights might prompt just such a response from New Englanders as it seems to be on the cusp of doing in the UK/Europe.
Coffeguyzz,
Can’t they ship LNG from Louisiana to boston?
I agree pipelines would make more sense, but building pipelines in the Northeast is a struggle, not sure New York would agree to have a pipeline built from Pennsylvania to Connecticut or Massachusetts.
Dennis,
I just posted a lengthy comment on another site about this and – while absolutely a timely, fascinating topic – I just don’t feel like going on at length again.
Somewhat succinctly…
A temporary waiver of the Jones Act could (and, if things become especially dire, might) be invoked to enable LNG to be loaded at a US terminal and discharged at Everett/Boston.
Practically speaking, lifting from Cove Point would offer better economics/logistics, but the nosebleed costs are already so high, a few million in transport would be inconsequential at this point. (Recent LNG cargoes out of Australia are valued at ~$200 million when, historically, it would be ~ $10 million).
FSRUs have been used at the Northeast Gateway Port – just offshore Boston – the past several years including a then-record breaking sendout in February, 2019. Source of the gas was from Trinidad/Tobago and Russia (Yamal via St. Nazaire. No MSM attention was put on this event).
I would not be surprised if one or two FSRUs have already been contracted, but I have not checked.
So, short answer, it might be possible to have emergency shipment of LNG to New England, but – practically speaking – these ‘crises’ arise and disappear in a matter of days. Pre-positioning of adequate fuel is crucial and, from all public sourcing that I have read, you all are cutting it pretty close.
Might be an interesting winter up your way if temperatures plummet.
The fact that van Welie actually called a press conference to announce/warn what many have long been saying is a bit disconcerting.
Coffeeguyzz,
You can always copy and then paste. or provide a link to your comment.
Dennis, I think I captured the gist of my other comment in the above post.
Actually, much of my other remarks were focused upon the overall energy infrastructure of New England with attention placed on the Everett terminal and Exelon’s ‘holding a financial gun to your heads’ a few years back to keep the LNG terminal operating.
FWIW, throughout much of this morning (Wednesday, Dec. 8), your region has been having electricity supplied at a 3 to 4 times higher rate from coal and oil (!!) versus wind.
At precisely 11:13 AM, local time, wind provided 32 Megawatts while coal and oil (!!) provided 161 Megawatts … over 5 times the wind supply. (Wind actually dropped to 24 Megawatts earlier, an amount barely sufficient to supply a small neighborhood. This, in a region with a population of ~15 million).
The big concern is your generators being able to adequately restock oil and coal as there is an ongoing global scarcity. Natgas, in the absence of piped capacity, would need to be in the form of LNG.
If you become familiar with the ‘workings’ of your fine ISO site, a greater appreciation/knowledge of your local power situation might ensue.
I find this fascinating – while we are experiencing peak weather events, overall NE has been experiencing consistently decreasing overall need for heating (in my industry we seasonally look at heating loads as Heating Degree Days HDD).
https://www.epa.gov/climate-indicators/climate-change-indicators-heating-and-cooling-degree-days
Are the limitations increased population / infrastructure problems?
This national data presented shows that beginning roughly in 1980 the lower 48 has had mild increase in cooling requirement and mild decrease in heating requirement.
This corresponds well with the early phase of global warming we have entered. and is therefore an expected result.
The trend will continue in the absence of a mass volcanic or geoengineering event.
You can see the same trend in “Length of Growing Season”- https://www.epa.gov/climate-indicators/climate-change-indicators-length-growing-season
Aramco CEO: Rushed Energy Transition Could Spark Social Unrest
“I understand that publicly admitting that oil and gas will play an essential and significant role during the transition and beyond will be hard for some,” Amin Nasser said as quoted by the Financial Times.
from the article-
“A rushed transition into renewable energy would cause spiraling inflation and social unrest, the chief executive of Aramco warned at the World Petroleum Congress in Texas this week, noting that investments in oil and gas needed to continue in order to avoid such a scenario.”
There certainly is truth in that- if fossil fuel energy supply falls off before adjustments/replacements are in place.
And that is exactly the path we are currently on since most of the world is sleep-walking into the scenario of depletion.
But realize that there is an additional truth to be acknowledged (even more so)-
If the world doesn’t dramatically escalate the deployment of fossil fuel alternatives,
then “spiraling inflation and social unrest” are guaranteed by the scenario of depletion without energy replacements.
The hard conclusion is that we need to travel both paths at the same time, meaning that we will need to spend much more money on energy to avoid shortfall. That includes brisk capital spending on fossil fuel supply, while at the same time increasing alternative energies deployment ten-fold plus. Traveling on either path with a small donkey rather than a freight train will guarantee failure- and thus severe disruption.
This is Tom Murphy’s Energy Trap. Transition will not ease energy costs in the short term, rather FF demand (and price) will increase due to transition related activity. We should expect strong pushback to transition for that reason, much more than we’ve seen so far.
“We should expect strong pushback to transition for that reason, much more than we’ve seen so far.”
And if so (pushback limits alternatives deployment), then the shortfall of energy supply later in this decade will be even worse. And escalating.
The EIA’s Short-Term Energy Outlook came out yesterday. They are a bit optimistic I would think.
Ron
I also take out the US because their liquids are also growing. In the attached chart November 2019 and December 2022 are essentially the same. It seems it is all about the US.
Ovi, the STEO has total Non-OPEC liquids up 3.96 million barrels per day between September 2021 and December 2022. Virtually all that was just five nations with over half being the US alone. The below chart is Non-OPEC Total Liquids increase between Sep. 2021 and Dec. 2022 in million barrels per day.
Ron
That is why I removed the US from the chart I posted.
Tomorrow afternoon I will post Non-OPEC and World C + C charts in the Non-OPEC update.
One thing to keep in mind is that this increase includes NGL and C plus C, this is not C plus C alone. Also there is no change in trend on those charts, just a continuation of the trend from July 2020 to July 2021 over the July 2021 to Oct 2022.
Ron,
Based on the trend, you are correct, the trend over July 2020 to Aug 2021 for US total liquids output is about 859 kb/d increase each year, over the next 16 months that would be an increase of 1145 kb/d, far short of the 2000 kb/d ex[ected on the STEO. In this case we agree, the STEO is quite optimistic.
I meant to say overly optimistic but somehow left out the “overly”. Not a problem though as you now recognize their “overly” wild expectations. 😆
Ron,
The STEO is often too optimistic.
Ron,
If we look at crude plus NGL plus renewables and oxygenates from July 2021 to Dec 2022, the increase is only 1.31 Mb/d. From June 2020 to July 2021 the annual rate of increase was 839 kb/d, from July 2021 to Dec 2022 is 18 months so at the annual rate of increase over the past 14 months we would see an increase of 1.26 Mb/d. So on re-evaluation the STEO estimate looks reasonable for crude plus condensate plus NGL plus renewables and oxygenates (basically all liquids except refinery gain). I exclude refinery gain because a portion of these is the result of importing heavy grades of crude and also because the extra “barrels” disappear if we do the supply in energy terms (Exajoules, BTU, or barrels of oil equivalent).
Ron,
Realized you were using international tab of STEO, using that we get an annual trend for US of 1.36 Mb/d per year increase from June 2020 to July 2021, that would be a 2.04 Mb/d increase from July 2021 to Dec 2022, if the trend continues. The STEO has US output increasing by 1.51Mb/d over the July 2021 to Dec 2022 period. So the STEO seems reasonable for the US and perhaps for the rest of non-OPEC as well.
The below article is way too long to post all of it and way too good to miss. If you really want to know what is going on in the shale patch and why the EIA seems not to have a clue, you must read this article.
Has The EIA Massively Overestimated The Potential Of U.S. Shale?
A new report from Earth Scientist David Hughes seriously undermines rosy long-term forecasts made by the U.S. Energy Information Administration (EIA) for U.S. oil and natural gas from shale deposits.
Of the 13 major plays he evaluated, Hughes rates the EIA’s production forecast for five as “moderately optimistic,” five as “highly optimistic,” and three as “extremely optimistic.”
Saturation of sweet spots in key shale plays may lead to an irreversible production decline.
Ron,
Took a quick look at AEO 2021 tight oil estimate. From Jan 2000 to Dec 2050 cumulative output of tight oil is 120 Gb, but tight oil output is quite high in 2050 for this scenario (9490 kb/d). If we assume output declines linearly from 2050 to 2060 to zero output in 2060 that adds about 17 Gb of output so the scenario implies at least 137 Gb.
Peak output is in 2049 at 9.58 Mb/d. For comparison my most recent scenario has a URR of 69 Gb with tight oil output falling to zero in Dec 2051 and centered 12 month tight oil output reaching zero in June 2052. Output for my tight oil scenario in 2050 is 6 kb/d (or about 1580 times lower than the AEO 2021 reference scenario. My URR is roughly half as large as the EIA’s AEO 2021.
In chart below my scenario is indicated by DC.
I would call the AEO 2021 scenario wildly optimistic.
Dennis, did you read the article I linked above? Do you think David Hughes would agree with your opinion that shale oil will peak around 2026-2027? And that the shale patch would still be producing 8 million barrels per day in 2030?
I have trouble agreeing with even your pessimistic scenario.
Ron , not his fault . It is them rose colored glasses . 🙂
Ron,
I did not pay $20 to read the report, in the executive summary he does not give projections so I cannot answer your question. Note that all of the criticicisms that hughes makes about the EIA projection I agree with, and all of those are addressed in my scenario.
I will point out that every scenario I have ever created you have said is wildly optimistic and many of those scenarios have proven in retrospect to have been lower than actual output.
We will see how accurate my guess proves, much will depend on the price of oil, the scenario used has oil prices remaining at $70/bo until 2035. I should probably revise the scenario to have oil prices starting to decrease by 2030 as I expect by this time we will see enough electric transport that oil demand starts falling faster than oil supply and oil prices may crash.
In any case the point was to show that my scenario is very different from the EIA scenario especially after 2028, you are probably correct that my scenario will be wrong, there are an infinite number of possiblities. Perhaps you can show us the correct scenario? What do you think tight oil output will be in 2025 and 2030?
Yes I read the article, there is no mention of what Hughes expects output to be. He focuses on resources and that the EIA estimate is too high, I agree with that assessment.
Ron in chart below I have the price scenario used for Bakken, Eagle Ford, Niobrara, and Other tight oil scenarios.
Permian uses a slightly different oil price scenario ($75/b max decreasing after 2028)
Permian price scenario in chart below.
This is what I have been saying.
IMF isn’t expecting China’s real estate bubble to implode like Japan’s did. Not in their global GDP models.
Even with all the years of underinvestment in oil. Economy still needs to be doing well for higher oil prices to stick.
Everything that China will have to do in order to stave off complete economic collapse will be negative for their currency. And dollar positive.
HHH , just thinking . What about the Yuan peg to the USD ? I think it is now at the lowest point of vulnerability .
When you peg your currency to another currency your adopting their monetary policy as well. China needs to devalue. But FED is moving towards tightening monetary policy and stronger dollar to tame inflation. So this isn’t inline with what China’s needs to handle their mountain of a debt bubble they have. Banking sector is about $45 trillion. 30% or more of total loans are non preforming. And they got $2 trillion in Reserves that actually matter which are the US treasuries they have.
China’s currency is appreciating against all major currencies. When your a export driven economy that isn’t good.
Right now China is being squeezed between high debt load and a strong currency. Only way out is major devaluation. It’s coming.
Are there any bigger experts than Halliburton ? Let me know when you discover them .
https://www.reuters.com/business/energy/halliburton-says-world-is-entering-period-oil-scarcity-2021-12-06/
A new thread on Non-OPEC oil production has been posted.
https://peakoilbarrel.com/non-opec-oil-production-drops-in-august/
A new thread for Non-Petroleum comments has been posted.
https://peakoilbarrel.com/open-thread-non-petroleum-december-9/