A guest post by Ovi
Each month the EIA produces four reports which project oil output for the US and the World. The Short Term Energy Outlook (STEO) forecasts oil output for a period of 12 to 24 months into the future for US and World oil production. A second report, the Drilling Productivity Report (DPR) forecasts the combined production for conventional and tight oil in the main tight oil basins, four months ahead of the EIA monthly report. Their third report, Light Tight Oil (LTO), reports on only the tight oil produced in seven tight oil basins and a few smaller ones. A fourth and final outlook is the Monthly Energy Review (MER) that forecasts US output two months past the official US production numbers, for this report that will be October and November. Due to technical issues at the EIA, the LTO report and the MER were not available at press time.
Production numbers/charts for May for four countries obtained from their official sites are provided below.
Normally the Outlooks report appears at the end of the monthly US report. For this month it has been posted separately and early.
1) Short Term Energy Outlook
The June STEO provides projections for the next 21 months, starting with April 2022 to December 2023, for US C + C and other countries.
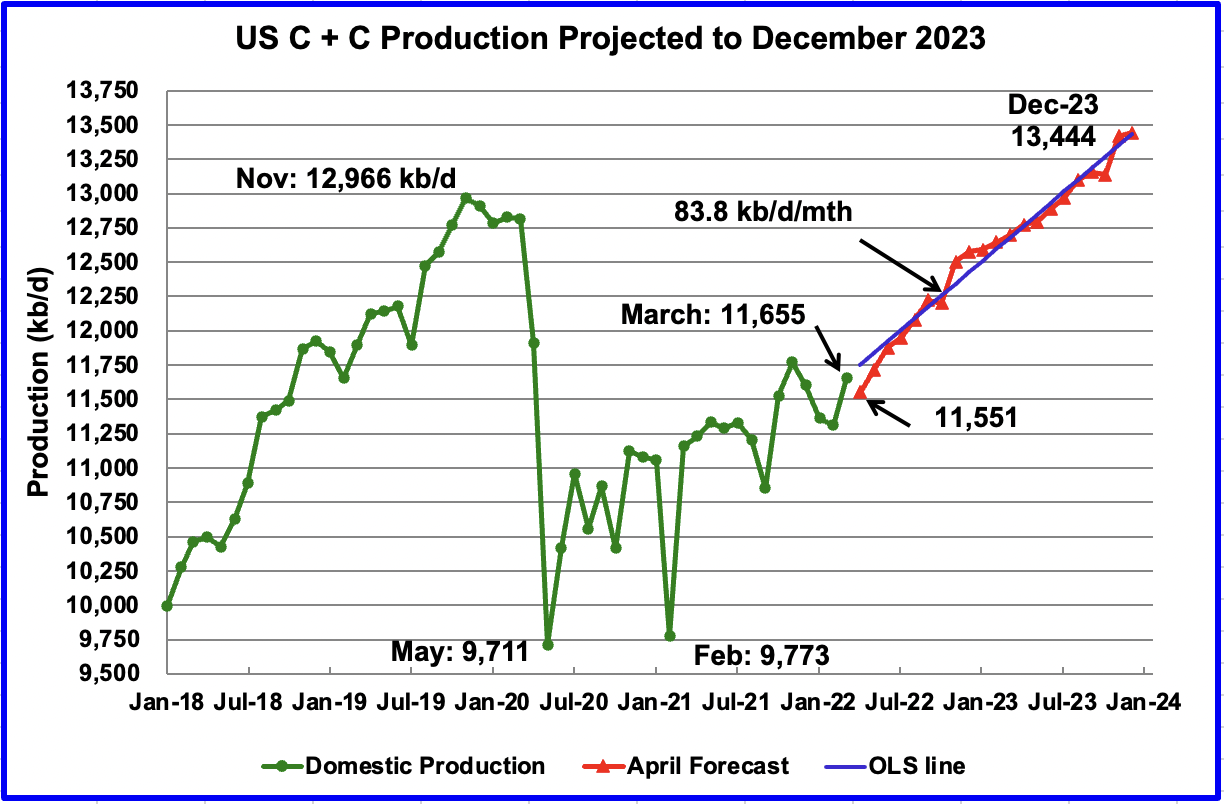
The June 2022 STEO has revised downward its projected US oil output from May 2022 to Q3-23. However Q4-23 has been revised up from the previous May 2022 STEO. In December 2023 output is expected to reach 13,444 kb/d, 160 kb/d higher than reported in the May report
Using only the projected data from May 2022 to December 2023 to fit an OLS line, the STEO is forecasting production will increase at an average rate of 83.8 kb/d/mth, much higher than the average rate of 76.1 kb/d/mth estimated in the May report. If the December 2023 output is achieved, it will be 478 kb/d higher than the November 2019 record. The monthly rate of 83.8 kb/d translates into a yearily increase of more than 1,000 kb/d.
Note that the STEO is projecting a drop in April, which may be associated with North Dakota’s April production drop.
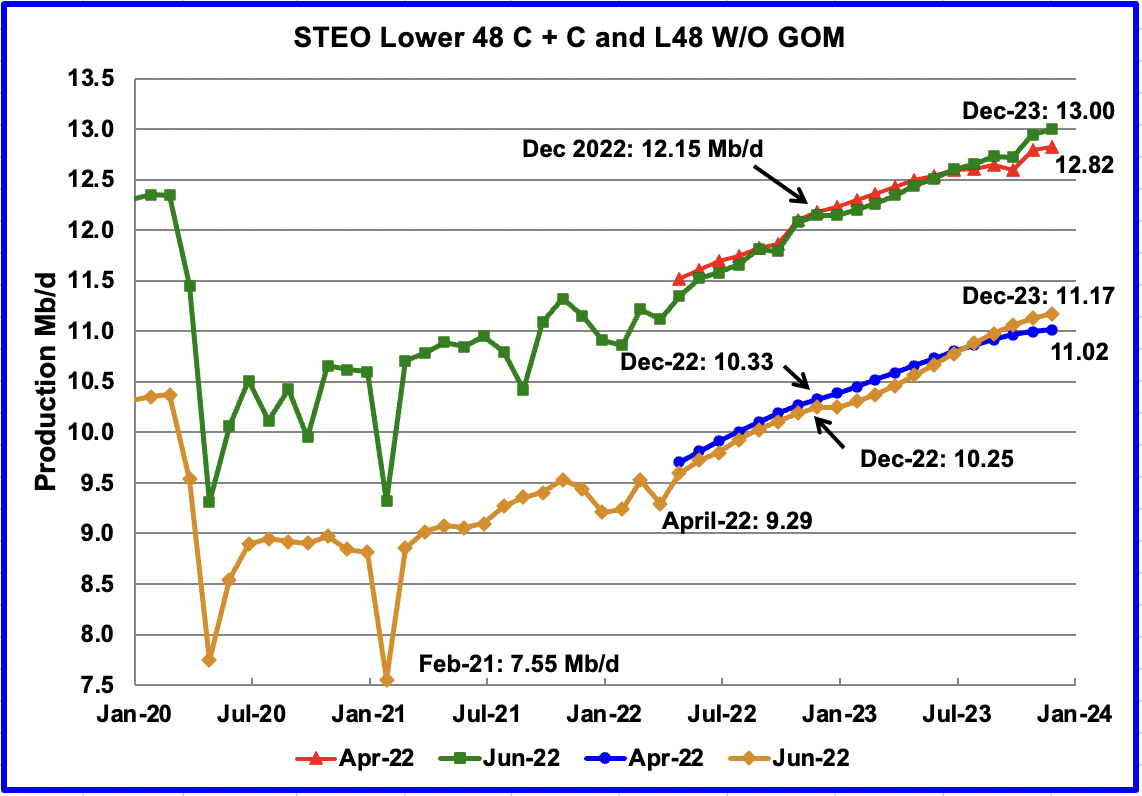
This chart compares the STEO forecast from the April report with the current June report to better illustrate how the output forecast for June 2022 changed. For the Lower 48, the December 2023 output has been revised up by 180 kb/d to 13.00 Mb/d. For most of 2022 and 2023, production was revised slightly closer to the April estimate. However over the last 4 months of 2023 production is projected to be higher.
The June output projection for the Onshore L48 states has also been revised down from the April forecast except for the last three months of 2023 which are higher. For December 2023, the output is increased by 150 kb/d to 11.17 Mb/d.
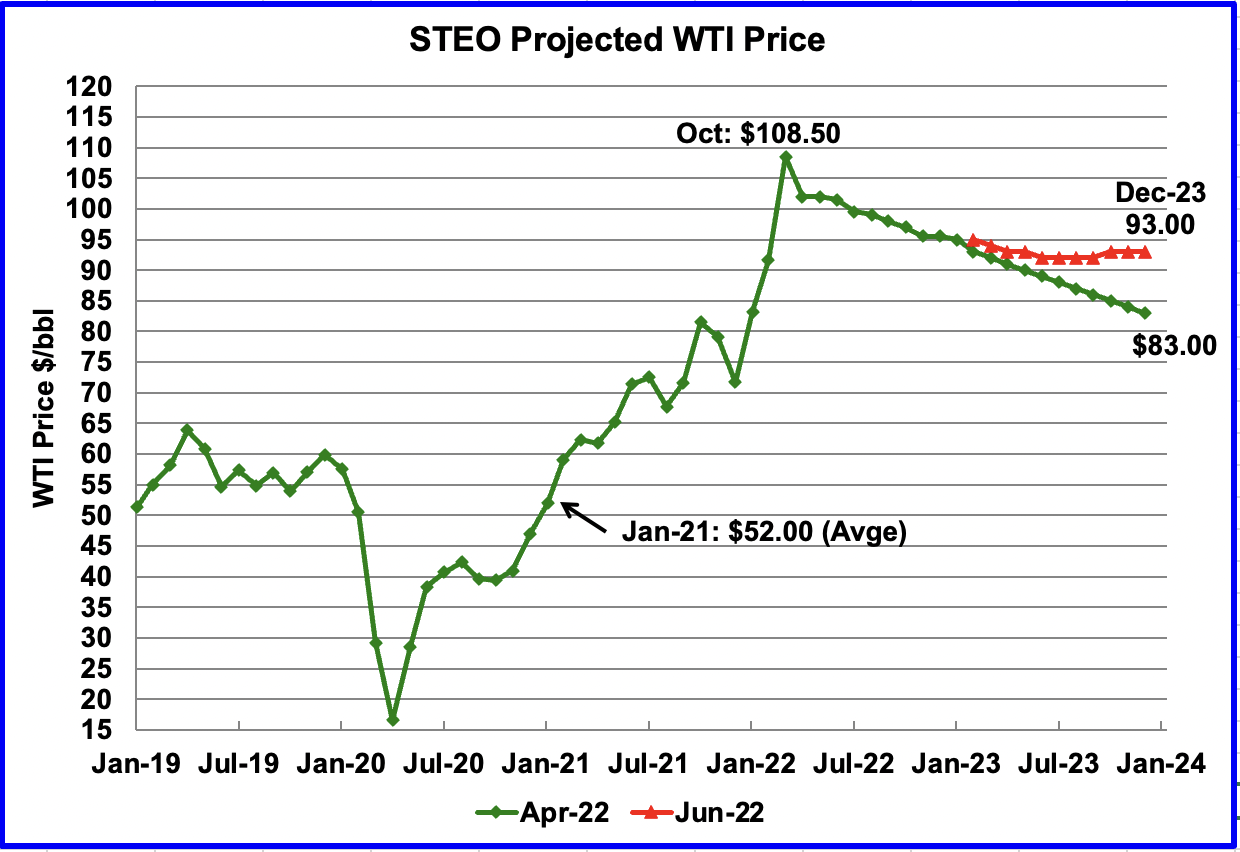
The June 2022 STEO oil price forecast continues to show a steady decline from the EIA’s new March peak of $108.50/bbl to $93/bbl in December 2023. Essentially the EIA is continuing to forecast that the only direction for the price of WTI going forward is down to $93/bbl. However what is different with their latest forecast is that the price of oil stabilizes in the $93/b area during the later half of 2023.
The June STEO price forecast was the same as May even though the July contract at the publishing time was over $115/b. The average July STEO price for WTI is $99.50/b.
The August WTI contract settled at $107.62 on June 24, $8.62/b higher than the EIA’s forecast average price of $99.00/bbl for the August contract.
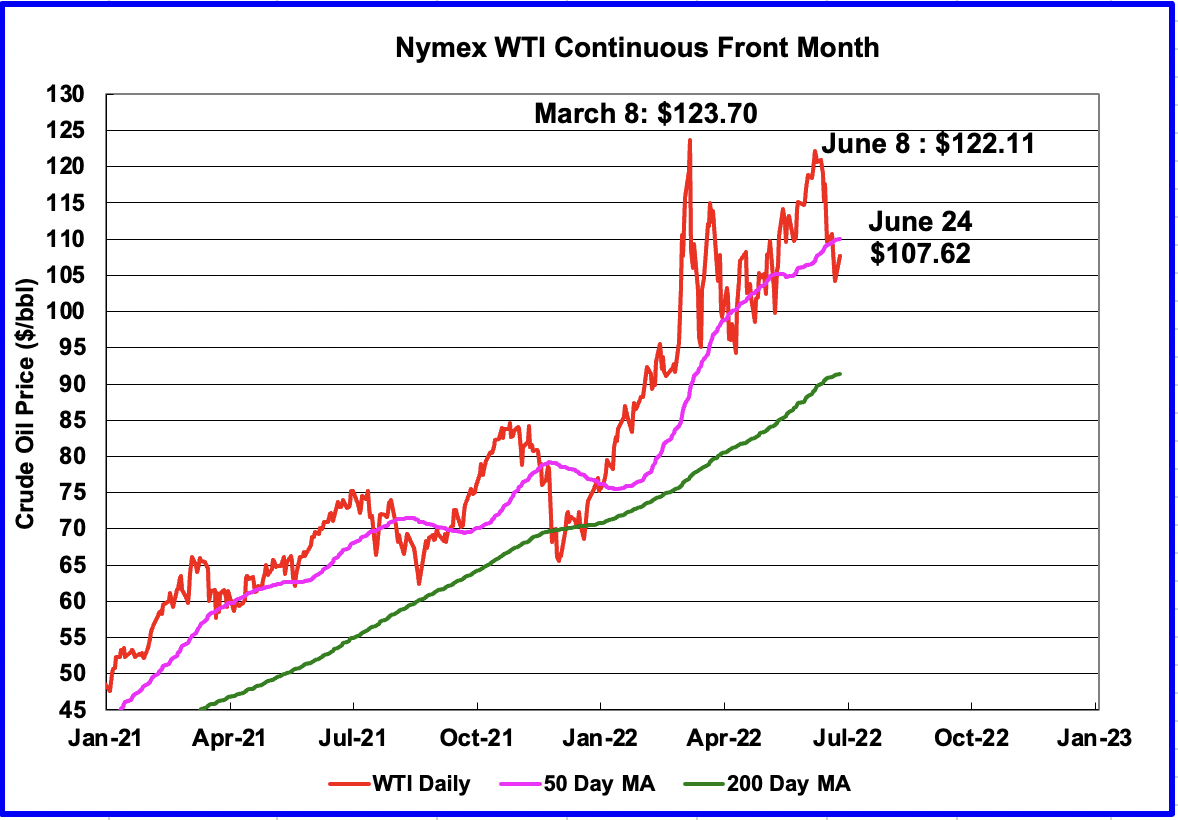
WTI on June 24 settled below the the 50 day moving average. The rapid decline from the June 8 high of $122.11/b was due to recession concerns and possible higher Russian production than anticipated.
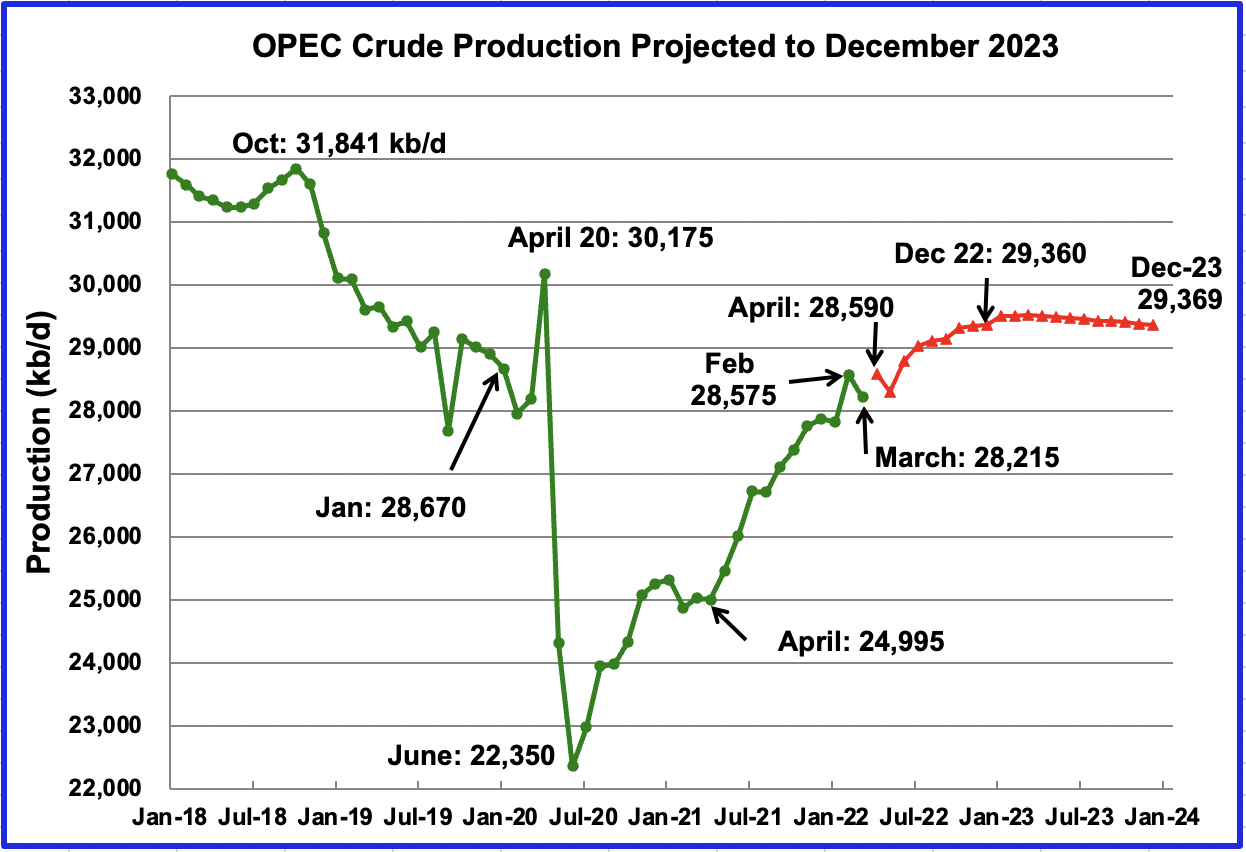
This chart shows the STEO’s June forecast for OPEC crude output from April 2022 to December 2023. OPEC’s output is projected to increase from April 2022 to December 2022 by 770 kb/d to 29,360 kb/d. After December 2022, production remains essentially flat at close to 29,365 kb/d out to December 2023.
The June report decreased OPEC output for December 2022 by 124 kb/d. In parallel the December 2023 output was decreased by 92 kb/d.
For May 2022, the June STEO forecasted OPEC production to be 28,295 kb/d, lower than April’s 28,590 kb/d. Actual May production as reported by OPEC was 28,508 kb/d. OPEC’s May production was lower than April as forecast by the STEO.
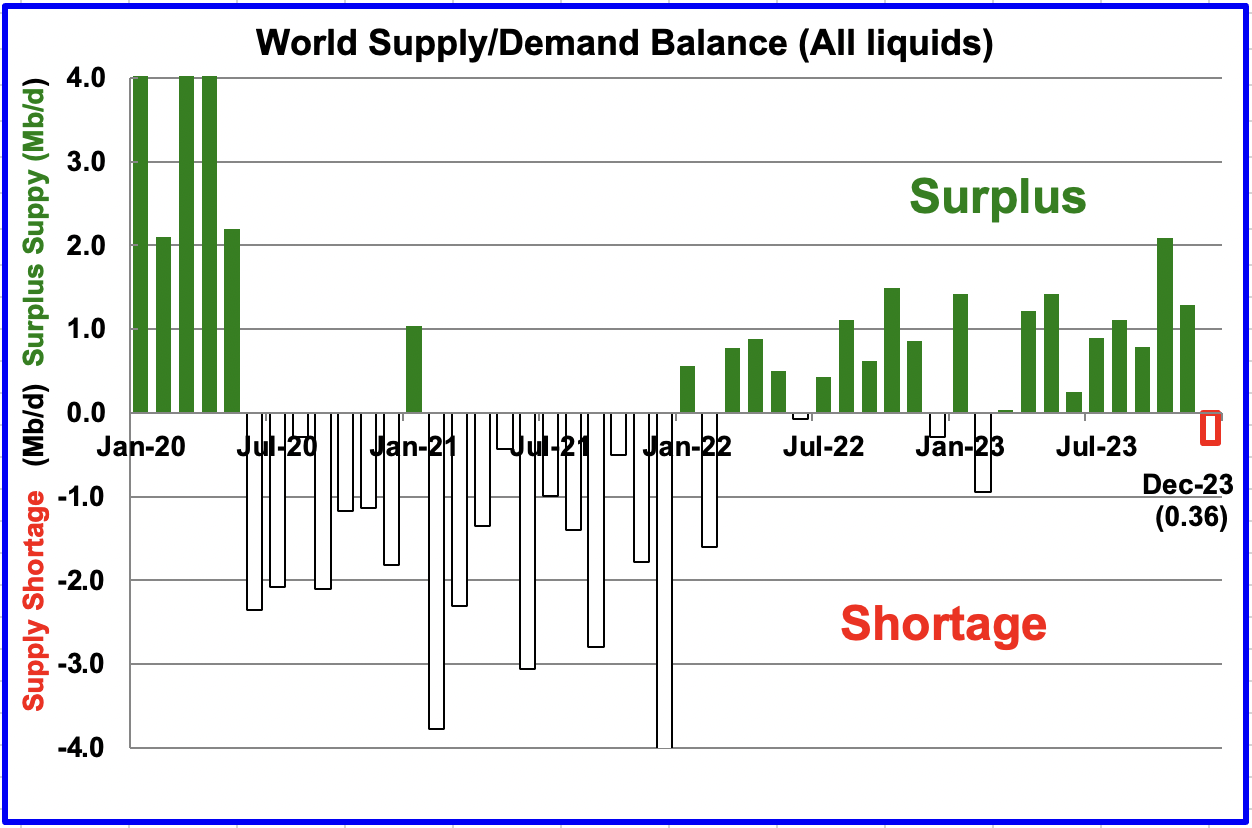
This chart shows the historical world supply/demand balance up to April 2022 and after that, the EIA’s forecast out to December 2023.
From May 2022 to December 2023, the STEO is forecasting an average monthly surplus of close to 693 kb/d up from 167 kb/d in the previous report. The sanctions on Russian oil, increased prices and reduced future demand may account for the increase to this month’s surplus forecast.
2) Drilling Productivity Report
The Drilling Productivity Report (DPR) uses recent data on the total number of drilling rigs in operation along with estimates of drilling productivity and estimated changes in production from existing oil wells to provide estimated changes in oil production for the principal tight oil regions. The June DPR forecasts production to July 2022 and the following charts are updated to July 2022.
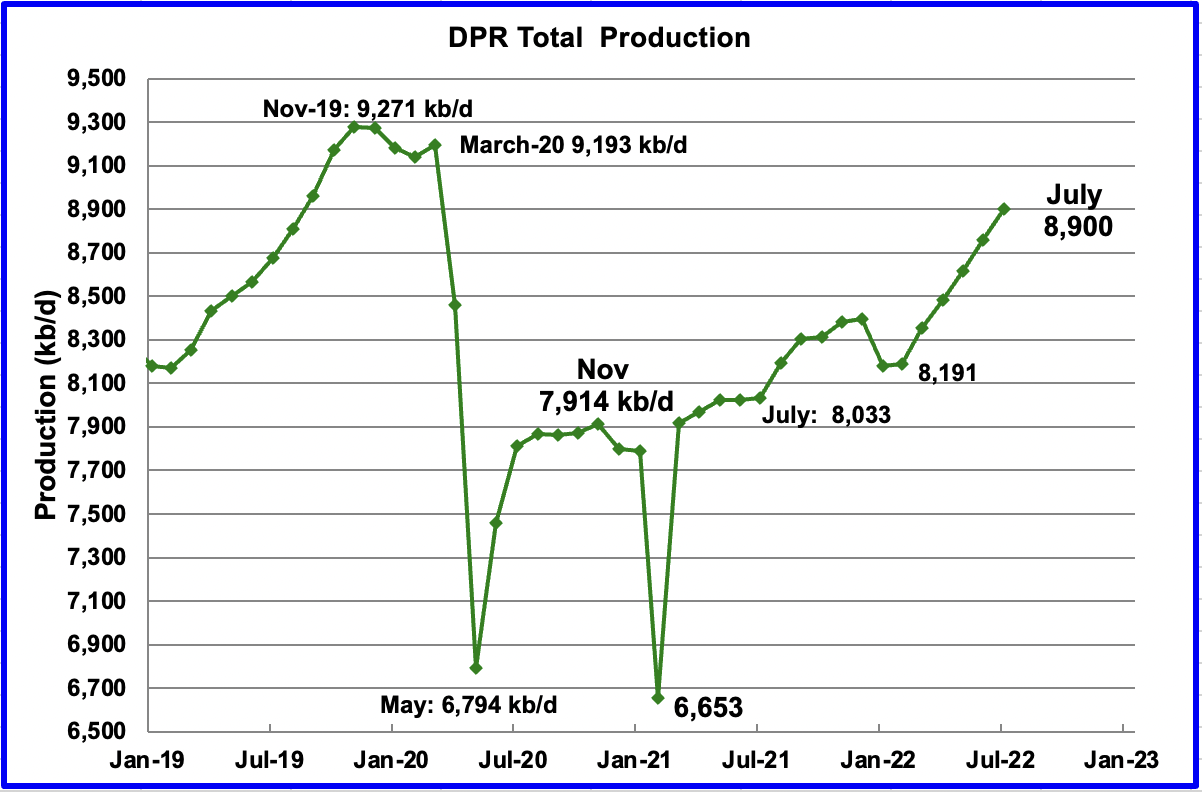
Above is the total oil production projected to July 2022 for the 7 DPR basins that the EIA tracks. Note that DPR production includes both LTO oil and oil from conventional wells.
The DPR is projecting that oil output for July 2022 will increase by 143 kb/d to 8,900 kb/d. From February’s output of 8,191 kb/d to July 2022, output in the DPR basins is forecast to increase by 709 kb/d or by an average of 141.8 kb/d/mth. Note that this monthly production rate is much higher than the STEO rate of 83.8 kb/d projected in the STEO section above.
It is difficult to asses what is really happening in the near term in the DPR basins since significant revisions are made to the previous few months. For Instance, North Dakota has now reported a production drop of close to 220 kb/d in April. That drop does not show up in this projection. This raises the question of from where does the STEO get their information to make these projections?
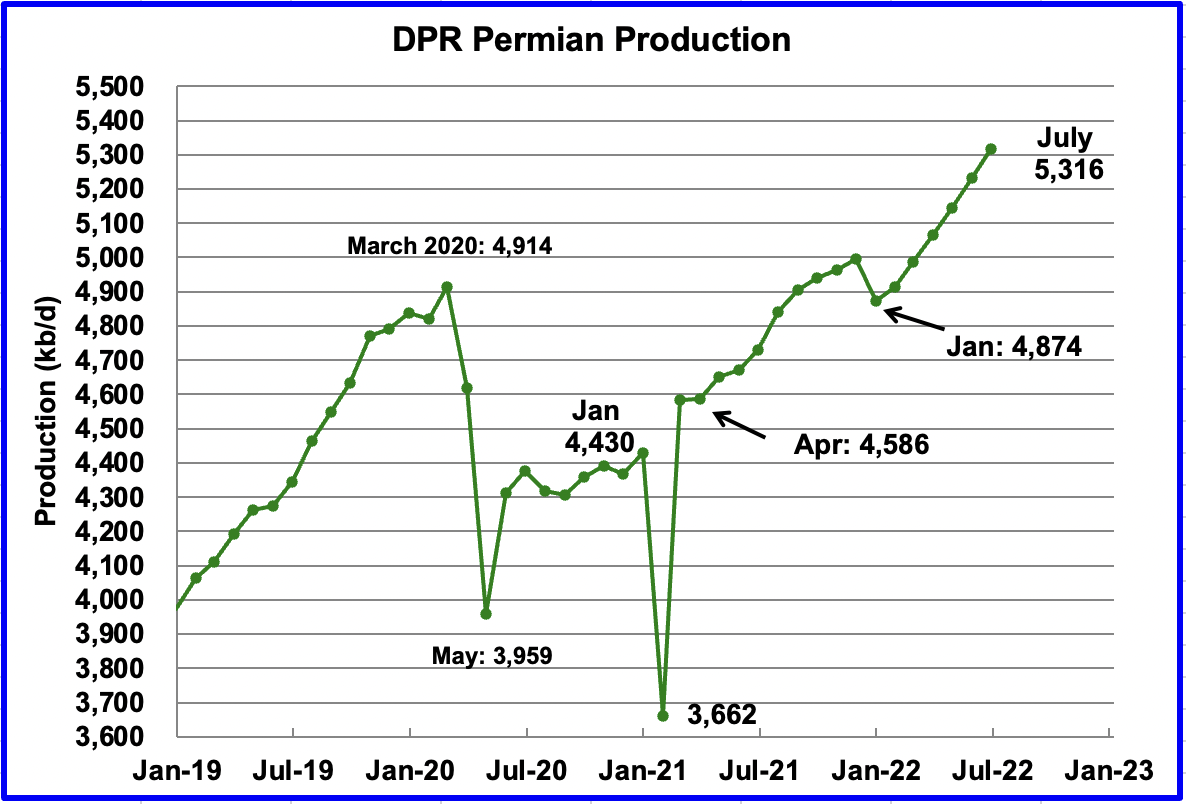
Permian output exceeded 5,000 kb/d in April 2022 and continues to increase. In July, production is expected to increase by 84 kb/d to a new high of 5,316 kb/d. From January to July, production is forecast to increase by 442 kb/d or at an average rate of 73.7 kb/d/mth. If the Permian were part of OPEC, at 5,316 kb/d it would be the second largest producer after Saudi Arabia.
During May, 399 wells were drilled and 436 were completed in the Permian. The completed wells added 358 kb/d to May’s output for an average of 821 kb/d/well. The overall decline was 278 kb/d which resulted in a net increase for Permian output of 80 kb/d. Of the 436 completed wells, 339 were required to offset the decline. It is the completion of the additional 97 DUCs, over and above the drilled wells that accounts for the increase in the production in the Permian.
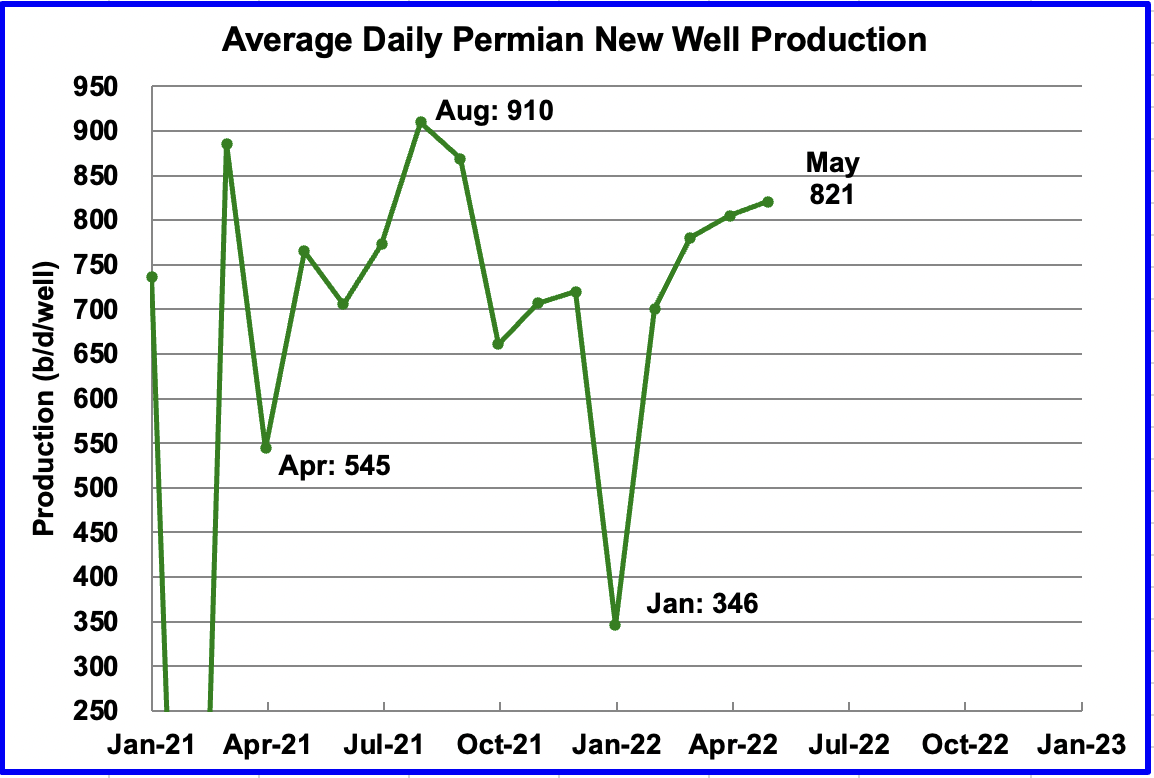
This chart shows the daily production from the average first month Permian well tracked on a monthly basis. The daily output for new Permian wells was divided by the number of completed wells, as reported in the DPR and DUC reports. Note this chart is two months behind the DPR production charts.
The recent average first month output continues to be close to 800 kb/d. May’s average output was 821 b/d/well. January dropped due to bad weather in Texas.
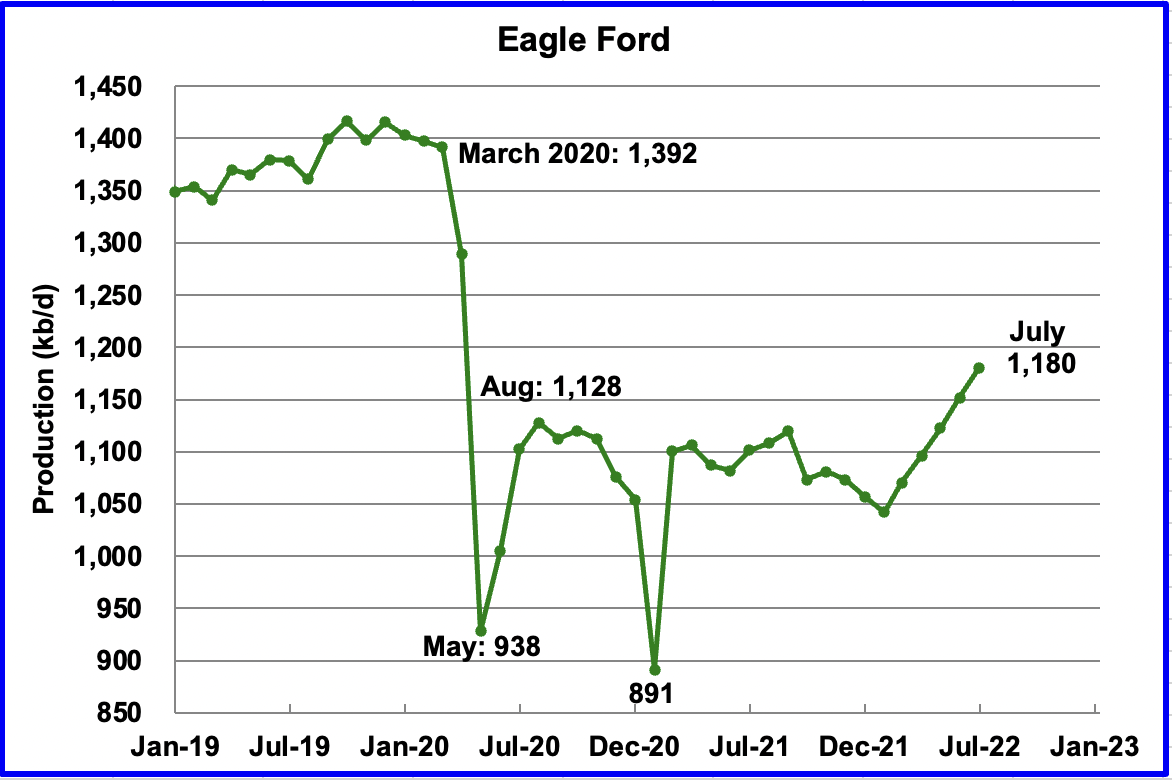
Output in the Eagle Ford basin has been showing an increasing trend since March 2022. For July, output is expected to increase by 28 kb/d to 1,180 kb/d.
Attached is a story on “How One Eagle Ford Shale Producer Illustrates The New Model For Success“
“The days of an active rig count of 2,000+ in North America generating oil and natural gas drilling and fracking booms in half a dozen major shale plays across a dozen states are gone, at least for the foreseeable future. Despite global demand for more oil and gas, much stronger commodity prices and the sudden new interest from the Biden administration for more domestic energy production, the focus of corporate independent producers like Ranger Oil is on performance metrics like free cash flow and rewarding investors with higher returns.”
“We have a share repurchase program of $100 million that starts in the 2ndquarter. Starting in the 3rd quarter we’re going to implement an annual dividend of 25 cents per share, we’ll do that quarterly at 6.25 cents per share.”
“One thing Henke and his team will not be doing with that free cash flow is implementing major increases in the company’s drilling program. “We haven’t had shareholders on our doorstep demanding we grow our production and out-spend our cash flow like the industry did for many years,” he told me. “That’s certainly not what is being rewarded in the market now.”
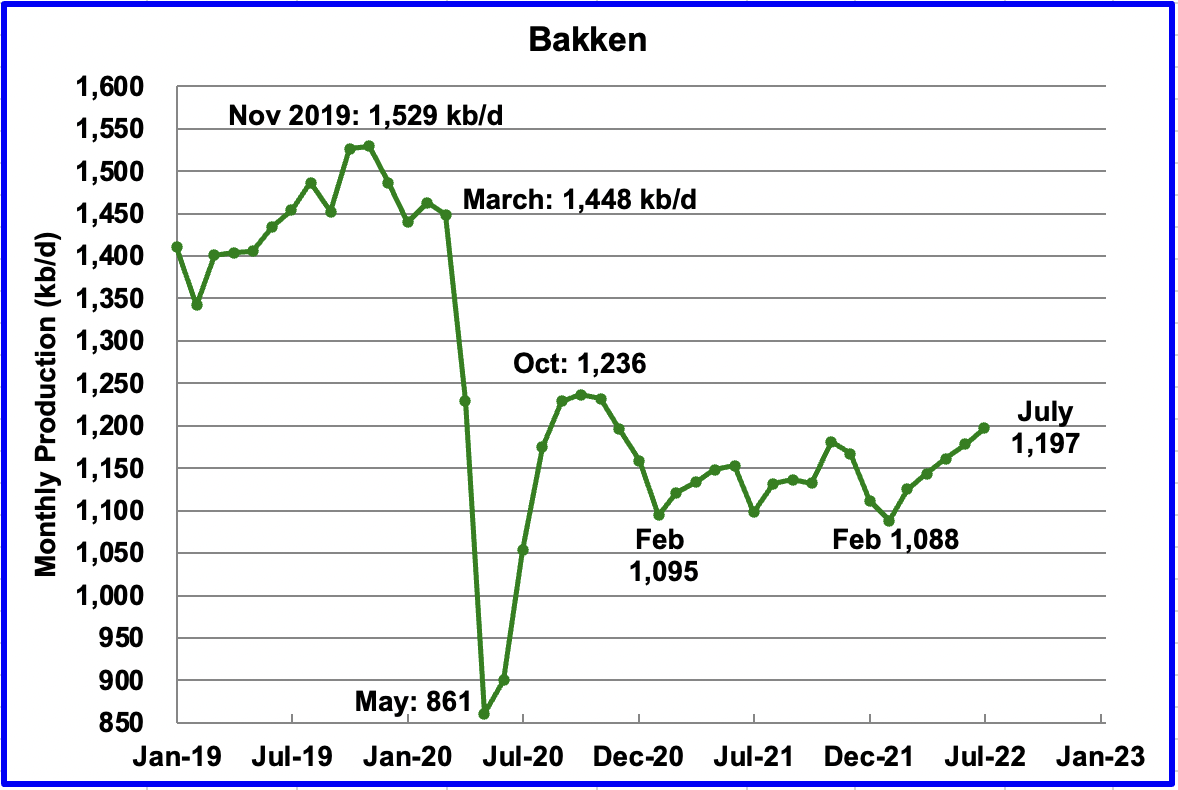
The DPR forecasts Bakken output in July to be 1,197 kb/d an increase of 19 kb/d from June.
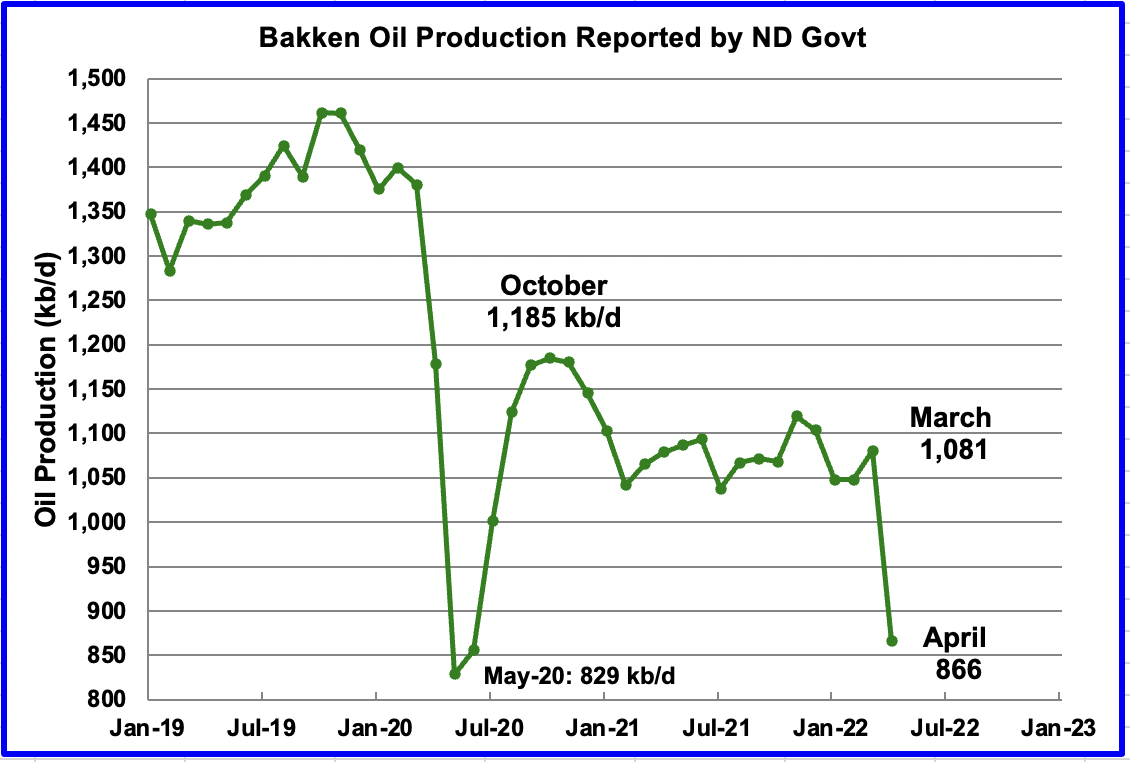
This is the Bakken output as reported by the North Dakota government. Note the 215 kb/d drop in April does not show up in the DPR Bakken chart above.
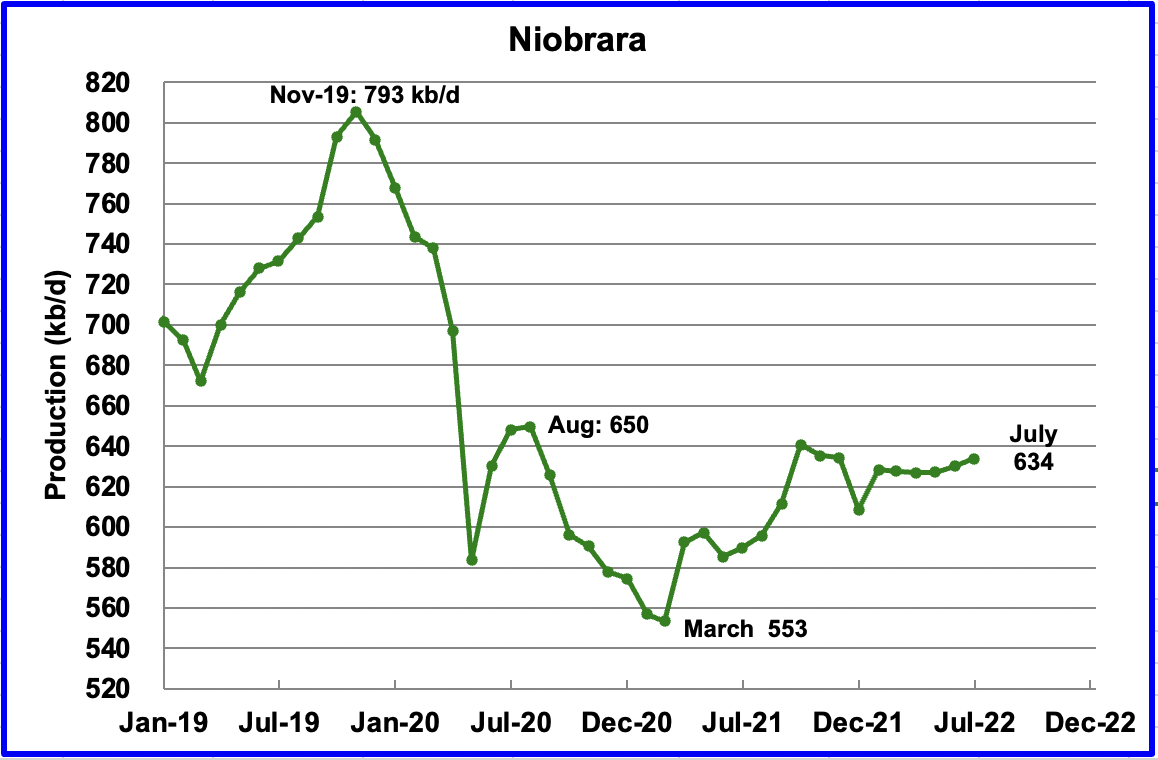
Output in the Niobrara is growing slowly. July output increased by 4 kb/d to 634 kb/d.
DUCs and Drilled Wells
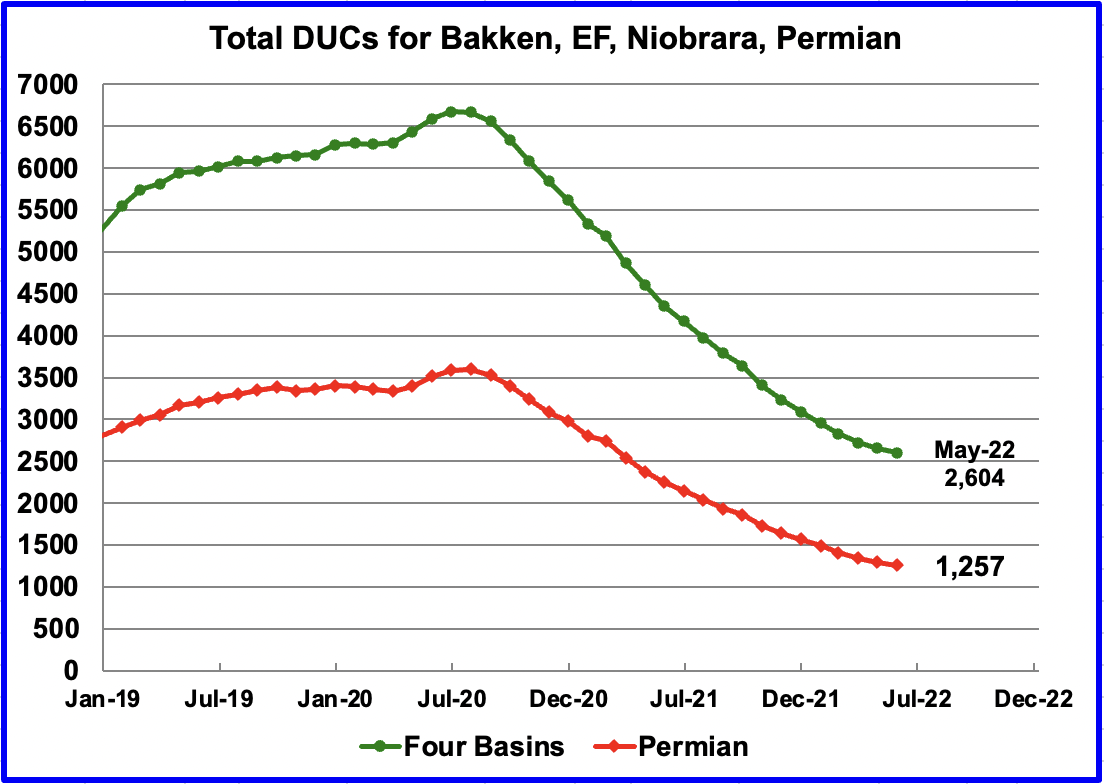
The number of DUCs available for completion in the Permian and the four major DPR oil basins has continued to fall every month since July 2020. Prior to July more wells were drilled than were completed.
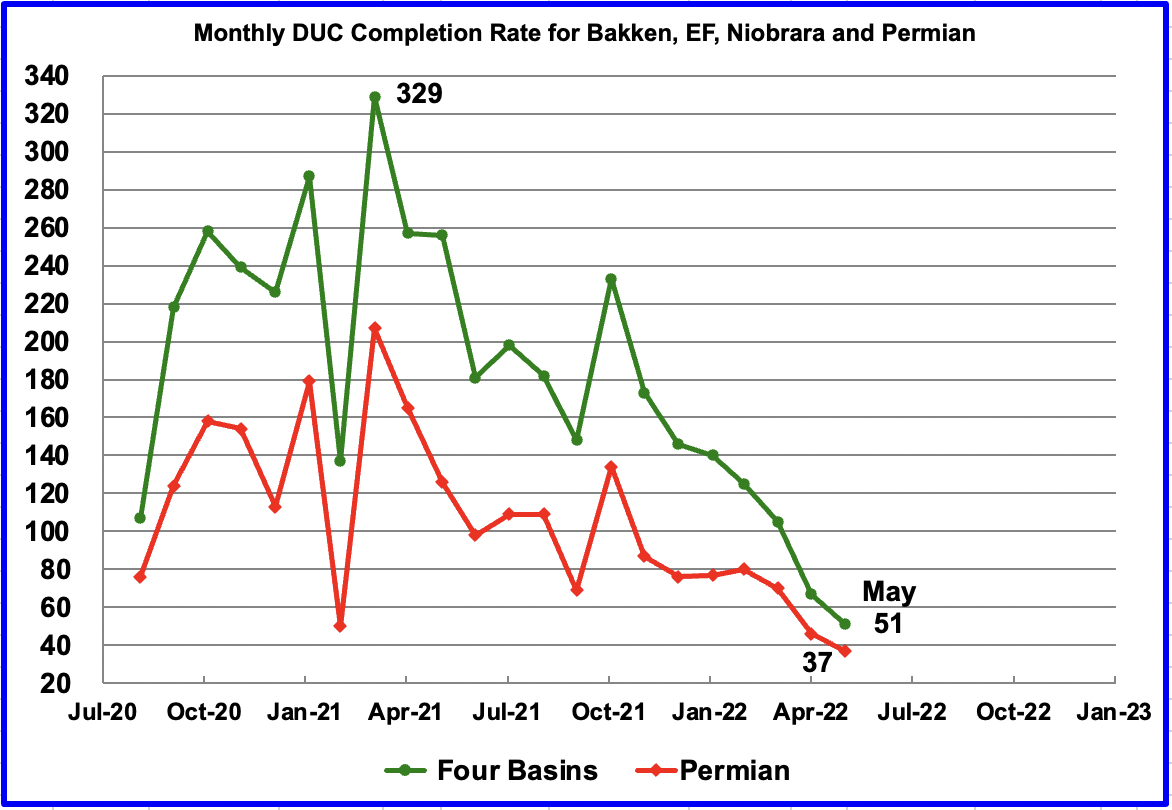
In these four primarily oil basins, the monthly completion rate of DUCs started to slow after peaking in March 2021 at 329. In May 2022, 51 DUCs were completed, 16 fewer than in April. Similarly the monthly completion rate for DUCs in the Permian continues to fall. It dropped from 46 in April to 37 in May. Is this an indiction that the remaining DUCs are getting less economic.
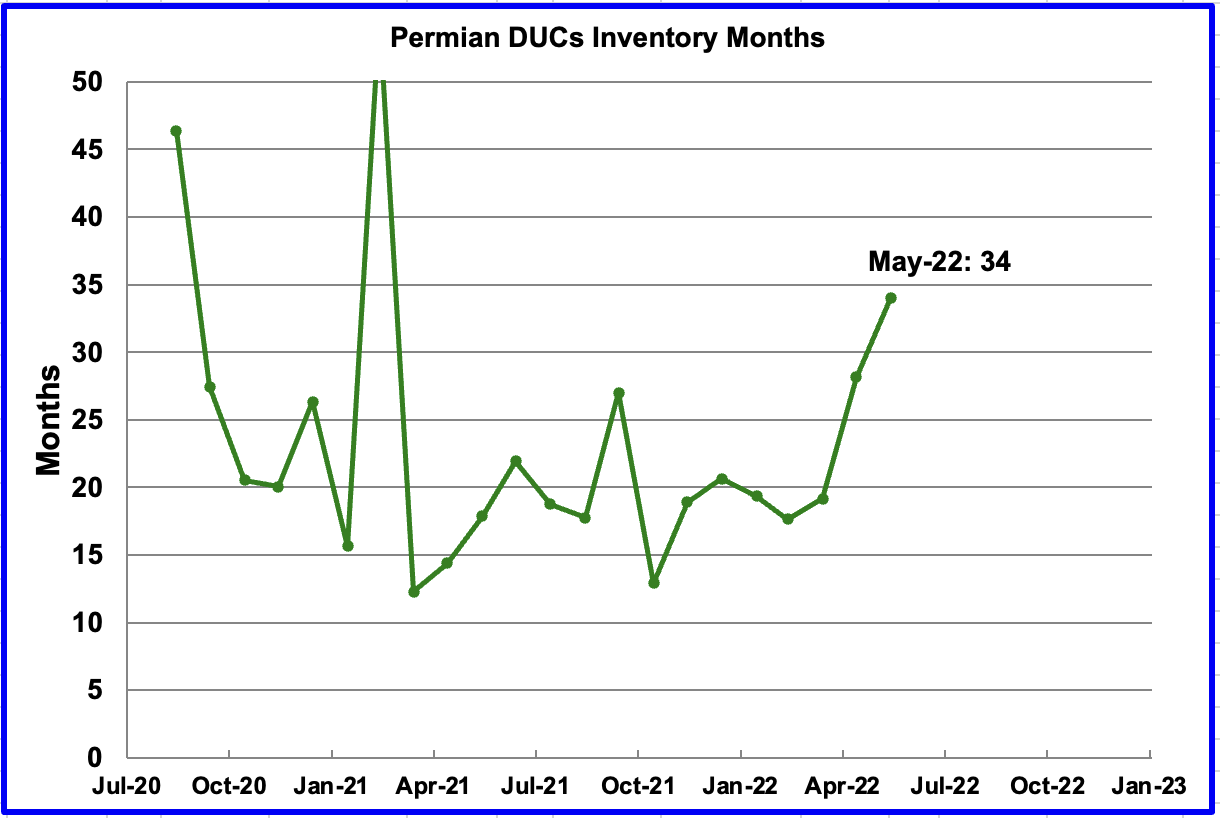
If Permian DUC’s were to be completed at the latest rate of 37 DUCs/mth, that converts into 34 months of DUC inventory, assuming the remaining 1,257 are all commercially viable. The increase in DUC inventory months is due to the slowing rate of completing DUCs.
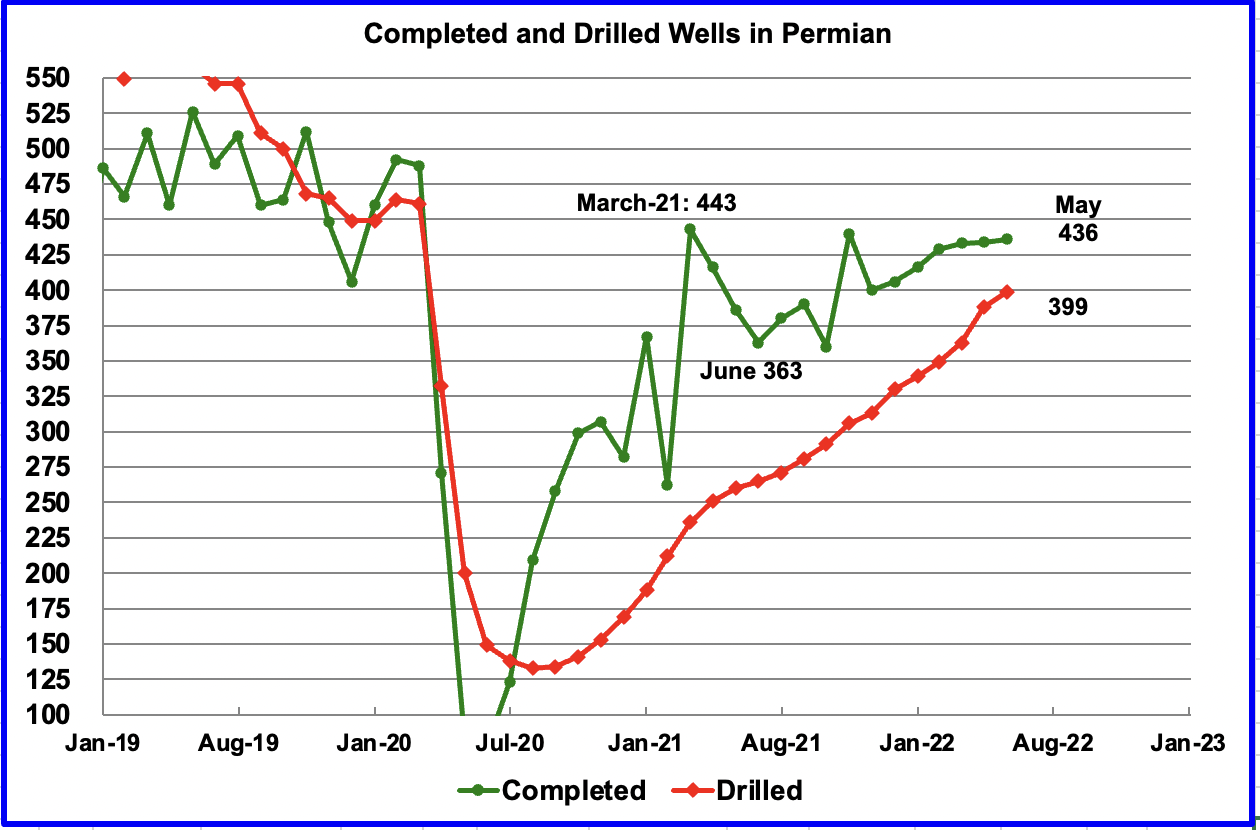
In the Permian, the monthly completion rate has been showing signs of slowing since March. In May 436 wells were completed, 2 more than in April. During May, 399 new wells were drilled, an increase of 11 over April. To counteract the lowering use of DUCs, drilling has been increased.
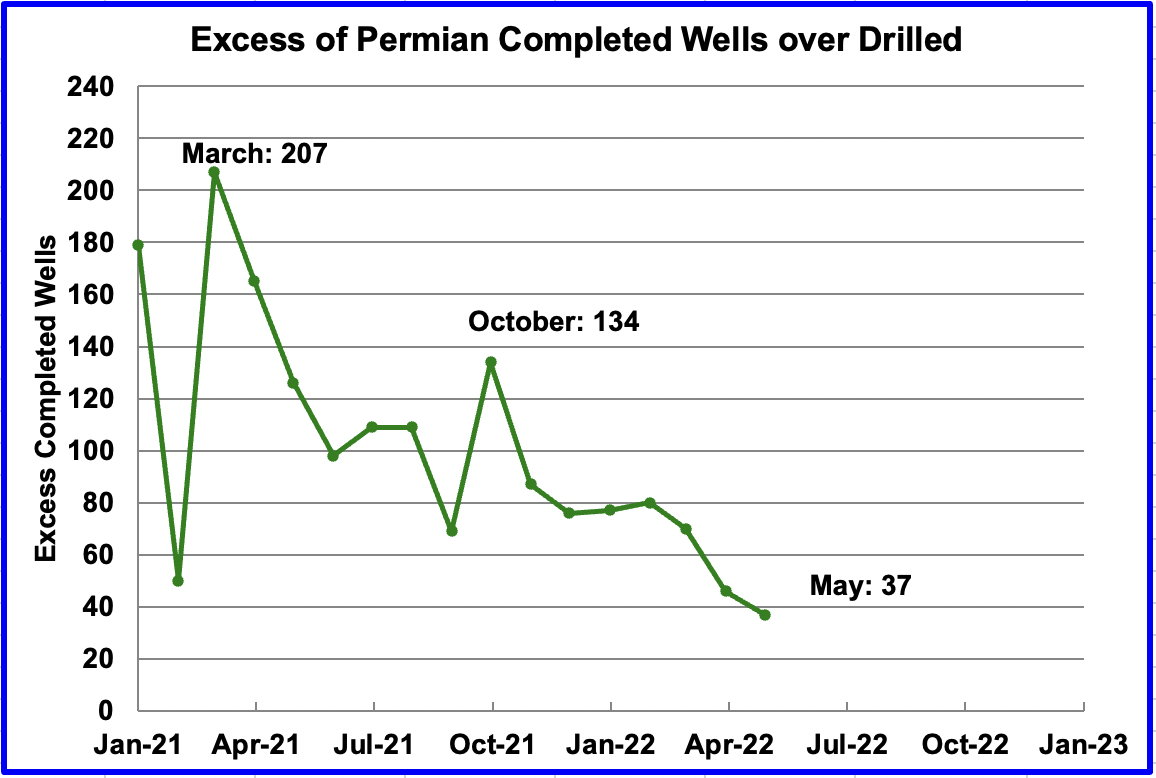
In October 2021, 134 more wells completed in the Permian than were drilled. In May 2022, the number of excess wells completed was down to 37 since the drilling rate was higher than the completion rate. To offset the drop in the use of DUCs, more wells had to be drilled to increase production.
5) Rigs and Fracs
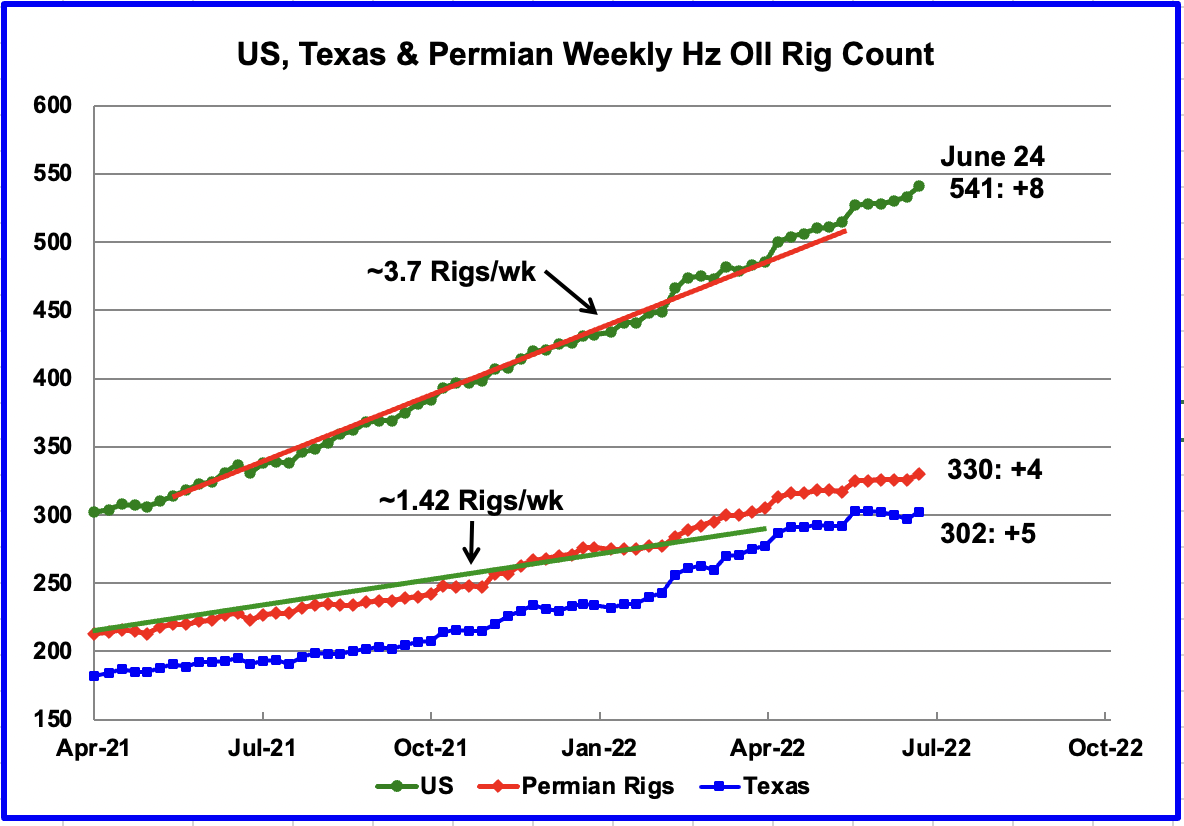
Since the beginning of April, the US has been adding oil rigs at a rate of close to 3.7 rigs/wk. Of these, the Permian has been adding 1.42 rigs/wk over the period April to September. However, since the end of January, it appears that the addition of rigs in the Permian basin has accelerated over the average rate as the red graph breaks away to the upside from the green trend line. The addition of rigs in the Permian since the end of January has increase to 2.5 Rigs/wk.
In the week of June 24 there were 330 rigs operating in the Permian, an increase of 4 over the previous week. This seems to confirm that drilling in the Permian continues to be attractive to the drillers.
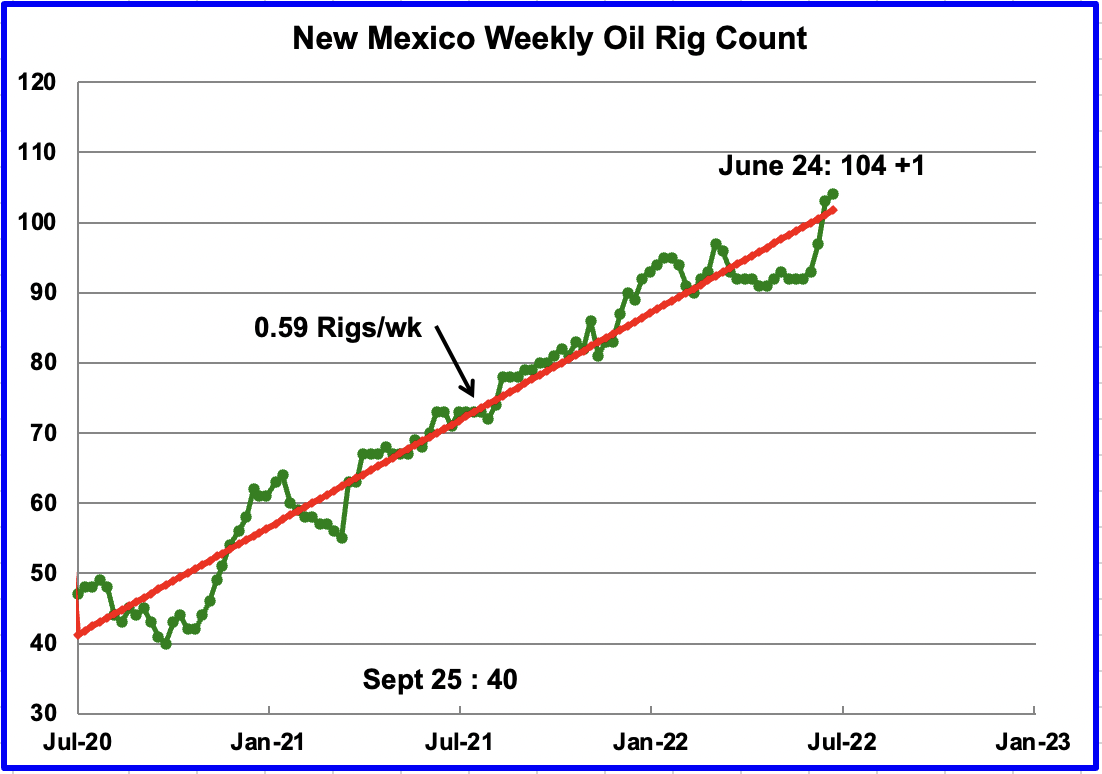
On occasion for a few weeks, it appears that rigs are not being added in the Permian. See recent flat spots in previous chart. However by looking at the rig count in the New Mexico Permian, it appears that rigs move back and forth between the Texas and New Mexico Permian. The rig count in New Mexico has increased an an average rate of 0.59 Rigs/wk since July 2020.
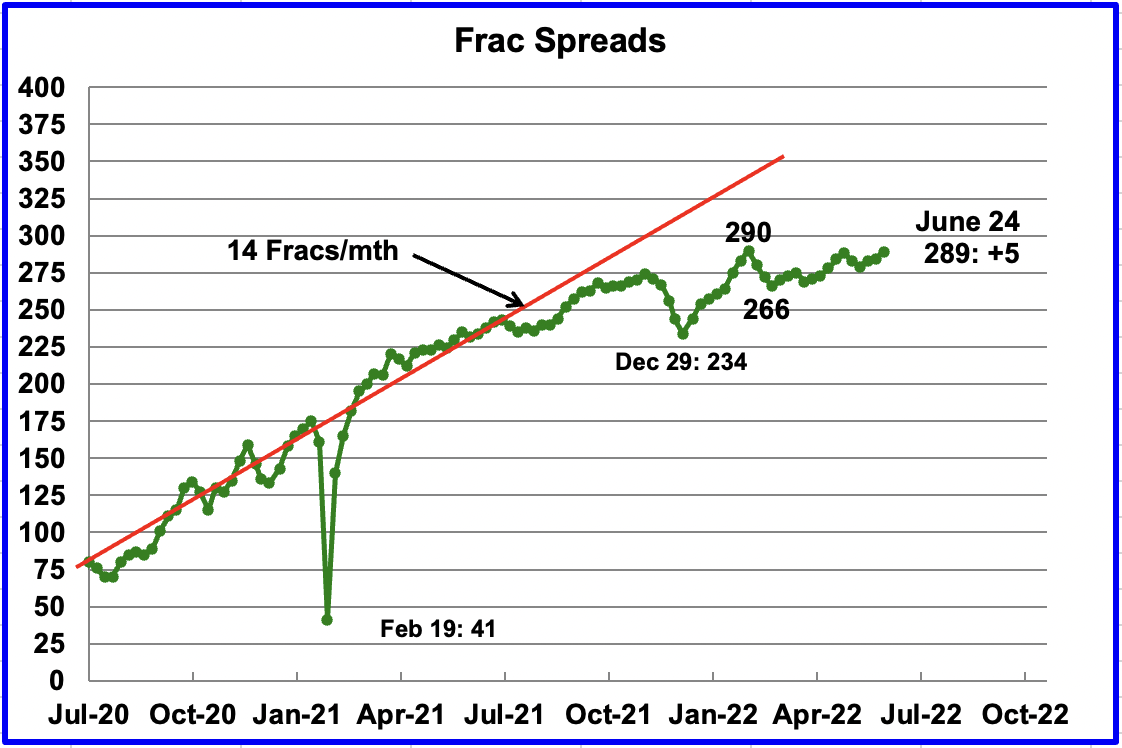
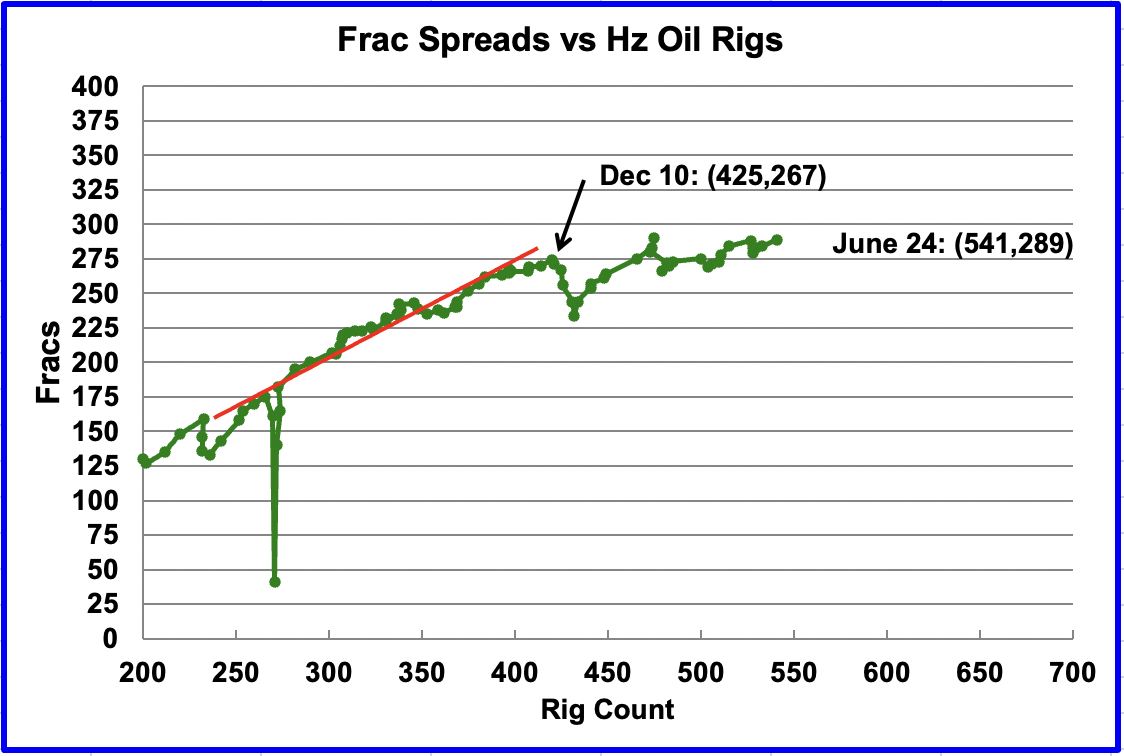
Since early February, the growth in frac spreads has not been keeping up with the growth in rigs. In the week ending February 25, 290 frac spreads were operating, 1 more than the 289 operating in the latest week ending June 24. In the second chart one can clearly see how the rate of frac spread additions has slowed compared to rig additions. Now that summer is here, the frac spread count may begin to increase provided the hurricane season does not impact plans/operations.
Note that these 289 frac spreads include both gas and oil spreads, whereas the rigs information is strictly for oil rigs.
Updated Oil Production from Four Non-OPEC Countries
The following charts are updated to May 2022 using data provided by the country’s official web site.
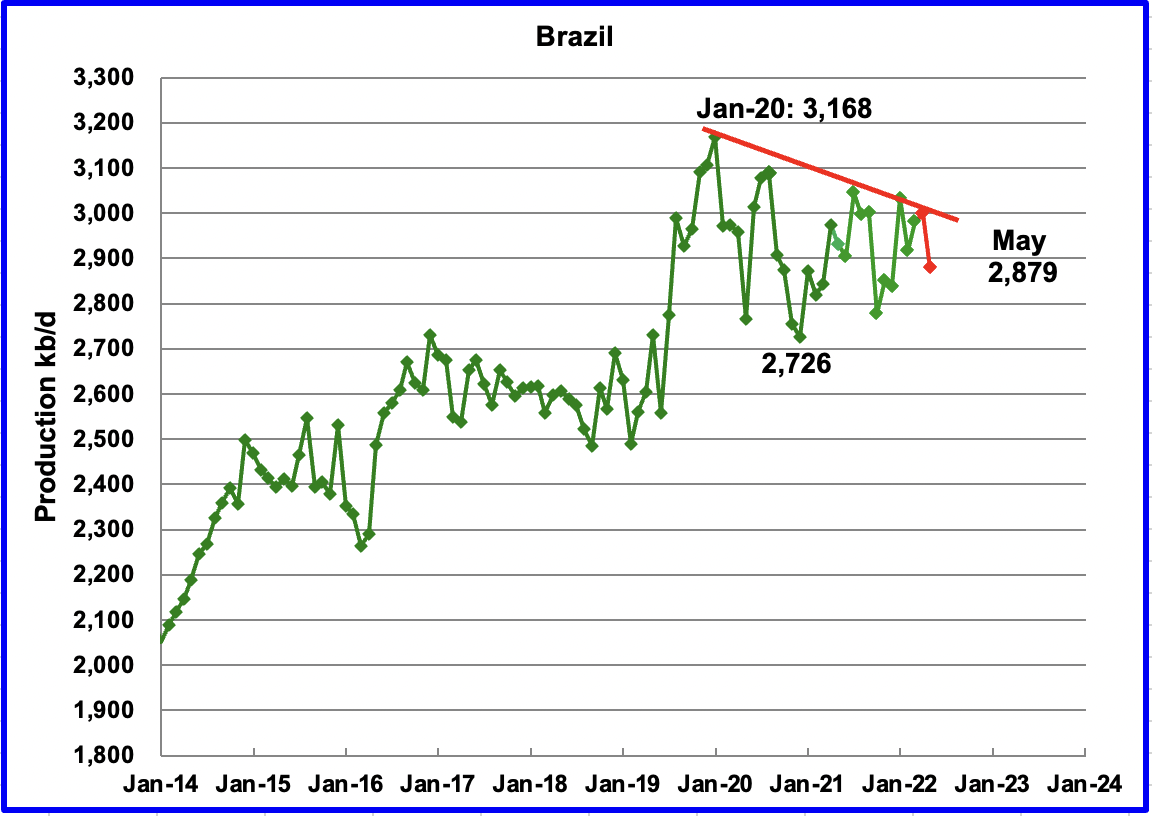
Brazil’s National Petroleum Association reported that May’s output decreased by 120 kb/d to 2,879 kb/d, reversing April’s small increase. (Red Markers).
The chart indicates that Brazil continues to experience difficulties in increasing its monthly output. However according to OPEC, the main growth in 2022 will be driven by the continued ramp-up of the Sepia field, which came online in August 2021, along with two start-ups of Mero 1 and Peregrino Phase 2 in the pre-salt Santos basin. Connection activities at the Mero oilfield – the third largest field in Brazil’s pre-salt regions after Buzios and Tupi – have finished and the Petrobras-operated Guanabara Floating Production Storage and Offloading (FPSO) vessel saw first oil in May.
While first oil from the Guanabara FPSO was expected in May, it did not show up in the latest report. The decline from January 2020 to April 2022, red line, may reflect the natural decline of the offshore fields. The red line decline rate is close to 80 kb/d/yr, or roughly 2.5%.
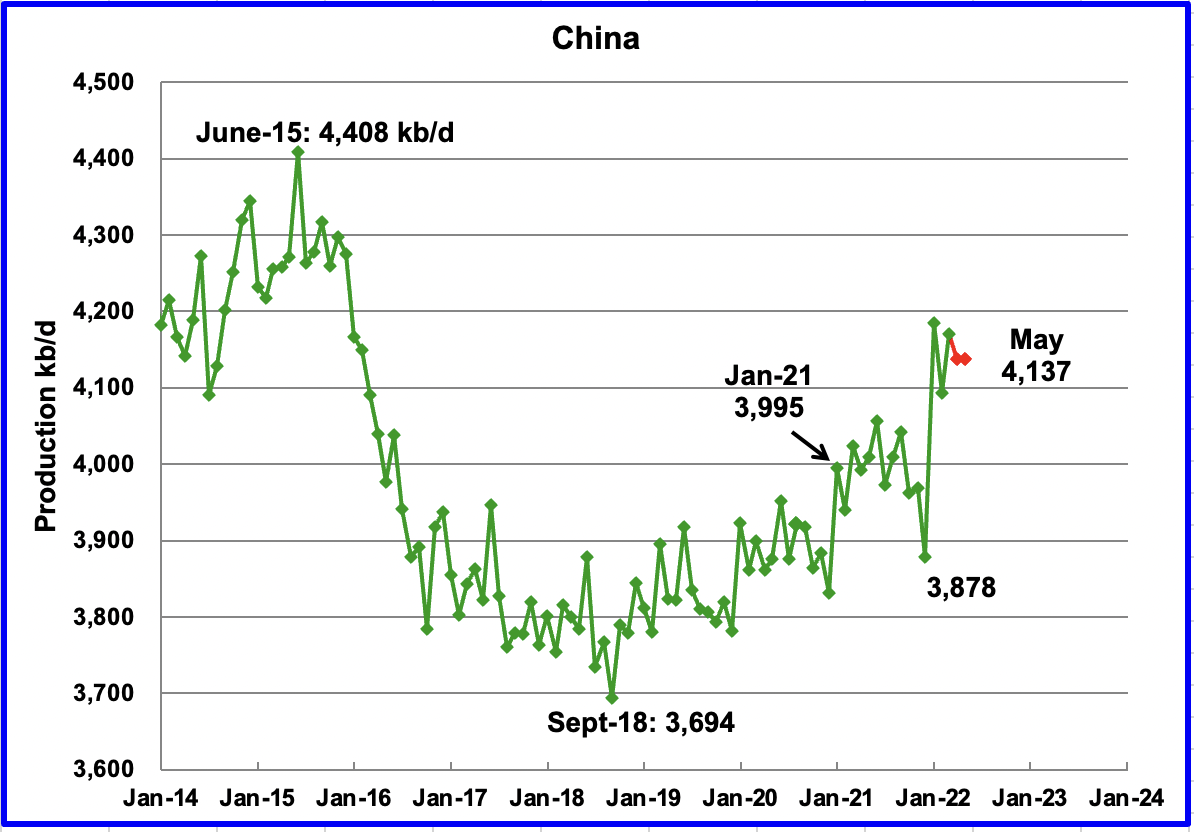
China reported that its May output was unchanged at 4,137 kb/d.(Red markers).
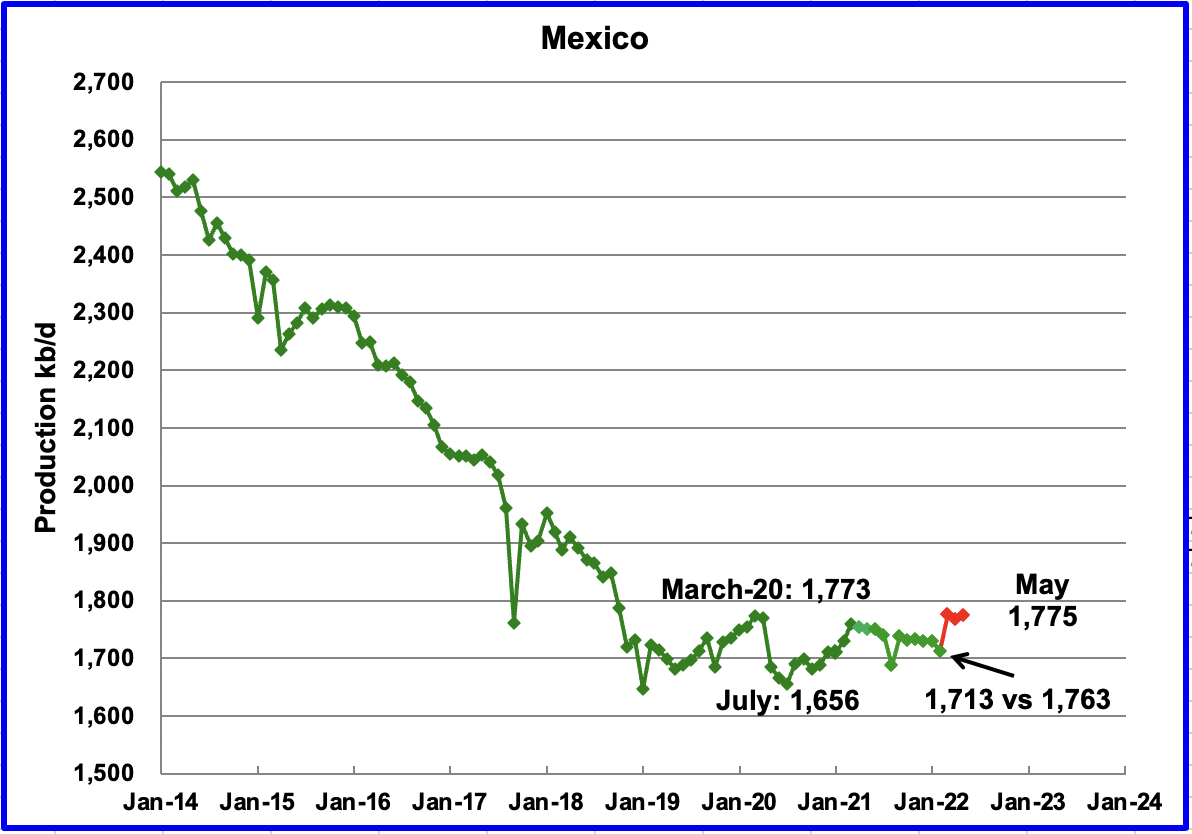
Pemex reported that May production increased by 8 kb/d to 1,775 kb/d. Red markers. Note the EIA reduces the Pemex production numbers by close to 50 kb/d. Green markers. The EIA reduced Pemex’s February output by 50 kb/d, 1,763 kb/d to 1,713 kb/d.
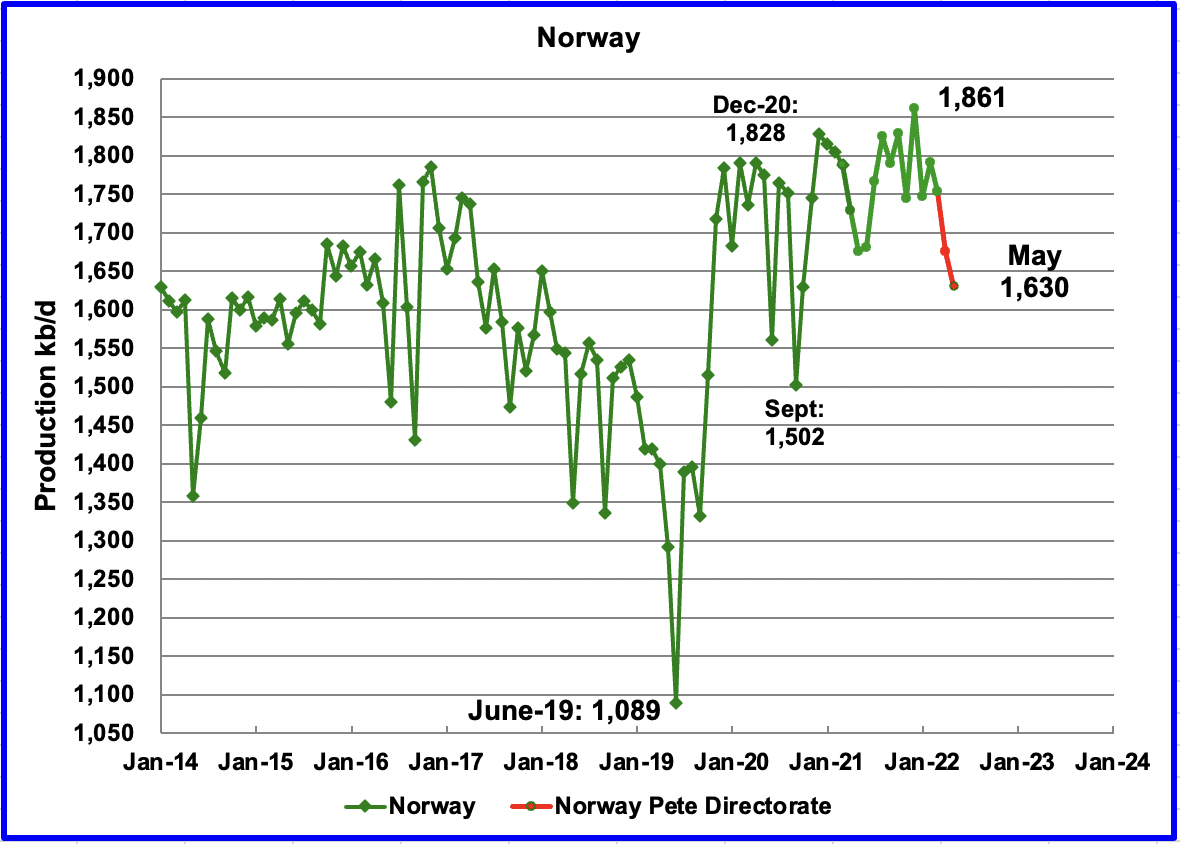
The Norway Petroleum Directorate (NPD) reported that production decreased in May to 1,630 kb/d. (Red markers.). According to the NPD: Oil production in May was 2.4% lower than the NPD’s forecast and 4.8% lower than the forecast so far this year.”
According to OPEC the May production drop was due to early maintenance. However OPEC notes that following the end of the maintenance season, growth is expected in 4Q22, when the second phase of the Johan Sverdrup field development starts production, adding around 220 kb/d on top of the 535 kb/d already being produced.
Non-OPEC W/O US
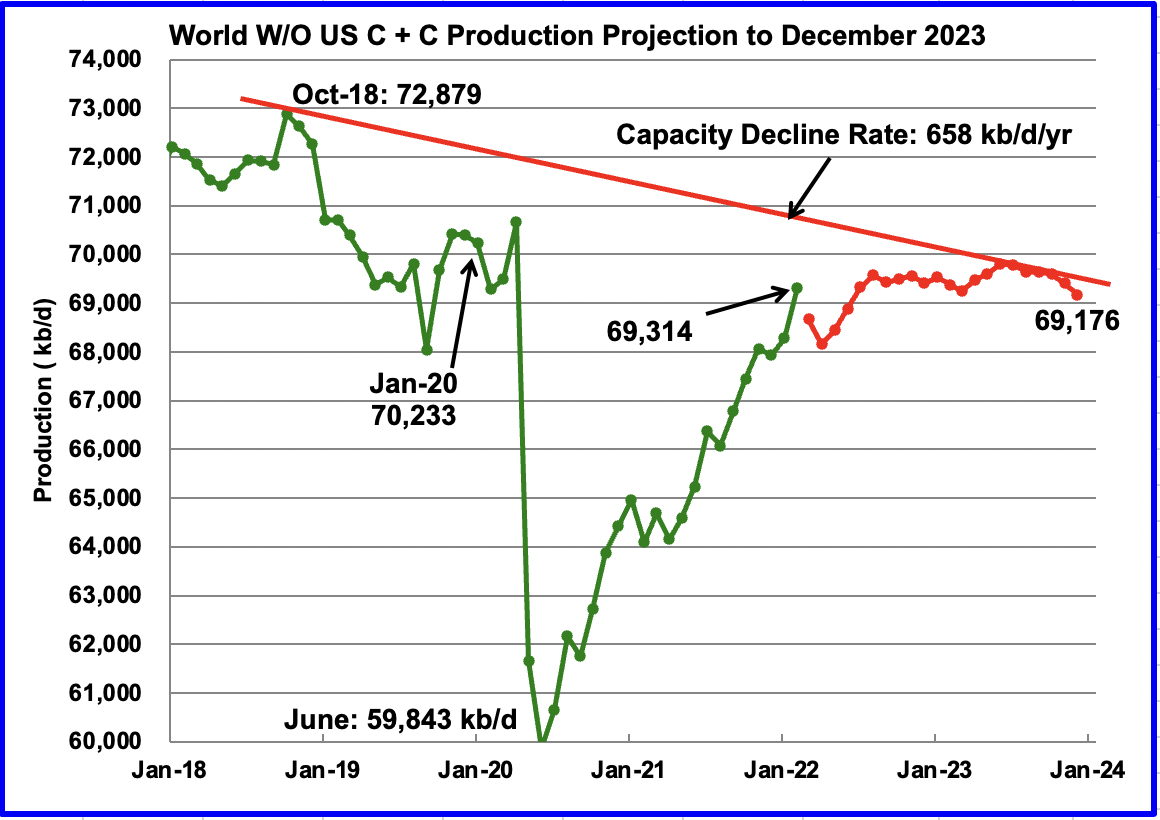
World W/O US oil production increased by 1,033 kb/d to 69,314 kb/d in February 2022 according to the EIA.
This chart also projects world production without the US to December 2023. It uses the June 2022 STEO report along with the February International Energy Statistics to make the projection. (Red markers). It projects that World crude production W/O US in December 2023 will be close to 69,176 kb/d, 500 kb/d higher than reported last month. Note this projection estimates that World Output W/O US will be essential flat for the next two years since the December 2023 output is less than February’s 69,314 kb/d. In other words, starting in February 2022, World oil production without the US will be close to 3,700 kb/d lower than in October 2018.
The essentially flat output also means that any increase in World oil demand will have to be provided by the US over the next to years. According to this source, the US permian will be up to the challenge.
Note that the chart also shows a Capacity Decline Rate line of close to 658 kb/d/yr over the years 2018 to 2023. Capacity decline encompasses natural decline and decline associated with reduced investment for drilling and exploration.
Saudi Arabia Closing Stocks
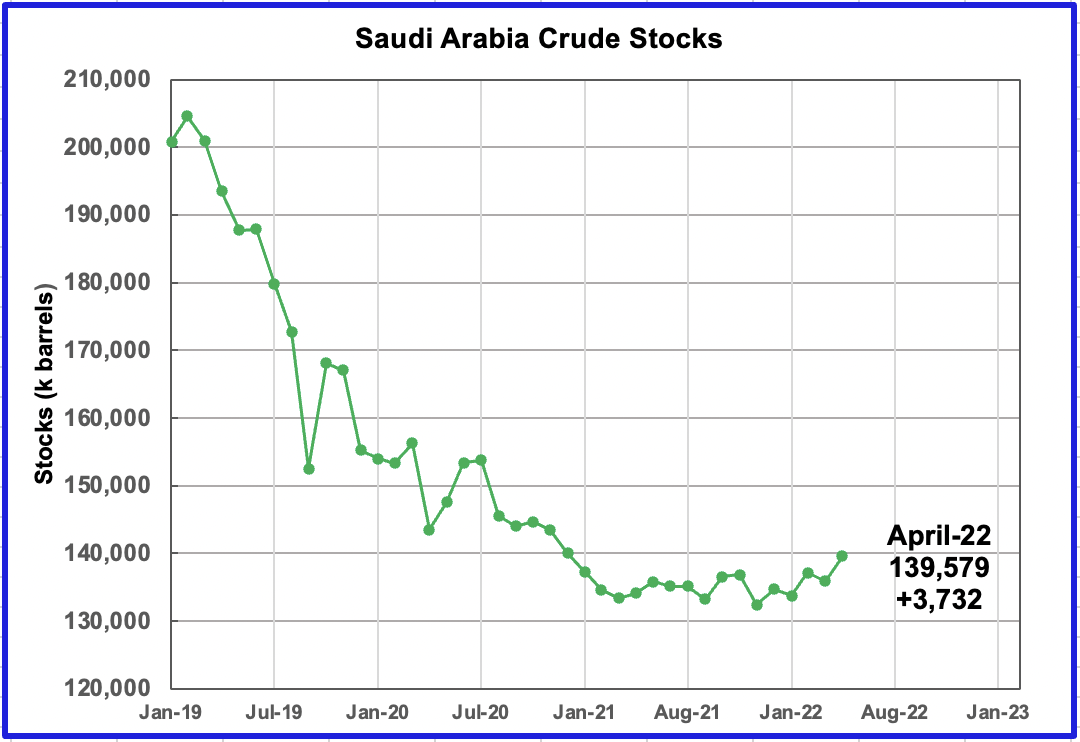
Saudi Arabia, in addition to increasing its monthly output by 115 kb/d, is also increasing its stocks. In April, stocks increased by 3,732 kb or 124.4 kb/d.
321 Refinery Crack Spread
The 321 crack spread is a measure of a refinery’s potential profit margin. It was developed many years ago because a barrel of WTI crude produced roughly 2 barrels of gasoline and one barrel of diesel. This prompted many market participants/specialists to concentrate on 3:2:1 crack spreads, i.e. three crude oil futures contracts versus two gasoline futures contracts and one ULSD futures contract. However, a more recent source notes that they now also look at the 2-1-1 crack spread — the difference between the cost of two barrels of crude and the sum of one barrel of gasoline and one barrel of diesel — because that one-to-one gasoline-to-diesel output ratio is often a little closer to reality these days.
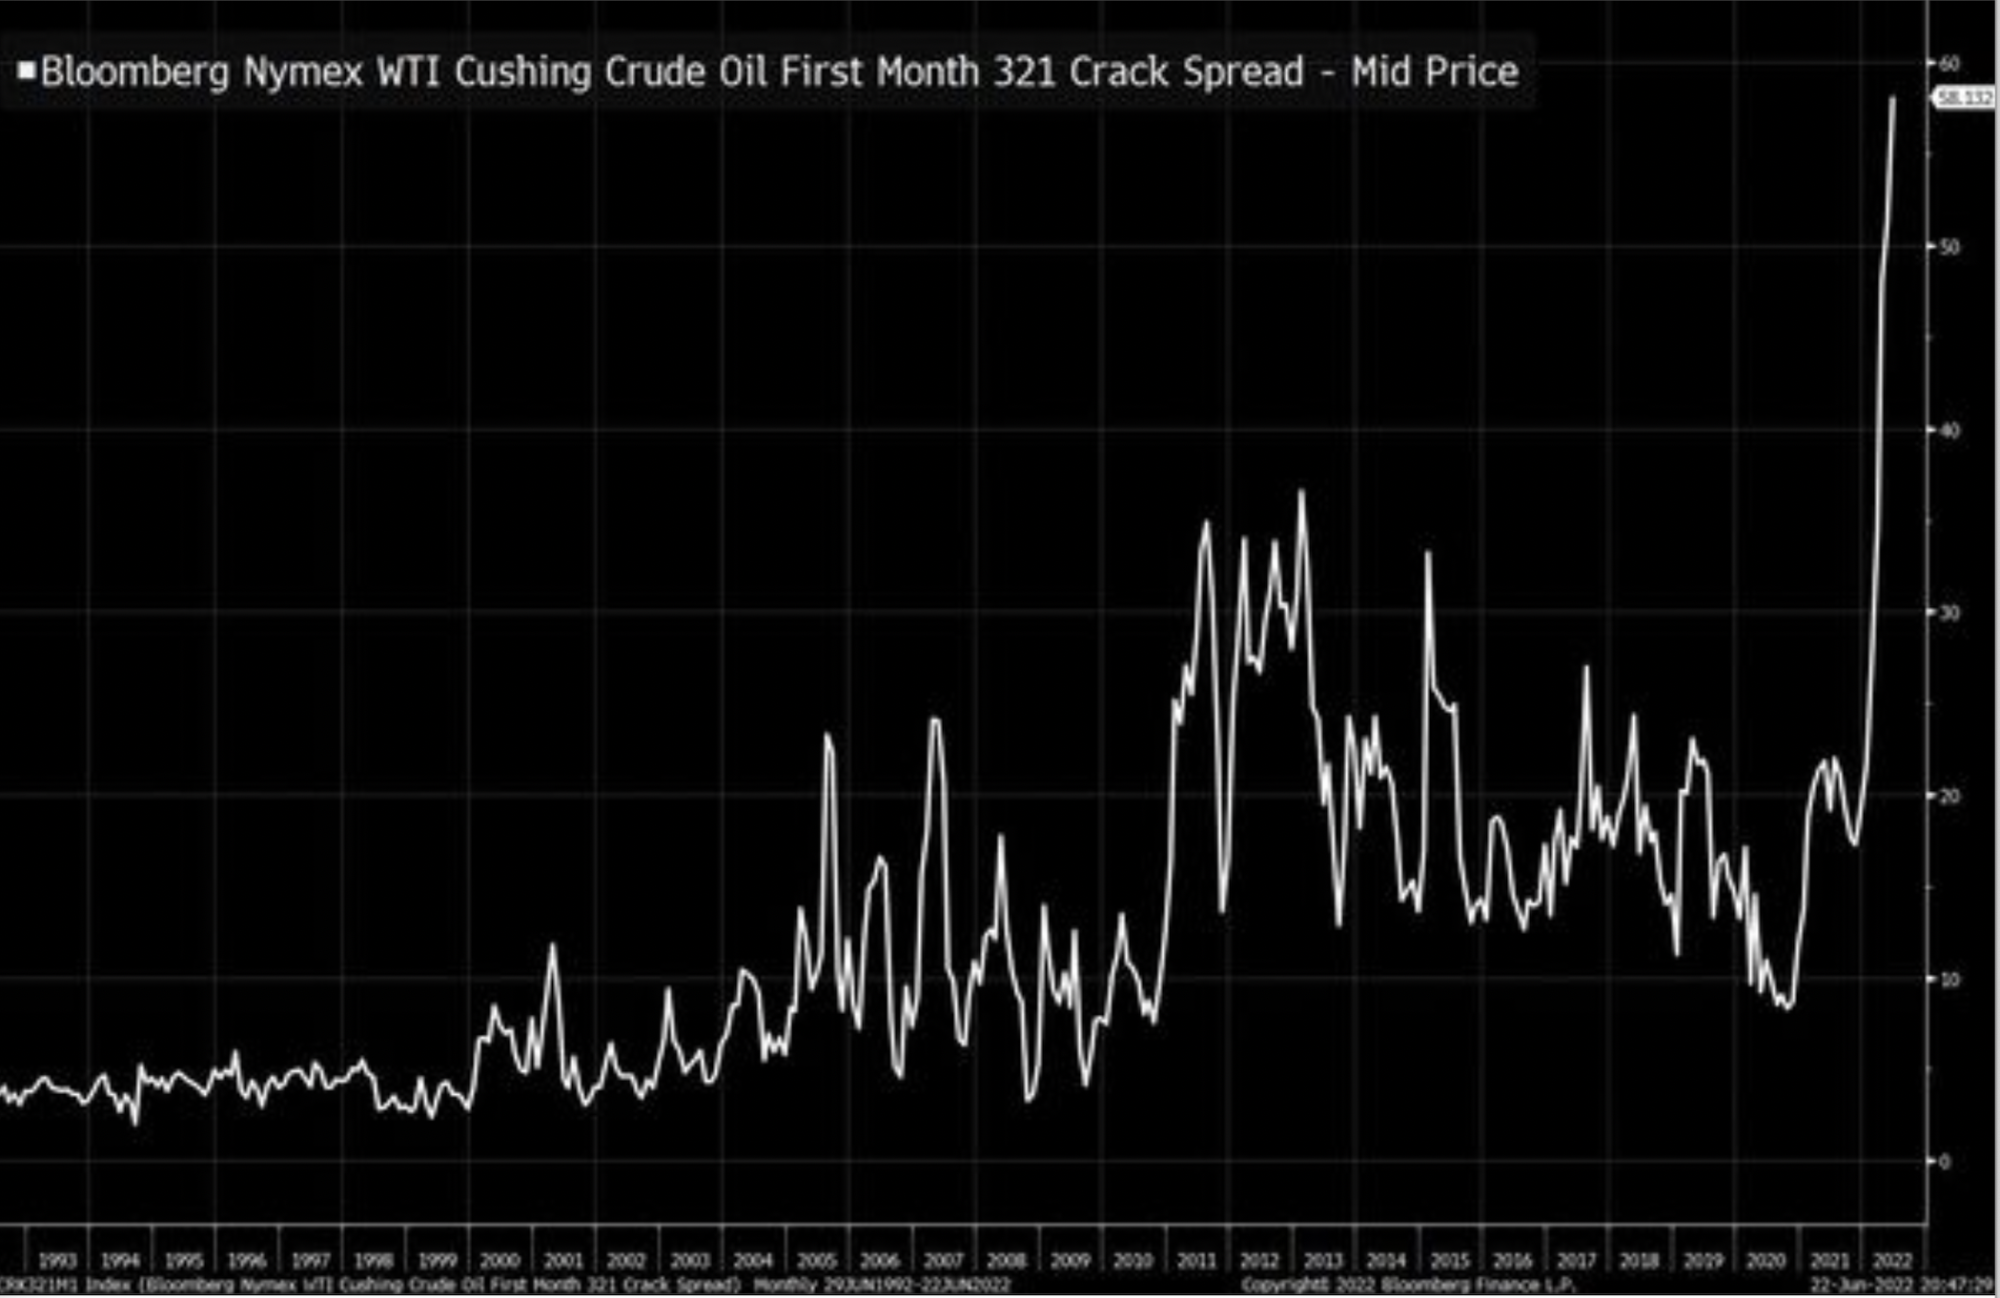
As can be seen from this chart, the 321 crack spread margin between 2011 and early 2022 varied between $20/b and $35/b. However this crack spread has recently blown out to $58/b as shown in this chart.
Using the June 24 settled prices for gasoline at $3.8848/gal, heating oil at 4.3629/gal and WTI at 107.62/b, the 321 barrel price is $169.86/b. The crack spread margin using this info is $62.24/b. Note that heating oil was used as proxy for ULSD, which is supposed to be used. If ULSD is more expensive than heating oil, the crack spread margin would be lower.
The point of this chart is to try to shed some light on the recent high prices for gasoline in the US. The high gasoline prices must reflect a high demand low supply market condition. One must assume that with the recent margin increase of $25/b to $30/b since the beginning of the year, refiners don’t have to compete to sell their products since they can sell all they produce. The extra $25 margin means that refiners are currently making an extra 60¢/gal over say late 2021 sales.
Appreciate that I am not a refinery expert. Just did a bit of reading, scratched some numbers on a piece of paper in hopes of generating some intelligent discussion, which is what participants on this board do. Better informed comments would be appreciated.
194 responses to “EIA’s June 2022 Oil Production Outlooks”
Ovi. Thanks again!
I am not a refinery expert either. However, 90+% utilization rates are not sustainable.
The refinery l live near postponed a major turnaround for about six months to take advantage of the record crack spreads.
This fall I understand they must do the maintenance turnaround and that means 260-275k BOPD of refining capacity goes offline for awhile.
I suspect the same thing is going on elsewhere.
So need to hope demand falls sharply after Labor Day in the USA.
SS
Do you know if the US is self sufficient in gasoline? There used to be a time when the US produced excess diesel while making gasoline. Europe was the opposite, they had to produce excess gasoline to make diesel. Then the US and Europe would swap the gasoline and diesel to try to maintain a balance. Not sure what is happening these days.
Europe is still exporting gasoline to the US. Read a report that in May, 2022, Europe exported more gasoline to US for any month since July, 2019.
As always great job OVI…
I am adding my comment from the last thread because I think it is a key piece of American History that has been overlooked as it relates to PEAK OIL
— Start
Putin has been following Peak Oil, like the people have on this site.
He couldn’t know when it would happen exactly, just like the people on this site.
He wanted Trump in office because he knew that dumb ass would make things worse.
https://www.peakoil.net/files/JOE2010.pdf
General Jim Mattis released this document. Search for Peak Oil
General Jim Mattis was Secretary of Defense under Trump
Trump said he heard scary stuff in one of his security briefings and then STOPPED ATTENDING THEM.
General Jim Mattis resigned.
I speculate (pure speculation) General Mattis found out trump was disinterested in the security of the country and did not want his name associated with that.
— Finish
https://www.yahoo.com/entertainment/trump-why-doesnt-security-briefings-175040811.html
Trump stopped attending security briefings because “He is a smart person”
well that quickly degenerated a professional technical comments section into the usual diatribe of american politics.
Ovi perhaps you move this thread to the other section ? Thanks
Read the .pdf…..specifically the Peak Oil section
Peak ,what is new in the report . Admiral Hyckover warned about peak oil in a speech I think in 1953-54 . Bundesweher (German army ) report has warned about ” peak oil ” about 10 years ago . . A UK army report warned about ” peak oil ” and CC . Mattis ‘s report was nothing new , just old wine in new bottles . Reinventing the wheel is no achievement . As to the Trump part of the story and his actions etc are not for me to comment . Forbin’s suggestion that it should be moved to the other thread is supported . Only I can say ” The people get the leaders they deserve ” . Trump , Biden next who Kamala ??
“Peak ,what is new in the report”
General Jim Mattis was the Secretary of Defense of the Country.
And then resigned.
Peak , I know . He was also called as ” Mad dog Mattis ” .Still what is new in his report that was not known to the public ?? Designation is not important .
HIH,
Ok, I guess it is obvious to everyone that the US Government at some level is aware of Peak Oil.
I guess the guy advising Trump that Peak Oil is real…isn’t worth mentioning on a Peak Oil website.
Mad Dog became Defense secretary in 2017, that paper was published in 2010.
For the largest military on the planet to acknowledge this….Big Deal!!!!
My bad.
thanks!
Peak Avocado
Mattis was at the Pentagon, starting in 2007.
“From 2007 to 2010, he commanded the United States Joint Forces Command and concurrently served as NATO’s Supreme Allied Commander Transformation. He was commander of United States Central Command from 2010 to 2013, with Admiral Bob Harward serving as his deputy commander. “
I warned about Mattis: https://www.americanthinker.com/articles/2017/09/mattis_is_no_good.html
But got Pruitt wrong.
I thought Mattis was Trumps’ only good hire.
He understands the threats the world is facing and has integrity.
Why he resigned.
Why the nonsensical diatribe. Im not a great fan of his but I can be honest enough to admit that his energy policies reduced political and security risks by putting the US in the energy pole position. Lets focus on facts that matter and that we can use going forward to help us plan and invest
” his energy policies reduced political and security risks by putting the US in the energy pole position”
The US shale boom is the last of the oil we got, and we are burning thru it as fast as we can.
Skipping security meetings cause you don’t care, is not good leadership.
Jim Mattis resigned. I suspect it is because of something in the .pdf.
The energy risk the US has is that the US wastes a vast amount of a dwindling resource.
Calling it a horse race and declaring victory is completely senseless, except to score political points. It is just propaganda.
The chart on oil production is interesting. It shows that the decline rate in existing fields, without further drilling, is close to 6.5%. It also shows that those fields after further development will begin to decline in 2020. Not an unrealistic forecast.
Report was published in Feb 2010.
This is two quotes from the report regarding energy:
Renewable: Wind and Solar combined are unlikely to account for more than 1% of global energy by 2030. That figure assumes the energy from such sources will more than triple, which alone would require major investments.
OPEC: To meet climbing global requirements, OPEC will have to increase its output from 30 MBD to at least 50 MBD. Significantly, no OPEC nation, except perhaps Saudi Arabia, is investing sufficient sums in new technologies and recovery methods to achieve such growth. Some, like Venezuela and Russia, are actually exhausting their fields to cash in on the bonanza created by rapidly rising oil prices.
From the data i seen wind accounts for 2.2% and solar 1.1% of the global energy mix consumption (BP statistical review of world energy 2020 for 2019). So their assumptions where wrong there.
However the IEA has ‘other’ sources supply of energy at 2.2% so there seems to be a discrepancy here between the IEA and BP.
https://www.iea.org/data-and-statistics/charts/global-share-of-total-energy-supply-by-source-2019
Not sure how much OPEC is producing now and would require in 2030. If Ron or Dennis have that data we can see whether that prediction could be correct or not.
OPEC is out of spare capacity, but we have of course known it, but now it comes from UAE officials.
Doc linked is 2010 – a bit before trump
https://www.theatlantic.com/magazine/archive/2019/10/james-mattis-trump/596665/
The salient point…albeit on the wrong thread…
I’ve seen the infamous Peak Oil document referenced on this site before.
However, I personally haven’t seen anyone connect that the guy who released the paper eventually became the Secretary of Defense of the country.
Then he resigned……draw your own conclusions.
Mattis said in his resignation that he did not agree with Trump.
“Many generals and admirals worried that sustained exposure to Trump would destroy Mattis, who is perhaps the most revered living marine.”
Thanks for the report, Ovi.
Just a comment on Refinery Crack Spread: “The 321 crack spread is a measure of a refinery’s potential profit margin. It was developed many years ago because a barrel of WTI crude produced roughly 2 barrels of gasoline and one barrel of diesel.” Somehow this does not sound right (think the ~10-15% increase in the refinery gains column), the other side of this is the size of my ignorance : ).
A quick search suggested a different approach to the definition (https://www.energystockchannel.com/3-2-1-crack-spread/).
Regards.
“The 321 crack spread is a measure of a refinery’s potential profit margin. It was developed many years ago because a barrel of WTI crude produced roughly 2 barrels of gasoline and one barrel of diesel.”
“Petroleum refineries in the United States produce about 19 to 20 gallons of motor gasoline and 11 to 12 gallons of ultra-low sulfur distillate fuel oil (most of which is sold as diesel fuel and in several states as heating oil) from one 42-gallon barrel of crude oil. Many other petroleum products are also refined from crude oil. Refinery yields of individual products vary from month to month as refiners focus operations to meet demand for different products and as they work to maximize profits.”
The crack spread refers to-
“complex hedging strategies for crack spreads that are designed to replicate a refiner’s yield of refined products. In a typical refinery, gasoline output is approximately double that of distillate fuel oil (the cut of the barrel that contains diesel and jet fuel). This refining ratio has prompted many market participants to concentrate on 3:2:1 crack spreads — three crude oil futures contracts versus two gasoline futures contracts and one ULSD futures contract…
In addition, a refiner running crude oil with a lower yield of gasoline relative to distillate might be interested in trading other crack spread combinations, such as a 5:3:2 crack spread. This crack spread ratio is executed by selling the five refined products futures (i.e., three RBOB gasoline futures and two ULSD futures) and buying five crude oil futures contracts, thereby locking in the 5:3:2 differential that more closely replicates the refiner’s cracking margins.”
Hickory,
Thanks. I’m a bit slow and thus still confused. How has the ratio of gasoline:distillate gone from 2:1 to 3:2 when the feedstock has at best been stable and possibly become lighter? The chemical composition of the feedstock puts boundaries on the products that can be refined from it. Refinery gains are significant at low gravity and tail off to a slight loss with condensates. So it seems to me that the ratio should be going the other way with less diesel per barrel?
Dan
The physical yield of distillation is a different issue than the hedging ratio.
Thats the basis of confusion on this.
Ovi ,thanks . Proficient as usual . Well laid out , lot of work . Appreciated .
HH
Much appreciated.
Has the STEO oil price forecast been accurate in the past?
I never paid it any attention.
_____________________________________________
“From May 2022 to December 2023, the STEO is forecasting an average monthly surplus of close to 693 kb/d up from 167 kb/d in the previous report.”
That is a surprise, well depicted on your chart [World Supply/Demand Balance-all liquids]
They must be assuming a big slowdown in global demand.
What would dent oil demand?- either very high oil prices or global recession for all the other reasons.
Yet they are projecting Oil to be less than $100/b in that timeframe (thus my first question).
No. Price forecasts are not good. In particular they never foresee any volatility in price.
Top chart on their most recent month. Show one helluva lot of possible volatility in price.
Top of the page, first chart of the 4 provided.
https://www.eia.gov/outlooks/steo/#:~:text=We%20forecast%20the%20U.S.%20residential,%2FkWh%20(up%203.2%25).
I think this is the chart reservegrowthrulz is referring to. Yes a great deal of potential volatily over the 2 sigma range (assuming a lognormal probability distribution).
For the chart above there would be a 95% probability that WTI is between $50/b and $190/b at the end of 2022. The mean (assuming lognormal) would be about $97/b. That may be how the STEO reference forecast is done.
This chart does not forecast volatility. This chart says that they don’t really know what the price will be. It is one of the most honest charts I have seen.
Schinzy,
One cannot forecast random events (which is what future volatility represents), the wide confidence interval implies volatility and that chart is presented with each and every Short term energy outlook.
Any random up and down pattern could be drawn within the 95% confidence interval and be called a “forecast”, but it would simply be a random line, just like all other scenarios of the future.
Hickory
I am a bit skeptical of the EIA’s projection. Below is the supply demand balance according to the June OPEC report.
Balance of supply and demand in 2022
Demand for OPEC crude in 2022 remained unchanged from the previous month to stand at 29.1 mb/d, which is around 1.0 mb/d higher than in 2021.
Compared with the previous assessment, 1Q22 was revised down by 0.2 mb/d. 2Q22 remained unchanged from the previous month, while both 3Q22 and 4Q22 were revised down by around 0.2 mb/d each.
Compared with the same quarters in 2021, demand for OPEC crude in 1Q22, 2Q22 and 3Q22 is forecast to be higher by 2.3 mb/d, 1.0 mb/d and 0.8 mb/d, respectively, while 4Q22 is forecast to be slightly higher by 0.1 mb/d.
According to secondary sources, OPEC crude production averaged 28.4 mb/d in 1Q22, which is 0.2 mb/d lower than demand for OPEC crude.
To the OPEC chart, in red, I have added guesstimated numbers for OPEC supply for Q2 to Q4. Even with those optimistic OPEC production numbers, only the second quarter will have a surplus.
Ovi,
The EIA may have a different forecast for liquids supply and demand than OPEC. I agree that the forecast by the EIA may be optimistic, but my personal forecasts have historically been pessimistic, so I am likely to be incorrect.
Ovi,
Ron has pointed this out before, every tight oil well that is completed is a DUC. The number you call DUCS completed is actually a decrease in the inventory of DUCs.
Dennis
This may be a matter of semantics. In the chart “Permian DUCs Inventory Months”, the following is stated:
If Permian DUC’s were to be completed at the latest rate of 37 DUCs/mth, that converts into 34 months of DUC inventory, assuming the remaining 1,257 are all commercially viable. The increase in DUC inventory months is due to the slowing rate of completing DUCs.
I thought that the above statement was pretty clear that the decrease in available DUCs refers to the decrease in inventory.
Ovi,
You have a chart entiltled “Monthly DUC completion rate…”
It should be entitled the “Decrease in DUC inventory …”, to be consistent.
“…the slowing rate of competing DUCs.” at the end of your sentence does not seem correct, the completion rate (of DUCs) has been increasing.
Dennis
In my way of thinking, DUCs are the wells that are in inventory, sitting on the shelf, waiting to be completed. I just track the inventory of those wells.
The statement you are referring to is: “The increase in DUC inventory months is due to the slowing rate of completing DUCs.” I could change that to …….completing inventory DUCs, However adding “inventory” sounds redundant to me since DUCs are in inventory.
Realize that the chart “Monthly DUC Completion Rate for Bakken, etc” is the derivative of the previous chart “Total DUCs for Bakken, etc.”. That previous chart clearly shows how the monthly use of DUCs is slowing.
Yes, more wells are being completed each month. However, those completed wells are a combination of wells just drilled plus DUCs coming out of inventory.
I agree that some wells drilled today might go into inventory. However the only thing that counts at the end of the month is whether the DUC count goes up or down and whether more or fewer were removed from inventory this month relative to last month.
Ovi,
Here is the basic difference between how we define a DUC, when a tight well is drilled it becomes a part of the DUC inventory, essentially a tight oil well never goes immediately from drilled to completed, there is always a delay (even in the best case scenario it takes time to move out the drilling rig and then to move in all the equipment needed for fracking. You seem to have two categories in your mind where some wells go from drilled to completed without ever being classified as a DUC (group A) and some other group of wells that become a part of DUC inventory (group B).
I guess I just think of it differently based on what I have read, group A either does not exist or is exceedingly small in number, basically every drilled well waits at least one month ( and the average is about 3 to 6 months) after being drilled to be completed.
You are correct that is just a matter of semantics, I think of all drilled wells adding to the DUC inventory and all completed wells as drawing from the pool of existing DUCs.
See
https://www.investopedia.com/ask/answers/061115/how-long-does-it-take-oil-and-gas-producer-go-drilling-production.asp
Based on the hydraulic fracturing section of that article, this suggests at least a month between when the drilling process ends and the start of production after final completion.
In any case I think of every completion of a tight oil well as being the completion of a DUC, by definition.
I agree the rate of decrease in the DUC inventory has been slowing over time (since early 2021).
Dennis
In my explanation I made it sound like there are DUC s and wells. I may throw in my definition in the next DUC post.
This is how I think of wells and DUCs. Wells are completed and drilled during a month. At the end of the month the uncompleted wells are counted and they become DUCs. In other words, uncompleted wells at the end of the month officially become DUCs, regardless if they have been there for one day or one year.
Ovi,
I think of it in much the same way, I guess the difference is how quickly the drilled wells get completed, my guess is that very few (if any) wells that are finished with the drilling process on the first day of the month will reach the “first flow” stage (of a completed well) by the final day of that same month. Of course I have never drilled or completed a tight oil well, so perhaps anyone more familiar with the process can correct me (I am referring to horizontal tight oil wells in 2022).
Wells are completed and drilled during a month.
That’s not quite how it works. All wells after they are drilled automatically becomes a DUC. Only DUCs are ever completed. Even if fracking starts the next day, it is still a DUC even if for only one day. But that seldom happens. Fracking crews are told which DUC to complete, and it is always a DUC as only DUCS are available to be completed.
Ron,
Thanks. That sounds correct to me, but it would be nice to hear from one of the oil guys who are certainly more knowledgeable than me.
That “sounds correct but”??? But how else could it possibly be? You know that drilling crews are not fracking crews. You know that when the drilling crew leaves, what they leave is an uncompleted well because it has not yet been fracked. They call that a DUC. It may be days, weeks, months, or even years before the fracking crew moves in. Until that day, that well will be a DUC. Again, how else could it possibly be? But I do hope you get an oil man to confirm that.
Ron
Wells become DUCs officially at the end of the month. That is the only piece of info we have and counts.
DUC stands for Drilled but UnCompleted. It becomes a Drilled but UnCompleted well when the drilling rig pulls out and the drilling crew picks up their tools and moves on. When they officially list it as a DUC is another matter altogether. However, I am not at all surprised that they count them only once a month.
I have long been interested in how DUCs get identified, tracked, and accounted. The general concept of a DUC is obvious. The processes can vary greatly. Take Colorado for example, where wells go from planned to producing with no interim steps. Obviously they are drilled, sit idle for weeks to months to years, then are completelld, and then have initial production while flowing back by the completions group before being turned over to production operations. Only if a well sits uncompleted for an extended period of time (1-2 years) does it get a well status code officially indicating it is a DUC. Different processes, different verbiage, different reporting requirements, etc. all are likely to lead to some sloppy bucketing. So long as those differences are consistent, we can paint a reasonably accurate picture. And at some point, there are a bunch of dead DUCs in the bottom of the bucket that will never be completed for various reasons including reservoir depletion, logistics restrictions, regulatory blocks, etc. I am interested in the dead DUC count.
Hi Ron,
I said I agree on the naming convention you suggest, things are not always done the way I think is logical. In addition I don’t know the typical timing between the end of the drilling process and the end of the completion process. I have read it takes at least one month minimum and typically the average time between the end of the drilling process and first flow tends to be 4 months or so. This is what an oil industry professional could confirm.
El Dano,
Nobody knows what the Dead DUC count is, we only have speculation. Actually , somebody could probably dig it out of the data, if they have access to a detailed database, but it would take some time. I don’t have access to the detailed data needed.
Ovi and Ron,
Here is the part of the Article linked above that describes the process after the drilling process is finished for a tight oil well.
After drilling is done, the drilling rig is removed while the well is prepared for hydraulic fracturing. Wells in shale formations require high-pressure flushing with engineered fluids to create fractures in the rock and then hold them open, releasing oil and gas.
It takes about a week after the drilling to prepare the well for hydraulic fracturing and about 10 days to carry out the process, depending on the length of the lateral segments. Adding production tubing takes another week, followed by two to three weeks of flowback, the early production stage in which oil and gas is mixed with water and sand.
Based on this we have in days (7 plus 10 plus 7 equal to 24) so slightly less than 1 month, if the fracking process occurs immediately after the drilling process is finished.
Consider a lease where 11 wells will be drilled (8 into two different benches of the Wolfcamp and 3 into the Spraberry formation). First all 11 wells will be drilled (about 2 weeks for each well so a total of 22 weeks or about 2.5 months on average) and then the fracking/flowback process would be another 5.5 months on average for an average of about 8 months that these 11 wells would be in the DUC stage before completion is finished.
It may be that fewer than 11 wells at time are done together as I have read that 4 to 6 months is a typical lag between drilling and completion. If 6 or 7 wells are done at the same time it would be an average lag of about 5 months. Again I am not familiar with all the details and no doubt there may be efficient ways of doing this that I am unaware of, the process is complex.
Change in DUC inventory for Anadarko, Bakken, Eagle Ford, Niobrara, and Permian plays. An alternative explanation for this decrease in the rate of change in the DUC inventory is that currently the DUC inventory is very low so the rate of drilling has increased in order to bring the DUC inventory level closer to the optimal level. In Jan 2017 the DUC inventory was 4310 for these 5 basins with 625 wells completed (6.9 DUCs per completion), in May 2022 the DUC inventory was 3319 for the 5 tight oil plays with 799 wells completed (4.2 DUCs per completion).
Dennis
In the post chart above “Total DUCs for Bakken, Eagle Ford, Niobrara, Permian”, there is no indication of a linear downward trend. The rate of change of the number of DUCs at the end of each month is slowing and heading for zero.
The Permian at 1,257 DUCs is close to bottoming and probably is an indication that a good number of them are Dead DUCs.
If as you indicate drilled well are not completed in the same month, that can be used to estimate the number of dead DUCs. In May 399 wells we drilled. They all become DUCs. From April say 200 wells are still DUCs. So one might estimate that of the 1,257 Permian DUCs, 600 are recently drilled wells. So roughly 650 DUCs in the Permian are Dead DUCs and are in permanent inventory.
Ovi,
The fastest a drilled well can be completed is probably about 6 weeks, that does not mean that is what typically occurs. We don’t have any idea how many DUCs are viable in the current inventory. Let’s assume what I have read is correct which says on average a DUC stays in inventory about 5 months. I think the DUCs probably get completed on a FIFO basis and the 1257 Permian DUCs are wells that were drilled from Feb 2022 to May 2022, the Dead DUC meme has little actual evidence imho. More wells are being drilled because inventory is low and the drilling rate is increasing much faster than the completion rate is increasing so that by the end of Nov 2022 we are likely to see the DUC count start to increase. My estimate is that so called dead DUCs are close to zero, all DUCs may have been drilled in the past 4 months and are simply waiting on frack crews. Chart below shows the ratio of DUCs to new completions for the 5 tight oil plays (includes Anadarko) from Jan 2017 to May 2022, the average over the entire period was about 7 DUCs per completion, May 2022 is the lowest at 4.15 since May 2018 (4.45), basically this suggests the DUC inventory is 4 months at minimum and 7 months on average.
Ovi,
Yes I didn’t choose my title well, it should have been titled “monthly decrease in DUC inventory for tight oil plays”.
The chart that I mislabeled is essentially the first derivitive of the DUC function, where it hits the x-axis is the minimum for the DUC curve, shown in chart below (projection after May 2022).
I have always called Macron ” midget Macron ” . Now he calls for oil price caps on oil at the G 7 meeting . F*** , France does not produce a drop of oil .
https://www.anews.com.tr/economy/2022/06/26/france-urges-producers-to-cap-oil-price-over-ukraine-macron-office
Another energy moron . Janet Yellen with a record of 100 % failure in forecasting . Crazies are in charge of the asylum . Doesn’t she know price controls don’t work ? Obviously not .
https://www.reuters.com/business/energy/us-talks-with-allies-russian-oil-price-cap-says-yellen-2022-06-20/
The proposed price caps are on Russian Oil but that distinction was too complicated for you, or perhaps you ignored that part for the sensational propaganda value (desperate for attention, as always)?
Par for the course.
Price caps on Russian oil sound good to me. Pretty impossible to enforce however.
So let’s say Russia sells its oil for a lower price. Then the buyer resells it at market value? Or Russia will sells the capped oil to BRICS countries only, fortifying its allies. All this stuff will only send oil prices through the ceiling for the “collective west”. Or: Russia doesn’t sell but barters its Oil with its allies, while the west pays in dollas for the same amount of oil on the world market – which should devalue the dollar. Together with inflation this will be totally toxic.
If we are headed into recession. Which I think is highly likely. Commodities including oil are likely going to plummet in price.
I’m looking for long term treasury yields mainly the 10 year bond yields to fall an strengthening of Japanese Yen to confirm growth is not just going to slow but contract.
Falling yields and strengthening Yen are a sign of tight monetary conditions. Lending gets scarce and prices drop. Eurodollar funding gets scarce.
There is the situation where Europe will no longer insure any ships traveling to Russia which will likely shut in Russia oil production.
That doesn’t have to be inflationary for prices though. It could end up being very deflationary for oil price as deep recession results from lack of oil flow.
Think about it for a minute. If oil stops flowing into any individual country. Be Anywhere in Europe or China or India. Dollar based loan into that country are going to contract severely. Even local currency loans are going into contraction.
I think it can both ways. A recession can send the prices down, obviously true. Depending on scarcity they could also remain high(er) than expected. This would result in a very uneasy mix.
Personally I also expect lower prices, a price too low for producers and too high for consumers. I simply don’t expect the mother of all ecological overshoots to end well.
But on the hand we have the following anectode by Lisa Abramowicz (@lisaabramowicz1).
Is oil “beginning to succumb to the bearish macro pressure?” asks RBC commodity analyst Michael Tran. A trader responded: “oil has long since been pricing in a global recession, which is why we have been confined to the $105-$120/bbl range rather than pricing at $150/bbl.”
On one hand American retailers are sitting on an epic amount of unsold inventory. They will have to deep discount that inventory in order to move it. Also means China doesn’t have any orders. Which is deflationary as China won’t be buying near the amount of raw materials.
But with the shortage of DEF (diesel exhaust fluid) due to lack of urea. There will be a shortage of trucks available to deliver later on this year. Which could be temporarily inflationary. But when you realize how many jobs are dependent on trucks continuing to run it will become deflationary.
If 10-15% of all trucks are forced of the road due to lack of DEF that’s a big deal.
HHH, (I am reposting this question as the OPEC thread is now stale)
Thank you for your input on the fragile global financial situation. If I understand this correctly, one of the uncontrollable aspect of this is the Eurodollar system, which is in nobody’s control. My understanding is that the Eurodollar system in basically loans taken outside the USA banking sector in dollars, mainly in Europe first, although this has in the last few years expanded to countries other currencies as well, but less so . So, are you saying that with the dollar strength these loans are more difficult (or impossible to pay off) and the ECB cannot rescue the European banks and the FED will not (or cannot) do the same. Perhaps you have posted this many times before, but I have not paid enough attention to the line of reasoning. Thanks.
The BP Energy Outlook, 2022 edition is supposed to be released tomorrow.
BP has posted a summary document at the site below. Here is what it has to say about the US and OPEC
US tight oil – including natural gas liquids (NGLs) – bounces back from the impact of COVID-19, with output peaking above pre-COVID-19 levels at around 15Mb/d during the first decade of the outlook in all three scenarios. Brazilian output also grows over the first 10 years of the outlook. But as US tight formations mature and OPEC adopts a more competitive strategy against a backdrop of accelerating declines in demand,
US production (and other sources of non-OPEC output) falls from the late 2020s onwards.
OPEC’s production strategy changes over the course of the outlook. In response to the rebound in US and other non-OPEC supplies, OPEC lowers its production over the first decade or so of the outlook allowing its market share to fall in order to mitigate the downward pressure on prices. The fall in OPEC’s market share is most pronounced in Accelerated and Net Zero given the backdrop of falling oil demand from the mid-2020s
https://www.bp.com/content/dam/bp/business-sites/en/global/corporate/pdfs/energy-economics/energy-outlook/bp-energy-outlook-2022.pdf
And they [BP] say up front-
“The Outlook was largely prepared before the military action by Russia in Ukraine and does not include any analysis of the possible implications of those developments on economic growth or global energy markets…
Energy Outlook 2022 is focussed on three main scenarios: Accelerated, Net Zero and New Momentum. These scenarios are not predictions of what is likely to happen or what BP would like to happen. Rather they explore the possible implications of different judgements and assumptions concerning the nature of the energy transition..
The many uncertainties mean that the probability of any one of these scenarios materializing exactly as described is negligible. Moreover, the three scenarios do not provide a comprehensive description of all possible outcomes. However, they do span a wide range of possible outcomes and so might help to inform a judgement about the uncertainty surrounding energy markets out to 2050.”
BP Statistical review of world energy 2022 will be released on June 28, 2022. I cannot find a link to the presentation.
Dennis
This is the link for the 2021 review. Scroll down a bit and it says 2022 is supposed to be released today.
https://www.bp.com/en/global/corporate/energy-economics/statistical-review-of-world-energy.html
Ovi,
The page says June 28 on my computer, my calendar says it is June 27 today.
Dennis
Another senior moment.
Ovi,
I figured it was me, I am looking foward to the BP Stats 2022, usually they have more information, or that’s what I remember (these days I remember less than my younger days.)
I find it hard to agree with any of the particular scenarios that they have published in their summary.
They mention another one-
‘Delayed and Disorderly scenario’.
Some version of that is what I expect to happen (continue to happen).
It seems to me that overall BP is trying hard to sugar coat the projections.
I suppose that is the acceptable role for those making corporate projections.
Afterall, you don’t want to upset the customers too much.
The Big Guy has discovered Peakoilbarrel.com.
Careful in what you say.
https://elonsfeed.com/2022/06/27/eiaa%C2%80%C2%99s-june-2022-oil-production-outlooks/
Ovi,
If you check the ABOUT PAGE: https://elonsfeed.com/#about
Seems a bit odd… No?
steve
Srsrocco
Agreed, but so is the guy.
Tried searching for info but could not find anything. If it wasn’t him, I would think he would complain.
The “Lorem ipsum …” bit is standard greeking text to illustrate how text will appear— as in a template.
EIA still having issues releasing data…
https://www.eia.gov/petroleum/supply/weekly/
Sitting outside a sidewalk pizza place in an older Seattle neighborhood yesterday
a Rivian pickup, a VW ID4, and an Arcimoto Deliverator
passed by within a few slices (and I eat too fast- she says).
Coming to a street near you this decade.
https://www.arcimoto.com/
Next to famine, war, blackouts and depression.
Yeh, those things too perhaps.
In some neighborhoods more than others.
Kicking and screaming as the country is dragged into the future-
At every step of the way there has been heavy resistance to efforts to upgrade the vehicle fuel efficiency of the country.
“First enacted by Congress in 1975, the purpose of CAFE is to reduce energy consumption by increasing the fuel economy of cars and light trucks. The CAFE standards are fleet-wide averages that must be achieved by each automaker for its car and truck fleet, each year, since 1978. When these standards are raised, automakers respond by creating a more fuel-efficient fleet, which improves our nation’s energy security and saves consumers money at the pump, while also reducing greenhouse gas (GHG) emissions.”
The push-back has been controlled and instigated by huge vested interests and has been a heavily partisan/politicized issue.
But thankfully the efforts at forcing the industrial upgrade of the nations vehicle fleet has been partially successful, with the average MPG of cars having doubled from 1975 to 2020.
Imagine how much more quickly we would be burning through the fuel resource of the country without that improvement, and the strain on family budgets.
And now we are on the verge of a huge leap in vehicle energy efficiency. It is at our fingertips.
And still, kicking and screaming against the trend is just as common a response.
Nonetheless, it will happen despite the sluggish response by most,
simply because the base conditions are now so favorable for the change toward electrification.
Fortunate, since it will allow crude oil residual production to be used for much more critical uses than light vehicle transport.
chart- https://www.energy.gov/eere/vehicles/articles/fotw-1237-may-9-2022-fuel-economy-all-vehicle-classes-has-improved
Spoiler…there is no future.
The future has no internal combustion, true. [at least for light vehicle transport]
btw- for comparison to the data presented in the chart above
Ford150 Lightening 70 mpge
Ford Mustang Mach e 90 mpge
for example
For Tesla Model 3 long range AWD MPGe is 121. Tesla Model Y Long range awd is 125 MGPe.
Indeed.
I avoided posing the Tesla data since so many people seem to think it not an American car company.
We are all going to die, but yet the healthcare industry is about one-sixth of the American economy improving the quality of life. If you can’t put some kind of timeline on your statement “there is no future”. It’ meaningless.
Ecuador’s oil production falls 51% due to national strike
In 12 days of protests, Petroecuador and foreign oil companies stopped extracting a cumulative 679,000 barrels of oil, which means losses of USD 61 million.
https://www.ecuadortimes.net/ecuadors-oil-production-falls-51-due-to-national-strike/
Macron tells Biden Opec is tapped out:
“I had a call with MbZ,” Macron was heard telling U.S. President Joe Biden on the sidelines of the G7 summit.
“He told me two things. I’m at a maximum, maximum (production capacity). This is what he claims.”
“And then he said (the) Saudis can increase by 150 (thousands barrels per day). Maybe a little bit more, but they don’t have huge capacities before six months’ time,” Macron said
https://www.yahoo.com/news/macron-tells-biden-uae-saudi-165741869.html
If Europe is Able To Make it past this Next Winter… 2023 and onward is going to be Fricken Ugly.
Because the U.S. Freeport LNG facility went offline, domestic U.S. natgas prices collapsed by 30%, while Europe’s Dutch TTF price surged by 50%… LOL.
German Minister Habeck, now publicly admitting, that the future of Germany’s Economy is in Russia’s hands, not Germany’s. However, most European countries continue to play CHICKEN, hoping and praying that the ENERGY TOOTH FAIRY comes to the RESCUE.
GOD HATH A SENSE OF HUMOR…
steve
You think 2023 is going to be ugly,
just wait for 2024.
As I often say, things are going to get bad. But after that, they will get worse.
I just realized that the person calling himself the EIA Director of Ciber Security is fake. He has a .com email address. Any real EIA person would have a .gov address. Therefore he is posting anonymously. Dennis says he does not allow that. I have put his posts in the Spam file.
I think it was a joke and maybe a reader who doesn’t post often and so just used the first name he came across.
Since when are we not allowed to post anonymously?
UAE, Saudi Arabia Pumping Oil Near Limits: Macron
The UAE and Saudi Arabia’s oil production is nearing their limit, French President Emmanuel Macron told his U.S. counterpart during the G7 meeting this week.
The French president was referring to a conversation he had with the rule of the Emirates, as caught by Reuters. According to the cited conversation, the UAE was already “at maximum,” Macron told Biden. Whether that was referring to the maximum as allowed by OPEC quotas or maximum capacity remains unclear.
“And then he [Sheikh Mohammed bin Zayed al-Nahyan] said (the) Saudis can increase by 150 [thousand barrels per day]. Maybe a little bit more, but they don’t have huge huge capacities before six months’ time,” Macron also said, as quoted by Reuters.
BP’s Statistical Review of World Energy is now out.
Interestingly, the sheet “Proved Reserves” has not been updated to 2021. It is the same as the 2021 version, which contains data up to 2020.
https://www.bp.com/en/global/corporate/energy-economics/statistical-review-of-world-energy.html
Big red footnote in the excel table:
https://www.bp.com/content/dam/bp/business-sites/en/global/corporate/xlsx/energy-economics/statistical-review/bp-stats-review-2022-all-data.xlsx
“Please note that due to process improvements for the Statistical Review these reserves tables have not been updated this year.”
Funny, I think we can all guess what numbers come next for 2021 and 2022:
Proven Reserves (thousand million barrels): 2018 (1,736.1) 2019 (1,734.8) 2020 (1,732.4)…
Maybe 1,730 for 2021 and 1725 for 2022? Could be a much bigger drop than that, who knows…
The SEC requires all listed oil companies to determine their P and P reserves on December 31 using the current price and technology. Dec 2019 about $65, Dec 2020 about $48 , Dec 2021 about $75. The change from 2020 to 2021 will certainly be an increase in P and P reserves.
2021 Oil highlights from BP’s bible
Virus related as follows:
US 2021 consumption 18.6 mbpd 8.7% from 2020, still down from 2019
Poland consumption WAS UP from 2019
Ditto Romania
Ditto Russia
China is up over 7% from 2019, and recall they were the only country to increase consumption 2020
They log in at 15.4 mbpd 2021 Relentless increases
South Korea consumption is also up over 2019
Taiwan slightly up
Production:
US down from 2019 and 2021 number 16.58 mbpd (all liquids)
Canada UP from 2019 2021 number 5.4 mbpd
Norway up 300K bpd from 2019
Iran up from 2019
(pssst if you think China growing consumption 7% from 2019 is a lot, imagine what it will be buying cut rate diesel rich Russia crude)
And barely a hint of slowing in atmospheric CO2 trend over the pandemic:
https://gml.noaa.gov/ccgg/trends/
if such were to be expected.
I think the BP annual energy review gives an impression that the 2020 covid situation was a pump in the road, and that it was more or less business as usual in 2021. The covid situation certainly affected oil more than other energy types, and demand had not even recovered fully in 2021.
Some nations showed a decline of their oil consumption (crude, condensates and liquids together seems to be what is being measured) due to demographics and energy policy mainly. The European nations as a whole has decreased consumption a lot the last 10 years (-1% annually). West European much more, while Eastern European nations were in contrast growing in their consumption. Japan down a lot last 10 years with -2.7% annual growth probably due to demographics first and energy policy second. In North America it seems the shale revolution did that consumption stayed more or less still from 2011-2021 with -0.1% for the decade (even with Mexico dragging down hard with -4.2% annually). Some nations are in between, wants growth and renewables if the economics and rationale is there. And some nations simply don’t care when it comes to the energy transition and just want business as usual (Russia and Iran are the main culprits). China certainly was on an adrenaline rush with 4.8% annual consumption increase from 2011-2021.
https://www.bp.com/en/global/corporate/energy-economics/statistical-review-of-world-energy.html
https://mishtalk.com/economics/g-7-agrees-to-cap-the-price-of-russian-oil-using-a-buyers-cartel
G7 agrees to “cap” the price of Russian oil
A demonstration of how the G7 and more particularly the US is isolated from the world community:
https://t.me/intelslava/32151
Concept
Don’t let your adversaries or other random bullies engage in optional invasion of other countries without attempting to challenge them hard.
Or else the pattern of behavior is likely to become the norm.
Too bad no one challenged the US hard on VietNam (besides the invaded country).
We, and others, might have learned a stronger lesson.
https://mishtalk.com/economics/a-laughable-explanation-of-the-g7-oil-price-buyers-cartel-emerges
Mish Shedlock:
Occam’s Razor
I am a big fan of Occam’s Razor. The idea is best described as the simpler the explanation, the more likely it is to be correct.
My corollary is “If stupidity is a possible explanation for anything, that’s likely the reason.” I use that idea to discard most conspiracy theories.
And as you look at the above proposal, you may be asking “Can these leaders really be that stupid?”, the unfortunate answer is “Yes!”.
If I’m not mistaken it was the North Vietnamese army that invaded the south first.
You are mistaken.
That was not act 1.
It was act 734
The point about US optional invasion of VietNam (and Iraq) akin to Russian optional invasion of Ukraine, or German optional invasion of Poland 1939, or Japan optional invasion of Asia early 20th century
are examples of optional destabilizing invasions.
No one should be surprised that capable nations will provide push-back against these invasions.
In news on this today “Russia calls NATO expansion deal ‘destabilizing’”
Reality Check-
The invasion of Ukraine was destabilizing.
The emperor wears no clothes. People are figuring out that OPEC has no spare capacity, and if that genuinely sinks in with oil traders, all bets are off.
“No statements made by OPEC in the coming two days are going to be able to remove the worries in the market. OPEC’s future depends fully on its power to stabilize markets. At present, there appear to be no options available to the cartel. Without new oil production hitting markets soon, OPEC leaders MBZ and Crown Prince Mohammed bin Salman need to try to maintain the illusion of spare capacity. If spare production capacity is revealed to be under 1.5-2 million bpd, the future of both OPEC and oil markets would be bleak.”
https://oilprice.com/Energy/Energy-General/Oil-Markets-Could-Face-A-Doomsday-Scenario-This-Week.html
S+H
OPEC was always about protecting the downside risk to oil prices, the inventory control aspect was the sugar coating on the pill. If they run out of spare capacity and no one else in the world can step up, the need for OPEC disappears and the oil exporters in the group will be in the clover.
Tropical weather update. Better keep an open tab on this one, it’s going to be a long summer…
https://www.nhc.noaa.gov/gtwo.php
My key take-aways:
On average, the Top 9 (U.S – Saudi Arabia – Russia – Africa – Canada – Iraq – China – UAE – Iran) oil producers peaked in 2017-2018.
The Top 9 currently account for ~75% of all oil production (in contrast, in 2000 the ‘Others’ accounted for almost 40%, while the Top 9 were 60%). 22 years ago Mexico, Venezuela, and Norway played a larger role than they do today (together those 3 produce less than half of what they did in 2000).
Actual observed world peak was 2019 largely due to massive gains in US output between ~2016 and 2019 (~40% increase).
US #1 (2019 peak)
Saudi #2 (2018 peak)
Russia #3 (2019 peak)
Africa #4 (2012 peak)
Canada #5 (2021 peak)
Iraq #6 (2019 peak)
China #7 (2015 peak)
UAE #8 (2016 peak)
Iran #9 (2017 peak)
Everyone else ‘Others’ #10 (peaked in 2005).
For the ‘Others’, between 2015 and 2020, production has been falling steadily at an average of ~3%/year.
Before that (2005-2015), the decline rate was less, only ~0.7%.
Some other highlights:
Between ’18-’19 there were 3 considerable drops in production including Iran, Venezuela, and Saudi Arabia. Their total decrease was around 2.5% of world production. Three notable increases in Norway, Iran, and China were observed between 18′-’19.
Comparing ’19 to 21′ (excluding the 20′ covid slump), the most significant countries falling short in 21′ (compared to 19′) were Saudi Arabia (-879k barrels), Russia (-735k barrels), Iraq (-677k barrels), US (-529k barrels), Nigeria (-476k barrels), Venezuela (-368k barrels), and UAE (-331k barrels).
I’ve seen estimates (Dennis) where US shale increases year over year adding ~600k barrels each year until ~2030. If actually possible, that still wouldn’t make up for the ‘Others’ decline rate.
It’s very important that we look carefully at the past 10-20 years of data, it shines a light on where we are headed…
Ken Geo,
It will be combination of increases in output from tight oil, oil sands, deep water offshore (Guyana, Suriname, Brazil), and large Middle east producers (Saudi Arabia, Iraq, UAE, Iran and Kuwait) that will offset declining output from the rest of the World from 2022 to 2029. After that I expect declining World C plus C output after 2030, possibly with demand for oil falling faster than supply and leading to falling oil prices in order to balance supply and demand.
Can you think of something that changed from 2005-2015 compared with 2016 to 2021? This does not include either the Covid 19 Pandemic or the Russian invasion of Ukraine and applies to the entire World oil market (a two word answer). Note that the Others decline rate includes Venezuela which declined by over 2.1 Mb/d from 2015 to 2021 (C plus C data). In 2021 Venezuela was only producing 605 kb/d, so that decline (400 kb/d annual decline rate) cannot continue for more than 1.5 years. The decline in Africa is from Nigeria and Angola mostly and the total decline from these nations may see annual decreases of about 200 kb/d, while Venezuela’s decrease in the future will likely be about 50 kb/d or less. We will see middle east and north america increase output in the future. If we take World C plus C output minus (N america plus middle east plus CIS plus Venezuela plus Angola plus Nigeria) we get an average annual decrease of this “other producer” group of about 93 kb/d from 2015 to 2021. Adding up the decreases from Venezuela, Angola, Nigeria, and “other producers” we get 200 plus 50 plus 93 = 343 kb/d. Increases from North America, MIddle east, Brazil, and Guyana over the next 6 to 8 years are likely to be larger than decreases from elsewhere in the World. A new peak is likely in the 2025 to 2030 time frame depending upon the speed of the transition to electric transport, the peak might end up resulting from falling oil prices due to a lack of demand, but I think lack of supply due to geological and technological constraints at a high oil price level in 2028 is more likely.
Saudi production (I have used the average for Jan and Feb for 2022 number and will adjust it as the data becomes available). Ultimate for C&C 344 Gb, Depletion level 50%.
Seppo,
There is also data at OPEC for crude only
https://asb.opec.org/data/ASB_Data.php
using that for 1999 to 2021 annual data I get about 336 Gb for the Saudi crude ultimate with cumulative of about 162 Gb at the end of 2021, about 48% depletion. If we assume 10.4 Mb/d of crude output in 2022 and 2023, 50% depletion of crude oil resources in Saudi Arabia is reached in mid 2023 under that scenario if the HL estimate is correct. Rystad estimates Saudi 2PCX resources at 275 Gb and adding cumulative production of 162 Gb suggests an ultimate of 437 Gb (if the Rystad estimate is correct). This estimate for Saudi URR suggests a depletion of 37%. An HL on 1999 to 2018 suggests a URR of about 375 Gb, not clear from HL what the ultimate will be.
Thanks Dennis for this information. I was unaware of this link to OPEC data and have only used EIA data in the past. A cursory look shows that when condensates are excluded the numbers are a lot less.
Talks to renew the Iran Nuclear Deal (which is really the Iran Oil Deal) have failed…
Iran’s millions of BBLs of excess crude will remain stored in tankers for the foreseeable future…
NOTE: a 2nd Iranian news agency is saying that the Iran nuclear talks have NOT concluded – but will conclude today…
Dennis – For the quiz portion above, Donald Trump/China Sanctions?
Most likely was the drop in Oil Price around end of 2014 (2007-2014 was essentially >$70-80/barrel).
By Jan. 2015 it dropped to $50/barrel and stayed between $35-$75 up until a year ago (reopening).
I concede that some US oil production growth is likely, (but not guaranteed).
A best case (unlikely) scenario sees Brazil climbing yearly 200 kb/d, to hit a new peak sometime in 2024. But I think Brazil needs most of what it produces, so really not a source to the world market anyhow…
Current 6 year trend for middle east countries is downward trajectory of 850 kb/d each year…when do you anticipate that giant losing streak to turnaround?
From what I can tell Guyana is 5 years out, so that wouldn’t have an impact for a long time…I believe Exxon anticipates 1,200 kb/d day sometime in 2027…
Here’s another roundup of 2018 vs 2021:
Middle East production (yearly) down 1,135 kb/d
US production (yearly) up 425 kb/d
Russia production (yearly) down 206 kb/d
Africa production (yearly) down 328 kb/d
Canada and China each up ~60 kb/d (yearly)
‘Others’ production down 550 kb/d (yearly)
All together this is a loss of 1,674 kb/d
A lot more downs than ups…
World production yearly growth from 2009-2015 was ~1,900 kb/d
Best case scenario appears that we’ll be lucky to keep production steady, but most likely we will see continued overall production drops due to a number of factors, the biggest being natural depletion since most fields are nearing or passing their prime.
Price sensitivity is another big factor, many of the producing nations rely on their exports…I don’t think there’s a single producer that wants to sell for under $100/b (including US and Canada).
What is the impact of inflation on your models?
Thanks for the discussion!
Ken Geo,
I always do my prices etc in real dollars (inflation adjusted to 2021 US$ currently), so inflation has little impact on my scenarios.
The Middle east cut production due to a glut of oil starting in early 2019 and then cut by much more in 2020. Also sanctions on Iran limit production there.
For Brazil see
https://peakoilbarrel.com/brazil-summary/#more-30556
based on George Kaplan’s analysis, it looks like there may be some room for growth in Brazil, Guyana will gradually increase output. US tight oil output may grow by about 4000 kb/d from now until 2029.
For middle east the EIA expects the following (about a 5 Mb/d increase in annual average output from 2022 to 2028 from 22 to 27 Mb/d) see IEO at link below. Also note that according to the EIA average annual output of C plus C by the middle east was 24707 kb/d in 2021, by Feb 2022 middle east C plus C output was up to 26958, output has continued to rise by 484 kb/d through May (big 5 middle east OPEC producers crude only), that brings output to 27442 kb/d, the middle east average in 2017 and 2018 was 27907, part of the decrease is due to sanctions on Iran.
My expectation is that OPEC has more proved plus probable reserves that can be developed between now and 2028, high oil prices will make it attractive to do so. In addition they risk having stranded assets if the oil is developed later, doing it now while oil prices are high reduces that risk.
I mention this often , but my scenario is pretty conservative. Did you look at the Laherrere paper from August 2018?
https://aspofrance.org/2018/08/31/extrapolation-of-oil-past-production-to-forecast-future-production-in-barrels/
There is a nice summary at the end of the report, his estimates tend to be very conservative.
See for example this old post from 2014 (at the time my estimate for Bakken/TF URR was 8.6 Gb (see comments).
https://peakoilbarrel.com/bakken-oil-peak-jean-laherrere/
At the end of 2020 cumualtive production from the Bakken/Three Forks was about 3.7 Gb and proved reserves were also 3.7 Gb at the end of 2020 for a total of about 7.4 Gb if no new resources are developed in the future and probable reserves are equal to zero (neither of these assumptions are likely to be correct.)
https://www.eia.gov/outlooks/aeo/data/browser/#/?id=21-IEO2021&sourcekey=0
The answer was indeed oil price. From Jan 2005 to Dec 2014 the average Brent oil price was $106/b in 2021 US$, from Jan 2015 to Dec 2021 the average Brent price was $61/b in 2021 US$. The $45/bo decrease in the real price of oil leads to less investment in new oil projects and lower supply. A return to higher oil prices may change the level of investment by the oil industry and lead to an increase in supply.
Thank you for the intelligent discussion.
That OPEC Middle East graph doesn’t look realistic. A mirror image of the graph would be more believable in my opinion.
Frugal,
I think up to 2035 it may be realistic. Consider the following for OPEC middle east C plus C output from 2000 to 2019 using BP Statistical Review of World Energy data, an OLS trendline is fit to the data and extrapolated to 2030. In 2020 and 2021 OPEC reduced output due to the pandemic as you may recall, OPEC output has been recovering strongly in the past 18 months, the IEO probably has it about right through 2030 at least and possibly through 2035. After that output may fall as demand may falter and drive down oil prices and new investment in oil production.
Note that the output in 2022 will be similar to 2019 annual output so the extrapolated line needs to be shifted lower from 2022 to 2030 due to the pandemic cuts by OPEC, 2030 middle east C plus C output would be about 28500 kb/d, if my guess is correct (highly unlikely). The IEO scenario is actually more conservative than this with middle east OPEC output at only 28080 kb/d in 2030.
Dennis, your charts often give a false impression of the actual trend. The one above is no exception. The trend is actually upward to the peak in 2016, 2017, and 2018. That was a three-year plateau. The trend is now slightly downward leading, very likely, to a steep decline in this decade.
The one-month spike upward in April 2020 is everyone delaying maintenance and emptying their storage tanks in order to set a higher production point for the coming quotas.
I know you can make better charts Dennis. I think you deliberately make them vague.
Click on the chart below to enlarge.
Ron,
As I said, the chart uses annual data from BP statistical review of World energy, the little wiggles up and down in the 12 month average data are of little consequence in my opinion.
Did you hear about OPEC cutting output in 2019 and 2020?
I could use the period from July 2020 to Feb 2022 to find the recent trend using EIA monthly C plus C data, but that would be silly imo. See chart below, which I think would be an absurd forecast, so I chose my vague chart instead in order to find the long term trend.
Only production is counted, emptying storage tanks shows up in exports and consumption, but not production, a delay of maintenance for a month might make a bit of difference, it may be that they filled their storage tanks as often the GOSP is the bottleneck so some produced oil may not have gone through the GOSP and an estimate is made of how much water will be pulled out in the GOSP in order to estimate oil produced.
These OPEC games are part of the reason the long term trend gives better information and why annual averages are also more informative. The monthly ups and downs are noise.
Dennis, that chart starts in July of 2020, right at the bottom of the covid-19 destruction cuts. All the data you show is simply the recovery from those cuts. They are now already past their pre-covid level. Yet you show that the recovery rate continues for another two years at over 260,000 barrels per month until they get to 30,000,000 barrels per day. Up almost 7,000,000 barrels per day!
Dennis, do you really believe that shit or are you just trying to be funny? Because if you truly believe that projection I have a bridge I need to sell you.
The chart below makes what you are projecting a bit clearer. As I said, your charts are a little deceiving.
Oh, and you are wrong about emptying storage tanks. Secondary sources have no way of knowing wher the oil came from. They estimate consumption and measure exports. That is how they arrive at their estimate. They have pulled that trick in the past. I have read articles where they have been accused of doing exactly that to show increased production for quotas.
EDIT: I just realized your chart is C+C and mine is crude only. Okay, you are predicting an increase of only 5 million barrels per day onve the next two years. Still… Fat Chance!
Click on chart to enlarge.
Ron,
Chart below uses EIA monthly C plus C data (Jan 2000 to Dec 2019) instead of BP annual
C plus C data (2000 to 2019) for OPEC big 5 (Saudi Arabia, Iraq, UAE, Kuwait, and Iran). Data from Jan 2020 to Feb 2022 is shown in red (thicker line), the thin line in blue (Jan 2000 to Dec 2019) is used to find an OLS trend line which is extrapolated to 2030 (equation of the line is shown on chart). In my view the long term trend is of greater interest.
This chart seems more reasonable than the recent 20 month trend shown in the previous chart, output obviously does not exactly follow a straight line, but all of us are well aware of that fact so it seems unnecessary to state it.
Another difference on my chart using BP data was it used a zero scale in order to make it more comparable with the chart from the EIA’s IEO for the OPEC middle east.
Strange Dennis. Your chart shows all of the oil production above your straight line between early 2015 through 2018. But from the beginning of 2019 through the present, almost all the oil production is below that straight line.
I think I could draw a far more accurate line than that. That chart clearly shows a peak in 2016 and then a three-year plateau, ending in a downward trend beginning in 2019.
Ron,
There is a straightforward explanation for both the increase above trend from early 2015 to the end of 2018 and the fall in output after Dec 2018. During 2015 to 2018 OPEC was trying to punish US tight oil producers by flooding the market with oil and driving down prices to take back market share (also sanctions on Iran ended during this period). Near the end of 2018 OPEC changed course and decided to reduce output to boost the price of oil, then Output was further reduced in 2020 in response to the pandemic, in between there was a brief spat between Persian Gulf producers and Russia which led to the spike in output in early 2020 (in this case Persian Gulf producers were trying to punish Russia). The slight decrease from 2016 to 2018 was due to sanctions being imposed on Iran when Trump left the JCPOA.
I doubt the middle east producers will follow the 2000 to 2019 trend from 2022 to 2030, but I do expect that high oil prices may lead to more investment by the big 5 OPEC producers in undeveloped resources and potentially a moderate increase in capacity.
Dennis, your projections, there are two of them, in your chart above do not match your 7 million barrels per day predicted increase by July 2024 in your other projection above. I wish you would be more consistent. I do not know which one to take seriously.
Well, actually I take none of them seriously. 🤣
Hi Ron,
The chart with the very steep slope was to show that using a short term trend to predict the future can lead to a poor projection.
I believe I said this about the chart with the steep slope of about 2492 kb/d:
I could use the period from July 2020 to Feb 2022 to find the recent trend using EIA monthly C plus C data, but that would be silly imo. See chart below, which I think would be an absurd forecast ….
I think calling the scenario absurd is a not so subtle hint that I think it is ridiculous, silly, not correct, etc.
The point was that using short term trends is not very useful for projecting the future in my view.
I expect output might reach either 27500 (most recent projection, which uses data through May (using condensate total from Jan 2022 to estimate condensate from March to May 2022) and the EIA monthly data from Jan 2000 to Dec 2019 to find the slope of the future increase (green dotted line).
The projection using BP annual data assumed 2022 output would be roughly near the 2019 level and annual increase would follow that trendline (slighly steeper slope than the EIA monthly data). Both are fairly close to the EIA’s IEO projection in 2030 (which is about 28.1 Mb/d. So 28 /- 0.5 Mb/d for OPEC middle east C plus C output is my estimate for 2030, based mostly on the 2000 to 2019 trend in historical output.
The charts with trends having a slope of 400 /-20 kb/d for annual increases in OPEC middle east output are reasonable. A chart with output increasing (or decreasing) long term at 2400 kb/d per year is not reasonable, aka wrong imho.
OPEC Latest: Meeting Concludes Without Discussion of Oil Policy
Shell CEO comments below are very interesting.
Iran Nuclear Talks in Doha End ‘With Little Effect’ (2:15 p.m.)
The decision-making process may grow a little easier for OPEC after the latest round of nuclear talks between fellow member Iran and the European Union ended on Wednesday with “little effect on progress of negotiations,” semi-official Tasnim news agency reported, citing informed sources.
That means OPEC’s top two producers, Saudi Arabia and the United Arab Emirates, can be less concerned about the prospect of a breakthrough that would lift US sanctions on Iran’s petroleum trade — pushing a flood of crude onto the market and enriching their political rival.
Shell CEO Says Spare Capacity Running Very Low (13:37 p.m.)
The world is set for a “turbulent period” because spare energy production capacity is running “very low,” Shell Plc Chief Executive Officer Ben van Beurden told journalists in Singapore. OPEC doesn’t have as much idle capacity as many people think and there is a “fear factor” in oil prices as a result of an “ever-tighter market,” he said.
https://ca.finance.yahoo.com/news/opec-latest-meeting-concludes-without-130508651.html
The EIA has not published US production for April. However the Monthly Energy Review is out with preliminary output for April and May, red markers. For April output was 11,870 kb/d and May added 14 kb/d to 11,884 kb/d.
It is difficult to believe the April number since North Dakota has stated that their production dropped by 215 kb/d in April.
North Dakota oil production was down 222,000 barrels per day in April. The Monthly Energy Review has total US production up by 215,000 barrels per day in April. That means the total US production outside North Dakota had to be up 437,000 barrels per day in April. I find that hard to believe. They will definitely be revising their April production numbers next month.
The release of the Petroleum Supply Monthly, which was due today, now has the release date as TBD, to be determined. The review was four days late. So if the PSM is not out tomorrow, it will be at least Tuesday before we get it.
Ron,
They said it will be next week (hopefully Tuesday).
see
https://www.eia.gov/pressroom/releases/press508.php
We will publish our monthly data releases, including the Petroleum Supply Monthly, Natural Gas Monthly, and Electric Power Monthly, next week.
I agree the MER is likely wrong, the STEO has output at 11.55 Mb/d for April which is a better estimate, but might still be too high, it depends in part on what happens elsewhere in the US in April.
Ron
I should have said, more accurately, that North Dakota reported Bakken production was down by 215 kb/d in April. I posted the ND Bakken data after the DPR Bakken report above.
Ovi,
Interesting that the MER data for April and May seems to match the 4 week average from the EIA’s weekly crude oil estimates (may 11.89 Mb/d, april 11.88 Mb/d). I had remembered incorrectly that the STEO was used for these last two months of the MER. Clearly that is not the case as the STEO has April 2022 at 11.55 Mb/d and May 2022 at 11.71 Mb/d. The STEO is likely to be closer to reality imho. Note that the STEO has April 2022 at about 220 kb/d below the MER estimate, roughly matching the drop in North Dakota output in April 2022, this might simply be coincidence. It is unclear why the MER seems to use the weekly estimates rather than the STEO as the weekly estimate is based on an earlier (and less accurate) STEO, I would think the folks at the EIA should realize this (as they do the models and tabulate the data). Unfortunately in a large organization often the left hand has no idea what the right hand is up to. I don’t imagine they read this blog at the EIA.
Dennis
I have calculated the U.S. monthly production many times using the weekly data and it comes very close to the MER.
I am curious on why the STEO has April lower. Maybe they read newspapers and were aware of the bad weather in ND in April.
Ovi,
The EIA may have consulted the Director’s cut at the NDIC.
Does it seem strange to you that they would use the weekly numbers for the MER? The weekly numbers are based on the current STEO, so for April 2022 we had an estimate of 11840 kb/d in the March STEO (released March 8, 2022) and 11830 for the April STEO (released April 12, 2022) for an average of about 11835 kb/d for April 2022 (which is reflected in the 4 week average of 11875 for 4 weeks ending April 29, 2022) note that the discrepency may be due to Alaskan output which is kept very up to date by the State of Alaska and used in the weekly estimate, only L48 STEO estimate is used for weekly crude supply estimate. For May 2022 the STEO had 11900 kb/d in the April STEO and 11840 kb/d for the May 2022 STEO (April had been revised lower to 11630 kb/d in the May 2022 STEO). This would suggest a weekly estimate for May of about 11870 kb/d and indeed the 4 week average for May 27 was 11875 kb/d.
I just don’t understand why the most recent STEO isn’t used for the most recent two months reported in the MER, would you agree the estimate is likely to be more accurate in that case?
The most recent June STEO has April at 11550 kb/d an May 2022 at 11710 kb/d, these seem to be far closer to reality than what is reported for April and May 2022 in the MER.
Wonder if BP is planning to downgrade reserve numbers, as Rystad is doing now
https://www.oilandgasksa.com/news/total-recoverable-oil-lower-rystad
Thanks Seppo,
Interesting that Rystad has TRR at about 1572 Gb at the end of 2021, with a drop of about 27 Gb from the end of 2020. Production of C plus C in 2021 was about 28 Gb, so the drop could be explained by a lack of discoveries or reserve growth in 2021. Cumulative C+C output at the end of 2021 was about 1437 Gb, if the Rystad estimate is accurate URR would be about 1572 plus 1437 or 3009 Gb, this is similar to my best guess for World C plus C URR (currently my estimate is 2973 Gb), but basically each estimate should be rounded to 2 significant digits so in reality the estimates are equal at about 3000 Gb for World C plus C URR. Jean Laherrere has an estimate of 2700 Gb or 3000 Gb in an August 2018 paper. (At end of paper he suggests 2700 Gb, but earlier in the paper he has 2600 to 3000 Gb for World C plus C less XH and an estimate of XH at the end of paper of 215 Gb, taking 2800 plus 200 of XH to get the 3000 Gb estimate, perhaps 2850 Gb (average of 2700 and 3000) would be a rough guess. In general Laherrere’s URR estimates have tended to increase over time as reserves have appreciated and new discoveries have occurred.
https://aspofrance.org/2018/08/31/extrapolation-of-oil-past-production-to-forecast-future-production-in-barrels/
Rystad chart, better resolution in article posted by Dr Korpela.
I just took a look at the rystad report for the end of 2020, the World total 2PCX estimate and there has been a drop of 152 Gb, only 28 Gb can be explained by oil produced, the difference of 124 Gb is a drop in the resource estimate of roughly 8%. For last year’s Rystad reserve report the 2PCX estimate was very similar to the BP reserve estimate, so now I understand Dr. Korpela’s question better. I would think BP may revise its proved reserve estimate lower in the future.
Rystad report from July 2021 at link below
https://www.rystadenergy.com/newsevents/news/press-releases/worlds-recoverable-oil-now-seen-9pct-slimmer-commercial-volumes-can-keep-global-warming-below-1p8c/
Dennis
Late last year, Rystad published this oil discovery chart. It shows that only 4.7 B barrel of BOE were discovered up to October 2021. Lowest year in quite a while. The 34:66 below the 4.7 is the gas to liquids ratio.
Thanks Ovi,
Not a lot of exploration happening in 2021, only 1.6 Gb discovered in first 10 months (maybe 11 months) of 2022, possibly 1.7 Gb of liquids if December was similar to the previous 11 months for average discovery (424 million BOE) assuming the gas liquids ratio remained at 34:66.
I wonder if the Rystad 2PCX estimate includes expected reserve appreciation.
Dennis
I think the look of the chart is misleading. Above you state “only 1.6 Gb discovered in first 10 months (maybe 11 months) of 2022, possibly 1.7 Gb of liquids”. The liquids are 0.66*4.7 = 3.1 Gb.
Here is clarification from the original article. Note no discoveries in first three weeks of December.
“Global oil and gas discoveries in 2021 are on track to hit their lowest full-year level in 75 years should the remainder of December fail to yield any significant finds, Rystad Energy analysis shows. As of the end of November, total global discovered volumes this year are calculated at 4.7 billion barrels of oil equivalent (boe) and, with no major finds announced so far this month, the industry is on course for its worst discoveries toll since 1946. This would also represent a considerable drop from the 12.5 billion boe unearthed in 2020.”
https://www.rystadenergy.com/newsevents/news/press-releases/2021-global-oil-and-gas-discoveries-projected-to-sink-to-lowest-level-in-75-years2/
Ovi thanks for the clarification and correction. Not likely there were any big finds that last week of December so yes 3.1 Gb of liquids (as I got the gas to liquids ratio reversed and used 34% instead of the correct 66% of BOE).
BP apparently did not update 2021 Reserves. Is this an all time first?
Jean Laherrere’s newest Global Oil Reserves, minus HOPIUM, GARBAGE, and ENERGY TOOTH FAIRY Resources show a more realistic 770 Gb.
THERE LIES THE RUB… Welcome to the Energy Cliff.
steve
Steve,
If we assume no future resrve growth or discoveries you would be correct.
Those are not very good assumptions based on history.
US proced plus probable reserves grew by about 63% from 1980 to 2005. Reserve growth is real.
Of course reserve growth is real. And Reserve Growth Rulz. 🙂
Always amazed me how long it took Happy McPeaksters to notice when I chose it as a user name in 2005 because it was obvious. Not so much the “Rulz” part at the time, so that part was just me being unnaturally precognitive.
Yes, Dennis, reserves bib grow. Yes, we did make a lot of discoveries. And you just assume we will go on making more and more discoveries. And you assume reserves will continue to grow and grow. Are you sure that’s how it works Dennis?
Ron,
Jean’s newest Global Oil Reserves chart, showing the 2P Reserves, includes all the newest additions. Unfortunately, while the oil industry is spending money to find oil, less than in the past, it still isn’t finding much oil. So, there really isn’t much GOOD STUFF left, which is why Russia is trying to extract oil from the Arctic.
steve
He might not know, but apparently the USGS solved the problem from a technical perspective nearly a decade ago now. Damn scientists, figuring stuff out, posting the methods and results, and then the amateurs can’t be bothered to read it. ‘Nuff said….back to randomly fitting curves and calling the next peak oil of the century (#7 warming up in the wings!).
Nuff said….back to randomly fitting curves and calling the next peak oil of the century (#7 warming up in the wings!).
Errr… there ain’t no next perk oil. There was only one and it was three years ago.
Maybe start calling it “Woe-PEC”?
https://oilprice.com/Energy/Energy-General/OPECs-Oil-Production-Drops-As-Cartel-Undershoots-Target-Again.html
Stephen
Possible more WOE from the EIA. The EIA has just posted this headline and have attached the chart below: “EIA estimates show a decrease in global surplus crude oil production capacity in 2022”
The chart shows the spare capacity of OPEC and Non-OPEC countries up to 2021, very visible. In much lighter blue for 2022, its shows a remarkable projected collapse in spare capacity. From a spare capacity of 7 Mb/d in 2021, it drops to around 3.5 Mb/d in 2022 and with virtually no spare capacity for Non-OPEC. OPEC drops from 5.5 Mb/d to a little over 3 Mb/d in 2022.
Some may say the OPEC spare capacity is too high. I would agree. What is startling is the big drop that the EIA is now estimating.
https://www.eia.gov/todayinenergy/detail.php?id=52879
Ovi,
Yes spare capacity is very low, high oil prices will continue until this is addressed.
Dennis, how can this be addressed when just upstream y’all were talking about close to zero discoveries in 2021? What I read about all the majors’ windfall profits is stock buybacks and dividend increases, not E&P. The fact is that they aren’t even trying. If OPEC isn’t increasing at $115 Brent then it just isn’t gonna happen. The post COVID peak appears to be right now.
Rig count down 3 this week:
https://www.houstonchronicle.com/business/energy/article/U-S-rig-count-down-3-this-week-as-oil-prices-17279527.php
Our labor and supply chain issues are getting worse.
We have been waiting on a rig for over two weeks, and have been waiting on two pumping units we ordered for almost two months. They are in TX, can’t find anyone to deliver them. The supply store has 30 ordered, all sold, but can’t get a semi. These are 25 units, which are small.
I think it’s pretty amazing that the US rig and frac spread count is where it is given labor and material issues.
Thanks Shallow, imagine the supply constraints in some of the other places that try to operate with
less efficient economies, like Ecuador or Angola or Nigeria. One can only speculate how challenging maintaining oil production levels in many of these places is without access to replacement parts in a timely manner.
Stephen,
Even with no discoveries there is still reserve growth and existing discovered resources that can be developed. I am talking about developing discovered resources, but also higher prices may lead to more exploration.
Wrong, prices are going lower much lower as a repeat of 2008 plays out.
There are a lot of opinions and misconceptions of what 2008 was all about. Be it bad mortgages or high oil prices.
2008 was a global dollar shortage as the banks in Eurodollar system became risk adverse and stop creating loans also known as bank deposits.
As the global reserves currency there is a synthetic short on the dollar as dollars are borrowed to fund pretty much everything.
Btw more dollars are loaned into US from banks that are outside the US than are from banks inside US.
Global reserve currency is actually the Eurodollar market. There is a big difference between banks reserves created at the FED and bank deposits created in Eurodollar market.
Eurodollar curve is screaming dollar shortage. Keep ignoring it. But when oil is back at $25 I told you so.
“But when oil is back at $25 I told you so.”
When it isn’t, I told YOU so.
So lay your argument out why I’m wrong.
HHH,
Demand will be geater than supply even with a recession.
What level of worldwide real GDP growth do you expect in next 12 months?
If it is more than -2%, you will be wrong imho.
You are preaching to the peanut gallery HHH. You are spot on but most people on this site still believe in supply and demand. They have little idea how the real economy works and therefore will always be surprised and say this shouldn’t be. Or that shouldn’t happen”
HHH
If there is a short on the dollar, why is it at a five year high in the DXY and almost at par with the EURO.
Please explain in detail since I don’t understand the currency markets.
Ovi,
I know the question wasn’t addressed at me but HHH is saying there is a dollar shortage not a short, hence the increase in value on the DXY. And USD is always in demand during perceived recessions and economic uncertain times such as now, as it’s seen as a flight to safety.
Iron Mike
Thanks for the clarification. DXY high now makes sense.
When dollar’s are borrowed your effectively shorting the dollar and going long whatever it is your buying.
The whole world borrows massive amounts of dollars to do business. That’s the short.
Dollar strengthens as banks that do all the lending for whatever reason become risk adverse or balance sheet constrained due to collateral or lack of collateral. Sometimes it’s a regulatory constraint. Banks either won’t or can’t lend.
In Europe a lack of natural gas is a huge reason not to lend. In US companies are sitting on record amounts of inventory. Corporate debt is also at all time highs. So corporate profits will be tanking. Good reason not to lend.
China’s #1 and #2 customers are the US and Europe. Good reason not to lend into China.
What we are seeing in currency markets isn’t capital flowing into the US dollar. It’s a lack of US dollars flowing or being created.
Strong dollar is inflationary if you live in Japan. Japan is paying 50% more in dollar terms for 5% more imports by volume. That’s year over year month of May.
Similar situation in Germany. 25% more for actually 3% less goods and services.
As dollars become harder to source. And debts harder to service. We will see a deflationary debt unwind.
And yes low oil prices.
HHH
What is an individual doing when he buys a US stock. I am asking this in terms of your first statement. I am wondering because I am not sure if $ and Stocks are monetary assets.
Also when a foreigner buys US Stocks, he must convert his local currency in US dollars. Isn’t this demand for US dollars and why isn’t this capital flowing into US dollars.
HHHs explanation is thorough. But to simplify keep in mind – if the whole world is on the wrong side of a trade (short dollars) – as it starts to unwind its going to go violently in the other direction. That’s why HHHs prediction of low oil prices is correct. All commodities are rolling over. Oil was last of Mohicans (pivotal role ans supply constraints).
Dennis,
It could continue, but there will be a lot of downward pressure on prices as the global economy moves into recession.
2022 Q1 U.S GDP | -1.6%
2022 Q2 U.S GDP| -1% (St Louis Fed prediction)
CPI | 8.1%
So the U.S is in a technical recession, with high levels of inflation, hence stagflation. So have you accepted the stagflation scenario playing out like I and many armchair economists predicted last year ? Or are you still in denial Dennis?
HHH,
Demand will be geater than supply even with a recession.
What level of worldwide real GDP growth do you expect in next 12 months?
If it is more than -2%, you will be wrong imho.
I am less concerned with inflation.
The recession is likely to bring down the rate of inflation. Note however that I cannot predict the future, nor can you.
You can sometimes guess correctly perhaps, but currently you are predicting the past.
Tell us what will happen in the next 12 months and we can check back and see if you were correct.
I do not know what the future will be.
Dennis,
it’s not me predicting anything. The largest banks in the world that make all the loans are telling you this via the Eurodollar yield curve.
They see a very fragile economy that’s about to implode and not only that they see it as imminent.
It’s happening now and will play out over the rest of this year and 2023.
Keep an eye on on REPO fails. Which are when one of the party’s involved in a REPO transaction fail to return either the collateral or the cash.
We aren’t at 2008 levels of REPO fails yet. But this is where the financial plumbing breaks down. It’s ground zero.
https://www.cnbc.com/2022/06/30/the-markets-worst-first-half-in-50-years-has-all-come-down-to-one-thing.html
Not that i agree with the article but Only in Dennisworld are there no signs of a problem. Let the strawmen come forward in 3, 2, 1…
The inversion of Eurodollar curve into the whites or shortest term contracts suggest we will be in a situation before years end where the FED will be cutting interest rates instead of raising them.
So by say October or November FED will be cutting rates. Growth and inflation are about to fall off a cliff.
HHH,
I agree with a recession oil prices will decrease, perhaps to $90/bo, $25/bo could occur if we see a repeat of GFC or worse, but I doubt that is very likey. So you might be correct that commodity prices will fall, I doubt we see a monthly average price for WTI a less than $75/bo unless we see World real GDP decrease at at annual rate of 3% or more.
The currency markets can turn on a dime with changes in sentiment. The stock market was poised for a correction, now it has occured and could turn around very quickly as inflation subsides and central banks ease monetary policy.
Again it is impossible to know what will happen, any assumptions about the future tend to be incorrect.
Blurb of note
US Diesel consumption 2021 +4% down only 1.5% from 2019
China Diesel consumption 2021 +4.9% Nearly same as 2019
Suggests not much decline to virus, people have to eat.
Africa up 9% from 2020, about same as 2019
India +7%, but far below 2019 still
Energy Has Always Been The Key To Empire Growth…
Due to a 50-year technological headstart in the 1800s of smelting iron with coal rather than wood-charcoal, England’s Empire grew exponentially. However, when England peaked in coal production in 1913, ironically a year before WW1, that was the peak of the Empire.
After things really got bad as coal production continued to decline in the 1950-1970 period, England found the North Sea Oil Fields and enjoyed 3 Decades of the continuation of a global financial empire.
However, that is all over now as the U.K.’s oil production continues to collapse to 874,000 bopd, according to the 2022 BP Statistical Review.
Anyhow… I wanted to show that ENERGY has always been and continues to be the KEY to all civilizations and Empires. Here we can see in the chart below that the major Industrial Sectors in England were centered around its coal deposits. While this is COMMON SENSE, most people think of the Industrial Revolution as some amazing feat of Mankind and technology.
I can assure you, without COAL, England would have fizzled into the DUSTBIN of a typical second-rate economy.
steve
“The United Kingdom has proven reserves [coal] equivalent to 1.9 times its annual consumption. This means it has about 2 years of Coal left.
Should they decide to go after it seriously they have a huge wind resource- more output potential than the equivalent of over 600 1000MW nuclear reactors.
https://gwec.net/wp-content/uploads/2021/06/United-Kingdom_Offshore-Wind-Technical-Potential_GWEC-OREAC.pdf
pick a country here to compare- https://esmap.org/esmap_offshorewind_techpotential_analysis_maps
UK’s proven reserves of wind energy – one billion years.
Folks often criticize renewables for their intermittency but on a time scale of a few hundred years or more the blip of fossil fuels is all too apparent.
Stephen,
I always appreciate good humor when I can get it… “UK proven reserves of wind energy… one billion years.” Fricken hilarious. You are quite the silly guy.
I would love to see a company or an engineer try and manufacture a wind turbine with a 15 year lifespan and windblades with an even shorter lifespan without burning a a massive amount of fossil fuels.
Lots of ENERGY TOOTH FAIRIES out there.
Steve
That’ the puzzle isn’t it – why the lives of wind turbine components are so short. Are they built only to survive the initial financing term of the wind park? If 20% more was spent in making them, would they last five times as long?
David,
That’s surprising coming from you. Any machine, however well built, needs to be maintained or replaced. Also, if more was spent, then the Wind Industry, which is now LOSING MONEY HAND OVER FIST… would really be hurting… LOL.
‘We’re all in trouble’ | Wind turbine makers selli
ng at a loss and in a ‘self-destructive loop’, bosses admit
5 April 2022 19:52 GMT UPDATED 6 April 2022 14:50 GMT
Price pressures from auctions, higher raw-material and logistics costs, plus the Ukraine war, have led to an unsustainable situation, top executives from GE, Nordex and Enercon tell WindEurope 2022.
https://www.rechargenews.com/wind/were-all-in-trouble-wind-turbine-makers-selling-at-a-loss-and-in-a-self-destructive-loop-bosses-admit/2-1-1197217
GOD HATH A SENSE OF HUMOR….
steve
Steve, I don’t know if the population of England a hundred years hence will be five thousand or fifty million, but if they have any electricity it will most likely be generated by wind, because the fossil fuels will be long gone.
Libya’s Crude Oil Exports Drop Sharply After Key Ports Halt
https://www.bloomberg.com/news/articles/2022-07-01/libya-s-crude-oil-exports-drop-sharply-after-key-ports-halt
OPEC Well Completions Dip In 2021
The number of completed wells at OPEC producers dipped by 280 compared to 2020 and stood at 1,588 wells completed in 2021. This was the lowest number of well completions since at least 2017.
All major producers, including Saudi Arabia, Iraq, the United Arab Emirates (UAE), and Kuwait, saw the number of completed wells drop last year. Well completions rose in Venezuela and Libya, two producers exempted from the OPEC+ production cuts.
While well completions at OPEC producers fell in 2021, the number of total world well completions rose last year by 5,619 to 51,924, according to OPEC’s bulletin.
In 2009, Jim Lentz nailed it (peak oil between 2017-2020).
See attached graph of World Oil Production covering a broad range of annual growth/decline scenarios, pink area is /- ~3% (annual).
The high scenario is 106 MBpD in 2026 assuming ~4-5% annual growth.
Blue line assumes close to 0% growth. (This is the null hypothesis).
Green line is a continuation of current long term (30 year) average growth (~1.4%).
{This may be close to what Dennis likes to project.}
2 lower ranges account for steeper annual decline 3-5% range. It’s not clear if/when we will enter this phase…but judging from 2018 thru 2022, one could argue we are already in it.
A new thread on predicting future oil production has been posted.
https://peakoilbarrel.com/can-past-oil-production-predict-the-future/
A new open thread Non-Petroleum has been posted.
https://peakoilbarrel.com/open-thread-non-petroleum-july-3/