A Guest Post by Islandboy
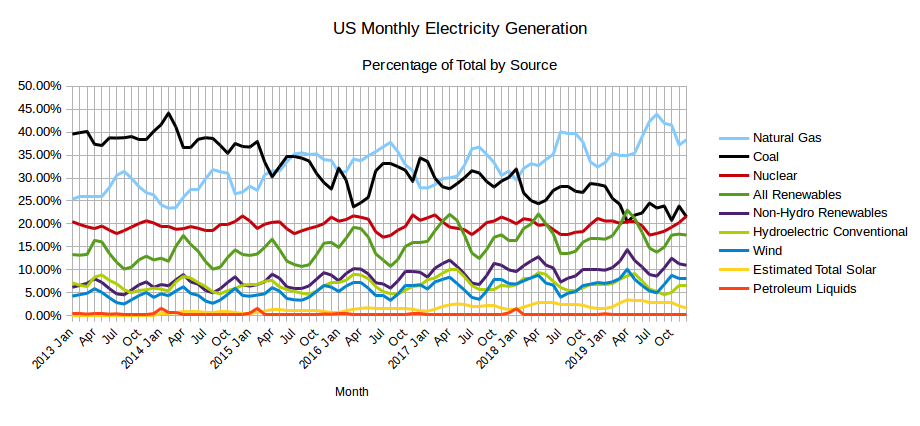
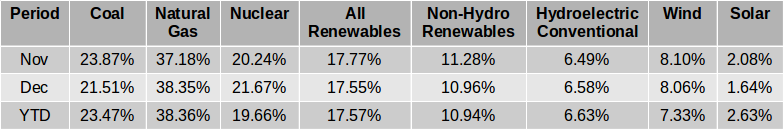
The EIA released the latest edition of their Electric Power Monthly on February 26th, with data for December 2019. The table above shows the percentage contribution of the main fuel sources to two decimal places for the last two months and the full year 2019 (YTD).
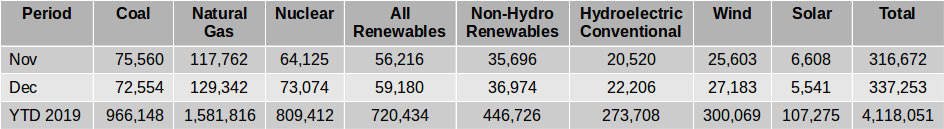
The Table immediately above shows the absolute amounts of electricity generated in gigawatt-hours by the main sources for the last two months and the year to date. In December, the absolute amount of electricity generated decreased as is usually the case between November and December. Coal and Natural Gas between them, fueled 59.86% of US electricity generation in December. The contribution of zero carbon and carbon neutral sources increased from 38% in November to 39.22% in December. The percentage contribution from Natural Gas in December increased to 38.35% from 37.19% in November, remaining below the more than 40% achieved between July and October of 2019. The winter solstice occurs on December 21st so the absolute contribution from Solar fell to what is expected to be the lowest monthly amount for 2019, with the exception of January. The combined contribution from Wind and Solar decreased to 9.70% from 10.17% in November and the contribution from Non-Hydro Renewables also decreased to 10.96% from 11.27%. The contribution of zero emission and carbon neutral sources, that is, nuclear, hydro, wind, solar, geothermal, landfill gas and other biomass increased to 39.22% from 38% in November.
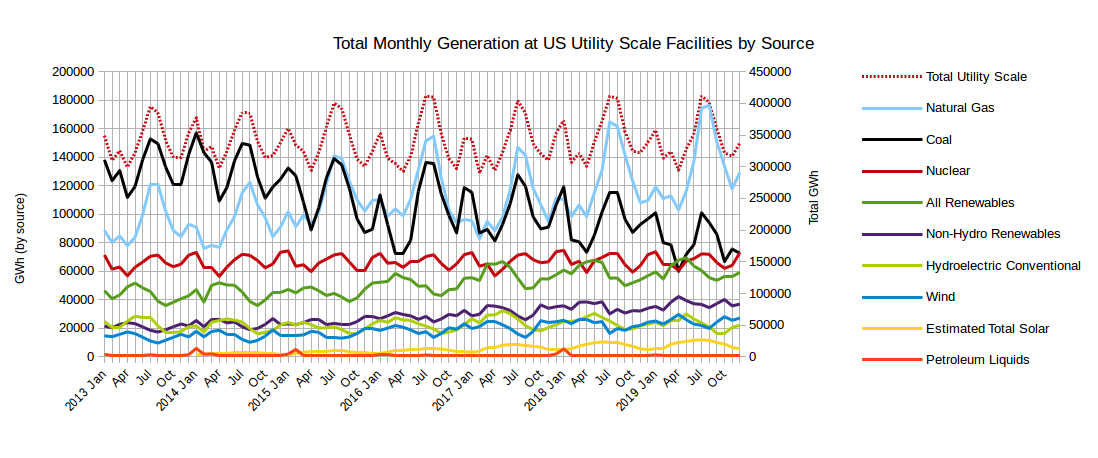
The graph below shows the absolute monthly production from the various sources since January 2013, as well as the total amount generated (right axis).
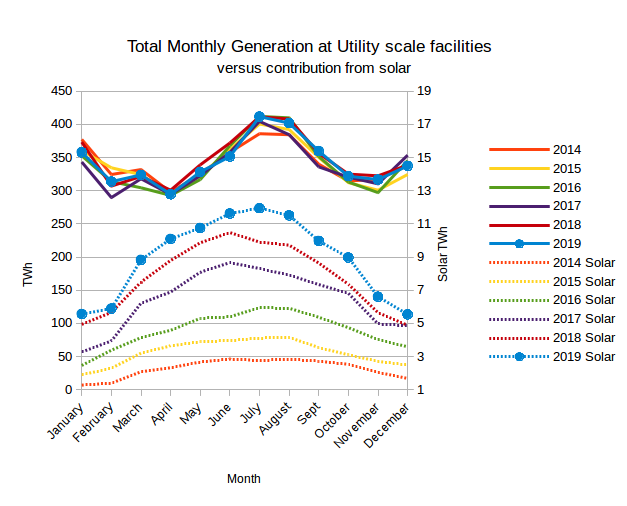
The chart below shows the total monthly generation at utility scale facilities by year versus the contribution from solar. The left hand scale is for the total generation, while the right hand scale is for solar output and has been deliberately set to exaggerate the solar output as a means of assessing it’s potential to make a meaningful contribution to the midsummer peak. In December 2019 the estimated total output from solar at 5,541 GWh, was 2.23 times what it was four years before in November 2015.
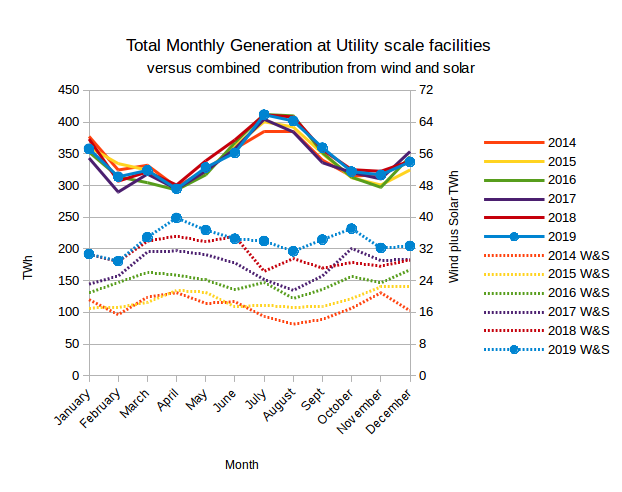
The chart below shows the total monthly generation at utility scale facilities by year versus the combined contribution from wind and solar. The left hand scale is for the total generation, while the right hand scale is for combined wind and solar output and has been deliberately set to exaggerate the combined output of solar and wind as a means of assessing the potential of the combination to make a meaningful contribution to the year round total.
December 2019 Capacity Additions
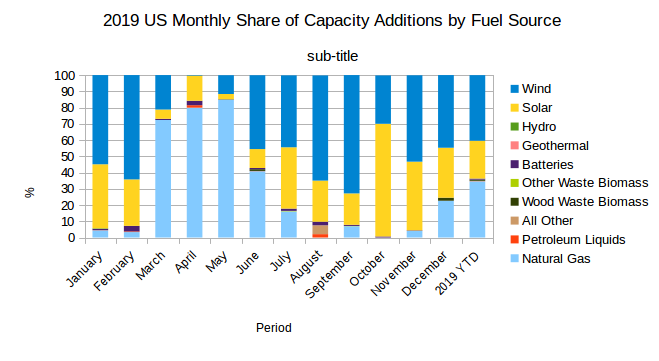
The chart below shows the percentage contributions of the various sources to capacity additions for each month and the whole year 2019 (YTD). In December 22.63 percent of capacity additions were Natural Gas. Solar added 30.79 percent and and Wind contributed 44.69 percent of new capacity. Batteries had relatively minor capacity addition of 0.025 percent, 1.86 of capacity additions were Wood Waste Biomass and 0.01 percent of new capacity was Landfill Gas.
In December the total added capacity reported was 6249.4 MW, roughly fifty percent more than the amount reported in March, the next highest monthly figure. I suspect that not all this capacity was added in December but, it may be that amounts that are reported late or for which a precise commissioning date is not available, are reported in December.
2019 Capacity Additions
For the complete year 34.56 percent of the added capacity was Natural Gas (7841.4 MW) compared to 61.62 percent (19305.6 MW) for 2018. Wind contributed 40.36 percent (9159.1 MW) compared to 21.13 percent (6621.5 MW) in 2018. Solar contributed 23.29 percent (5285.7 MW) compared to 15.71 percent (4921.7 MW) in 2018. Batteries contributed 0.68 (153.9 MW) compared to 0.568 percent (177.8 MW) the year before. Wood Waste Biomass contributed 0.64 percent (145.4 MW) compared to less than 0.1 percent in 2018. The category All Other which was basically a single facility made up 0.21 percent (47.9 MW) and Petroleum Liquids contributed 0.15 percent (35.1 MW). All of the other sources including Hydro, Geothermal, Other Waste Biomass contributed less than 0.1 percent each to the capacity additions for 2019. It is worthy of note that no new coal fired capacity was reported in 2019 making it six years in a row that no new coal capacity has been added.
December 2019 Capacity Retirements
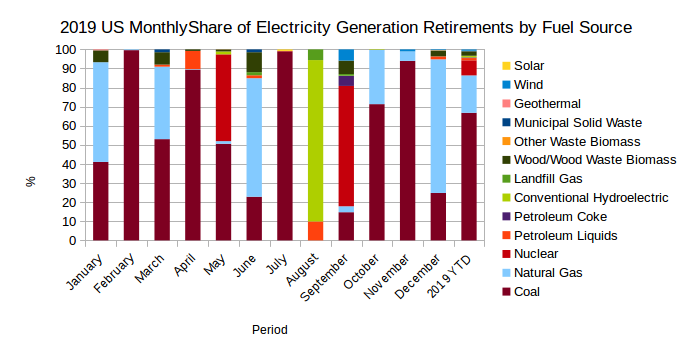
The chart below shows the percentage contributions of the various sources to monthly capacity retirements for 2018. and the whole year. In December 24.84 percent (432 MW) of capacity retirements were fueled by coal and 69.98 percent (1217 MW) were fueled by natural gas. Wood/Wood Waste Biomass made up 2.93 percent (51 MW) of retirements and Petroleum Liquids made up 1.52 percent (26.4 MW). Wind, Landfill gas and Other Waste Biomass made up the remaining 0.74 percent of the 1739.3 MW reported retired in December.
2019 Capacity Retirements
For the entire year, 66.81 percent of the retirements were Coal fired plants (12,529.5 MW), 19.57 percent were fueled by Natural Gas (3670.8 MW), 7.87 percent were fueled by Nuclear (1476.4 MW), 2.93 were fueled by Wood/Wood Waste Biomass, 1.20 percent were fueled by Petroleum Liquids (224.2 MW), 0.7 percent of retirements were Conventional Hydroelectric (132 MW) and Wind made up 0.68 percent (127 MW) of retirements. All other sources retired less than seventy megawatts of capacity.
First Solar PV Facility Retirement Reported
As is customary, in December a significant amount of revisions were done to data for earlier months, one of which included the retirement of 8MW of Solar Photovoltaic capacity at Southern California Edison Co,’s Solar Photovoltaic Project #44, reported as retired in July, this is the first retirement of a Solar PV facility reported to my knowledge. Searching for further information on this project reveals that it is installed on the roof of a large (approx. 1000ft. x 2000 ft. or 330m x 700 m) commercial building which shows up as the Perris Distribution Center and came on-line in 2015. It is somewhat strange that a solar PV facility that is roughly four years old has been listed as retired.
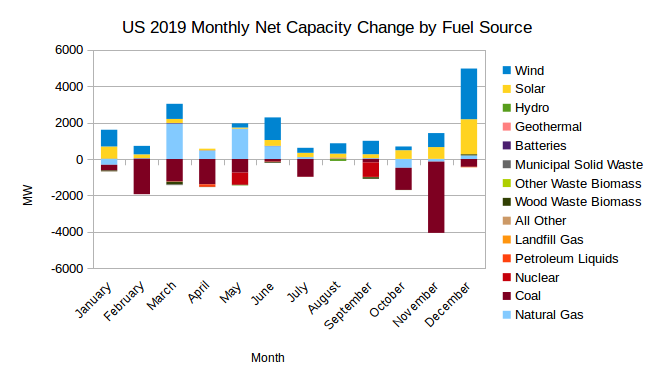
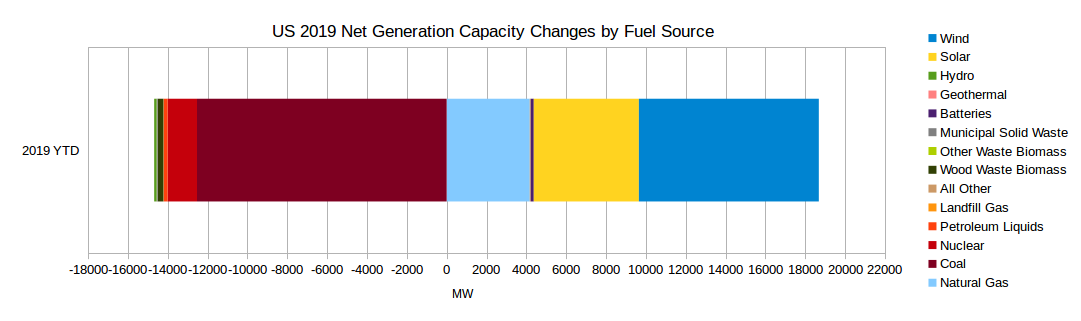
Below is a chart for monthly net additions/retirements for all of 2019 and another showing the total net changes for the year.
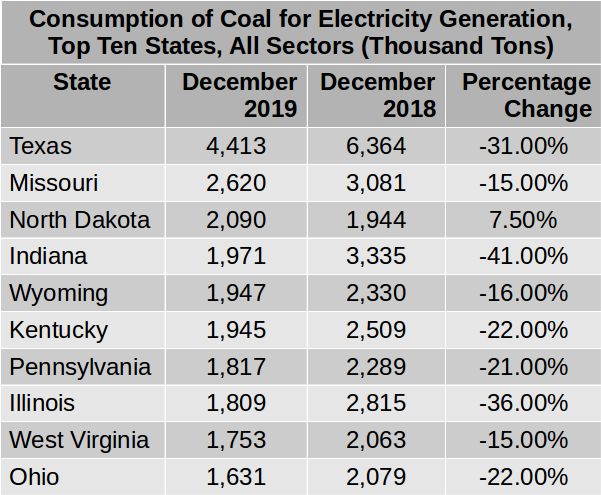
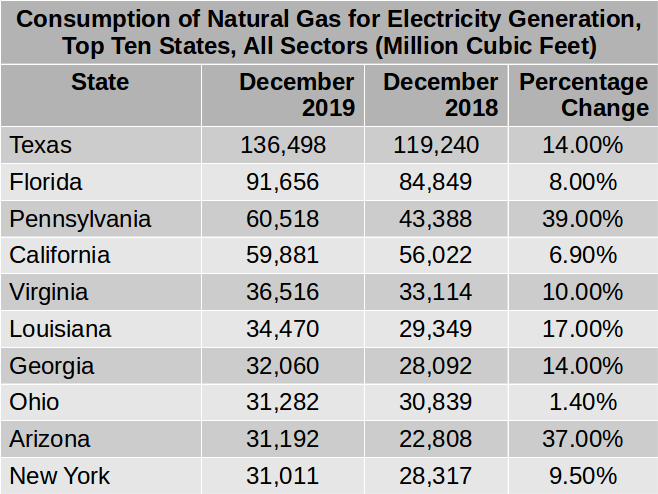
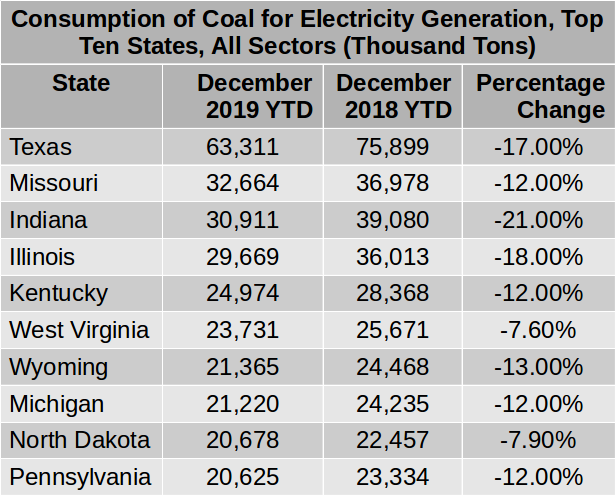
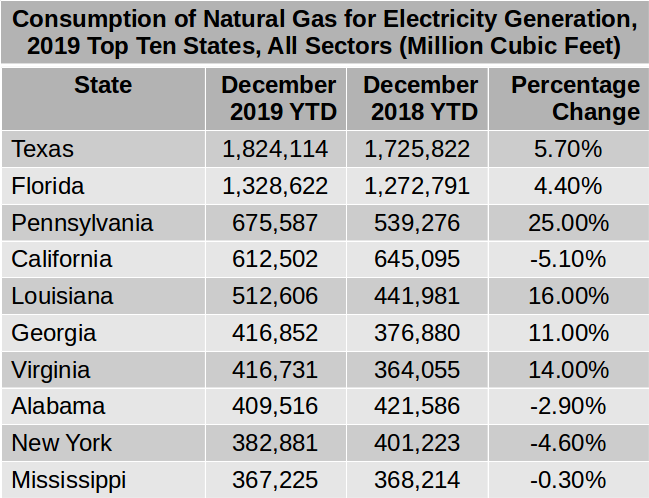
Below is a table of the top ten states in order of coal consumption for electricity production for December 2019 and the year before for comparison followed by a similar table for Natural Gas and one for renewable sources.
Annual data
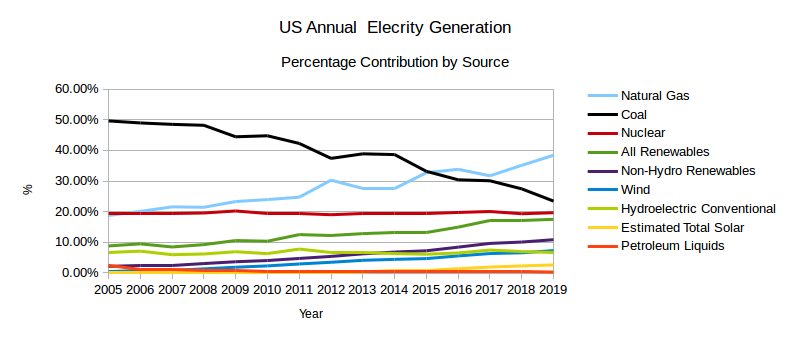
Now that the full year’s data is in for 2019, below is the updated chart for the annual contribution from the various Sources. For the full year 2019, Natural Gas generated 38.41%, 14.95% more than Coal, widening the gap between the amount of electricity generated using coal and the amount generated using NG from 7.7% a year ago. At 23.46%, the contribution from coal continues to dwindle and the contribution from coal is likely to shrink further in 2020 with a large block of coal fired plants retiring in the last quarter of 2019 and several more scheduled for closure in 2020.
Wind generated more than hydro on an annual basis for the first time
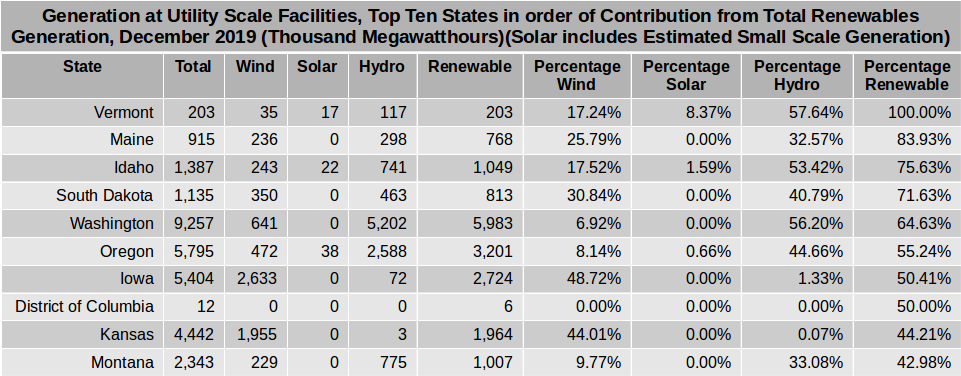
The continued absence of the unusually high levels of rain experienced in the west over the 2016 to 2017 winter season, resulted in the contribution form hydro-electric generation continuing to fall to 6.65%. Hydro has only contributed more than 7% in three years since 2005, i.e. 2006, 2011 and 2017. 2019 makes it the sixth year in a row that non-hydro renewable sources have contributed more to the electricity mix than conventional hydroelectric sources and wind alone has now contributed more than hydro, coming in at 7.29% as opposed to hydro’s 6.65%. In 2016 the EIA reported, U.S. wind generating capacity surpasses hydro capacity at the end of 2016. The lower capacity factors of wind turbines result in lower overall generation from wind but, with the growth in wind capacity continuing apace, wind has finally generated more than hydro on an annual basis. In the last four months of 2019 wind has consistently generated more electricity than conventional hydroelectric as it did in 2016, a year with unusually low hydro output. Since November 2014 when wind output fist surpassed conventional hydroelectric for the month, periods with higher wind contribution have become more frequent and longer. It remains to be seen if wind output will fall below hydro in the summer months of 2020 when wind output is usually at it’s lowest
Growth of Solar PV slows
The fastest growing source continues to be solar PV, with the contribution from solar growing by slightly more than 13%, a lower rate than the previous year when it grew by almost 20%. The contribution from solar in 2019 only grew by 35.65% in comparison to 2017 and by 89.00% in comparison with 2016, continuing the trend of slowing growth in solar, with the doubling time increasing from every two years to just over three years. The ten year view of the growth of solar continues to be spectacular nonetheless. Solar contributed less than four hundredths of one percent to the electricity mix in 2009 and the contribution has grown to 2.6 % in 2019, more than eighty times as much.
Among other things, tariffs imposed by the current US administration on Chinese imports continued to have a negative impact on solar capacity growth for 2019. The current administration’s preference for the use of fossil fuels may have resulted in policy signals that could have affected the growth of solar capacity as well. It could be seen as remarkable that solar capacity grew as much as it did, despite the less than enthusiastic support it is receiving from the current federal administration. At some point, solar capacity growth could accelerate, as module costs continue to fall to the point where electricity generated using solar PV is the lowest cost source, even for regions that do not have the excellent solar resources available in the southwestern US.
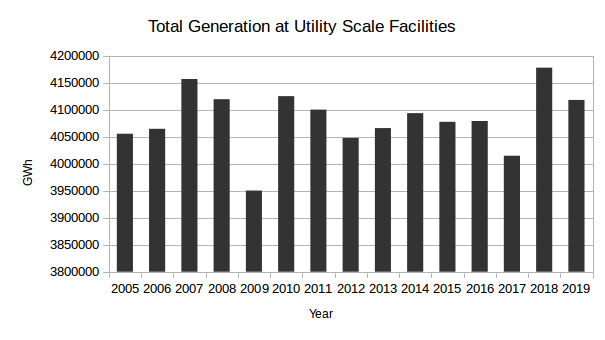
The graph below shows the total annual generation from 2005 to 2019.
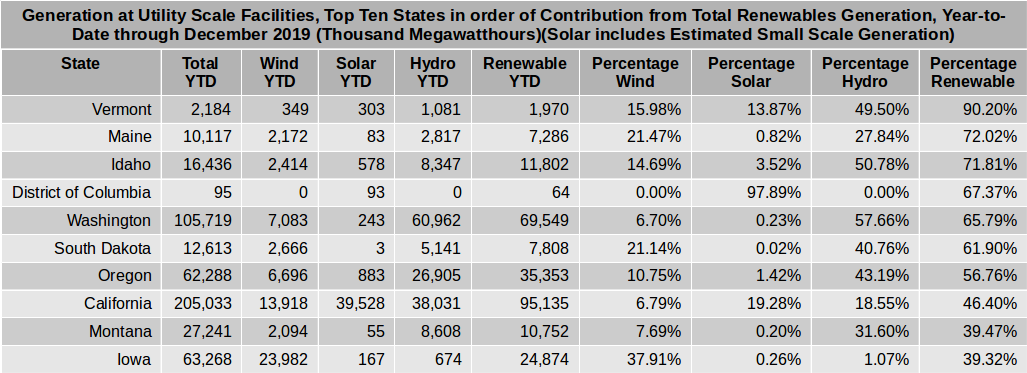
Below are tables for the top ten states in terms of Coal and Natural Gas consumption for the production of electricity as well as a table for the top ten states in order of total electricity generation from renewable sources for the year 2019.
289 responses to “EIA’s Electric Power Monthly – February 2020 Edition with data for December 2019 and the whole year 2019”
Two thoughts on the Coronavirus in the USA.
If the response is so bad to the spread of an ordinary disease, what the hell would have happened to the USA if it had suffered a biological weapon attack? Where was the plan for an attack? What was the preparation for an attack? The USA is totally lacking in defense against a biological attack.
Good luck trying to contain the disease by restricting movement. All those republican gunslingers who cry freedom from government regulation. I just can’t see it as possible.
NAOM
All the countries of the world should be thinking of this episode as batting practice before the big game.
Maybe change some policies, and local practices.
This is an article on the Corona Virus:
https://arstechnica.com/science/2020/03/dont-panic-the-comprehensive-ars-technica-guide-to-the-coronavirus/
Their articles are “peer reviewed” on a voluntary basis by people who register and log in. The comments can be ordered chronologically or by insightfulness, highest voted, or funny. Although it’s hard to imagine how someone could find anything about this article and situation as being “funny”.
Update on how things are being handled in Mexico
http://impreso.meridiano.mx/edicion/vallarta/2020/03/08/politica/publicidad/4.pdf
(In Spanish)
NAOM
Thanks for such a comprehensive report IslandBoy, as always much appreciated.
Great post IB, thanks a lot.
I’ve been looking into electric chainsaws lately and I’m quite impressed. Prob gonna go with a Stihl plug in and use it with an electric splitter at the plugin point on the yard. I’ll still use gas saw to fall trees, but once fallen I’ll drag to the yard for further processing with electric. My retreat is supplied with elec by Libby Dam. My buddy picked up a little battery powered saw for processing dead fall and smaller tees into firewood.
I’d be interested to know if OFM is getting any electrics for tree care.
I have a 16″ Electric. It’s great for stripping branches from felled trees, and anything under 6″.
I especially like the light weight, less tail-heavy balance, and the instant on/off (no idling engine using gas when you stack brush).
Sounds similar to what my friend has. He got a battery powered Makita. Great for cleaning up deadfall and little trees for easy firewood. I like that it’s so much quieter!
Agree with Lloyd. Very pleased with the one I have.
Colonial Trinkets
I look forward to seeing how things, from a global , say, north-south perspective, continue as increasing attempts are made to batterify (etc.) everything.
I Want More
The Good Ship Lifestyle
I’m quite interested in that too. I chose to go with a plug in saw specifically because I’d rather not consume a battery.
Fair enough… although I might have been tempted to presume that survivalists would be more likely to go with hand-tools, yes? ‘u^
Incidentally, did the thought ever cross your mind that coronavirus/COVID19 could be deliberate, like part of a plan? I haven’t looked around about what others have said about that, but imagine it has been brought up.
People who are still working are using more electric saws and clippers on a regular basis.I’m retired, but I have a plug in electric saw I use occasionally.
An electric chainsaw is ideal for working in an orchard, where you don’t ordinarily use the saw for more than a few minutes at a time, and seldom have to cut anything more than a few inches in diameter. With two or three batteries, you can usually get thru a day, no problem.
If you have a couple of extra batteries, they’re really great for light work, or for working IN trees, when you’re climbing.
Not practical for cutting up pickup truck loads of firewood, etc. The batteries just aren’t up to it yet, and a five hundred dollar gasoline powered saw will cut twice as fast, maybe three times as fast.
Pollution and maintenance aside, gasoline still rules. Saving an hour cutting a pickup load under optimal conditions means a liter of gasoline is a no brainer. My Husky is five years old now, and I still haven’t spent a dime on it, other than a couple of new chains.
I very strongly recommend avoiding the purchase of a cheap chainsaw, if you expect it to run for more than a few hours before you have problems with it. About five hundred bucks seems to be the quality cut off sweet spot these days. Much less than that, you may be dealing in junk, even if it has a major brand name on it.
There’s battery backpacks too.
I know at least one with 1kWh.
Thanks for the effort IB. Nice charts.
First time the generation from coal fell below 1000 TWH for the whole year. The last time this happened should have been sometime in the 70’s. It is going to fall further to roughly 800 TWH this year and depending upon the performance of renewables, coal is going to end 2020 either in 3rd (behind NG and Nuclear) or 4th (above 2 + all renewables) place. Quite a record for the guy in the White House who ran on reviving “king coal”.
Thank you for the post. Then, it appears that, and it demonstrates, that renewable energies are growing thanks to solar and wind energies and will exceed electricity production from coal in a near future.
VIX seems to have gone into Cape Canaveral mode, highest since the last recession.
NAOM
Good work island boy, the small annual gain in wind and solar power production is encouraging.
Thanks to all for the compliments. The small annual gain in wind and solar is even more encouraging when you look at the chart below, showing the change from 2005 to now. It will be interesting to see what develops after November, if the current US administration is replaced by one that is open to a “Green New Deal”.
Natural gas has been rising only because of its abnormally low pricing. The producers are practically giving it for free. Any indication of it going back to $4 or above will kickoff a pedal to the metal effort towards renewable plus storage particularly in the blue and purple states. Renewables will jump from the current 20% to 50% in no time.
There has also been a big shift towards combined cycle plants. I think 20% of the generation capacity shut down last year in the US was gas plants, and these were all older single cycle.
Gas can beat other fuel with price cuts, but it is impossible to win market share against fuel-free renewables by cutting prices. Renewables work like a ratchet. Once they get built and into the market, they suck all the profit out if the industry and are impossible to squeeze out.
There is a lot of talk about how much electricity is generated by different methods, but it is of dubious value because nobody really agrees how much we will need in the future. The standard prediction that energy consumption will be in line with economic growth is “safe” but clearly false.
The fossil fuel business lives on profit, like any other industry. Its future will be decided by its ability to continue making profit. Coal, for example, is not dying for lack of demand for electricity (peak demand) or lack of coal (peak resources). It is dying for lack of profit, just like the whale oil industry did.
Batteries and smart grids play a key role here. Power plants make a significant part of their profit by gouging customers during short term demand peaks. Batteries are too small to make a significant contribution to overall generation, but they are much better at dealing with peaks than any method involving setting stuff on fire, which is excruciatingly slow. So they hit the industry where it hurts most — in its profit centers.
It’s noticeable that combined cycle gas was invented for highly profitable “peaker” plants, but is now starting to be pushed out of that sector, and is wining against low profit “baseload” coal and nuclear, which are loss leaders.
Exactly.
Yep, about 0.64 percent per year.
GF, agreed, 0.64 percent per year is nothing to write home about. But 13.3%? 31.6%?
Global solar PV 31.6% per year growth rate (average 2011-2019), 2.4% of global electricity production 2019.
Global wind 13.3% per year growth rate (average 2012-2018), 5.5% of global electricity production 2019.
So how do your percentages change when you compare solar and wind production to the total global production?
GF, wait, you’re changing the goalposts? First, 0.64% is nothing (agreed) and now 31.6% is nothing? A CAGR of 32% is a doubling every 2.5 years, so PV would be 30+% of global electricity production in 10 years? (4 doublings)
Nahhh, not me. These guys throw percentages around like political economists. One is percentage against actual US power production, other is compared against itself.
If an ant grows by 300 percent, still not very big, right?
I see this all the time in the media. they avoid actual comparisons and throw around the biggest percentages that can be found.
+1
If wind and solar is an ant, coal is slightly larger than 2 ants. It will be less than 2 ants 1 year from now.
Yep about 2.5 ants, cheap natural gas and a flat power demand have displaced coal power and reduced the growth of wind and solar power.
Natural gas is rising at about 2 percent a year with wind and solar at less than one percent. If that trend continues most coal power will be shuttered by early 2030’s. US has an old coal power fleet that can be retired. Not true in Asia.
Demand for all fuels increased, with fossil fuels meeting nearly 70% of the growth for the second year running. Solar and wind generation grew at double-digit pace, with solar alone increasing by 31%. Still, that was not fast enough to meet higher electricity demand around the world that also drove up coal use.
As a result, global energy-related CO2 emissions rose by 1.7% to 33 Gigatonnes (Gt) in 2018. Coal use in power generation alone surpassed 10 Gt, accounting for a third of total emissions. Most of that came from a young fleet of coal power plants in developing Asia. The majority of coal-fired generation capacity today is found in Asia, with 12-year-old plants on average, decades short of average lifetimes of around 50 years.
from IEA
Globally, fossil fuel generation is rising faster than solar and wind power generation.
20% in 2019 to 50% in 2029 will be 3% per year
It will have to be solar and wind powered electric generation growth to fill that surmised 30 percent gain. When did the rate of solar and wind growth in the US suddenly rise or are you anticipating a major drop in overall power consumption by 2030?
It’s already 10%. It only need to double every 5 years to hit 40% in 10 years. That’s only 14% per year. While wind grew in that ball park for the last 15 years, the past growth has been much higher than that for solar. The growth of solar can halve and still beat 4 times in 10 years handily. That’s the power of exponential growth.
Well, that exponential growth dream is not panning out. Wind in the US has been linear for quite a while now, mostly due to increases in natural gas.
Global PV installation has flattened out also.
Looks like an exponential curve to me.
Yep for 2 years. The rest is straight lines. Brush up on your math.
Ok
GF —
Instead of insulting people, maybe you should try to get some better data to support your claims. Arguing about the best mathematical model to describe two points of noisy imprecise (an probably inaccurate) data doesn’t seem particularly constructive.
Wind growth can be held back politically because it needs to be big to be economical. Grids are politically controlled. Solar can be sold to end users and will crush grids if held back too long. Solar is growing at an increasingly faster rate over time. It’s presence is helping to loosen the political grip that has been holding back wind growth. Usage and production of batteries is also growing at an increasing rate over time.
SOS, Anybody,
I’ve been looking for numbers about the effect of increasing production of wind and solar power on the average prices of coal and gas in the USA.
Obviously the more wind and solar electricity there is on the grid, the less coal and gas used. This quantity could be easily if roughly estimated, but the average decline in the prices of coal and gas isn’t so easy. You must know the price elasticity, and I can’t find a number for that from any reputable and well known economist or university.
But it seems likely that we have COLLECTIVELY saved enough on the purchase of coal and gas, as the result of having lots of wind and solar power,to offset a large portion, maybe even ALL the money we’ve spent subsidizing renewable electricity.
If this is true, it would be one hell of a good argument to make in favor of MORE wind and solar power.
I’m not sure the answer to your question is knowable, it would be based on speculation of multiple trends. A similar question I have had is- without fracking, what would be the price of oil and petrol in this country? The answer to that is unknowable, I have concluded (a hell of a lot higher of course).
But if we use the standard of truth that is now utilized by the executive branch of the USA- we can say with certainty that the subsidies for wind and solar have resulted in energy savings to each citizen equal to 8 years worth of utility payments. Tweet it 3 times. It becomes truth, to the loyalists.
I agree that any answer must be an estimate based on hopefully reasonable assumptions and perhaps some historical market data, etc.
But people from one man accounting practices to little banks to the biggest banks to the Federal Reserve, etc,give paid advice or publish such studies on a regular basis.
I’m surprised some environmental organization someplace hasn’t explored this idea and used it to rebut the arguments so often made against subsidizing renewable energy and energy conservation and efficiency programs, etc.
Coal, oil, and gas, not to mention steel, concrete, skilled labor, etc, would all be much cheaper if we were to have cheaper fossil fuels to manufacture these things, plus we could and may well be saving a few bucks a month on our electricity bill.
Subsidies for the renewable energy industries probably don’t exceed about seven billion a year, with most of that being in the form of tax credits. That’s back of the envelope only two or three bucks per person or maybe ten or twelve bucks per wage earner/ tax payer.
Surely we are saving more than a dollar per person per month, in money, because things are cheaper. Natural gas is cheap, so I can buy nitrates cheap, and sell my crops cheap. Paving companies and gas stations charge less when asphalt and gasoline are cheap because oil is cheap, etc.
Sure we are short a few jobs in the ff industries as the result of going renewable, but I’m thinking a great case can be made that we are ALREADY much better, in terms of our wallets, as the result of having ONLY ten percent of our electricity coming from wind and solar, etc.
Actually our wallets are worse each year because all the solar pv subsidies are taxed through power bills. Lots of solar installed around here. Now the big offshore wind projects will add more tax. Plus lots of resilience projects.
Maybe a local guy’s wallet will be a little lighter for a few years, until the subsidy is covered, if it’s tagged onto his power bill.
BUT he’s going to be buying his bread and beef cheaper……. because I can sell grain and beef cheaper, because gas is cheaper.
Everybody, not just the people paying a temporarily higher power bill, will be saving a little on bread and beef, a little on anything based on fossil fuels, and some people are already saving on electricity.
So…. the pain or expense in such cases is often concentrated, whereas the pleasure or profit or savings is distributed over the entire community or nation.
A few thousand coal miners lose their jobs….. but tens of thousands of people get new jobs involving renewable energy infrastructure.
Forward looking companies move to places with lots of renewable electricity, and the promise of more available later……… because it’s good pr, and likely to actually SAVE them money over the long haul, with rates locked in on subsidized renewable juice in at least some cases.
I don’t pretend to know what gas will cost from one year to the next for the next thirty or forty years, but I’m willing to bet the farm it will go up on average from one year to the next, due to depletion, rising demand, and inflation of the money.
Inflation works FOR people who have locked in wind and solar power, because once built, wind and solar farms are dirt cheap to operate, and selling the juice at a fixed price decades ahead is not only possible, it’s profitable.
Every dollar a spent on wind and solar is a big win for the collective pocket book, over the life of the investment, and big win for those who don’t admire the effect of coal mining and burning on the environment. No matter what Trump wants you to believe.
OFM, so how are we doing over the last two decades of this transistional century?
Fossil fuel energy rose by over 40,000 TWh while during that same period renewable energy rose by 2,000 TWh. Total global energy growth about 45,000 TWh on a basis of about 150,000 TWh.
Lots of energy change in the last two decades. Progress in renewables (all of them, not just solar and wind) are down in the noise still during this great age of progress.
So stop pulling legs. You are a more practical thinker, unlike these Mobius drugged out people that comment here. How are we really doing? Has anything really changed much? Or is it mostly just hope and more propaganda, while everyman subsidizes the non-change.
Hi GF,
I’m on record here and other places as being a hard core doomer, like Ron, a few years back.
Now I’m cautiously hopeful that some people, maybe a lot of people, in some places will pull thru the baked in collapse being brought on by overpopulation, depletion of one time thru non renewable resources, pollution, etc, but there’s no way to know for sure.
Industrial civilization may collapse world wide in fairly short order,sometime in the next hundred years or so. It’s easy to visualize dozens of scenarios that play out this way.
Now I’m thinking that it’s more likely there will be economic and ecological collapse on the grand scale, geographically and temporally, but on a regional rather than world wide basis.
Consider climate change. It might be twenty or thirty years, or even longer, between the time let us say for example most of India and large portions of Africa get too hot and too dry to support local populations…. where as things will be bad in North America, but probably not so bad we Yankees can’t still feed ourselves ok, and maintain public order.(The climate might of course continue to worsen to the point that it will wipe us Yankees out as well, sooner or later.)
But the climate might never get so bad that we can’t grow enough food in this country to support our own population, especially if it’s declining, and it will decline, there’s no doubt about that at all, in my mind at least.
I’m not an orangutan fan, but there’s also no doubt in my mind that we WILL close our borders, eventually, to every body except a handful of rich people and individuals such as physicians or engineers.
Depletion of natural resources will continue, but there will likely still be enough oil, aluminum ore, gas, water, timber, etc, to maintain an industrial economy, if we do what we will HAVE to do, such as eating down the food chain, getting by on a tenth as much oil per capita as we use today, recycling just about everything, etc.
So every little bit of progress that’s made now in renewable energy technologies, energy efficiency, sustainable agriculture, etc, will be priceless later on.
If we get our shit together, and it’s altogether possible that some of us will, we can have an industrial economy based on renewable energy and recycling by emphasizing efficiency and conservation.
We can live quite well, once we adjust our life styles and economy, on one quarter or even one tenth of the electricity per capita we use today, and generating that much with wind and solar power is not at all out of the question. We can build new houses that are extremely easy to heat and cool. We can drive cars the size of golf carts that go twenty mph and have a range of twenty or thirty miles, or maybe fifty miles, and get along with them JUST FINE….. given time to adapt to our new circumstances.
We CAN get along with wind and solar electricity without having all the juice we might want around the clock around the calendar. There’s nothing at my house that really needs to work without fail other than a refrigerator, freezer and well water pump,a few lights, and there are ways to finesse these needs.
We don’t have to use anything much that’s one use only, excepting only toilet paper. You can wash your butt with a rag and rinse it out and use it indefinitely.. You can use one hand and water. But so help me, I don’t believe anybody EVER used corncobs, lol. Leaves and grass, sure.Have done that myself, lots of times.
Most of my own furniture, being hand made from solid wood, will last more or less forever. The newer pieces are already fifty years old, and just now getting a nice patina from constant use, lol. If the house doesn’t burn, all of it will still be as good as new a century down the road. Two or three centuries.
With a declining population, we won’t be needing new highways or much in the way of new water and sewer systems, etc. We can refurbish what we have as necessary etc.
I’m quite comfortable in a nice soft recliner at this minute at fifty degrees, playing on the net, with a blanket over me and dressed in jeans and sweat shirt. I didn’t bother with a fire last night. The programmable back up oil furnace kicks in at fifty. It just came on the first time. The sun will be coming thru the big east, south and west facing windows in an hour, and I will then have to open some of them, or bake.
So I don’t see any reason to give up hope.
But I sure as hell wouldn’t want to be caught in the hotter and dryer portions of the Middle East, or in someplace already desperately overpopulated and stripped of resources, such as Haiti, or in any country that’s a major net food importer, for that matter.
People are going to be very scarce in such places by the end of this century. After that, if it’s not too unbearably hot, any survivors will be living a more or less sustainable preindustrial life style.
The Four Horsemen will pretty much take care of the population problem most places. Other places, the pill, the implant,the lowly condom, and the abortionist will solve it.
Maybe this is all wishful thinking on my part, but if so, it’s wishful thinking that anticipates most of humanity dying slow and hard within the lifetime of some kids being born today.
A runaway climate, a flat out WWIII, and a couple of new diseases, etc, could wipe out just about every last naked ape on the planet. Such new diseases are to be expected. Any biology major knows the basics of evolution and ecology by the end of his freshman year.
Some countries that otherwise ought to simply collapse might pull thru more or less whole by way of draconian martial law.
In a big enough jam, there’s no real reason why a government powerful enough to do so won’t dictate a NO child policy, rather than a one child policy such as was done in China a few decades back.
Between a famine and a plague or two, and some ethnic conflict, etc, a population can fall by half in fairly short order.
When food supplies fail, there’s ample reason to expect that people out of favor with the prevailing government will starve in place or in prison labor camps, if they’re not murdered by soldiers or mobs.
Such things are easily predicted, in general terms. They’re covered in biology text books, and history books are full of examples from times past.
I don’t expect to live to see most of these things come to pass, but some of them are happening,in some places, even as I type this comment.
Even in winter cold and dark New England-
‘Wind, solar and storage take up 95% of ISO-New England interconnection queue, marking ‘dramatic shift’ ‘
-About 95% of nearly 21 GW of energy resources currently proposed for the New England region are grid-scale wind, solar and battery projects, according to the Independent System Operator of New England (ISO-NE).
-The number “reflects a dramatic shift” in the grid operator’s interconnnection queue, ISO-NE president and CEO Gordon van Welie said in a press call on Friday. Five years ago, the majority of projects sought by developers were natural gas resources (63%), he said.
The makeup of the proposed 20,927 MW includes 68% wind, 15% solar and 11% battery storage. Natural gas makes up only 5% or 1,037 MW.
https://www.utilitydive.com/news/wind-solar-and-storage-take-up-95-of-iso-new-england-interconnection-queu/573680/
‘Zero emission’ and ‘carbon neutral’?
Unsure what the above quote from the article means exactly, such as with regard to nuclear for example, since for example, its waste has yet to be taken care of; or such as with regard to how far fossl fuel inputs and externalities, like against other areas of nature beyond climate are calculated.
So ‘battery capacity’ can be included with solar and wind, etc. energy?
I wonder how the USA’s energy statistics relates to its per capita material/energy consumption vis-a-vis the rest of the world’s (25% at 5% of the global population?) and how this might affect/skew the stats/perspectives on so-called renewable energy and its progress (or regress for that matter).
https://www.businessinsider.com/coronavirus-us-allies-disbelief-donald-trump-bad-covid-19-response-2020-3?utm_source=quora&utm_medium=referral
This one is a dilly.
https://qz.com/1815829/harvard-university-is-shutting-down-because-of-coronavirus/
If there’s one place in the country where it’s likely professional advice from people in the medical field will be listened to, it’s a major university with a med school, etc.
This is somewhat of a jolt to me, a further wakeup call.I’ve been expecting more bad news, but I didn’t anticipate this sort of response coming first from such an institution, this early in the game.
AND
Breaking News: A one-mile “containment zone” will limit gatherings in New Rochelle, an epicenter of the coronavirus outbreak that’s just outside New York City.
Inbox
x
The New York Times Unsubscribe
1:09 PM (3 hours ago)
to me
View in browser | nytimes.com
The New York Times
BREAKING NEWS
A one-mile “containment zone” will limit gatherings in New Rochelle, an epicenter of the coronavirus outbreak that’s just outside New York City.
Tuesday, March 10, 2020 1:07 PM EST
Schools and other large gathering facilities like community centers and houses of worship within the area will be closed for two weeks beginning on Thursday, Gov. Andrew M. Cuomo said.
Read the latest
From reneweconomy.com.au:
Rooftop solar unstoppable as market breaks “all previous records” in February
Biggest drop in CO2 emissions in 30 years in 2019 – but it’s not nearly enough
Planet’s largest ecosystems collapse faster than previously forecast
New research has shown that large ecosystems such as rainforests and coral reefs can collapse at a significantly faster rate than previously understood. The findings suggest that ecosystems the size of the Amazon forests could collapse in only 49 years and the Caribbean coral reefs in just 15 years.
https://phys.org/news/2020-03-planet-largest-ecosystems-collapse-faster.html
EIA’s 50% Carbon-Free Generation side case projects little effect on CO2 emissions
Can anybody explain why, according to the linked article from the EIA, US power sector CO2 emissions suddenly stop declining sometime around 2025 as shown in the graph below?
No, and neither can the EIA.
If I may, firstly, I think it’s coming from the same people who extend to infinity the productions of shale gas and shale oil. The fact that the use of oil or gas could be prohibited by the law or by the economy is out of their scopes. Secondly, if they forecast a decrease of the use of oil and gas for electricity production, then the investors could think that there will be a problem with gas and oil production in USA (actually, there is a big one for shale oil production) which they don’t know but which is known by the people of EIA (the chronic information asymetry) and that they should reduce their investments in these sector, resulting in the self-realization of their hypothesis. I suppose that the people of EIA did make the same inference.
Find out when the Sahara was last green and how often this happens. You may be very surprised.
https://www.youtube.com/watch?v=ZQP-7BPvvq0
Will it soon be green again?
Gonefishing,
The Sahara was last supplied with rivers and lakes and an integrated drainage system during the early part of the present interglacial. The generally warm mid-latitude climate included an enhanced West African Monsoon and winds bearing moisture extended clear across North Africa. We’d expect the same thing during the early part of the next interglacial if we hadn’t begun changing global carbon cycling about 8000 years ago with the spread of agriculture out of the Middle East and into Europe. That’s when the forests really began to go (cleared for growing crops) and when levels of CO2 (and methane) in the atmosphere began to climb, slowly, when they should have been slowly declining–toward the next glacial.
With warmer conditions ongoing we might expect a new stronger West African Monsoon and rivers and lakes in the Sahara again, but this today is not a repeat of global conditions during the early present interglacial. The warming now is global, not simply an expansion of the present latitudinal distribution of climate types that characterized the present interglacial back in the day. There’s no next glacial on the horizon to be followed by a next interglacial complete with wetter Sahara. We can say that when atmospheric levels of CO2 are down to, say, less than 200 ppm then a next glacial will be possible. The present level is around 414 ppm and rising though.
So you expect no monsoonal shift with global warming even though the differential between pole and equator has changed?
Since the greening of the Sahara supposedly goes back 8 millon years (well beyond the current ice age and when CO2 was higher) and the albedo of the northern hemisphere will change dramatically as it loses ice and snow, I question your conclusions. I need an explanation for those 230 green periods that occurred over the last 8 million years, most of which did not involve low CO2 or glaciers.
Gonefishing,
I don’t know that we know enough to expect, or doubt either, a shift in the West African Monsoon as climate change continues. The huge amount of work that is going on on climate teleconnections such as that between the North Atlantic and East Asia is helping us see how little we do understand as yet, and what’s coming is without precedent–we have no past analogues during the last 55 million years or so to help us.
Eight million years ago is back in the second half of the Miocene, a time that was part of the long decline in CO2 that got underway along about 38 million years ago. There was a warm plateau in the Mid-Miocene (it’s correlative with the Columbia River Basalts) but that was only an interruption in the CO2 decline. It was early in the spread of grasslands on a large scale as grasses using the C4 photosynthesis pathway gained a competitive advantage over C3-type grasses–the C4 pathway works better at lower CO2 than C3 does. That could have opened up the Sahara to development of savanna. Evidence of that would usually have been interpreted as the result of a wetter climate.
One of the things we’ve learned recently is that changes in floras that have been interpreted as resulting from wetter or drier climate can sometimes result from that long CO2 decline. The spread of grasslands (think the Great Plains, the Pampas, the veldt in southern Africa, the steppes in central Asia) in the later Miocene is a good example. The Milankovic factors would still have been acting so there’d be variations in the changes over time, not a smooth record.
Too late for Port.
Synapsid, it maybe too late for port, but, “it’s never too early for a cocktail” ~ Noel Coward
John Norris,
And Noel Coward was a man of principle. He lived by those words.
Synapsid, likewise. I never drink before 11am. Unless I am on vacation 🙂
John Norris,
I am much more abstemious: I wait until after mid day except for the small volume (one half of a miniature A&W Root Beer mug) of 10-year Tawny Port in the morning. (I got the idea from an elderly Greek via Patrick Leigh Fermor, although that was with ouzo not Port and smaller in volume because of the difference in proof.)
Thanks Synapsid. At 81 I am still not too old to learn a new word.
ab·ste·mi·ous
/əbˈstēmēəs/
adjective: abstemious
not self-indulgent, especially when eating and drinking.
““We only had a bottle.” “Very abstemious of you.””
I found a pressure cooker pot the other day for distilling for ethanol. The stainless steel pot, found in a second-hand shop, looks new/unused and like a refugee from the retail closure crisis.
Now I’m downloading a whole bunch of moonshine-making videos on the road to watch later, maybe over a nice cold drink, hot bath and with the laptop just beside the tub on a chair. ^u^
Abstemious sounds like abstain.
Changes in grass aside (the Sahara possibly formed about 8 million years ago). You might be interested in this study relating orbital positions and the 20,000 year cycle to the Sahara greening and desertification.
“We can now produce a record that sees through the biases of these older records, and so doing, tells a different story,” McGee says. “We’ve assumed that ice ages have been the key thing in making the Sahara dry versus wet. Now we show that it’s primarily these cyclic changes in Earth’s orbit that have driven wet versus dry periods. It seems like such an impenetrable, inhospitable landscape, and yet it’s come and gone many times, and shifted between grasslands and a much wetter environment, and back to dry climates, even over the last quarter million years.”
https://phys.org/news/2019-01-sahara-swung-lush-conditions-years.html
Thanks for this, Gonefishing.
These cycles are part of the Milankovic set and they have been found in sedimentary rocks at least as far back as the Jurassic and a small voice is saying farther still.
The 20 000 year cycle is composite as I believe the others (41 000 and 100 000 years) are too. Their timing effects have varied; as an example, when our ice ages started a bit after 3 million years ago, the glacial/interglacial cycle length was governed by the 41 000-year cycle but after around 900 000 years ago there was a shift to 100 000 years. The study at the link points out that at a more local than global scale cycle expression can be other than that of the dominant Milankovic one–20 000 years for North African rainfall in that case during the time of 100 000-year glacial/interglacial timing.
By the by, the oldest records of modern humans spreading out of Africa date to the early part of the previous interglacial when climates would have been favorable and similar to the early part of our current interglacial. The usual story is that the spread was out of East Africa but I think that’s because of the rich human fossil record there. The Sahara was green at the time and I think it likely that the out of Africa migrations drew largely from the populations there.
Sorry if this is a bit garbled; it’s past my bed time.
The Ice Age is an artifact of the properties of water (as is life on this planet). Once enough CO2 was absorbed into forest, rock, ocean and soils, the reflective nature of water as a solid overtook the dark nature of water as a liquid in determining further temperature reductions.
It’s been fairly repetitive since then, but not boring. In fact much perturbed by earth orbital changes.
Now as CO2 and methane rise from land and ocean, the world will tip back as less ice/snow form. Much more stable, I think.
Something to reflect upon.
Time for some green tea.
Gonefishing,
That’s an intriguing way to look at it. It’s worth keeping attention on water when thinking about a planet covered just over 70% by it.
Sequences of ice ages such as our own aren’t common in Earth’s history; the last such sequence was about 300 million years ago during the Pennsylvanian and the ones before that were late in the Ordovician (centered around 450 million years ago) and a couple late in the Precambrian between 700 and 600 million. The oldest was back about the time our atmosphere became oxygenated maybe 2.4 billion years back. These sequences differed from one another and make up very little of the time span of Earth’s history but the ocean was there all along.
I guess it depends on how tightly one defines Ice Age. If I recall correctly, Antarctica formed ice about 39 million years ago.
During the PETM there was probably no ice on Antarctica or permanent ice anywhere.
Now we have sea and land ice to lose as well as vast stores of carbon to be released naturally.
Perhaps we have pulled the trigger and are just seeing the beginning of a long episode of increasing warmth on this planet. I see no long term factors that will reduce carbon and water vapor in the atmosphere, just the opposite in fact.
We’re right now still coming out of the last ice age, just one of various ice ages that earth has been through in an understood cycle (because earth’s climate has always been a changin’). These changes have occurred a multitude of times in earth’s history with absolutely no interaction from man.
It then stands to reason if the scientists don’t know how or why climate changed naturally in the past, they can’t know how those same natural triggers interact with any influences man could possibly cause.
Reading comments like this reiterates why humans are arrogant and stupid. LOOK AT THE RATE OF CHANGE. And try to learn something.
Iron Mike On the Rate of change? What is your take on the mammoths found frozen in the Siberian permafrost with what I understand to be green vegetation and even flowers in their digestive track. I pick up quite a number of road kill deer and it needs to be really cold to to freeze them before they rot so I have to wonder how extreme the temp change must have been to have them foraging green and then frozen stiff for 1000s of years.
On the Rise of Solar and Wind…(and the death of Coal)-
IEA- “The latest numbers again confirm the bottom line: Renewables are now cheaper than the average cost to operate coal and average cost to build new natural gas.”
Renewable energy prices fell to record lows in 2019
Lazard’s most recent Levelized Cost of Energy (LCOE) analysis shows U.S. renewable energy prices continued falling fast in 2019, with wind and solar hitting new lows, renewables fell below the cost of coal in 2018. LCOE measures the total cost of building and operating a facility over its lifetime, and shows renewables beating fossil fuels by ever-larger margins – even without subsidies – with that trend forecast to continue for decades to come.
Over the last decade, wind energy prices have fallen 70% and solar photovoltaics have fallen 89% on average, according to Lazard’s 2019 report. Utility-scale renewable energy prices are now significantly below those for coal and gas generation, and they’re less than half the cost of nuclear. The latest numbers again confirm the bottom line: Renewables are now cheaper than the average cost to operate coal and average cost to build new natural gas.
New U.S. renewable energy investment rose 28% to a record $55.5 billion in 2019 despite pro-fossil fuel Trump administration efforts, U.S. solar installations could hit a record 19 gigawatts (GW) in 2020 despite federal tax incentives phasing out, and grid regulators estimate 330 GW of wind and solar will come online by 2029.
New U.S. Energy Information Administration (EIA) data predict solar and wind energy will dominate America’s new generation in 2020, making up 76% of new generation and adding 42 gigawatts (GW) of zero emission capacity, while coal and natural gas will dominate 2020 retirements with 85% of plant closures.
source- Forbes 1/21/20
https://www.forbes.com/sites/energyinnovation/2020/01/21/renewable-energy-prices-hit-record-lows-how-can-utilities-benefit-from-unstoppable-solar-and-wind/#157372cc2c84
So, having revealed all that, how do you answer my question above?
It looks like they are projecting increase energy demand over the next 3 decades-
“After falling during the first half of the projection period, total U.S. energy-related carbon dioxide emissions resume modest growth in the 2030s, driven largely by increases in energy demand in the transportation and industrial sectors; however, by 2050, they remain 4% lower than 2019 levels.”
They expect a big slowing in the rate of coal retirement, and gradual increase in nat gas utilization through the period.
I don’t know if their assumptions will be true.
Consider, their projection includes carbon emission from all energy consumption, not just electricity.
If all petrol motors were quickly converted to electrical ones, the projections would look much better just based on marked improvement in efficiency alone,and much so if the increased electrical generation came form low carbon-emitting sources, of course.
Look at page 4 for the details on this
https://www.eia.gov/outlooks/aeo/pdf/AEO2020%20Full%20Infographics.pdf
Once again, if you have not followed Rons advice on this info source, I strongly suggest you take the time to watch and digest this current info regarding the virus outbreak-
https://www.youtube.com/watch?v=K0HYh6zjTUo
Coal remains a major fuel in global energy systems, accounting for almost 40% of electricity generation and more than 40% of energy-related carbon dioxide emissions.
Coal 2019, the latest annual coal market report by the IEA, analyses recent developments and provides forecasts through 2024 for coal supply, demand and trade. Its findings should be of interest to anyone interested in energy and climate issues.
The report finds that the rebound in global coal demand continued in 2018, driven by growth in coal power generation, which reached an all-time high. Although coal power generation is estimated to have declined in 2019, this appears to have resulted from particular circumstances in some specific regions and is unlikely to be the start of a lasting trend.
Over the next five years, global coal demand is forecast to remain stable, supported by the resilient Chinese market, which accounts for half of global consumption. But the report notes that this stability could be undermined by stronger climate policies from governments, lower natural gas prices or developments in the People’s Republic of China.
https://www.iea.org/reports/coal-2019
Well, we got the development in the People’s Republic of China.
The question now is how bad will the rebound effect be as the world attempts to rise out of recession and virulence? Huge rebound after 2008.
While the Renewable Energy cheerleaders continue their (dissonant) victory dance in the real world we have ongoing failure to deal effectively with our biggest planetary crisis:
CLIMATE EMERGENCY: GLOBAL ACTION IS ‘WAY OFF TRACK’
“The world is “way off track” in dealing with the climate emergency and time is fast running out, the UN secretary general has said. António Guterres sounded the alarm at the launch of the UN’s assessment of the global climate in 2019. The report concludes it was a record-breaking year for heat, and there was rising hunger, displacement and loss of life owing to extreme temperatures and floods around the world…
… Prof Dave Reay, of the University of Edinburgh, said: “This annual litany of climate change impacts and inadequate global responses makes for a gut-wrenching read. Writ large is the ‘threat multiplier’ effect that is climate change on the biggest challenges faced by humanity and the world’s ecosystems in the 21st century.””
Meanwhile,
CORONAVIRUS DELAYS GLOBAL EFFORTS FOR CLIMATE AND BIODIVERSITY ACTION
https://www.theguardian.com/environment/2020/mar/10/climate-emergency-global-action-way-off-track-says-un-head-coronavirus
“in the real world we have ongoing failure to deal effectively with our biggest planetary crisis”
We lost the biggest crises back in 1960.
World population exceeded 3 Billion.
Everything else related to the decline of earths ecosphere is merely ramifications of the failure to step hard on the brake at that moment.
Who among you, born before or after that crossroad, have not contributed to this biggest failure?
Well yes, besides current world population of 7.8 billion (as of March 2020) Earth currently has about 19.6 billion chickens, 1.4 billion cattle, and 980 million pigs being raised as livestock. All in service of the wise Master Species. God must be pleased!
Yeah, what a shame and a total travesty. The Mobius Heads will never get it Doug.
To change the subject, here is a more than 2000 year old analog computing astronomical model of the known universe.
https://www.youtube.com/watch?v=Iv-zWbxm2lY
Fish, thanks for that. Fascinating video to say the least.
Climate change responses can only take place at the individual level, so put your money where your mouth is, Doug, and lead the way in adopting a caveman lifestyle.
CORONAVIRUS CONFIRMED AS PANDEMIC BY WORLD HEALTH ORGANIZATION
“WHO chief Dr Tedros Adhanom Ghebreyesus said the number of cases outside China had increased 13-fold over the past two weeks. HE SAID HE WAS “DEEPLY CONCERNED” BY “ALARMING LEVELS OF INACTION” OVER THE VIRUS.”
https://www.bbc.com/news/world-51839944
We all know the airplanes did it.
With death rate below 0.6%, it’s no plague.
Peak oil people can understand the dynamics of exponential growth of the virus perhaps a bit more, especially the plateauing as with the Hubbert logistic sigmoid.
How high the plateau gets on the first wave is the scary part, as China does a lot of strict social engineering to limit the growth to a smaller finite population to draw from.
discussing it over here https://forum.azimuthproject.org/discussion/377/logistic-equation#latest
Paul, as you know, like the (precisely defined) words Hypothesis, Theory and Law, the expression Exponential Growth frequently gets bandied about by people commenting on this Blog who repeatedly get its meaning wrong. I especially hate hearing people say: that’s just a theory, or we have exponential growth (for something that increases rapidly). Sometimes it’s worth explaining to people that Exponential Growth means growth of a system in which the amount being added to a system is proportional to the amount already present: i.e., the bigger the system is, the greater the increase. This avoids resorting to the math and makes a point!
Ummm Doug, science speak is different than public speak. Just like business speak and legal speak are different than both of the previous. Forget computer speak, totally out there. DIMM and dim, RAM and ram, byte and bite, all sound alike. Hardware and software (not tools and ladies’ underwear). Confusing.
Not much science or math actually going on here so one may assume mostly public speak. No way to know for sure, without further clarification.
New Rule, if it bugs Doug, it’s public speak.
Just my observations, not a theory or anything like that. 🙂
But to add more confusion while being more thorough. Read this.
https://www.merriam-webster.com/dictionary/theory
I’m doing this analysis on that forum I linked to because it’s charter is “The Azimuth Project is an international collaboration to create a focal point for scientists and engineers interested in saving the planet.”. I suppose that’s a pretentious goal 🙂
https://forum.azimuthproject.org/discussion/377/logistic-equation#latest
Another similarity is between our Oil Shock Model and the way that a virus spreads using compartment models
https://forum.azimuthproject.org/discussion/comment/21943/#Comment_21943
Dennis could easily take one of his oil production spreadsheets and modify that for a virus contagion model 🙂
I know this ia a waste of time since people see and believe what they want anyway.
Still looking for that exponential wind growth that everybody is talking about.
+1
GF, from 282 GW in 2012 to 654 in 2019, wind has grown at a 12.7% CAGR. This is slightly better than the S&P over the same date range at 12.0% [however, from 2012 to yesterday, S&P is now at 8.9% CAGR – what a difference 70 days can make!]
PS “Exponential growth is growth that increases by a constant proportion” ~ the internet. Surely wind and the S&P (until recently) are examples of that, no?
Edit: S&P gapped down 7% at open today, so make that CAGR 7.8%…
You can make this stuff up. Just ask yourself a couple of questions? Was the growth rate constant each year or was it diminishing as would happen in a linear system? Was the growth rate higher earlier?
Does linear growth also have a growth rate?
1.127^7=2.3092 exponential
2.3092=0.32989 (7) linear
x=time in years
What is the difference?
Getting tired of the simple math lessons. You can graph it for yourself.
USA wind pwr capacity growth rate by year
11-12 28%
12-13 02%
13-14 07%
14-15 12%
15-16 11%
16-17 8%
Overall growth 189% 2011 to 2017
source WWEA
17-18 5%
18-19 12%
Not a constant growth rate. Might have seemed exponential in very early years.
US increased by 76% 2012 to 2019
US increased by 1600% 2002 to 2010
Source Wind Power in the United States -Wikipedia
Ooopsy, what happened to that earlier growth rate? Fell off a cliff and stayed down. Used to double in a year or two, now it has not doubled in 7 years.
GF, I guess you must live in the USA. I was quoting global numbers. Sorry, should have made that clearer. Agree, earlier years were crazy growth which is why I use 2012 as a base year…
Edit: Thanks for staying in the conversation 🙂
Edit 2: global growth has more than doubled in the last 7 years: 282 GW to 645 GW is a 2.32x increase…
If the current actual growth continues, not percent, how long will it take to replace half the global electrical power?
If the CAGRs I’ve quoted continue (32% solar, 13% wind) then solar and wind will be more than half of (today’s) global electricity production in ten years. I know that doesn’t answer your question, I’ll let you answer that.
Hmmm, wind will be about 3 times more than now and solar 16 times more. If for some reason they actually go exponential and stay there.
Yep, at least half the global power if growth changes from near linear to exponential. Last year wind represented 5 percent of global power production and solar 2.6 percent. Adding 200 to 300 TWh per year is not going to cut it, so definite exponential rise needed.
So according to your proposal, We should see an increase in production close to 400 TWh this year. How is it going so far?
Maybe the chart would look different if it were an area chart.
I’ve never really understood the exponential growth claim. Exponential growth comes from positive feedback loops. For example, the number of infections in an epidemic can grow exponentially because the number of infections depends on the number of infected people.
But I don’t see how the number of windmills being built depends on the number of windmills already built.
I suppose that manufacturing costs fall with as the number of windmills built increases. But that depends on the shape of the demand curve.
Costs have fallen by a factor of ten or better, over the last couple of decades , in both the wind and solar power industries. Costs will fall even further as these industries continue to mature.
And before much more time passes, the new big boys with new money who see opportunities to make even MORE money will continue to force their way into the electricity business, because the outsiders now have as much or more money, and except in the USA, more political clout, than the insiders, the oil and gas people.
Sometime soon, in historical terms, the D’s will regain control of the federal government here in the USA, and then the new boys with new money will continue to pour some of it into the renewable electricity business, because it promises to be PROFITABLE…. more profitable than gas and coal fired electricity.
The RATE of growth of renewable wind and solar electricity FAR outstrips the rate of growth of fossil fuel fired electricity.
Unless civilization collapses before it happens, renewable electricity is going to displace fossil fueled electricity, given time, simply because it’s going to be cheaper.
But it’s not going to happen quickly. The existing fossil fuel generation infrastructure is mostly paid for, and most countries are having a hard time coming up with money enough to push for more wind and solar electricity, which have to be paid for UP FRONT almost altogether. Fossil fuel plants have the advantage of paying for fuel as it’s used, years down the road, rather than up front.
The storage problem is overblown, in terms of the wind and solar industries doubling or maybe even tripling production, because there are plenty of ways for businesses and consumers to adapt to using cheaper wind and solar juice when it’s available, thereby saving some money.
“Still looking for that exponential wind growth that everybody is talking about.”
Look, if you want to be smart think the issue through before posting. :-)))
You simply show installed capacity without understanding that the capacity factor of new turbines is much higher than of older ones. Repowering actually adds no kW but kWh. Does the electricity generation by wind power shows only a linear increase? In Germany not, and you cannot explain this with better wind. :-))
“Look, if you want to be smart think the issue through before posting”
Germany is the world!!!!
Look below at German wind power generation with time, 3 years to increase 10X (100 to 1000), then 6 years for next 10X (1000 to 10,000), and more than 15 years for next 10X increase. Not exponential at all, if you understand the mathematical concept.
Maybe next time, you will do some research before posting complaints. Would be good to produce some facts rather than stories.
Apparently the definition of exponential growth is in dispute, at least in day to day conversation. I have an old text book around someplace, a junior high text book, that says any function with an exponent greater than one is an exponential function.
Most people, lay people at least, who are familiar with the term, consider ten percent annual growth to be exponential growth, so far as I can tell, reading the mass media.
But GF uses his math on a regular basis, whereas I’ve forgotten most of what I used to know, fifty years or more ago now, because I haven’t been using it, beyond ordinary arithmetic and maybe some basic algebra and geometry.
I’m thinking he has probably has a point, from the professional mathematician’s point of view, in strictly technical terms.
OFM, think of exponential as a constant with a variable exponent and linear as a constant times a variable.
y=3^x versus y=3X. First produces an increasing curve and the second a straight line. Or on semi-log graph, a straight line and a decreasing curve.
Example of exponential and linear function on a semi-log scale.
“Look below at German wind power generation with time, 3 years to increase 10X (100 to 1000), then 6 years for next 10X (1000 to 10,000), and more than 15 years for next 10X increase. Not exponential at all, if you understand the mathematical concept.”
You stop at 2025. That is lame. Get the data for the next for years. 🙂
And in a logarithmic scale a linear increase would indicate an exponential growth….
Data without context. West Texas wind has been enabled. Wyoming wind has been politically throttled.
Gone fishing —
That’s not a great chart for eyeballing trends, because the curves aren’t additive. Select world instead.
https://ourworldindata.org/grapher/wind-energy-consumption-terawatt-hours-twh?tab=chart&country=OWID_WRL
https://getpocket.com/explore/item/the-2-5-trillion-reason-we-can-t-rely-on-batteries-to-clean-up-the-grid?utm_source=pocket-newtab
Hardly a fucking word in this piece about ways we can live just fine with renewable energy WITHOUT complete backup capacity, no fossil fuel, or only small amounts of ff’s.
EVERY house, and almost every building, can serve as defacto backup battery, and WILL, as it becomes necessary to do so.
Battery storage is undergoing explosive growth. 1 st inning.
The companies that do the work here in central Calif are very busy, hard to hire enough staff.
https://www.greentechmedia.com/articles/read/us-storage-industry-achieved-biggest-ever-quarter-year-in-2019
Coming to a valley near you-
Virginia approves 100% clean energy legislation, pushing state toward 2.4 GW storage
https://www.utilitydive.com/news/virginia-clean-energy-legislation-pushes-state-toward-storage-rggi/572349/
“Hardly a fucking word in this piece about ways we can live just fine with renewable energy WITHOUT complete backup capacity, no fossil fuel, or only small amounts of ff’s.”
But OFM, if you don’t keep feeding them lots of sugar they won’t even take a little of the medicine.
You don’t kill the Hydra by cutting it’s heads off one by one. That is a recipe for disaster in ways I will not explain here. You get the meaning though.
Hi GF,
Unfortunately I have to agree. People, collectively, ARE like spoiled children.
But reality dictates that people making a quarter of a million live in apartments in cities that are literally hovels, compared to my old farm house, except that they have nicer furniture and appliances, lol. These people were willing to make the trade off from ample living space to barely enough to entertain close friends occasionally, voluntarily, as the available desirable housing supply in cities dried up.
Reality will force people collectively to do the same when energy gets to be expensive enough. They’ll go for the ground source heat pumps, the micro cars, triple pane windows, foot thick insulation in walls, two feet in attics, living close to work, etc.
And once they HAVE to make this choice, they will voluntarily switch a lot of discretionary spending from areas such as cosmetics, fancy clothing, high dollar phones, snooty brands of liquor, etc, to energy saving appliances, cars, and homes, etc, because the home and the car will be more important to them than the fancy clothes, high dollar liquor, or premium phone.
The well off people have accepted tiny apartments for the same basic reason, the trade off of being where they want to be, versus ample living space, and some of them spend enough money on rent in a year to buy a nice little farm with a nice old farmhouse ready for occupancy out in the boonies.
This scenario depends on business as usual over the next few decades, in the broader sense of the term. I’m not talking about most people who drive now doing without cars altogether for instance, but rather switching to smaller cars that are cheaper to own and run so as to have more money for other things. ETC
The top ten percent produce 50 percent of the GHG. Of course that is where the bailout money goes, so the 90 percent are disposable inconveniences.
Ooooh shit, but we weren’t not expecting this, were we!
https://www.bbc.com/news/science-environment-51846468
NAOM
From your link: “Earth’s great ice sheets, Greenland and Antarctica, are now losing mass six times faster than they were in the 1990s thanks to warming conditions.”
” it would put 400 million people at risk of annual coastal flooding by 2100,” said Prof Shepherd.
Note that he indicates ‘annual’. This means that occasional flooding will be much more extensive and severe.
It has occurred to me that China might be a fertile breeding ground for human pathogens, particularly those that can be spread by casual contact such as colds and flu. China has an estimated population of 1.409 billion more than 0.8 billion of whom live in urban centers. A quick internet search reveals that over 50% of the adult male population in China smoke cigarettes. Many if not most (all?) Chinese cities are notorious for their abysmal air quality, largely as a result of pollution from coal burning plants across the nation. It should be well known that poor air quality poses a challenge for the human immune system, forcing it to work overtime to combat the airborne pollutants. Couple the poor air quality with a high percentage of smokers and large amounts of people tightly packed in urban centers and what could possibly go wrong?
At the risk of sounding cavalier, I suspect healthy individuals with properly functioning immune systems will recover from COVID19 as they would any other flu.
I wrote the above before doing a search on “flu originating in China” that brought up articles suggesting that major global flu outbreaks may have originated in China from as early as 1918. More recently SARS originated in China a little more than a decade ago. The fact that al of these pandemics have started in the middle of the northern hemisphere winter also suggests that low levels of vitamin D (the sunshine vitamin) might also play a role.
Hmmm, close contact with animals. Where do people live with their farm animals?
https://www.livescience.com/12951-10-infectious-diseases-ebola-plague-influenza.html
https://theweek.com/articles/457135/5-modern-diseases-grown-by-factory-farming
Here is a great way to look at our current situation. Global wind power production is growing at 1/6 the rate of growth of global power production. Solar PV power production is growing at 1/20 the rate of global power production.
Come on people, install more, you are lagging way behind. Accelerate the disruption, somebody took their foot off the accelerator. Wake him up or take over.
GF, I find your numbers simply non-credible. Global energy consumption increases at approx 2.5% to 3% per year.
Really? You are complaining about my saying wind production growth has been about 16 percent of power production growth, when last year it only was 13 percent of total growth? Where do you get your numbers, if any?
Governments warned: $1 trillion in coal power investments at risk
Prepare for a hot summer and severe weather.
Most growth in the energy sector will halt soon as the economies slow down.
https://weather.com/news/news/2020-02-06-united-states-on-pace-record-warm-winter
Dated by a few weeks, but the newest numbers I ran across in a quick search.
It’s time for a new open topic thread!
Here’s something interesting, which supports my argument that demographics rule, and that historically speaking, the days of the orangutan and preachers, etc, controlling American politics are numbered.
First the link.
https://www.cnn.com/2020/03/12/media/fox-news-coronavirus/index.html
And now, the relevant excerpt from the link, for my purposes.
“Fox’s audience is the most vulnerable
The disinformation being disseminated by Fox News is especially alarming given that, like most cable news channels, its audience skews older.
According to Nielsen Media Research, a firm that measures television audiences, the median age of a Fox News viewer for the month of February was 67.
The Centers for Disease Control and Prevention has said that “older adults” are “at higher risk of getting very sick from this illness.”
The hard core of the orangutan’s base is fast headed for the cemetery, the cremation furnace, or the nursing home.
All we need to do to fix our political problems, for the most part, is to somehow get younger people, especially really young people, to vote. They will overwhelmingly vote D or liberal once they show up on election day.
I don’t have any numbers, but I’m thinking at least a million likely orangutan voters will be dead by election day, most of them from the usual causes, but maybe as many as several tens of thousands from CV19.
That might not convince the older ones who remain that it’s not just bad luck or god’s plan for them, but it will serve to get the attention of their somewhat better informed children and grand children, some of whom will then vote D, or stay home.
Demographics will save our sorry asses,politically, assuming we live thru the next few years.
I hope you are correct. It will help, in the longrun, if the democrats govern well.
I am mystified that so many young “progressive” people support Bernie Sanders for prez.
I do support many of his policy positions, but that is a different notion than selecting him to be president.
I see a vote for Sanders as a vote for 4 more years as Trump, as the most likely outcome.
Why is it the young voter demographic is willing to take such a big risk on Trumps re-election?
Are they severely naive about Sanders prospects, are they so desperate for a huge change that they are willing to risk 4 more years, are they unaware that a slow marathon runner can cover 26 miles much faster than a sprinter?
I am not confident of their turnout. Hope to be surprised, and that they can tear themselves away from their device screens for a moment to vote.
Shaping up to be the ‘great’ Quid pro quo vs status quo election of 2020.
I’ll hold my nose and vote for Biden, just like I held my nose and voted for Hillary, but not because I think he has the right stuff, but he’s not Trump; sole feature.
I believe that Trump won in 2016 because he was the candidate that promised the biggest disruption to BAU. The GOP didn’t support him, yet he won regardless. Obama won on a promise of hope and change, and MAGA, as a slogan, is just a repackaging of the same promise. Obama didn’t deliver, and so far, neither has Trump.
I don’t have any data to support this, but I think there is a good chance that a lot of change voters that voted for Trump, would jump ship and vote for Bernie, hoping once again for positive change, but they ain’t going to jump ship for Mr. Coat Tails.
It’s looking like once again, though less credible this time, Trump will be viewed as the most likely agent of change and it will be to his advantage.
As of this morning, Sanders is still in the race, so we have three, soon to be two septuagenarians from which to choose, any one of which could be felled by Covid19 pretty easily, despite the state of the art medical care that would be thrown at them. What then?
Good points you make.
“two septuagenarians from which to choose, any one of which could be felled by Covid19 pretty easily, despite the state of the art medical care that would be thrown at them. What then?”
And excellent question.
I suspect backup plans are in the works. Maybe.
Oh well, maybe we can do better in 2021?
DEFORESTATION IN BRAZIL CONTINUES TORRID PACE INTO 2020
• Deforestation in the Brazilian Amazon continues to rise, according to data from Brazil’s national space research institute INPE.
• INPE’s deforestation alert system DETER shows that deforestation during January 2020 amounted to 284 square kilometers (110 square miles), an area 83 times the size of New York’s Central Park. The loss is more than twice that registered in January 2019.
• January’s numbers put deforestation in the Brazilian Amazon over 9,000 sq km for the past 12 months, an 85% increase over a year ago.
• The various data points suggest that forest destruction in the Brazilian Amazon is currently pacing about double last year’s rate.
https://news.mongabay.com/2020/02/deforestation-in-brazil-continues-torrid-pace-into-2020/
JAPAN RACES TO BUILD NEW COAL-BURNING POWER PLANTS
“… Japan plans to build as many as 22 new coal-burning power plants at 17 different sites in the next five years. Together the 22 power plants would [will] emit almost as much carbon dioxide annually as all the passenger cars sold each year in the US. The construction stands in contrast with Japan’s effort to portray this summer’s Olympic Games in Tokyo as one of the greenest ever….”
Japan relies on coal for more than a third of its power generation needs. And while older coal plants will start retiring, eventually reducing overall coal dependency, the country still expects to meet more than a quarter of its electricity needs from coal in 2030.
Will this summer’s Olympic Games in Tokyo even happen?
https://www.nytimes.com/2020/02/03/climate/japan-coal-fukushima.html
Meanwhile,
CHINA IS STILL BUILDING AN INSANE NUMBER OF NEW COAL PLANTS
“To meet its climate goal as stipulated in the Paris agreement, China will need to reduce its coal power capacity by 40 percent over the next decade, according to Global Energy Monitor’s analysis. At present, this seems unrealistic. In addition to roughly 1,000 gigawatts of existing coal capacity, China has 121 gigawatts of coal plants under construction, which is more than is being built in the rest of the world combined. But here’s the weird thing — more than half the time, China’s coal plants are just sitting around collecting dust. If China already has more coal power than it needs, why does it keep building new plants?
Because, local governments were under enormous political pressure to increase the economic productivity in their region and saw new coal plants as a great shortcut. China’s energy policies from the ’80s and ’90s basically guaranteed new coal plants would turn a profit, so local officials were incentivized to approve as many new coal plants in their region as possible, and that’s exactly what they did. The following year, the capacity of newly approved coal plants in China tripled…
… In 2021, China will adopt its 14th five-year-plan, which will provide a roadmap for the country’s political and economic priorities through 2025. China’s state-run National Center for Climate Change Strategy has advocated for the next five-year-plan to include hard caps on carbon emissions. Premier Li Keqiang, director of the National Energy Commission, which determines China’s energy policy, has a different idea. Recently, he spoke of the need to “promote the safe and green mining of coal and the clean and efficient development of coal power.”
https://www.wired.com/story/china-is-still-building-an-insane-number-of-new-coal-plants/
A bit of overbuilding, they build whole cities that are essentially ghost towns. Keeping busy I guess.
China coal power generation increased by 1.72% in 2019 to make it 2.25 times the global production of solar and wind electricity combined.
Hey Doug, finally sold my telescope a few months ago. Hadn’t had good skies around here for over a decade. Always high haze even on so called clear nights.
Guess what, with this reduction in pollution due to C-virus I have had a dozen beautiful clear nights in the last month or so. Great blue skies during the day too, unlike any I have seen in a long time.
Don’t expect it to last, but if it does we are all in trouble anyway.
I’ve gave up on my backyard radio telescope (an old 10-foot satellite dish) several years ago. Did manage to “see” the Crab Pulsar a few times. With a second dish plus additional hardware (and software), my system could be made capable of some semi-serious pulsar observing — via interferometry. However, I don’t have space (or inclination) to establish a suitable east-west baseline. And, one 10-foot dish just isn’t big enough for the stuff I’m interested in. Obviously, I don’t require clear skies but rather a bigger collecting area!
There are many things still you could pick up with that 10 ft dish. Of course all the big cable channels are scrambled, but a lot of them use a pretty weak form that’s no match for modern computing power… The main OTA networks and several of the smaller diginets that show reruns and classic programming are completely unscrambled. A bigger reflector of like 12 ft or larger is only needed if you’re on the edge of the satellite footprints and your signals are weak or you’re after higher modulated wildfeeds like what you see with NASCAR and such (most of those are scrambled too though).
With respect, I was only interested in “spotting” astrophysical objects, specifically pulsars.
I’ve noticed a lot fewer chemtrails in the sky on clear days over the last couple weeks. I live in the Chicago metro near a flight path to O’hare so truly clear days use to be pretty rare here.
Lol chemtrails?
gadzooks!
A couple of updates on what is happening in Mexico. One thing they do take seriously, around here, is planing for emergencies and things like vaccines with influenza posts set up at supermarkets and door to door in some areas. There are also sessions set up for municipal services where there are vets, doctors, legal advisors, vaccinations etc. Had a checkup, pneumonia and tetanus vaccinations completely free at a local one last summer. Hopefully they will treat covid seriously although vaccines are in the distant future.
In Spanish
http://impreso.meridiano.mx/edicion/vallarta/2020/03/13/politica/publicidad/4.pdf
http://impreso.meridiano.mx/edicion/vallarta/2020/03/13/politica/publicidad/8.pdf
NAOM
Peach trees in full bloom last two days.
Earliest ever.
And in the spirit of trying for renewables.
I’m trying to get a solar panel farm going on a 160 acre plot near the Baluarte Mines in Nevada (38°07’20.6″N 118°00’37.4″W).
Best luck! Got transmission trunk line nearby?
It was supposed to be a banner year for PV and Wind power installations in the US. Will probably still be large but slowdowns are expected across the globe due to the COVID-19 virus pandemic.
BloombergNEF (BNEF) has reduced its global solar demand forecast for 2020, due to the impact related to the coronavirus (COVID-19) outbreaks.
BNEF lowered its forecast range from 121GW-152GW to 108GW-143GW. With the low end of the revised range, BNEF is highlighting the possibility that COVID-19 could have such an impact on demand that 2020 could mark the first time in several decades when annual demand falls below that of the previous year.
https://ieefa.org/bloombergnef-coronavirus-likely-to-slow-solar-pv-installations-in-2020/
It seems likely that battery tech will continue to improve from one year to the next with prices falling at least a little every year for the easily foreseeable future.
And with some luck
https://www.caranddriver.com/news/a31409442/samsung-solid-state-battery-revealed/
This from my Daughter in Italy this morning:
“We are definitely under quarantine now. The only shops open are grocery stores (closed on weekends to avoid crowds) and pharmacies, and the number of people inside are restricted, which means G. had to line up to get medicine yesterday (sick dog, our vet diagnosed from photographs in e-mail), a meter apart from everyone else, and only two were allowed in the store per time.
More than that, the police have road blocks everywhere, and even if you’re walking your dog on foot, they make you sign an official document about your exact route and activities — then they check after to make sure you’re home.
It’s about time, in my opinion; and feel safer, knowing this is finally being taken seriously.
The positive side, is people are complying, and the local soccer fans, who have had the tickets to cancelled games refunded, have donated the money to the hospital with the express purpose of helping.
Meanwhile, everything at home is just fine. I’m not very worried, since I essentially had us quarantined on day one, and we are well prepared food-wise.
But the death rate is absurdly high compared to China, and this is going to hit a lot of families hard. The worst part, is once you are in isolation, that’s it: if you don’t come out again, there is no chance to say good-bye.
The doctors are now predicting the peak to come in about 14 days. I hope that is right, and things can settle down.
As it begins to hit the rest of the world.”
This is the best article I’ve read regarding diagnosis number vs actual numbers, spread, mortality rate variations between countries. Definitely worth a read and probably a good person to follow on twitter.
https://medium.com/@tomaspueyo/coronavirus-act-today-or-people-will-die-f4d3d9cd99ca
Basically, Italy is behind the curve. And the US is a sitting duck given the lack of social cohesion, the ineffectiveness of Federal Government, culture of misinformation, et al.
Thank you, yes outstanding summary!
Wow, lots to take in, thanks for that. Should be compulsory reading.
SOCIAL DISTANCING MUST BE COMPULSORY NOW.
NAOM
twocats,
Thank you very much for the article.
From the article:
The worst infection then becomes through surfaces: The virus survives for up to 9 days on different surfaces such as metal, ceramics and plastics. That means things like doorknobs, tables, or elevator buttons can be terrible infection vectors.
That 9 days seems a typo. Must be 9 hours ? Never heard/read that a virus “survives” that long outside cells
There have been reports that the virus can live much longer on metal or plastic surfaces, 1 day and upwards though there is no consensus on how long. Other surfaces much less than 1 day.
NAOM
I agree, 9 days is quite excessive.
On the site of an article I’m about to post, I read 3 days if recalled, but I imagine the type, quality and temperature of the surface and surrounds matter.
Has there been any work on strains of virus to see if the Italian strain is different or more aggressive?
NAOM
I have been scanning the news for this issue. Nothing yet.
It looks like the case trajectory in countries who have not been taking appropriate measures quickly enough are very similar, including Italy, Iran, France, USA for example.
No epidemiological evidence for differing strains when you dissect the data. For example, the heavy caseload among the Korean Church was a young population, thus the lower mortality rate.
Thanks
This information- asymptomatic spread- is very important, especially in countries that have failed to enact early widespread testing, like the USA (still failing miserably in this regard).
https://www.cnn.com/2020/03/14/health/coronavirus-asymptomatic-spread/index.html
An article about the possibility of using hydrogen as seasonal storage.
https://pv-magazine-usa.com/2020/03/13/hydrogen-is-the-first-viable-option-for-seasonal-storage/
I’m thinking it’s going to be practical a lot sooner than thirty years, but probably not produced in even remotely large enough quantity for a very long time, if ever, to continue with today’s business as usual energy consumption.
What’s going to happen, imo, is that wind and solar power are going to be vastly overbuilt, so as to save on the purchase of coal and gas, and oil too, to a certain extent, so that huge surpluses will be available during sunny and or windy weather, and that electrolysis plants can be and will be built to take advantage of this intermittent surplus electricity. This does assume that such plants will be economically viable while operating part time of course.
This is an inexpensive asymmetric solution: the electrolysis would take place during the majority of the year (whenever there was a surplus of renewable power – the percentage of time would increase along with the relative amount of over-building – if we overbuilt as much as 3x then the surplus would exist for at least 90% of the time, and there would be a significant deficit only perhaps 1% of the time).
So…if your electrolysis is happening 90% of the time, and your backup generation is only happening 1% of the time, the ratio of electrolysis equipment to generation equipment would be 90:1. That means that you don’t need much of the expensive electrolysis equipment. If, say, your grid generation averages 450GW and you need 300GW for 10 days for backup, you can build 10 GW of electrolysis which will operate for 300 days, and 300GW of less expensive turbines (or even ICEs) that will only operate for 10 days. Or 290GW of turbines in combination with the 10GW of fuel cells (electrolysis in reverse).
Some frequent posters here are staunchly against the energy and climate adaptation we lump under the term ‘renewable energy’ [wind and solar] deployment. They go to great effort to denigrate efforts at innovation in this sector.
And thus they are ‘defacto’ pro-coal. They may not admit it, or may even deny it (lesson learned form Trump perhaps). But it is what it is.
Well, I have some bad news for them.
But lament not, it is good news for everyone else (including non-human life).
https://www.vox.com/energy-and-environment/2020/3/14/21177941/climate-change-coal-renewable-energy
So, putting forth realistic numbers on ‘renewable energy’ [wind and solar] deployment equates to being ‘defacto’ pro-coal? Perhaps you should sign up for a night school course in logic for beginners because generalizations like this make you sound like a moron, at best!
PV global installations at end of 2020 will displace 1.3 percent of 2019 coal consumption. Problem is that coal is growing at 2.3 percent for power use globally(much bigger basis). If renewable energy is to make a dent it has to increase much faster.
Which means you’re ‘defacto’ pro-coal. 😉
Doug,
The markedly adolescent nature of the remarks is a strong tell. But, it’s the internet, full of all kinds.
I do find the delusion that giving civilization silicon implants and whirly beanies will stop the extinction event. Most likely they are just worried that the lights will go out or that the TV programs will stop. Sad.
Back to the skies!
This fellow gives an excellent assessment of the degree of astronomical observation problem that will be caused by the Space-X Starlink program will present.
Starlink Satellites and Astronomy: New ESO Report
https://www.youtube.com/watch?v=vXCLlOn7kNc&t=1763s
LOL
The problem that coal industry has is coal is that their product is now too expensive. Even running existing plants costs more than building new renewables. The costs vary quite a bit from area to area, but the trend is clear.
https://carbontracker.org/reports/how-to-waste-over-half-a-trillion-dollars/
Here’s more on that from Reuters:
https://www.reuters.com/article/us-coal-power/nearly-640-billion-coal-investments-undercut-by-cheap-renewables-research-idUSKBN20Z001
96% of the [EU’s] 149 GW of operating coal capacity costs more than new renewables.
Renewables don’t have to “make a dent” because most energy is wasted anyway. Killing profitability is more significant.
“Renewables don’t have to “make a dent” ” So you believe that renewable energy does not have to grow ?
I think renewable energy has to grow faster to achieve replacement. Lower cost for the basic generation is a good economic motivator to use it.
BTW, despite the limited view of some on this site, it’s not just coal that must be replaced. Coal is the fixation of one person here (not me).
Meanwhile, the natural gas mining that will stimulate more natural gas from nature is increasing quickly.
Also, to have an even stronger effect, EV production needs to ramp up quickly.
Just think how much PV and EV could be quickly subsidized from all this money being poured into the markets, banks and fossil fuels by governments. Then I would think people were actually serious about their spoken aims rather than just waving hands and spouting righteous psalms of a “green” world.
Also, a realistic view of PV and wind with storage hurts the economic advantage (from a classic point of view).
Supposedly, a large amount of PV will be installed in the US this year, something on the order of 20 GW. Actual production will be more like 4 GW. Compared to a total of 461 GW for the country, with 285 GW production being fossil fuel driven.
At that rate of replacement, even if demand never grows, it will take over 70 years to replace fossil fuel generation.
Next we have to take into account losses for storage and increasing EV demand (to replace oil). That could be taken care of by increased wind power.
So unless installation rates of PV and wind increase by at least three times the current rate, it will take well past mid century to replace fossil fuel electric generation alone. That is for a country with essentially flat demand.
The big question now is will the economy hold together long enough to support such an endeavor.
“The big question now is will the economy hold together long enough to support such an endeavor.”
In a rough economy, one of the things that has to happen is that costs have to be cut to the bone. Without operating surpluses in some areas, there will be no support for loss leaders which in the current environment means coal plants will have to shut down at an accelerated rate. From the article at Vox linked to by Hickory above: According to Carbon Tracker, “around 70% of China’s operating coal fleet costs more to run than building new onshore wind or utility-scale solar PV.” The logical thing to do is to build more onshore wind or utility scale solar but, logical things are not always done when the going is good. When the going gets rough, it becomes harder to justify not making logical choices. We live in interesting times!
I am impressed when all changes, both positive and negative, provide to the same result.
I’m with Alimbiquated,
Renewables are going to mostly push coal out of the market place for electricity given time. But coal generation is so far ahead, as a percentage of the total, that it’s going to take quite some time.
We will eventually be burning only enough coal to cover the intermittent shortages resulting from variations in the weather, and seasonal shortages, above and beyond what we can cover using gas.
I’m thinking some coal plants will still be running even in places like the USA and Western Europe decades down the road……. but only on an intermittent basis when they are badly needed due to unsatisfactory production from wind and solar farms.
Sometime after that, we may be able to give up coal altogether, as generating fuel.
With really good future weather forecasts, we will know when to fire them up twelve to twenty four hours in advance, and that’s long enough.
Nobody much in this forum seems to agree with me that the people and governments of countries that are energy importers will see the light, in terms of local employment, national security, balance of trade, and environmental quality, and put the pedal to the metal, eventually, for renewable energy, locally produced when possible.
But it’s going to play out this way anyway, lol, because this is the usual course of history. Countries build their own weapons, when they can, and grow their own food, when they can, once they’ve had a problem with imported supplies.Countries will likewise produce their own energy, if they can, once they are able, and it’s safer and cheaper than importing energy.
Or if local production is impractical, a country such as Italy, which has plenty of sunny weather, can cut a deal with say the French, and have the French pay for solar farms with the Italians getting part of the electricity for use of their land.
Then they can swap both ways, when either country is in need, if the other one has a surplus. Long distance transmission lines are expensive, but once built, they last pretty much forever.
But countries such as China aren’t able to deal with the upfront cost of building renewables in the here and now, compared to building more coal plants.
The history of energy consumption seen below. Since 1800, population rose by over 7X and energy rose by 30X. That is four to one ratio (energy/population).
Will energy use double again, as some predict? Or will it go over the cliff as others think? Time will tell. Trends say the latter, but things change.
GF,
Silicon Valley guys like Vinod Khosla and Elon Musk think there will be vast amounts of solar. I think Freeman Dyson started that line of thinking back in the day.
Here’s Bob “I invented the internet” Metcalfe making this claim.
https://youtu.be/TdtEEBcCeD0
That may start in 30-40 years, but I have my doubts. The big question is why bother, a question nobody seems to be able to answer. One way or another, it isn’t really relevant for the time being. Metcalfe suggests desalination and space travel may be the answer. On current trends computation will be the biggest energy consumer by 2050.
In the meantime, I wonder why we have such a huge energy industry. Most of the output is squandered anyway. Huge amounts go into poorly conceived transportation systems and heating badly insulated buildings. Industrial demand for energy per unit output is steadily declining. In other words “more energy” is rarely the correct answer. Maybe the energy industry is just a parasite.
Renewables offer the possibility of separating energy production from the business of buying and selling energy. I think that is the upshot of what OFM is saying. So homeowners may soon be asking themselves questions like whether it makes more sense to upgrade their batteries or improve their insulation. Traditional utilities don’t like this kind of question, because it implies that “more energy” isn’t the only solution.
So anyway, in the short term I don’t think renewables need to replace fossil fuels. I think we need to rethink energy. I agree with you that renewables should grow faster, but more to break things (Silicon Valley style) than to replace them.
There’s no need for a false dichotomy. It’s not renewables or efficiency. It should be renewables *and* efficiency, and both of them ASAP.
Two hundred years ago, even one hundred years ago, it all seemed OK in a bizarre way. Bring up the levels of convenience, comfort, medicine, education, and speed by using the dead and buried. The problems were not really seen, just as animals were viewed as meat, clothing, decoration and entertainment. Didn’t matter how many were killed or even if they vanished.
Yes, alim, profit and the infinite consumer hook is a major objective of the energy and most business systems. Waste is paid for by the consumer and throttled back by the industries as needed.
I agree, the whole system needs to be re-invented in a much better way. That does not fit into profit schemes needed for most efforts. So it will take a huge shake-up to have a chance at that.
Problem is the unpaid bills for all that squandering, killing and waste is coming due all across the planet.
OFM,
I agree. Look at Kansas and Nebraska, two state governments bought fair and square by coal companies, who have had to cut coal imports and replace them with wind because in-state farmers insisted. It simply makes no sense to let yourself get dependent on outsiders with mineral rights in far flung areas.
Agree Alimbiquated
“Even running existing plants costs more than building new renewables.”
And that is the gist of the article that I had shared as well.
Eating The Rich
The System’s fundamentally irrational.
Anyway, here’s a thought:
Let’s say The System is like a giant meat-machine that is slowly running out of calories to consume. What do meat machines do when they slowly run out of food? Maybe they conserve energy and burn their fat. So how does The System conserve energy? Coronavirus/COVID19. Where is its fat? The rich’s money and assets. ü
Some people seem a little defensive.
They like their coal black?
Its Ok, its good to have many perspectives, and to have some people specialize in belittling solar and wind is a good exercise in ‘how people think’.
And some people wear rose-colored glasses.
“rose-colored glasses”
Please don’t get me wrong. I am not optimistic, and do not think renewable deployment will be enough to offset lost fossil fuel energy as we progress through this depletion phase. But its kind of like closing the windows when a scold storm is rolling in. You do what you can. And sure you may lament that the window insulation factor is poor (R-3 for double glaze?), but how many times does it need to be said?
btw Doug, I did not have you in mind upstream. I appreciate your perspective.
Larch & Hickory
Maybe the storm requires that the windows be shuttered and that the glass closed, alone, won’t do much, and may even be dangerous, such as if it shatters during the storm, gives a false sense of security or detracts from priorities or other, more effective actions.
Industrially-produced photovoltaic solar panels and windmills are ‘monocultural’ approaches to ‘polycultural’ problems and that depend on bad forms of government and business as usual to boot. That’s not a good recipe.
You’ve mentioned hereon before that you’ve studied agronomy. Hey great. So, well then how about sharing some of that knowledge– maybe in a kind of Cuban Special Period as applied to current global issues context– if you haven’t already? Even JH Kunstler has recently mentioned root veggies, because, if memory serves, they store well.
It’s spring soon over here in Nova Scotia and if I can swing it, I’m about to go just for fun to a little seed/plant shop’s seed-sprouting/planting seminar at the end of the month and see what else I can learn. What can you tell us about that sort of thing for example?
I’ve just begun slowly and casually teaching myself about trees this year by the way- how to identify which, but also what might be edible about them. I already know about the edibility of spruce-tips for example. Someone on the path I was on last week told me what they thought a particular conifer may have been. She said, Tamarack, but I looked it up and Tamaracks seem to look like a type of Larch, which I know reasonably well because I’ve transplanted a couple before. Apparently, the Larch likes it a little wetter and is a good wood for boats, since it resists rot well. Its needles fall in the autumn.
I love trees.
Caelan MacIntyre,
I’m with you in regard to trees. I learned most of them by their pollen and I recommend that you look online for pictures of the pollen of Juglandaceae, the walnut family. The family includes walnuts, butternut, pecans, hickory, and wingnut. Wingnut is a Eurasian tree that makes a seemingly indestructible and nearly unstoppable street tree; the others I named are native to North America. Their pollen grains are unlike those of any other family. (I don’t know if there are such pictures online but I wouldn’t be surprised.)
Tamarack is a name for the Eastern Larch. Larch pollen, sad to say, looks like an empty plastic bag.
Coming up on time for Port oboy.
Thanks, Synapsid.
I’ll definitely look up some of the pollen and will probably end up looking at some of it in any case in my foray. I do have a concern, though, with being unable to see it effectively without some sort of technological aid such as a microscope or even magnifying glass. My tack is to be able to distinguish something like a tree species without such aids, using only the naked eye and limited stuff in the backpack. At the same time, however, I’m not averse to using them where I can and while they and the internet are still around.
Natrually, trees that enable good soil, sequester C02 and produce material and edible stuff like leaves, needles, bark, fruit and nuts make sense in a declining peak energy civilization and from a personal-empowerment perspective, as well as simply for the love of nature and all that it offers.
Caelan MacIntyre,
You’d need a microscope to see the grains, of course. They don’t help in field identification, that’s a whole different kind of fun. I live in the Pacific NW and we have very low diversity in our forests but one Summer visiting Massachusetts I went wild–every tree I walked up to was different from the last. I knew them all by their pollen but I was identifying them from my tree book.
I suggested the online search because the grains are so neat, many very beautiful.
Under what circumstances were you learning about tree pollen and what makes some kinds beautiful/neat for you? What should I look for in that and other regards?
The coronavirus, incidentally, at least as represented here and there as a 3D model reminds me of some kind of underwater mine or expensive chocolate-truffle-granola-liqueur cluster.
BTW, the tree that someone guessed might be a Tamarak was not one, but I still wonder what it was and have yet to properly find out. Its evergreen needles grew out flat along the branch.
BTW2, if recalled, the pot distillation method looks very simple and I may attempt that one before the pressure-cooker method. If so, it looks like I will be enjoying a drink– probably a cold-brewed milk-brewed, semi-frozen Sumatra or Ethiopian bean coffee to begin– spiked with the home-made ‘vodka’ before the end of spring, if not sooner.
BTW3; I lust looked up port again. It looks like a bother to home-make since it’s both a wine and spirt and does well to be aged. (I wonder what the older, over 40-year, ports cost.) I actually like ice wine and still need to try a port (assuming I already haven’t and didn’t know it was a port). What was your recommendation for a good, reasonably affordable port for a newbie again, and since it is unlikely I’ll ever home-make one?
Caelan MacIntyre,
I was learning to identify pollen grains during my first year of grad school in the lab of Margaret Davis at Yale. She’s the one who brought Quaternary (ice-age, approximately) palynology to North America maybe back in the 1950s from Denmark; the technique had been developed in Sweden in the early 190os I believe.
Plants with showy flowers attract pollinators but plants like most trees outside the Tropics simply make lots of pollen and let the wind carry it away. Wind-borne pollen settles out over the whole land- and waterscape and in particular the grains are incorporated into growing peat and the sediment building up in lakes. My masters work was building a sequence diagram of the pollen types recovered from a core of lake sediment 17 meters long from Mineral Lake to the SW of Mt Rainier in Washington state (I’d moved to the U of Washington.) The pollen sequence is a proxy for the sequence of floras over time in the catchment of the lake and near it and thus for a good part of the changes in ecosystem as well. To some extent that sequence can be read in terms of temperature and precipitation history.
BTW: If the needles grow out flat from the branch it’s likely to be of the true firs but I can’t recall which one. Look for cones; the cones of true firs stand upright on the branches and disintegrate so they’re rarely seen on the ground unless a whole branch with cones comes down. If cones are small like maybe an inch and hang below the branch it might be a hemlock.
BTW2: You’re a braver man than I but I wish you good luck.
BTW3: Port is one of the fortified wines so-called because brandy or another spirit is added at some point in the distillation. This was originally a means to prevent the wine spoiling but now is used because of the various product characters that can be produced. The main fortified wines are Port (yay!), sherry, and Madeira. Ports are mostly made in Portugal (the name comes from Porto) but they’re also made in California, Chile, Australia, and here in Washington state. I’m happy with the Portuguese ones. No one says that making them well is simple.
I have never tried a 40-year Port but I’d guess it would be close to $100 a bottle and taste very much like a sherry, as sherries are drier than Ports as a general thing. Recommendation, now, that’s difficult. It seems from experience that if one enjoys wine one does not enjoy Port–can’t say that surprises me because I don’t enjoy wine. Ports are mostly either Tawny or Ruby Port, the difference being that Tawnies are aged in wood and Rubies aren’t. For years and years I bought only Tawnies because who’d buy a Ruby? That lasted until I bought a bottle of Warre’s Heritage Ruby by mistake, cursed myself for an idiot (I hadn’t spotted it until it was in the glass: “Huh; that isn’t a Tawny”) and found I liked it. I’m pretty sure no wine lover would. I don’t set myself up as one o’ them corner-sewer types, I jus’ know what I like.
I’ve had good luck with Fine Tawny Ports from Kopke and from Quinta da Romaneira; the latter is unusually light for a Port and I’ve become fond of it. “Fine Tawny” is the basic good Port and here in the Puget Lowland currently prices range from $14.99 to $19.99 (US) a bottle. With Port you get what you pay for and $6.98 Tawny from Trader Joe’s is worth every penny I suppose. My own approach to trying a new Port is: If I like it I’ll try a second bottle. There is some variation to be expected from bottle to bottle.
The beauty of pollen grains to me comes from endless variety and in most families the symmetry of the grains. That variation in ornamentation is tremendous. Some are very simple admittedly: Grass pollen grains are spheres with a small pore that has a lip; magnolia pollens are shaped like Navy beans. But most tree pollens have a plane of symmetry, sometimes two, and astonishing ornamentation. Magnification x450 is needed for best viewing and that’s why I suggested looking online–I should have specified magnified images. That I did not so specify haunts me.
Caelan MacIntyre,
I just sent quite a long reply to your 8:06 post and it’s vanished. If it doesn’t show up I’ll try to re-send.
Caelan MacIntyre,
Here’s a second try: I learned tree pollen in the lab of Margaret Davis who had brought palynology to North America from Denmark; I believe it was developed in Sweden in the early 1900s. Trees that have showy flowers attract pollinators but most in the mid- and higher latitudes just make lots of pollen and let the wind carry it away. The pollen rain falls on land and water alike and is incorporated into growing peat and the sediment that builds up in lakes. The sequence of pollen grains is a proxy for the changes in flora over time in the local catchment and that records changes in ecosystem over time. My Master’s research was mapping the sequence of pollen grains from a 17-meter core of lake sediment out of Mineral Lake, to the SW of Mt Rainier. To some extent such a sequence can be read in terms of temperature and precipitation.
BTW: If the needles lie flat the tree may be a true fir though I don’t recall which one. Look for cones; fir cones stand upright on the branch and disintegrate there too–you won’t find fir cones on the ground unless a whole branch bearing them comes down. If the cones are about an inch long and hang below the branch the tree could be a hemlock.
BTW2: You’re a braver man than I am and I wish you good luck.
BTW3: Port is a fortified wine like sherry and Madeira. Brandy or another distilled spirit is added at some point during fermentation. Most Ports are either Tawny or Ruby, the difference being that Tawnies are aged in wood. A 40-year Tawny would probably cost somewhere near $100 (US) a bottle and taste like a sherry but I haven’t had one.
Recommendation, now, is difficult. Those who like wine generally don’t like Port, to start with. I’ve had good luck with Fine Tawnies from Kopke and from Quinta da Romaneira, the latter an unusually light Port. Fine Tawny is the designation for the regular good Port and here in the Puget Lowland they run currently from $14.99 to $19.99 a bottle. (Ports are about 19.4 per cent alcohol while a Burgundy would be about 13 per cent.) With Ports you get what you pay for; I’m sure a $6.98 Tawny from Trader Joe’s is worth every penny.
I hadn’t had a ruby (who’d buy a ruby?) until I bought a Warre’s Heritage Ruby by mistake. I cursed myself for an idiot when I saw it in the glass but I’d opened the bottle so I sipped it and found I like it. One learns.
Pollen grains vary tremendously. Some aren’t very interesting–grass grains are plain spheres with one pore that has a lip, and magnolia grains are shaped like Navy beans–but most have one or two planes of symmetry, and ornamentation varies without end.
Caelan MacIntyre,
It happened again. I don’t know why.
Doug, it’s not rose colored glasses, it’s a pure effort to limit free speech when it does not fit his delusional view of reality. He cannot take the truth. Nor does he have any comprehension about how scientists think or how science operates. Belief operates without an anchor and blows whereever it’s sent by biased concensus.
Roses are edible.
OFM –
Above you wrote: “…but countries such as China aren’t able to deal with the upfront cost of building renewables in the here and now, compared to building more coal plants.” What makes you think that when:
China has 29,000 kilometres (18,020 miles) of high-speed rail (HSR), the longest HSR network in the world.
China boasts the world’s longest, second-longest and third-longest metro systems. Eight of the world’s 15 longest metro systems are in China. Although the Shanghai Metro only started operating in 1993, it is now the world’s longest subway system. Half of the top ten busiest metro systems in the world are in China.
China has over 130,000 kilometers of highways nationwide, according to an official census on the country’s expressways. That’s enough to go around the globe more than three times. Every year since 2011, another 10,000 kilometers has been added to the network. And, China now has the world’s largest highway system.
China has 206 supercomputers and is leading the US by a record margin.
China has 36% of the world’s industrial robots, with about 154,000 units. This is down 1% from 2017, but it’s still more than the Americas and Europe combined.
Over the past two decades, Chinese steel industry has increased its output significantly and has grown into the world’s largest crude steel producing country, accounting for almost 50 percent of the world’s production..
China was the first country to pass 100 GW of cumulative installed PV capacity, and by the end of 2018, it had 174 GW of cumulative installed solar capacity.
I could go on but you get my point? ?
Got me on the chin with this one Doug!
I should have thought more and typed less, lol.
Coal is working better, faster, than more wind and solar power for China, even though they are pouring it on in every sort of investment, including renewable electricity.
I should have emphasized earlier that coal plants can be built close to where the juice from them is needed, and the coal hauled there on trains as necessary…..
Whereas remotely located wind and solar farms require new power lines, and still require coal or gas backup.
Plus there’s a lot of politics involved. Local politicians and investors want LOCAL investment, and if the choice is between a local coal plant and a power line to a remote wind or solar farm…… which will leave those local people in the dark and cold now and then, and local factories sitting idle now and then…….. they’re going to go with coal, because coal is the short term answer for them that works best by a mile, for the next few years.
This is not to say the Chinese aren’t building wind and solar farms out the ying yang. It’s just that from their pov, coal seems to be the answer to near term electricity supplies, around the clock and around the calendar. Neither they nor anybody else has a handle on the intermittency problems associated with wind and solar electricity.
Of course they’re eager to cut back to the extent possible, or maybe I should say, PRACTICAL, on purchasing imported coal, and they’re also eager to make sure they continue to dominate the solar power manufacturing sector, and to the extent they can, the wind power manufacturing sector as well, and this means using all they can of their own production in these to industries, so as to maintain the advantage of massive scale, thereby achieving the lowest cost, for the rest, which they export.
At any rate, they have the materials, talent, and manpower to build coal plants, and they need CONSISTENT electricity production NOW, not consistent theoretical production later on…… and while wind and solar might be cheaper, and are cheaper, in the long run, I don’t think they can giterdone, in the short run, with renewables, but they can get it done, in that same short run, with more coal plants.
We may not be building any new coal fired plants in places such as the USA, but we will likely be running some coal and a LOT of gas fired plants for decades to come.
If the Chinese had domestic gas resources comparable to ours, they would likely quit coal immediately and build new gas plants instead.
They don’t and they can’t import gas in such quantities as they would need, because it’s simply not available at any price, to the best of my knowledge.
But coal IS available to them in just about ANY quantity they might want, with no worries about depletion. Coal is dirt cheap, and it’s likely to stay cheap.
Bottom line, they’re going with the safe bet, in terms of their economic growth and security.
This is my interpretation of the situation.
YMMV.
Mac, The whole point of the article linked to by Hickory further up and the Carbon Tracker study on which it is based (linked to by alimbiquated) is that, many existing coal plants and all those under construction or planned are destined to become stranded assets with a a high degree of certainty. Here’s the link to the Carbon Tracker web page where the report can be downloaded (free account required):
https://carbontracker.org/reports/how-to-waste-over-half-a-trillion-dollars/
Below is the link to the Vox article based on the Carbon Tracker report:
4 astonishing signs of coal’s declining economic viability
Bold mine. The expected economic life of a coal plant is at least 30. years and can be extended to as much as 60. As such I doubt the builders of such plants expect to recover their investments in under 10 years. If as the article linked to above states, By 2030, it will be uneconomic to run existing coal plants” investors in newer plants are certain to lose some or most of their investment. Hence the title for the Carbon Tracker report page: ” How to waste over half a trillion dollars”.
Below is the take from the utilitydive.com web site:
Global coal developers at risk of losing over $600B through building new plants: Report
Mexico/Jalisco update. Screening taking place at points of entry to the state and University of Guadalajara (how do they get so many ‘a’ in one word?} is going virtual
In Spanish
http://impreso.meridiano.mx/edicion/vallarta/2020/03/14/politica/publicidad/4.pdf
NAOM
Another example of how electrification of transport is a big and viable deal-
Its not electric, but it can go about 63 miles on electricity before the ICE engages, while carrying two pallets of cargo. Not shabby, and in the UK where this vehicle is developed, they are weaning off coal pretty quick-
“Coal supplied 5.4% of UK electricity in 2018, down from 30% in 2014”
https://insideevs.com/news/404038/new-plugin-van-levc-name-vn5/
Interlude from the rose colored glasses balcony- ‘always look on the bright side of life’
https://www.youtube.com/watch?v=JrdEMERq8MA
Available in any colour you like so long as its white.
NAOM
The Plasma Universe Overthrows the Mental Cage of Newton – Revives Planck’s Musical Space Time
Hi Islandboy,
I’m all for pedal to the metal on renewables and conservation, but I still try to understand why people, and countries, do as they do, when they opt to invest big money in coal plants.
I’ve read the Carbon Tracker stuff you excerpt, and a good bit more besides, but thanks for posting it.
The real key to understanding almost ANY question or issue these days is to look at it from the OTHER side, as if you were ON the other side, and then draw conclusions as impartially as possible.
So , maybe I can try again to get my argument across. China is a country that is by and large governed from the top down, with local governments and some companies and some rich and powerful individuals having considerable leeway to do as they please, so long as their actions are consistent with national policy.
The top priority of the leadership is virtually always to stay in power. Chinese leaders understand that the best way to do that is to make sure the economy hums steadily, and that the country is secure and peaceful.
So how can they do that— keep the country safe, people happy, fed, working, expecting to be a little better off from one year to the next….
They invest in the military, as every country does, they work to expand their industrial base, etc.
They ARE pushing wind and solar power, HARD…… but that’s NOT going to keep those factories running, and all those new lights in all those apartments with tv’s and refrigerators running, when the wind doesn’t blow and it’s night or cloudy. NOBODY has a viable solution to the intermittency problem.
THIS is the goddamned problem, from their pov. They need huge amounts of around the clock around the calendar electricity, WITHOUT FAIL, to keep the factories humming and the people nice and quiet and mostly SATISFIED.
The PROBLEM, with everything you have excerpted, is that it’s based on avoiding a discussion of the problems associated with wind and solar power, especially the big two,one being the money going in up front, with the PAY OFF coming ten or more years down the road, and the other being intermittent electricity shortages.
The stability and security of going with coal NOW is worth more to the Chinese than the money they can save, years down the road, by going to wind and solar NOW. They don’t really HAVE to put much thought about things ten years down the road, and stranded assets. They will write those coal plants off, the way the USA writes off obsolete military equipment, or outdated drugs. They care about NOW.
We say here in the USA that corporate management is determined by the necessity of showing results quarter after quarter, and that politicians are more or less compelled to focus on the short term, the next election, a year or two down the road, etc, than the long term good of the country. I’m saying the Chinese leadership is doing the same, going with the better short term policy, at the expense of the long term. If the people running the show last five or ten more years, they will either be ready to retire, or ready to continue their fight to stay on top.
I could buy a new Tesla truck next year. But I won’t be around long enough to “come out” owning it, so I’ll stick to my old gas hog Ford.
Ten years from now, they will still be running those plants, or at least quite a few of them, as backup plants. Not many of them will actually be torn down. If they can get gas enough, cheap enough, they will convert them to gas, which is much better for backup power. The intermittency problem is still going to be with them, and us too, ten years from now.
They’re rational, from their own pov, in terms of their own big picture.
Or maybe the national leadership is not powerful enough and stable enough to force local governments and companies to “do the right thing” and go with wind and solar now.
It is essentially the same thought processes that have resulted in a 190 MW combined cycle gas turbine (CCGT) plant being built in Jamaica despite the fact that a new solar PV facility commissioned months before the NG fueled plant is already the lowest cost, new source of electricity on the local grid. The US$330M spent on the CCGT plant could have added at least 185 MW of solar PV but, as you point out, there would still be the intermittency problem.
The difference is that while larger economies might be more able to write down the losses on investments that turn south, small island developing states might face more problems with covering the losses on these stranded assets.
The Virus People
Viruses revealed to be a major driver of human evolution
Study tracking protein adaptation over millions of years yields insights relevant to fighting today’s viruses
The Viruses That Made Us Human
Viruses that infected our ancestors provided the genetic foundations for many of the traits that define us.
The Matrix – virus scene
Don’t know the species, but for the first time ever in living memory, we didn’t see the ones we refer to locally as “snowbirds”. They’re gray trending towards black, ground feeders, almost round in appearance, and have ALWAYS shown up coming down from farther north and higher elevations when there’s snow on the ground or if it’s really cold.
Sounds like a Junco to me. Had some here during the “winter that wasn’t”, not many.
Thanks, that’s it.
Memory isn’t what it used to be, lol.
“slate colored” is what the orintologists say.
We have had a number of the Juncos this year in north central North Carolina (RTP area).
They are quite common in Central Oregon,
A bird I see frequently– they come is several different types.
There’s some guy with a semi-handlebar mustache and ‘thoughtful’ eyes called Junco with some songs on You Tube, but I haven’t seen him anywhere around here in my northernish vicinity and
don’thardly know what he sounds like. The weather is still cold, though, so maybe he will appear when it warms up a bit more and we’ll hear him singing soon enough.Some Happy Sunday morning news,
RECYCLING IN THE US IS BROKEN
“Recycling in the U.S. is broken. In 1960, Americans generated 2.68 pounds of garbage per day; by 2017, it had grown to an average of 4.51 pounds. And while many Americans dutifully put items into their recycling bins, much of it does not actually end up being recycled. For decades, China handled the recycling of almost half of the world’s discarded materials, because its manufacturing sector was booming and needed these materials to feed it. In 2016, the U.S. exported 16 million tons of plastic, paper and metals to China. In actuality, 30 percent of these mixed recyclables were ultimately contaminated by non-recyclable material, were never recycled, and ended up polluting China’s countryside and oceans. An estimated 1.3 to 1.5 million metric tons of plastic found its way into the ocean off China’s coast each year. Without the Chinese market for plastic — as well as for some types of cardboard, paper, and glass — the U.S. recycling industry was upended.”
https://phys.org/news/2020-03-recycling-broken.html
On that happy note, please note: currently, about 2.01 billion metric tons of municipal solid waste are produced annually worldwide. The World Bank estimates overall waste generation will increase to 3.40 billion metric tons by 2050. Further, an estimated 13.5% of today’s waste is recycled and 5.5% is composted. The report estimates that between one-third and 40% of waste generated worldwide is not managed properly and instead dumped or openly burned. The good news is: future archaeologists (or little green men) will have lots of interesting places to dig.
Continuing my rubbish talk:
SCIENTISTS LONG PUZZLED OVER PLASTIC ‘MISSING’ FROM OUR OCEANS — BUT NOW IT’S BEEN FOUND
“New research suggests ocean plastic is being transported back onshore and pushed permanently onto land away from the water’s edge, where it often becomes trapped in vegetation. This pollution kills and maims wildlife when they mistake it for food or get tangled in it. It can damage fragile marine ecosystems by smothering sensitive reefs and transporting invasive species and is potentially a threat to human health if toxins in plastics make their way through the food chain to humans.” Oh joy!
https://phys.org/news/2020-03-scientists-puzzled-plastic-oceansbut.html
Fords electric Mustang may be a turning point in adoption of electric vehicles (finally).
Judging from reservations, many people are eager for the vehicle as indicated by their willingness to switch brands. I am assuming most of these people have never owned an electric vehicle before.
‘Deliveries of the Ford Mustang Mach-E haven’t begun yet, but in the meantime Ford is releasing smaller tidbits of information—about the people making reservations for the electric crossover, for instance.
Ford claims six out of 10 Mach-E reservation holders are coming from other brands. These customers haven’t purchased a Ford (or Lincoln) in 15 years, according to the automaker.
Known in the industry as “conquest” customers, these converts are highly prized by automakers because they represent growth in market share.’
As the enumerators for the 2020 census are trained and prepared to hit the ground soon, the coronavirus is starting to throw a wrench in the works. With a potential of killing millions in the US, I doubt if most people will want to open doors to strangers. The internet, phone and mailing is the best way, but historically a large portion do not comply. With office and field staff numbering about 500,000, that is a large virus vector system between themselves and the public.
https://www.citylab.com/equity/2020/03/coronavirus-census-bureau-san-francisco-pandemic-planning/607246/
I think this article is very well written (maybe because i am biased). But the financial system has a potential for GFC 2.0 as a result of dumb central bank and government policy, total corporate debt stands at ~ $19 trillion dollars. Which now has potential to dry up liquidity. Which most likely your tax dollars will end up bailing out.
https://edition.cnn.com/2020/03/14/investing/corporate-debt-coronavirus/index.html
I am in complete agreement on this. There is only one way to pay down a debt so big without hurting some segment in a massive way. And that method is to very gradually devalue the currency, so slowly that people don’t revolt, and businesses find themselves unable to service their debt with current earnings. Its like threading a needle. Add to this the problem of energy depletion and aging demographics. Not a good recipe.
Electricity the new oil ?
http://www.terrajoule.us/
Mexico update.
Mexican schools have extended back the start of Easter school holidays to the 20th March. Supermarkets in Guadalajara will be rationing certain products including toilet paper. Pre-Olympics have been cancelled. Some social venues are being closed. 2 cases reported in Guadalajara and cases are expected to surge between the 20th and 30th March.
NAOM
North Rhine Westphalia, Germany’s biggest state by population, is going on more or less complete lockdown starting Monday. Stores, bars, schools, government offices, all sports, restaurants, even bordellos have been shut down by the state government.
last data i have seen- Germany has
802 cases on mar 13th.
4585 cases mar 16th.
Yike, that says a lot for where the USA is going.
NAOM
without doubt
Saw an interview with Kevin Hassett [is an American economist who was the Chairman of the Council of Economic Advisers and former member of Trump economic team] on CNN this hour.
He said 2nd qtr. GDP in the USA will -5% and job growth will be – 1M.
To early to project 3rd qtr.
Buckle up.
Boost your immune system by eating fruits and vegetables. Results of studies.
https://nutritionfacts.org/video/using-the-produce-aisle-to-boost-immune-function/
Boosting antiviral immune function with green tea
https://nutritionfacts.org/video/benefits-of-green-tea-for-boosting-antiviral-immune-function/
“There is NO systemic risk. No one is even talking about that. Governments are intervening in the markets to stabilize them, and the private banking sector is very well-capitalized. It feels more like 9/11 than it does like 2008.”
https://www.zerohedge.com/markets/half-america-will-get-sick-here-what-goldman-told-1500-clients-its-sunday-conference-call
NO systemic risk?? OK Virus is Housekeeping. What about all else? Many Foundations r gone. Never been here before – FED put is done – zero interest rates. The Only Question that matters – systemic risk and what happens when the too big to fails fail?
https://www.investopedia.com/terms/s/systemic-risk.asp
During the first 18 years of the 21st century, global fossil fuel power generation rose by 6700 TWh. Renewable energy (all forms) grew by 4000 TWH. Overall growth was about 10, 600 TWh.
PV now comprises 2.2 percent of total generation in 2018 (as of June 2019) and wind about 4.8 percent.
Global power generation is now about 27,000 TWh.
Interesting scenarios discussed here, that economic activity will fall by 25-50% for 2-3 months.
https://oilprice.com/Energy/Energy-General/Is-10-Oil-On-The-Horizon.html
And don’t look at your 401k today.
Well, this is a bit different from a certain country to our north
“Puerto Vallarta already applies preventive measures to take care of the health of its inhabitants and visitors who come to this city, which were announced at the extraordinary session of the Municipal Health Council, which was chaired this weekend by Mayor Arturo Dávalos Peña, in which public, private and business institutions, join forces in a responsible way to take care of the community and make it participate in these actions that are merely preventive. The municipal president stated that in Puerto Vallarta there is no positive or possible case of COVID-19 For this reason, it is a good time to adopt preventive and hygienic actions, in order to avoid the presence of this and other diseases in the future. problem in the municipality; clarify that they are preventive actions knowing that in Puerto Vallarta there is no case, but we have to be responsible and start working on them with the population, “he said. He noted that in addition to the measures that have already been issued at the state level and the installation of filters by the health authorities at the airport, maritime terminal and trucking center, health institutions such as the IMSS already have established protocols, and the hotel sector, through the Association of Hotels and Motels, has maintained 15 days the disinfection of specific areas inside their establishments, as well as internal training for staff and the dissemination of preventive information to their guests, among others, which are already being replicated in other shops such as restaurants. He stressed that the municipality is also doing his homework, sharing the acc preventive ions that everyone can carry from home, such as constant hand washing, avoiding touching your face or covering your forearm in the event of a sneeze, through a media campaign; while in all the offices there will be antibacterial gel with 70 percent alcohol, recommended in these cases, as well as soap in the toilets for hand hygiene and other measures that will be carried out by the servers Also preventively, the first mayor said, the massive events contemplated on the following dates will be canceled, of which many will be rescheduled for later as is the case of the traditional celebration of Children’s Day and the Puerto Vallarta Marathon. He clarified that the event that the musical event that was scheduled this weekend, was allowed to take place to avoid a social problem due to the haste of its cancellation; however, for the moment, they will no longer be allowed.Arturo Dávalos asked the people of Vallarta to be attentive only to the official information of the Ministry of Health, the State Government and the Municipal Government, since they have generated content that is not truthful, misinformed and they create confusion among citizens, and reiterated that all the actions implemented are preventive to avoid possible risks and take care of the health of citizens and tourists. Likewise, strategies will be being seen so that the economic activity of the port is not affected and promote everything that is being done in Vallarta, to be a safe tourist destination in terms of health and to prevent someone with possible symptoms from entering the destination. All the members of the Municipal Health Council agreed that it is at the time ideal to take care of the health of Puerto Vallarta and prevent any possible contingency that could be derived from the presence of this disease in the world. They assured that work will continue and that actions will be followed up on time. FROM THIS TUESDAY CLASSES ARE SUSPENDED On the other hand, the municipal president Arturo Dávalos, announced that following the instructions released this Sunday by Governor Enrique Alfaro Ramírez, from this Tuesday, March 17, classes are suspended at all educational levels in the municipality, and he invited to be attentive to official information and consider all the preventive measures that have been shared in the different media.”
Also (in Spanish)
http://impreso.meridiano.mx/edicion/vallarta/2020/03/16/politica/publicidad/8.pdf
Cruises have been stopped and one was aborted, here, with the passengers flown home.
NAOM
Wow-
My old pueblo natal.
(I think I got that right)
If you make it through, an interesting thing to look back on will be the atmospheric CO2 measures from Mauna Loa a couple years from now. Will this moment in history be a blip on the rising stepladder chart?
Taking wagers at booth # 9 against the far wall. Please maintain appropriate social distancing while in line.
Steep emissions plunge puts Germany’s original 2020 climate target back in sight
Islandboy, as you seem so desperate to report any glimmer of positive news on GWGs I’m surprised you haven’t mentioned coronavirus and its “fantastic help” in reducing all those nasty gasses getting into the atmosphere. 😉
Actually I was pondering whether or not “clearer skies” might increase solar PV output by a noticeable amount. In another couple of months the data should be in and we should have some indications one way or another. Since there is no shortage of gloom, I choose to highlight stuff that is more positive but, you know that already! 😉
A more transparent atmosphere warms vast regions of the ocean and land even faster, as they are low in albedo. Warm water holds less gases and warm land/swamps release more gases. Whether the amounts gained and avoided are near equal or not is unknown. Point source reduction versus vast planetary areas.
I read a few days back that renewables were responsible for close to 2/3rd of all electricity in Germany for the whole month of February. This is before the COVID outbreak. Also EU has moved to the new emission regulation this year and the plug in vehicle share is starting on the steep part of S curve in most major markets. All combined, the emissions should be much less than negative 40% (from 1990) target for 2020. It may rebound a bit in 2021 but let’s wait and see.
This just in:
Solar Accounts for 40% of U.S. Electric Generating Capacity Additions in 2019, Adds 13.3 GW
Then divide by 5 to get production additions.
Yeah, and divide gas by two. The highest capacity factor among new sources is probably wind.
The reason capacity is so interesting for solar is that when the sun is shining rates are high, and solar shuts down traditional power plants. That ruins their profit, because nighttime electricity is a loss leader.
Like most industries in capitalist countries, power plants exist because they make a profit. Take away their profit, and they just disappear.
A good example of this is the American shopping mall. Malls are getting killed because of online shopping. About a third of the shopping malls ever built in America are now dead. But online shopping is only about 10% of the market. what’s killing the malls? Not a lack of sales. It’s a lack of profit that shuts them down.
The same thing is happening to power plants. They are just getting crushed. What happens then? We’ll have to wait and see I guess.
Coal, natural gas and nuclear can run as baseload systems, meaning on most of the time. That must be throttled back during low demand periods such as in winter in the north and brought on during high demand periods such as hot days and nights in the summer.
So what can you do to turn the wind up during a hot summer afternoon? Or how do you turn up solar PV during a cloudy hot humid late afternoon and night when the aircons are all running full out? Only by having a lot of excess unused capacity which is shut down most of the ime and/or by having a lot of excess expensive storage systems can be used short and long term (winter away from the equator). Storage is now 5 to 10 times too expensive to even think about 100 percent solar and wind.
In other words, just meeting an average demand level is not enough. One has to deal with the realities of current societal demand and the seasonal demands.
Not sure why you do not understand economic cycles and the overbuilding of retail outlets which causes a cyclical closing and building of retail.
But right now we have a grand experiment going on where demand destruction for many things (something I have advocated for a long time) is being forced upon societies. Let’s see how that turns out.
The time will soon be ripe for “cold storage” air conditioning and refrigeration. I have investigated putting together a system that makes ice during the day and uses the ice to cool the conditioned space well into the night. It would cost somewhere in the region of 4 to 5x the cost if on off the shelf split system ac. If the big names in air conditioning were to develop something and manufacture it at scale, I’m sure costs could come down. This technology would be useful in the southern US where heating needs are modest and summers are long and hot.Think the desert southwest, Florida and the Gulf Coast. Not to mention Australia, North Africa, the middle east and India. The market potential looks massive to me.
Atlanta had a population of 25,000 pre air con.
It probably will again.
Atlanta used to be wilderness.
Good DIY project.
Further north we can just tap the ground temperature for heating and cooling assistance. Also mass storage, both passive and active.
Yes, a massive redesign and rebuild of all infrastructure with integrated design is needed to make renewables work without upping the cost by several times. The extra cost will be in building new or refitting old structures to be as efficient as possible and use passive solar/mass storage as much as possible.
That cost is never added to the calculations. Even so, several major studies show storage systems, such as batteries, need to fall in price by a factor of 5 or more.
If we allow economics to determine the transition, it will happen slowly, haphazardly and will produce much greater inequality within the population. Most likely it will never be completed, leaving much of the populace in a severe bind.
it seems as if the US government and others can freely print money as they want just to keep the status quo. Yet they are very stingy when it comes to making “progress” and planning for the future.
Good news. Solar should breach 3% easily for the whole year.
Three percent of what and for where?
There was some debate on how long the covid virus could survive on surfaces. This BBC article gives some information on that.
https://www.bbc.com/future/article/20200317-covid-19-how-long-does-the-coronavirus-last-on-surfaces
NAOM
Clean your phones.
Good info NAOM, thanks.
Stay away from cough zones-
“that the virus could survive in droplets for up to three hours after being coughed out into the air. Fine droplets between 1-5 micrometres in size – about 30 times small than the width of a human hair – can remain airborne for several hours in still air.”
This is where it is curious as to why masks are not stockpiled in anticipation of epidemics and pandemics and wearing them made mandatory at a reasonable point in the path from case to cluster to boom. The mandatory part would decrease or eliminate the social stigma problem, and help with the asymptomatic carrier problem.
It’s also a lot easier to remember not to touch your face (and harder to do) if you have a mask on. And what the hell, require swim goggles too. Why not?
Good article. I think the human skin is an effective killer of viruses.
Also one can use UVC lamps to disinfect surfaces.
” I think the human skin is an effective killer of viruses.”
I wouldn’t rely on it, the answer to ‘how long the virus may survive’ is ‘long enough to contaminate’. That is too long. On searching, there is some indication that the skin bacteria may kill off viruses but that takes time and will vary by virus/bacterias and that is enough to spread it. Worry about money, instead.
Some general information here.
https://health.mcleancountyil.gov/723/COVID-19-Myth-Busters
Oh, while UVC is effective think about the illumination of the surfaces and the time of exposure. For a large area, such as a kitchen, you are going to need one big lamp.
NAOM
As per the CDC website, as of mid day 3/17, the USA has not yet achieved any day of virus testing over 3000/d
[including both public and private sector testing].
Only 4 days have exceeded 2000 tests/d.
Its a gross failure of the culture.
Russia has tested 5 times more people than USA.
Case, Case, Cluster, Cluster, Boom!
Well the pandemic seems to be good news for pangolins anyway.
https://www.news24.com/Africa/News/pangolin-sales-plunge-in-gabon-over-coronavirus-fears-20200316
With all the environmental benefits of this human and economic catastrophe accruing rapidly (clean air, clear canals, exploding pangolin population etc) it will be interesting to see how the ‘recovery’ – the ‘return to business as usual’ – will pan out. Will some places try and lock in the improved environmental conditions, or will it all just go to hell in a handbasket in the rush to start making a profit again?
Some governments are considering raising fuel taxes, or reducing fuel subsidies during this period of low oil prices, when people won’t notice so much the increase of prices at the pump.
Contact your local representatives, and tell them you support this idea.
Thanks for mentioning this. I will tell my classic car buddies to write to OPPOSE such highway robbery bullshit.
Do you agree that oil creates some pollution; that we’ve had many military casualties fighting oil wars; and that we’ve suffered some recessions due to oil shocks?
How much is a child’s asthma (from diesel particulates)worth? How much is a soldier’s death worth? $1M? $3M? $10M? How much is a leg worth? How about PTSD? How about PTSD that makes a veteran homeless? How many trillions have we spent on oil wars, just for pay and equipment? How many trillions have we lost in oil recessions?
Doesn’t it make sense for consumers to pay the hidden costs of their oil consumption?
Do you believe in decentralized free markets? Do you believe in taking responsibility for what you do, and paying your own way, and that’s there’s no free lunch?
“Doesn’t it make sense for consumers to pay the hidden costs of their oil consumption?”
No. It makes sense to not use it at all for transport, but society has not provided a means to do that except for a very few rich people, subsidized by the poor working people.
What is wrong with the government just mandating higher mpg levels with a final cutoff year for ICE production at a future date. Just taxing everyone does a partial job and hits the lower income people hardest. That is most of the people. Also taxes have a habit of being used for other purposes and being misused.
High cost of fuel alone will never get rid of ICE.
Government is there to accomplish things the individual cannot. ICE can be mandated away and car companies that do not want to change can just vanish. There are always those willing to fill the niche.
How is the Uber and Lyft idea working out during the C-virus lockdown? I bet people are just loving public and mass transport right now.
“How is the Uber and Lyft idea working out during the C-virus lockdown? I bet people are just loving public and mass transport right now.”
L.O.L. For that matter, how about cruise ships and airplanes? Big petri dishes! 😉
Doctors are vanishing, offices closing around here. Wonder what it will be like in two weeks. 8 people per day dying of
C_virus nationwide. I bet that the loss of jobs and income will kill more people of all ages than the Virus. Plus people that cant afford medicine, doctors or good food will be far more susceptible to all disease and suicide (more than 100 per day). Death by lockdown and economic lockout. Could be the largest effect as this continues. That plus failed business and lost homes, lost cars. Lost lives in a country that has no safety net.
I think an effective strategy will include both regulations and market solutions.
I think CAFE regulations have been enormously beneficial, and could be increased to get vehicles to where they need to be, as you describe. But…that won’t reduce fuel consumption by existing vehicles – in fact, there would be a risk that they’d be kept for a very long time. Existing vehicles have a very long life, and are thrown away long before they wear out – but if they can’t be replaced they could stay in use almost forever.
A dramatic increase in fuel prices would dramatically reduce fuel consumption by existing vehicles, and incentivize people to get rid of them completely. European fuel prices are much higher than most of the world (though I don’t think they’re high enough) and European light vehicles only use 18% as much fuel per capita as do those in the US.
EU uses about 300 million tonnes of diesel per year. Has not fallen since 2007. They use 80 million tonnes per year of gasoline, which reduced from 100 million in 2007. No big drop.
Compare that to the 387 million tonnes of gasoline used by the US (2019) . 95 million tonnes of diesel used. 482 million is not that far from 380 million tonnes. Rather inefficient method of reduction apparently. Why not just go electric and renewable energy, instead of whining about a few old cars that would probably not even be used or could easily be mandated out of the system.
Not a huge difference even though the price is much higher, so not an efficient method.
Overall, only a small decrease in petroleum products from 2007 to 2018. Price does not reduce use much nor did all that efficiency.
Also member nations get a lot of tax revenue from fuels, about 7 percent on average of their tax income. So who pays the tax gap as the fuels are replaced? Somebody will. Maybe it will stop being a poor tax.
The only people that use less fuel because of price are ones that can barely meet their monthly needs. They also usually buy the most efficient cars, while all the rest get whatever they want and burn as much as they want.
The top 10 percent in the world make 50% of the emissions. Price is not a point with them.
Yes, overall per capita fuel consumption in the EU is not that different from the US.
But, light vehicle fuel consumption in the EU is much lower than the US: about 40% fewer vehicles per capita, about 40% less VMT per vehicle, about 40% less fuel per km per vehicle: the net difference is that EU per capita light vehicle fuel consumption is about 18% of the US.
What you’re seeing is diesel consumption from the industrial commercial side: a big part of that is truck transportation as EU rail is balkanized and oriented towards passengers.
Nick wrote”about 40% fewer vehicles per capita, about 40% less VMT per vehicle, about 40% less fuel per km per vehicle: the net difference is that EU per capita light vehicle fuel consumption is about 18% of the US.”
Nick, not sure I understand your calculations. vehicles/capita X miles X fuel/ mile = fuel/capita as the scalar. So 0.4 X 0.4 X 0.4 =0.064 fuel/capita Euro vs. 1.0 for US , Which is much less than your stated 0.18.
Actually a lot of light vehicles use diesel and as far as emissions go, it does not matter what is burning the oil product. Just different forms of transport which is irrelevant to the problem. Choosing a narrow niche is inappropriate to the required measure.
GF,
A 40% reduction means the same as 60% of the base. So, it means 60% x 60% x 60% (or .6 cubed). This is equal to 21.6%. That tells you that some of the reductions were a bit higher than 40%, but it’s in the ball park = the cube root of 18% is .565, or an average reduction of 43.5%).
So…why is it useful to “analyze” (meaning to break the problem down into smaller parts)? Because it tell you something about the dynamics of the situation. In Europe, gasoline taxes are higher than diesel taxes, so surprise, surprise: diesel sales have become much higher over a reasonably long time.
Thanks Nick, for clearing that up. So basically the taxes reducec the private yee of fuel but shifted the use elsewhere, causing only a small drop in overall consumption. Looks good on paper, punishes the poor, does little to solve the problem.
The average EU citizen uses 18% as much fuel as the average US citizen for personal driving. In other words, the average US citizen uses 5x as much fuel as the average EU citizen! That’s dramatic, and is largely due to high fuel taxes. The fact that EU industry wastes fuel is a separate and independent problem, due in part to bad planning, due in part to regulatory capture by business.
Now, we also see a shift from gasoline to diesel, due to diesel taxes not being as high as gasoline taxes, which in turn is due to car industry political pull. Which tells us that taxes, just like other kinds of regulations, need to be monitored carefully for unintended consequences. Although, to be fair, these consequences were desired by the car companies, just not by anyone who cares about good public policy.
It’s worth mentioning that the idea that fuel taxes hurt the poor is unrealistic, and unfortunately is an oil industry meme/talking point. In fact the poorest quintile (the lowest 20% by income) use far less fuel: they tend to use mass transit. It’s the higher income quintiles, especially the highest, which use the most. Policies which keep fuel prices low are subsidizing the wealthy.
I know a lot of people who are into classic cars. I dabble a little that way myself.
No more than two or three out of all I know drive their old cars or trucks on a regular basis, and virtually all of them have a fairly new car or truck, or two or three modern ones.
Every last one of them can easily afford another five bucks or so to fill up their collectible car once every month or so, or more likely, once every couple or three months.
We really need to get the money coming in to work on the roads, not that I’m in favor of MORE traffic, but I’m in favor of straighter roads with better pavement, safer intersections, better synchronized lights, and cars and trucks that burn less gas.
Higher fuel costs NOW paradoxically mean we are ALL better off, long term, because we will have less need for oil, due to buying cars and trucks that use less fuel.
I wonder, if 2 weeks ago the US Government ordered the closure of all stadia, restaurants, bars, theatres, schools, etc. Would Americans actually have obeyed that order. Even though only a handful of people had died at that time.
Good question. Not completely without bitching and moaning.
It take big balls to lead.
Also, this president has cultivated such poor level of respect over the coarse of his term.
It was just a week ago that he said he had a hunch this ‘chinese virus’ wasn’t going to amount to much.
He has surrounded himself with yes men for decades.
He has ignored scientists for his adult life.
So, much of the country does not have any trust for the man, to handle serious problems or make appropriate decisions. He has failed to cultivate a sense of trust or respect. Most see him as a buffoon. His instincts are extremely poor, for an adult. Not so bad for a poorly trained child.
This countries federal government is still about 2 weeks behind where it should have been for the last 4 weeks.
Lesson- when you see a country rushing to build a huge hospital in 3 days to deal with a respiratory illness, you better wake up and react. With vigor.
A question being asked in the UK is, if schools close who looks after the children of doctors and nurses.
There are arguments on both sides.
People now told not to go to restaurants and pubs, how do these workers pay their rent and feed themselves
Things do not look good!
Yes, very hard situations for so many.
Its not going to end quickly, and will get much worse for a while.
Its looking more likely that here in the US every citizen or legal resident can expect a $1000 check in the mail on April 6 and another one in May. Hong Kong has already done something similar. Hoping so bad the rest of the world roles out something similar and soon. I’m not a fan of printing endless fiat but “If your house is on fire you don’t ask how much the water will cost” Andrew Yang.
from the other thread-
In 2018, World jet fuel consumption was 7814 kb/d of 83161 kb/d of World C C production, about 9.4% of World C C production was jet fuel consumption. Data from BP Statistical Review of World Energy.
“Let’s say Jet fuel use falls by 75%,”…
____________________________________________________
The good news is that none of this jet fuel consumption is necessary for the full function of a modern and vibrant civilization. The other 25% is far more than enough for any important air transport requirements.
And it would good for the air.
I think every wild species on this planet is loving what covid-19 is doing.
CO2 will almost certainly drop in level now.
I think there is a deep structural issue here financially. And there is potential for a depression or a deep recession with heavy quarter drops. They are using helicopter money to try the save the financial system.
There is also potential for martial law in your country and probably the rest of the world.
In Australia, the worst is yet to come as the weather turns cold and the flu season starts, i think there is potential for things to get really bad here. I hope not but we’ll see.
Winter? For you guys winter is a few frosty nights. For me winter has temperatures dipping to minus 30 C. It’s all relative I suppose! 😉
Haha i know Doug, I don’t know how you guys handle it!
But regarding the flu season it’s been a shocker past 2 years here. Record number of cases, record number of deaths. I even got the influenza B virus last year. Absolutely horrible experience.
IM, just one more poorly understood variable in a cluster of them. The prognosis is not good, especially considering the dramatically different levels of response to levels of severity.
Major economic disruption with about 1 percent mortality.
No significant effort when possibility of 50 to 100 percent mortality from climate change and biodiversity loss.
Hello Debbie Downer ?
GF Are you sure it’s not more like 2% with adequate beds equipment staff and medications? Then we would need to adjust numbers for any shortages of any or all of the above. Hope not; but why not take this seriously until we have a better data?
Farmlad, we have had a half century to study and think about climate change, biodiversity losses, pollution, overpopulation, etc. With no significant response other than to go further into the predicaments. Why not take those things seriously since they may wipe out most life on earth in an irreversible manner?
As far as the virus goes there are probably at least ten times the number of infected people as are reported as cases. Most have shown light or no symptoms and most are not tested. That would bring the death rate well below one percent. Time and lots of testing will tell, but by then it will have spread much further.
Agree IM.
I was watching Bourbon Street New Orleans webcams for a while on Tuesday night. Very bizarre to see the street quiet and almost no people around, especially on a party night like St. Patrick’s Day. A few small–possibly confused–rodents were out enjoying themselves, though. As long as there’s still food around, I wonder how much their numbers will increase with fewer people bothering them.
I’ve also thought about what the pigeons that live in the centers of many big cities might be making of the current situation.
https://nypost.com/2020/03/18/japanese-flu-drug-clearly-effective-in-treating-coronavirus-officials-say/
Medical authorities in China said they tested the antiviral drug favipiravir on 340 patients and found it reduces recovery time and improves lung condition of patients, according to the Guardian.
Takining it seriously here. Getting going at the case, case, case level, not waiting for the boom.
The Governor of the State of Jalisco, Enrique Alfaro Ramírez, announced through his social networks, the total closure of business lines such as casinos, nightclubs, party halls and events, clubs, bars, canteens or similar, the suspension of public transport . “Initially, the decision has been made, based on WHO criteria and in coordination with municipalities, to temporarily close party halls, casinos, clubs, canteens, nightclubs and bars,” said the President. turns of cinemas, restaurants and gyms, it is instructed to reinforce cleaning measures, as well as to decrease the influx of people: in the case of cinemas of up to 50% and 25% in restaurants, in addition to seeking social distancing between one and two meters per p ersona.The establishments will receive each procedure and requirement letter by letter and the 125 state councils and the Commission for the Protection against Sanitary Risks of Jalisco will be in charge of supervising compliance with this measure, which in case of not abiding by it, the consequence will be the Total closure. “This decision has not been easy, but what seems exaggerated today will be insufficient tomorrow. In Jalisco we are prepared to prevent a massive spread of COVID-19, but if you stay at home we are already on the other side. If we join him as a team, we will prevent a health alert and we will be able to move forward, “he concluded. In addition, also via social networks, the president ordered through the Ministry of Mobility the suspension of service of any unit of public transport from this Friday, March 20. “SEMOV” urges all operators not to use the units during the announced period. Failure to comply with the order, motorcycle patrol and ground foot operating personnel will reinforce surveillance in the areas surrounding the fixed cameras to warn offenders, “warns the brief statement. The population is reminded of the suspicion of having the disease or symptoms related to it, before thinking about going to a hospital, staying home and dialing 33 3823 3220. More information about COVID-19: https: //coronavirus.jalisco.gob.mx/
NAOM
New post up by George Kaplan
http://peakoilbarrel.com/us-gom-2019-summary-part-i-exploration-drilling-and-discoveries/
also new Open Thread Non Petroleum
http://peakoilbarrel.com/open-thread-non-petroleum-march-19-2020/
Jan EIA report is out. Coal again had a disastrous month. Down 35% year on year.
The absolute amount – 65TWH is the second lowest generation only above April 2019 (60TWH).
It’s had the lowest share of total generation (19%) ever, well below the 20% share it had last april.
Coal started 2019 at 28% and ended the year at 23%. That was a non pandemic year. In 2020, it has started at 19% and will be lucky to generate 15% of the total.
Meanwhile, natural gas generation is up 10% rising much slower than the rate of fall in coal (-35%). Nuclear and hydro are essentially flat while solar is up 23% and wind is up 13%.
I will let Island Boy to come up with the rest of the stats.
This year is going to be wildly exciting and interesting!! I am particularly interested in what is going to happen in April and May as that’s when coal demand falls to its lowest. Couple it with the effect of COVID, it’s going to be super exciting.
Honestly, I guess such posts should be printed more and more
because of the present situation and modern demands of the Millenials.
I read them to find some new information that will correspond to my demands,
such info I found on https://kleighwinters.com/students-with-stories-schulich-scholar-jivetesh-singh-chhatwal/. Each of us
has a proper comprehension of the information supplied to
the general public, so I truly liked the article
and expected you to provide us with more things like this one.