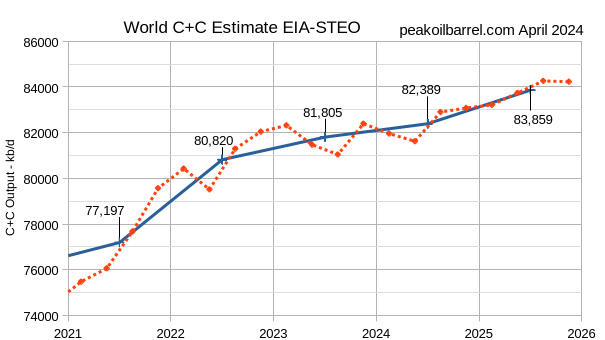
The EIA STEO was published recently the estimate below is based on data from that report and statistics from the EIA International Energy Statistics. The EIA expects the 2018 peak for annual average World C+C output will be surpassed in 2025.
The EIA STEO was published recently the estimate below is based on data from that report and statistics from the EIA International Energy Statistics. The EIA expects the 2018 peak for annual average World C+C output will be surpassed in 2025.
By Ovi
The focus of this post is World oil production along with a more detailed look at the top 11 Non-OPEC oil producing countries.
Below are a number of Crude plus Condensate (C + C) production charts, usually shortened to “oil”, for oil producing countries. The charts are created from data provided by the EIA’s International Energy Statistics and are updated to December 2023. This is the latest and most detailed/complete World Oil production information available. Information from other sources such as OPEC, the STEO and country specific sites such as Brazil, Norway and China is used to provide a short term outlook.
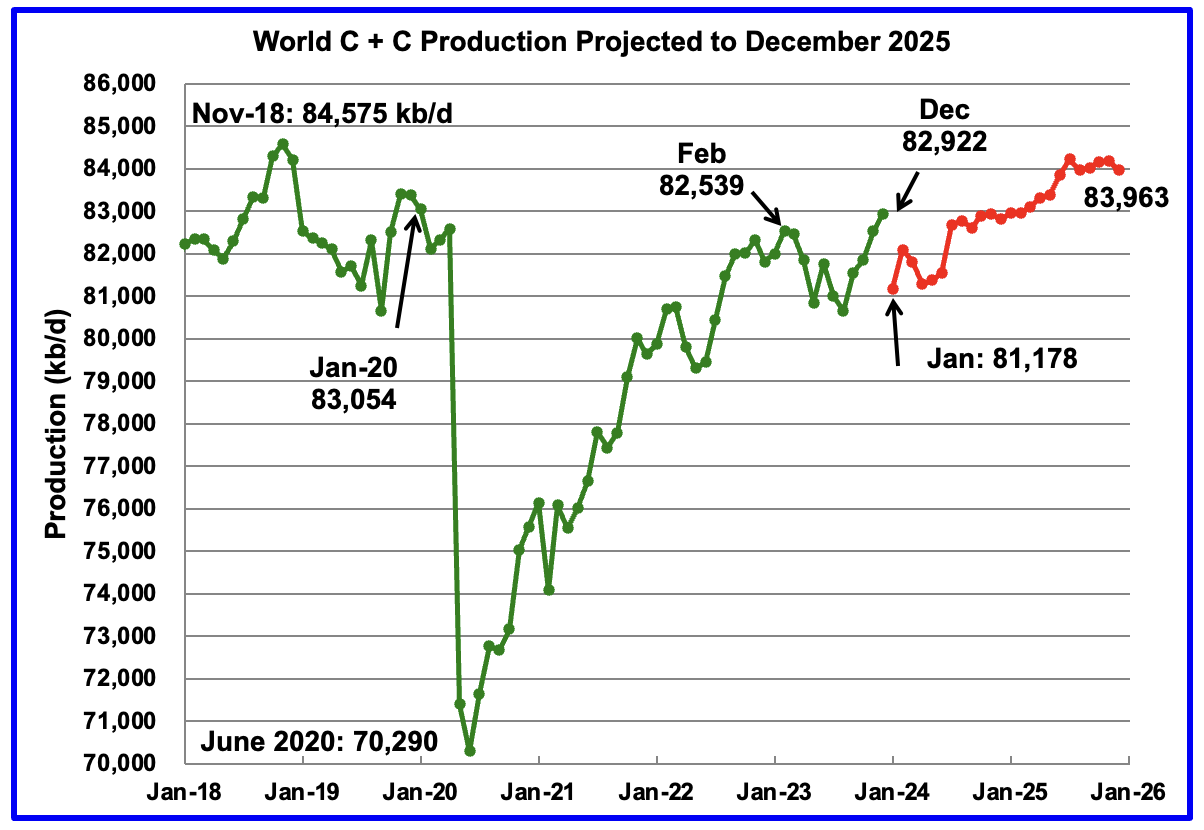
World oil production increased by 400 kb/d in December, green graph, to a post pandemic high. The largest increase came from Guyana, 175 kb/d. January World oil production is projected to drop by 1,744 kb/d to 81,178 kb/d. The large production drop is due to the STEO’s January estimated drop of 2,160 kb/d for all liquids. Of the 2,160, US accounts for 1,500 kb/d while Canada drops 130 kb/d and Brazil drops 280 kb/d.
Read MoreBy Ovi
All of the Crude plus Condensate (C + C) production data for the US state charts comes from the EIAʼs Petroleum Supply monthly PSM which provides updated information up to December 2023.
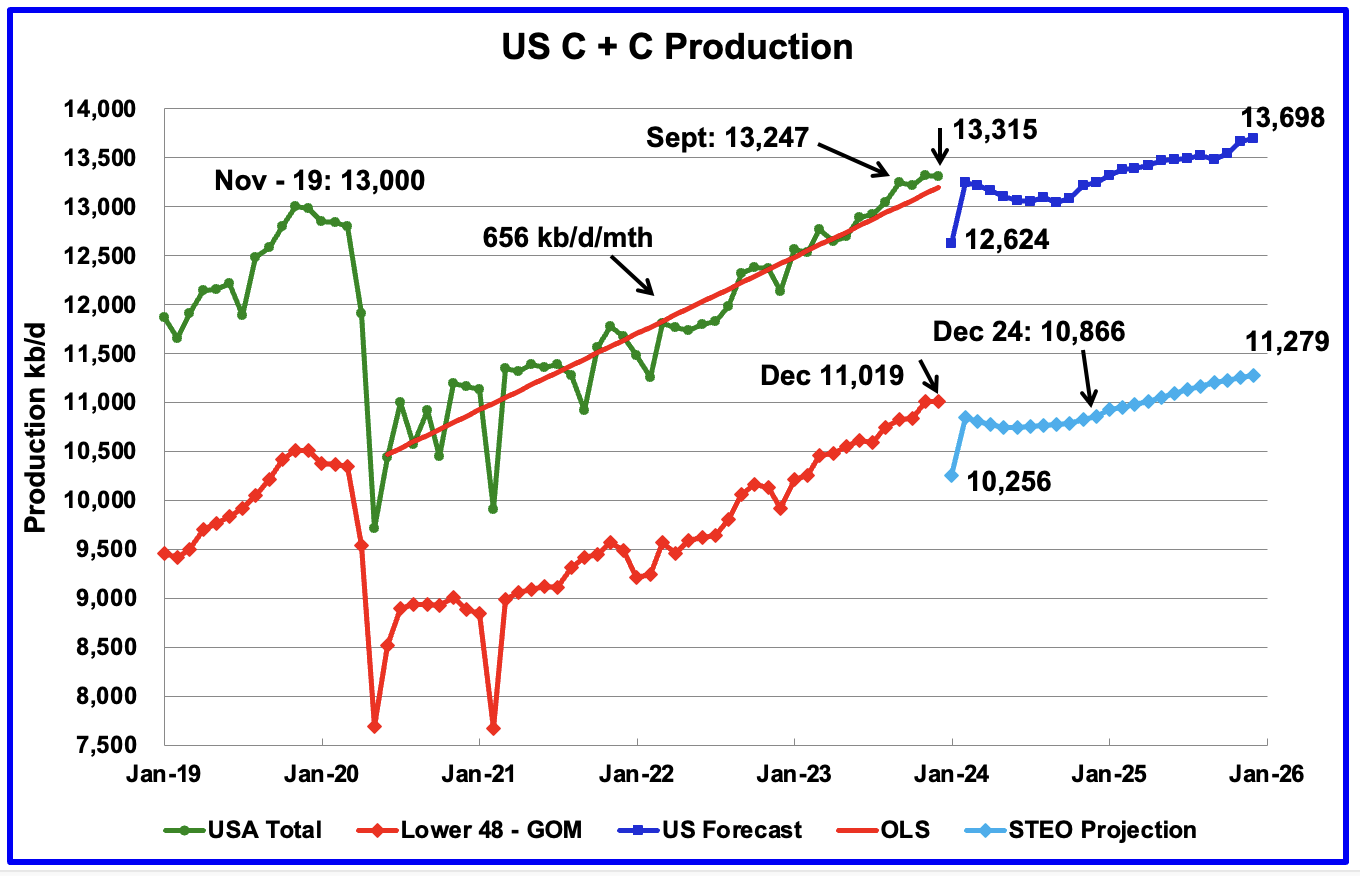
U.S. December oil production decreased by 4 kb/d to 13,315 kb/d. The small decrease was a mix of increases and decreases that netted out to a negligible decrease. The largest decrease came from Texas, 20 kb/d, offset by a New Mexico increase of 23 kb/d.
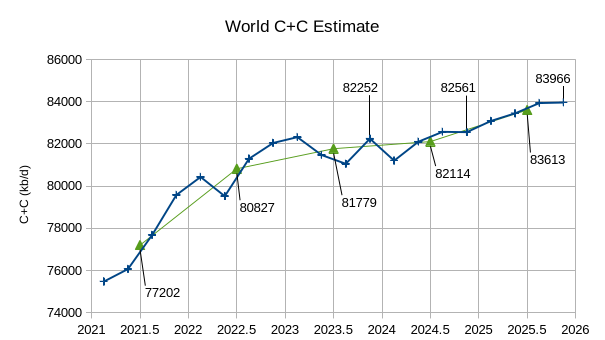
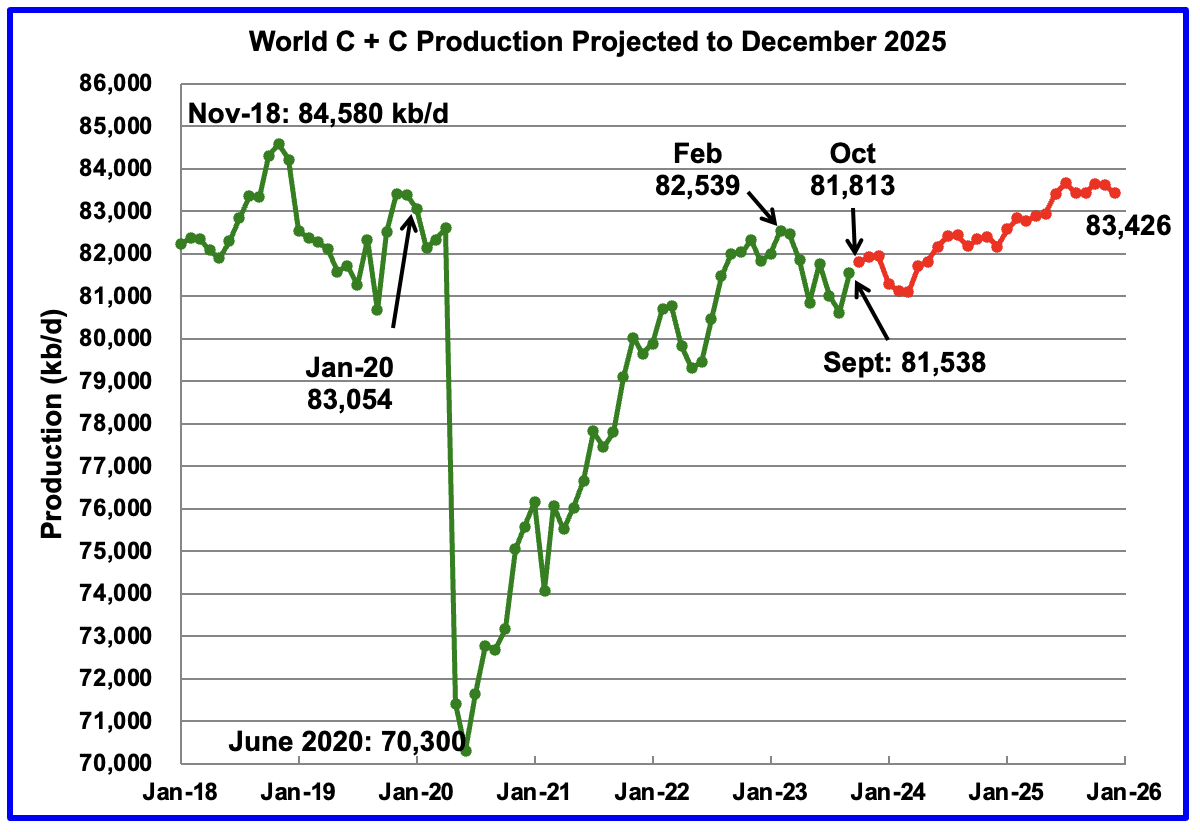
Read MoreThe EIA’s Short Term Energy Outlook (STEO) was published in early February. The chart below estimates World C+C by using the STEO forecast combined with past data from the EIA on World Output.
By Ovi
Below are a number of Crude plus Condensate (C + C) production charts, usually shortened to “oil”, for oil producing countries. The charts are created from data provided by the EIA’s International Energy Statistics and are updated to September 2023. This is the latest and most detailed/complete World Oil production information available. Information from other sources such as OPEC, the STEO and country specific sites such as Russia, Brazil, Norway and China is used to provide a short term outlook for future output and direction for a few of these countries and the World.
World oil production increased by 927 kb/d in September, green graph. The largest increase came from Saudi Arabia 500 kb/d while the US added 224 kb/d and Brazil 210 kb/d.
Read More