The EIA’s Short Term Energy Outlook (STEO) was published in early February. The chart below estimates World C+C by using the STEO forecast combined with past data from the EIA on World Output.
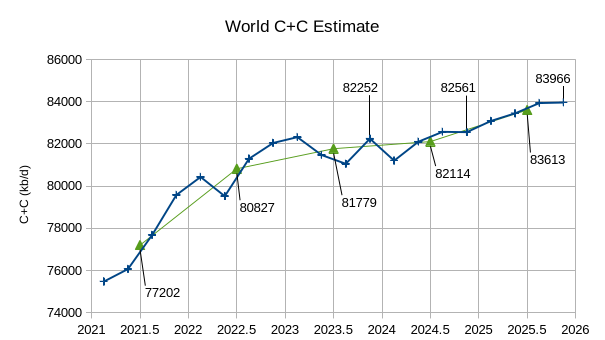
The World C + C estimate by the EIA has increased in the most recent STEO, especially for 2025 where average annual C+C output rises to 83613 kb/d, about 600 kb/d more than the centered 12 month average peak in August 2018 (83009 kb/d). Output increases by a relatively small amount in 2024 (335 kb/d for change in annual average output) and by a much larger 1499 kb/d from 2024 to 2025.
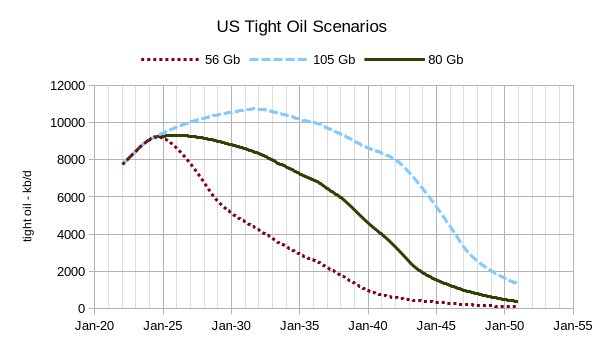
The scenarios above correspond roughly to the F95, mean, and F5 USGS assessments for US tight oil. Only the Permian Basin scenarios were modified the US tight oil minus Permian tight oil scenario is the same for all three scenarios. If the rest of US tight oil was modified to create a low and high scenario the URR would be reduced to 49 Gb for the low (56 Gb) scenario and increased to about 115 Gb for the high (105 Gb) scenario. The medium (80 Gb) scenario is my best guess for medium tight oil scenario, though any scenario between 49 Gb and 115 Gb is pausible depending on technology and price assumptions and assumptions about the level of technically recoverable resources. Note that about 27 Gb of tight oil has already been extracted and likely 40 Gb could be recovered with no new wells drilled (about 13 Gb of additional oil from wells that have already started development). The low scenario peaks in about 6 months at 9.2 Mb/d, the medium scenario in about 2 years at 9.3 Mb/d and the high scenario in 2031 at 10.7 Mb/d.
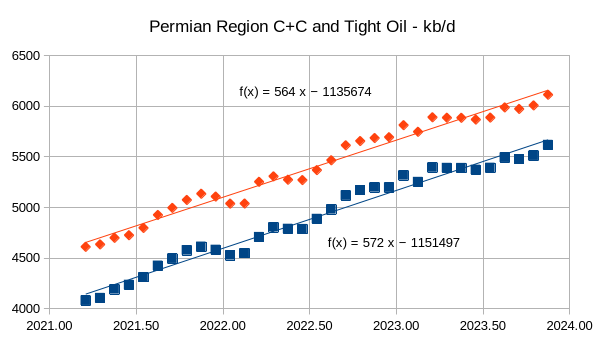
The chart above uses State data from Texas and New Mexico for the Permian region counties (upper line red diamonds) and also uses Novi labs, EIA, and State data to estimate Permian tight oil output (blue squares), the trend from March 2021 to November 2023 is nearly the same suggesting that conventional oil outut in the Permian basin has been nearly constant over this period at about 500 kb/d.
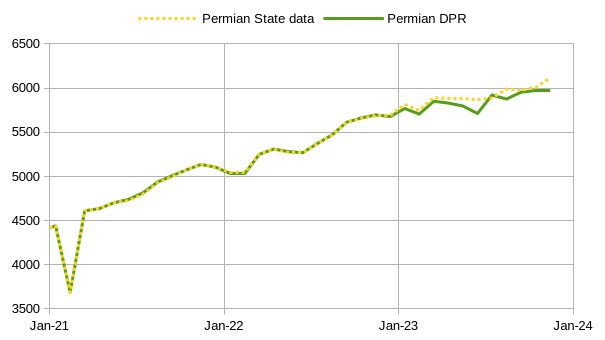
The chart above compares the Permian Region State Data with the Drilling Productivity Report estimate for the Permian region, the match is very good through the end of 2022.
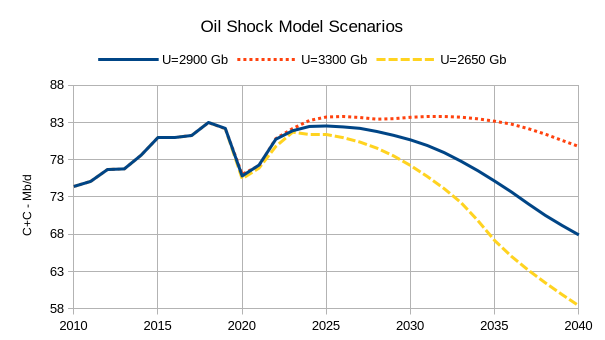
The chart above has three different Oil Shock Models. The high model with URR=3300 Gb assumes higher oil prices and a slow transition away from oil use for land transport which leads to higher unconventional oil output (tight oil and extra heavy oil), the medium model has similar levels of conventional output as my recent best guess models, and the low model assumes a lower level of conventional recoverable resources (2500 Gb rather than the usual assumption of 2800 Gb). My guess is that the probability that World C+C output falls between the low and high scenario is roughly 80% with about a 10% probability that the output path will be above the high scenario or below the low scenario. The middle scenario represents my best guess with an equal probability the output path will be above or below that scenario.
209 responses to “Short Term Energy Outlook and Tight Oil Update, February 2024”
Thanks, Dennis!
This is fascinating. Even your “high model” seems to peak and plateau at 2025. This means that all of the demand growth for mobility energy will be met by non-oil energy sources from 2025 on. That’s still a very aggressive oil transition timetable.
kdmitrov,
In order to save time, I did not use my high TRR model for conventional resources, this probably was a mistake, probably the F95 URR is about 2600 Gb and the F5 case would have a URR of about 3500 Gb.
The chart below adjusts both the 2650 Gb scenario to reflect the low tight oil scenario in the post and increases the Conventional oil URR to 3100 Gb for the 3500 Gb URR scenario (from 2800 Gb in the chart in the original post for the U=3300 Gb scenario) . The peak for the low and medium scenarios is 2018 at 83 Mb/d and for the U=3500 Gb scenario the peak is 86 Mb/d in 2035. My expectation is that World C plus C demand will never rise to this level, but there is a high probability (virtually certain) that my best guess scenarios will be incorrect.
Thank you Dennis for your work. As we are approaching (or crossing) the peak, it’s natural that different positions close in towards the only one that counts: the truth. It’s always inspiring to read this community where people still manage the art of dissent.
KDIMITROV: “That’s still a very aggressive oil transition timetable.“
The word aggressive preoccupies me. It might not be so much the resources in the ground, but the human ability to collaborate peacefully that is going to peak. I hope we will get through this turning point in human history as smoothly as possible.
People might even be forced to take public transportation!
Or carpool…the horror!!
Or work from home…
Dennis
The graphs match well with this article.
https://www.sciencedirect.com/science/article/abs/pii/S0306261921011673
Our net energy peak is already behind us.
from the article-
“We determine the energy necessary for the production of oil liquids (including direct and indirect energy costs) to represent today 15.5% of the energy production of oil liquids, and growing at an exponential rate: by 2050, a proportion equivalent to half of the gross energy output will be engulfed in its own production.”
These EROI arguments are often way too silly…
So what if it takes 15% now of the energy in a bbl to produce it, if the energy is coming from gas for example? 0.15 BOE of gas is only 0.9 mcf, costs $1.50… Who cares? Oh, it’s gonna go to 50%? Well, it’s 3 mcf, or $5.50…
It’s not about the energy inputs, it’s the required complexity, infrastructure, technological know-how that make non-conventional liquids harder to extract and process.
(BTW, making humans is super inefficient in terms BROI, biomass return on investment …)
Kdmitrov,
I agree the argument is silly if we look at only one energy product, but if we look at the EROEI for all energy products that society uses and also look at energy input required for all non-energy producing endeavors by society then it is definitely important in my view. The money doesn’t really matter it is the thermodynamic requirement of energy services that is the point. It matters a great deal, though the research is lacking.
“These EROI arguments are often way too silly…”
Sure, what matters is where the ‘rubber meets the road’ so to speak-
its the price of the energy product that matters.
Harder to produce oil gets more expensive (all other relevant factors held steady).
Energy return on cash invested seems easy enough to figure out. Energy return on energy invested is rather vague and ambiguous; can’t figure it out; must be silly. I would advise against dismissing it, in these waning days of Babylon.
oil is such a premium “energy product”, why would anyone care how much gas or coal or wind or whatever it takes to extract it?
But if by 2050 you’re having to use half the reserve to get the other half then that’s a completely different kettle of fish (i.e. the reserves are really only half as much as you think). And the speed with which this is rising is probably making development and exploration decisions increasingly difficult with risk aversion having a big say.
Kdimitrov,
Simply, the more energy it takes to produce the product the more expensive it becomes.
At some point that higher price will become unaffordable for many people/many uses.
JT,
Thanks, great paper. Chart from page 10 of 23 for pre-print below.
Thanks Dennis
What I see is even a best case production scenario we never get past the 2018 net energy peak. Meaning we’re now working with less or a lot less depending on how things go.
JT
Probably correct, but note that what is more important is EROEI for all types of energy used by society. Kdimitrov makes a good point that oil is a premium source of energy and like electricity people will pay a premium for its convenience. In this regard the EROEI analyses do seem silly.
We need to focus on all types of energy and the EROEI for energy use in general by society.
You are assuming people can afford to pay a premium for the hydrocarbons. But what if they can’t?
Perhaps they can’t afford to commute to their job. Perhaps they can’t even afford to buy food. Perhaps there is no job to commute to, nor food to buy.
It could happen.
Pasander,
I think the point that Kdimitrov makes is likely correct, oil prices have been much higher in the 2011 to 2014 period than they are today, in 2023 $ the equivalent price for Brent in 2011 would be about $140/bo. The World economy grew at about 3% per year in real terms over this period.
Pasander. It looks to me like we will have a situation where
billions of people will have the purchasing wherewithal to pay a premium for oil,
while at the same time there are/will be billions of people who simply cannot. Increasingly so.
It has always been this way…those who have had plentiful food and/or energy while others have had little, or simply not enough to even live.
The number of people in the world who a this very moment are flying at 36,000 ft on non-essential excursion while there are starving people below looking up at the contrail, is as high as ever. ‘Airlines are projected to carry 4.7 billion passengers in 2024’.
Will the post-peak era see more or less equality in the ability to purchase fuel, or its derived products and services?
Which trade block will your country be excluded from?
That article/analysis is very interesting:
For every barrel of oil that we sacrifice to the ever bountiful oil/energy gods, they currently bless us with 3.5 barrels to do what we will (move things/people/food/planes/boats etc).
On the other hand, by ~2037 that same sacrificial barrel will become cursed and instead of 3.5 barrels, will only get 2 in return, still not terrible.
However by 2050, for every sacrificial barrel, only 9/10s of a barrel will appear, there will be no net oil/energy gained…
Realize that all attempts at carbon capture of fossil fuel combustion requires energy input that subtracts from the net energy equation.
Sleight of hand, it’s not only good for magic tricks…also works wonders on convincing green washed minds that the genie can be put back in the bottle…
Did Mexico eventually go ahead with these measures (“Petroleos Mexicanos, also know as Pemex, will reduce crude oil exports in 2022 before phasing out sales abroad in 2023”)?
https://www.aljazeera.com/economy/2021/12/28/mexico-plans-to-end-oil-exports-in-2023-to-reach-self-sufficiency
I checked the exports data from the OPEC website and as of 2022, they were still exporting about 1Mbd.
More generally, has anybody picked up the torch from Jeffrey Brown and the research he was doing with his Export Land Model (https://en.wikipedia.org/wiki/Export_Land_Model)?
I would be very interested to see how global net exports of crude and/or condensate are doing.
The extra part on the top essentially folds over
Or instead of cannibalizing from the supply, one can think of it using extra NG to process. That NG can’t be used for heating or fertilizer then.
It shows energy needed currently increasing rapidly (is this part true?) then the rate stops. Seems off to me but nevertheless it’s sobering because the trend is probably right.
And given the increasing population people will see the repercussions much sooner if not now.
Maybe we’ll restart the research on those integral fast reactors.
Or maybe the oil companies will pull another rabbit from our hat?
I get a slight drop in ratio of oil produced per barrel required between now and 2028 (3.4:1), then steeper decline during 2030s (2.3:1), trailing off by 2040s (very little energy returned maybe 1.2:1 or so).
That roughly means that oil production in 2035 will be half as profitable as today and by ~2045 it will not be profitable at all…
Chevron operates and 50% owns the Tengiz (TCO) oil and gas field in Kazakhstan. There is a current expansion project based on adding compression to reduce wellhead pressures to increase nameplate capacity from 600kbpd to 860kbpd liquids, originally due to start in 2022 but most recently delayed to late March. There may be three problems with this. First it has been delayed several times now, second Kazakhstan has a nominal production with OPEC plus, and third reserves have been falling quite rapidly in the last few years through production and negative revisions while no compensating discoveries. Most of the negative revisions have been from undeveloped reserves and 85% of the fall in the last three years is from liquids. Given the project’s maturity and negative revisions there is not much probable reserve left.
Production could be added to compensate for decline in the other major fields in Kazakhstan or to all maintenance turn arounds, or the OPEC limit could be ignored. If the flow is increased however the oil R/P, which has been dropping steadily to under 10 years, would jump down to under 7. That is low enough that typically the field would be in exponential decline (i.e. production and reserves would fall together and the R/P would stay approximately constant), so the production plateau would not be maintained. 860kbpd would translate to about 150mmbbl annually for Chevron, compared to 110 recently (NGL may add some variability to the numbers). Tengiz uses gas injection for pressure support and there must be some conceptual design going on for the coming blowdown phase – the wellhead pressure lowering compressors would play a part in this.
When will people wake up from Lala land?
Seems like Dennis is starting to…
Dennis – I would add a 2200 Gb run for your model, it’s possible for one reason or another production falls off faster than your other runs suggest…
Thanks for your work on this, it’s greatly appreciated…
Kengeo,
If we use Hubbert Linearization to estimate World Conventional C plus C URR, the result is about 2500 Gb, generally this method has historically underestimated actual URR, so I won’t be doing a 2200 Gb model for conventional oil as that would be roughly an F99 scenario. Here is some food for thought. Conventional oil output reached a cumulative output level of 1100 Gb in 2010 at an output level of 71.6 Mb/d, in 2016 World conventonal C plus C output was about 73.6 Mb/d (this has been the peak to date) at cumulative output of about 1266 Gb whhich is consistent with a URR of 2530 Gb for conventional C plus C. Generally I discount the HL types of analyses, my best guess is 2500 Gb for conventional oil URR due to lower demand for oil in the future.
See this, seems like there is a reason to do a lower URR 2,000-2,200 Gb…
Kengeo,
The red dashed line is the current estimate, the other black dotted lines are earlier estimates which proved incorrect, do you also think I should do a model with an 800 Gb URR?
First Signs of US Oil Production Topping. Increase from September has been 63 kb/d.
December: 13,315 -4 kb/d.
Ovi,
Alternatively we could consider the change in November to December output in the US over the years. Since 2015 US C plus C output from November to December has decreased every year except 2018, so far except in early 2020 we have not seen a top in output, perhaps this time will be different. There are lots of ups and downs in US output from June 2020 to December 2023, the trend over that period is an annual increase of 779 kb/d. I would agree it is slowing down in 2024 to 2025 to perhaps half that rate or less, based on the forecast of the EIA STEO.
Another consideration is to look at the STEO from Feb 2023 and compare with actual output for the US. In 2023 actual US C plus C production had an annual increasing trend of 940 kb/d, but the Feb 2023 STEO was forecasting an annual increasing trend of 175 kb/d for US C plus C output (about 5.37 times less than actual.) No doubt there are many other cases where they missed this badly in the opposite direction. Bottom line, the Short term Energy Outlook is pretty good one or two months ahead, but longer term can miss very badly.
Dennis
That is correct, however I did not say that without other information. There is the first indication that Martin county has now just entered the bubble point phase. Also recall that the EIA STEO is showing no growth for 2024 and the DPR and LTO are flat. Many indicators pointing to an undulating plateau phase.
Looking at the GOR chart, the right red boundary possibly should be at 2.5, where the peak occurred. The next few months should confirm if it has entered the bubble point. Note the steady drift to the right after November.
I guess we will have to see what the future holds. Note how closely the state data matches the DPR Permian Region estimate when we adjust state data for recent 12 months to match the EIA PSM estimates for Texas and New Mexico (chart in post). For all Tight Oil Basins the DPR estimate through December 2023 is below, the model estimates after December are probably not reliable in my opinion.
Dennis
The outlook may be about to change. The effects of the huge drop in rigs from last August may be about to show up.
Ovi,
Permian Horizontal rig count from Sept 2020, if we assume a 6 month lag to completion of wells drilled, this would correspond with completions starting in March 2021. Recent December 2023 completions would correspond with rig count in June 2023. The count at 325 horizontal oil rigs at the end of June, the rig count has fallen another 25 rigs by mid September and then has remained at about 300 since then. So perhaps not a “huge drop” in rigs, a little under 10% over 3 months or roughly 3% per month.
Ovi,
I found this short piece at the primary vision website.
https://primaryvision.co/2024/01/25/us-oil-drillers-operational-efficiency/
Excerpt:
With frac spread counts (FSC) decreasing by 6.4% over the past year and rig counts down by 19.9%, a superficial analysis might predict a downturn. Instead, crude oil production has surged by 9.0%, revealing an industry that has mastered the art of doing more with less. This paradigm shift from drilling to completing wells suggests a maturing industry that is leveraging technology to extract more value from existing assets.
They fail to account for the 6 month lag between the rig counts and numbers of first flow wells, there is also likely a few month lag between frac spread count changes and and changes in the number of first flow wells.
Ovi,
For discussion…. I suppose as new well completions drop, the average well age increases and the GOR with it. Without new higher liquids/crude percentage wells coming online to keep the GOR down, the county will naturally rise through attrition.
I do not have new well completion data by time for Martin County, but will look. However, the past year trend of active frac spread reductions is likely a source of the rising GOR in Martin County, and other areas…if they also had the same frac spread reduction profile allowing existing well age to mature on average.
If things get peppy again out there, or other less developed zones become the more dominate target, you could see a reversal of the rising GOR trend, for the moment at least. I do not think Martin County is doomed to the permanent bubble just yet.
Gungagalonga
I have downloaded the Frac Focus database but they have changed it again. Not sure what I have is 100% correct but I did one long way check and it came out the same as in the table below.
I was hoping to get weekly data but could not find a way to get it. Attached is monthly frac spreads for Lea, Eddy, Martin and Midland from June 2023 to January 2024.
Providing the data is up to date, frac spreads peaked in September/October and then start to fall off. I confirmed the long way the 1,121 fracs for Martin in December.
The low January numbers are probably due to late updating. December is about right. I will try to do this again next Friday to see how much the numbers change. That will provide some idea on the update lag time.
There are three benches in Martin County that make up 94% of all HZ tight oil production from that county. Just three. To get to all three primary benches operators have to drill thru a severly pressure depleted “upper Sprayberry” zone (the “largest, most unprofitable oil field in the world”) that often, almost always, requires setting another sting of casing, liners, open hole packers, etc. etc. and it raises D&C costs signficantly. Economics are worse in the Midland Basin than the Delaware.
There are no new, “less developed” benches in the Midland Basin to get people “peppy” again, unless its deeper Devonian/Mississippian Woodford/ Barnett which will be 90% gas and gas liquids related. All those children out there sitting those drilling rigs are scared to get that stuff in ther face and burn a rig down. Why would they want to put themselves thru the stress anyway? WaHa Hub prices in West Texas were trading around 19 cents per MCF this week.
Look at Ovi’s frac spread chart. For God’s sake. Please. How can people NOT see what is happening, even the liars and the deniers? When DUC’s get deducted from the scheme, and rig counts fall, what is there to frac?
If they are NOT pouring 300,000 pounds of dirt and 600,000 BW into new wells, where is the production growth going to come from?
Who’s lying more these days than the US tight oil sector, than all the people who make free money, or $40MM compensation packages as CEO’s, or sell manipulated data to make a living to promote US tight oil and keep their jobs?
The renewable, transition-away-from-fossil-fuel crowd, thats who. Those folks are telling big whoppers. You EV guys make the shale oil and shale gas sector look like saints.
Why do so many people participate on social media these days hiding behind a fake, anonymous name?
Because they are lying and it helps ease their bad consciousness.
Charlie didn’t lie. He stood tall in his beliefs. Unafraid.
https://www.oilystuff.com/single-post/us-energy-independence-is-a-terribly-stupid-idea
Mike, what a wonderful book! It is a gift. I’ve just spent hours engrossed in it. I’ll share one quotation and a comment:
This is anathema in today’s Cult of Self-Esteem, but fuck them.
A good quote from this discussion by Munger:
” We should conserve and subsidize new forms of energy “
Charlie Munger was a very smart man.
Mike,
I use the data from Statistical Review of World Energy for renewable energy to show historical trends.
We can’t lie about the future, it is unknowable. All we can do is guess what the future trend might be based on past trends, there are many different opinions on what the future path might be, none of them will be correct.
Mike,
Your wrote:
>>The renewable, transition-away-from-fossil-fuel crowd, thats who. Those folks are telling big whoppers. You EV guys make the shale oil and shale gas sector look like saints.<>Oil and gas are absolutely certain to become incredibly short and very high priced.<< Me: Maybe until we can't afford it.
I'm one of those EV guys and I have been driving an EV for about 5 years. My colleagues always thought of me as a straight shooter. I see the writing on the wall where we will be peaking in World crude oil production. I have PV on my roof and it offsets some of the electricity I use and it does help to recharge my EV. I expect that one of these days, if I live so long, I will be generating and storing what I produce. I'm not naive to think that is going to solve what is coming. I may eventually become "energy Independent" and "export" all my surplus electricity. Little to none in winter to a lot more in summer.
Exporting oil is not a "The renewable, transition-away-from-fossil-fuel crowd" thing. It's a supply and demand and geopolitical thing. I assume we blew up the Nordstream pipeline to cut off revenue to Russia over its invasion of Ukraine and have had to export our oil and natural gas to stave off loss of energy to our European allies. There is money to be made in sending "our surplus" to our allies.
Yeah, Germany screwed up and bought into the "the renewable, transition-away-from-fossil-fuel crowd" with what you are describing. Some of the Big Automakers are backing away from EVs; likely to their detriment. Norway is going ahead with transitioning to electrifying all their transportation systems from cars to ferries to buses to figuring out how to do so for trucks (I doubt they will be successful in the near term).
How **do we conserve** with respect to what is remaining?? Oil and Gas are too precious for wasting on frivolous things. Supply and demand is going to be a bitch from insidious to overt. If I use less, then there is more oil and gas for vital things like growing food and for other more important things than me using an ICE to go grab some fast food. I like to eat.
Bottom line what do you think should be done?
Canadian Natural Resources Reported Q4 results.
Another blowout quarter. IMO, this is the best run oil company in the world. Paying down debt, raising dividend and no exploration costs. Below are an analyst’s comments.
Q4/23 Results Beat; Net Debt Target Achieved Earlier Than Expected
Bottom Line:
Canadian Natural reported better-than-expected fourth-quarter cash flow and achieved the largest quarterly production in the company’s history. More importantly, the
company was able to reach its net debt target a quarter earlier than expected and will begin returning 100% of its free cash flow to shareholders. Additionally, Canadian Natural announced another dividend hike, which is its third over the past year. We believe the results and updates will be positive for the shares.
Key Points
Better-than-expected Q4/23 financial results. Canadian Natural reported Q4/23 cash flow of $4.05/share (diluted), above of our $3.68 estimate and consensus’ $3.70. Relative to our estimate, the beat was primarily driven by lower operating costs, royalties, and cash taxes. Capital spending in the quarter was $1.12 billion (including ARO) vs. our estimate of $1.12 billion and consensus’ $1.15 billion.
Record production. Canadian Natural posted a production record of 1,419 mboe/d in Q4/23, ahead of our estimate of 1,405 mboe/d and consensus’ 1,409 mboe/d. Liquids volumes came in at 1,048 mb/d vs. consensus of 1,040 mb/d, while natural gas production averaged 2,231 mmcf/d vs. consensus of 2,216 mmcf/d. The company achieved record volumes at its mining and natural gas operations.
Net debt target achieved. Net debt fell to $9.9 billion, below the company’s targeted floor of $10 billion. Canadian Natural was able to achieve this a quarter earlier than expected due to the cash flow beat coupled with a ~$550 million working capital tailwind. As a result, the company will now begin returning 100% of its free cash flow to shareholders.
Raising the dividend again. Canadian Natural has raised its quarterly dividend 5% to $1.05/share (4.7% yield). The company has hiked it base dividend 24% over the past year through three separate raises. This increase reflects the confidence the board has in the sustainability of the company’s business and will mark the 24th consecutive year of dividend increases, with a CAGR of 21% over that time.
Reserves update. 1P reserves rose 2% to 13.9 billion BOE and 2P reserves increased 3% to 18.5 billion BOE, implying reserve replacement ratios of 166% and 194%, respectively. Proved FD&A costs (including changes in FDC) were $9.25/boe, representing an attractive recycle ratio of 3.4x.
https://www.cnrl.com/investors/financials/#investors
Ovi,
Do you think oil sands production can be ramped up much? I can see a long plateau if oil prices remain relatively high, but I wonder if we will see much future growth in oil sands output.
Your perspective would be of interest as it is your nation that produces the bulk of oil sands output. Doubtful that Venezuela will see much growth imho.
Dennis
The typical number I keep hearing is close to 100 kb/d/yr. One of the hold backs is the Carbon intensity of the extraction process and we have a current Prime Minister that has decided that Canada needs to be a leader in CC, even though we produce slightly over 1% of world’s CO2. At one point before he was elected he said “We have to shut down the oil sands”.
Below is a production statement from the CNQ Q4 report. Production increase is primarily from SAGD pads.
The Company’s thermal in situ assets continued to demonstrate long life low decline production before royalties, averaging 278,422 bbl/d for the fourth quarter of 2023, an increase of 10% from 253,188 bbl/d for the fourth quarter of 2022, and a decrease of 3% from 287,085 bbl/d for the third quarter of 2023. The increase in thermal oil production in the fourth quarter of 2023 from the fourth quarter of 2022 primarily reflected pad additions at Primrose and Kirby in 2023, partially offset by natural field declines. The decrease in thermal oil production in the fourth quarter of 2023 from the third quarter of 2023 primarily reflected the cyclical nature of steaming at Primrose and natural field declines.
Attached is a chart that shows in situ production (SAGD). From January 2021 to July 2023, production increased by 115 kb/d. With TMX coming on, SAGD could increase but I think 100 kb/d/yr is close to the limit.
https://www.cnrl.com/content/uploads/2024/02/12.31.2023-Q4-MDA.pdf
This is a fascinating sector. Some random notes.
1. SAGD is one of these lower EROEI resources, where EROEI doesnt matter much. There is plenty of gas in Alberta to boil steam.
2. Speaking of which, Canadian gas and condensate producers should be seeing some brighter days ahead. LNG Canada is almost ready to go, TMZ-related SAGD ramps will bump gas demand in the basin, rising demand for C5 condi as diluent will keep its WTI-parity pricing, if not even higher.
3. Given its ample gas resources Canada should be building more upgraders and refineries to ramp exports of syncrude and products. TMX would probably narrow the WCS spread as people say, sure, but the country can do much better to maximize the value of its bitumen….
Kdimitrov
Yes it is a fascinating sector, but the times are changing. Fortunately some of the better decisions on upgrading were made in the 1990s.
SAGD: Cost is an issue with SAGD as the price of NG fluctuates. Mining operations costs would fluctuate from being cheaper to more expensive than SAGD as NG costs changed. However today the game has changed.
The challenge to is to lower CO2 emissions. The big push today is two pronged. Reduce the Steam Oil Ratio (SOR) and reduce CO2 emissions. Much research has been done in adding solvents to the process and companies are now implementing their findings. Leaders in this field are Cenovus and Imperial Oil (Cdn subsidiary of XOM).
https://innotechalberta.ca/news/a-novel-solvent-will-make-bitumen-recovery-more-energy-efficient/
https://www.canadianenergycentre.ca/long-awaited-oil-sands-emissions-reduction-technology-going-commercial/
As for building new upgraders, forget it, a big disaster. The smart time to build upgraders was in the 1980s and 1990’s. That is when they were built and are still operating. I recall when Syncrude added a 100 kb/d Coker and upgrader to their facilities in the 1990s. The initial cost was $Cdn4.8 B. The final cost was $Cdn8.4 B. I remember this because of the flipped numbers.
Around 2010 studies indicated that a Refinery/Upgrader should be built in Alberta that would upgrade 79,000 b/d of bitumen into ULSD and by products. The estimated cost was $Cdn5.7 B. Final cost was $Cdn11 B. Funding was a combination of public and private money.
In the end the Alberta government had to take a 50% stake and CNQ bought out the original investors. It is still losing money and the government is trying to sell its half. It is not clear if there will be a buyer. CNQ is a possible buyer but may only be willing to pay $1.
Maybe when TMX becomes operational and the WCS discount becomes clearer, a deal could be made. Attached are two articles providing some background.
https://calgaryherald.com/opinion/columnists/varcoe-danielle-smith-alberta-options-sturgeon-refinery-stake
https://financialpost.com/commodities/energy/oil-gas/alberta-takes-50-stake-in-troubled-sturgeon-refinery-as-cnrl-north-west-refining-see-combined-825-million-payday
Very interesting and illuminating, Ovi. Thanks!
It’s disheartening that Canada – or most western countries for that matter – doesnt seem to be able to build industrial installations (upgraders, refineries) efficiently, on time, and on budget anymore.
Thanks Ovi.
Ovi,
Looking at all Canadian output in the 2023 Canada Energy Futures Scenario (current measures scenario) the rate of increase in all Canadian C plus C (most likely coming from Oil sands) is about 100 kb/d as you suggested from 2024 to 2029, then this decreases to 45 kb/d from 2030 to 2035 and then flattens to roughly zero from 2036 to 2040 with decline after that at about 24 kb/d from 2040 to 2050.
You may not agree with the government scenario.
https://open.canada.ca/data/en/dataset/7643c948-d661-4d90-ab91-e9ac732fc737
https://aspofrance.org/2023/12/23/extrapolation-of-past-oil-production-to-forecast-future-production/
abandoned well issue:
https://www.texastribune.org/2024/02/28/abandoned-oil-wells-west-texas-railroad-commission/
Tax payers will pick up the tab?
Astonishing amount of risk as billions of barrels of produced water continue to be injected back into the Permian. Great article.
For the US medium sized independents with most of oil and gas production coming from fracking the following are some results from their 10-ks for 2023.
Spending was up a bit from 2022 even after deflating based on the North American capital cost index (diamond symbols).
Long term debt about the same as last year.
Dividends continued to be payed by most firms but were down from 2022.
Share buy-backs were still high but down from 2022. Overall I would have thought investors were pretty happy with the year, financially at least.
Mr. Kaplan,
Great stuff, thank you for sharing.
Great graphs!
Financially there is some slack at 80 dollars per barrel in the US it seems; at least in the short term. I guess the current oil price at 80 dollars per barrel is somewhat fair. The dollar strength is subdued as of lately. It is impossible to reconcile the need for low fuel price for the consumer and for other uses all over the world and at the same time allow for enough economic muscle for expansion of the hydrocarbon complex. Well, who knows how much dry powder is left at these prices in Africa, Central Asia and in South America? Export of technology is occuring and will occur one way or another – the seismic phase is probably very important given this a long term game no matter how you look at it (as well as efficient drilling).
The obvious solution is to reduce demand for fossil fuels with renewables. It is great if the financial system can balance somehow, the alternative would be imbalance. Painful most certainly – not necessarily wrong, but the lack of stability would not be something to urge for in my opinion.
For the combined E&Ps shown above 2023 saw a return to negative revisions after some price related additions in 2021 and 22. Negative revisions mean there are no reserves in probable and possible categories and the proven were overstated at the average annual price. The large cumulative revisions mean the original estimates for recovery were all overstated (CLR has been the worst for this, SM and EOG have been conservative and show positive revisions every year).
Discoveries, which mostly represent FIDs for new drilling but may include some extensions, appear to have peaked even given the higher prices in 2022 and 2023, which would tend to agree with there being fewer tier one locations available now but may have some impact from investors’ desire for returns over growth.
Remaining liquids reserves for theses companies have risen steadily but may be showing signs of flattening out, with undeveloped reserves maybe having clearer indication. R/P has been falling but the early numbers are skewed a bit because they include a lot of conventional and the numbers reported include NGL, which is a large proportion and dependent on the shale gas holdings rather than the oil fields. For conventional fields R/P dropping below 10 often indicates a move to continuous decline but there is no real history to compare for non-conventional.
Remaining dry gas reserves have also risen but may be plateauing, with undeveloped showing signs of declining and R/P maybe declining. For oil and gas the choice seems to be between a plateau or an initial decline but the days of clear growth have gone.
EIA publishes reserve estimates for individual areas (i.e. basins) and with C&C separate from NGL, which give clearer indications of trends and cover more companies, but they are alway a year behind the 10-ks and this year are three months late so far.
Rig Report for Week Ending March 1
– US Hz oil rigs increased by 1 to 453. The rig count continues to hover close to 450 since the beginning of October.
– Permian rigs were up 1 to 296 and also have been flat around 295 since October 2023.
– Texas Permian was unchanged at 203 while NM was up 1 to 92. In New Mexico, Lea county was up 3 to 46 while Eddy dropped 2 to 47.
– Eagle Ford rigs held steady at 46.
– NG Hz rigs were unchanged at 107, (not shown), even though NG prices are weak.
Rig Report for Week Ending March 1
The frac spread count was up 2 to 272 and down 4 from one year ago. How high will the Frac count go in 2024? It is starting to show signs that Fracs will bounce around 275.
There was some discussion last post about the Marcellus. I used data from Novi Labs on the Pennsylvannia shale gas output (about 98% from the Marcellus) to create a rough model. I assume the mean USGS estimate for area of the 3 highest EUR Assessment Units (AU) and about 300 acres per well on average after 2018. The average well EUR from 2010 to 2020 is estimated based on the data, for simplicity I assume 2021 to 2023 wells have similar productivity as the average 2020 well then I assume productivity decreases at 3% per year starting in 2024, wells are added at a constant rate of 44 per month from Jan 2024 to Dec 2040 then wells decrease by one each month.
The guess is likely to be wrong.
better to add the scenarios where the productivity “decrease only 1%”, “stay the same” or “increase 1%”
Sheng Wu,
I assume a 300 acre well from 2020 to 2040, under that assumption it is highly unlikely we will see productivity increase as core areas become drilled out and producers move to less productive rock. Scenarios below cover 2% annual productivity decrease and 1% annual productivity decrease. (This is the decrease in EUR for the average well over time.) The scenarios are for the Pennsylvania Marcellus only. Also in the original comment I mistakenly said that productivity was assumed to decrease at an annual rate of 3%, the correct value is 2% per year for the model assumption.
great additions, but I still think you should also add scenarios for “high, med, low” price scenarios, e.g. it is quite possible that pipeline issue/negative spread will be alleviated if the production drops 20%?
An example is the Marcellus in WV, the production is still growing at quite brisk pace, probably due to NGL spread help the economics. Total Marcellus is now well above 10TCF annual now.
Sheng Wu,
I only do such an analysis with more information, I have no data on average CAPEX, OPEX, etc for Marcellus. Note that these scenarios would be for a high oil price assuming the mean USGS TRR assessment is correct (the 5% annual EUR decrease scenario). The higher scenarios are something like an F25 or F10 scenario (very rough guess). As far as growth of Marcellus output, it has been 1.1% over the past 24 months, relatively flat. West Virginia shale gas grew at about 669 million cubic feet per day annually from 2013 to 2022, so yes significant growth in W. Virginia, but note for the Marcellus as a whole the growth from 2013 to 2022 has been about 1741 million cubic feet per day, so W. Virginia provided about 38% of Marcellus growth over this period.
Sheng Wu,
Note that the USGS Mean estimate for Pennsylvannia is approximately 185 TCF for Marcellus Shale Gas, in the chart below I also include a scenario with a 5% annual decrease in new well EUR (or productivity) which has a URR of 188 TCF, more in line with the USGS mean TRR estimate for the Marcellus shale gas resource.
if UTRR for Penn M only then it is closer, just checked by 2023, Penn M produced close to 70TCF, and WV M at close to 20TCF, total close to 90TCF.
If the WV M continue the brisk pace, probably it will peak later at more than half of Penn M? Then maybe WV M will have UTRR at also more than half of Penn M, and then total M UTRR at around 300TCF, and plust 90TCF already produced, total at 390TCF.
Compared to 2019 USGS mean, 50TCF produced, 130TCF proven, and ~90TCF Undiscovered, or total at 270 TCF, we see increase of ~35%.
Sheng Wu,
At end of 2018 proven reserves were 135 TCF with cumulative output at 37 TCF, so 172 TCF plus 97 TCF for USGS Mean estimate, so yes 269 TCF for mean TRR (I mistakenly forgot to add cumulative output.) So far cumulative output and proven reserves for Pennsylvania Marcellus are about 77% of the Marcellus total, which might suggest Penn Marcellus TRR of 207 TCF rather than the 185 TCF I estimated incorrectly. Thanks for the corrections.
Note that I expect most of the output from the best three AU will be viable to produce, but the other 3 AU from the 2019 assessment with lower EUR (about 26 TCF) will not be extracted, this reduces the overall TRR by 26 TCF to about 243 TCF for Marcellus with Penn Marcellus at about 77% of that for a Penn Marcellus TRR of about 187 TCF. I expect W. Virginia Marcellus TRR to be about 56 TCF.
Can you clarify “we see increase of 35%”? Based on the area of core production in the Marcellus (in Pennsylvania 75% of Marcellus output comes from 4 counties) the mean USGS TRR seems optimistic, I would say ERR is likely to be at least 10% below the USGS mean estimate even with high natural gas prices which is by no means a given. If the US slows it building of LNG export terminals it may keep natural gas prices in the US relatively low and if natural gas prices rise wind and solar may take market share in the electric power industry from natural gas which may reduce demand, also heat pumps may take more share for space heating if natural gas prices rise.
We may see low natural gas prices in the future.
I also miscalculated the “35%” when comparing USGS 2019 and the latest numbers based on your Penn M projection (200TCF UTRR) and WV M trajectory(100TCF UTRR, my rough estimate based on WV M still fast rising production), which is about 390TCF including produced 90TCF, UTRR at 300. It should be more like 40% increase from USGS 270TCF total, and if you further deduct the USGS fringe M 26TCF, then it is more like over 50% increase.
Sheng Wu,
I don’t have much information on West Virginia except output. Note that much of the 26 TCF in less productive assessment Units is in West Virginia. I think you overestimate W Virginia. Through 2021 looking at cumulative output and reserves the split between W Virginia and Pennsylvannia is 25%/75%, W Virginia is about one quarter of total Marcellus output with W Virginia one third of Pennsylvania output.
So W Virginia looks like it would be 269 times 25% or about 67 TCF, much of that 26 TCF is from the Eastern Interior assessment unit (about 21 TCF) which is primarily W Virginia (roughly 60% of the area). Very doubtful we see 100 TCF from W Virginia imho, even 70 TCF is not very likely.
Also note that if the TRR ratio for Pennsylvania and West Virginia is similar to the ratio of shale gas proved reserves, then the USGS mean estimate for the Pennsylvania Marcellus would be about 185 TCF. This suggests my model estimate may be too high by perhaps 15%.
Sheng Wu,
I just realized I forgot to label vertical axes on Penn Marcellus charts, the units are billions of cubic feet per day (BCF/d). For 2022 Penn shale gas averaged about 20 BCF/d and W Virginia shale gas about 7.58 BCF/d for a total of 27.6 BCF/d. As you suggested this is over 10 TCF per year.
I am also surprised by WV M production rise in the past 3 years, and it definitely still has room.
My guess is that the liquid part of the production really helped the economics in WV M, and it is extremely productive in terms of liquid— better than some of the best wet gas condensate liquid producers in Eddy/Culberson co, Delaware basin.The GOR could be as close as 6MCF/bbl, i.e. 1:1. The first 3 year liquid could be as high as 200 KBO (almost at $12M, yet just 1.2BCFe), and plus 1~3 BCF of gas (only $1-2M if only consider dry gas, but with high wet NGL, probably $3~5M if there is plant ).
Also, the well depth are so shallow, at only 7000′, and one 15K well could be drilled in one shot in less than a week, and all the fracking is a lot easier. The per foot cost probably is half of Haynesville, or 2/3 of Delaware and 3/4 of PA NE. Plus, the water production is so low, so lifting cost is minimal too.
So, if USGS or someone only use gas economics, then the well BCFe EUR will not be good, but with the liquid plant infrastructure all ready, the well economics is improved significantly, although the railroad will be under pressure. The only way the similar wells in Permian could survive is to make the gas plant and infrastructure as good as the Appalachian.
Sheng Wu,
Note that NGL only gets about 30% of the crude price, but even at that price the average West Virginia shale gas well may get 2.92 million barrels of NGL over its first 3 years of output (based on recent ratios of NGL to NG in WV, which at 30% of $80/bo would be about 69 million before royalties and taxes, if we deduct 30% for those and another 10% for transport cost we still have 40 million, assume the well costs 15 million (probably less than this) and we are left with 25 million even if natural gas prices were zero. If we assume natural gas sells at $1/MCF that adds another 7 million to the picture, but note also there may be about 17 million in OPEX so this reduced the profit to about 15 million on a 15 million investment over 3 years, a pretty attractive investment as there will be future revenue after year 3.
it isn’t clear how much of the Marcellus has this liquids rich character, but at present it looks like WV is the better area for higher profits unless there is a glut of NGL which could cause prices to plummet.
Note that the USGS does not look at economics they look at what is technically recoverable only.
hahaha, Dennis,
WV M is a mega million jackpot.
I believe your numbers above are all inflated — from income to OPEX, NGL bbl MCF conversion is a huge mess even for Art and Patzek, god knows how could they did not make a scam there yet. In China, few Petro engineers could distinguish M and K, or MM with million, and there are news writers claiming one M well is producing 1/3 of China total gas production.
Hi Sheng Wu,
Yes I was mistaken in my calculations and was off by a factor of about 10 on NGL produced (used annual data NGL with monthly data for NG by mistake). With the correct calculations the well does not pay out in 36 months assuming 15 million CAPEX and $24/b NGL and $2/MCF NG. True though that the higher NGL output in WV (roughly 5 times higher NGL per MCF NG compared to PA) is likely to make the wells there more profitable than the PA Marcellus wells, especially in NE PA if NG prices remain low.
I was able to find a wellhead price for NG in Dec 2023 in Susquehanna County, PA at about $2.29/MCF. Statewide the average price was about $2.17/MCF. This is based on crowd sourcing and may not be valid pricing, only 23 samples for Dec 2023. From site linked below.
https://www.marcellusgas.org/pricing/
Article below discusses NG prices in PA
https://stateimpact.npr.org/pennsylvania/2023/09/22/pa-gas-prices-drilling-falls-report-says/
WV M has lots more liquid (NGL+oil) than SW PA M, and gas to liquid at about 2TCF:100Million Bbl. Or, if one use the maturity based wetness, the molar mass ratio should be about 5 NGL and 1 methane, and or 1TCF methane dry gas should have 200BCF of NGL. The NGL barrel can not be converted to gas volume at 6MCF=1bbl, and it actually varies for different components of the NGL.
So, EIA has a composite price based on Million BTU, besides price for each components, i.e. butanes, propane, ethane…
https://fred.stlouisfed.org/series/MNGLCP
https://www.eia.gov/energyexplained/hydrocarbon-gas-liquids/prices-for-hydrocarbon-gas-liquids.php
From this Million BTU price, if 1MCF methane is roughly 1Million BTU, then 1MCF ethane, propane and butane will have higher BTU. 6MCF of NGL should fare price quite close to oil, at around 50% of oil, or each MCF of NGL should get better than $6 as the link above shows.
Sheng Wu,
The prices reflect dry gas after NGL plant separation, I realize the WV natural gas has more NGL per MCF gross gas than Pennsylvannia wells, typically the NGL composite barrel sells for about 25 to 30% of the price of a barrel of crude, though this depends on supply and demand for the various components of NGL (ethane, propane and butane in their various isomers). In any case the WV wells will do better under the current price environment. I don’t convert NGL based on the 6 MCF/ 1 bo metric only the dry natural gas.
I was looking at a Delaware Basin Wolfcamp well being auctioned this month. The operator is Callon.
The well was completed in 2017. It has cumulative oil of about 275k and cumulative gas of about 581k.
The well is currently producing 55 BOPD.
What struck me was the expense for disposing of water. The water is truck hauled. There are 6 750 Barrel water tanks on the lease (and 2 1,000 Barrel oil tanks).
Water disposal expense is running anywhere from $10k to $18k per month for the past six months.
The company doesn’t show how many BWPD is being produced. I assume this well is an outlier on the high end for water production? Suspect that is why it is being sold.
LOE for this well was over $25 per BO. I didn’t figure in the gas. The average price for gas had been $1.70 per MCF, but I think that has since fallen quite a bit.
Does anyone have access to statistics for the amount of water being disposed of from operations in the Delaware Basin?
That well probably should be a giveaway. It will cost someone (probably the taxpayers) about $250,000 to P&A, and it’s getting there fast. The water cut is almost certainly very briny, which makes it difficult to clean up for use in fracking other wells, and the brine at the bottom of the well bore is going to become more concentrated, pulling in more water with each mole of salt. The SWD wells that are closest are full, and the transportation cost is going up. The wellhead gas is likely bringing no more than 50 cents/tcf, and that’s not likely to change much, as the European winter is mild and about over, not to mention the ban on new LNG trains. The Delaware is close to Carlsbad Caverns–a massive limestone karst that is at some point (with such loss of water) likely to weaken–perhaps with catastrophic consequences.
That whole thing (it’s not unusual for a well in the Delaware to put out ten barrels of water for each barrel of oil) is indicative of the desperation of a basin to claim oil hegemony. This is a well in terminal decline, put on the market as sucker bait. Has the entire Permian shale oil industry turned into a Ponzi scheme? It is beginning to look like that. By my calculations they have made about a 1:6 return on that well, which after taxes and tax savings just about breaks even. But as they say, future returns can’t be based on past earnings. An uneconomic, environmentally-dangerous well like this should be put to sleep.
You fellows (with good intentions) who are making these models on Permian production, extrapolating into the future, should be aware that there are tens of thousands of similar wells right behind this one. This well could go on in this fashion for another ten years, eating up truck tires (and lives) in water transport, adding to the seismic dangers of SWD wells built along Texas fault lines, until its end-owner goes belly up and the taxpayers plug it and mercifully put it out of its misery. A shit-show is coming.
This particular well may be an outlier, but there are a bunch almost as pathetic coming right behind it. Count on it. If the oil and gas “experts” who move markets actually did the work to understand the natural history of these wells, and the precarious nature of the Permian Basin in its current form, the price of oil would be $150.
Hi Gerry,
Here are the scenarios I used for the Permian Basin for my US tight oil model. Note that as of December 2023 approximately 12 Gb of tight oil has been extracted from the Permian Basin, so the low scenario has about 12 more Gb extracted after December 2023. Note also that if no more wells were completed after December 2023 the total oil extracted would be about 18 Gb. The low scenario seems fairly conservative to me, YMMV.
Hi Dennis:
You may be right. I’m reluctant to respond, because it’s morbid.
I have difficulty seeing past performance define the future. The reservoir pressure has dropped all over the place. There is already a massive problem disposing of produced water yet we’re about to see a deluge as wells in terminal decline draw in more salt, which pulls in more water. NG is now such a glut that it’s at giveaway prices at the hub, yet we’re going to see more and more as thousands of wells hit “that point” and many of the new wells have higher gas cuts. EUR’s of the pilot (parent) wells drilled in 2018 do not by any stretch denote the EUR’s of the infill (children) wells drilled in 2022. Take away proceeds from NG, increase expenses of production, give us lower EUR’s and what kind of net back is there?
How do we get out of this mess? Where do we put the water? What about all that gas? With XOM paying 3.5 million for each drilling site, the cost of a well just went up to about $15M. Is someone actually going to drill that well?
When we have fifty-thousand wells similar to the one delineated by Shallow Sands, we’re talking about a massive field of expensive-to-run stripper wells that are producing all the wrong things: brine and methane gas. If all that water is taken away from the “People’s Well” and sequestered in a SWD well that is already exceeding physical limits, I suspect it’ll change the local climate.
I suppose I’m sensationalizing the matter, but I just don’t think the tail-end of this is going to be pretty–or the production amenable to modeling. In point of fact, as the saltwater flood hits as the earth shakes, I’m pretty sure that a lot of marginal wells are going to be merely abandoned–not plugged.
Gerry,
The assumptions of any model will always be proven wrong by future events. So yes the future will be different than shown here for all the reasons you cite.
Interesting discussion on shale strippers. Their economics will be becoming more and more relevant, as an ever increasing fraction of LTO will be coming from these <100 BOPD wells.
I would imagine that the more wells per pad a company has, the better efficiency and lower costs per bbl can be achieved from scaling these intense operating activities. So companies that developed these cubes with multiple benches will benefit at the later stages, while companies who were cherry-picking and hopping around will fare worse…
Hi Gerry. I agree with basically all you said about the well. I hadn’t considered how the long-running effects of the Delaware could lead to damage or destruction of one of earth’s treasures, Carlsbad Caverns. Do you have any idea how close they are drilling?
Hi DC, I’m sorry, I missed your note. They’ve drilled in Eddy county as close as the USGS would allow them. That whole area is a carbonate karst. Sinkholes develop when slightly acidic rainwater dissolves the limestone “bedrock,” and God knows they’ve got enough CO2 in that area to make the rainwater “slightly acidic.” In fact, there is the fabled JWS Sinkhole in Eddy county. In a limestone karst, there is a network of interconnected underground streams. These frequently meander around brine deposits. This whole area was studied out the wazoo by the USGS due to the placement of the WHIPP site down there in Eddy county, so presumably they know what they’re doing. They had the common sense to limit the number of SWD wells, which could have been disastrous to that fragile area–that’s one of the big reasons the produced water is trucked back to Texas. Several brine deposits reside directly under the city of Carlsbad. The very southern tip of the largest reservoir in the United States, the Ogallala, comes down south of Lubbock. Many of those underground interconnecting streams also connect to it. No one on God’s green earth knows what will happen to this exceptionally fragile area in a few years. I’m not trying to be a fear-monger, and I’m no geologist, but anyone who has been down in Carlsbad Caverns or has seen the JWS Sinkhole nearby can appreciate the delicate balance between the limestone karst and the underground water system.
Thanks Gerry. I’m glad to hear they are at least trucking the water out of the area. It does sound like I should get back there by this summer to see it again. It would be a shame for us to screw up Carlsbad Caverns just for entries in a ledger.
Totally agree! The companies have been lying about the EURs (estimated ultimate recoveries) for the past decade. My company drilled over 200 wells in the Delaware Basin and only a few were stars (the first wells drilled on a lease) everything else sucked. Many operators who own the SWD systems servicing their wells and take the opportunity to over-charge the non-operators for water disposal. Common practice among Permian Basin Operators. Economics at current prices provide extremely marginal single well economics. I wouldn’t drill a well in that pin cushion unless costs remained the same with an oil price over $100 per barrel. Lots of 50 bopd stripper horizontals all over the Permian.
Last year I drilled 3 wells in Eddy County during a very high oil price environment (2022). Recovered all of my capital and based on current cash flow 18 months later, I will make approximately 1.35 times my money on an undiscounted basis over the entire life of the well. Does this sound like a good business to anyone based on the inherent mechanical risks? Not to me.
This comment by the “Survivor” should put an immediate end to all speculation about remaining URR from the Permian, be it 10, 20 or 200 G BO. End of story. Declining liquids productivity, gas and gas liquids is fast becoming the principle component of the production stream, as gas prices collapse and produced water costs go thru the roof…135% rates of return on $11MM wells is NOT profitable. Enough. That was in 2022; now, because of natgas, economics are worse. In the Midland Basin most remaining well costs increased to $14MM each because of M&A. There is no more OPM; they are on their own financial feet now and still losing money. Debt is increasing.
I simply do not understandy why people don’t get that. Who is going to pay for this wonderful tight oil and America’s 5MM BOPD of oil exports? Where is the money going to come from? Drill baby, drill…with what?
More importantly, why?
Mike,
At current prices for crude, natural gas, and NGL I would think the number of first flow wells should decrease, if they do output will fall. Somehow the wells continue to be drilled and completed. There are still 296 horizontal oil rigs running in the Permian as of last Friday and about 272 frac spreads in the US operating as of last Friday, the Permian horizontal oil rig count has been stable since October and is down about 10% since June 2023, frac spreads are at roughly the average level of 2023. If prices remain at current levels for oil, nat gas and NGL we should see output in the Permian start to decrease between April (5 well per month decrease in completion rate) and September of 2024 (2 well per month decrease) depending upon how quickly the completion rate starts to decrease.
Permain economics have changed, signficantly, the past 8 months; rig counts have declined, DUC’s are gone. Half the production stream of a typical Permian Basin well, and corresponding revenue, is now N/A. Past results are never indicative of future performance in the oil and natural gas business.
The question is likely better directed at businessmen or women, particualarly those IN the oil business…where will the money come from? The US shale sector is now standing on its own financial feet, for the first time ever, and it looks to me its getting a little weak in the knees.
Wells are now designed to be as long as possible, where there is room, and frac’s designed for maximum up front cash flow, NOT EUR’s. Its about cash flow.
Once that is all over, where will the money come from to drill 100,000 more tight oil wells in the Permian Basin when the profit margin it is working within is currently <2% annually? Are we still hoping for higher oil prices to solve the problem?
Mike,
It won’t happen at current price levels, I agree economics have changed significantly since 2022 when prices were higher. I expect prices will probably rise which is why my best guess scenario has a flat completion rate. In my view the money will come from cash flow, companies may need to reduce dividends and start paying down debt. If not completion rates will decrease, the scenario below has a total of 85k wells (40k more than at present). URR=33 Gb. If oil, natural gas, and NGL prices remain where they are or fall this might be how it goes in the Permian. We will see.
The scenario above assumes the completion rate decreases by 3 wells per month starting in Jan 2024 and also that new well EUR decreases at an annual rate of about 3.5% initially and a gradually falling rate over time as the completion rate falls. Chart below has assumed annual rate of EUR (productivity) decrease for Permian basin horizontal tight oil wells over time (where the date is the month of first flow for a given new well).
One thing I have not done for this scenario is to analyze the economics at some assumed level of CAPEX, OPEX and oil, NG, and NGL prices. The falling new well productivity might be offset by falling costs per foot of lateral for longer wells, but eventually we run out of room for 15 thousand foot laterals (Pioneer claimed recently they have about 1000 of such future wells, perhaps basin wide there might be 4000 such opportunities (this would be 6000 of the 10k wells assumed in my scenario). Also note that although cost may decrease, the productivity per lateral foot decreases faster for these wells than for a 10 thousand foot well so it is not clear that operators come out ahead on this (it may be investor presentation hype that big tight oil companies are well known for.)
In any case, at current oil, NG , and NGL price levels the scenario presented above may be quite optimistic because falling EUR will lead to falling profits which will in turn lead to a more rapid decrease in well completion rates than I have presented in my scenario.
Mike,
The scenario below takes account of the effect of falling new well EUR on profits at current prices. After December 2025 the wells do not produce enough oil, NG, and NGL to be profitable at current price levels so completion rate falls at faster 10 well per month rate in this scenario. Total wells drilled are 65k (20k more than at present) and URR for Permian is 27 Gb (18 Gb with no future wells drilled). So with these corrections this would be my best guess for a scenario where future oil, NG, and NGL remain at present levels in real 2023 US$ and costs also remain flat in real dollar terms in the future. Of course this will be wrong, like all my scenarios as I agree the past does not predict the future.
Click on chart for larger view. The new well completion rate in wells per month is shown on right axis for this chart.
Mr. Coyne, declining well completions in the Permian are inevitable for reasons you correctly point out. I am not seeing well costs go down much and I’ve looked at AFE’s for wells scheduled 6 months out. Longer laterals are carrying the day at the moment because of cash flow; cash flow allows Juan to be robbed to pay Jose. Those guys are lying about how many 15K well locations they have to drill in already overly drilled, pressure depleted core areas. The economics on those lataerals are terrible anyway.
I am always amazed, and saddened, by people that know so little about the business end of this stuff. For instance 450 K BO EUR’s = $34MM; they’ll keep drilling. Yikes. Breakeven prices less the oilprice.com price is net back price. Divide $32/ BO net back into $14MM well costs in todays consolidated Permian to see what an EUR has to be to pay the well out, pay dividends, service debt and drill new wells with declining liquids productivity… and its easy to see where this is going. Survivor’s 135% ROI in 2022 was as good as it got back then. Things ARE worse now.
Good work.
Thank you Mr. Shellman, I agree 100%.
Maybe I am starting to get it, at least a bit. I owe the little knowledge I have about the real oil business mostly to you, Shallow Sand, and one other person who prefers I not mention his name.
BTW, so sorry about the wildfire disaster in Texas. My thoughts are with your fellow Texans.
Don’t listen to me, Dennis, listen to Survivor, Shallow, Longhorn and Gerry; they’re saying things that are important.
Thank you. The Texas Panahandle is actually quite beautiful and the Canadian River Basin very unique. It has been devestated. A friend in Borger says over 25K head of cattle through the big burn (Smokey Creek) were burned to death and another 25K will have to be put down from underbelly burns. Its calving season too. There are thousands of oil and gas wells in the burn area. I live 400 miles south but in the mornings, even here, we can see and smell the smoke.
Mr Shellman,
I listen to all of the people you named, but you and Shallow Sand have offered a lot of useful information over many years. LTO Survivor, Gerry Maddoux, DC Longhorn, George Kaplan, South LA Geo, and Fernando Leanme have also taught me much, all the mistakes I make are my own and I am happy people point them out to me, that is part of how i learn and there is much that I don’t know.
LTO. Maybe you can confirm or dispute something I have believed.
The shale companies have been paying a lot of dividends. It doesn’t look to me, after looking at 10k, that they can afford to do both this and keep drilling and completing a significant number of wells each year.
Case in point, Pioneer burned over $4 billion of cash from 12/31/21 to 12/31/23 and borrowed $700 million, despite paying large dividends in 2022 and 2023. As you know, oil and nat gas prices were good in 2022, not as strong in 2023. Yet they still burned cash both years due to the dividends.
Did Pioneer sell because the dividend model is unsustainable without $100 oil and $6 MCF in the field?
Shale pundits have argued to me, saying look at the earnings. But aren’t the shale companies juicing earnings by overstating EUR/reserves, thus overstating GAAP earnings, as cost depletion is being understated 2-3 times?
For a simple example. $10 million well. EUR 1 million BOE. Unit cost depletion taken is $10 per BOE. If BOE EUR should really be 500k BOE, that would make unit cost depletion $20 per BOE instead of $10? Am I correct on this?
And thus, earnings are being juiced to the hilt, as $10 v $20 per BOE is huge, when a lot of BOE is nat gas and liquids selling at rock bottom prices?
I know I’m oversimplifying things some, but hasn’t this been the game all along?
Investors were lulled into thinking these guys must be making money because they are paying these big dividends and showing GAAP earnings. But then, after just two years of paying these, the pure shale companies are almost all bailing and selling out for little to no premium.
These guys have managed to all build huge NOL’s and pay almost no income taxes. They aren’t taking much percentage depletion, so the depletion is almost all “real.”
In an earlier life I prepared some oil and gas company tax returns. But they were mom and pops, so there is a lot I don’t know and more that I have forgotten. But we still file a couple ourselves every year, and I try to understand them best I can, including meeting with our CPA.
This is my take and would really appreciate yours. If I’m wrong, please let me know where I have messed up.
Shallow sand,
The average Permian well in 2020 has an EUR of 455 kbo, 180 kb NGL, and 361 kboe NG (assumes 1 boe= 6 MCF) that totals to about 995 kboe for EUR with the well assumed to be shut in at 10 bo/d ( C plus C only). So EUR is in fact close to 1 million boe for average Permian wells, note that 2022 wells look very similar to 2020 wells, at least for first 12 months. Unfortunately we are in need of updated data for the Permian (last update was November).
Dennis.
The numbers used were to make a simple illustration.
I have no idea what the actual EUR figures should be.
I just know back in 2015-16, the EUR being used were inflated.
Do you know what companies such as PXD are booking now?
as discussed by many, both sides, pro or bashing shale drilling,
2021 wells are the best, and might have been affected positively by Covid, i.e.high grading, and postphone hold back productions that push up the IP, and rest 2019~20 and 2022~23 are obviously lower, and according to Art,
https://www.artberman.com/blog/beginning-of-the-end-for-the-permian/
his 2021 best numbers are close to your number above, but rest are obviously lower.
The oil and gas EUR and break even table actually shows that the GOR for EUR is not going up — yes, when oil is down, gas is down faster, Art must be using some special shale-bashing DCA analysis.
Seems more reasonable average EUR numbers should be 400K BO, and 200K BOE of gas and NGL. If overdrilling induced bubble point death gets worse, we will see 350K BO, and 200K BOE of gas and NGL.
Shallow sand,
No I don’t know what companies are claiming, I go with the data that I get from Novilabs. Took a quick look at recent Pioneer investor presentation and they don’t give specific new well EUR. Looking at Pioneer wells at Novi labs they are fairly average in 2020, but a bit below the average in 2022.
Sheng Wu,
I use the data from Novilabs, yes the 2021 wells were the best (ignoring lateral length, I don’t have that data), but 2022 looks very similar to 2020. The oil is 455 kbo, NGL and NG about 540 kboe combined based on the data.
455 kbo @ $75/bbl is $34M, without even counting gas and NGL.
CAPEX is $11-12M, for D&C and ~$3M for acquisition.
LOE, taxes and other OPEX: ???
I think it is a good business @ $75/bbl, if you have efficiencies in lift, maybe not gangbusters, but decent.
A company like XOM, who have already paid for the acreage with the PXD acquisition has no choice but keep drilling and even ramping up. They do get the cash flow increments, and besides, if you are the CEO what’s the point of sitting on that huge acreage and wait for “peak demand” and “energy transition”. Your job security as a CEO is higher if you drill.
Small private operators may have different economics, due to probably less efficient lift costs. But whoever’s got the acreage will drill, I think.
Kdimitrov,
OPEX is probably about $13/bo, royalties and taxes are about 28.5% of gross revenue. Income tax is another 25% of net revenue. Natural gas sometimes trades for close to zero at Waha Hub in W Texas and NGL prices have also fallen to about 25% of the cost of a barrel of crude. Mr Shellman likes to see a well payout in 36 months to earn a decent profit on a conventional well, his rule of thumb might be lower for a tight oil well (maybe 30 months ?) The economics for these wells at current prices is not very good. Also note that wellhead prices tend to be below WTI price when we account for transport cost, so at the wellhead the price of goods sold may be $70/bo.
Also realize that average new well EUR is falling and normalized EUR (kbo/foot lateral) has been falling since 2016 in the Permian basin. Compamies tout lower cost per foot for longer 15k lateral wells, but fail to explain that EUR per foot may decrease just as much as costs decrease so the claimed increase in IRR may simply be investor presentation hype.
Unless oil, NG, and NGL prices rise these Permian wells will no longer be profitable once EUR falls to 90% of the average 2022 well which may occur by Jan 2026, then things really fall apart at current price levels.
Ovi,
It is unclear what you are counting here. The frack spread count for the nation was 272 frack spreads for week ending March 1. Is this total wells fracked per month in these counties? Even is this case it seems high.
Dennis
I know. I realized that after I posted the data and then discovered the problem about three hours ago and decided to take a break from this new database. Frustrating and took a long walk in some fresh air. The Frac Focus company is just making it harder to work with their data.
In my original post I noted it was different. I keep discovering different columns. The latest discovery is that each line is for a different chemical. In other words there are 20 to 30 rows for each frac spread. Just ignore the posted stuff. I have figured out how to clean out the duplicates. Will post updated info in about and hour. While the numbers will be smaller, I don’t think the trends will change.
My apologies to all.
Dennis
I eliminated my charts and in the process your comment.
I discovered the problem about three hours ago and took a long walk. Very Frustrating working with the new data base. There are multiple rows associated with each frac spread. One for each chemical. Frac Focus is just making it more difficult to work with their free stuff.
I have a fix and will re-post in an hour or two. I think the numbers will come down by a factor of 30 but I think the trends will be the same.
Apologies to all.
Ovi,
Not a problem, thanks for looking into it, I found the old database difficult to work with, too bad they have made it even more difficult. Took a quick look, it seems unusable in its present form, at least as a CSV file, I am not competent with SQL files, perhaps that would be better, if I knew how to do it.
Dennis
I use the csv file. Don’t know SQL
Dennis and Ovi.
If you have produced water data available for the shale basins, it might be a good idea to post it and get some feedback from those in the know who post here.
From my experience, truck hauling large volumes of produced water is not economic. But my experience is with wells that do not produced much BOPD.
We truck haul from two leases. One lease is just one well, which produces about 400 BO per year, and just one 70 barrel load of water being hauled a year. The other lease has two wells, also produces about 400 BO per year, and we haul 1-2 70 barrel loads of water per month.
A 70 barrel load of water only costs about $100 to be hauled. Each lease is near other leases of ours where we have water injection wells. So the tank truck, which is a bobtail, just has to haul the water about 1/4 mile and dump it into our plant.
Trucking several semi-loads a day eventually has to become uneconomical? Do the Delaware basin wells see lower levels of produced water as oil production drops.
Seems we have discussed this in the past? Maybe there is some updated data?
SS
NM publishes water data. Attached is a table for Lea county for 2023. Note how much water they inject and how much is produced. Looks like they have to haul a lot away. Is the injected water recycled?
I’m making an assumption. The difference between produced and injected is water that is not disposed of in Lea County. I assume much of that is being truck hauled to Texas.
If all of the water is truck hauled, that would be around 600,000 semi loads a month. Surely that isn’t the case and some is moved by water lines?
To me, 3 barrels of water per barrel of oil isn’t bad. What can be bad is if that increases over time.
It would be interesting to see how much water per BO wells make from each year, such as 2013, 2014 etc. Basin wide.
I haven’t owned part of a SWD for some time (Toyah), but in mid-2022 there were just over 5-million barrels of brine water PER DAY injected down 2,100 SWD wells in the Permian. I suspect that has increased a great deal. This is a massive industry: a few trillion barrels of saltwater a year. Mike Shellman will know current numbers.
The Delaware wells have in general a higher water cut, from inception. This gets worse as the wells decline, not better. Because of the extensively-surveyed limestone karst (where the old WHIPP Project was scheduled), NM got squirrelly about SWD (rightly so), and much of that water has to be trucked back to Texas. This whole situation is a travesty, as the depository wells are busting at the seams, literally.
Gerry
How is a SWD well created? Us city slickers know didly of what happens in oil fields.
Ovi, I’ve only owned a part interest in one SWD well, about eight years ago, and I recall that it had to be deep, its walls made impermeable to chemicals, and well away from known fault lines. I am not very familiar with the construction, to be honest, but I do recall the cost: $3M, and again that was roughly eight years ago. I do know that the water has to be analyzed, and especially treated to prevent hydrogen sulfide from being produced. Unfortunately, some of these wells were put in prior to current knowledge about fault lines, so there are a couple right on a fault line. The cost of disposal of produced water can run pretty high. In the Niobrara in Weld County Colorado, on the Wells Ranch, this is done entirely by a pipeline system. In the Permian and elsewhere much of the water is trucked. These are not just holes in the ground; they must be created according to strict guidelines which are regulated by the pipeline authority of the TRRC. I got out of this business because I wasn’t comfortable with it, to be honest. It was exceptionally lucrative, but became apparent that it was going to go berserk. There’s just so many places to put SWD’s, and so damn much produced water. There have been huge water-producing conventional fields in the past, of course, but nothing with this level of frenzy. It’s hard to understand, especially by this group, but with leaders all over the globe clamoring for renewable energy and the death of hydrocarbons, there seems no time to preserve minerals for the future, because there may be no future. A lot of people simply don’t want to think of having their minerals stranded by an edict for a solar panel or a wind turbine. So there has been this enormous rush to get what is there out of the ground and to market. This has wasted what we will surely need in the future, and has resulted in less-than-ideal produced water transport, destruction of the natural gas market, and a lot of other things that can be railed against but in context aren’t that crazy or inconsiderate. That said, we’re headed for Armageddon with tens of thousands of wells hitting the bubble point, a glut of NG, SWD wells brimming full, and the new wells coming on with higher water and methane cuts than we’ve traditionally had. It’s going to be a mess. If the water can be cleaned up for reuse, and if enough produced water pipelines can be laid, perhaps a disaster can be averted. I hope this helps understand the challenges that are being faced. These issues are the very reason Exxon, Chevron, Occidental and others are laying down rigs, allowing some degree of reason and equilibrium to come back into the shale field. To make this work, hundred-dollar oil is needed. But even that won’t work without at least three-dollar NG.
Gerry
Thanks. What are they drilling into? An aquifer, an underground river?
Gerry,
I agree there a lot of challenges. I would think State agencies could mandate water recycling of produced water and that would reduce some of the water disposal load if produced water was reused for fracking, perhaps the water could be cleaned up enough to use safely for agriculture as well. Or we could just stop producing altogether and save it for the future. The scenario below assumes no new wells are completed in Permian basin after Dec 2023.
Dennis, barring a cataclysmic event of widespread nature, stoppage isn’t going to happen. I didn’t start out to paint a picture of complete dystopian awfulness, just to comment on the well that Shallow Sand described, and I guess the dialogue grew morbid from there. It may sound as though I’m negative on the basin, and I’m not, but all this frenzy has worked it into a jam, which I’ve tried to illustrate. I’m not very good at this. If and when Mike Shellman reads through these, he can better describe the situation in about three sentences.
Dennis,
could you share some detail on your decay model, please. It is a complex function since decay rate depends on the age of the well, obviously… Did you approximate an average decay rate? Or is it a more elaborate model with #s of wells by vintage and IP, with declining decay rate?
Kdimitrov,
Note the decline in productivity is EUR over the entire life of the well, the decrease in output as an individual well ages is a simple Arps Hyperbolic fit to Novi labs annual well profile data (for 2020 well) for other years I approximate based on cumulative output at the latest month which we have data for all completed wells for that year compared to the 2020 average well, for wells in 2021 to 2022 I assume the well profile is the same as the average 2020 well. After hyperbolic model falls to 10% annual decline I assume exponential decline for well profile at 10% per year for Marcellus well profiles and for Permian Well profiles I assume 12.5% terminal decline rates after an initial 12 to 15 years following an Arps Hyperbolic (when hyperbolic reaches 12.5%/year I switch to exponential decline at 12.5%/year).
For EUR decrease I assume at a 500 well completion rate the average monthly decrease in EUR is the 12th root of 0.9644 (this is based on average annual Permian basin decreases in normalized EUR from 2016 to 2021 of 3.65% ). Then on a per well basis the monthly decrease is the 500th root of the previous value (0.9969) which is 0.999993802887348.
For each month the EUR decrease is the previous value raise to the wells completed power. This works out so that for a 250 well completion rate the annual decrease in EUR is roughly half of the rate of decrease for a 500 well completion rate. For a constant completion rate model at 478 wells per month the EUR decreases at 3.49%/year until the completion rate starts to fall. For a scenario with a falling completion rate (for example at 2 wells per month) the completion rate in Nov 2033 is 240 wells completed for this scenario (completion rate starts at 478 in Jan 2024 and decreases by 2 wells each month thereafter), in Nov 2033 the annual rate of decrease in new well EUR has fallen to 1.77% per year for my model.
The hyperbolic decay derives from a model of diffusive flow, while the exponential decline can be explained by the Ornstein-Uhlenbeck modification to diffusive flow. It’s been 6 years since publishing this model and it continues to work quite well so it might be deserving of a top-level blog post write-up.
Hi Paul,
E-mail me if you are interested in writing it.
Updated Frac Spread charts. Found a problem and it is explained in a comment to Dennis a few comments up
The trend is the same, peak spreads in October/November. I think December data is significantly under reported. Will post updated chart in a few weeks to check the difference.
Huge drop in Lea county.
Ovi,
Why do you think that about December? Activity usually slows down quite a bit in December…
Kdimitrov
Good point. December is then a combination of lower activity and late reporting. It takes about 3 months to get all of the data. Not sure why.
Table
Ovi,
Texas reporting is fairly slow, probably Texas data is only good through October, the NM may be better may be pretty good through December. The Frac focus data is likely based on what the States report.
Dennis
I think Frac Focus is a private company that surveys the biggest frackers. On the other hand the chemicals used has to be supplied to the government. Not sure where the government data can be accessed.
Frac Focus for a while would publish a report on You Tube. It then announced it would be a paid subscription.
Found this statement in the article below.
“A 2005 law bans the federal government from requiring disclosure of the composition of fracking fluids. However, 26 states issue disclosures through FracFocus, the Ground Water Protection Council’s national fracking chemical registry.”
https://thehill.com/policy/energy-environment/3855934-states-with-fracking-disclosure-rules-have-higher-water-quality-study/#:~:text=However, 26 states issue disclosures,the same requirement in 2023.
Thanks Ovi,
Note that TX and NM are among those 26 states, so the reporting is a state requirement and is likely reported to the State oil and gas agency for each state. Then the Frac Focus registry pulls the data from the state agencies, just as it takes nearly 12 months for Texas production data to be complete, the same may be true for Frac focus data for Texas. Note that the frac spread count from Primary vision may be based on satellite data so a different methodology is used that does not depend on state oil and gas agencies. Looked at Primary Vision website, and it is not very clear what their methodology is.
For 2022 the annual rate of increase for Permian region output was about 750 kb/d using OLS trend line, for 2023 the annual rate of increase fell to 350 kb/d for Permian region output. For my best guess model (URR=47 Gb) the annual rate of increase for Permian tight oil in 2024 is about 124 kb/d. Peak is 5800 kb/d in 2026, I assume a constant completion rate of 478 wells per month up to October 2032 with productivity (new well EUR) decreasing at at annual rate of 3.65% starting in Jan 2023.
Dennis
I think that 125 kbd is about the upper limit. It’s a good model.
Thanks Ovi,
My guess is there is a 50/50 chance it could be higher or lower. I would put the probability at 75% that the increase will be between 75 and 300 kbpd for the annual OLS trend from Jan 2024 to Dec 2024.
In the past I have tended to guess too low.
Last year around this time I claimed that 2023 output for tight oil would increase by about 350 kbpd, I was over a factor of 2 too low. Perhaps this year my guess will be too high, we will revisit in 12 months.
Correction
I remembered incorrectly what my best guess scenario was from about a year ago, it was about a 414 kb/d annual increase in US tight oil output using the OLS trend in the scenario from Jan 2023 to December 2023. So I was too low by a bit less than a factor of 2. My prediction from a year ago for 2024 was an annual increase (OLS) of about 279 kb/d and the slope of the two year trend (Jan 2023 to Dec 2024) was about 343 kb/d. Note that US tight oil output rose about 740 kb/d in 2023, equivalent to the 2 year increase I guesses 13 months ago. So if the forecast from a year ago were accurate we should expect flat to declining output in 2024. My best guess scenario currently has the rate of increase in tight oil output dropping sharply from 740 lb/d in 2023 to 124 kb/d in 2024, roughly a factor of 6 lower for the annual increase in tight oil output (using OLS trend on Jan 2024 to Dec 2024 model estimate).
Dennis,
where is the 740 kbd figure from?
NOVI just posted it was 592 kbd. https://twitter.com/tedcross/status/1764653093050892740
You did very well, I think.
Kdimitrov,
It is the rate of increase for the DPR, which seems to track state output from TX and NM and I am assuming it does fairly well for other states as well through December 2023. I also assume the conventional output from the tight oil regions has been relatively constant in 2023, so the estimate is based on a number of assumptions which may be incorrect. Note that Novi labs uses state data and might not be correcting for incomplete data from state agencies. Or my estimate is wrong. Novi labs certainly has better access to the full state data set than I do as well as a set of data scientists that can interprest that set of data quite well. Thus the 592 kb/d may be the better estimate.
Also note that for the Permian Basin alone my estimate is about a 351 kb/d annual rate of increase in 2023, so the 740 kb/d estimate seems a bit high as this suggests the non-Permian shale regions had an annual increase of 389 kb/d, the Novi labs estimate is very likely more accurate.
Thanks for sharing this.
Guys, I don’t want to appear to be the harbinger of doom, or the naysayer of nicely done models of future oil production. I just don’t trust them, for many reasons. But to illustrate my skepticism on the bright side (for a change), I’ll paint a picture of what I see as an interesting possibility.
The world is changing, and the Permian basin is going to change a lot too. It’s in a jam right now (which I’ve tried to show), but what the whole world is convinced of is hydrocarbon-induced global warming, and they want it fixed. Only problem is, that takes time, and in the interim the world needs more oil and gas.
The Permian will possess the world’s largest collection of long holes in the deep earth, with tens of thousands of them stalled out in the production of oil. If carbon capture can be scaled, the CO2 will need to be placed somewhere. Voila!
If CO2 is injected forcefully down horizontal wells in terminal decline, there is almost certainly going to be a transient period of enhanced oil recovery from some of those wells. I imagine there will be some duds, but also some corkers. And then, when that phase is over, they will turn into final resting places for CO2.
At least that is the dream of Ms. Hollub, and it has certainly caught the attention of a certain nonagenarian in Omaha. This may be the silver lining. I don’t know, but it’s going to be fascinating to watch.
Gerry,
My assumptions about future completion rates are likely wrong.
I could create any scenario, I have shown what it looks like if no new wells are completed. I could have completion rate decrease by 1, 2, 5, 10 or any number you choose per month. Do you have a guess as to what might be realistic in your view?
Gerry may not want venture a guess but if there are any guesses out there let me know.
I see that Baytex has just taken more than 800 million dollar writedown of their reserves, mostly in the Eagle Ford.
I wonder how long they have been sitting on that knowledge.
Old Chemist.
That is why they bought Ranger oil to try to mask that and make it look smaller. Then there is another little nasty issue of the Cdn government going after them for Cdn$250 M of taxes. I understand they have bought some insurance for that.
“We remain confident that the tax filings of the affected entities are correct and will defend our tax filing positions. We have also purchased $272.5 million of insurance coverage for a premium of $50.3 million which will help manage the litigation risk associated with this matter. The most recent reassessments issued by the CRA assert taxes owing by the trusts of $244.8 million, late payment interest of $166.6 million as at the date of reassessments and a late filing penalty in respect of the 2011 tax year of $4.1 million.”
I don’t remember exactly how they said it, but they were trying to link it with the Enginering analysis of the Rageing river deal. I’m not sure they convinced me, but it sounds like they didn’t convince you either.
Dennis,
I asked up in the comments but you probably didn’t see it: what is the base decay function that you use?
Kdimitrov,
Answered in comments above, see
https://peakoilbarrel.com/short-term-energy-outlook-and-tight-oil-update-february-2024/#comment-771435
Got it. Thank you, Dennis, sounds very elaborate.
Kdimitrov,
The best guess scenario is below, you can create the other scenarios in the scenario sheet by changing column B in the EUR decrease sheet and then copying and pasting column B3:B249 into the output sheet N3:IZ3 (use paste special transpose number) and similarly paste column C3:C249 into output sheet N5:IZ5 (again transposing using paste special). You can also change the annual EUR decrease rate assumption in EUR decrease sheet cell E1. Link to spreadsheet below.
https://peakoilbarrel.com/wp-content/uploads/2024/03/permian-model-bigx3.xlsx
Also you can create any scenario that seems useful or realistic to you.
Gerry,
The following scenarios all assume at a 500 well completion rate that the annual decrease in EUR is about 3.65% per year. The annual rate of decrease changes as the completion rate changes (so a 250 well completion rate would result in about half of the rate of decrease in new well EUR as the 500 well rate of completion). In all but one of the scenarios below the monthly completion rate falls starting in Jan 2024, by 1 well per month, 2 wells/mo, 5 wells/mo and 10 wells/mo. A scenario with a steady completion rate of 478 wells per month until December 2038 followed by a 10 well per month decrease is presented for comparison. Of course with higher oil and natural gas and NGL prices we could also see an increase in the completion rate so these scenarios are by no means the upper limit of possible peak production if problems in the Permian basin (water, natural gas, pipelines, earthquakes, etc) are overcome, under a very rosy scenario URR might be as high as 80 Gb, but my guess is about 50 Gb as a best guess given constraints. So for me the no well decrease scenario would be the F50 scenario with the 10 well per month decrease scenario being an F99 scenario (99% probability that the output path would be higher than that scenario.)
Looks like you’ve got it covered, Dennis. I don’t have a clue. Exxon has other major projects and clearly knows the only way to “solve the mess” in the Permian is to slow down. All the others–I dunno.
There are too many moving parts for me to analyze. The Permian basin is going to be the predominant oil production basin in the United States until the end of oil usage.
It would be a breath of fresh air for activity to slow down. Like you say, it seems that recoverable water for new fracking could be obtained from the saltiest water. It’s not like Texas doesn’t know how to handle this; the “frenzy factor” has simply overwhelmed them in the moment. Part of that had to do with a deluge of warnings from every government that the end of oil and gas demand was almost upon us.
Soon the pendulum will swing, and world demand will likely outstrip supply. War is certainly possible, with all the hot spots and tensions ratcheting up. In such a world, just about anything is possible in the Permian, and all other basins. And that doesn’t even take in consideration a possible regime change: a Rebel yell to drill, baby, drill would be disastrous. But so would electing an 81-year-old gentleman. And I’m not being political.
Gerry,
Thanks I also have no clue. Not clear a 78 year old would be much better, of the two Trump looks like he is a couple hamburgers away from a heart attack. I would consider both VP candidates carefully as they may become president.
Age is not a just a Biden issue; it is a Biden and a Trump issue. Fundamental unfitness to lead a democracy is a Trump issue. The comparative importance of these two issues would be clear in a functioning multiparty (more than 2) representative democracy.
A presidential administration is not just one man. It’s his cabinet, his advisors, the people he appoints, and the influence he’s acquired from fifty years in politics.
Biden is a statesman and shrewd politician. If he keels over in his second term well, that’s what you have a VP for.
Dennis – FWIW, 25-35 Gb looks like a reasonable estimate that would follow a decline rate of 10-15%. This doesn’t seem unreasonable for shale…
To me, 40-50 seems too high and less than 25 seems unrealistic as well.
So I’d call 30 Gb a very good estimate. Which is pretty close to the yellow line.
Kengeo,
That decline rate only occurs if operators decide to slow down the rate that they complete wells, most are saying they plan to hold steady or increase output by 5% per year or so, that guidance is more in line with the 49 Gb scenario. Also note that the USGS F95 TRR estimate is about 45 Gb, 50 Gb is the TRR estimate if we assume the less productive benches of the Permian are not developed, the mean USGS TRR estimate is 75 Gb for the Permian basin, if we assume only 67% of that TRR is economically recoverable we arrive at 50 Gb. Also note that if no new wells are drilled in the future (after December 2023) the URR would be 18 Gb. If we add cumulative production and 2P reserves at the end of 2021 we get about a 34 Gb URR estimate, it seems likely that 2P reserves will continue to grow for a few more years. We would need 15 Gb of increase to get to a URR of 49 Gb, in 2021 2P reserves for the Permian basin increased by about 6.4 Gb so 2.5 years of this rate of increase would get us to 49 Gb. The assumption that 2P reserves (after accounting for produced oil) always either decrease or remain the same is the reason many have underestimated future production. Some people learn from their errors.
Note that if we assume future oil prices are very low, then a 30 to 35 Gb estimate might be reasonable, but I expect demand won’t fall below the level of supply at current price levels until after 2030, even in an optimistic transition to electric transport scenario. If oil and natural gas price rise as some seem to assume, then output may well be higher than 49 Gb, perhaps as high as 60 Gb, if the mean TRR is correct and higher still if the mean USGS TRR estimate proves low (the F5 TRR estimate is about 110 Gb for the Permian).
Dennis – Understood, when I calculate tight oil vs Non-tight oil I get following:
Total 2PCX: 190 Gb
Non-tight oil: 160 Gb
Tight oil: 30 Gb
This is rough order, expect there’s some error of 5-10%…
Kengeo,
That is probably an underestimate for US tight oil 2PCX, a better value would be about 56 Gb for US tight oil.
Dennis – Might be, here’s an interesting chart from Goerhring & Rosenscwajg (G&R).
They place peak in next 7-8 month timeframe…the way production is stalled out seems like that might not be that far-fetched. Can you confirm that total permian tight oil production is approaching 15 Gb?
Kengeo,
As of December 2023 cumulative tight oil output from the Permian basin is about 12 Gb, note that the Drilling Productivity report includes all output from the Permian region (both tight oil and conventional oil). Use tight oil output from page linked below.
https://www.eia.gov/petroleum/data.php#crude
Kengeo,
On further thought and with suggestions by DCLonghorn, it may be that 40 Gb is pretty reasonable to me, I still think 30 Gb may be too low unless prices remain depressed, perhaps the average of what we think will prove correct (around 35 Gb which is too high for your taste and too low for mine).
So maybe 30 to 40 Gb may be in the ball park for Permian URR. My expectation is that prices for liquids and natural gas will rise, by how much is unknown.
Dennis – All we can do is make educated guesses, 30-ish seems pretty reasonable, 20 seems too low and 40-50 possibly on the high side…I like your 28 Gb best…
Kengeo,
Note that the 28 Gb scenario needs low oil, NGL and natural gas prices, I believe your expectation is for higher energy prices, if you are correct about prices, then the 40 Gb scenario at comment below is a more reasonable Permian Basin scenario.
https://peakoilbarrel.com/short-term-energy-outlook-and-tight-oil-update-february-2024/#comment-771640
China boasts bubbling crude discovery – oil that is, 107 million tonnes – in Henan province, adding fuel to energy-security drive
Sounds more like a small find
https://www.scmp.com/economy/china-economy/article/3250189/china-boasts-bubbling-crude-discovery-oil-107-million-tonnes-henan-province-adding-fuel-energy
yes, it is quite small, that’s 107million tonnes in place underground, recoverable probably only 20%.
Drilling in China still is a fraction of US, especially province like Henan, where there is limited past discoveries.
Out in the Bohai Bay, which is like GOM in the US, which contribute to 20% of total oil production, drilling is quite limited considering the water depth is only 10~20meters. The deepest wells in the Bohai Bay including onshore blocks is limited to 6km, and very few ever touch 7km.
According to deposition and maturity, this Bohai bay has rocks like the Brazil Presalt, and many more oils could be found in deeper wells.
Outside in the Yellow Sea, although no oil were found, China only drilled a third of the test wells North Korea did.
Devon leans toward the future, and it does not involve nuclear reactors-
‘Fervo Energy announced that it has raised $244 million in new funding led by Devon Energy, meant to enable Fervo’s next phase of growth, deploying technology adapted from the oil and gas industry at scale.’
‘“Fervo’s approach to geothermal development leverages leading-edge subsurface, drilling, and completions expertise and techniques Devon has been honing for decades,” said David Harris, Chief Corporate Development Officer and Executive Vice President at Devon. “We look forward to deepening our partnership with Fervo to capture the full value of Fervo’s first-mover advantage in geothermal and the adjacencies to Devon’s core business.”
“Demand for around-the-clock clean energy has never been higher, and next-generation geothermal is uniquely positioned to meet this demand,” said Tim Latimer, Fervo CEO and Co-Founder. “Our technology is fully derisked, our pricing is already competitive, and our resource pipeline is vast. This investment enables Fervo to continue to position geothermal at the heart of 24/7 carbon-free energy production.”
My sense is that the chances for this to be a successful, widespread and large scale baseload electricity supply source is high… a compliment to whatever else we can muster. A story well worth watching.
https://www.renewableenergyworld.com/baseload/geothermal/fervo-energy-raises-244m-for-geothermal-deployment/
A minor revision to my Permian best guess scenario with the well profile revised to reflect the latest data for the average 2020 Permian well (with a very similar profile to the average 2022 Permian well). URR is 50 Gb, constant completion rate at 478 new wells per month, EUR of new wells decreases at 3.65 % per year at 500 well completion rate starting in Jan 2023. The annual rate of new well EUR decrease varies depending on completion rate (higher at higher completion rate and lower at lower completion rate.) At 478 new wells per month (from Jan 2024 to Dec 2038) the annual rate of EUR decrease is 3.49% per year. The output peaks in Jan 2027 at 5830 kb/d and a total of 131 thousand total horizontal tight oil wells are completed for the 50 Gb scenario, about 46.5 thousand wells have already been completed through December 2023. The likelihood this scenario is correct is nil.
Output increases at an annual rate of about 101 kb/d over the Jan 2024 to Dec 2025 period. For Jan 2024 to Dec 2024 the annual rate of increase is about 129 kb/d and in 2025 about 73 kb/d for this scenario.
Dennis
This is a gutsy forecast. I hope you can put this forecast somewhere so we can revisit it six months from now. I still think it is optimistic or at the high end.
Regardless nice work.
Ovi,
Thanks, if oil natural gas and NGL prices remain at current levels I agree this may be too optimistic, as I said earlier to Mr Shellman, if we assume prices do not rise, then we probably see a short term peak between April 2024 (if the completion rate falls by 5 wells per month) to September 2024 (under the asumption that the completion rate falls by 2 wells per month). The scenario presented assumes a constant completion rate at 478 new wells per month in the Permian basin with new well EUR decreasing at an annual rate of 3.5%, bith of those assumptions are likely to be incorrect.
Ovi,
Spreadsheet with updated well profile at link below
https://peakoilbarrel.com/wp-content/uploads/2024/03/permian-model-bigx4.ods
Anyone can play with this model by adjusting the wells completed to their liking after Dec 2022 there are two well rows the bottom row is wells adjusted for decreased EUR, so if a well has half the EUR of the original 2022 well we consider that as 0.5 wells. That is done in the EUR decrease sheet. Then copy and paste the two columns of one sheet into the appropriate rows of the output sheet. The scenario sheet has not been updated, it is older scenarios from the previous model with a slightly different well profile.
Ovi – Dennis has an extreme bias towards the high-end of any estimates, not sure why exactly (may be at least partially because he’s been on the low-side in the past so he’s overcompensating). I think he does a great job making estimates that cover a range of scenarios, but I do feel he is naturally biased high by ~10-15%…
Kengeo,
We will see, depends in part on future oil, NG, and NGL prices.
See comment linked below for a scenario that considers output for Permian tight oil with an assumption of no increase in future prices from today’s level (in real 2023 US$).
https://peakoilbarrel.com/short-term-energy-outlook-and-tight-oil-update-february-2024/#comment-771581
Also note that some expect oil markets will be tight (as in the report you cite below in comments) which would tend to imply rising oil prices. If that occurs my 50 Gb Permian tight oil scenario might be the better guess of the future, reality might be somewhere between the 27 Gb and 50 Gb scenario with perhaps a slight rise in oil prices, maybe 38 to 39 Gb might be right, impossible to predict future oil prices, NGL prices, and NG prices, all of which feed in to Permian tight oil profitability.
Dennis –
I’m not really sure how much it depends on price, we are seeing higher production under a relatively low price environment. Right now you could argue that prices would be an even lower environment if it weren’t for OPEC pulling several million BOPD off the table.
I do think prices have to go up but I don’t think pricing has that much to do with production (the oil is needed regardless of price), price is just a lever that gets pulled when demand is too high…but I don’t see how price would determine whether oil is extracted or not (we know people want/need to eat and consume so 30 Gb tight oil locked in the ground seems unlikely).
There is some flow of oil that gets produced regardless of the price (unless it’s a Covid situation – but even that only reduced demand by ~25%), price (high) only incentivizes producers to increase the rate as much as they can….
I think it’s been discussed here how once a project/well is going it’s hard to shutdown even if price isn’t where you want it (there are bills/people/workers to pay afterall)….
Kengeo,
For tight oil the well rate of decline so continued drilling is necessary just to keep output flat, what changes with price is the number of new wells drilled each month, higher prices lead to higher profit and more incentive to increase the rate that new wells are completed, low prices have the reverse effect. There is also a lag between changes in prices and the effect on output roughly 6 months between the start of drilling a well and first flow of oil from the well, so this tends to confound the analysis.
Listen to the oil men (LTO Survivor). He says he would not drill a new well in the current price environment, but might consider it with oil prices over $100/bo. The price matters more than you seem to imagine, note that natural gas and NGL prices also are important as all three of these products are produced by the average Permian basin well.
I agree wells are not shut down, low prices simply reduce the rate that new wells are drilled and completed. That is what my scenarios for the Permian are all about. The scenarios are: no change in rate that new wells start flowing, a decrease in this rate by 1 well per month, 2 wells per month, 5 wells per month, and 10 wells per month from an initial rate in December 2023 of 478 wells per month starting to flow.
In the US, where 90% plus percent of hypothetical worldwide reserve “replacement” has occurred over the past eight years, where producing oil and natural gas is a business, mandated by profit and in the complete hands of private enterprise, who then pays for it all this necessary oil for people to eat if prices don’t matter?
This comment is how the US shale oil phenomena has totally messed with peoples heads. It has never been profitable to extract, still isn’t as a resource play, but because its BEEN produced it will continue to BE produced. How? With whose money?
It is very clear that from 2009 to current time something in the order of $400 plus billion dollars of CAPEX has been incinerated, with no return whatsoever, shareholder value has been flushed down the toilet, $150 B of upstream shale oil bankruptices have occured and another $200 B of bankruptcies have occured from services suppling bankrupted upstream companies. Its probably more like $600 B… and still in the red. Getting worse, actually.
What? Do you think the US is made of money and we can keep printing it, at will, just so Darren Woods can make $36MM a year in salary and we can keep the Netherlands as an ally?
This is where I totally don’t get internet experts focused on nothing but… data. This comment is right up there with 450K BO EUR’s equalling $35 MM dollars, thats plenty of money so they’ll keep drilling. Or the new one I am hearing these days…APP Basin natural gas being talked about in BOE terms, as though natgas actually has some value to society as a transport fuel? Those APP Basin guys would run over their own grandmothers in a pickup to get to an LNG export terminal.
I’m sorry, I guess I did not realize how dumb people were about making money and staying in business. Thats actually dumb of me; I just heard the biggest Non-GAPP SOTUS in American history. I should know better.
Price is very important – as important as geology and political stability.
Even in state owned oil companies – here the price goes indirect. When formal prices are too low, the oil get’s wasted and too much state effort goes into producing, lowering overall wealth (at some times you get queues on everyday goods or nothing at all). In countries living from oil export (Hello OPEC) oil price dictates state finances – and at low price the oil minister may not spend billions to invest in new fields when the oil price is so low that even the king can’t buy new fighter jets and private jets anymore.
There is no free lunch, even in communistic command economies (and especially there).
I’d like discussion over price more here, since it is that important. The oil world is an completely other at 50, 70 or 100+$ / barrel.
And no, oil will not be produced at any prices just because it is needed. At low prices existing oil wells will be continues to pumped (mostly), but investing will dry out at rapid speed. Hello decline.
If it stays low artificially, it will be like in socialist countries in the 80s: Gas price is low, but you get no gas when you want, only when there is some.
For the oil price: At the moment it is at an interesting point in the chart, it’s a hard bull/bear battle.
Bulls in the financial press still calculate with an US production grow like in 23 of much more than 1mbpd, and a surpressed china growth. Houthi shooting practice and gulf problems are seen as distraction.
Bears hint we are in a deficit already now, and US production will be essential flat this year.
A lot of this will play out the next weeks – I expect bigger movements the next time.
Price is low due to Japan, Germany, UK, China, New Zealand and others being in a recession.
Banks globally are going to take a hit to their balance sheets due to CRE loans because it’s not just US banks that are exposed to the issue. It’s actually hard to find a major economy in which the banks don’t have a huge amount of underwater collateral on their balance sheets because central banks hiked interest rates and currently don’t have the political cover to cut interest rates to fix the problem because inflation has been the issue.
Buckle up because by the time central banks do finally cut rates it will be far too little too late and we will be in a crisis instead of recession by that point.
The money curves aren’t wrong. They can just take longer to play out than everyone thinks.
If prices go low enough OPEC will be forced to end their production cuts which will send prices even lower. OPEC has to have revenues in order to support their economies. Cuts will likely be abandoned as revenue falls.
And of course revenues fall as the world goes into crisis due to underwater collateral.
I don’t buy it.
There is enough money on the market. The USA is issuing additional collateral (= new debt) as there is no new morning.
There is enough money to shoot Bitcoin and NVidia and Tech into the stratosphere – and for example in India the economy is growing strong. Not doom everywhere.
Financial construct is getting more complex everywhere, that’s normal.
And the oil market is small compared to these financial rivers – 3 trillion a year, and much of it is consumed internally not hitting any market.
It’s US CTAs that are betting bull and bear to make the price – and this is on margin at the future market, so they need even less money. A fistful of billions are enough to move the oil price from here to there.
NVidia alone is trading almost 50 billion $ a day – this market is bigger than the oil market. Brent future market is 100 million barrel , 8 billion $ a day. Only rough numbers, only to compare the size.
The collateral I was referring to isn’t treasury debt. It’s the actual property that backs the loans on CRE.
Only way to make the banks whole is get interest rates back to zero and do it fast before the ship sinks.
There will however be hoarding of treasury debt collateral as the CRE ship sinks and everyone runs to safety and liquidity.
It’s not the amount of money or collateral that’s is the problem. It’s the circulation of money, collateral, credit that will be the issue.
You can bailout banks and save deposits but that doesn’t mean the banks will be in position to circulate the money.
US Production Since October
Production has been flat since October on both a monthly and weekly basis. Production dropped by 100 kb/d last week. Last time that happened was the last week in December and the first week in January when production dropped to 13,100 kb/d.
I know the weekly data is not as reliable as the PSM, however it has been pretty good since October. The huge drop to 12,300 is due to severe weather in the US central states.
Ovi – Just came across this corrected/adjusted graph from G&R…not sure what to make of it…published 2 weeks ago…https://www.gorozen.com/commentaries/4q2023
Kengeo,
Interesting report, thanks for sharing.
They are leaning on the Adjustment factor, too. Their estimates for 2023 LTO growth is ~ 500 kbd YoY, compared to NOVI’s estimate of 590 kbd YoY and EIA’s > $700 kbd YoY
I’d probably take NOVI’s number as the most accurate…
Kdmitrov,
The EIA monthly data is usually pretty good, for Jan 2023 to Dec 2023 the EIA monthly data based on an OLS trend through 12 months of data is 944 kb/d for US C plus C and 869 kb/d for US L48 excluding GOM and an 891 kb/d annual rate of increase for the past 24 months for L48 excl GOM. The 750 kb/d annual rate of increase in 2023 for tight oil output based on DPR data may be a pretty good estimate.
Kangeo
Thanks for the link. Interesting that they question the EIA production numbers. I found this comment interesting.
“If our analysis is correct, total US crude production may begin to decline sequentially as soon as the second quarter. By the end of 2023??, production may be lower by nearly 1 m b/d. US crude production could fall by 470,000 b/d for the entire year compared to 2023. Although NGLs will likely grow, we do not expect it will be enough to offset crude declines. Total US liquids production (including NGLs) could average 19.3 m b/d this year, unchanged from 2023.
I think the Bold 2023 is meant to be 2024. Also I don’t think crude production will be down by 470 kb/d. That is a bit much. Maybe 200 kb/d.
Ovi have you changed your expectation for oil prices in 2024?
I think drawing a parabola through a data set is a very poor way of predicting the future and that looks like what has been done in that chart by G & R. The EIA data is fine, no need for “adjustment” to fit one’s narrative.
Ovi,
If we look at the weekly average for Jan 2021 to Dec 2023 and compare with the monthly average we get
weekly average=12,250 kb/d
monthly average=12,419 kb/d
Mostly the weekly data is terrible imho.
Looking at the trends using OLS we find over this two year period (Jan 2022 to Dec 2023) the weekly data had an annual rate of increase of about 726 kb/d and the monthly data had an annual rate of increase of about 1016 kb/d.
Globally Japan finances more oil, gas and coal infrastructure than any other country in the world.
If the Yen starts strengthening. Which most of the charts are pointing to a strengthening Yen coming. It’s going to suck those financing dollars back home to Japan.
Leaving a hole in global fossil fuel finance. Something to keep in mind.
“Before the end of this decade, India is set to become the single biggest driver of global oil demand, replacing China, analysts and forecasters say.
India’s economy has grown at a robust pace over the past year. Meanwhile, growth in other major economies—including China—has sputtered. High GDP growth, industrialization, urbanization, and a rising number of middle class in India are all expected to shift the key oil demand growth driver from China onto India.”
A comment by Enbridge chief executive officer Greg Ebel
“Enbridge bought Ingleside three years ago, but it has exceeded the company’s expectations. Much of the product that lands there comes from the Permian basin, which straddles western Texas and southeastern New Mexico. Mr. Ebel called it “one of the most competitive basins on the planet,” and expects production to grow by a couple of million barrels per day by the end of the decade.”
Obviously he doesn’t visit POB
https://www.theglobeandmail.com/business/article-enbridge-to-invest-500m-in-pipeline-business/
if the mid-stream (Enbridge) is not optimized, e.g. the value of NGL is not fully realized, then the Permian’s profit margin will further shrink. And to minimize rail based expensive and dangerous mid-stream…
Hi Dennis. I was trying to understand the model you have for the Permian above. One graph has each periods EUR’s starting with an annual decline rate of 3.5% and declining to no decline after a few years. At least, that’s how I’m understanding it.
Instead, wouldn’t it make more sense to just leave it around 3.5 % for say 5 maybe 10 years, they should be running out of mostly undrilled drilling units somewhere around there. After that its likely they pick the bones clean pretty quick and the decline rate in the EUR’s should be parabolic up and to the right, (I think).
DCLonghorn,
The EUR annual rate of decrease reflects average new well productivity becoming lower as more drilling occurs in non-core areas. It is a guess and may in fact increase rather than remain constant. Note that the constant rate occurs only if the completion rate remains constant. So if we are completing 5700 new wells per year and the annual rate of decrease in new well EUR is 3.5%, the model has the rate falling to about 1.75% if the completion rate falls to 2850 new wells per year. So I have created a scenario with a constant completion rate or 478 new wells flowing each month from Jan 2024 to December 2031(8 years), with completion rates falling after that time. It is assumed the oil, NGL, and natural gas prices rise enough over this period to allow the lower productivity wells to be profitable on average, after 2031 it is assumed that prices do not rise enough to keep the average well profitable enough to induce the same rate of completion and completion rate falls in the scenario (a total guess as it is impossible to anticipate the dynamics of the market). The chart below shows the average well productivity (or EUR) relative to the average 2022 Permian well for the scenario.
DClonghorn,
Scenario associated with chart above shown below, number of first flow wells each month shown on right axis.
An alternative scenario with first flow wells remaining constant for 5 years rather than 8 years.
DCLonghorn,
Annual rate of decrease in New well EUR for first scenario above in chart below.
DCLonghorn,
corrected scale for first chart, sorry.
Thank you much for this suggested scenario.
Note that I only believe this might occur if oil, NGL, and NG prices rise enough to make these lower productivity wells profitable, if prices remain where they are in real terms, my expectation is that the completion rate will continue to fall (as it has been doing during 2023) going forward and perhaps at slightly higher rates as productivity continues to decrease over time.
Great work Dennis! Appreciate you taking a look at that.
I continue to be amazed by how effective the oil and gas industry has become at removing bits of oil and gas which were locked among chunks of mud and sand thousands of feet below surface. I am sure the industry will come up with many innovations to get more out of less, but depletion always wins eventually.
Nate Hagens has a very well done video on youtube just out. Peak Oil, AI and the Straw:
https://www.youtube.com/watch?v=mxqxq4sUfh8
The December US update has been posted.
https://peakoilbarrel.com/us-december-oil-production-flat/
A new Open Thread Non-Petroleum has been posted.
https://peakoilbarrel.com/open-thread-non-petroleum-march-8-2024/