GoM Reserve Revisions for 2019

A Guest Post by George Kaplan

Overview

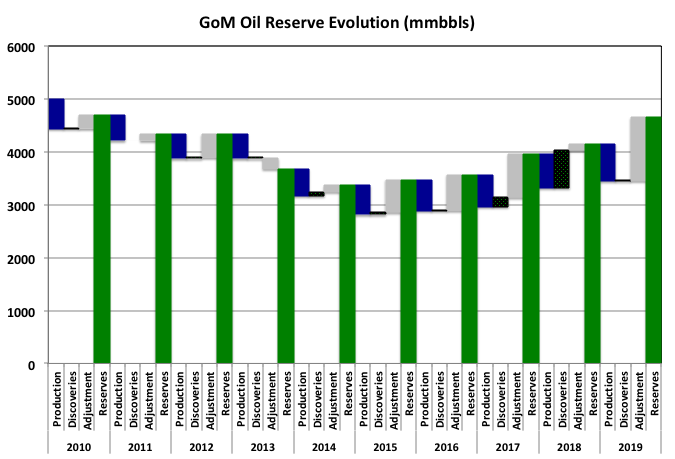
For 2019 BOEM showed a large increase in remaining reserves of 1.3Gboe,  91% of it oil, from newly discovered oil with Appomattox/Vicksburg and Vito the largest contributors at over 400mmboe each, followed by Buckskin and Kaikias, which are fairly large multi-well tie-backs, and smaller, one or two well  tie-backs of Blue Wing Olive, Constellation, Claibourne, Red Zinger and Stonefly. These discoveries were made with exploration wells between 2006 and 2016 but were only counted as reserves once firm development plans were put in place. Even given this the year in which BOEM includes the reserves is rather opaque and idiosyncratic, for example some of theses fields started production before 2018, and some developments, notably Kings Quay, are more advanced than Vito but are not included. 

Other additions came from revisions to Thunder Horse, Atlantis, Mars-Ursa and Jack/St. Malo, which had major brownfield developments. The fields were not all added as discoveries or adjustments for 2019, but were spread over 2016 to 2019. Some other discoveries under development, such as Anchor, Whale and Ballymore, or in pre-FID studies, such as North Platte and Fort Sumter, will likewise be added against their discovery years as their estimates are finalised. Several of these projects are among the first to use new 20ksi wellhead equipment and it will be interesting to see what teething troubles are experienced.
Read More

Norway Part II – Production and Wellbores

A Guest Post by George Kaplan

Annual Production

Overall Norwegian oil production peaked in 2000 but, thanks to the Johan Sverdrup discovery, it is heading for a secondary peak in the next couple of years. Phase I of the development started in 2019 and has design capacity of 440kboed (70kSm3/d) and Phase II is due in late 2022, raising the total capacity to 700kboed of which 535kbpd (85kSm3/d) is crude. The development uses predrilled wills over which the platforms are installed and tied-in, so ramp up was, for Phase I, and will be, for Phase II, rapid. To find a field this size in a mature basin (it is in the North Sea) is unusual, possibly unique so far in offshore oil developments.

For some years Troll has been the largest single oil producer, coming from horizontal oil wells exploiting the oil rim in one half of the field, but recently Troll III was started which produces from the gas cap above the rim, so oil production will now fall.

In the chart green bands are fields in the North Sea, blue-green those in the Norwegian Sea, and the couple of thin blue ones those in the Barents Sea. The 2021 values are only through July.

Read More

Norway 2021 Part 1 (of 2): Exploration, Discoveries and Reserves

A guest post by George Kaplan

Remaining Reserves

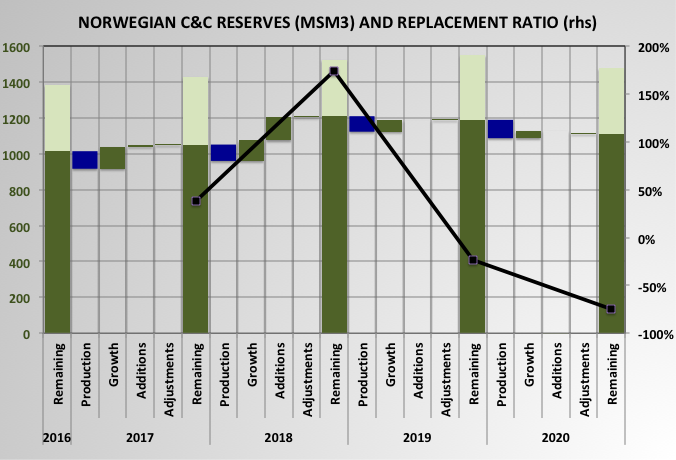
The increase in remaining C&C reserves that has been seen over the last few years, and has come mostly from growth in Johan Sverdrup, has run its course and there was a significant drop in 2020, even as production continued to climb. The reserve replacement ratio has been 38%, 174%, -24%, -75% for 2017 through 2020.

The Norwegian NPD does not use the standard proven/probable/possible categories but based on the way growth occurs the dark colours are close to a P1 reserve number (producing or in development in NPD terms) and the light colour represents a resources or a P3 value (production in clarification or production likely but not yet evaluated). Growth mostly is given by moving resources from the light areas to the dark. New discoveries are usually initially added to the resources.

Read More

Annual Reserve Revisions Part VI: Sub-Saharan OPEC Members

A guest post by George Kaplan

IOC Reserves and Production

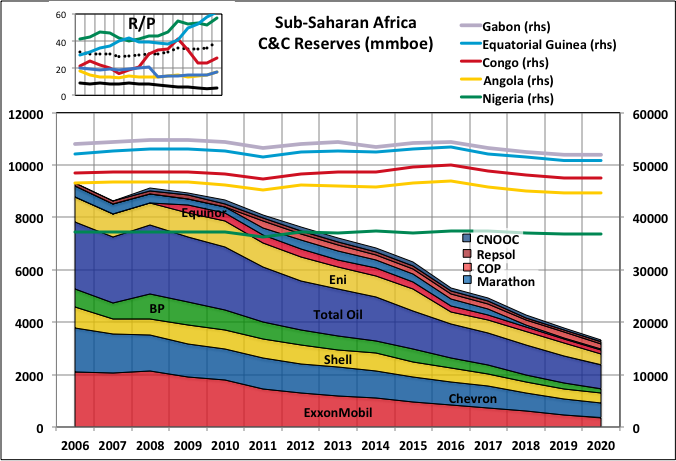
About the only place where properly audited estimates for OPEC’s claimed reserves are available is sub-Saharan Africa, principally Nigeria and Angola, but with Congo, Equatorial Guinea and Gabon as minor players. Except for some on-shore legacy production in Nigeria most of the fields are partly owned and wholly operated by western IOCs that are required to provide accurate estimates for reserves and revisions for SEC and other financial reports.

In the 10-k or 20-f reports the estimates are presented geographically with Africa seprated out and, usually, sub-Saharan Africa separated from North Africa, which is typically lumped with the Middle East (in which the IOCs now have little direct ownership in OPEC countries). 

Read More

Bakken Summary

A guest post by George Kaplan

The North Dakota area of the Bakken LTO basin has accessible data from the ND Department of Natural Resources, Oil and Gas Division. Production here seems to be past peak and in general decline. The data presented here is therefore more a historical perspective than of much interest in predicting issues that may have significant impact for the future. However it may give some indication on what to expect in the Permian basins, the only ones left in the US that may have capacity to increase production. The Texas RRC does also produce good data but a global data dump produces files that are too big for my computer to handle and splitting into smaller subsets is too man-hour intensive for me to pursue.

Production Across the Area

These charts show how the oil production has changed every three years by range (almost equivalent to lines of longitudes) and township lines (latitudes). These lines run every six miles and the area they contain is called a township, consisting of 36 square mile sections (that’s the simplified explanation, earth’s curvature and irregular land features make things a bit more complicated). 

Read More