The USA data below was taken primarily from the EIA’s Petroleum Supply Monthly while some were taken from the EIA’s Monthly Energy Review.
I have some bad news to report. The EIA no longer published World production data or Non-OPEC production data. This data had previously been published in the Monthly Energy Review.
The Monthly Energy Review’s data was one month behind the Petroleum Supply Monthly but now they jumped two months and are now one month ahead of the Petroleum Supply Monthly. They now publish the previous month’s numbers, June in this case, but now publish only US data. The Petroleum Supply Monthly is unchanged.
EDIT: The Petroleum Supply Monthly does publish some, incomplete, world data… through April or one month behind their USA data. I will use that with an explanation and comments next month.
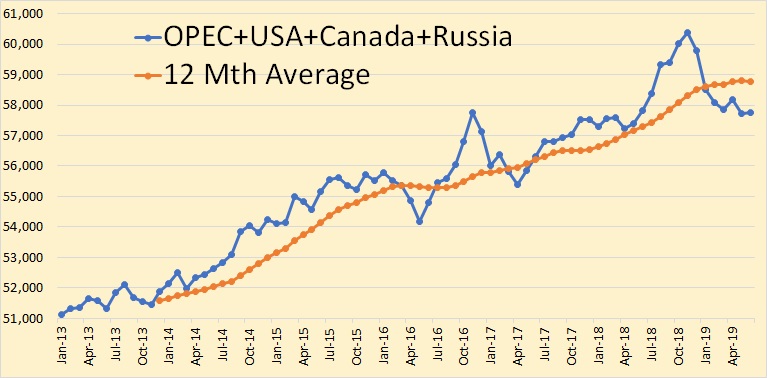
The closest I can come to World oil production, through June, is the combined production of OPEC, Russia, the USA, and Canada. This is 70% of total World Production.
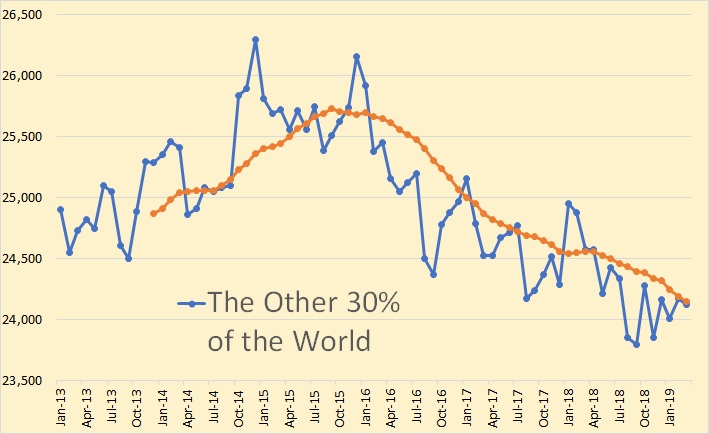
Here is the other 30% of World oil production. However, this data is only through March. Unfortunately, I can never update this chart because the EIA no longer publishes the data
This 30% of World oil production peaked in late 2015 and has declined an average of 450,000 barrels per day per year every year since.
Actually, in 2015 these countries averaged about 32% of World oil production but now averages about 29%.
I have no other source for World oil production. The IEA publishes quarterly projected data for the World and Non-OPEC. But this data is total liquids and only quarterly projections that bears little resemblance to actual C+C production.
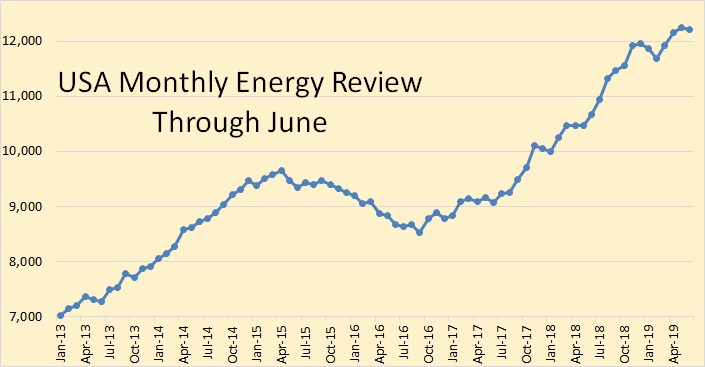
USA production according to the EIA’s Monthly Energy Review, through June 2019.
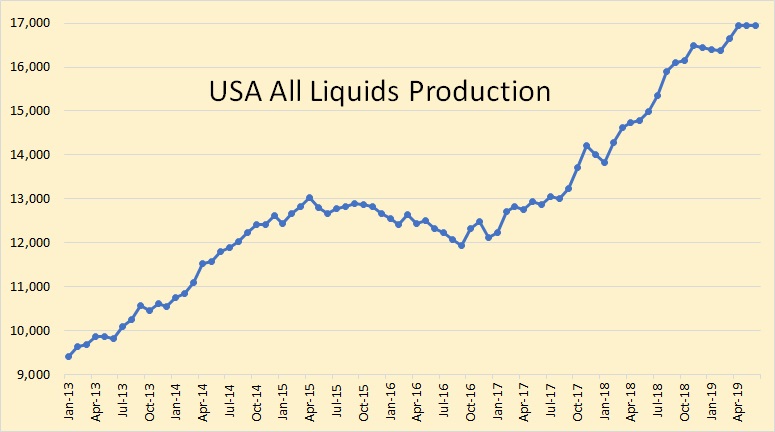
The Monthly Energy Review also produces total liquids data. This data is through June. The Monthly Energy Review is more of a guess and they eventually publish the same numbers as the Petroleum Supply Monthly.
All the below data is from the EIA’s Petroleum Supply Monthly and is through May 2019.
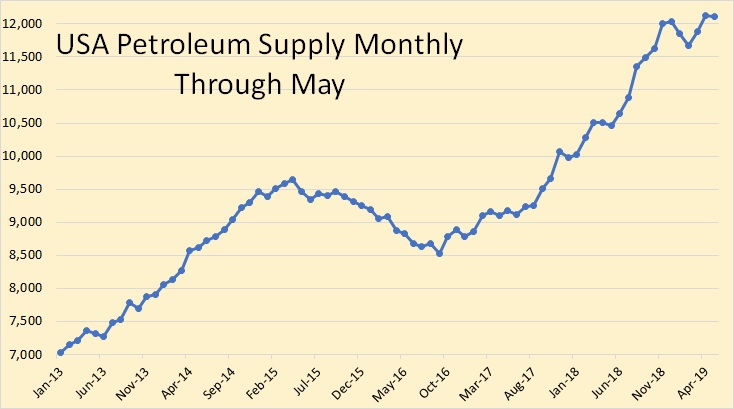
USA production was down 26,000 barrels per day in May.
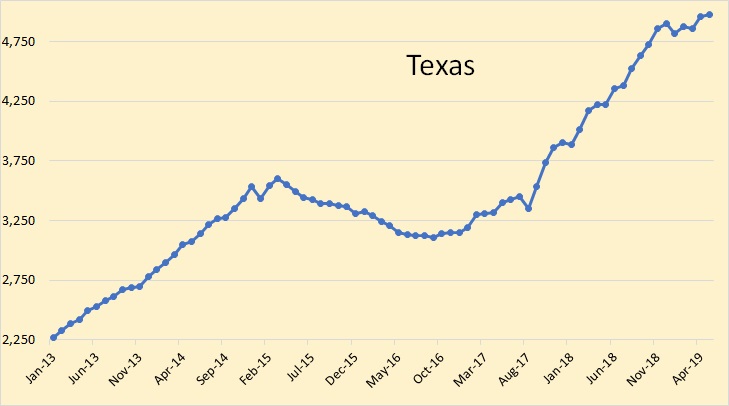
Texas oil production was up 16,000 barrels per day in May. Texas production is definitely slowing down.
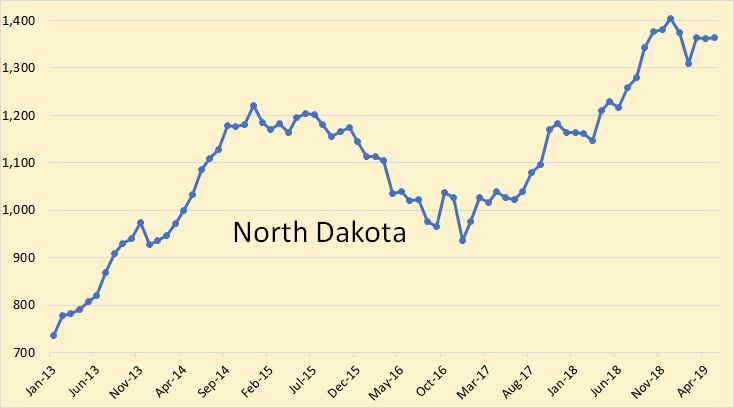
North Dakota was up a mere 3,000 bpd in May. North Dakota has definitely plateaued.
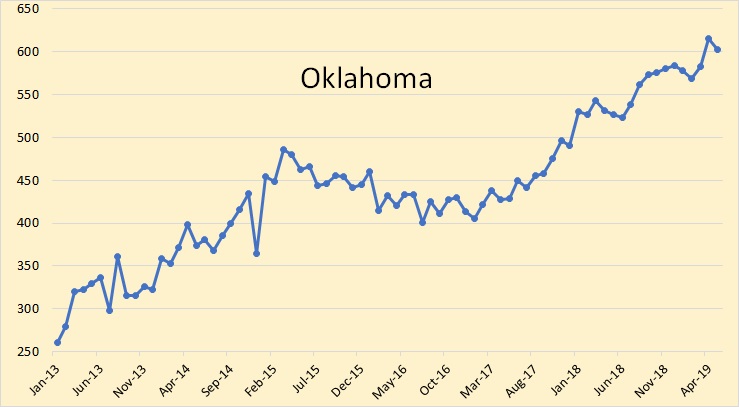
Oklahoma oil production was down 12,000 bpd in May.
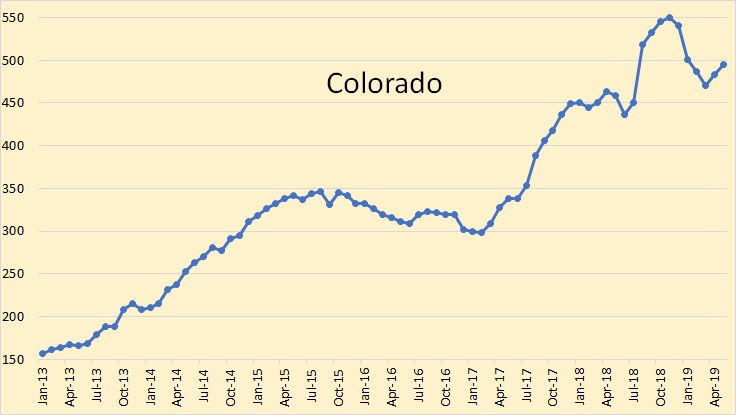
Colorado oil production was up 12,000 bpd in May.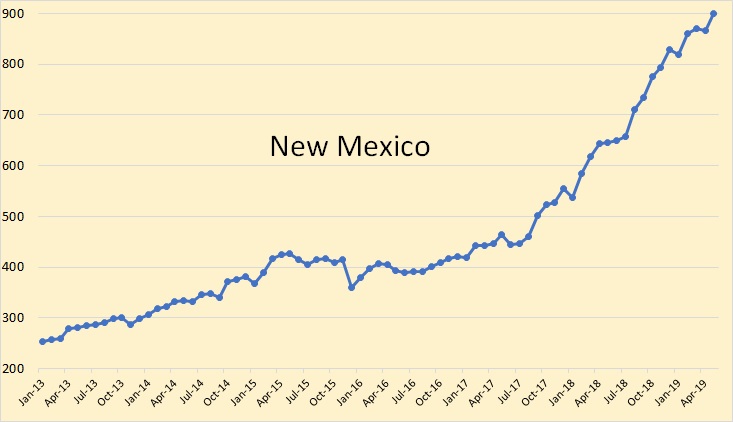
New Mexico was up 33,000 barrels per day in May and now produces 900,000 barrels per day.
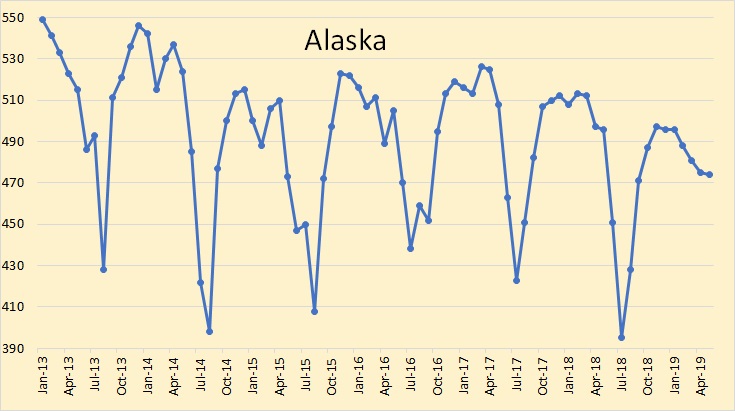
Alaska was down just 1,000 bpd in May but is down 22,000 bpd from May of 2018.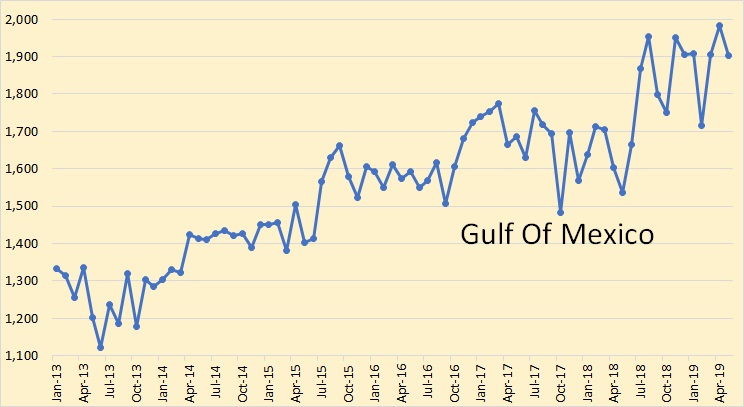
The Gulf of Mexico was down 78,000 bpd in May to 1,904 bpd.
308 responses to “USA and World Oil Production”
How is the oil production in USA without shale, without GOM, and without Alaska? Does its dynamics still follow Hubbert curve?
Alaska fits peak dynamics almost to textbook.
https://images.app.goo.gl/RCNFEYxsK4DMEyeQA
Gulf is erratic because it is multiple discreet resources rather than one field. The individuals peak and decline but the basin as a whole hasn’t. GOM is also prone to external disruptions that interfere with maximum possible production- hurricanes annually and the Deepwater Horizion moratorium.
https://images.app.goo.gl/Ztqc4s3aJTBWcT2RA
Thanks.
However, it looks like USA-Alaska-GOM-shale has stayed roughly at 2mbd for 20 years or more (found charts only since 2000). How such a long plateau is possible?
“multiple discreet resources rather than one field“ PP
My guess is cuz they just keep drilling new ones to augment the old ones, and so far it seems to keep the aggregate production from declining.
Nevertheless, it is a bit strange that so constant, I mean if that are multiple discreet sources, then it would follow that they are also of similar volume (constans meaning that they are exchangeable), and that there are MANY OF THEM. If the latter, then the drilling dynamics is very different than in shale case; there is no rush to increase production (which should be possible since sources are exchangeable and numerous), only to keep it steady.
Maybe here lies a hope for Saudis then, who are supposed to have something like multiple discreet sources in the Kuwait corner of their sandy realm.
Haven’t run out of discoveries to exploit yet; leadtime on deepwater is fairly long.
It will decline once there are inadequate new discoveries. Here is an article Ron had last year on OilPrice.
https://oilprice.com/Energy/Crude-Oil/Can-We-Expect-A-Rise-In-Gulf-Of-Mexico-Oil-Production.amp.html
But non-GOM, non-Alaska conventional oil? I have meant this conventionl production in USA. It has been around 2mbd for the last 20 years or more. Why it is not falling?
The reason it is not falling is that at least 750K wells are producing that 2 million BOPD. Many of them were completed from 1975-1985. Wells that old decline little. They are also expensive to operate, and typically small family owned companies are the only ones who can operate them efficiently.
Stripper well operators are a virtual unknown to the majority of US residents. When politicians talk about oil producers it is usually in the vein of the Darth Vader’s at ExxonMobil and Chevron. The public either thinks that, or JR Ewing.
Tons of small businesses in the lower 48 upstream industry. People from all different backgrounds. Mostly rural people. One of my best friends has been making a living for the past 20 years on about 20 net barrels a day that he pumps himself. He takes one week off a year, and took no vacation 2015-17. 7 days a week. 365 days a year for three solid years.
A $10 drop in the oil price costs him $6,000 per month.
When prices were high, he donated a lot of $$ to charity, and didn’t ask for any recognition. I found this out not from him, but third parties who are on the boards of the charities.
Not all oil producers are the devil.
2mbd is a lot, more than Norway. Maybe this is future employment for Arabs in the Gulf…. Everyone gets a stripper well to tend. Don’t know how many wells have been drilled in Saudi Arabia till now, though.
But it sounds like a lot of work for your friend…. Can’t you switch off such a well for a week or a month? I would think that it is just emptying the bucket every evening and every morning….? I mean there are no more active measures like water or gas injection, or other kind of investments? Only power for a pump?
I suggest to blog proprietors a separate post on economy of stripper wells and how long they can last… that will be a future anyway. That would be some change of subject from the shale. Also, a lot of shale will turn into stripper wells finally, no?
Some stripper wells do only pump part time. Many pump full time. Depends primarily on how much water each produces.
Many are part of a waterflood. Or produce enough water that it is not economical to truck haul produced water from the lease. So the produced water is separated from the crude oil and pumped through a pump back down injection and/or disposal wells.
Most stripper wells required a down hole chemical application to prevent corrosion to the down hole equipment.
The pumper checks all wells daily at a minimum, as well as gauges the stock tank, checks for leaks, checks belts, applies chemical treatments (weekly or Bi-weekly usually) and many other things. The pumper ultimately has much to do with the economic success or failure of the well(s).
A lot of shale wells are stripper wells already, particularly in the EFS, Permian and Niobrara. I would argue that a well that produces under 50 BOPD from a horizontal wellbore that has a TVD of 3 miles or more and a lateral of a mile or more should probably be counted as a stripper well. Technically, however, a stripper well produces under 15 BOPD for oil, under 90 MCF for gas.
For example, Enno Peters has a new EFS post today. It appears that the average 2012-2014 first production EFS well produces a little more than 20 BOPD. Given the expense those wells cost I would say they have similar, if not worse, economics as conventional stripper wells in the US.
Thanks for explanations. Now the last question:
And how long can such a well go? what is the ultimate recovery of a stripper well in relation to its pre non-stripping period recovery?
OneofEU,
It depends on a number of factors, the price of oil, water disposal cost, price of replacement pumps when there are downhole failures, there are no general rules of thumb, each well is unique from what shallow sand and Mike shellman have explained in the past.
I believe that is why they are skeptical of my simple models, there is no way it could be as simple as my models. They are of course correct the model is a simple guess.
I would say an assumption of a 4% decline in output would probably be realistic in a moderate price environment for stripper wells, but I would defer to experts who actually run these wells, when I have asked the same question in the past I got no answer. There probably is no answer to your question, or it is a well kept secret.
The Mclintock well number 1 has been producing since 1807 in Penn. There is no answer. Answer to Dennis, below. Yeah, the well was not drilled until then, but the land produced oil since 1807. Reminds me of the Clampetts. Shoot bullet, and oil comes out.
http://www.energyglobalnews.com/mcclintock-well-1-worlds-oldest-producing-oil-well/
GuyM,
I think it was 1861 when that well was drilled.
https://www.reuters.com/article/us-oil-oldest-idUSTRE77H5RP20110818
Oldest well drilled in US was in 1859 ( a different well).
I agree there is no general answer.
Fat-tail statistics rule. If the collecting region is extensive, oil can always diffuse and diffusion is fat-tail over time. This is one of those behaviors that is universal across all physical domains. Don’t even have to be an expert.
Paul,
Yes for a region I suppose that is correct, though the specifics of how much oil a set of wells will produce, will depend on the number of wells, when they are drilled, the specifics of the geology and how much oil was originally trapped by the specific geological seals that have existed over time, so I stand by the statement that there is no general rule it will depend on the specific physical characteristics of the region in question to which the physics will be applied. Kind of like a planet and moon’s physics will be determined by distances and masses of the objects involved. For oil and gas it is a bit like not knowing the masses or distances involved. In astronomy these can often be deduced, with oil and natural gas we can sometimes do this with good output data and other observations, but often finding the needed data is difficult. Knowing average well profiles and number of completions over time can get us pretty far, for 750,000 wells with unknown average well profiles and unknown completion dates, it is a bit tricky, at least for me.
Dennis,
I was just getting at the virtual impossibility of maintaining a flow for >100 years without some sort of diffusional mechanism behind it.
The next question is when the flow drops below a certain level, what to do?
Paul,
Got it. The well in Pennsylvannia is a bit unusual, most wells become uneconomic within 30 to 40 years, seems they use pumps at the tail though perhaps it is diffusion that gets the oil to the wellbore.
GuyM,
Got it now, I was unfamiliar with that history, pretty amazing.
The oldest well we operate will turn 114 later this year. We operate many that were completed 1905-1912.
We also operate several completed in the late 1950s.
The majority were completed 1975-85.
Most are producing under 1 BOPD. However, almost all are under 1,000’
A ballpark total cost would be $60-80K for one well. We would hope 30 year production would exceed 10K BO. Most drilled in the 70s-80s have, the best have almost hit 50K BO.
Hi shallow sand,
Based on EIA data in 2017 there were 351,555 oil wells that produced 15 b/d or less with average output of 2.419 b/d, of these wells 330,234 of them produced 10 b/d or less with average output per well of 1.86 b/d. Total oil wells in 2017 producing in the US was 435,460, with 81% of those wells being strippers (15 b/d of less). The 105,000 highest producing wells produced about 90% of the oil in the US.
You were probably including the gas wells also with 15 boe/d or less, there are another 434,050 of stripper gas wells for a total count of 764,284 stripper wells (both oil and natural gas) in the US.
A lot of wells for sure. Total US oil and gas wells producing at the end of 2017 was 990,677.
Dennis. I was probably including gas wells, just threw out the number from memory.
shallow sand,
I had remembered differently (350k) so I checked, then realized that you were probably including gas wells.
Of the 1975-1985 wells you have operated, what is your guess as to the average life? Many have been going for 34 to 44 years already, roughly what percentage of those vintage wells have you needed to shut in permanently? I would think some of them become uneconomic, but I am often wrong.
Thanks.
I would th
One of EU,
Before 2000 there was very little tight oil output so one could simply assume that was zero before 2000. In any case a chart from 2000 to 2019 has a trend of a 1.2% annual decline rate, quite low. No tight oil data prior to Jan 2000.
I smell a political rat. Compiling the missing world data wouldn’t cost hardly anything at all, just a few minutes of computer time for one or two people familiar with the job. This little chore is probably mostly already automated ANYWAY.
It’s just like the current administration to pull this sort of trick, in order to protect the BAU establishment from people coming to understand that oil is on it’s way OUT, no matter WHAT, due to depletion alone.
The revolution will not be televised.
Yep–
https://www.youtube.com/watch?v=QnJFhuOWgXg
He knew it in the 1960’s.
being not an American I can’t say much for which administration would stop publishing but I’d posit that both would , well you don’t want to frighten the horses , do you ?
We get that over here, stop publishing the data and hey presto , you don’t have to explain it…;-)
Forbin
This is the same way they solved climate change.
There’s this notion that the U.S. Majors are going to be able to do the SHALE BIZ much more successfully than their small-mid sized brethren. This, of course, is PURE FOLLY.
I wrote an article showing that ExxonMobil’s U.S. upstream earnings to CAPEX spending was a disaster in Q1 2019, and I look forward to seeing their results for Q2 released tomorrow. However, ConnocoPhillips released their results a few days ago, and let’s just say, WHAT A FRICKEN MESS.
If you look at the attached table, and compare ConnocoPhillips Earnings per CAPEX, you will notice what a disaster is taking place in the LOWER 48 segment. COP spent more than 50% of its CAPEX on the Lower 48 only to make 12% of its overall earnings.
Please compare the other segments earnings to CAPEX spending and we can clearly see that COP is investing GOBS of money in its U.S. Lower 48 sector, to only make PEANUTS.
How long before large shareholders of the MAJORS tell the management to stop BLOWING money on shale, and instead buy back more stock and pay more dividends.
IT’S COMING….
How long can the buy back stocks and pay more dividends game run before the stockholders realize it’s time to get out?
“Getting out” is going to be way down the list of problems.
It will be a considerably smaller problem for stockholders who get out in time, but I tend to agree, everything else held equal.
On the other hand, there IS a real possibility that oil supplies will hold up well enough that the price of oil will not bring about the next major economic depression or that outright economic collapse won’t come about as the result of a lack of oil.
I didn’t think I would ever say this four or five years ago, but since then, the prices of renewable electricity and batteries suitable for use in cars and trucks have fallen so fast that electrified transportation may actually result in demand for oil falling off fast enough that we won’t have to deal with oil shortages in and of themselves any time soon.
Imho, currencies is the main issue. They will be devalued, at gunpoint if necessary. The oil must flow, electronic payments, and restrictions…..
will make sure there’s no alternative. Banks and countries bailed out, as we know. Fundamentals, like oil. Oil will be bailed out too, ‘subsedized’.
Whether we want it or not.
Devalued? With respect to what? Other currency?
Who wants their currency to be strong? A strong currency harms your exports.
It’s unwise to think about money wrt oil. It’s best to think about oil, wrt oil.
For God’s sake people, China is buying oil hand-over-fist and they’re paying for it with currency that is pegged to the dollar.
Well, it is pegged to a basket of currencies, and the basket is mostly filled with USD. Think about this. Every single day think about this. They are buying oil with yuan that has a fixed USD conversion.
Watcher, devalued against the real world, all currencies together. Until they will be abandoned en masse.
$7 trillion in negative yielding debt. Trillions in pension shortfalls. The financial system is a very sick old man. Stocks at all time highs through buybacks and ZIRP. A currency is backed by debt, and debt is backed by promises that won’t be kept. Net energy is in decline while the debt system needs growth, an exponential road to nowhere. Who do you think will pay for the monetization of shale? Oil majors shareholders? Wrong. We all will. Through currencies that will be worth less by the year, month, etc.
Because that is our current base. And it is sick as hell.
‘Healthy markets’;
My mistake, 14tn in negative yielding debt, not 7. Exponential factors travel faster than we think.
https://1.bp.blogspot.com/-g6F9p07FJ_g/XUSZBdtP9rI/AAAAAAABbpM/8ci8XwnTxmcYEMFPbIaUX-jkKtP4jAB9QCLcBGAs/s1600/negative%2Byield%2Bdebt.png
They have to buy shit loads of US dollars or US dollar equivalents mainly US treasuries in order to keep the peg. And if they fail to buy US dollars the peg gets broken.
There i thought about it.
Steve. Waiting for your comments on XOM and CVX.
Am I reading it wrong or did XOM burn an incredible amount of cash in Q2?
I know they have dropping lots ( XOM) on their new refineries and chemical plants for Permian high level API stuff. Temporary, and long term beneficial. No comment on the other.
XOM had negative free cash flow for the 2Q and spent 52% of their
upstream CapEx in the US. Doubling down in the Permian!
Shallow,
Yes, I was waiting all week for Exxon’s Q2 2019… and wasn’t disappointed. Furthermore, I had a bit of a TIT for TAT Twitter exchange with Art Berman in regards to Exxon’s miserable U.S. upstream , or oil and gas earnings vs. CAPEX. Art replied by saying the following:
Art Berman @aeberman12
Replying to @SRSroccoReport and @Jazzmatazz76
It’s Exxon’s book, not mine nor yours. Problems with tight oil not going to crater US. or global economy as you have predicted. It’s not a big enough part of the economy. Even in an apocalyptic scenario, U.S. govt will be the under-writer of last resort. Oil’s too important.
SRSrocco Report @SRSroccoReport
Replying to @aeberman12 and @Jazzmatazz76
U.S. oil production growth 2008-2018 accounted for over 75% of global growth, mostly from shale. I gather you understand that Global GDP growth based on global oil production growth?? Correct? Money printing & Zero interest rates don’t work in a peak oil scenario.
—————–
Art says “It’s Exxon’s book, not mine nor yours.” What sort of response is that?? Aren’t analysts supposed to go over companies data to make “calculated assessments?””
Anyhow… ExxonMobil had another MISERABLE quarter in their U.S. upstream earnings versus CAPEX spending. (INT. = International, Non-US)
Exxon Q2 U.S. Upstream Earnings = $355 million
Exxon Q2 U.S. Upstream CAPEX = $3.2 billion
Exxon Q2 INT. Upstream Earnings = $2.9 billion
Exxon Q2 INT. Upstream CAPEX = $2.9 billion
So, Exxon spent nearly TEN TIMES the CAPEX to earnings in its U.S. oil and gas sector. But, it’s even worse than that.
Exxon Q2 U.S. oil production = 662,000 bd
Exxon Q2 U.S. upstream CAPEX = $3.2 billion
Exxon Q2 U.S. CAPEX per Oil Barrel = $53
Exxon Q2 INT. oil production = 1,727,000 bd
Exxon Q2 INT. upstream CAPEX = $2.9 billion
Exxon Q2 INT. CAPEX per Oil Barrel = $18
Exxon is spending nearly three times the CAPEX per barrel of oil production per quarter in its U.S. upstream sector than it is in its International or Non-U.S. sector.
And, in spending three times the CAPEX per barrel, Exxon’s U.S. upstream earnings are only 12% of their International upstream earnings.
This is GOOD NEWS ART BERMAN??? LOL
steve
Steve. Somehow I missed your post when I posted below.
Yes, XOM hasn’t figured out how to break even at $15 WTI like I think their CEO has claimed they would.
Looks like US will be flat or start to decline this year, guess Russia not have much to add eighter OPEC. Than future oil price depend on if there will be trade agreement and if the situation with Iran is getting wurst. Low oil price combined with low gaz price is bad for many oil majours that mostely have gaz resourses left.
Freddy,
Doubtful that US output will be flat before 2025.
Doubtful that US output will be flat before 2025.
Dennis, you’re dreaming. A 12-month average proves nothing. It could turn down in a few months. The six-month average is almost flat. And when the July data gets here, it will be flat. But that proves nothing either. It’s what’s happening in the oil patch that’s important. And US production will, I believe, plateau in 2019 and turn down in 2020. Okay, I could be a year off but no more than that. But 2025 ? That is beyond all reason.
I talked to a guy with a pretty key position in a pipeline company recently.
He says everything USA lower 48 other than shale is completely dead, and has been for sometime. He said look at Kansas since 2014. That is pretty much the rest of conventional lower 48.
He also said they are getting nervous about shale because the financial people in New York are turning against it. He says it is not profitable sub $75 WTI and if the money is cut off, it’s going to fall like a rock.
They are also concerned about 2020 big time. A lot of wasted money on new pipes if there is a fracking ban, which they are taking seriously.
Shallow sand,
A fracking ban has less than a 1% chance of occurring for the US as a whole, California, Oregon, Washington, New York, and New England perhaps, for North Dakota, Rocky Mountains, Texas, New Mexico, Oklahoma, Louisiana, and some midwestern States snow in hell is more likely. 🙂
I don’t see a fracking ban, either. For communities that don’t want it within their borders, there might be restrictions, but a nation-wide ban would be a crude way to reduce oil consumption. Politically it’s not the best route.
Dennis.
What do you think Joe Biden meant in the debate earlier this week when asked about fracking?
I’d say the chances of a national fracking ban are much higher than 1%. Not entirely sure what a fracking ban would mean. Would that include all fracking or just the “shale kind.”
Do any of the dem candidates or Trump even have a clue about any of this?
I assume this would be tied up in the courts and possibly Texas, NM and ND courts would enter temporary injunctions allowing the fracking of shale wells to continue.
It seems everyone here is just blowing this off as campaign talk. Maybe it is?
Most of what we hear in the debates is just campaign talk. Nothing new there.
Fracking may be banned once there is no more oil or gas to recover.
On the other hand, I wouldn’t be surprised to see some regulations requiring disclosure of fracking materials, or waste water handling procedures.
Shallow sand,
Politicians say stuff to win nomination that they know will never happen. I haven’t watched debates or paid much attention. Seems Dems have proposed a bunch of dumb ideas, very little will come of it in my view.
“He also said they are getting nervous about shale because the financial people in New York are turning against it. He says it is not profitable sub $75 WTI and if the money is cut off, it’s going to fall like a rock. ”
Yes. No money, no fracking. This is the reason why we don’t see much growth in US LTO production so far in 2019.
Unless oil prices increase, I don’t think we’re going to see much growth in LTO production.
That is very true. And, internally, most of the companies can not provide a lot of capex, without more funding. No matter what the price of oil goes to. So, it may be awhile, before we can see an increase. My bet is that it will be falling sometime in the next year.
GuyM,
Many of the big independents in the Permian basin were cash flow positive in 2018.
So far in 2019 tight oil growth has been slower than 2018 by about a factor of 3 (500 vs 1500 kb/d).
I agree growth will be lower, the argument that there will be no growth in tight oil output is not correct in my view.
It won’t increase. It may not dive, but, in order for things (in all shale) to keep increasing, there will have to be funds available. It’s not there. Find a way to fund it, you will be correct, and a hero.
In short, financials trump, and credit availability, override very accurate predictions.
GuyM,
In order for output to remain flat the completion rate will need to fall by 25% or more, I doubt that will be the case, but it is possible I am wrong. An increase in tight oil output simply requires the same completion rate as the first 6 months of 2019, my guess is that poorly run companies will decrease the number of completions and the better companies will increase the number of completions and overall the level will remain flat until oil prices start to increase, then we may see an acceleration in the completion rate by majors and well run independents.
Tita,
For the first 6 months of 2016 about 456 tight oil wells were completed on average in the Permian basin, there is still money being spent, though perhaps at a lower rate of growth in spending. Note also that the average completion rate in the Permian basin for the first 6 months of 2018 was only 396 tight oil well completions per month on average, so we have seen an increase in the number of completions in 2019 compared to 2018 for the Permian basin. For second half of 2018 the average completion rate increased to 437.5 new wells per month and then increased further to 456 new wells per month in the first half of 2019.
Most of the growth in US tight oil output over the past 6 months has been from the Permian basin, in other tight oil plays some plays have seen decreasing output while others have been increasing but overall outside the Permian basin output has been relatively flat (down about 0.06% from Dec 2018 to June 2019).
Hi Ron,
We will see in 2022 who is correct. I am confident that US output in 2025 (12 month average output) will be higher than 2018 or 2019. It is possible US output could plateau, but my focus is always on 12 month output, if there is a brief plateau or even a slight decrease in 12 month average output, it will be followed by a rise in output, even the most pessimistic scenarios I can envision will likely peak in 2024, but the more likely scenario is a peak in 2025 for US C+C 12 month average output, in my opinion.
Actually, Dennis, my estimate was based on what is happening in the oil patch, primarily the Permian Basin.
The Permian Boom Is On Its Last Leg By Robert Rapier – Jul 28, 2019
In the past, you have put a lot of faith in what Robert Rapier has said, especially his optimistic predictions. Have you lost faith in him now that he has a pessimistic prediction?
The Permian boom is on its last leg. It will begin to decline in 2020. And when the Permian begins its decline, the USA as an oil producer will begin its decline.
Rapier writes some good stuff, I don’t always agree with him just as I don’t always agree with you.
My model suggests Permian output will increase.
Your model appears to be based on the one-year average projection line? Yes? Really Dennis? Hell, you could project that line out ten years and still be climbing. But that line could very easily turn down in less than one year.
In April 2015 that one-year average line was headed up, just like in your chart above. But by December 2015 it had already turned down. The December value was below the November value. And that may very well be the case this year.
All I am saying Dennis is that projecting production based on a one-year trend line is a very poor way to project. What about what’s happening in the shale oil patch. Hint: It ain’t pretty.
Ron,
No the model is based on an assumption that the completion rate in Permian tight oil wells remains flat at the average level of the first 6 months of 2019. (That is the not pretty picture lately in the tight oil industry, low output will likely lead to higher prices and better financial performance.)
It is not just a projection of recent trends in output.
In chart below the low scenario is the “flat tight oil completion scenario” that I have presented in my previous post. The high scenario leaves all tight oil basins except the Permian basin with the same completion levels as the “flat completion scenario” and assumes the completion rate in the Permian basin increases by about 4.5 wells per month on average from Jan 2020 to Dec 2025. Note that from Dec 2016 to Dec 2018 the average 12 month completion rate in the Permian basin increased by 12.9 wells per month on average, so this assumed rate is 2.87 times lower than the 2016 to 2018 rate of increase. For the low/high average scenario it would be about 6 times lower.
In my view the low/high average scenario is quite reasonable, the high scenario is optimistic and the low scenario is pessimistic. My guess is that there is about an 80% probability that US tight oil output will fall between the low and high scenarios presented in the chart below, especially if oil prices are close to the AEO Mod scenario that I have presented elsewhere in the comments.
Note also that I have considered how much the completion rate would need to fall below current completion rates for tight oil output to remain flat at Jun 2019 levels and it is about a 25% decrease in completion rates, basically that is a highly unlikely scenario (less than a 1% probability in my opinion).
Note that it is Rapier that is simply extending trends and I agree that is a very poor way to make predictions because as you correctly point out trends often change.
In fact I have assumed in my models that the completion rate in the Permian basin decreases considerably from the rate over the 2017 to 2018 period (24 months). The low scenario has the monthly rate of increase in tight oil well completions fall from 13/month to zero and the “high” scenario assumes the rate of increase in completion rate falls from 13 to 4.5 completions per month from Jan 2020 to Dec 2025.
Click on chart for a larger chart.
“ A scenario that is completely unlikely.”
It’s trending way down, Dennis. My guess, is that completions for July for EF is back up 15, but that’s not really good news, because they were down about 50% for June. Completions for the Permian will be down about 40. The Bakken is about to cave. Look at WLL. It will get worse as the year wears on, and the price of oil will have little to no effect for a year, at least. That’s reality, as I see it with the most current harbingers. Oxy, EOG, and ConocoPhillips will play it very conservatively. Most of the others, besides the majors, are just waiting for the grim reaper. Because, WTI will remain in the $50 to $60 range, until inventories approximate zero. The paper traders are dumber than a rock.
GuyM,
I was without internet access for a couple of days so missed some of the recent news on tight oil financial results. The Bakken falls in output are being offset by increases elsewhere.
For EF (districts 1 to 5)I have 111 new drill oil completions in June vs 205 in May so a big drop in that case, somehow the drilling info data shows EF output remaining flat, perhaps the completion data or drilling info data is incorrect (or perhaps both). EF output has been pretty flat for all of Jan to June 2019, eventually it may decrease if completion rate falls. I think a 25% drop for total US tight oil completions (about 1000 per month for the first 6 months of 2019, so a drop to 750 completions per month is not very likely in the near term (from now to June 2022). I think higher oil prices can affect capital spending pretty quickly, more like 3 months rather than 12 months especially for tight oil plays (not true for longer term projects like deep water offshore where 3-5 years would be a better estimate.)
Geeze, dude! Pay your internet bill. Your one of the mainstays!?
GuyM,
A visit to a rural area with poor cell coverage and a nice weekend of Jazz and family, was the cause. This will be a problem for most of the rest of the summer, though I will stop in with comments lacking news background from time to time.
Well Dennis, you’re gonna love this latest missive from Robert Rapier – https://oilprice.com/Energy/Energy-General/The-No1-Reason-Why-Oil-Isnt-Trading-Over-100.html
I assert as always, and as per Ron’s charts, that peak is 2018-2019.
Mike Sutherland,
Trends can change and often do, I focus on the 12 month average in World output, the centered average peak is currently in Oct/Nov 2018 based on EIA World C+C data (that is the most recent centered 12 month moving average for World C+C output). In November 2020 we will know if your assertion is correct about a World peak in 2018 or 2019, I think any “peak” over that period will be temporary just like many of the previous “peaks” in World C+C output of the past. The final peak will be in 2024 to 2026, if my medium estimate of World C+C URR of 3100 Gb proves correct and there is no GFC2 prior to 2026. We will not know if my guess is correct until Dec 2027. Like any prediction of the future, odds are near zero that I will be correct.
I have never expected that the high rate of growth of 2018 could be sustained. The high rates of growth were in response to oil prices of over $60/b, the growth rate in US output will likely stabilize at 500 to 700 kb/d at the current oil price level of $50 to $60/bo.
Hi Ron,
What happened in 2015? Oil prices went from $100/b to $40/b. In 2018 oil prices went from $75 to $50, are you expecting a big drop in the price of oil in the coming months? I expect the opposite, I also base my estimates on future completion rate estimates which are very conservative. In the past my estimates have been too conservative though that could change.
Dennis,
When exactly do you expect oil prices to start their perpetual increase?
Iron Mike,
I see what you mean. I guess in reality I do not expect a big increase in oil prices near term, see the price scenario at the link at bottom of comment, after 2036 I expect a plateau at $100/b in 2017$ until 2038 and then a decline in oil prices as transition to electric vehicles reduces demand for oil to less than oil supply. I think oil prices may remain about where they are (with fluctuations above and below current price) until about 2020.
If you look at my oil price scenarios, it is not a perpetual increase.
Oil prices are impossible to predict on a daily basis, I look at long term trends.
The exact time will be noon on Dec 31, 2019. 🙂 Note that the AEO 2018 scenario that I typically use for my tight oil models has the average Brent oil price in 2019 at $56.25/b in 2017$ and it rises to $69.96/b in 2017$ for the 2020 average price, today the Brent future price for Oct 2019 is $61.89/b. For the model price we have $59.68 in 2017$ and Brent future price in 2017$ is $58.90 in 2017$ for Oct 2019 future. Bottom line, oil prices are a little bit higher than the AEO 2018 oil price reference scenario that I use for my models. The perpetual increase will need to wait.
My actual price expectation is based on slower growth in actual World C+C output than is forecast by OPEC, IEA, EIA and other agencies, my expectation for demand growth is a continuation of the 800 kb/d annual increase in World C+C output that has been the general trend since 1983 until oil prices reach $85 or $90/b in 2017$, possibly in 2024 as World growth in C+C output slows to a stop by 2025. At that point demand will be constrained by supply and prices will rise to the point that demand matches available supply. In the long run we cannot consume oil that is not produced as in general we expect conservation of mass (with the exception of small amounts of matter converted to energy in nuclear reactors).
See
https://www.eia.gov/outlooks/aeo/data/browser/#/?id=12-AEO2018®ion=0-0&cases=ref2018&start=2019&end=2036&f=A&linechart=ref2018-d121317a.3-12-AEO2018&sourcekey=0
Hi Dennis,
Thanks for the reply. You wrote above that you expect in the coming months oil prices to rise, i believe. That’s why i was asking. I thought maybe by next year you expect Brent to be around $70/b.
What would be your guess for the average price of Brent for say the next couple of years?
The AEO is a long term prediction that i assume you agree with, but is almost certainly wrong in my opinion.
My guess is that spot prices will determine more the movement in oil prices during the next year and a half. Not what paper traders determine. When will that happen, and how much? Don’t ask me, I dunno. Probably a bunch.
And that is probably why there is not much downward movement now, with all the negative BS on oil.
Iron Mike,
I agree the AEO oil price scenario was just an oil price scenario that was easy to download and use and will no doubt be wrong (just like every prediction of the future which typically have odds of success of about zero.)
My guess is that the AEO 2018 forecast is a good starting point, my guess is that if anything it will be too low up to 2027, after that it depend how fast the transition to EVs occurs, my guess is that a realistic scenario has demand falling below supply in 2037, it is difficult to guess how quickly the transition away from oil in land transport will occur and how fast AVs might become approved which could lead to more car pooling and fewer vehicles on the road and less oil demand. Potentially oil demand could be cut quite rapidly.
My guess would be (all in 2019$) for Brent crude about $75/b in 2020, $80/b in 2021, $87/b in 2022, and $97/b in 2023 all annual average oil prices and probably +/-$5/b around each of these guesses. This of course also has approximately a 0% probability of being correct. 🙂
DC and all,
Here are projections for Brent prices per barrel for 2019 from various sources, which I pulled from a leading article at today’s Rigzone:
Fitch Solutions Macro Research (FSMR):
2019 $67/bbl, down from $70/bbl month before. $73/bbl in May.
Bloomberg Consensus:
2019 $67.7
July, from Interfax Global Gas Analytics:
2019 $68/bbl
Ann-Louise Hittle, VP for macro oils at Wood Mackenzie; in June:
2019 $68/bbl.
I’m no expert in this so read the whole article. Wood Mackenzie’s take interests me, since you ask.
Synapsid,
Yes everyone thinks there will be a glut of oil, I just think everyone is wrong, except me. 🙂
Note that the scenario I use (EIA AEO 2018) has an average Brent price of $56/b in 2019 (in 2017$) and the price rises to $70/b in 2020 and $77/b in 2021, and $80/b in 2022 (all in 2017$).
By contrast the short term energy outlook has Brent prices at about $52/b in 2020 in 2017$.
The AEO 2019 has Brent prices rising to $73/b in 2020 and only rising to $74/b by 2022 (prices in 2018$).
The AEO 2018 and AEO 2019 reference scenarios seem pretty reasonable, though I think the peak in World oil output is not expected by the EIA in 2025, so their estimates in 2024 and later may be too low.
Regarding oil prices and the effect on long term (beyond 5 years, say) oil production, we may start to see a big effect from electrification of transport.
I have been skeptical on this before, but plenty of high priced oil may stay in the ground in the second half of this coming decade and beyond, simply because electric transport will be available for cheaper.
BNP Paribas is the 8th biggest bank in the world, and they just released a study that is worth pondering. If their assumptions and analysis are correct, or close, at some point the effect of competition from EV’s will be big.
According to the study, if comparing the mileage derived from oil vs wind/solar, per dollar invested in energy production- it would take oil to be priced at about $10/barrel to equate to the utility scale solar and wind production now feasible. [At the level where the wheel meets the road]
Its probably just a matter of time. Certainly, it will take a long time for the price advantage to filter its way down to the level of the 10 yr old ICE vehicle ‘on the road’ inventory across the world.
At some point earlier, the attitude of ‘only the wealthy’ can afford EV’s, expressed here by some and in the culture at large, will switch. It will become an attitude of ICE travel is for the rich. Only they could afford the high cost/mile.
Wells, Wires and Wheels Aug 2019
[courtesy of IslandBoy]
https://docfinder.bnpparibas-am.com/api/files/1094E5B9-2FAA-47A3-805D-EF65EAD09A7F
Hi Ron,
Using my “medium” (average of low and high tight oil scenarios) tight oil scenario and the trend in non-tight US C+C from 2005 to 2019 to project the rest of US output, the scenario below shows a US C+C output scenario from 2019 to 2039 with peak output of 14400 kb/d in 2024 (10000 kb/d of tight oil output at peak).
Wow! You have shale oil output rising much faster than the EIA, peaking at about the same level, but much sooner.
EIA: U.S. shale output to keep rising until peak after 2030
March 29 (UPI) — Production of the so-called shale, or tight oil, will continue to increase through 2030 and reach more than 10 million barrels per day in the early 2030s, the Energy Information Administration said.
“EIA projects further U.S. tight oil production growth as the industry continues to improve drilling efficiencies and reduce costs, which makes developing tight oil resources less sensitive to oil prices than in the past,” according to the EIA’s Annual Energy Outlook 2019.
I can understand the EIA’s optimism, but not yours. I am really shocked at your outlook Dennis. For shale oil to peak at about 10 million sometime after 2030, the EIA has the increase in shale oil production slowing dramatically. But you don’t think that is going to happen. I am shocked.
Of course I think you are both wrong. And so do a lot of other folks in the oil business. The bad news just keeps pouring in from the shale oil patch.
Hi Ron,
The EIA expects Brent oil prices will remain about $70/b in 2019$ until 2022, I believe their estimate is incorrect, a lower oil price scenario would lead to a lower tight oil scenario with perhaps a peak of 9 Mb/d in 2024, the EIA’s outlook through about 2027 is fairly reasonable, after that they will be incorrect as they expect a long plateau in tight oil output.
My models for tight oil are based on the oil price scenario below, well profiles estimated using data from shale profile.com and well cost estimates, OPEX, transportation cost, royalty and taxes, etc based on conversations with oil professionals.
The “medium scenario” assumes an increase in the completion rate that is 6 times slower than the rate of increase in the tight oil completion rate from Jan 2017 to Dec 2018. A “flat” or no increase in completion rate scenario has a lower peak of 9.1 Mb/d in 2024 rather than 10 Mb/d in 2024.
The tight oil producers that are doing poorly will decrease their completion rate while stronger independents like EOG and the majors will increase their completion rates and the result will either be a wash (no increase in the completion rate) or a slight increase in the completion rate (this will depend in part on the price of oil in the future).
Not sure why you are shocked, my tight oil scenarios have not changed much in the past 6 months.
Oil price scenario below, I use AEO mod scenario, this is from the AEO 2018 report.
Ron,
Scenario from Jan 2019, note that the scenario is too low in June 2019 by about 1000 kb/d, scenario has been modified a bit to match model with data through June 2019.
Sorry for fuzzy chart.
Hi Ron,
It is very likely I am wrong as has been the case in the past. Below is an earlier projection from October 2017 (no doubt you thought my projection was too optimistic in that case as well). 🙂
I expected the peak to be about 6800 kb/d in 2021/2022, June 2019 output was expected to be about 5500 kb/d.
In general my projections have proved to be too pessimistic rather than the reverse, but of course things might change, hey I might even be roughly correct with my 10 Mb/d+/-1 Mb/d peak tight oil estimate in 2024/2025. Time will tell.
Hi Ron,
The World C+C output through April 2019 can be found at the International section of the EIA website.
https://www.eia.gov/beta/international/data/browser/#/?pa=00000000000000000000000000000000002&f=M&c=00000000000000000000000000000000000000000000000001&tl_id=5-M&vs=INTL.57-1-WORL-TBPD.M&ord=CR&cy=199401&vo=0&v=H&start=197301&end=201904
Chart below has data from Jan 2017 to April 2019 and trailing 12 month output, with peak in April 2019 at 82925 kb/d.
Better chart, first chart has last few data points cut off.
Thanks Dennis, they don’t make it easy to find. But I can definitely use this in my next post. I do hope they update it every month.
Dennis
Something does not add up.
If Global oil production has fallen by 2 million barrels per day, yet global consumption has increased by 600,000 C and C. The price should be much higher.
There must be oil being produced that is being hidden from those trying to compile the data
Or, we are in the beginning of some pretty large inventory drops.
Hugo,
There are oil stocks, but visibility of stock levels is not very good. The data is not perfect in the short run, long run data is better.
There is no real, concrete reason why oil prices “should” be anywhere. There is still a huge gap between lowest production costs and highest consumption values. Prices seesaw somewhere in between.
Price are set by short term considerations only. Arguments about long term profitability, ROI, total system costs etc do not determine prices. As Keynes put it, in the long term we’ll all be dead.
I really should have stuck to my first point.
You cannot have a drop in oil production of 2 million barrels per day and an increase in consumption of over half a million barrels per day in 6 months.
US stock have gone up in that time.
Hugo,
Consumption numbers are estimated by production and stock level changes, all the numbers in the near term are not very good (production estimates are probably best). The US is only 20% of the crude plus condensate consumed in the World, so US stocks are just a part of the story, OECD stock levels are far more important, and even those are just a part of World stock levels, non-OECD stock level information is very poor. What we have is a black box on stock levels and consumption at the World level.
Also, focus on the trailing twelve month (TTM) average in World output on the chart a few comments up the page. In 2018 the TTM average World C+C output increased by 2000 kb/d, where the long term change in C+C output for the World has been about 800 kb/d from 1982 to 2018. So output increased by 1200 kb/d too much and for the past few months (Dec 2018 to April 2019) OPEC has cut back output to get the World oil market back in balance. In October 2018 the World realized the market was oversupplied leading to a fall in oil prices, perhaps the market will be back in balance by the end of 2019. The market will mainly focus on OECD stock levels, it would be nice if China and India provided better visibility for their oil stock levels as they are consuming large quantities of oil and have become far more important (most of the World’s consumption growth is coming from these two nations).
You know, big companies configure themselves to have profit centers and cost centers.
Just watch the 10 yr bond. Shouldn’t be too much longer before Exxon can create a new profit center called debt. Like Europe has. If you borrow money, the lender pays you to lend. That’s profit. Revenue comes in and there are no costs.
Really hard to lose money if you get paid to borrow.
WLL is getting crushed today, lost 40% of its value between earnings and crude cratering on the tariff announcement. Investors seeing serious risk of bankruptcy.
Concho Resources also down a WHOPPING 22% today.
Gosh, what a FRICKEN MESS the U.S. Shale Oil Industry. Any folks here who still have a large LUMP SUM of FIAT MONEY invested in this garbage industry… you have my sympathies.
Steve
Just a wild ass guess, but I would say that as far as the shale industry is concerned, the shit is about to hit the fan.
Ron,
Agreed. Gosh, I might as well post Whiting’s Chart. Looks more impressive than Concho’s.
https://srsroccoreport.com/top-bakken-shale-producer-stock-plummets-nearly-40-today/
Also, we must remember that Whiting did a 4-1 reverse split back in Nov 2017. So, a more realistic stock price for Whiting is $2.71… LOL
God hath a sense of humor…
steve
I shorted the naked shorts. Fingers crossed.
Survivalist,
Are you shorting?? LOL. Don’t know what you mean, but anyone who thinks WLL might turn around and head back up much higher needs to understand that the Former Louisiana Attorney General Charles Foti is investigating Oasis and Whiting. Why?
Well, Law Firm Kahn Swick & Foti are focusing their investigation on whether Oasis & Whiting’s management breached their fiduciary responsibilities in regards to warning shareholders of the rapid decline rate and its negative impact on the financials and share price.
I believe we are going to begin to see a BUNCH of class action lawsuits when the FAN hits the SHALE SHYTE. Virtually, no shale company has warned their investors of the rapid decline rate.
steve
Lol, that was my guess a while back. But, I think I worded it “when the fit hits the Shan.”?
Lenders took the treadmill away. Now, there is not even the appearance of moving. Or, is it spelled treadmeal.
GuyM,
No doubt there will be bankruptcies of the weaker players, the better companies and the majors will pick up the better leases on the cheap and a lot of debt will be wiped out.
It is called capitalism, some win and some lose, same as it ever was.
The death of the tight oil industry has been greatly exaggerated, it will slow down, and by 2025 it will peak. Much depends on the price of oil, if supply is short oil prices will rise, and output will increase until market is balanced. Price that I think is reasonable below (AEO Mod), it is based on AEO 2018 reference oil price scenario for Brent up to $100/b in 2017$, eventually demand declines below supply and oil prices fall.
I think you are close, but like Ron, I think you are on the optimistic side. I’m tend to think March 2019, is going to be the high, or close to it. While the Permian is the strongest horse pulling the coach, it will be slowed down by others. And, frankly, the Permian players are not so strong, as a whole.
The give away to me, is that you don’t realize that there are parts of the capex that are not expensed in the current year. Sources of funds were not so restricted in 2018. Some of the debits are in the balance sheet, and not in expenses in the income statement. It’s what has been the impetus for years. It ain’t there no more. In the past, you could have borrowed a lot more to increase income, which is not fully matched on the income statement, thus increasing net income. It’s gone.
As it not the case with some (very limited players), the whole game was a house of cards, and the wind came?
It’s why I have been stressing the limited borrowing power in the shale area, it’s the yin and the yang.
A plateau or broad peak centered at 2025 are at least necessary to maintain the crude oil production that the economy demands.
A plateau may support growth if exports are reduced and the transition to electric continues.
Er, someone tell the investors about that requirement. Don’t think it means shit to a tree, as the song goes.
How did the original shale escalation happen then? BTW, never heard that song
Jefferson Airplane, Grace Slick, probably way before your time.
FCC radio filter on that one
Here are two statements from XOM AND CVX. They are planning on increased production. Will the other company decline rates offset the predicted increases by XOM and CVX
“ExxonMobil said Friday that its oil-equivalent production in the Permian averaged 274,000 boe/d in Q2, a 21% increase from Q1 and a 90% jump from Q2 2018, as it looks to average 1 million in the basin within five years.”
“Likewise, Chevron produced 421,000 b/d of oil equivalents in the West Texas and New Mexico basin, an increase of 155,000 boe/d, or 55%, over the same period in 2018, Jay Johnson, executive vice president of upstream, said during the company’s Q2 earnings conference call.
The company expects to deliver 900,000 boe/d in the Permian by 2023, with what Johnson called a “relatively steady rig count” of 20 company-operated rigs and about seven to 10 net non-operated rigs.
The company said it is also increasing the lateral length of its horizontal Permian wells, and these should approach 10,000 feet next year in development areas — a length that is standard for many independent Permian producers.”
Ovi,
Those figures aren’t for barrels of crude; they’re for barrels of oil equivalent, boe, and that figure includes NG. They’ve been flaring NG in the Permian like there’s no need for it but they use it in the boe figures so they look larger.
Synapsid
Understood BOE but did not realize they could count flared and uncaptured NG.
I had not thought of that. NG before it is flared is counted in production. Flared is just a disposition category.
Whoops. I meant April the high, not March.
USA All Liquids Production chart/data-
does that include the ethanol derived from corn [40% of the acreage devoted to corn]?
Yes, all liquids includes ethanol from corn or sugar cane.
Thanks.
Thats a little over 1 mbpd in 2018
[corn ethanol in USA]
“By 2020, the U.S. will become a net energy exporter due to increased production of crude oil, natural gas and NGL combined with the slowing energy consumption in the domestic market. ”
Assumes more Drill Baby Drill. Author argues that Midstreams should be isolated from the Carnage of the E&P’s. Drilling Diversity? Of Interest is info on NGL’s exports. Seeking Alpha Links go behind a paywall in a few days.
https://seekingalpha.com/article/4278930-one-6-percent-yield-want-dividend-pipeline-enterprise-products-partners
Graph from SA Article above. Assest concentration.
If FED doesn’t come out with guns a blazing to support US equity market here. 400-500 point down days will become normal. They can’t afford not to. The entire yield curve all the way out to the 10 year will be going negative. While their benchmark rate remains at 2.25%. If they don’t step in. But they will step in. They absolutely have no choice. How far do US equities have to fall before mass layoff start happening because every major US corporation has done massive buybacks. Levered buybacks! If FED doesn’t support US equities how much of corporate USA goes bankrupt here? Most of it is the answer. If corporate USA goes bankrupt then so do most if not all pension funds.
They either support the market or the whole lie we’ve been living since 2009 comes unraveled. There was
nothing real about the recovery from 2009.
When it becomes clear that they are going to step in. There is the go long oil trade. Equities might have to fall a bit before it becomes clear. And oil price will likely continue to fall right along with them until FED gives. Our reality depend on and ever increasing amount of debt at an ever decreasing interest rate. Sad but true.
HHH, here is my take. Many of the oil companies’ financials are in the latrine no matter what the price of oil is selling for. They are already beginning to be punished for that, and I don’t see an end in sight. After it leaves the companies’ wells, it becomes a commodity. An initial big drop in the financial markets will make the price of oil go down for awhile. Investors are both in the commodities and in stocks, bonds, and whatnot. When they have to sell commodities to cover margin calls in other areas, the price of oil does go down. Too many sellers, and not enough buyers. That would be true, even if there was an acute shortage in the commodity. Which there is, it’s just not recognized yet. When the pain ends, the commodity becomes even more valuable, and will eventually go up. And if the commodity becomes too scarce, the bidding on the commodity becomes the most important source of price determination, not financial traders. By oil definitions, that would be the “spot price”. The actual commodity, and not paper representations. The highest bidder gets the oil, and all the rest push carts. Countries who can pay more will get it, the others will become “have nots”. Extreme example, but it’s not too far from happening.
In short, in the long run oil prices will rise, my guess is 2021.
Falling US equities is a major problem for Japan and Europe. Makes their currency appreciate. More so the Yen than the Euro. Simple carry trade unwind as Japan and Europe have NIRP and US has positive interest rates. So if FED allows US equities to fall that is dollar negative. If they step in and support market through more interest rate cuts and more eventual QE that is also dollar negative. US equities would have to go up without any help from the FED to be dollar positive.
Massive bearish shooting star on dollar index weekly chart. I trade price action more than i trade trendlines or any other technical stuff. That turn in the dollar is seen in every major currency pairs. it’s even seen in currency pairs that aren’t dollar base like AUD/CAD. WTI had an inside day Friday. Which is bullish for price. It reflects the turn in the dollar. If traders are setting up for a dollar short here it’s probably going to carry the price of oil with it. It just won’t be tick for tick. The bottom for oil might come a week or two later after the turn in the dollar. But if that inside day holds on WTI chart and the top on the dollar index holds. The low on WTI might coincide in the same week.
Might take a 10-20% correction of US equities before the FED comes out blazing though. So oil price might still have a little further to fall.
Glad you guys are still here! smile
An old thought just re-surfaced when seeing again (Tom Whipple) the oft quoted ‘fifth of world oil supply’ (20mbpd) goes through the Gulf of Hormuz. What is the latest on ‘exported’ world oil? A lot more than a fifth of internationally traded crude + cc must exit through that strait? Does anybody keep a ready reckoner?
best
Phil H
http://www.worldstopexports.com/worlds-top-oil-exports-country/
But, the worry is not in the Straight. It’s in Texas and US production, who won’t get near the 2 to 3 million barrels a day being counted for 2019-2020.
GuyM,
On this we agree, US tight oil will probably increase about 1.5 Mb/d from Dec 2018 to Dec 2020 for the 12 month trailing average output, that is about half of the increase expected by IEA and OPEC.
Note that the increase in the trailing 12 month US tight oil output from Dec 2018 to Dec 2019 is likely to be 1000 kb/d, in the first 6 months of 2018 the trailing 12 month average of tight oil output has increased by 638 kb/d.
Tight oil output will continue to slowly increase over the next 5 or 6 years.
Hi Ron
EIA short term outlook publishes monthly data for non-OPEC oil production from 2015 onwards. (Table 3b)
Although that is probably for all liquids but crude oil production can estimated using historical proportions between crude and all liquids. I think for most countries the non-crude part is very small.
Condensate has corrupted all historical measures.
Watcher,
No not really, condensate is not a big factor for most of the World and crude in general at the World level is getting heavier, the US is not the World and the extra light oil in the US can be exported elsewhere if refinery capacity is not developed to utilize the lighter crude streams from tight oil.
Y’all might want to focus on the more important parameter between price and interest rates.
A lender’s decision gets adjusted by what he can get for his money “elsewhere”.
Meaning, if you might lend your money to an entity that pays negative interest rate, vs a shale driller con artist who MIGHT be able to repay you 6% if he can get a price rise — well, that tightness in Wall Street may loosen with every downtick of the 10 yr bond yield.
Fun in Truskavetts, Ukraine. Seems my buddy at the Villa Kristina, where I am staying is Manager of the place. His wife is manager of Mirotel Hotel. That is where the new President of the Ukraine will be, and will be speaking for the next couple of days. They have pictures of him staying at Villa Kristina ten years ago. He advised me that security at breakfast at the Mirotel May be more active, as our breakfast at Mirotel is one floor below. Damned interesting choice for a vacation spot. President is a valid and well established comedian, not like ours, who is just a buffoon, at best.
https://corporate.exxonmobil.com/
From Exxonmobil 2Q result I read they have increased their production in Permian by 90% the huge question is do tjey earn money on thoose barrels with oil price WTI in range 50 -60 usd. From Compared to Q2 2018 the report shows income decrease from 439 Musd to 335 Musd Q2 .2019 or – 23%. Income outside US from mostely offshore field increase from 2 601Musd to 2 926 Musd or 12,5% in the same period. I believe Exxson like other oil majours not earning money in US shale play and they might already look for buyers for their assets like some other are that have assets in EF. Oil Companys have a urge to attract investors that always will look at anual interest of their investment.that is why. Exxson depend on projects that will get fast payback and dividend to owners. From Q2 report it seems their investment in US shale with todays oil price level not benefits the owners as it actual might have reduced dividend.
XOM spent $10.5 billion in CAPEX in US to increase production by 107,000 BOPD during the last four quarters, and increase gas production by 250,000 MCF during the last four quarters. The oil is not all oil, but are liquids.
Q2 US upstream EPS was slightly more than 1/10 of Q2 US CAPEX.
XOM is spending a lot of $$ on US upstream, so far not generating a lot of EPS. Just over 10% of upstream EPS was US, even though US upstream accounted for 52% of upstream CAPEX.
Not sure why XOM would thrive in US shale when others aren’t. Have to think XOM overhead has to be high, or at least comparable, to the independents.
shallow sand,
The major players in the Permian basin all made money in 2018, I imagine a well run oil company can accomplish that and their pockets are very deep. It takes a lot of capex to get started in tight oil (or any business), so the initial few years when output is growing rapidly will not look as good on the financials.
Dennis.
Keep in mind US for XOM includes GOM and conventional production.
Also, although XOM is constantly being thought of as a new entrant into shale, it isn’t. It has owned XTO for many years. It has been a major player in the Bakken for a decade.
As discussed since 2014, shale requires never ending large amounts of CAPEX, just to keep production flat, let alone grow it.
As to making money in 2018, that is debatable. As discussed many times, GAAP EPS is not always a good metric. Major asset write downs occurred in 2015-2016, which lowered DD&A. The companies exaggerate EUR, which causes unit cost depletion to be much lower upfront than it should be.
I guess some of us here feel vindicated to see that finally the mainstream is acknowledging what we have been arguing for about 5 years. Shale doesn’t work economically without high oil prices.
XOM is a great example of how uncompetitive financially US shale is with other oil production around the world. XOM spent less than half it’s CAPEX on international, yet that is where almost 90% of its upstream earnings were derived.
I am not making any arguments as to US future production growth, because economically it shouldn’t have been anywhere near what it has been since 2014. Just making the point that XOM results continue to prove that shale needs higher prices.
shallow sand,
I was looking at more tight oil focused companies in the Permian such as EOG, Concho, Pioneer, Anadarko, and Occidental.
I agree growth in tight oil has been higher than is sensible, most of these companies were cash flow positive in 2018. I certainly would agree that they will not do well at lower oil prices, but I doubt oil prices will stay low.
Those that believe the World economy is about to crash have been claiming this for quite a while, eventually they will be correct, my guess is in 2030 or so. In the mean time oil prices will rise.
Guym, as one ol bean counter to another, can you explain a little of what you said above.
“you don’t realize that there are parts of the capex that are not expensed in the current year.”
Capex used to be capitalized expenditures which went to the balance sheet then were amortized based on estimated future production. I believe estimates of future production are widely overstated leading to inadequate DD&A charges in the income statement, and think you probably agree. Is there something else you are thinking of when you say expenses are understated?
Expenses are not understated. Did not mean to say that. But, most of the capex is thrown into the balance sheet. So, if you borrow lots to drill, the income statement looks good now, but if you can’t borrow anymore, it’s time to pay the piper.
IRS and AICPA need to look at their rules for shale oil. To get a better matching. Like allowing a 60% depletion per year on the remaining balance in CAPEX.
As it is, if you stop drilling, and eliminate all admin costs, you’d still operate at a loss due to amortization being higher than income.
Or, get rid of a third of your employees, like some companies are going to. Kinda doubtful they can maintain, much less increase production doing that.
Guym thanks for the clarification. I believe we are in agreement that unit of production amortization based on the assumed long life of shale wells distorts economic earnings. Often units to be produced are overstated, as in the 30 year life of the well as presented by some companies. Further, a lack of any recognition or adjustment to reflect that after the first years of production, any units produced will be burdened by much higher per unit opex leaving little if any margins.
The result of this accounting bias has been that financials look better while drilling and production is increasing. Many of the companies that have gone Bk looked relatively good up to the time at which it became necessary for them to reduce capex. Once capex and production begin to decline it becomes evident that they have too much debt, then the spiral hits, and the only chance for them to avoid BK is much higher prices.
I wish I had understood this better 4 years ago, but now its evident to many. WLL’s recent results are one of the latest examples. Whiting was over 50 last October, about 10 now, and absent rapid oil price increases, they may be BK in another year. I believe the market is responding much quicker to this distress than it did earlier in the cycle.
Oh, heck, DC, they are gone. No more. More than pissed off. They won’t come back.
dc and guy.
I mentioned NOL’s these companies have awhile back.
Any thoughts on those?
They sure don’t seem to pay income taxes. GAAP yes, but all deferred.
Not sure, but right now, I see it as another debit they will lose.
Hi Shallow. Generally their tax NOL’s aren’t recognized in the financials as an asset. Accounting rules used to allow recognition in certain circumstance where recognition of the NOL was almost assured. This was rare. Even though they can’t usually recognize an asset on their financials, they can and do talk up the NOL like their ultimate recoveries after producing their shale wells 30 years.
I may have mentioned this before, but one of the things that surprises me is that the shale cos haven’t figured out a way to peel off the IDC and sell it to investors. Maybe that will be in the next tax simplification bill.
In previous comments I have argued that if declining oil supplies trigger a military response, I don’t expect it to be with bombs or invasions. Cyber warfare is cheaper. And so is biological warfare.
“Biological weapons are very attractive to the terrorist because of several characteristics. Aerosols of biological agents are invisible, silent, odorless, tasteless, and are relatively easily dispersed. They are 600 – 2000 times cheaper than other weapons of mass destruction. It is estimated that the cost would be about 0.05% the cost of a conventional weapon to produce similar numbers of mass casualties per square kilometer. The production is relatively easy, using the common technology available for the production of some antibiotics, vaccines, foods, and beverages. The delivery systems such as spray devices from an airplane, boat or car are commonly available. The natural lead time provided by the organism’s incubation period (3 to 7 days for most potential organisms) would allow for the terrorists’ escape before any investigation starts. In addition, the use of an endemic infectious agent may cause confusion because of the inability to differentiate a biological warfare attack from a natural epidemic. For some agents potential exists for secondary or tertiary transmission by person-to-person transmission or natural vectors.”
https://www.siumed.edu/im/overview-potential-agents-biological-terrorism.html
Ok, Dennis, I was wrong on the comparison to EF production vs Delaware. This is EOG’s dog and pony show for the second quarter. Interesting metrics in the Appendix:
http://investors.eogresources.com/Cache/1001255228.PDF?O=PDF&T=&Y=&D=&FID=1001255228&iid=4075407
GuyM. Thanks for posting.
Thanks GuyM,
Not sure if those EUR estimates are realistic, they are far higher than the industry average. According to shaleprofile EOG wells are about 24% more productive than the industry average in the Permian for 2017 and 2018 wells, that suggests an EUR of about 480 kb for the average EOG Permian basin well, while EOG claims about a 700 kb EUR for a typical Permian basin well or about 46% too high.
My Permian basin model assumes the average 2018 Permian basin well has an EUR of 400 kb vs the EOG “typical” Permian well at 700 kb.
I never take the EUR that is claimed in investor presentations at face value, shaleprofile.com is the best place to find this data.
Well, EOG, so far, is the only one trying to do any extensive Enhanced production. They report good results on it. Too soon to tell, for sure what a realistic EUR may be on some of the last three years of wells. They did not say anything to us about any enhanced recovery on the Raindrop new series. But, they may be experimenting. Prior to drilling the additional Raindrops, the original was down to around 1500 barrels a month. The next two months after drilling, the totals were less than 500. Which makes sense for one month, because they shut in the well for completions and tie in. Not two months. The last month is now at over 3900 barrels, which is contrary to any type of parent/child norm. Their procedure, it has been said, is to pump gas into the well, shut it off for a month, or so, and then open it up again. Results are slow. I’ll keep an eye on it.
At it’s then current production, Raindrop would easily exceed 300k EUR. At a 33% increase, it would be over 400k EUR.
But, all of this is in the EF, and not what you are talking about. Your talking of the Permian horizontals which were not sprung until 2014. EOG entered later, so how can we be close to determining EUR, yet. Probably, the first wells of EOG of any volume, were only about three years ago. Learning curves, and all that, means EOG is a real newbie. But, 700 seems a bit high. Everyone over hyped the EF in the first five years, too. Some still do. Thirty impossible years of production, and yadda, yadda, yadda.
And, there is no way that EOG could use the same EOR methods in the Permian. They’d wind up blowing the remaining oil into the next county.
And, I did notice one other very questionable thing in the dog and pony. EOG is dropping their well spacing in the Permian. Looks close to 400 ft. They will be sorry.
GuyM,
The EOR results will be interesting, I imagine they might be able to use what they have learned in the EF in the gassier areas of the Delaware perhaps, though the geology may be very different and the same rules may not apply.
One can take 24 months of data and fit to a hyperbolic using solver in excel with a least squares type of minimization to get a rough idea of EUR. I just took the hyperbolic fit I have for all companies and compared with first 12 months of output for EOG wells vs all companies. EOG was about 25% higher, I assumed that the entire well profile was 25% higher for EOG so if it was a 377 EUR for all Permian producers, EOG was assumed to be 377*1.25=471 kb.
I did not look at Eagle Ford in this case.
The reason the EOR in the EF works, is because the EF is trapped between the Austin Chalk and the Buda. Both fairly hard ceilings and floors. And, the EF is pretty tight, too. You don’t have that in the Delaware. The oil moves as it is accessed, and pressurized. They may spend most of their time and money, chasing it. But, I should shut up, I don’t know the first thing about geology.
I was vouchsafed a vision today.
In our little country town, they had a “parade.” This is when a bunch of internal combustion engines line up on the road to make a lot of pointless noise.
Meanwhile, traffic on the very busy road that runs through town had to be diverted down our “back” road in order to make the stupid parade possible.
So, I have spent all morning listening to loud diesel stacks, muffler-less motorbikes with radios blaring, stupid, stupid American noise, defiling our country road. They are impatient that they can’t drive fast and constantly honk their horns at each other.
And all for nothing.
We’re fucked.
M. the lurker.
How many EV have driven down your road today?
Zero, AFAIK. They all made noise. Large trucks with loud mufflers. Poor, rural area.
Dennis, Guy
Can this statement be verified through some other source? It is taken from the Q2 report of Baytex Energy.
“Production in the Eagle Ford averaged 39,822 boe/d (76% liquids) during Q2/2019, as compared to 41,097 boe/d in Q1/2019. The lower volumes during the quarter reflect the timing of completion activity. We commenced production from 29 (5.0 net) wells during the second quarter, as compared to 36 (8.9 net) wells during the first quarter. The wells brought on-stream generated an average 30-day initial production rate of approximately 2,045 boe/d per well.
That 2045 number is three times the average that Enno is showing for EF.
Quick look revealed not much in either district one or two. It’s a very small quantity, and I don’t have the producer’s rrc number. Note the increase indicates only one completion. Could have missed it, or it could be a pending lease.
But, no. The more I read it, the more confused I am. Doesn’t make sense. Are they drilling under some other name? In other words, are they the primary operator? That’s a lot of wells to miss. And, a decrease in production is not entirely logical at over a 2000 barrel a day 30 day initial average. They decreased well from 36 to 29, and there is a decrease in production?
Baytex is a non op in the eagle ford for the most part.
Thanks. So, nothing is verifiable via RRC. It could be anything. For a little clarity, they are not usually the operator, but they have an operating agreement with royalty owners. Usually, that means they have agreed to participate with the majority leasehold owner, who is the operator. If that was not clear in their dog and pony, it’s probably all BS.
I wonder is this statement is a clue that they are not the operator without actually saying i.e. “production from 29 (5.0 net) wells”. 29 wells and their portion is the equivalent of 5.
Thanks Guy
US manufacturing lowest in a decade and heading lower:
https://tradingeconomics.com/united-states/manufacturing-pmi
https://www.businesscycle.com/ecri-news-events/news-details/economic-cycle-research-ecri-lakshman-achuthan-business-cycle-pmis-have-not-bottomed-yet
The global economy is getting weaker, not stronger. This happens in the midst of a de-globalization that predates the trade-wars but can only accelerate with them:
https://www.businesscycle.com/ecri-news-events/news-details/economic-cycle-research-ecri-lakshman-achuthan-business-cycle-ecri-de-globalization-diagnosis-predated-trade-war
There won’t be much pressure on oil prices from the global economy. Oil demand will not be strong.
In Permian there is what is called a rate limiting step to growth. If you look at NG growth in Permian from shaleprofile, it has gone up from 6.55 BCF/day in January 2018 to about 11 BCF/day in April 2019. And Enno says it is getting gassier.
At the current NG and NGL prices, it is not possible to build pipelines. And at these ridiculous growth rates in NG where is the market?
Texas RRC has allowed extensive flaring. In one of the twitter posts, I saw COP flared 100% of NG and 50% of NGL for a small oil growth.
You can project all you want about shale growth in Permian but unless you light the sky with NG flaring, those growth projections will not happen.
Only about 4% of the Natural gas is flared or vented, the other 96% is captured. Much of the excess natural gas comes from a few counties in the Permian basin, if flaring permits where made much more expensive perhaps fewer wells would be completed in the high gas counties until enough infrastructure is built to handle the natural gas, or it will continue to be wasted if the state agencies choose not to do their jobs properly. That is up to the people in Texas and New Mexico, I don’t vote in either of those places.
Texas RRC understates NG capture. The environmental activists had it at 16%. Sitton wants oil revenue and does not care about NG flaring. Here is the latest news. There was a NG pipeline available but Exco chose to flare because pipeline cost is higher. EOG has data on flare from companies. Raja Sarkar in Twitter said COP flared 100% of NG
11:12 ET – State regulators reinforce shale drillers’ right to burn natural gas in Texas, even when they have access to a pipeline. The Texas Railroad Commission approves Exco Resources request to flare nearly all of the gas produced by a group of South Texas wells, even though the wells are connected to a network of Williams Cos. pipelines. “It would be unreasonable for us to force Exco to shut in the wells until a contract could be signed to capture this gas,” Texas Railroad Commissioner Ryan Sitton says. ([email protected]; @rfelliott)
(END) Dow Jones Newswires
08-06-19 1112ET
Copyright (c) 2019 Dow Jones & Company, Inc.
Krishnan,
Interesting, thanks.
“The Williams gas pipeline is about 6 miles from where Exco is producing in Frio County. The cost to treat and connect its facility to the pipeline is about $7.1 million, according to the RRC docket. Net revenue from the remaining reserves is estimated to be about $1.1 million, however, making it uneconomical to build a pipe connecting the Exco lease to the Williams pipeline.”
https://www.hartenergy.com/exclusives/texas-flare-dare-upstream-vs-midstream-181850
Roger,
Also interesting, thanks.
Why would a big player, like Exxon or Chevron, produce any more tight oil currently than they need to just cover fixed costs from that sector, and ‘keep the light on’ so to speak?
At these prices , they would be better to simply hold off on production for perhaps 5 years.
Pickup distressed acreage players/acreage while they wait.
Do they so desperately need to show growth, that they are willing to operate with poorer results today than they could get in 5 years? What is the rush?
I ask from the perspective of a citizen/consumer who hopes for a long tail of production, for the sake of economic stability.
Hickory,
They may believe this is a good way to increase returns in the future, to ramp up tight oil production requires capital spending, in many cases leases need to be developed to hold the lease, some of the money spent may be due to those factors, they may have also expected oil prices to rise.
” in many cases leases need to be developed to hold the lease,”
I hadn’t considered that.
Oil’s as the Master Resource and Support role for modern life is taken for Granted.
I’m searching for graphs to illustrate that Energy Transition and Efficiency matters.
Seems like few are really preparing or can comprehend existence with any lower Fossil fuel inputs. Upon mention that 8 out every 10 gallons of fuel they pay for blasts out the Radiator on their Ride they start to question the Energy Dominance Story. Steve’s article here is informative but the API of Upstream oils are way over the average Joe’s head. Some key North America API graphs here. https://srsroccoreport.com/the-united-states-a-net-oil-exporter-the-dirty-little-secret/
https://www.shaleexperts.com/deals/Conoco-Wintershall-Team-Up-in-the-Vaca-Muerta-Ink-JV-Deal_99941469
https://www.rigzone.com/news/wire/concho_stumble_casts_cloud_over_permian-02-aug-2019-159471-article/?pgNum=0
Seems there still is huge unsolved problems with well spacing in Permian , many wells will never be profittable because of to high decline rate…
A lot of graphics about global fossil fuel use.
https://www.nationalobserver.com/2019/07/31/opinion/fossil-fuel-burning-leaps-new-record-crushing-clean-energy-and-climate-efforts
China’s currency peg just broke through the line in the sand which was 7.0 Things could get really nasty here if they don’t get this under control. PBOC hasn’t stepped in yet. Which is a little surprising.
Useful for everyone to understand what you just said. The currency is pegged. The free market does not determine its value. There is no free market.
They buy more exported oil than anyone else, and they pay for it with that currency. It is pieces of paper with ink printed on it and its value is decreed by the Chinese government. Oil sellers are going along with this. Well, not explicitly. They still expect to get dollars for their oil. It’s just that the dollars derive from <7 yuan. Maybe it is the oil seller who is taking the Yuan and doing a conversion elsewhere. It sort of doesn't matter because the stuff is no more or less meaningful than it was before the peg.
The really bad news is. . . this is largely normal. This is how civilization has always operated economically. The substance has only imaginary value. Don't spend too much time worrying about how money is going to define oil. Oil has meaning. Money does not. Study millidarcies rather than free cash flow.
And you need to understand something about a pegged currency. A currency can stay pegged as long as the value remains fairly constant with the currency it is pegged to. But if the value slips too far in either direction, the peg must pop out.
It happened in Mexico in the late 70s. The Mexican Peso was pegged to the dollar but Mexico had a financial crisis and the strain became just too great, the peg popped out. The peso suffered severe inflaton and people who had invested in the peso lost their shirts.
Currency pegs can and will pop out when the strain becomes too great.
Yeah, I was in banking at that time in South Texas. Pretty messy. Some of the border banks that had to carry a lot of pesos did not fare very well.
Wait, 1970s is what, 50 Trillion dollars in debt ago globally? $100 Trillion globally? And even then the peg held up a long time.
It’s over. It’s been over for at least 10 yrs. Stop avoiding the truth. The Chinese buy more oil than anyone else and they buy it with paper the government assigns value to. The oil sellers tolerate this because they convert to USD and then get rid of the currency (any currency) as fast as they can.
There is no intricate contortion to create rationale within failed capitalism (yes, failed, we’re running about 5% of GDP fiscal deficit this year as fiscal stimulus and it’s creating what, 2% GDP growth?). There is no value. It’s all imaginary. This is all why the Vaca Muerta and its decreed pricing is so very dangerous.
“Currency pegs can and will pop out when the strain becomes too great.”
Currency pegs pop when the defending country runs out of forex reserves.
China has a massive pile. Ergo the PBoC decided to let the yuan slip. It was a direct response to Trump’s 10% tariff hikes. Just games and such at this point.
Who will blink first?
Real question is how much pain will the FED allow US equities to take. Where is their line in the sand? This selling isn’t going to stop until they come out firing. When they do i have to believe the price of oil will take off.
Y’all should go and look up the Chinese peg. Go read about it.
Anyone care to guess when it started? Don’t bother I’ll tell you.
1985. That’s the purely correct year, but most places you look up will quote 1994.
Yes but it will fail as soon as xxxx or yyyy. As soon as this or that, just you wait.
25 yrs. 1/4 century. Largest oil importer on Earth. But in some people’s world it’s all traded and managed by some sort of bizarre free market. Come now, think about it. If you were the Chinese government why would you care about a free market? Your goal is Victory. Your goal is dominance. Why would you leave such things to the vagaries of a bunch of people with varying moods trading numbers on a screen?
You will do whatever appears to point towards dominance. You’re importing more oil than anyone else on Earth and the exporters are willing to give it to you for pieces of paper with ink on them, the value of which you declare. Why would you want to change this?
Enno just posted EF production for April
April production was 278,230 b/d and total production was flat. What does that tell you?
Er, couldn’t be right. EF is closer to a million barrels a day. Under that, but not much.
Guy
I just said that total production was flat because I could not read it exactly. However it is close to 1.275 Mb/d. My point was that with April production at 278 kb/d and total production flat, that implied that the legacy decline in EF for April must also be close to 278 kb/d.
Ok, I get you. I think they count a bunch of other formations in EF. Counted in district one and two is everything from Austin Chalk, Buda, and some shallow formations.
Ovi,
The april production is all 2019 wells so you are not accounting for legacy decline correctly. About 117 wells were added in April, maximum output for an average well is about 718 b/d so we get 84 kb/d, if overall output was flat this suggests legacy decline of 84 kb/d. Output actually went up by 2 kb/d so that suggests legacy decline of about 82 kb/d for Eagle Ford in April 2019. Actual legacy decline is a bit more complicated due to first month output being lower than second month so we need to look at two months to get a better picture of legacy decline, for my model I get about 105 kb/d. When I look at the two mnths using the data from shale profile I get about 87.5 kb/d for Eagle Ford Legacy decline in April 2019. The DPR has 114 kb/d for April 2019. On possible problem with the estimate for shaleprofile is that the number of completed wells is often revised. If the well completions were revised higher by 10%, the legacy decline becomes 96 kb/d and if revised higher by 15% legacy decline becomes 100 kb/d.
Dennis
The 87.5 kb/d that your model is predicting is almost spot on with the DPR at 91 kb/d. The production for April is 114 kb/d.
It is going to be interesting to see what your models will be saying over the next 3 to 4 months. With the rigs dropping, the trend appears to be that we may be getting onto a plateau for many of these basins. With the drop in the price of oil in the last few days, there may be more incentive to cut back on drilling.
Ovi,
The DPR says 114 kb/d legacy decline in April for Eagle Ford. The production increase in April was 117.6 kb/d based on the DPR model. It is Enno’s data that predicts 85.5 kb/d legacy decline, my model has 105 kb/d legacy decline in April. My model does not reflect the latest well profile, it is based on well profiles from 2017 and earlier so it will not be as accurate as Enno’s data, sometimes the most recent months (in this case Oct 2018 to April 2019) get revised as the data becomes more complete possible reality will be somewhere between Enno’s data and my model as the data gets updated over time.
I agree it will be interesting to see which predictions prove correct. In Dec 2019 my “low” US tight oil model has output at 7850 kb/d and my “high” model at 7900 kb/d, average of two is about 7875 kb/d. June 2019 US tight oil output is 7578 kb/d and Dec 2018 output was 7287 kb/d, so my prediction is an increase in tight oil output from Dec 2018 to Dec 2019 of about 588 kb/d+/- 25 kb/d.
Dennis
I take April EF info from the March report. Since it starts with March production on the left and then predicts April production and decline, I assume that the March report is the prediction info for April.
Ovi,
I use the spreadsheet from the most recent report which is based on the most up to date information.
For April the increase in output is 1337*88=117624 b/d and legacy decline is 113986 b/d. See screenshot from spreadsheet below. The model gets revised over time, note also that the DPR does the Eagle Ford region (as does shale profile, but horizontal wells only), my model does only Eagle Ford tight oil (consistent with EIA tight oil estimates), so there are good reasons for the differences in estimates, as I mentioned earlier I also use an older well profile estimate because we do not have enough data for a good well profile estimate beyond 2017, so that is another reason for the difference in my estimate compared with shaleprofile.com.
If the image is difficult to read (my old eyes find it fuzzy), clicking on the image will make it readable, at least for me.
Dennis
As you can see, my source was an old paper version of the DPR. It is interesting to note from your chart that August 19 production is predicted to be lower than Dec 18 and starting to plateau around 1.38 Mb/d.
Ovi,
Yes it was not clear at first that you were using the older DPR.
For tight oil I prefer the “tight oil production estimates by play” at page linked below. This data comes from drilling info which gathers the data from state oil and gas agencies rather than being based on a model as is the case with the DPR. I only like my models. 🙂
https://www.eia.gov/petroleum/data.php#crude
I use the data in the excel spreadsheet.
Ovi,
To be clear that 278 kb/d is output from all wells that were completed in 2019, note that legacy decline for April is the decline in all wells completed in March 2019 and earlier, though the shape of the well profile with the second month being the highest in output dictates that we modify this a bit to look at the increase in output from month 1 to month 2 (189 b/d for average 2019 well) for the wells completed in March and add this to the output from the wells completed in April (529 b/d) so the legacy decline will come from all wells completed in Feb 2019 and earlier.
Dennis
Yes the 278 is all of the 2019 decline. From Enno’s March data, production was 206 kb/d. So the April decline is closer to 278 – 206 = 72 kb/d. Subtracting the 2 kb/d increase, sets the decline at about 70 kb/d. The March DPR was predicting a 91 kb/d decline rate while your model is saying close to 84 kb/d.
Ovi,
I think you may not understand legacy decline. It is the decline of all wells which did not start producing in the current month. So you take the increase from wells that started producing this month (460-343=117) times maximum production 718 b/d or 117*718=84006 b/d. Then you look at the change in output for all wells 1288-1286= 2 kb/d so output increased so legacy decline is smaller by 2 kb/d, so legacy decline is 82 kb/d. This is the simple way to do it, but there is a better method which is more accurate, more later.
Ovi,
The more complicated way to calculate legacy decline is to look at completions for March(125) and April(117) and note that the second month after completion has the highest output for the average well (this is because on average the first month only has about 15 days of output, though it will vary for individual wells from 1 to 31 days depending on when the well was completed). So the second month has 189 b/d higher output than the first month for the average well and the first month output for the average EFS well is 529 b/d, so the new wells from March and April will result in 125*189+117*529=23625+61893=85518 b/d higher output, overall output increased by 2 kb/d so legacy decline is about 83.5 kb/d. The simple method given above gives close enough results as long as the number of completed wells is not drastically different from one month to the next, but the second method will be more accurate.
Ovi,
The estimate of 70 kb/d for legacy decline omits the decline from 2019 wells, when the decline from wells completed in Jan 2019 and Feb 2019 is added we get another 13.5 kb/d of legacy decline.
I just realized that the well profile I was using included only Eagle Ford and Austin Chalk wells (default at shaleprofile), when all wells from all formations are chosen, the first month is 502 b/d and second month is 694 b/d with the second month 192 kb/d higher than the first. So the increase in output from new wells is either 694 times 117 equal to 81 kb/d or 117 times 502 plus 125 times 192 equal to 83 kb/d. As overall output increased by 2 kb/d in April, legacy decline would be 2 kb/d less for each of these estimates, so 79 kb/d or 81 kb/d for legacy decline.
The 218 wells completed in Jan and Feb 2019 declined on average about 50 b/d in April 2019.
Oil Price Correction Triggers Shale Meltdown
It was a rough week for the U.S. shale industry.
A series of earnings reports came out in recent days, and while some drillers beat expectations, there were some huge misses as well.
Concho Resources, for instance, saw its share price tumble 22 percent when it disclosed several problems at once. Profits fell by 25 percent despite production increases. Concho conceded that it would slash spending and slow the pace of drilling in the second half of the year.
It also said that one of its projects where it tried to densely pack wells together, which it called “Dominator,” the results were not as good as they had hoped. The project had 23 wells, but production disappointed. The “30 and 60 day production rates were consistent with our other projects in that area, but the performance has declined,” Leach said. So, the company will abandon the densely packed well strategy and move forward with wider spacing.
In the second quarter the company had 26 rigs in operation, but that has since fallen to 18. At the start of the year, the company had 33 active rigs.
“We made the decision to adjust our drilling and completion schedule in the second half of the year to slow down and not chase incremental production at the expense of capital discipline,” Concho’s CEO Tim Leach told analysts on an earnings call. He said the company’s aiming for “a free cash flow inflection in 2020.”
The company reported a net loss of $792 million for the first six months of 2019. As Liam Denning put it in Bloomberg Opinion: “It’s sobering to think that Concho, valued at more than $23 billion in the spring of 2018 and having since absorbed the $7.6 billion purchase of RSP Permian Inc., now sports a market cap of less than $16 billion.”
The reason these results are important is because they may not be one-off problems for individual companies, but are more likely indicative of the problems plaguing the whole sector. “There is little doubt this is a big event for the sector and a brake of this nature will create lasting impact,” Evercore analyst Stephen Richardson wrote in a note, referring to Concho’s poor results.
There is a lot more to this article including stock price declines for a lot of shale companies. You might want to check it out.
If I remember correctly from another post, new tight oil production amounted to something like half a million barrels per day per month. It’s hard to see how these big money losing ventures won’t affect the incessant new production needed to keep existing production level. In other words, is shale oil about to peak?
Shale peak is all about price and wall street money – and this is all about geo politics.
When a knocked out oil country, for example Iran, comes back shale can’t grow anymore.
When another country fails (for example unrest in Iraqu) shale oil can continue growing to somewhere the mid-20s. Or the trade war stops and another global boom, even a shortlifed one, starts.
Wallstreet won’t finance an oil drilling boom during negative yields in shale anymore, but when prices come back to sustain a black 0 with some companies earning money, the oil magic will work again and credit will flow.
You have the scenarios here in the forum – and the number of new wells depends on politics, trade wars … – my crystal ball is somewhat foggy today to predict what happens.
Eulenspiegel,
I agree, all of those factors will influence the price of oil and that is key. My scenarios assume a certain oil price scenario. Prices that are lower, will reduce output (due to fewer completions) and higher prices will increase output (due to a higher tight oil well completion rate). Although I did not specifically consider different oil price scenarios, a lower oil price scenario makes the “low” scenario more likely and a higher oil price scenario makes the “high” scenario more likely.
In my view the “medium” (low/high average) scenario and medium oil price (AEO mod) scenario that I have used seems most likely, but future oil prices and all of the geopolitical and economic factors that will determine those prices are highly uncertain.
In my view a near term peak in tight oil output will only occur if the Brent oil price drops below $50/b and remains there for about a year. This is unlikely to occur unless GFC2 arrives in the near term (highly unlikely in my opinion).
Ron,
I agree that is a nice piece. From the end of that post:
But the majors aggressive bet on U.S. shale is a sign of the times. Small and medium drillers are getting hammered and seeing their access to capital close off, which is forcing budget cutbacks and otherwise leading to steep selloffs in their share prices. The majors, on the other hand, are only in the early stages of a multi-year bet on shale. They can stomach losses on individual shale projects for years, scaling up while they earn profits elsewhere.
So, despite the widespread financial losses for the shale sector, it’s not clear that production is set to grind to a halt.
Dennis, no one expects shale oil to grind to a halt. But about six new barrels must be produced to gain one barrel in growth. The other five goes to replace legacy decline. What I do expect is the end of growth in shale. For every five new barrels of production, we will see five barrels of legacy decline.
Ron,
If the number of wells completed each month decreases by 25% from the average completion rate of the first half of 2019, then shale growth will end as you surmise.
I am highly skeptical that the completion rate will decrease by 25%, but we will know in a few months if tight oil growth stops altogether.
Do you have a date in mind for when this will occur?
Do you expect if it does occur that oil prices will not be affected?
Let’s assume no and that you expect oil prices will increase.
What would you expect might happen to the completion rate in that case?
Scenario below assumes no change in tight oil completion rate from the average rate for the first 6 months of 2019 from July 2019 to June 2024. The number of new wells completed must fall by about 25% in order to stop tight oil output from growing.
Hate to be a spoilsport, but I see that happening.
But, we will be able to pinpoint it in three months. By then, you can probably be convinced. I know where you are coming from. You are not that far off from my original estimations, and you are an exceptionally intelligent person. But, as in most people with a high IQ, you have to be convinced with hard data.
P.s. hint, it will come in a combination loss from Permian, which may only be close to 20%, Bakken, EF, and Okla. Flat, but far from dead. EOG has already done most of what they need to do in the EF, and they are the major “living” player there. The biggest player in the Bakken is toast, for awhile. cLC is pretty sick, too, Okla. is dead meat. Pioneer fired 25% of their workforce, to imagine them as being able to spring forward, defies logic. Yadda, yada, yada.
But, as I said, that does not preclude some completely insane funds, from popping up and providing more capital for the sick companies. Everything changes, then, for the short term, but long term remains the same.
GuyM,
Keeping the number of completions flat is far from sprinting, I think falling completions from poorly run companies will be at least matched by an increasing number of completions by majors and well run independents. Data through June suggests this will be the case, but you are correct that I am usually convinced by hard data.
In 2015 I expected tight oil output would fall much faster than was actually the case, perhaps this time I am underestimating how hard the tight oil industry will be hit by a lack of available credit.
Like I said, you are the best.
Dennis, I remember when we were first looking at modeling the shale production, and how relatively easy it was to follow the total production from a model of just the # of sites and the average profile, using convolution.
This was a chart from exactly 6 years ago. It has a fast drop-off but that’s just because no new starts were added after that point. It really just goes to show one how sensitive this kind of model is to economic decisions. In other words, the underlying mathematical model is more than adequate, we just can’t predict a volatile economy.
Yes the original idea behind this type of model by you and others was amazing.
A little tweaking by adjusting for well profiles that change a bit over time due to longer laterals, more frack stages and more proppant aa well as future changes as sweet spotes become fully drilled gives a pretty robust model. Future changes in prices, well cost, operating costs and other factors as well as completion rates will always be problematic. Pick a few scenarios and try to bracket reality.
Dennis, yup, the tweaking adjustments are necessary as you have found out.
As with many of these analytical tools, they always do a better job describing what happened up to the present, and don’t do as good a job as predicting the future.
Like you have repeated many a time, any predictive model will by definition be wrong, but by presenting a range of scenarios, one can gain an understanding of what directions it can go.
GuyM,
I was playing around with the completion data at RRC and have you noticed that the completion dates don’t line up very well with when the forms are submitted?
It requires quite a bit of work to find out how many wells were actually completed in any given month. The Completion summary data seems to just look at when the forms were submitted without regard to actual completion dates. Seems the only place to find this data without a huge amount of work is to use shaleprofile.com.
What I find interesting is that for shale has been hailed as short cycle production, which means companies don’t have the same amount of risk exposure as compared to a mega project that takes years to execute, and which may start producing at a time of low oil prices, hence making it impossible to make a decent return. However, if you look at the way shale is developed, the whole industry is acting as if US shale is one massive long cycle project, they are burning hundreds of billions of dollars to build a large production base, with the goal of monetizing at a future date (exactly as if one were building a single large mega project) hence US shale has not eliminated any of the long term risk, instead the industry is following the same old playbook, invest massive amounts of cash now and hope for a return in the future. Idiots.
That’s right. If they understood how to read financial reports investors could figure out exactly how much money they were going to lose as they invested!
While tight oil producers put their hopes on a higher oil price, the demand for oil may be undercut by large scale adoption of electric vehicles. As about 30% of oil is used globally for land transportation, oil at 60$/bl cannot compete on long term with wind or solar energy at 0.05$/kwh or less.
https://docfinder.bnpparibas-am.com/api/files/1094E5B9-2FAA-47A3-805D-EF65EAD09A7F
It’s hard to predict the speed of transition from ICE vehicles to BEV. It may take something between 10 years ( see Tony Seba ) to 30 years. but it’s possible that investors start to see it now and they are going away from shale oil producers.
dood do you really think no one else has suggested this before? In fact do you think they suggested it 2 yrs ago, or 3 yrs ago? Or maybe last year, when US oil consumption rose 2.5% and Chinese oil consumption rose 5.3% and India 5.9%.
Maybe you’ll never get a transition, because the only place it could conceivably happen would be in cities, who will be filled with corpses breeding maggots because no food shipped to them due to oil scarcity. That’s actually magical, yes? You get a decrease in oil consumption without ever selling electric cars.
I think the idea of 300 to 400 mile BEV’s is totally nuts. I think what society really needs are PHEVs that can provide consumers with a variety of vehicles with a range of 25, 50, 75, or 100 miles. People would then buy the one that was most suitable for their daily use. With costs lower than a BEV, the transition to EVs would occur sooner and relieve the stress on some of the rare earths, such as cobalt, that is required for the battery. I think this would provide society with 90% of the environmental benefits at lower cost and probably sooner. My son has a neighbour with a Volt, 54 mile range, that is getting over 1000 mpg. Most of his miles are on battery, but every so often, he needs to add a few gallons.
BEV, PHEV- same effect Ovi, as you pointed out.
Rare trips to the petrol station
“Volt, 54 mile range, that is getting over 1000 mpg. Most of his miles are on battery, but every so often, he needs to add a few gallons.”
Hi Ovi,
As cost of batteries comes down the PHEVs will be more expensive than BEV. Probably 250 miles of range is fine in most cases. With 300 miles of range on my Model 3 in a relatively rural setting, and a cold climate there have been few limitations on my use of the Tesla. The charging network will only improve over time. More complicated to have a combination of ICEV and EV in one car, in the long run BEVs will likely be the cheaper option.
Dennis
The trade-0ff will be the cost of an extra 200 mile range via battery vs a 40 hp engine. Also the subsidies for BEVs will slowly vanish, driving up the front end cost. The market will slowly evolve but I think it will be more toward PHEVs, since the car companies can make engines using almost complete automation.
I have read that Mazda is bringing back their rotary engine to power their PHEV, possibly for 2020 or 2021. They have purchased some technology from Toyota and Toyota has bought 5% of Mazda. The advantage of the Rotary is that it has a high power to volume ratio and has fewer moving parts than a conventional engine. This is a very interesting new development.
It will take time to find a relatively optimal solution with high volume that will be affordable and practical for most consumers.
Ovi,
The rotary engine was never very successful due to poor reliability. The extra 150 miles for the battery will be cheaper than a PHEV, battery manufacture can also be automated, it comes down to complexity and reliability. An EV will be a lower total cost of ownership vehicle relative to a PHEV as production ramps up. The subsidies for the Tesla in the US go away on Dec 31, 2019, Currently the subsidy at the Federal level is 1875. Other manufacturers will get these subsidies, Telsa may push for them to be eliminated in 2020. 🙂
I drove Mazda rotary for quite a while—
Maybe I just didn’t notice it “was never very successful due to poor reliability”.
It was LA- maybe I just wasn’t paying attention?
Dennis
My understanding at this time is that battery manufacturer cannot be automated. As I recall, Tesla/Panasonic has major production problems last year at their Giga factory. Not sure what they were or have been solved.
What killed the Rotary a few years ago was the inability to meet stricter emission standards. The Mazda rotary that is coming is a different beast. It is a range extender. By that I mean it will be a series drive rather than a parallel drive system. It will run at one speed and be optimized and will just run the alternator/generator. It will also be mounted horizontally so it will not be dealing with gravitational forces. Mazda and Toyota are very conservative companies and not noted for making extravagant promises.
Some of what I said is opinion, some is fact. I think we will have to wait for a few more years to see how the market will evolve. There is one major battery technology out there that could change things, a solid state lithium battery. Many are working on it, Toyota being one. Don’t know enough about batteries to comment how close it might be.
Interesting, when i was younger i tried to get a new rx8 but was unable to and as you say if i remember correctly they stopped selling them in Sweden due to emission standards, volume was to small for them to bother to tweak engine for Swedish market so they just stopped selling them.
Do you have any links to this new engine? If i understand you correctly it wont have the same extreme rpm and sound as the rx8 rotary had? Will the new run at optimum fixed speed and then transfer power to battery and electric motor or?
I don’t know how to paste a link. This came from a motor1 site.
A new patent from Mazda has the Japanese automaker describing a way to mount a rotary engine on its side for better packaging as an electric vehicle’s range extender. The company registered for the patent in Japan on August 31, 2018, and the Japan Patent Office published it on September 19, 2018.
The way Mazda sees it, the Wankel rotary engine’s compact size is perfect to function as a range-extender. For even better packaging, the company wants to mount the powerplant horizontally under the rear cargo floor. However, an inherent issue with the Wankel is that it requires a small amount of oil injection into the combustion chamber in order to lubricate the spinning rotor. This patent describes what Mazda’s engineers believe is the best way to orient the oil injector for this layout.
Here is a later article
https://www.carmagazine.co.uk/car-news/tech/mazda-wankel-range-extender/
I recall the original excitement about the rotary engine. The mathematics was fascinating. My daughter and I tried to put together a plastic model that I purchased. As I recall it didn’t work
Watcher- “Maybe you’ll never get a transition, because the only place it could conceivably happen would be in cities, who will be filled with corpses breeding maggots because no food shipped”
Wishful thinking on your behalf.
I ponder a different vision, but I’m pretty sure you have no interest.
Your invested.
“RTRS-08-Aug-2019 11:10:50 AM – CHINA JULY CRUDE OIL IMPORTS 41.04 MLN TONNES – CUSTOMS
RTRS- CHINA JAN-JUL CRUDE OIL IMPORTS 285.64 MLN TONNES VS 260.82 MLN TONNES YR EARLIER – CUSTOMS”
Friday’s inside day on WTI chart is still holding even after a 700+ down day on the DOW. Kinda looks like the PBOC might be stepping in after US treasury dept. labeled them a currency manipulator.
Dollar index just hit it’s first supporting trendline and bounce a bit. I except it to go lower. There is a dollar short here. That is just getting going. Should support oil price as it works it’s way lower. For how long i’m not sure.
HHH,
Have I understood you correctly that you do not think oil will go to $20 and gold will decline too while as the dollar will rise? If so, what made you change your mind compared to just a few week ago?
Best,
Jeff
Jeff, It really all depends on what the FED is going to do and when it’s going to do it. Gold is rising on bets that the FED has no choice other than to cut interest rates and do more QE. This current dollar weakness is coming from mainly YEN carry unwind due to trade war. Not bets that the FED will immediately act. It’s not a broad base dollar move until dollar weakness shows up everywhere. Will still have all the commodity currencies making new lows against the dollar even though the dollar index has made at least a temporary top due to trade war.
ECB is getting ready to act. They going large here. With Brexit hanging over head and Germany pretty close to recession and their entire yield curve negative. There might be a short term dollar short here depending on if US equities continue to fall. If that don’t happen then the dollar is headed higher. Long gold is the other side of USD/JPY. When JPY strengthens so does gold. And when JPY weakens so will gold. If trade war cools a bit. JPY will weaken and so will gold because bets on more from FED get pushed back. Dollar heads higher and oil goes to 20 if FED never gets a reason to do more QE while ECB and others continue to expand monetary policy.
FED interest rate cuts will not be enough to weaken the dollar when ECB it doing major QE.
If Trump ever does tariffs on say Germany. Which is a real possibility here. Watch out below because not only are US equities going to tank but oil is going to fall off a cliff. Gold would do well though.
Suppose lending to shale becomes aggressive and abundant again? With no particular change in price.
What’s production look like then?
Probably higher, but as lenders and investors lose their shirts, funds may not be forth coming. Low prices mean low profits. A command economy leads to a poor allocation of resources as in Venezuela and Soviet Union.
The STEO is out and shows the following for US production
August-19: 12.48 Mb/d
December-19: 12.95
December-20: 13.62
No signs of plateauing. It will be interesting to see if it’s real or fake news.
About as much of bullshit that was ever put together. Course, you can’t blame them, they are using hysterical data to project.
GuyM,
I disagree, perhaps the GOM increase of 270 kb/d over the Dec 2018 to Dec 2020 period is too optimistic (I will leave that to SouthLaGeo, but I think a recent comment by him suggested this might be in the ballpark, but he can correct me).
For lower 48 excluding Gulf of Mexico the projection of a 1.32 Mb/d increase in output from Dec 2018 to Dec 2020 seems quite reasonable, my “low tight oil scenario” with flat completions (no change in the completion rate from the first half of 2019 through Dec 2020) has US tight oil increasing by 1.3 Mb/d, very much in line with the STEO lower 48 excluding GOM scenario (the difference is only 20 kb/d, essentially a rounding error).
The STEO, far from being bullshit is actually pretty conservative.
As I have suggested previously, the death of tight oil has been greatly exaggerated. 🙂
These are forecasts… It can’t be fake news as there is the uncertainty. In February, the STEO was forecasting production at 12.44 Mb/d and it turned out that it was 12.1 Mb/d.
The data from the “Petroleum Supply Monthly” show, so far, a plateau between November 18 and May 19.
https://www.rigzone.com/news/is_the_us_shale_boom_winding_down-06-aug-2019-159498-article/?amp
Gee, what a surprise.
And considering all shale fields, flatter a lot sooner than August. Dennis, I think we can consider a 1% growth rate as flat production. Note, that considers using EIA projections, which are usually high.
A worry for sharp decrease in demand? Dream on
https://seekingalpha.com/amp/article/4281963-open-insights-eias-weekly-petroleum-report-07-26-19
Still worried about an oil glut? If so, first let me tell you about this bridge in Brooklyn I have for sale, cheap.
Chart below uses data from “tight oil production estimates by play” (data in excel spreadsheet link) at page below
https://www.eia.gov/petroleum/data.php#crude
How does that reconcile to the monthlies by state? Did we go up 100k to May? I’ve banged on the monthlies for over two years. It, and RRC data are the only things I trust. The last month of drilling info data is an estimate, as EIA uses dated drilling info data, neither are actual. So, the estimations do not match May production. Makes working with data easier, but if it doesn’t match actual??
GuyM,
L48 excluding GOM increased by 53 kb/d in May 2019, tight oil increased by 108 kb/d according to the drilling info estimate, there is no separate tight oil estimate in the monthly data.
Note that drilling info gets its data from state agencies as far as I know.
No data is perfect, I simply use the information I have available. We never have “actual” oil output data, for large quantities such as output of crude oil in the US the number assigned is always an estimate of “actual output”. The estimates also get revised over time, actual output is known (roughly) about 24 months to 36 months after it has been produced for the nation as a whole.
Chart below has L48 excluding GOM (monthly EIA data) with slope of 518 kb/d for past 9 months (OLS trend line slope). If we throw out the june data from the tight oil data and do a similar chart the slope is slightly higher at 575 kb/d for Sept to May 2019 (9 months).
Also if we look at the change over the March 2019 to May 2019 period, for L48 excl GOM the increase was 225 kb/d and for the tight oil estimate it was 209 kb/d (not all that different).
GuyM,
Asfar as EIA projections usually being too high, many of my future tight oil scenarios matched fairly closely with EIA’s AEO projections over the 2015 to 2020 period. In every case the forecast proved too low rather than too high for tight oil. I think the current EIA AEO tight oil projection through 2025 or even 2026 to be reasonable. After that I agree the tend to be too optimistic.
In short, the medium term EIA forecasts (next 5 years) for tight oil seem pretty good at present (though in the past they have been too conservative), longer term I agree they seem too optimistic.
China’s import of oil in the past few months has varied a great deal because of a choice to rapidly import Iranian oil prior to sanctions triggering. After the month that sanctions triggered imports reduced.
Enough time has passed now since April to have a feel for the year-to-year change in Chinese oil imports. The last two months show an increase in imports.
The number is 8.8% since the equivalent months last year.
This does not mean Chinese consumption is 8.8% higher than last year. Chinese domestic oil production is in decline and the magnitude of the decline increases the overall Chinese import of oil. Meaning the 8.8% includes that production decline.
Production decline is unlikely to explain all that much of the 8.8%. They continue to have relentlessly increasing consumption growth.
Missing Energy News. This is the best I can find:
https://seekingalpha.com/article/4278099-east-pulling-west-recent-oil-inventory-data-revealing
Where the heck is this huge glut?
Falling oil prices.
At these prices, even good shale companies should write red ink when they had only small earnings the last 2 quarters.
Check out Oasis stock price this morning.
Wow.
My view into the future: If this oil price slide continues a bit and stays there a few months, we’ll see declining US production even this year.
The small ones going into survival and hibernation mode should be enough for this – since the bigger ones scale back, too. Even when they still grow, they won’t grow much.
Edit:
Now the oil price starts crashing – let’s see how this plays out. Lot’s of companies loosing big money.
Yeah, I’m losing some money, right now, but it is amazing to watch. All about China, which is not going to effect the consumption of oil that much. Chinese goods can make it to the US via many different countries. The financial community have lost a lot of IQ levels in a very few years. It’s just going to explode after a while. I give it three to four months.
https://www.chron.com/business/energy/amp/Permian-players-Diamondback-Pioneer-Parsley-14285380.php
Kinda smells now. Where is the bull? Wondered about the shenanigans with Viper in the snake farm, now I’m pretty sure. “snake farm, sounds kind of nasty. Snake farm, pretty much IS! Brrrrhhh- Ray Wylie Hubbard.” Dennis, you have to appreciate, some. It’s a screwey La. type jazz.
When I read this, I ask myself why didn’t they do this before?
Lowering investments, increasing production!
The best would be investing nothing, firing most staff and doubling production. They should get the economic Nobel Price for this new concept.
( From my experience in companies that smells like hiding the cost by shifting them to another quartal, or making a 1 time event of them). Lot’s of accounting tricks possible to generate a positive quartal.
Sounds good, but beware of snake farms! Lower investment, increase production doesn’t pass smell test. There has to be a bull in the rooom, somewhere, or it would not smell so bad.
“Midland-based Diamondback Energy, Dallas’ Pioneer Natural Resources and Austin’s Parsley Energy all said Tuesday that they’re lowering the top end of their 2019 capital spending projections while achieving oil and gas production volumes above or near the top of their guidance.”
Pioneer mgmt: “Indeed! Why did we not think of this before?”
/slap foreheads
Yeah, it’s become more than ludicrous, now. Down is up, up is down, depending on reporting. And the reporting must make prices go down, or stay low. Just ask Alice.
Difficult to know precisely what is going on. From an outside perspective it seems like most of the shale companies and the US based majors are afraid to not show increased production in their books. Two made the choice to collapse from my limited view of this; Whiting Petroleum and Concho R. ,and the rest seemed afraid to show anything else than growth.
The oil price can be manipulated ofcourse. In most earlier areas I suspect it was an emphasis on making sure the oil price was high enough to ensure major investment in friendly countries, to make the “West” more independent with regards to foreign influence. And as a consequence build up a buffer of spare capacity. Not more is this the case it seems. The focus nowadays is so short sighted; just by getting a pair of new spectacles the near future would be clearer. Pretty obvoius political power struggles are the cause of keeping oil prices down; it has nothing to do with fundamentals at the moment (supply/demand). I think the Trump deception is on its last straws; too many unfriendly relations all around. But that is just my view from the outside.
Ok, I missed the fact that a lot more countries have lowered rates. Of course, the price will go down.
Where have you guys been? This is not new. Shale has been producing at a loss for what, 3-4 yrs now? Why would that change?
“Oh, Wall Street is going to stop lending them money!”
Ya we’ve been hearing that. Why? What’s different now? Well, I’ll tell ya. Interest rates are lower. Germany has had negative interest rates for YEARS now. (yeah I know the awesome power of the free market and capitalism will end that, except that was supposed to be so the day it first went negative, and the next day and the next day. Here we are years later) Ditto Japan. Why would the US be different? Because the Fed is less willing to QE than the ECB? ha. Right.
But. That’s what’s different now. Interest rates are lower. Those lenders on Wall Street look around and see . . . hey, I’ll have to pay Germany money if I lend to them. Or I could lend to a shale con artist and if there’s a price rise some day, maybe I’ll get money back. Or hey, maybe I’ll pay them less in losses than I’d pay Germany. That means I can be shrewd.
[Y’all wanna know what can change all this? It ain’t free markets (there aren’t any) and it ain’t capitalism (remember we are doing 5% GDP fiscal stimulus with our $1T deficit to get 2% GDP growth) so there ain’t no capitalism either. What will stop this is direct government decree. It’s a small club. You ain’t in it. Those who are will know to execute their trades before the decree and score big.]
If i understand you correctly, you are positing that the financial side will keep the train rolling until the actual physical resource in this case (oil) runs out?
In some ways i agree with you (if that’s what you are saying). The global economy will only end when physical resources actually start to deplete and then money will have no meaning.
That’s rephrased not precisely, but essentially the point is you HAVE to have oil, there is no choice, and the economics around it are irrelevant. If you have to have it, you will get it. There may be manufactured some array of enshrouding gobbledygook of text about how and why this is all still capitalism ( I just pointed out 2% GDP growth with 5% stimulus, how is that capitalism, and that stimulus has been going on for years and years), but just laugh at that.
Study millidarcies, not cash flow.
Oh, one more thing. The whole “well, just calm down and wait for things to correct themselves” perspective. NOW is the point of measure. Not just wait for some time in the future. You see this with talk of 2008/9. “Yeah, the S&P got killed but it came right back.” No. No. It didn’t come right back. It didn’t get back to normal. It was BROUGHT back to normal by government intervention, mostly from Bernanke. How is that capitalism?
Yea 100% agree. Central banks are artificially creating bubbles all over the place. No such thing as free market capitalism at all. There never was.
I think central bank governors are so out of touch with the actual dynamics of the global economy. A disgusting narrow-minded cabal if you ask me.
This is capitalism.
If it is cheaper to promote Bernanke into the chair than investing into a new factory – then this is done.
Pure capitalism. Take the cheaper option.
When it is cheaper to bribe a local politican and pay a lawyer to wiggle out than to build this expensive waste water pipeline – it’s capitalism.
The other thing is democratic social market economy – when the people give the borderline for the companies, not the other way around.
The point . . . well maybe not missed but not focused on.
The point is all this financial analysis, particularly supply and demand, is self delusion. Far more assets changed hands in history via conquering or inheritance or bribery or necessity or even convenience than have done so because of an attractive price. Well, let me qualify that. Conquered assets have very attractive prices.
It’s a complete waste of time when people (and governments) should be preparing for the inevitable killing of people. War is the normal human condition. Oil scarcity will be the ultimate engine behind . . . what is normal. When war is inevitable, it’s a good idea to be the winner.
Sorry, but the price for conquering only seems to be low –
most countries going insolvent did this because of conquering – the military costs for holding the prey have always been underestimated.
That’s the main reason for the USA today not looking good economically – too much resources put into the military.
Some state of the art long range atomic missiles and a reasonable militia to keep other wannabe emperors at bay would be enough to life. Perhaps a few subs to counter marine games – but that’s enough for going only defensive.
Every empire in history until now collapsed because of military costs – and that’s not only the cost in money, but state ressources.
That’s the dangerous thing about oil – it must be protected at any cost. A world without oil would be more peaceful.
All this gulf wars are about oil, even the Syrian one – it’s about pipelines or russian marine bases for having a foot in the oil game.
Whether or not the price (or reward) for ‘conquering ‘ is high or low, people are poor students of history, and that hasn’t stopped them from trying that war pathway over and over. Especially when they are faced with de-growth.
Watch a moment who are the the great heroes of shale gas revolution:
https://shaleprofile.com/2019/07/17/us-update-through-march-2019/
1. Chesapeake
2. Rice Drilling
3. Cabot
4. Southwestern Energy
5. Range Resources
and watch their stock value:
https://finance.yahoo.com/quote/CHK?p=CHK&.tsrc=fin-srch
https://finance.yahoo.com/quote/COG?p=COG&.tsrc=fin-srch
https://finance.yahoo.com/quote/RRC?p=RRC&.tsrc=fin-srch
Their value degradation is an ongoing process for a few years and they reached a new bottom these days.
In the meantime, USA is a net exporter of NG. Genial trumpoline : import expensive oil and sell cheap natgas.
https://www.eia.gov/naturalgas/weekly/#tabs-supply-2
Compete with Russia:
https://www.indexmundi.com/commodities/?commodity=russian-natural-gas&months=12
although pipeline is cheaper than LNG processing.
https://www.nytimes.com/2019/05/29/us/freedom-gas-energy-department.html
My guess is when the ECB comes out with more QE next month and FED doesn’t respond in kind. Trump slaps Germany with tariffs. This is where things will really get interesting. The monentry valve is what is being used to manage the enormous debt loads. If you start getting penalized for using that valve then what?
It’s a false narrative that you can print away debt. Pushing back consequences by extend new loans to cover the old ones. All you end up with is more debt than you had before.
Debt has to be bought by the central banks via QE.
Then it is neutralized – every interest payment is funneled back to the government. And it can be rolled to eternity, no need to pay it back.
Money works as long as the narrative works. When the faith is destroyed, the currency will implode.
I believe they can neutralize the bad assets and debt by reducing their balance sheets by increasing interest rates and hence doing QT.
The FED tried to do that late last year and the stock market crashed, so they freaked out and surrendered to Trump and Wall street.
“It’s a false narrative that you can print away debt. Pushing back consequences by extend new loans to cover the old ones. All you end up with is more debt than you had before.”
So true.
It’s rooted in the mistaking of money/debt as wealth. I mean, if I own a billion dollars of US Treasury notes and corporate bonds I am said to be very, very wealthy.
But what do I really own? I own a billion dollars of claims on the issuers of the bonds. Sure, I can convert those to dollars (in the US), but then I have a billion dollars of liabilities of the Federal Reserve.
Okay, sure, I could then exchange those dollars for real things, like houses and oil wells and land and gold and food.
And that’s the point. Everything that we popularly call “wealth” (currency, stocks and bonds) are merely claims on the final items containing real value that we wish to own or consume.
Which means there needs to be a balance between the claims and the things. Too few claims and that’s deflation. Too many and that’s inflation.
Well, in this story the Fed, et al., have been fostering the exponential accumulation of claims at roughly 2x the rate of real GDP growth and without any indication of concern for the fact that the earth is, in fact, finite.
Rolling over debts with more debts is an implicit bet on the idea that the future will be larger than the present. Exponentially larger given the interest involved. The real wealth to justify those claims will show up. Magically. It always has. Peak All Sorts Of Things militates against that view.
Nobody in power seems to have the slightest clue about this dynamic or predicament.
Sad, really. Humans are capable of really complex thoughts and ideas. The one I’ve expressed is dead-nuts simple, yet it confronts too many emotionally-based belief systems so it goes by undetected.
Chris- “Rolling over debts with more debts is an implicit bet on the idea that the future will be larger than the present. ”
I think this is the most important thing said in this discussion.
Can the future [economy] be larger than the present?
Not likely if peak oil equates to peak energy.
Depends in part how gradual or steep the tail of production is.
And can the economy be larger in the face of population peak?
How far beyond peak energy is peak population? One generation?
“Everything that we popularly call ‘wealth’ (currency, stocks and bonds) are merely claims on the final items containing real value that we wish to own or consume.”
So much of what we call wealth is just numbers in a computer. And if not that, assets like artwork that are only worth much because someone else is willing to buy it at a certain price.
So I continue to be surprised that the world’s wealthy continue to exert as much influence as they do. It would be easy enough to make that wealth disappear or simply not acknowledge it as having much meaning. The poor and middle classes could take over if they got their acts together.
Wealth as digits in a computer is real wealth.
Think at the past, 500 years ago – there it was a little ink on paper.
Ink on paper giving a trade privileg in an important place. That’s real wealth, and power.
Or ink on paper that granted 10.000 gold dublones payed by the Medicies. Time didn’t change much. It was even encrypted for security in the old days, as today.
Viewpoint is valid. Some things have intrinsic value, regardless of the current values of currencies, stocks, bonds, etc. Barter value is fleeting. Some things of value, including commodities transcend whatever current barter is being used. In the long run.
Like unimproved land, works of art, and most commodities.
Debt? You can produce at any cost if Fed prints funds… inflation ensures no payment to big
WHITING & OASIS DOWN 50% In the past week.
Ironic that these two companies which have seen their share prices crushed by 50% in the past week are under investigation by former Louisiana Attorney General's law firm, Kahn Swick & Foti:
https://finance.yahoo.com/news/whiting-petroleum-investigation-initiated-former-025000182.html
https://finance.yahoo.com/news/oasis-petroleum-investigation-initiated-former-025000083.html
It seems as if the Law Firm is representing some large investors who believe Whiting's and Oasis officers and management failed to WARN INVESTORS of the RAPID DECLINE RATE and its impact on the companies share price and financial health.
With Oasis now trading at $2.75, below the critical $5 support level that held since 2014 and Whiting at $9.75 below the critical $14 level that held since 2014, these shares are now heading to PENNY STOCK HEAVEN.
I would imagine the "Investigation" will likely soon turn into a LAWSUIT, and watch as the number of lawsuits in the shale oil and gas industry grows.
steve
What I see is fools being parted with their money. It has been obvious for quite a while that these companies were high risk investments. Play with fire, you get burned, pretty simple really.
Dennis Coyne,
I Always appreciate your effort to reply to everyone’s comments in this blog. I imagine it must take a lot of your time.
That being said, if you believe that WLL and OAS are the only companies that are HIGH RISK and have treated their investors like FOOLS, then I believe you are quite naive.
I would imagine that 90-95% of shale companies are going to become PENNY STOCKS and will also be guilty of treating their investors like FOOLS.
By the way… has anyone noticed that Pioneer has suddenly dropped their Horizontal Oil production Permian data from the Q2 2019 Investor Presentation. For the past two+ years, they have reported Horizontal and Vertical Production data separately, but now they are only publishing the total.
While most INVESTORS IN SHALE ARE INDEED FOOLS, they will see no BIG DEAL HERE… but I do.
LOL,
steve
This information might be of some interest.
I see a non-operated owner of working interests in 22 wells operated by EOG in Mountrail Co., ND has the interests for sale.
Over the first six months of 2019, the wells have averaged gross production of 500 BOPD (22.73 BOPD average per well) and averaged 825 MCFPD (37.50 MCFPD average per well). This is prior to royalties. The net oil to all working interest owners is about 18 BOPD and about 30 MCFPD, per well.
The first six months of 2019, the non-operated working interest owner’s oil and gas sales have averaged $831 per month, and LOE has averaged $330 per month total for these wells. However, the LOE excludes expenses defined as CAPEX. I briefly reviewed the CAPEX expenses, and it appears there have been some significant CAPEX expenses, as there are several times where total expenses (LOE + CAPEX) exceeded revenue with regard to some of the wells. However, it is difficult for me to follow EOG’s JIB statements and 22 wells x 6 months would be a lot to try to breakdown for a blog post like this.
Without CAPEX, it appears gross LOE is about $12,000 per well per month. Including CAPEX takes the cost to an average of about $18,000 per well per month. Of course, some wells are much better than average, and some are much worse.
These are wells that were some of EOG’s best in the Bakken, and are some of the historically best wells in the Bakken overall.
So, in less than 10 years, the wells are not producing much income. It looks like it costs over $20 per BO to operate the wells, and when CAPEX items are included (which do not look like they are to enhance production, but appear to be common items such as equipment failures), it appears to cost over $30 per BO to operate the wells. This is in the ballpark of the costs to operate conventional stripper wells in the USA.
This is but an anecdotal snapshot, but might be helpful.
Shallow sand,
Let’s imagine these wells paid out in 5 years or less, it seems the bulk of the net profit would occur over years 6 through 10 for the average of these 22 wells. Is that roughly correct? Granted there is some money to be made after year 10 if they pay as well as an average stripper well, because I have heard there is money to be made running strippers for talented and hard working people.
Dennis. It depends quite a bit on the oil price obviously.
These wells were all good wells for EOG because they both produced above average oil for Bakken wells AND produced most of the oil 2008-2014, when prices were high for all but about one year around the GFC.
I just like posting examples from actual well data. It is why I really like shaleprofile.com.
I wish Enno could incorporate financial data, but he is correct that it would be impossible to be completely accurate, and he strives for complete accuracy, which is a big deal to me, given all the fluff stories we have read and continue to read about shale.
I think much of the shale trouble is that the oil price fell so far so fast, they were all caught off guard. They were pretending to be the new wave of oil, and wanted to “drill through” the downturn like an XOM or CVX might do. So in 2015 they still drilled a lot of wells, and the price really cratered in late 2015 into early 2016. WTI during that time was not much above $40.
I think most of those 2015 and 2016 wells were such money losers that they are still a drag on the companies.
In the end, the truth is the best course. In 2015 many of us thought the best course for shale was to be truthful, but instead they talked the price all the way to $26 WTI. EOG may be a better company than most, but they were complicit with their “profitable at $30 oil” story in 2016.
I think if you look at most shale wells, for oil, even years 6-10 aren’t that great production wise. Mike is correct, shale wells need to payout in 3 years to be economic for the one who drilled them.
Yes, these wells could make some people money in the future if prices return to 2011-14 levels. But I think I’d rather mess with 900’ vertical holes than 4 mile TD horizontals.
“I have heard there is money to be made running strippers for talented and hard working people.”
Dennis, that’s true, but let’s not conflate vertical and horizontal strippers.
A vertical well that’s maybe 1k to 8k deep is a very different beast to maintain and operate as compared to a Bakken H well that’s 15k to 17k in total length.
Turning the rods 90 degrees and then pump jacking them turns out to be full of frictiony badness for some reason. I’ve heard that a rod job can be $80k to $100k.
The point here is that not only is there a lot more to replace on a long H well, it breaks more often too.
Without getting into particulars, it’s safe to say that the break-even for an H well stripper is a lot higher than for a V well.
5x higher? 10x? As always, it depends on the well.
Steve,
I think you focus on the worst tight oil producers, some of these companies (EOG for example) are well run. None of these companies will do well in a low oil price environment, they need $65/b (in 2018$) at minimum for Brent to do ok. Higher prices such as $70 to $75/b would be better. Perhaps if the trade war settles down prices may eventually rise or stagnant tight oil output (more likely at today’s price level) will eventually lead to falling oil stocks with higher oil prices to follow.
Dennis.
OAS, CHK, WLL etc at one time were considered to be solid companies.
The truly weak shale companies filed Ch awhile back, with some finally doing so this year.
The problem is that even XOM isn’t making much money on shale right now with $52 WTI and gas that brings almost nothing. The financials make that clear to me. 7 cents of earnings was from US upstream, including GOM and conventional, almost all of which should no longer be encumbered by much DD&A for GAAP purposes. I suspect if shale wells were broken out from the other, it would show XOM lost money on shale.
CLR’s Hamm is taking about going private. Not sure if he can swing that, given company already has a high debt load. Have always wondered about CLR financials, though just wild speculation on my part.
Just interesting to see OAS and WLL cratering, while CLR isn’t. Seems WLL has better Bakken Wells. OAS comparable to CLR. Plus, CLR other main area is OK, which is having its own problems.
Steve doesn’t just focus on third tier shale IMO.
shallow,
Totally agree with your comment. No, I just don’t focus on the LOUSY TWO-BIT MOM & POP SHALE companies. As you stated, the Majors are not looking pretty producing shale. And, I would go as far as to say, companies like EOG may have a bit of breathing room before the RAPID DECLINE RATE catches up to them as well.
So, Dennis and many of the energy analysts who tend to go with the FLOW that believe everything is A-OKAY, let’s just wait a few years and see how things play out.
steve
Reading about the Oasis earnings call, it appears the stock tanked after the CEO stated they planned to increase capital expenditures. If this is a harbinger of what investors think about increasing drilling activity, this could be a serious inflection point, one most folks here have been expecting for some time:
https://finance.yahoo.com/news/oasis-petroleum-stock-drops-26-172900386.html
A bit more perspective to focus on the point you guys are starting to arrive at above, and likely y’all probably already had.
Let’s note that the money people are not stupid. They can see threats when they appear. Their huge wealth gets threatened by things like bitcoin because the governments/laws that protect their wealth are rendered somewhat powerless by bitcoin. But it goes further than that. Those people of wealth don’t want to hear anything that suggests the public is thinking “money has no meaning” thoughts. Huge threat, that. Bernanke probably had no choice in what he did to save the system, but he revealed that which the elite really didn’t want revealed.
This is substantially the reason the IMF is raging at Argentina. They didn’t do what is usually done. They didn’t give people a lower price of oil via a subsidy with government money. They did the opposite. They declared the price of oil to be HIGHER than the NYMEX quote and this is making the Vaca Muerta shale flow oil and gas. The IMF is enraged about this. They are still calling it a subsidy because they dare not call it anything else.
As for debt blah blah and german negative rates blah blah. Germany is an export driven country and so they can have negative rates, I hear bozos say. I click a few clicks and there is Japan with a -0.1% 10 yr instrument rate and they run a net trade deficit. Bozos best ignored.
Now here’s the really cool thing. We are running a $1T fiscal stimulus this year. Part of that is interest on the debt of a few hundred billion. Well, sportsfans, we have lower interest rates now. That means interest on the debt will be lower next year, and guess what, that reduces deficit/stimulus hahahahah. (This means the interest paid to non govt entities (meaning not the Fed). Mutual fund owns some Treasuries, gets paid interest, that interest money injects into the economy and tra la stimulus) But the Fed balance sheet of Treasury bond holdings . . . interest is paid on those and the Fed returns it to the Treasury, and look at that, they deny the country stimulus! How very stingy. And look what it means . . . lower interest rates are destimulative.
That’s the world you live in when you are scheduled with a suspended debt ceiling for about $24T by 2021.
You can grow out of debt by three ways: Inflate so land and its occupants are worth more; inflate so debt is worth less; inflate so growth is more than inflation.
cameron,
You bring up the typical KEYNESIAN MONETARY SOLUTION. However, you forgot an important ingredient in your assumption.
YOU NEED GROWING OIL PRODUCTION to grow out of debt. The United States did this after WW2 as the Fed Govt lowered the DEBT to GDP ratio considerably due to oil production nearly doubled during that period.
Try growing out of debt when oil production heads south. Let me know how that works out.
steve
Steve,
Oil is not the only energy resource, oil prices will rise, the economy will adjust, and it will be a difficult process, probably it will lead to GFC2 or Great Depression 2 (if unwise economic policy a la the European response to GFC is followed in the future).
Pretty hard to get 2 or more quarters of negative GDP growth (def of recession) when you are providing 5% GDP stimulus via deficit.
PIONEER RESOURCES Decides To Drop It’s Detailed Horizontal & Vertical Well Production Data in the Permian in its Q2 2019 Investor Presentation.
As I mentioned in a prior comment, Pioneer dropped the detailed data reporting in the recent Q2 2019 Report. I was doing a detailed analysis, WHICH I FOUND SOME INTERESTING ANOMALIES, on Pioneer’s horizontal drilling data, but can no longer as they have lumped them all together.
I have contacted the IR department to see why they decided to drop reporting the individual data. Do you think it was a cost-cutting measure…LOL.
Call me a conspiracy theorist, but it seems as if they are HIDING SOMETHING here. You will notice that overall production only increased by about 3,600 bopd in the Q2 2019 Data shown in the second table, but who knows how much is coming from their horizontal drilling or vertical. While I would imagine a large percentage stems from the horizontal drilling, we no longer can tell as they stopped reporting the individual data.
steve
And here is the Q2 2019 Update with everything SHOVED in one data point.
If you look at the data, you will notice that production increased nicely each quarter, but in Q2 2019, only 3,600 bopd. Maybe part of that came from Pioneer’s vertical wells. Who knows.
But, even if all of that 3,600 bopd came from the horizontal wells, it looks like growth has slowed down quite a bit.
steve
Steve,
Indeed growth has slowed. Isn’t that what we would expect due to lower prices since the end of 2018Q3. Seems Pioneer is doing exactly as it should given the lower oil (and natural gas) price environment. I do agree breaking out the horizontal and vertical well data gives more information.
It’s up to the company how much they want to reveal.
Dennis,
Agreed on how the company wants to publish their data. But, if we go by the wisdom from high-quality accountants, they will tell you that when companies start dropping data in their reports, it’s usually for a GOOD REASON.
However, that GOOD REASON tends to be good for the company and not SO GOOD for the stock investor or deb holder.
Thus, by dropping data the company tends to be HIDING SOMETHING. Again, not my words, but guidelines from ethical accountants, which seem to be RARE in the Shale Biz.
steve
From this presentation it seems for me that their permian production is shifting more to the gas side, as the growth in natural gas surpasses the oil volume -and gas growth is also more in line with the previous two quarters – which would fit in the rumors that Permian is moving to a higher gas percentage of production.
Unfortunately with gas priced in Permian at almost zero, this doesnt really help.
This profit seems very high, guess lots of cost is not included. Guess price reflects poorer quality as condensat is mixed as they call super light oil…
No, There Will Be No Russian Base In Iran
https://www.moonofalabama.org/2019/08/no-there-will-be-no-russian-base-in-iran.html
(I know it is a commie site, that hates capitalism, so it probably is just propaganda {sarc})
Oilprice.com a few days ago reported on this Iranian base about to house Russians. The specifics were somewhat absurd. The Sukhoi variant that was quoted has not been built yet. And a base for submarines in the Persian Gulf, nuclear, was similarly absurd. Mini subs maybe, but Russia has none.
This is the kind of thing that in the past would end a publication. But in this case oilprice.com will just escape all blame.
To all: Canada.
Anyone been following the trouble Enbridge has been having over its Line 5 oil pipeline at the Mackinac Straits between Lakes Superior and Huron?
Everyone here at POB knows that Canada’s oil industry has been stuck with low income because the only way to get most of its production to tidewater has been through the US. The TransMountain pipeline from Alberta to Burnaby near Vancouver on the West Coast is the exception. Kinder Morgan owned it and gave up trying to expand it–pretty much double its capacity–because of unending opposition from a variety of interests in BC, and the government of Canada bought it. The project may eventually get finished. A similar story is that of opposition to the building of the Keystone XL pipeline that would carry Canadian crude to Cushing for transport to the refineries on the Gulf of Mexico. It is inching along, last I looked.
The biggest part of the export of Canadian crude, though, is through Enbridge’s Mainline System of pipelines. The system carries crude eastward and its Line 5 supplies parts of the US and the refinery center at Sarnia in SW Ontario…What? “…to the US…”? Yep. Because the Sarnia refinery center is located in SW Ontario, as far south as Canada goes, to run a pipeline to it from Alberta the shortest route is through the US because Minnesota, Wisconsin and Michigan are in the way. And the Governor and Attorney General of Michigan say that Enbridge must close down Line 5, which runs beneath the Strait of Mackinac between the
Upper Peninsula and the main body of Michigan, because the pipelines (double, I think) are 66 years old– and they are not to be replaced (Enbridge wants to) because the risk of a pipeline break is too high. Pollute both Superior and Huron? Unthinkable. The AG has begun the legal process needed.
The current capacity is 540 000 bbl/day. I suspect its loss would be harmful to the Canadian economy but I have not seen comment from the Canadian government on this topic so far. But that’s just me. This looks like a topic the media would latch onto: Canada vs the US! Will Trudeau back down? Will Trump blow a gasket? Vapid opinionating at 11!
I have been following this issue and actually wrote the conservative leader Scheer, to say this issue was another reason that his idea for an East West energy corridor, thru which pipelines and power lines could be built, was a good idea. Never got an answer. It should be noted that this became a crisis, on the part of the Michigan governor and AG during their campaign. Whether that issue got them elected or was it the anti Trump vote the flipped the House, is not clear.
An agreement was made with the previous Michigan administration to build a tunnel 100 feet under the straits for the two pipelines. Enbridge has an agreement to build the tunnel. I think they agreed to have the tunnel in operation in five years. The governor wanted it done in two years. I think that Enbridge sued for breach of contract. The AG counter sued that the contract was illegal, I think. Not sure where it stands.
Trudeau, who is up for re-election cannot be seen to be fighting for this pipeline because he is already being criticized for buying TMX. There is speculation that he does not want shovels in the ground on TMX because there will be street protests during the election campaign. Not sure where Scheer stands. He has not said anything.
What is puzzling me is the role of NAFTA in this discussion. I think there are clear statements in the there on access to oil. Maybe the liberal government will get involved once the election is over. It is known from the bills passed by the liberals that they are anti oil. They were forced into buying TMX because there was no other buyer that was willing to put up with the constant delays.
While you have not mentioned it, Line 3, which is part of the main line and is being replaced because it is too old, is now being delayed in Minnesota by anti pipeline groups which took Enbridge to court. It’s ironic that Enbridge wants to replace a line that is too old to make it safer and the environmentalists prefer they do nothing and keep the old line as is, and probably hoping that it will spring a leak. In the meantime Texas is building pipelines as fast as possible.
To some of us Canadians, we think that we have a target on our back. What is interesting is that Jane Fonda flies up to Canada and tells us to stop producing our oil because we use to much energy to produce it. However someone forgot to tell her that the Kern field in California uses the same technology as used by the oil sands to get oil out of the ground and is the dirtiest oil in the US. In the meantime the Rockefeller foundation and Tides foundation keep funding our environmental groups so that we can continue to subsidize American drivers with our cheap oil.
Forgot to mention that most of the MSM outside of Alberta leans liberal and making Line 5 an issue is not part of their agenda. Most of the comments on line 5 came through the Financial Post out of Calgary.
Thanks for the opportunity to get this off my chest.
Thanks Ovi.
That’s a good point that Trudeau has to be careful about touching another pipeline controversy, what with the TransMountain hanging around his neck.
I’ve been paying attention to the Line 3 hoo-haw too. If Line 3 were to be stopped for good, say if there were a catastrophic break, Line 5 would be left without its supply of crude. There’s a review of the environmental statement at the moment that will postpone the start of work, at the least.
I think Line 5 has held my attention more because it makes such a journey through the US before returning to Canada. I can imagine Enbridge officials muttering “If only we’d taken the long way and kept the thing in Canada.”
Your mention of NAFTA–well, that would be the new one now–opens up a whole new direction of thought for me because I know nothing about how it deals with transport of oil and gas among the three countries. Oh, dear: homework. Maybe another day?
Thanks for the clarifications, Ovi.
Synapsid
Here is something I found. It sounds like Enbridge could sue Michigan state using ISDS (see below) under NAFTA but cannot under the USMCA (Cdn Version is CUSMA). So if Enbridge wants to sue for damages, they have to do it prior to the House approving the USMCA.
Amy Janzwood
The New NAFTA – What’s the Deal with Energy?
“In the aftermath of the USMCA negotiations, the Trudeau government chalked up two significant “wins” for environmental protection and Canadian sovereignty: the elimination of investor state dispute settlement (ISDS), at least in the Canada-U.S. context, and the disappearance of NAFTA’s so-called proportionality clause in the energy chapter.”
Ovi,
Boy, that puts the pressure on.
Thanks for this.
Enbridge also crosses an Indian reservation in Wisconsin and they want it out. Part of the easement is expired.
https://www.wpr.org/bad-river-tribe-files-federal-lawsuit-against-enbridge
Everyone wants a piece of the pie. Get too greedy, there ain’t no pie left. Makes no difference to me. Cut off all Canadian, WTI at 39 API is still pretty valuable.